Embed Size (px)
Citation preview
Vol. 3: 317328, 1980 MARINE ECOLOGY - PROGRESS SERIES Mar. Ecol. Prog. Ser.
Published December 15
Growth and Production of Mussels Mytilus edulis from Two Populations
B. L. Bayne and C. M. Worrall
Natural Environmental Research Council, Institute for Marine Environmental Research, hospect Place. The Hoe, Plymouth PL1 SDH, England
ABSTRACT: Gompertz growth curves for Mytilus edulis (L.) from two populations were derived from size-class analysis. By the incorporation of time and temperature as day-degrees, and of the results of length/dry weight regressions, estimates were made of seasonal changes in weight, and of fecundity as mantle weight loss on spawning. The results agreed well with independent estimates of growth made by integrating the results of physiological measurements of energy balance. Differences between production estimates for individual mussels at the two sites are discussed and related to various physiological differences, chiefly the seasonal pattern of the efficiency of absorption of energy from the ingested ration. Somatic production is shown to be similarly dependent on temperature in both populations, but seasonally abnormal temperatures and a reduced quality of available food at one site caused a marked reduction in the production of gametes.
INTRODUCTION
Many marine mussels of the genera Mytilus, Choromytilus, Aulacomya and Perna combine a toler- ance to a wide range of environmental conditions with a flexibility of physiological response, reflected in var- ious rates and seasonal patterns of growth, in such a way as to facilitate comparisons of the production potential of different habitats. Comparisons of rates of growth of mussels from different geographical areas have been made by Theisen (1968, 1973) in Denmark and Greenland, by Seed (1973) and Dare and Edwards (1976) in the United Kingdom, by Freeman and Dickie (1979) in Canada, Hickman (1979) in New Zealand, and by Berry (1978) and Griffiths and King (1979) in South Africa.
Estimates of the growth rates of bivalve molluscs are made by analysing annual growth rings, by measure- ment of marked individuals, by the analysis of size- classes in the population, or by a combination of these procedures. Each of these methods has its own advan- tages and disadvantages (Haskin, 1954; Seed, 1976). More recently, Lutz (1976) has described a direct technique for age determination of mussels using ace- tate peels of polished and etched longitudinal sections of the shell (see also Jones et al., 1978; Lutz and Castagna, 1980). In a wide-scale study of mussel growth, size-class analysis combined with direct age determination of a sub-sample is probably the pre-
ferred method since annual shell rings are often indis- cernible in these species and markhecapture methods are very labour-intensive. However, size-class analysis proves difficult in some circumstances, where recruit- ment is prolonged in time, with inevitable merging of the age-classes. Even when this type of analysis is possible, it results in a statement of average growth of individuals in the population and obscures individual variability which, if genetically based (Milkman and Koehn, 1977; Innes and Haley, 1977) can make the deduction of environmental correlates of growth dif- ficult (Freeman and Dickie, 1979).
Whatever the method of estimating growth in bivalves, the results are usually described by means of a von Bertalanffy or a Gompertz growth equation (Ricker, 1975). Both equations were used by Theisen (1973), who concluded that the sigmoidal Gompertz curve described the growth of Mytilus edulis from Greenland to about half the maximum shell length, whereas the Bertalanffy equation was valid for sizes larger than one-third the maximum length. Both these growth models have the advantages over more empiri- cal best-fit equations of some generality and common usage, facilitating comparisons between populations, particularly when calculated to include variance esti- mates for the parameters (Bayley, 1977). However, caution is necessary when attempting comparisons based only on individual parameter values (Hankioja and Hakala, 1979).
Mar. Ecol. Prog. Ser. 3: 317-328, 1980
An alternative procedure for estimating growth is based on the energy balance equation of Winberg (1960). Measurement of the various components of the energy budget provide an estimate of growth potential or scope for growth (Warren and Davis, 1967; Bayne et al., 1976) which, when integrated over time and applied to individuals of different sizes, can be used to derive an average growth curve. Physiological esti- mates of growth allow inter- and intra-population com- parisons of the components of growth, such as differ- ences in the processes of energy gain and loss.
The aims of the present paper are to compare the results of two methods of growth estimation -by size- class analysis and by physiological measurements - in two populations of Mytilus edulis, and to identify any differences in the main components of growth at two ecologically different sites. Most of the physiological data are taken from the study reported by Bayne and Widdows (1978).
MATERIAL AND METHODS
Mytilus edulis ( L . ) were sampled from two sites near Plymouth (England). The first, called the Lynher site, is situated at the confluence of the Lynher and Tamar estuaries; the second, the Cattewater site, is situated at the cooling-water outfall of a small electricity-generat- ing station in the estuary of the Plym (Bayne et al., 1977; Bayne and Widdows, 1978). At both sites sam- ples were collected between mean low water of spring and neap tides where the mussels were exposed to air for an average four hours per day. The samples for size- frequency analyses were taken monthly between June 1973 and August 1974 (Lynher) and September 1973 and December 1974 (Cattewater) by random 0.1 m2 quadrats, the contents of which were sorted through 2 mm and 0.5 mm mesh sieves to collect all mussels except the smallest post-larval recruits.
All mussels from each quadrat were measured for shell length (maximum anterio-posterior dimension). Twenty-five individuals, including all sizes rep- resented in the quadrat, were taken for separate meas- urements of mantle and non-mantle tissue weights after drying at 90 "C for 24 h. A further 10 individuals were used for analysis of the energy value of mantle and non-mantle tissues separately using a Phillipson micro-bomb calorimeter.
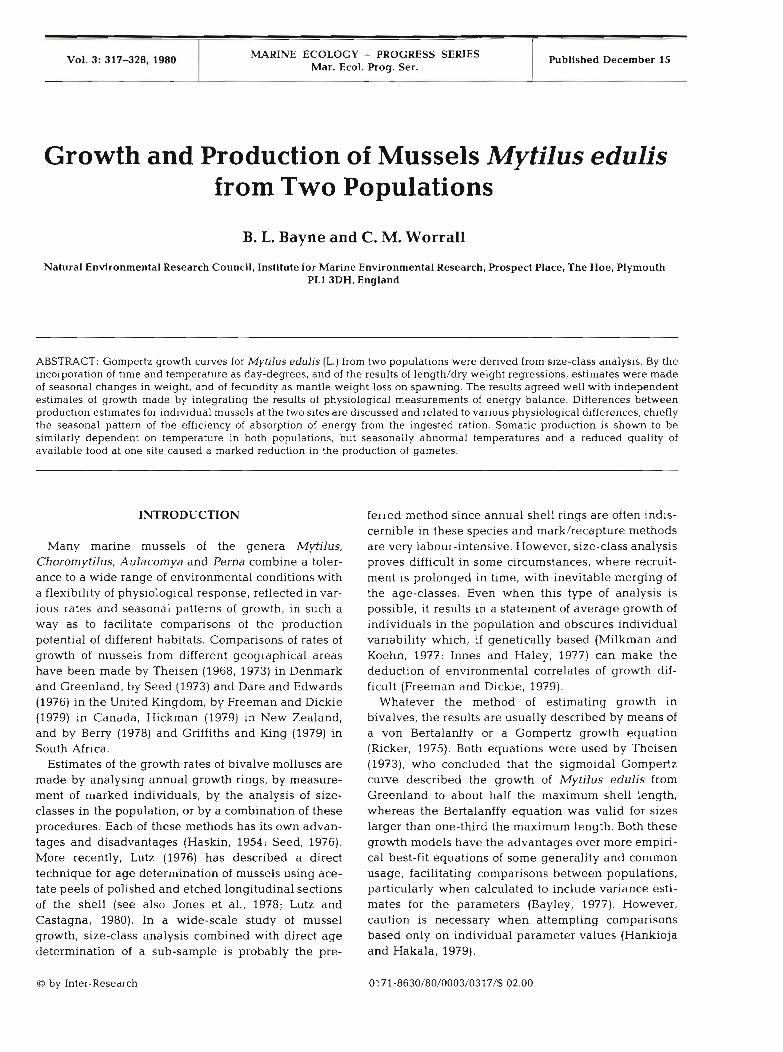
The measurements of shell length were grouped into 5-mm classes and all the resulting length/frequency tables resolved into Gaussian components using the method of Bhattacharya (1967). Figure l shows the degree of separation of component distributions that was possible. A thorough study of all available data resolved 6 size-classes; we make the assumption that these size-classes represent separate age-classes.
Fig. 1. Mytilus edulis. Size frequency analysis of shell lengths using the procedure of Bhattacharya (1967). In each sample 5 size classes are resolved. A: Lynher population; B: Cattewater
population
Two growth models were then fitted to the presumed age-class data: (1) The von Bertalanffy equation:
where 1, is length at time t, L, a constant representing the asymptotic (or maximum) length, k a constant rep- resenting the rate at which the asymptotic length is approached, and to a third constant representing time when 1, = 0. (2) The Gompertz equation:
log,, 1, = log,, L, [ l -e-k'[L-'t ' l where k' is the rate constant and t, a constant repre- senting time when l, = 1.
Winsor (1932), Silliman (1968) and Hankioja and Hakala (1979) discuss the relative merits of these two growth models. The constants for each equation were derived as discussed by Theisen (1973) and Ricker (1975). Boetius (1962) and Theisen (1968) related the growth of Mytilus edulis to an integration of tempera- ture and time called 'day-degrees' (D0) and Ursin (1963) incorporated day-degrees as the independent variable in the Bertalanffy growth equation as:
where 1, is length at D day-degrees, kD the rate con-
Bayne and Worrall: Growth a n d production of Mytilus edulis 319
stant determined as k/D, (D, = annual sum of day- degrees), and D, = t,.D,. Day-degrees may also be incorporated into the Gompertz equation:
log,, 1, = log,, L, [ I - ~ - " [ " ~ - ~ ' I 1
where D, is the day-degrees associated with t , . These equations were used to include monthly changes into the description of annual growth in length at the two sites.
Shell lengths were related to dry flesh weights (man- tle, non-mantle and total) according to the allometric equation:
Regression analyses on loglo-transformed values of weight (W) and length (L) were carried out for each sample, followed by covariance analysis (Sokal and Rolf, 1969) to compare estimates of b and a.
Mature mussels may lose a large proportion of their body weight on spawning (Bayne, 1976; Griffiths, 1977; Griffiths and King, 1979; Thompson, 1979). Since a major proportion of the mature gonad develops within the mantle, weight losses from this tissue may be used as an estimate of fecundity. To be reliable, however, such estimates should be accompanied by histological evidence of the timing and duration of spawning and of the extent to which losses of gametes represent complete or only partial spawning. In this study, weight changes in the mantle were correlated with the results of a parallel histological study (Bayne and Widdows, 1978; Lowe et al., 1980) of ga- metogenesis in mussels from the two sites, and used to estimate the weight losses due to spawning.
Physiological measurements were made between May 1973 and May 1975 (Lynher) and October 1973 and March 1975 (Cattewater), as described by Bayne and Widdows (1978). In the present paper we introduce corrections for the production of pseudofaeces (i.e. material filtered from suspension but rejected by the mussel prior to ingestion) and we have adjusted our earlier values for absorption efficiency.
(1) P s e U d o f a e c e S. Widdows et al. (1979) esti- mated the seston ( = total particulate matter in suspen- sion) concentrations at which pseudofaeces production was initiated by Mytilus edulis of different sizes in the Lynher. We have calculated from these data, and from unpublished information from Widdows (pers. comm.), a relationship between the threshold concentration of seston above which ingestion rate does not increase with further increase in concentration of suspended particulate matter (T : mg 1-') and the dry flesh weight of the mussel (W; g):
We assume the same relationship to hold for mussels
from both sites, which are similar in their total seston concentrations. The energy value of total seston was calculated from Widdows et al. (1979) and took season- ally variable values from 1.8 J mg-' in the autumn and winter to 4.6 J mg-l in the summer.
(2) A b s o r p t i o n e f f i c i e n c y . Bayne et al. (1979) recorded a relationship between absorption effi- ciency e and the proportion of organic matter (POM) present in the seston:
e = 0.5 log,, 0 - 0.32 (n = 26; rZ = 0.76)
where 0 is (POMTTotal seston) . 100. We have used this relationship here, in favour of the values originally published by Bayne and Widdows (1978).
RESULTS
Analysis of Size Classes
The smallest size class, which was identifiable in the summer with a mode between 0.5 and 0.6 cm, was taken to represent mussels in their first summer after settlement (i.e. the I-year class) since these individuals were too large to have resulted from a larval settlement in the same year. Because these individuals were prob- ably not sampled non-selectively, due to the mesh sizes used in sieving the samples, they were excluded from subsequent analysis. Larger sizes were assumed to represent successive age classes and their modal lengths calculated from each sample, to include year- classes I1 to VI. The means of these modal values, representing average annual shell lengths at each site, were as follows:
Year class Lynher site Cattewater site
I1 1.33 cm 1.46 cm 111 2.87 cm 2.94 cm IV 4.25 cm 3.99 cm V 5.31 cm 4.77 cm VI 6.06 cm 5 4 2 cm
Derivation of Growth Equations
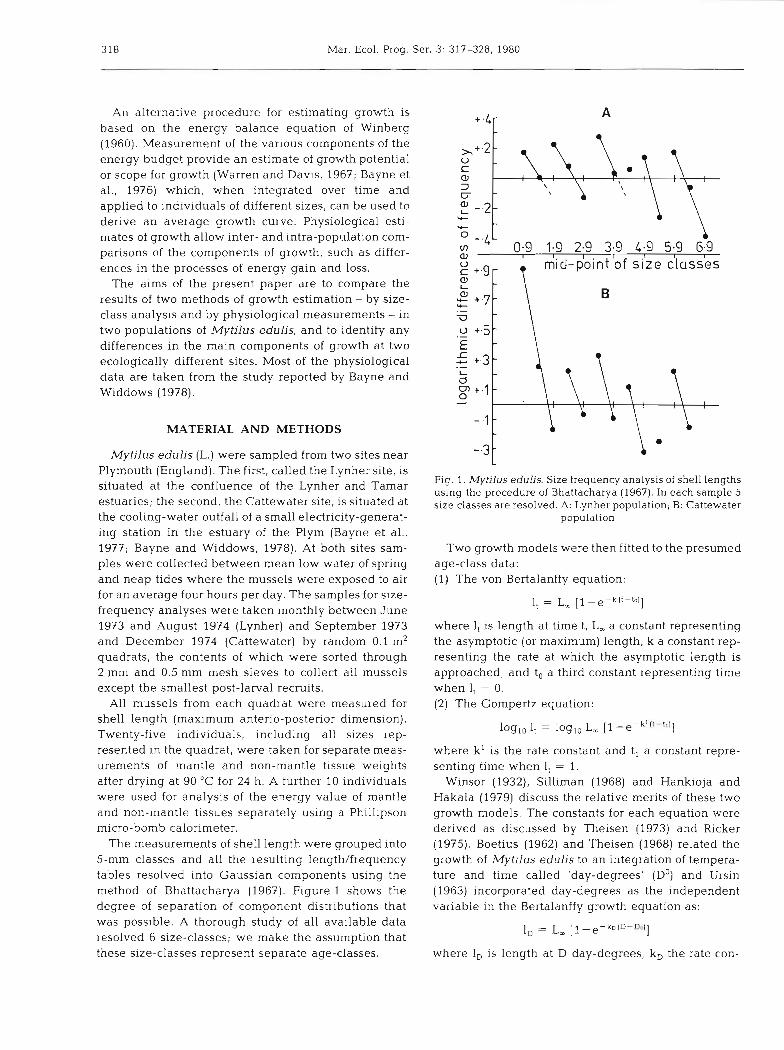
Figure 2 shows a modified Ford Walford plot (log,, 1, vs log,, It+,) constructed to estimate L, and k1 in the Gompertz equation for the Lynher site. The line of best fit was:
loglo l,+, = 0.537 log,, 1, + 0.39
from which k' was calculated to be 0.584 and log,, L, to b e 0.838. Comparing the results of similar treat-
320 Mar. Ecol. Prog. Ser. 3: 317-328, 1980
Fig. 2. Mytilus edulis. Modified Ford-Watford plot to estim'ate parameters for the Gompertz growth equation for two popula-
t i o n ~ : circles: Lynher; squares: Cattewater
ments for both Bertalanffy and Gompertz equations for Mytilus edulis from both sites:
Fit Lynher Cattewater
Gompertz. k' 0.584 0.61 1 L, 6.89 cm 6.35 cm
Bertalanffy. k 0.222 0 237 L, 9.38 cm 8.13 cm
Values for to and t, were estimated by plotting
(for the Bertalanffy fit) or
(log10 Lz - log10 1,) ln l Log,, I, l
(for the Gompertz fit) against time in years, fitting straight lines by least squares regression analysis, and solving for to and t , , respectively. The results were:
Fit Lynher Cattewater
The relevant mean annual growth equations can now be written as:
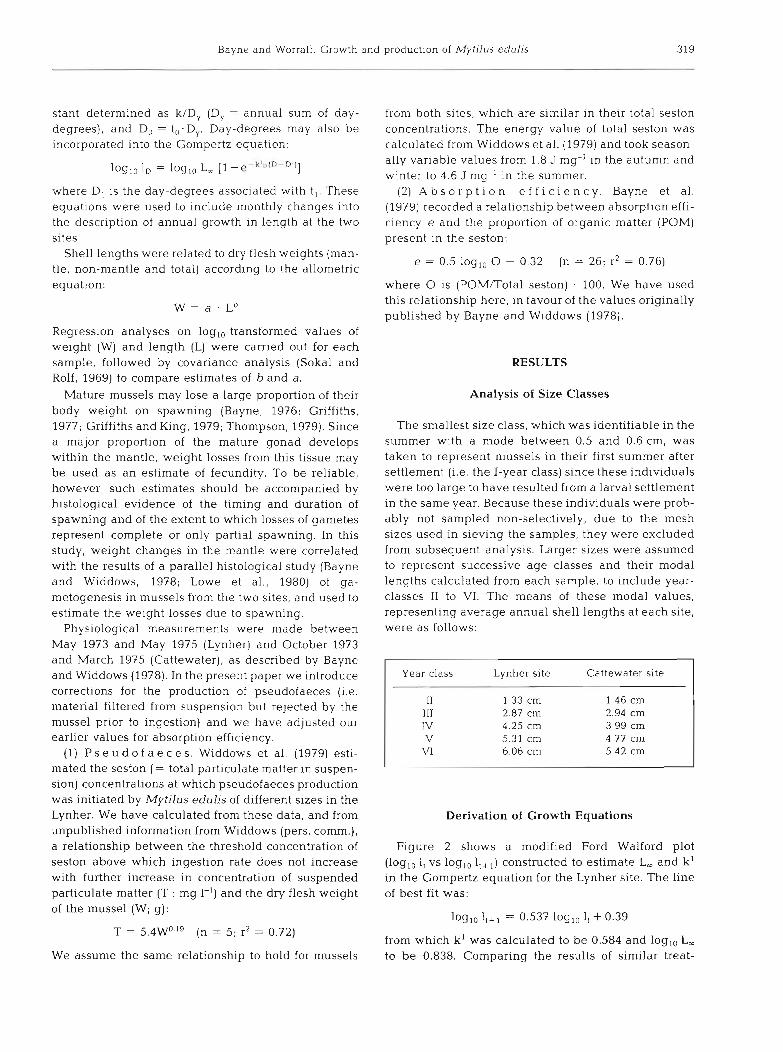
(1) Lynher Gompertz: log,o 1, = 0.838 [ l -e-0584('-1771] Bertalanffy: 1, = 9.38 [ l -e4.222('-' 321 1
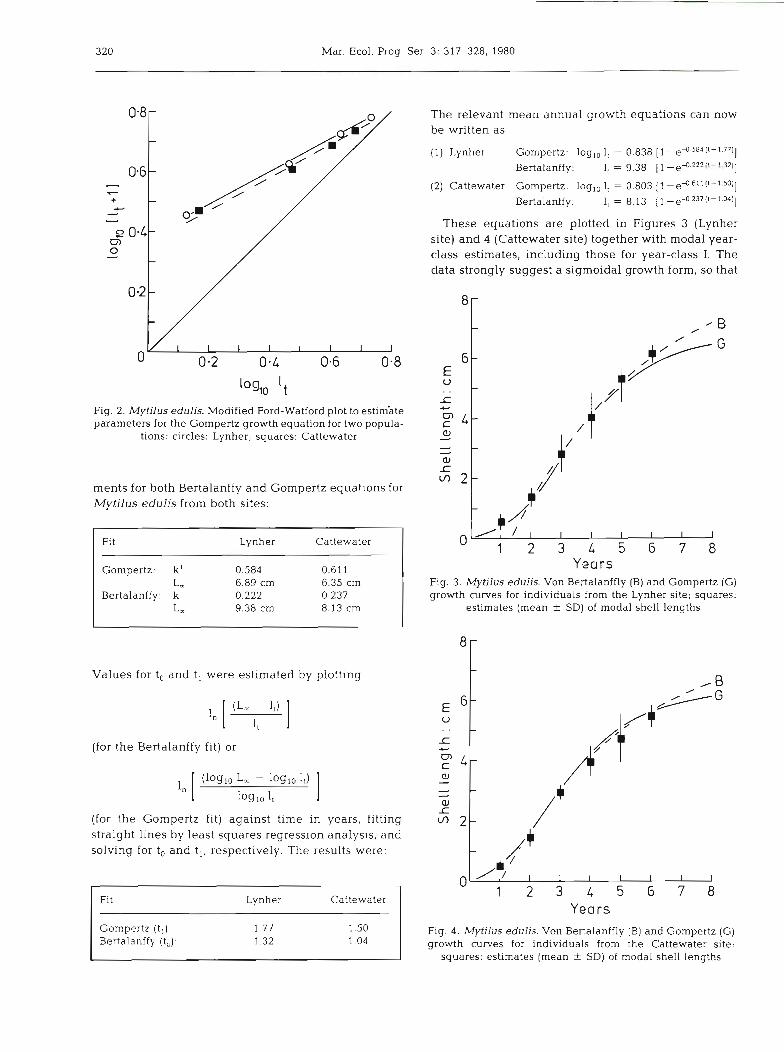
(2) Cattewater Gompertz: log,, l, = 0.803 11 -e4611('-'.501 l Bertalanffy: 1, = 8.13 [ l -e-0237('-'.04)]
These equations are plotted in Figures 3 (Lynher site) and 4 (Cattewater site) together with modal year- class estimates, including those for year-class I. The data strongly suggest a sigmoidal growth form, so that
Years Fig. 3. Mytilus edulis. Von Bertalanffly (B) and Gompertz (G) growth curves for individuals from the Lynher site; squares:
estimates (mean i- SD) of modal shell lengths
Years Gompertz (t ,): 1.77 1 .SO Bertalanffy (to): 1.32 1.04
Fig. 4. Mytilus edulis. Von Bertalanffly (B) and Gompertz (G) growth curves for individuals from the Cattewater site;
squares: est~mates (mean + SD) of modal shell lengths
Bayne and Worrall: Growth and production of Mytilus edulis
the Gompertz models provide the better fit. However, the Bertalanffy model provides an adequate fit to the data for the larger individuals and this equation possi- bly predicts more realistic asymptotic lengths. This is in good agreement with Theisen (1973). Both equa- tions agree in suggesting a more rapid rate of growth for smaller individuals, and a smaller maximum length, at the Cattewater site.
An independent estimate of age for Mytilus edulis from the Lynher site was kindly made by R. A. Lutz (see Lutz, 1976; Lutz and Castagna, 1980, for proce- dure), who examined 6 specimens, 3 each of mean shell length 5.5 -t 0.2 cm and 6.7 f 0.4 cm:
Age (years) Length (cm) (Lutz, pers. comm.) Lutz Gompertz Bertalanffy
Incorporation of Temperature into the Growth Equations
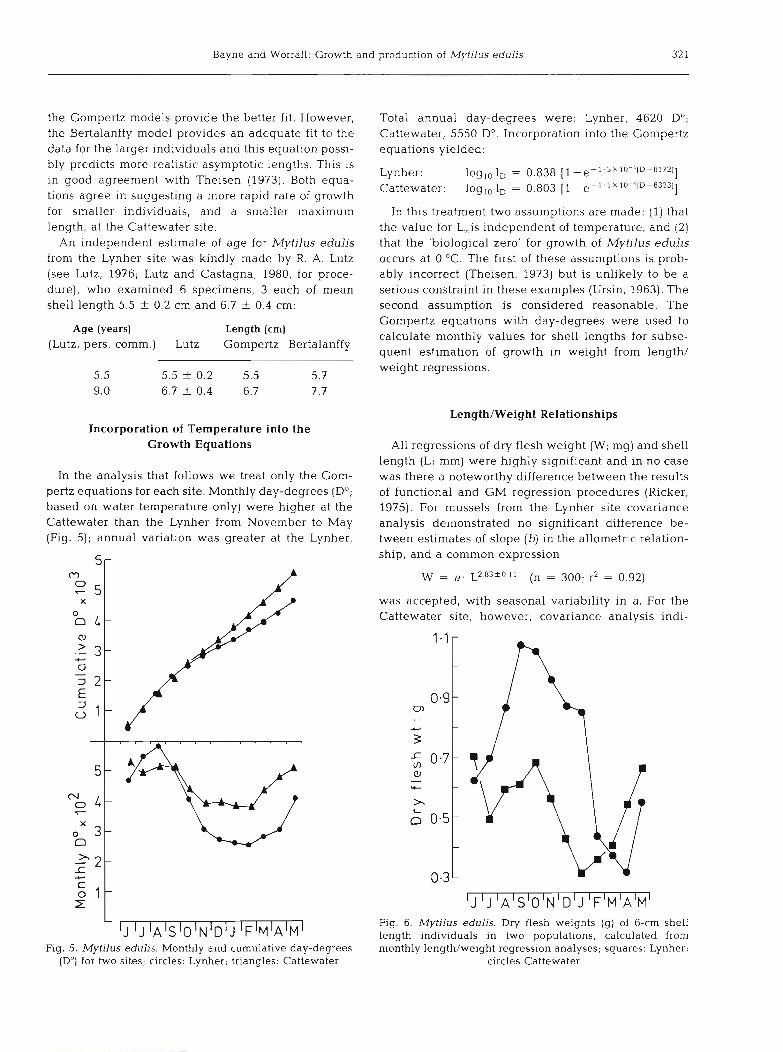
In the analysis that follows we treat only the Gom- pertz equations for each site. Monthly day-degrees (D0; based on water temperature only) were higher at the Cattewater than the Lynher from November to May (Fig. 5); annual variation was greater at the Lynher.
6 r
Fig. 5. Mytilus edulis. Monthly and cumulative day-degrees (D") for two sites; circles: Lynher; triangles: Cattewater
Total annual day-degrees were: Lynher, 4620 Do; Cattewater, 5550 Do. Incorporation into the Gompertz equations yielded:
Lynher: log lo l, = 0,838 [l - e - l 3X l0 - ' 1D -8172 l 1 Cattewater: log,, 1, = 0.803 [ l - e - I 1
In this treatment two assun~ptions are made: ( l ) that the value for L,is independent of temperature, and (2) that the 'biological zero' for growth of Mytilus edulis occurs at 0 OC. The first of these assumptions is prob- ably incorrect (Theisen, 1973) but is unlikely to be a serious constraint in these examples (Ursin, 1963). The second assumption is considered reasonable. The Gompertz equations with day-degrees were used to calculate monthly values for shell lengths for subse- quent estimation of growth in weight from length/ weight regressions.
LengthIWeight Relationships
All regressions of dry flesh weight (W; mg) and shell length (L; mm) were highly significant and in no case was there a noteworthy difference between the results of functional and GM regression procedures (Ricker, 1975). For mussels from the Lynher site covariance analysis demonstrated no significant difference be- tween estimates of slope (b) in the allometric relation- ship, and a common expression
was accepted, with seasonal variability in a. For the Cattewater site, however, covariance analysis indi-
I J ' J ' A ' S ~ O ' N ' D ~ J ' F ' M ' A ' M ' Fig. 6. Mytilus edulis. Dry flesh weights (g) of 6-cm shell length individuals in two populations, calculated from monthly length/weight regression analyses; squares: Lynher;
circles Cattewater
322 Mar. Ecol. Prog Ser 3: 317-328: 1980
cated significant differences between estimates of b. The data were then grouped according to season and the following expressions derived:
Summer (June to August) . W = a . ~ 2 . 7 0 5 0 . 1 1
Autumn (September to November) : W = a . L~.'?" l 3
Winter (December to February) : W = a - L3 J1*0.09
Spring (March to May) . W = a . ~ 2 . 4 4 50.23
Seasonal changes in weight for individuals of 6 cm shell length from both populations are shown in Figure 6, demonstrating the large annual fluctuations in weight at both sites.
Energy Value
Regression analysis showed no significant change between energy value g-' of tissue with change in dry flesh weight of the mussels between 0.1 and 1.0 g dry weight (F = 0.14 for 1, 105 degrees of freedom). Analy- sis of variance also demonstrated no significant differ- ence between mussels from the two sites (F = 3.09 for 1 , 10 d.f.). We have therefore taken a single overall mean value of 21.8 f 1.7 J mg-' dry flesh weight as the energy value for Mytilus edulis tissue in this study. This is within the range normally found for marine bivalves (Beukema and De Bruin, 1979).
Growth in Weight
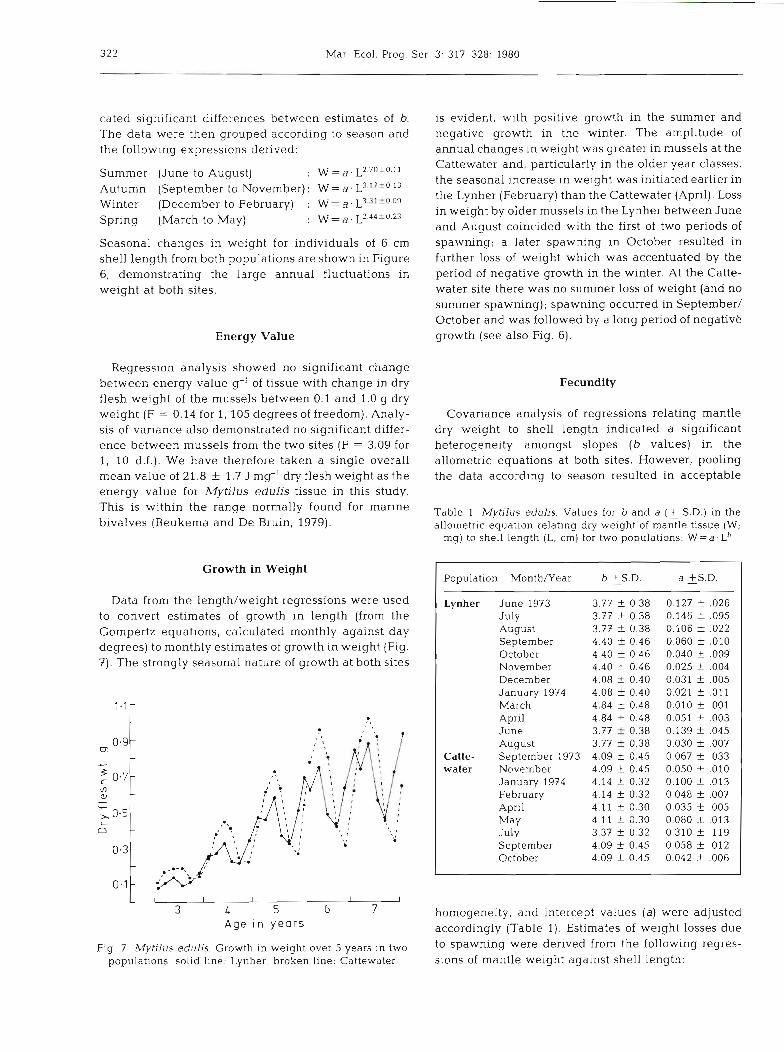
Data from the length/weight regressions were used to convert estimates of growth in length (from the Gompertz equations, calculated monthly against day degrees) to monthly estimates of growth in weight (Fig. 7). The strongly seasonal nature of growth at both sites
is evident, with positive growth in the summer and negative growth in the winter. The amplitude of annual changes in weight was greater in mussels at the Cattewater and, particularly in the older year classes, the seasonal increase in weight was initiated earlier in the Lynher (February) than the Cattewater (April). Loss in weight by older mussels in the Lynher between June and August coincided with the first of two periods of spawning; a later spawning in October resulted in further loss of weight which was accentuated by the period of negative growth in the winter. At the Catte- water site there was no summer loss of weight (and no summer spawning); spawning occurred in September/ October and was followed by a long period of negativC growth (see also Fig. 6).
Fecundity
Covariance analysis of regressions relating mantle dry weight to shell length indicated a significant heterogeneity amongst slopes (b values) in the allometric equations at both sites. However, pooling the data according to season resulted in acceptable
Table 1. Mytilus edulis. Values for b and a (-+ S.D.) in the allometric equation relating dry weight of mantle tissue (W;
mg) to shell length (L; cm) for two populations: W = a - Lb
Population Month/Year b 5 S . D . a 2 S . D
Lynher June 1973 July August September October November December January 1974 March April June August
Catte- September 1973 water November
January 1974 February April May July September October
L I I I I I I 3 C 5 6 7
Age i n years
Fig. 7 lMytilus edulis . Growth In weight over 5 years in two populations; solid 11ne: Lynher; broken line: Cattewater
homogeneity, and intercept values (a) were adjusted accordingly (Table 1). Estimates of weight losses due to spawning were derived from the following regres- sions of mantle weight against shell length:
Bayne and Worrall: Growth and production of Mytilus edulis
Lynher: July/August, 1973; September/October, 1973; June/August, 1974
Cattewater: September/November, 1973; September/October, 1974
The calculated spawning losses (W'; mg) were then related to the total body weights (W; g) before spawn- ing and two equations from the pooled data derived:
Lynher: W' = 104 f 23.W140'0.13 (n = 18, r2 = 0.93) Cattewater:
W - = 21 + 2 , ~ 1 . 2 9 ~ 0 . 0 9 (n = 12, r2 = 0.91)
The slopes of these two relationships are similar; at similar body weights, however, the weight losses which were taken to represent fecundity were greater in Mytilus edulis from the Lynher. In addition, mussels at the Lynher site spawned twice during the year, compared with a single spawning in the Cattewater (Lowe et al., 1980).
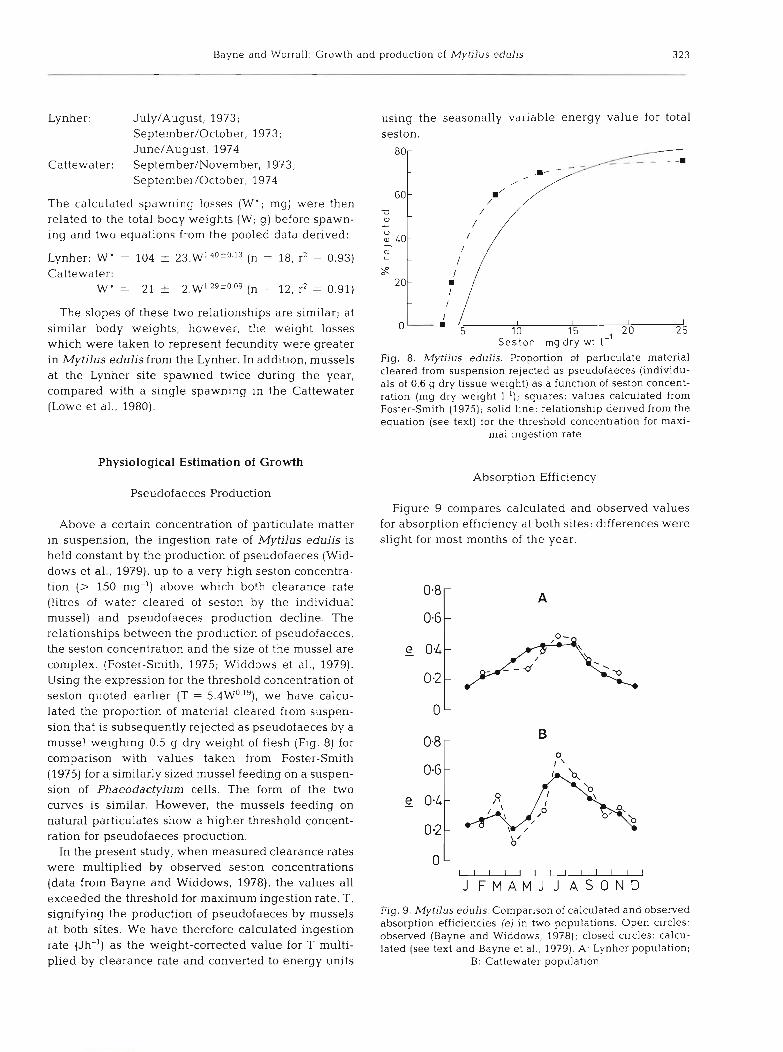
using the seasonally variable energy value for total seston.
0 I! / 5 10 I 15 I 2 I 0 2 5 I
Seston rng dry wt I-'
Fig. 8. Mytilus edulis. Proportion of particulate material cleared from suspension rejected as pseudofaeces (individu- als of 0.6 g dry tissue weight) as a function of seston concent- ration (mg dry weight 1-l); squares: values calculated from Foster-Smith (1975); solid line: relationship derived from the equat~on (see text) for the threshold concentration for maxi-
mal ingestion rate
Physiological Estimation of Growth Absorption Efficiency
Pseudofaeces Production Figure 9 compares calculated and observed values
Above a certain concentration of particulate matter for absorption efficiency at both sites; differences were in suspension, the ingestion rate of Mytilus edulis is slight for most months of the year. held constant by the production of pseudofaeces (Wid- dows et al., 1979), up to a very high seston concentra- tion (> 150 mg-') above which both clearance rate (litres of water cleared of seston by the individual mussel) and pseudofaeces production decline. The relationships between the production of pseudofaeces, the seston concentration and the size of the mussel are complex. (Foster-Smith, 1975; Widdows et al., 1979). Using the expression for the threshold concentration of seston quoted earlier (T = 5.4W0.'9), we have calcu- lated the proportion of material cleared from suspen- sion that is subsequently rejected as pseudofaeces by a mussel weighing 0.5 g dry weight of flesh (Fig. 8) for 0.8 P
B
comparison with values taken from Foster-Smith (1975) for a similarly sized mussel feeding on a suspen- sion of Phaeodactylum cells. The form of the two curves is similar. However, the mussels feeding on - e OaG; 0.4 natural particulates show a higher threshold concent-
0.2 ration for pseudofaeces production. In the present study, when measured clearance rates
?\
A ' t /O 0, x0
- / 1 /
b'
were multiplied by observed seston concentrations 0 - l 1 1 1 1 1 1 1 1 1 1 1 1
(data from Bayne and Widdows, 1978), the values all J F M A M J J A S O N D exceeded the threshold for maximum ingestion rate, T, signifying the production of pseudofaeces by mussels Fig. 9. Mytilus edulis. Comparison of calculated and observed
absorption efficiencies (e) in two populations. Open circles: at both sites' We have ingestion observed (Bayne and Widdows, 1978); closed circles: calcu- rate (Jh-'1 as the weight-cOrrected lated (see text and Bayne et al., 1979). A: Lynher population; plied by clearance rate and converted to energy units B: Cattewater population
324 Mar Ecol. Prog. Ser. 3: 317-328, 1980
The Scope for Growth
This was calculated from the energy balance equa- tion of Winberg (1 960);
C = P + R + U + F where C = ingested ration
P = production, both somatic (Pg) and germinal (Pr)
R = respiratory heat loss U = energy lost as excreta F = energy lost as faeces
I'he absorbed raton, A, is C X e, where e is the efficiency of absorption. Production (Pr + Pg) can then be expressed as a function of A, R and U:
P = A-(R + U), and is called the 'scope for growth'.
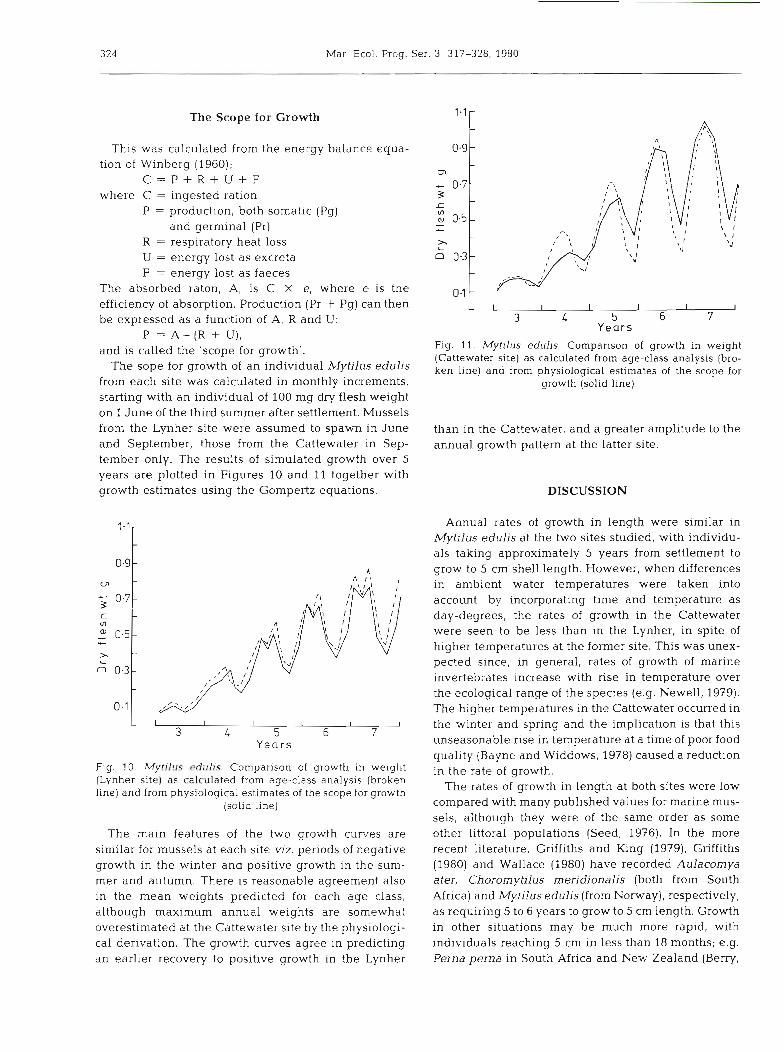
The sope for growth of an individual Mytilus edulis from each site was calculated in monthly increments, starting with an individual of 100 mg dry flesh weight on 1 June of the third summer after settlement. Mussels from the Lynher site were assumed to spawn in June and September, those from the Cattewater in Sep- tember only. The results of simulated growth over 5 years are plotted in Figures 10 and 11 together with growth estimates using the Gompertz equations.
L I I I I 1 I
3 L 5 6 7 Years
Fig. 10. Mytllus edulls. Comparison of growth in weight (Lynher site) as calculated from age-class analysis (broken line) and from physiological estimates of the scope for growth
(solid line)
The main features of the two growth curves are similar for mussels at each site viz. periods of negative growth in the winter and positive growth in the sum- mer and autumn. There is reasonable agreement also in the mean weights predicted for each age class, although maximum annual weights are somewhat overestimated at the Cattewater site by the physiologi- cal derivation. The growth curves agree in predicting an earlier recovery to positive growth in the Lynher
L I I I I I I
3 L 5 6 7 Years
Fig. 11. Mytilus edulis. Comparison of growth in weight (Cattewater site) as calculated from age-class analysis (bro- ken line) and from physiological estimates of the scope for
growth (solid line)
than in the Cattewater, and a greater amplitude to the annual growth pattern at the latter site.
DISCUSSION
Annual rates of growth in length were similar in Mytilus edulis at the two sites studied, with individu- als taking approximately 5 years from settlement to grow to 5 cm shell length. However, when differences in ambient water temperatures were taken into account, by incorporating time and temperature as day-degrees, the rates of growth in the Cattewater were seen to be less than in the Lynher, in spite of higher temperatures at the former site. This was unex- pected since, in general, rates of growth of marine invertebrates increase with rise in temperature over the ecological range of the species (e.g. Newell, 1979). The higher temperatures in the Cattewater occurred in the winter and spring and the implication is that this unseasonable rise in temperature at a time of poor food quality (Bayne and Widdows, 1978) caused a reduction in the rate of growth.
The rates of growth in length at both sites were low compared with many published values for marine mus- sels, although they were of the same order as some other littoral populations (Seed, 1976). In the more recent literature, Griffiths and King (1979), Griffiths (1980) and Wallace (1980) have recorded Aulacomya ater, Choromytilus meridionalis (both from South Africa) and Mytilus edulis (from Noway), respectively, as requiring 5 to 6 years to grow to 5 cm length. Growth in other situations may be much more rapid, with individuals reaching 5 cm in less than 18 months; e.g. Perna perna in South Africa and New Zealand (Berry,
Bayne and Worrall: Growth and production 01 Mytilus edulis 325
1978; Hickman, 1979), C. meridionalis on the west coast of South Africa (Du Plessis, 1977) and M. edulis in suspended cultivation in Spain (Mason, 1976). Rates of growth of M. edulis in North America have recently been compiled by Lutz (1980); they vary over the range indicated here i.e. 5 cm shell length reached from <2 to > 6 years. Some of this variation in growth rate can be explained by temperature differences, as demon- strated by calculating growth in length (mm) per 1000 Do (although non-linear relationships between age, rate of growth and Do make comparative use of such data difficult). Hickman (1979) made this calculation from various studies of mussels grown in suspended culture (values ranged from 8.9 to 15.2 mm per 1000 Do); some values for littoral populations are listed in Table 2, but with no corrections made for height on the
Table 2. Mytilus edulis. Rates of growth expressed a s mm increase in shell length per 1000 day degrees, from various
locations. + Calculated by Theisen, 1968
Rate of Location growth Authority
(mm per l000 DO)
Conway; North Wales 3.3 Savage (1956)+ 0resund;Denmark 7.0 Boetius (1962) Wadden Sea; Denmark 8.3 Theisen (1968) Disko; Greenland 5.5 Theisen (1973) Menai Straits; North Wales 4.5 Dare and Edwards
(1976) Lynher; Cornwall, U.K. 3.2 This study Cattewater; Devon, U.K. 3.2 This study
shore (Baird, 1966). Remaining differences in growth rate may still be considerable.
Mussels from the Cattewater site had lower values for annual growth in weight than those from the Lynher, but with a greater amplitude in weight in any single year. There were differences also at the two sites in the timing and the duration of the annual periods of weight increase and decrease, and in fecundity. Fecundity in both populations was somewhat lower than other published values for Mytilus edulis (Table 3). Values in Table 3 were calculated from Thompson (1979); the slopes in the expressions relating weight loss on spawning to body weight are all greater than one (range 1.12-1.51) and the weight loss (in mg) for an individual of 1 g dry flesh weight ranges from 21 to 471 mg. Thompson recorded annual variation in fecundity within populations of mussels; there are also consider- able between-population differences. In a study of mussels from the vicinity of a thermal discharge Hines (1979) recorded reduced gonad indices and body con-
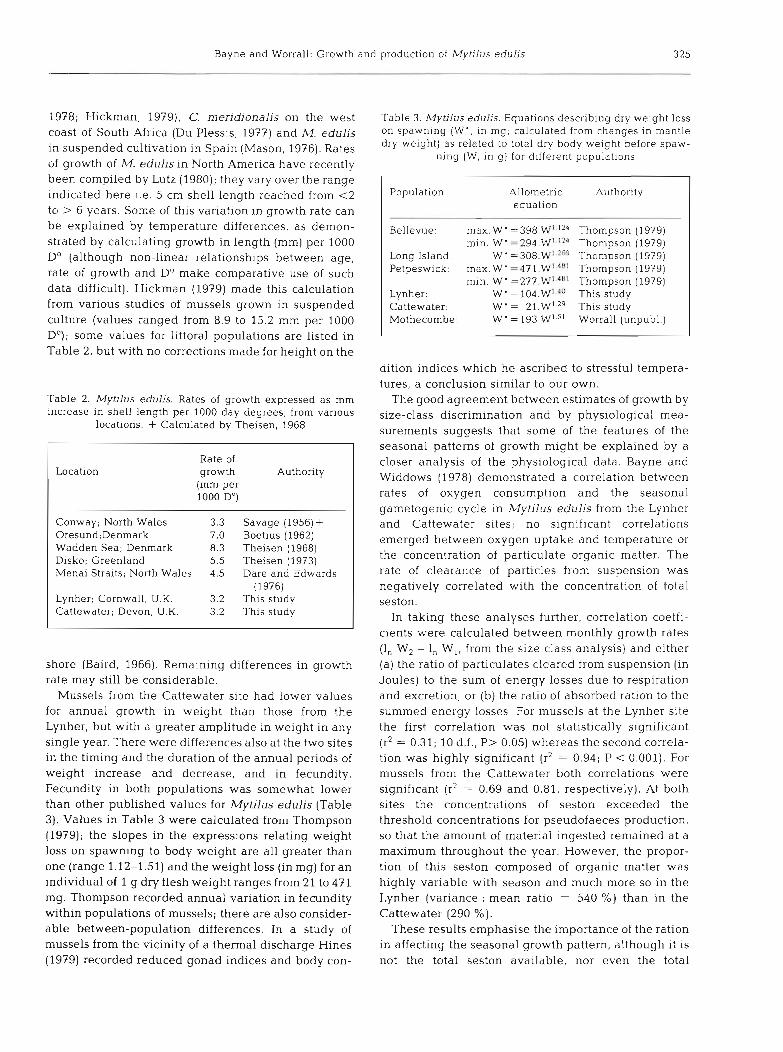
Table 3. Mytilus edulis. Equations describing dry weight loss on spawning (W' , in mg; calculated from changes in mantle dry weight) as related to total dry body weight before spaw-
ning (W, in g) for different populations
Population Allometric Authority equation I
Bellevue: max. W ' =398.W1 '?"hompson (1979) min. Wa=294 W' l J 4 Thompson (1979)
Long Island: W ' =308.W1 Thompson (1979) Petpeswick: max. W' =471.W1 4H1 Thompson (1979)
min. W' =2?7.W1 4 R 1 Thompson (1979) Lynher: W' = 104.W1 40 This study Cattewater: W' = 2 1 . W l . ~ ~ This study Mothecombe: W' = 1 9 3 . W ' . ~ ~ Worrall (unpubl.)
dition indices which he ascribed to stressful tempera- tures, a conclusion similar to our own.
The good agreement between estimates of growth by size-class discrimination and by physiological mea- surements suggests that some of the features of the seasonal patterns of growth might be explained by a closer analysis of the physiological data. Bayne and Widdows (1978) demonstrated a correlation between rates of oxygen consumption and the seasonal gametogenic cycle in Mytilus edulis from the Lynher and Cattewater sites; no significant correlations emerged between oxygen uptake and temperature or the concentration of particulate organic matter. The rate of clearance of particles from suspension was negatively correlated with the concentration of total seston.
In taking these analyses further, correlation coeffi- cients were calculated between monthly growth rates (1, W, - 1, W,, from the size class analysis) and either (a) the ratio of particulates cleared from suspension (in Joules) to the sum of energy losses due to respiration and excretion, or (b) the ratio of absorbed ration to the summed energy losses. For mussels at the Lynher site the first correlation was not statistically significant (r2 = 0.31; l 0 d.f., P> 0.05) whereas the second correla- tion was highly significant (r2 = 0.94; P < 0.001). For mussels from the Cattewater both correlations were significant (r2 = 0.69 and 0.81, respectively). At both sites the concentrations of seston exceeded the threshold concentrations for pseudofaeces production, so that the amount of material ingested remained at a maximum throughout the year. However, the propor- tion of this seston composed of organic matter was highly variable with season and much more so in the Lynher (variance : mean ratio = 540 %) than in the Cattewater (290 %).
These results emphasise the importance of the ration in affecting the seasonal growth pattern, although it is not the total seston available, nor even the total
Mar Ecol. Prog. Ser. 3: 317-328, 1980
amount of particulate organic matter, but the propor- both sites for sufficient gametogenesis to occur for an tion between these two variables which was signific- autumn spawning, although with a lower fecundity in ant. The efficiency with which the individual mussels the Cattewater. absorbed useful energy from material ingested, rather The seasonal changes in body weight, including than the rate of feeding per se, controlled the supply of those due to spawning, result in very variable turnover energy, and this efficiency (e), as well as the total ratios (PE-', where P is production of both somatic amount of available energy, were both a function of the tissues and gametes, and W is the mean body weight or proportion of organic matter in the ingested seston. At energy content) during the year. For example, for indi- the Cattewater site, total seston and the proportion of viduals in year class IV, monthly P W-' varied from organic matter CO-varied during the year, but this was - 0.34 to + 0.42 in the Lynher and - 0.59 to + 0.66 in not so in the Lynher (see also Widdows et al., 1979), the Cattewater. When calculated annually (Table 4), resulting in a lack of significant correlation between Mytilus edulis from the Lynher are seen to have been the amount of material cleared from suspension and more productive, with higher turnover ratios and a growth at the latter site. greater proportion of energy directed towards repro-
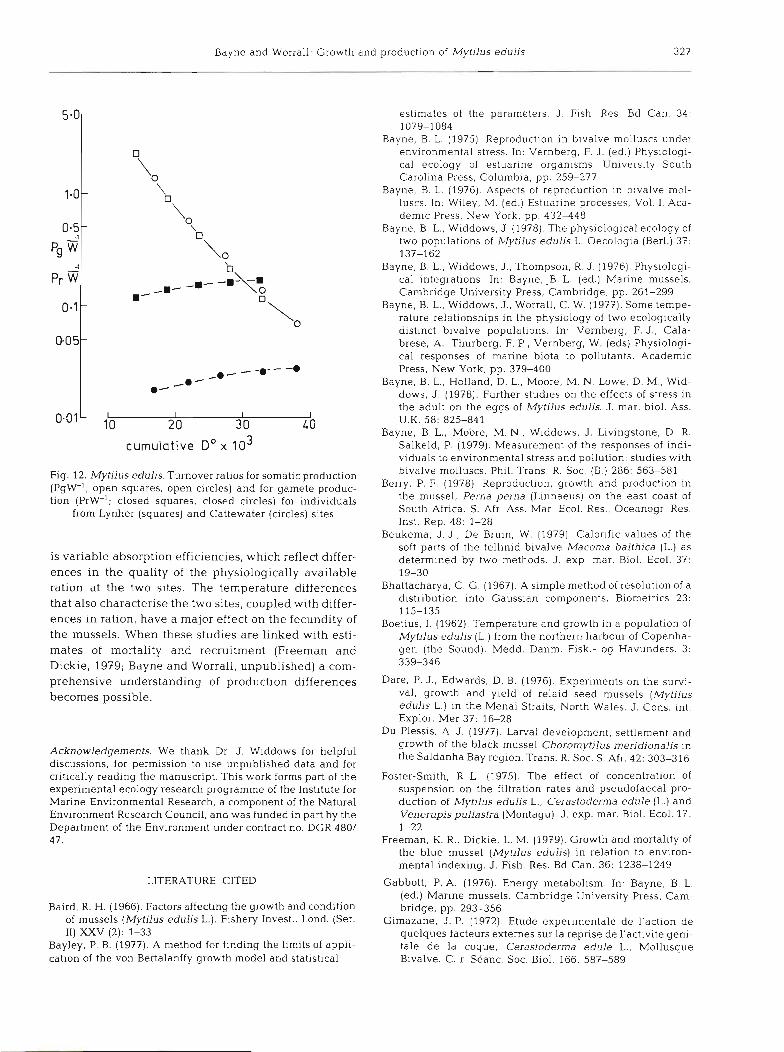
Another major seasonal cycle in these mussels was duction (Pr) than mussels in the Cattewater. that of gametogenesis and spawning. Two features Bearing in mind the known temperature differences distinguished mussels from the two sites viz. two at the two sites, the Pm ratios from Table 4 were spawnings per year in the Lynher compared with one plotted against cumulative day degrees (Fig. 12). The only (in the autumn) in the Cattewater, and a higher result demonstrates that somatic production per unit fecundity per spawning in the Lynher. For mussels in body weight (Pg W-') was similar at both sites when the Lynher the loss of weight in the winter (46 %) was temperature differences were taken into account, but less than in the Cattewater (67 %) and the period of that gamete production per unit body weight (P~W-l)
weight gain in the spring started earlier. Experimental was considerably less in the Cattewater. Previous work with bivalves (Sastry, 1968, 1970; Gimazane, experimental work in this laboratory has demonstrated 1972; Bayne, 1975) demonstrates that gametogenesis reduced fecundity in mussels exposed to temperature may be intitiated by a rise in temperature only if and nutritive stress (Bayne et al., 1978); the present sufficient nutrient reserves within the animal, or food results suggest a similar phenomenon occurring natur- in the environment, are present. Stressful temperatures ally in the Cattewater. in the winter and spring in the Cattewater, together This study illustrates the mutual advantages of with poor ration conditions, possibly inhibit game- growth estimates and physiological studies in explor- togenesis following the spawning in the autumn, ing difference in the production potential by individu- whereas in the Lynher, gametogenesis can be main- als of the same species at different sites. The growth tained in the winter and spring, resulting in a spawn- estimates identified difference in overall growth rates ing in the summer. This pattern for the Lynher appears and in the details of the seasonal cycle. The physiolog- typical of many mussel populations (Gabbott, 1976; ical studies (see also Bayne and Widdows, 1978) sug- Bayne, 1976; Lowe et al., 1980). Temperature and gest a number of factors likely to cause the observed ration conditions during the summer were suitable at growth differences; perhaps the most striking of these
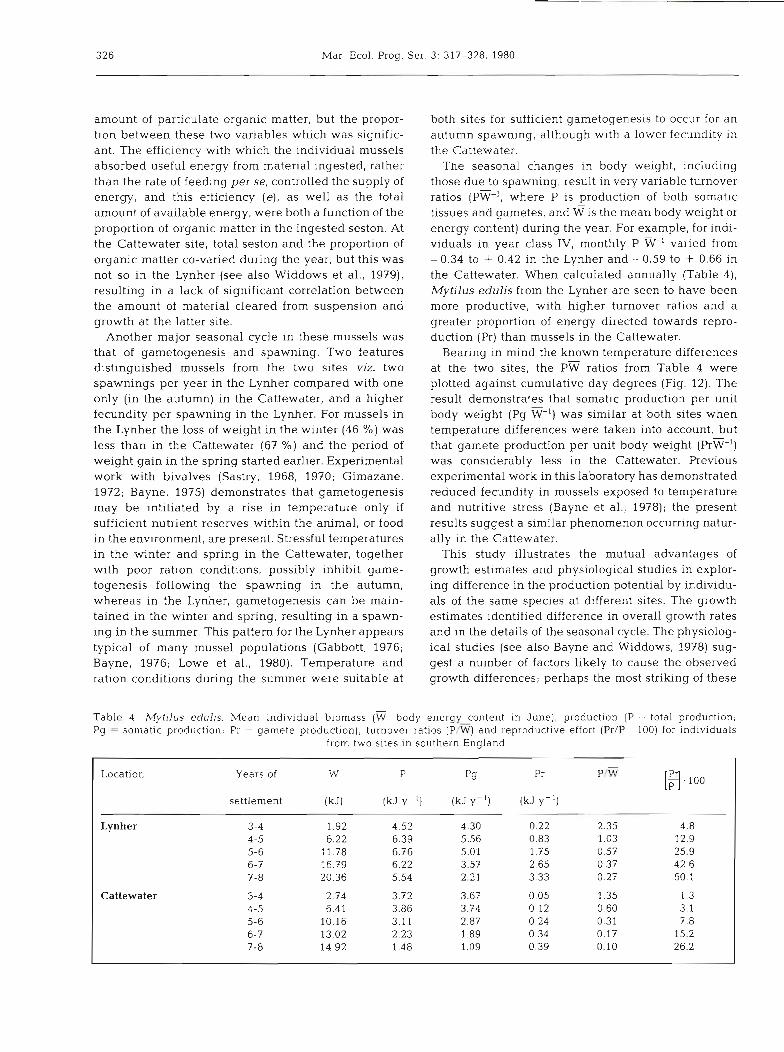
Table 4. Mytilus edulis. Mean individual biomass (W; body energy-content in June), production (P = total production; Pg = somatic production; Pr = gamete production), turnover ratios (P,W) and reproductive effort (Pr/P 100) for individuals
from two sites in southern England
- Location Years of W P pg Pr P!W
settlement (kJ1 ( k ~ y-l) (kJ y-') (kJ y-')
Lynher 3-4 1.92 4.52 4.30 0.22 2.35 4.8 4-5 6.22 6.39 5.56 0.83 1.03 12.9 5-6 11.78 6.76 5.01 1.75 0.57 25.9 6-7 16.79 6.22 3.57 2.65 0.37 42.6 7-8 20.36 5.54 2.21 3.33 0.27 60.1
Cattewater 3-4 2.74 3.72 3.67 0.05 1.35 1.3 4-5 6.41 3.86 3.74 0.12 0.60 3.1 5-6 10.16 3.11 2 87 0.24 0.31 7.8 6-7 13.02 2.23 1.89 0.34 0.17 15.2 7-8 14.92 1.48 1.09 0.39 0.10 26.2
Bayne and Worrall: Growth and production of Mytilus edulis 327
0.01' iO 1 I I 20 30 40
cumulative Do x l o3
Fig. 12. Mytilus edulis. Turnover ratios for somatic production (PgW-l; open squares, open circles) and for gamete produc- tion (PrW-'; closed squares, closed circles) for individuals
from Lynher (squares) and Cattewater (circles) sites
is variable absorption efficiencies, which reflect differ- ences in the quality of the physiologically available ration at the two sites. The temperature differences that also characterise the two sites, coupled with differ- ences in ration, have a major effect on the fecundity of the mussels. When these studies are linked with esti- mates of mortality and recruitment (Freeman and Dickie, 1979; Bayne and Worrall, unpublished) a com- prehensive understanding of production differences becomes possible.
Acknowledgements. We thank Dr J. Widdows for helpful discussions, for permission to use unpublished data and for critically reading the manuscript. This work forms part of the experimental ecology research programme of the Institute for Marine Environmental Research, a component of the Natural Environment Research Council, and was funded in part by the Department of the Environment under contract no. DGR 480/ 47.
LITERATURE CITED
Baird, R. H. (1966). Factors affecting the growth and condition of mussels (Mytilus edulis L.). Fishery Invest., Lond. (Ser. 11) XXV (2): 1-33
Bayley, P. B. (1977). A method for finding the limits of appli- cation of the von Bertalanffy growth model and statistical
estimates of the parameters. J. Fish. Res. Bd Can. 34: 1079-1 084
Bayne, B. L. (1975). Reproduction in bivalve molluscs under environmental stress. In: Vernberg, F. J. (ed.) Physiologi- cal ecology of estuarine organisms. University South Carolina Press, Columbia, pp. 259-277
Bayne, B. L. (1976). Aspects of reproduction in b~valve mol- luscs. In: Wiley, M. (ed.) Estuar~ne processes, Vol. I. Aca- demic Press, New York, pp 432-448
Bayne, B. L., Widdows, J. (1978). The physiological ecology of two populations of Mytilus edulis L. Oecologia (Berl.) 37: 137-162
Bayne, B. L., Widdows, J., Thompson, R. J. (1976). Physiologi- cal integrations. In: Bayne, .B. L. (ed.) Marine mussels. Cambridge University Press. Cambridge, pp. 261-299
Bayne, B. L., Widdows, J., Worrall, C. W. (1977). Some tempe- rature relationships in the physiology of two ecologically distinct bivalve populations. In: Vernberg, F. J . , Cala- brese, A., Thurberg, F. P , Vernberg, W. (eds) Physiologi- cal responses of marine biota to pollutants. Academic Press, New York, pp. 3 7 9 4 0 0
Bayne, B. L., Holland, D. L., Moore, M. N. Lowe, D. M., Wid- dows, J. (1978). Further studies on the effects of stress in the adult on the eggs of Mytilus edulis. J. mar. biol. Ass. U.K. 58: 825-841
Bayne, B. L., Mobre, M. N., Widdows, J. Livingstone. D. R. Salkeld, P. (1979). Measurement of the responses of indi- viduals to environmental stress and pollution: studies with bivalve molluscs. Phil. Trans. R. Soc. (B.) 286: 563-581
Berry, P. F. (1978). Reproduction, growth and production in the mussel, Perna perna (Linnaeus) on the east coast of South Africa. S. Afr Ass. Mar Ecol. Res., Oceanogr Res. Inst. Rep. 48: 1-28
Beukema, J. J., De Bruin, W. (1979). Calorific values of the soft parts of the tellinid bivalve Macoma balthica (L.) as determined by two methods. J. exp. mar. Biol. Ecol. 37: 19-30
Bhattacharya, C. G. (1967). A simple method of resolution of a distribution into Gaussian components. Biometrics 23: 115-135
Boetius, I. (1962). Temperature and growth in a population of Mytilus edulis (L.) from the northern harbour of Copenha- gen (the Sound). Medd. Danm. Fisk.- og Havunders. 3: 339-346
Dare, P. J., Edwards, D. B. (1976). Experiments on the survi- val, growth and yield of relaid seed mussels (Mytilus eduljs L.) in the Menai Straits. North Wales. J. Cons. int. Explor. Mer 37: 16-28
Du Plessis. A. J. (1977). Larval development, settlement and growth of the black mussel Choromytilus meridionaljs in the Saldanha Bay reglon Trans. R. Soc. S. Afr. 42: 303-316
Foster-Smith, R . L. (1975). The effect of concentration of suspension on the filtration rates and pseudofaecal pro- duction of Mytilus edulis L., Cerastoderma edule (L.) and ~enerupisp;llastra (Montagu). J. exp. mar. Biol. Ecol. 17: 1-22
Freeman, K. R., Dickie, L. M. (1979). Growth and mortality of the blue mussel (Mytilus edulis) in relation to environ- mental indexing. J. Fish. Res. Bd Can. 36: 1238-1249
Gabbott, P. A. (1976). Energy metabolism. In: Bayne. B. L. (ed.) Marine mussels. Cambridge University Press, Cam- bridge, pp. 293-356
Gimazane, J. P. (1972). Etude experimentale de l'action de quelques facteurs externes sur la reprise de l'activite geni- tale de la coque, Cerastoderma edule L., Mollusque Bivalve. C. r Seanc. Soc. Biol. 166: 587-589
Mar. Ecol. Prog. Ser. 3: 317-328, 1980
Griffiths, C. L., King, J. A. (1979). Energy expended on growth and gonad output in the ribbed mussel Aulacomya ater. Mar. Biol. 53: 217-222
Griffiths. R. J. (1977). Reproductive cycles in littoral popula- tions of Choromytilus meridionalis (K.) and Aulacomya ater (Molina) with a quantitative assessment of gamete production in the former. J . exp. mar. Biol. Ecol. 30: 53-71
Griffiths, R. J. (1980). Ecophysiology of the black mussel Choromytilus mendionalis (Krauss). Unpublished Ph. D. thesis, University of Cape Town, South Africa
Hankioja, E., Hakala, T (1979). Asymptotic equations in growth studies - an analysis based on Anodontapiscinalis (Mollusca, Unionidae). Ann. Zool. Fennici 16: 115-122
Haskin, H. H. (1954). Age determination in molluscs. Trans. N. Y. Acad. Sci. (Ser. 11) 16: 300-304
Hickman, R. W. (1979). Allometry and growth of the green- lipped mussel Perna canaliculus in New Zealand. Mar. Biol. 51: 311-327
Hines, A. H. (1979). Effects of a thermal discharge on repro- ductive cycles in Mytilus edulis and Mytilus californianus (Mollusca, Bivalvia) Fish. Bull. U.S. 77: 498-503
Innes, D. J . , Haley, L. E. (1977). Genetic aspects of larval growth under reduced salinity in Mytilus edulis Biol. Bull. mar. biol. Lab., Woods Hole 153: 312-321
Jones, D. S., Thompson, I . , Ambrose, W. (1978). Age and growth rate determinations for the Atlantic surf clam Spi- sula solidissima (Bivalvia: Mactracea), based on internal growth lines in shell cross-sections. Mar. Biol. 47: 63-70
Lowe, D. M,, Moore, M. N. , Bayne, B. L. (1980). Aspects of gametogenesis in the marine mussel Mytilus edulis. J. mar. biol. Ass. U.K., in press
Lutz, R. A. (1976). Annual growth patterns in the inner shell layer of Mytilus edulis L. J. mar biol. Ass. U.K. 56: 723-731
Lutz, R. A. (ed.) (1980). Mussel culture and harvest: a North American perspective, Elsevier, Amsterdam
Lutz, R. A., Castagna, M. (1980). Age composition and growth rate of a mussel (Guekensia dernissa) population in a Virginia salt marsh. J. Mollusc. Stud. 46: 106-115.
Mason, J. (1976). Cultivation. In: Bayne, B. L. (ed.) Marine mussels. Cambridge University Press, Cambridge, pp. 385-410
Milkman, R., Koehn, R. K. (1977). Temporal variation in the relationship between size, numbers and an allele-fre- quency in a population of Mytilus edulis Evolution 31: 103-115
Newell, R. C. (1979). Biology of intertidal animals, Marine Ecological Surveys, Faversham
Ricker, W. E. (1975). Computation and interpretation of biolo-
gical statistics of fish populations. Bull. Fish. Res. Bd Can. 191: 1-382
Sastry, A. N. (1968). Relationships among food, temperature and gonad development of the bay scallop, Acquipecten irradians Lamarck. Physiol. 2001. 41: 44-53
Sastry, A. N. (1970). Environmental regulation of 00cyte growth in the bay scallop Acquipecten irradians Lamarck. Experientia 26: 1371-1372
Savage, R. E. (1956). The great spatfall of mussels (Mytilus edulis L.) in the river Conway estuary in spring 1940. Fishery Invest., Lond. (Ser. 11) XX (7): 1-22
Seed. R. (1973). Absolute and allometric growth in the mussel Mytilus edulis L. (Mollusca Bivalvia). Proc. Malac. Soc. Lond. 40: 343-357
Seed, R. (1976). Ecology. In: Bayne, B. L. (ed.) Marine mus- sels. Cambridge University Press, Cambridge, pp. 13-65
Silliman, R. P. (1968). Comparison between Gompertz and von Bertalanffy curves for expressing growth in weight of fishes. J. Fish. Res Bd Can. 26: 161-165
Sokal, R. R., Rolf, F. J. (1969). Biometry, Freeman, San Fran- cisco
Thelsen, B. T. (1968). Growth and mortality of culture mussels in the Danish Wadden Sea. Medd Danm. Fisk.- og Havun- ders. 6: 47-78
Theisen, B. T. (1973). The growth of Mytilus edulis L. (Bival- via) from Dlsko and Thule district, Greenland. Ophelia 12: 59-77
Thompson, R. J . (1979). Fecundity and reproductive effort in the blue mussel (Mytilus edulis), the sea urchin (Strongy- locentrotus droebachiensis) and the snow crab (Chionoe- cetes opilio) from populations in Nova Scotia and New- foundland. J. Fish. Res. Bd Can. 36: 955-964
Ursin, E. (1963). On the incorporation of temperature in the von Bertalanffy growth equation. Medd. Danm. Fisk.- og. Havunders. 4: 1-16
Wallace. J. C. (1980). Growth rates of different populations of the edible mussel Mytilus edulis in north Norway. Aqua- culture 19: 303-311
Warren. C. E., David, G. E. (1967). Laboratory studies on the feeding, bioenergetics and growth of fish. In: Gerking, S. D. (ed.) The biological basis of freshwater fish produc- tion. Blackwell, Oxford, pp. 175-214
Widdows, J., Fieth, P,, Worrall, C. M. (1979). Relationships between seston, available food and feeding activity in the common mussel Mytilus edulis. Mar Biol. 50: 195-207
Winberg, G. G. (1960). Rate of metabolism and food require- ments of fishes. Fish. Res. Bd Can. Transl. Ser. 194: 1-253
Winsor, C. P. (1932). The Gompertz curve as a growth curve. Proc. natn. Acad. Sci. USA 18: 1-7
This paper was presented by Dr. B. L. Bayne; it was accepted for printing on September 3, 1980


![Classes of Ordinary Differential Equations Obtained for ... · distribution [19], bivariate Gompertz [20], Gompertz-power . Abstract — In this paper, the differential calculus was](https://img.pdfslide.us/doc/110x75/5c0865ae09d3f23a458c07be/classes-of-ordinary-differential-equations-obtained-for-distribution-19.jpg)


![[Bertalanffy Ludwig Von] Teoría General de Los Si(BookZZ.org)](https://img.pdfslide.us/doc/110x75/563db95f550346aa9a9cb2ec/bertalanffy-ludwig-von-teoria-general-de-los-sibookzzorg.jpg)


![[Ludwig Von Bertalanffy] Modern Theories of Develo(Bookos.org)](https://img.pdfslide.us/doc/110x75/5461958eb1af9f86228b4a1b/ludwig-von-bertalanffy-modern-theories-of-develobookosorg.jpg)