Embed Size (px)
Citation preview
*I gill -iL iUft P
b.
M Instrument Landing SystemL Mathematical Modeling Study
for Orlando International AirportRunway 35L Localizer, Orlando,Fla., Final Airside Docking Plan
< (Scheme IliA)
James D. RamboneJohn E. Walls
December 1988
DOT/FAA/CT-TN89/4
This document is available to the U.S. publicthrough the National Technical InformationService, Springfield, Virginia 22161. (76 DTIC
y -... :'!', E 1 9 8
UDepalment of TnsportationE
Technical CenterAtdantf City Intwna nal Alrport. N.J. 06405
,",, *

NOTICE
This document is disseminated under the sponsorshiDof the U.S. Department of Transportation in the interest ofinformation exchange. The United States Governmentassumes no liability for the contents or use thereof.
The United States Government does not endorseproducts or manufacturers. Trade or manufacturers'names appear herein solely because they are consideredessential to the objective of this report.
Technical Report Documentation Page
1. Report No. 2. Government Accessen No. 3. Recipient's Coeleg No.
11oT/FA/CT-TN89/44. Tol ond Sub0tole S. Repor Oe0o
INSTRUMENT LANDING SYSTEM MATHEMATICAL MODELING December 1988STUDY FOR ORLANDO INTERNATIONAL AIRPORT 6. Peufe-,mng Organi.aton Code
RUNWAY 35L LOCALIZER, ORLANDO, FLA., ACD-330FINAL AIRSIDE DOCKING PLAN (SCHEME IliA) $. P,-rmng Ognzaon Rpot o.7. Areteio )
James D. Rambone and John E. Walls DOT/FAA/CT-TN89/49. Peforming Orgen i zetien Name and Address 10. Work Unit No. (TRAIS)
Federal Aviation AdministrationTechnical Center 11. Contract o, Grant No.
Atlantic City International Airport, NJ 08405 T0605A13. Type of Report and Pe,,od Co'ered
12. Sponsoring Agency Memo end AddressU. S. Department of Transportation Technical NoteFederal Aviation Administration October 1988Maintenance and Development Service 1'. Sp.o,,nn Agoncy CodeWashington,
DC 20590
15. Sueplementary Notes
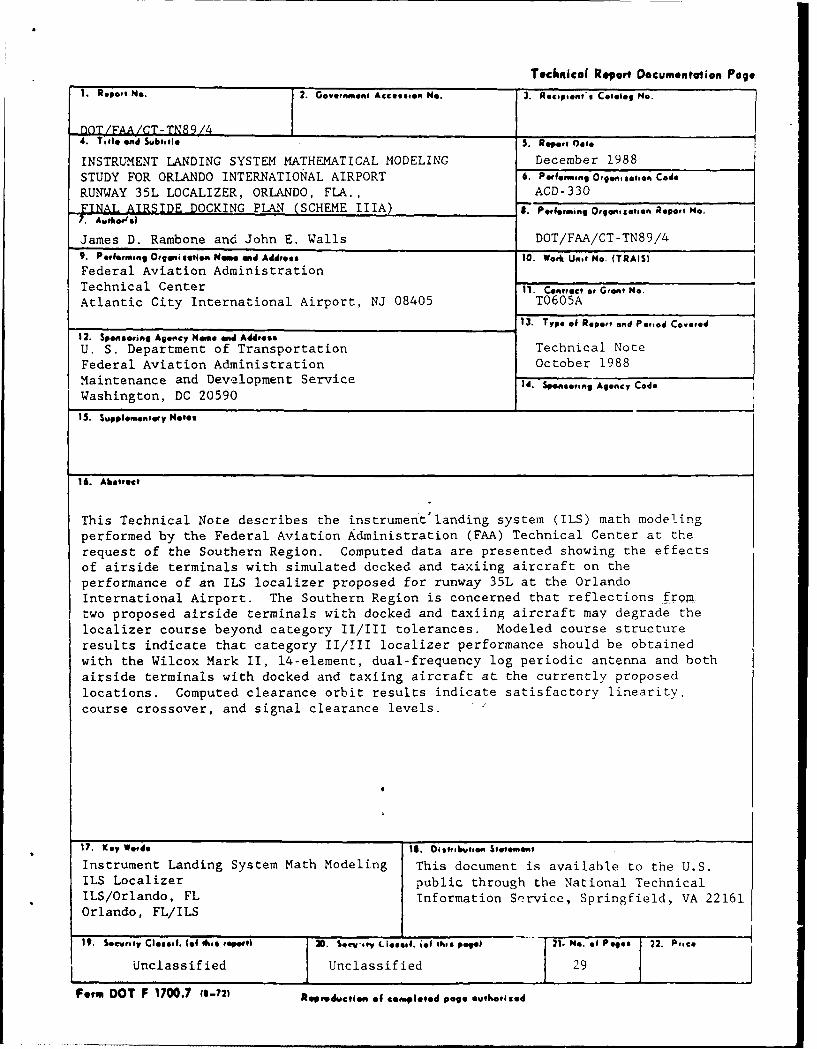
16. Abetrect
This Technical Note describes the instrument'landing system (ILS) math modelingperformed by the Federal Aviation Administration (FAA) Technical Center at therequest of the Southern Region. Computed data are presented showing the effectsof airside terminals with simulated docked and taxiing aircraft on theperformance of an ILS localizer proposed for runway 35L at the OrlandoInternational Airport. The Southern Region is concerned that reflections fromtwo proposed airside terminals with docked and taxiing aircraft may degrade thelocalizer course beyond category II/III tolerances. Modeled course structureresults indicate that category II/II localizer performance should be obtainedwith the Wilcox Mark II, 14-element, dual-frequency log periodic antenna and bothairside terminals with docked and taxiing aircraft at the currently proposedlocations. Computed clearance orbit results indicate satisfactory linearity,course crossover, and signal clearance levels.
17. Key We,ds 1S. Distributn Statement
Instrument Landing System Math Modeling This document is available to the U.S.ILS Localizer public through the National TechnicalILS/Orlando, FL Information Service, Springfield, VA 22161Orlando, FL/ILS
19. Socufty CloseJ. (of Ohio toessel 2 Sorety L.iestif. tfis poe 21. Ne. of Poses 22. Price
Unclassified Unclassified 29
Form DOT F 1700.7 (8-72) Repr.duction .f completed pog. o ,etrised
TABLE OF CONTENTS
Page
EXECUTIVE SUMMARY vii
INTRODUCTION 1
Purpose 1
Background 1
DISCUSSION i
ILS Math Models I
ILS Modeling Performed 2
Data Presentation 2
Data Analysis 10
CONCLUSIONS 10
REFERENCES 23
NTIS GRA&I
DTIC TAB
Unannounced 0justificatlo
By
Distributto!I/AvallabilitY CodeS---- iA an d/ot
Dist special
iii
LIST OF ILLUSTRATIONS
Figure Page
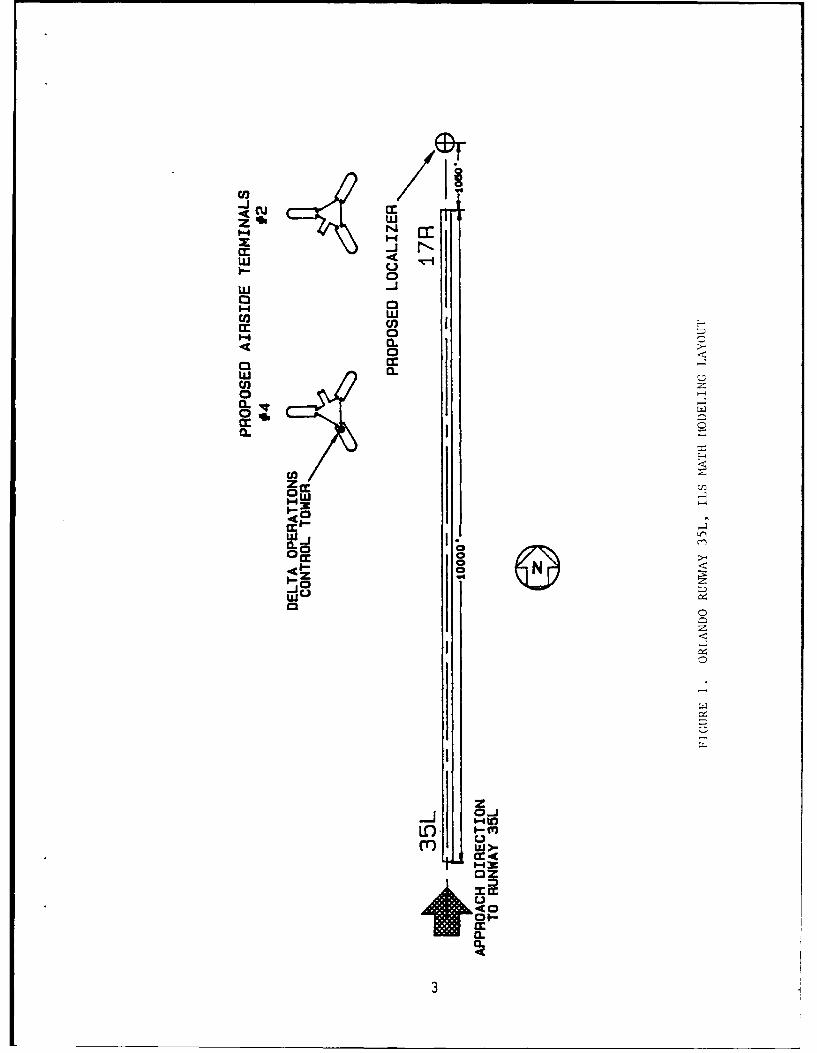
1 Orlando Runway 35L, ILS Math Modeling Layout 3
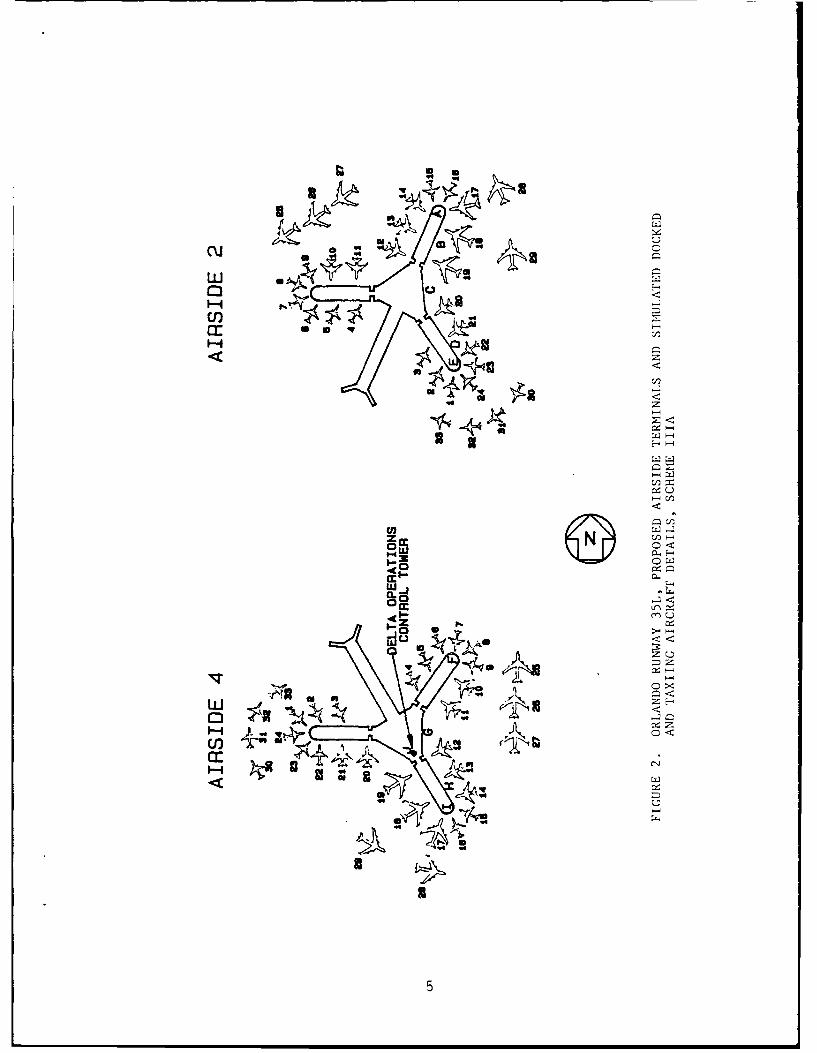
2 Orlando Runway 35L, Proposed Airside Terminals and Simulated 5
Docked and Taxiing Aircraft Details, Scheme liA
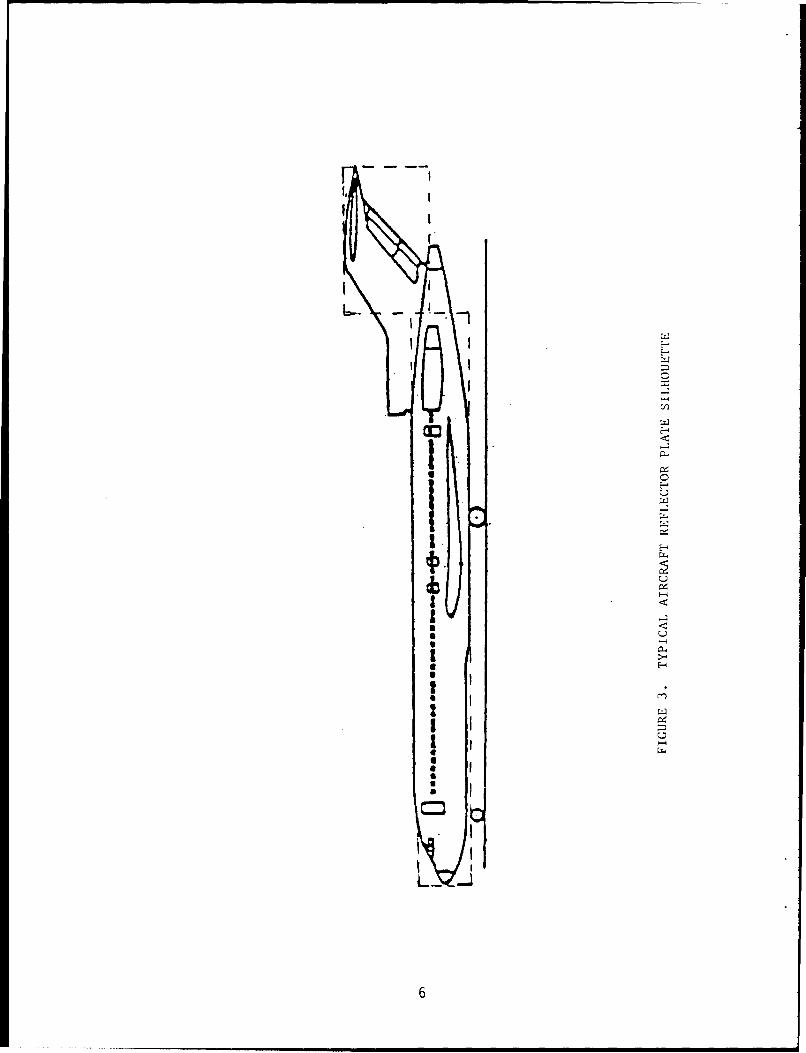
3 Typical Aircraft Reflector Plate Silhouette 6
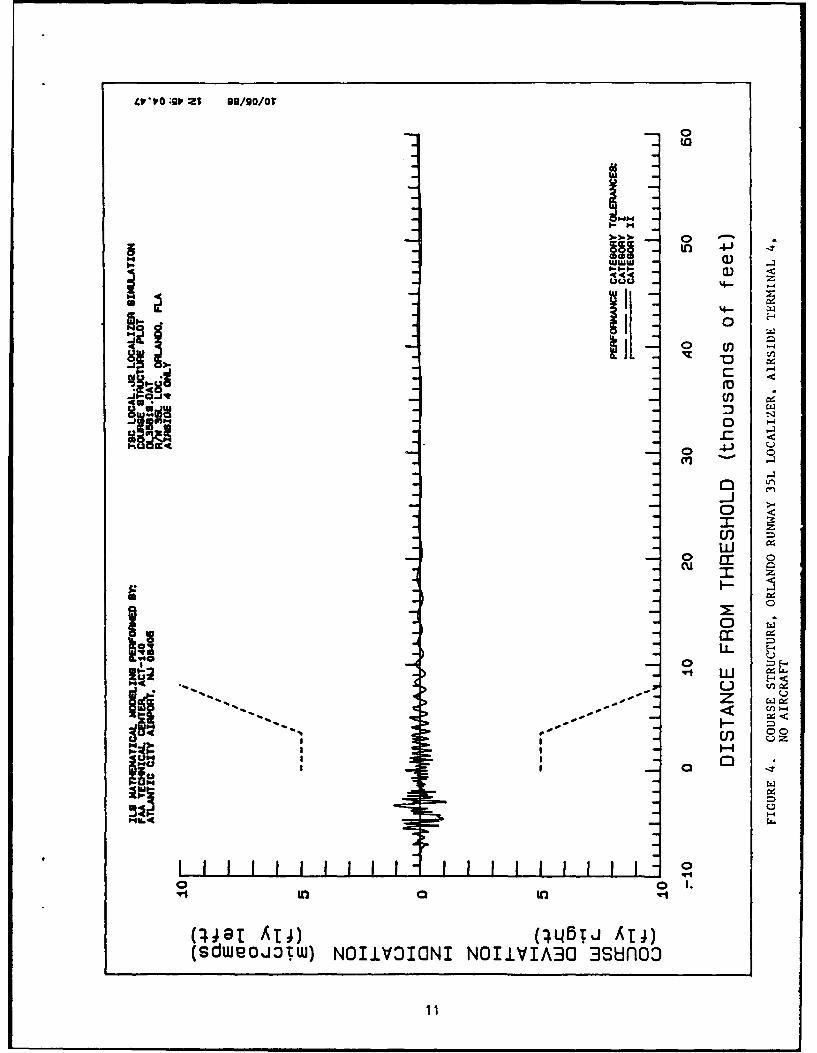
4 Course Structure, Orlando Runway 35L Localizer, Airside 11Terminal 4, No Aircraft
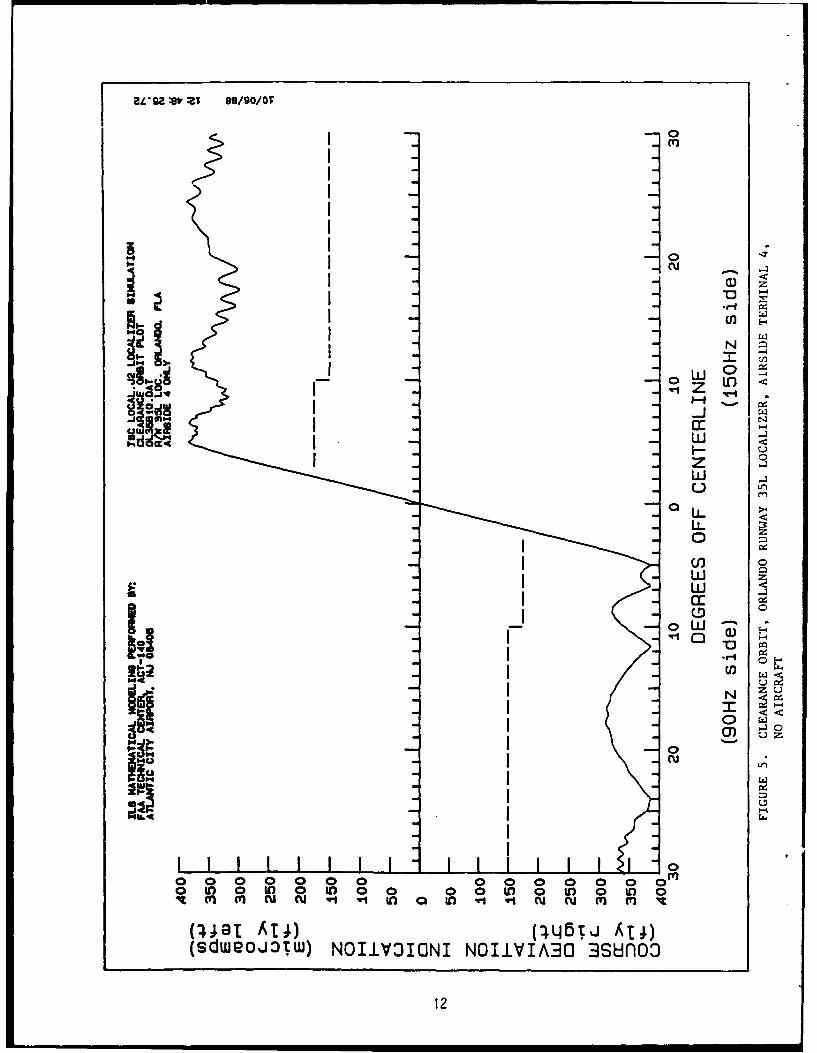
5 Clearance Orbit, Orlando Runway 35L Localizer, Airside 12Terminal 4, No Aircraft
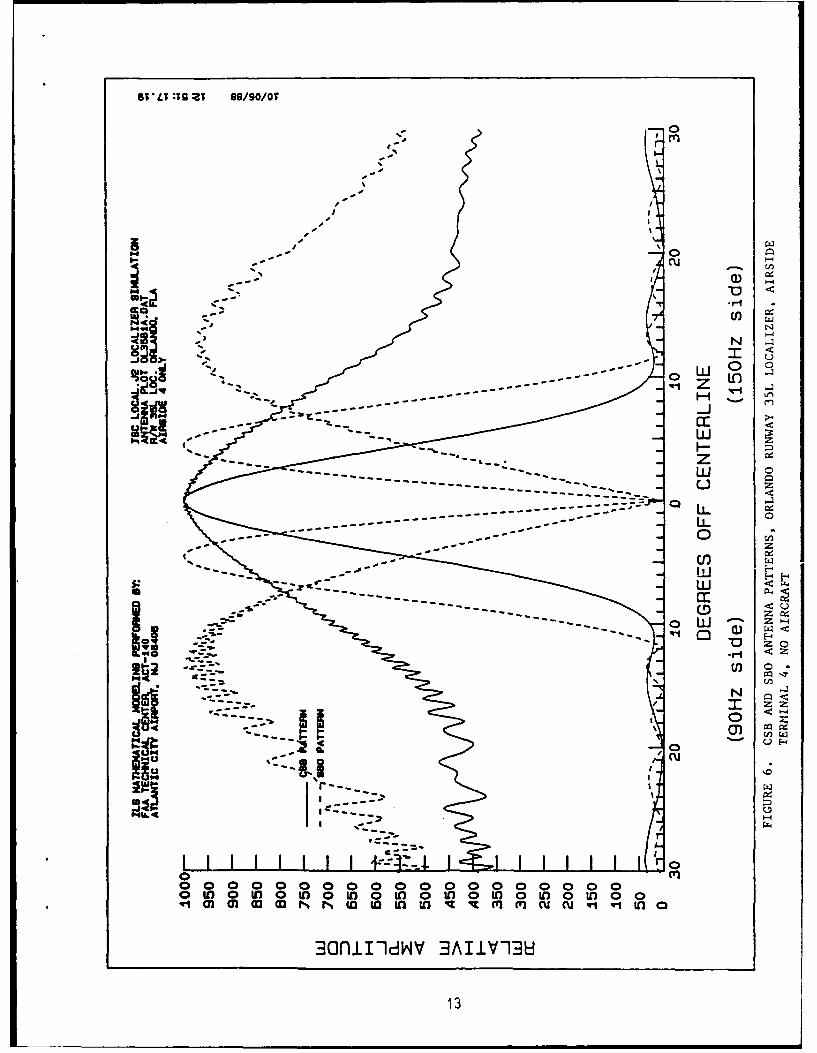
6 CSB and SBO Antenna Patterns, Orlando Runway 35L Localizer, 13Airside Terminal 4, No Aircraft
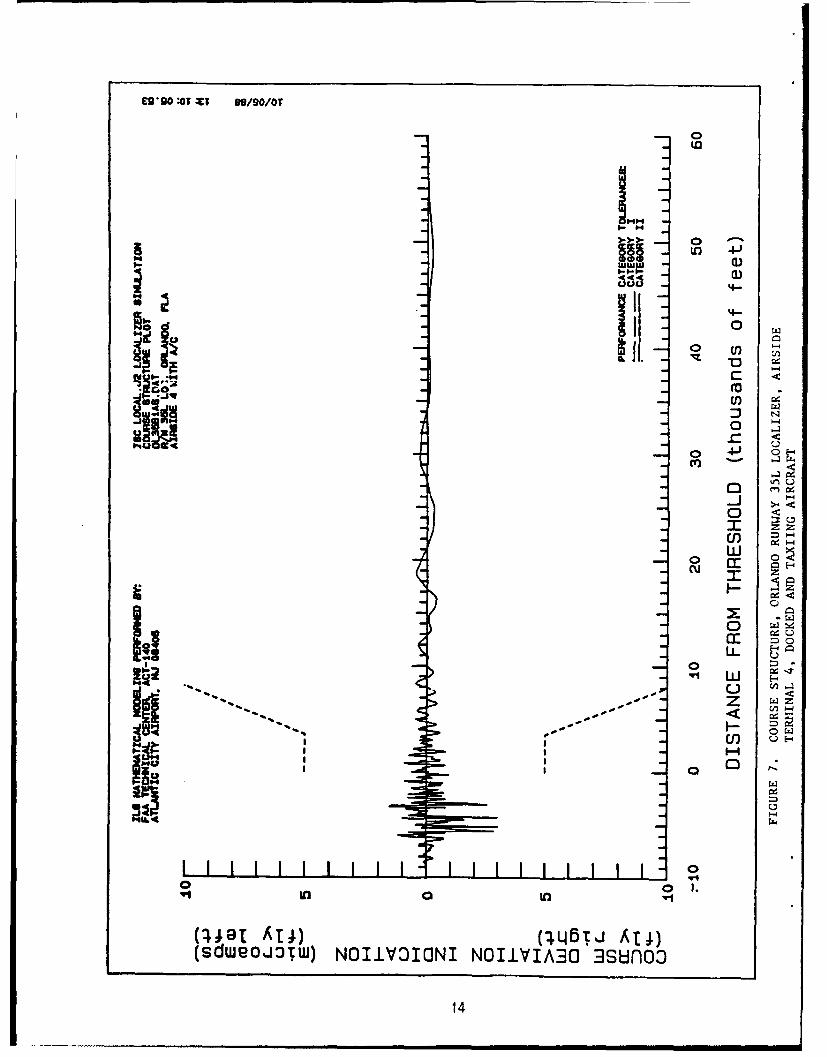
7 Course Structure, Orlando Runway 35L Localizer, Airside 14Terminal 4, Docked and Taxiing Aircraft
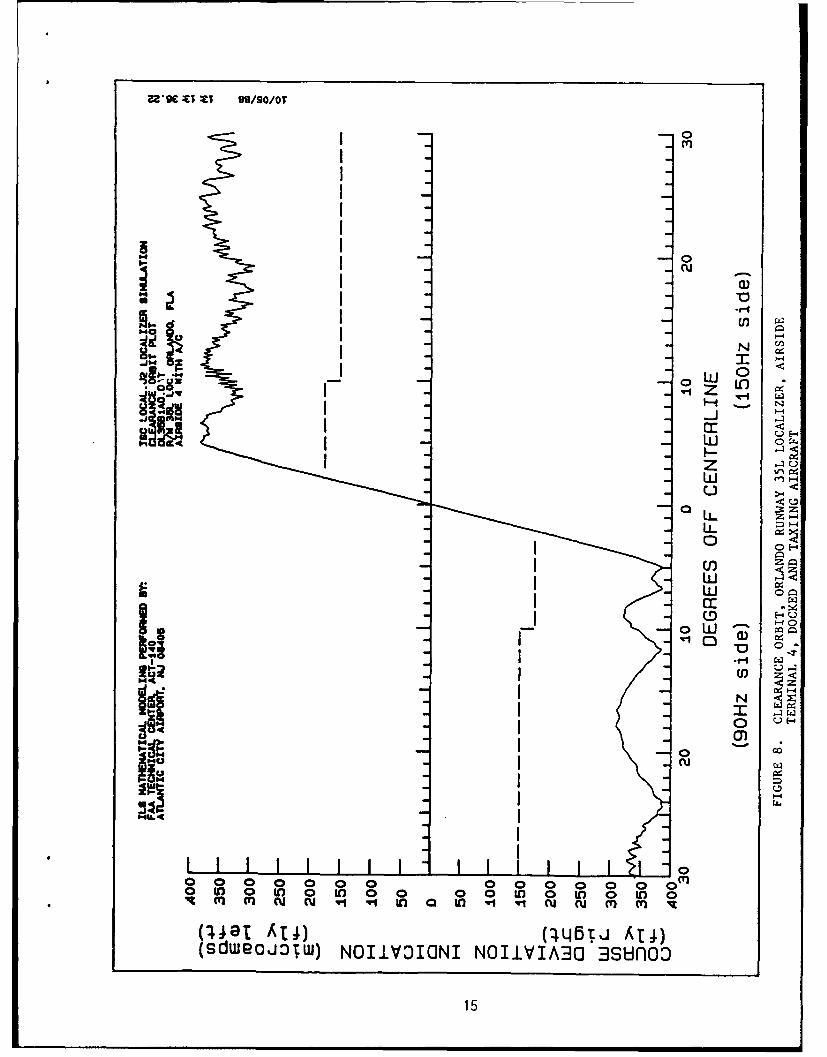
8 Clearance Orbit, Orlando Runway 35L Localizer, Airside 15
Terminal 4, Docked and Taxiing Aircraft
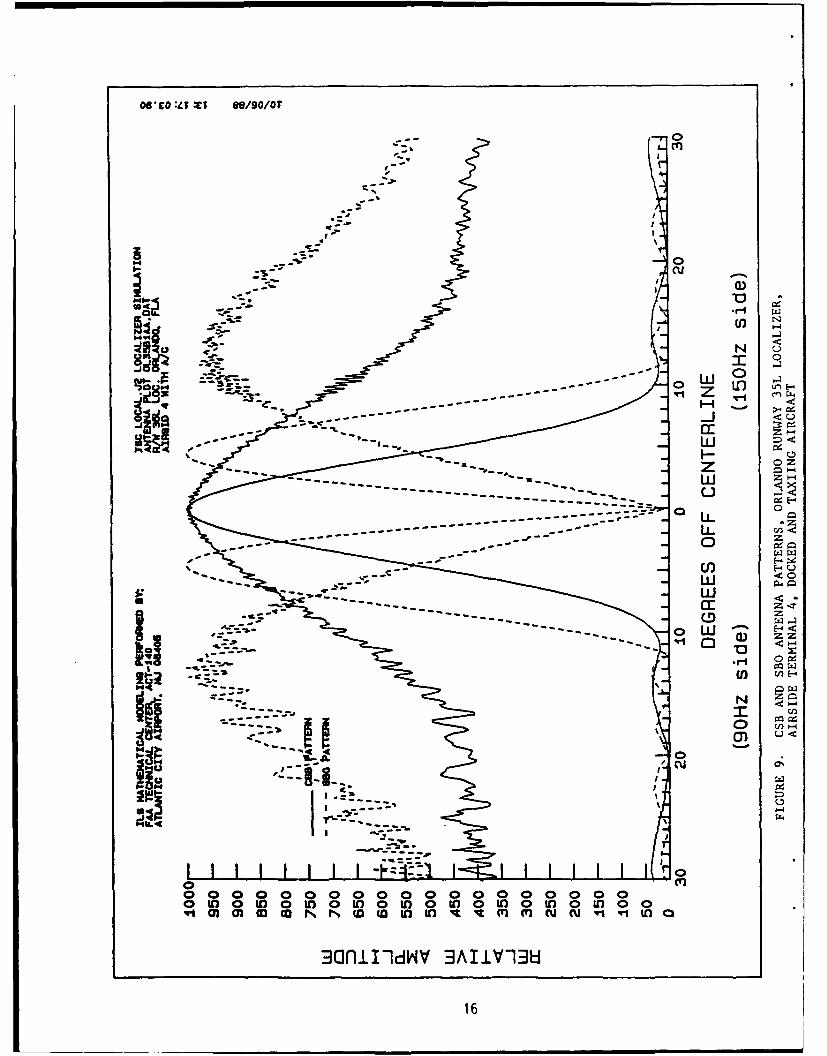
9 CSB and SBO Antenna Patterns, Orlando Runway 35L Localizer, 16Airside Terminal 4, Docked and Taxiing Aircraft
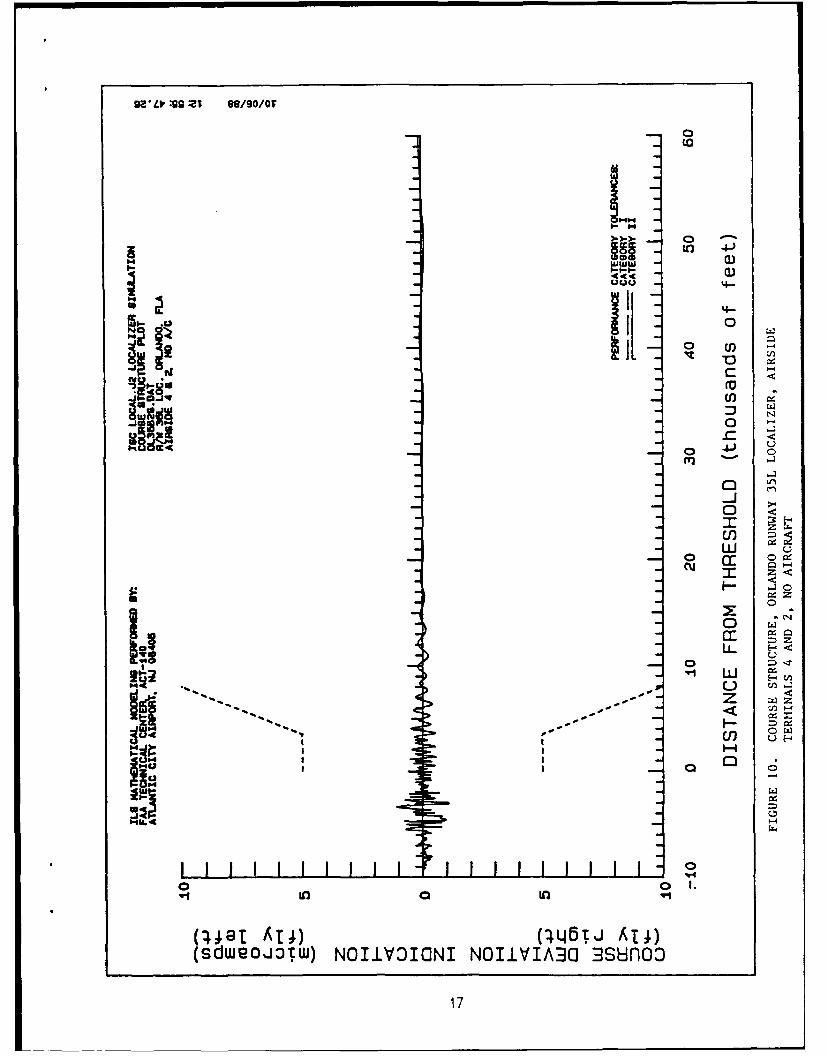
10 Course Structure, OrlandnRunway 35L Localizer, Airside 17Terminals 4 and 2, No Aircraft
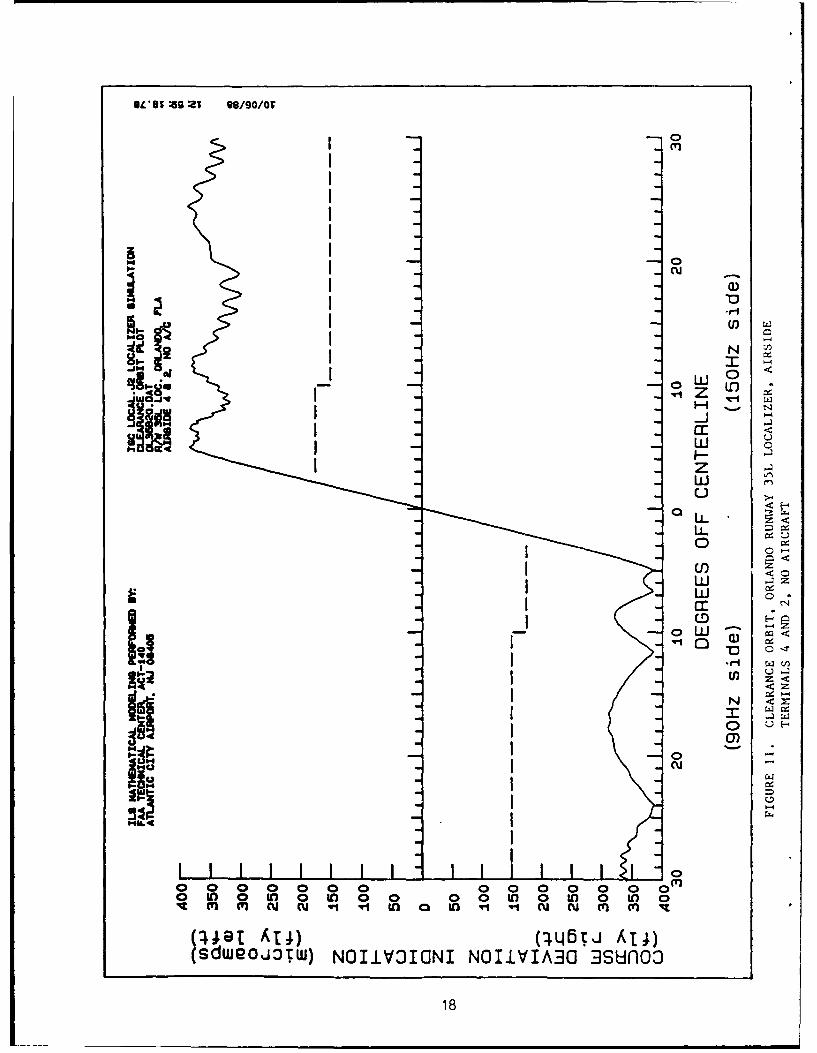
11 Clearance Orbit, Orlando Runway 35L Localizer, Airside 18
Terminals 4 and 2, No Aircraft
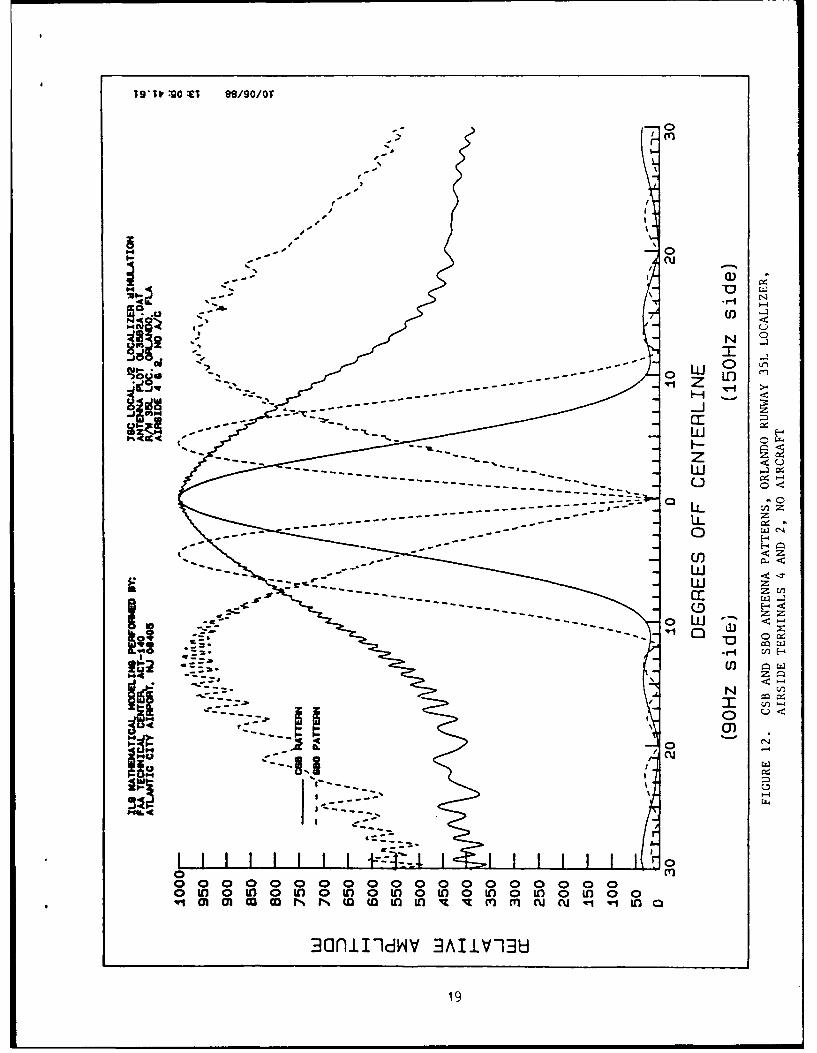
12 CSB and SBO Antenna Patterns, Orlando Runway 35L Localizer, 19Airside Terminals 4 and 2, No Aircraft
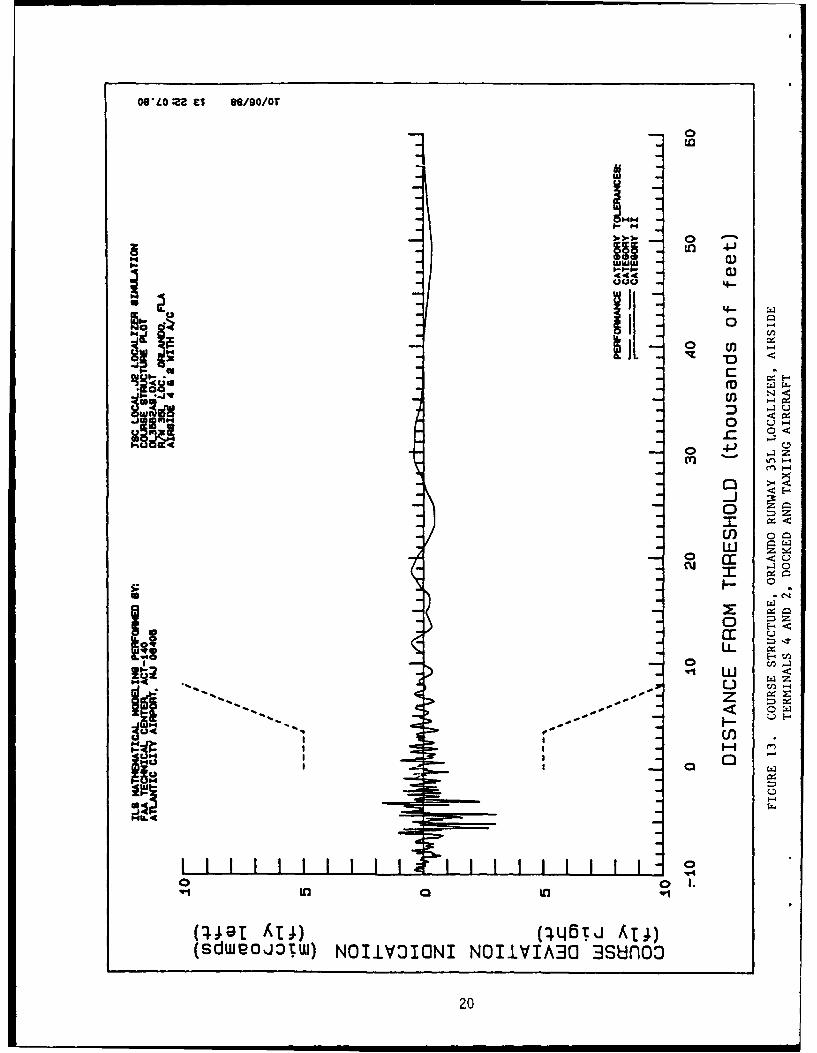
13 Course Structure, Orlando Runway 35L Localizer, Airside 20Terminals 4 and 2, Docked and Taxiing Aircraft
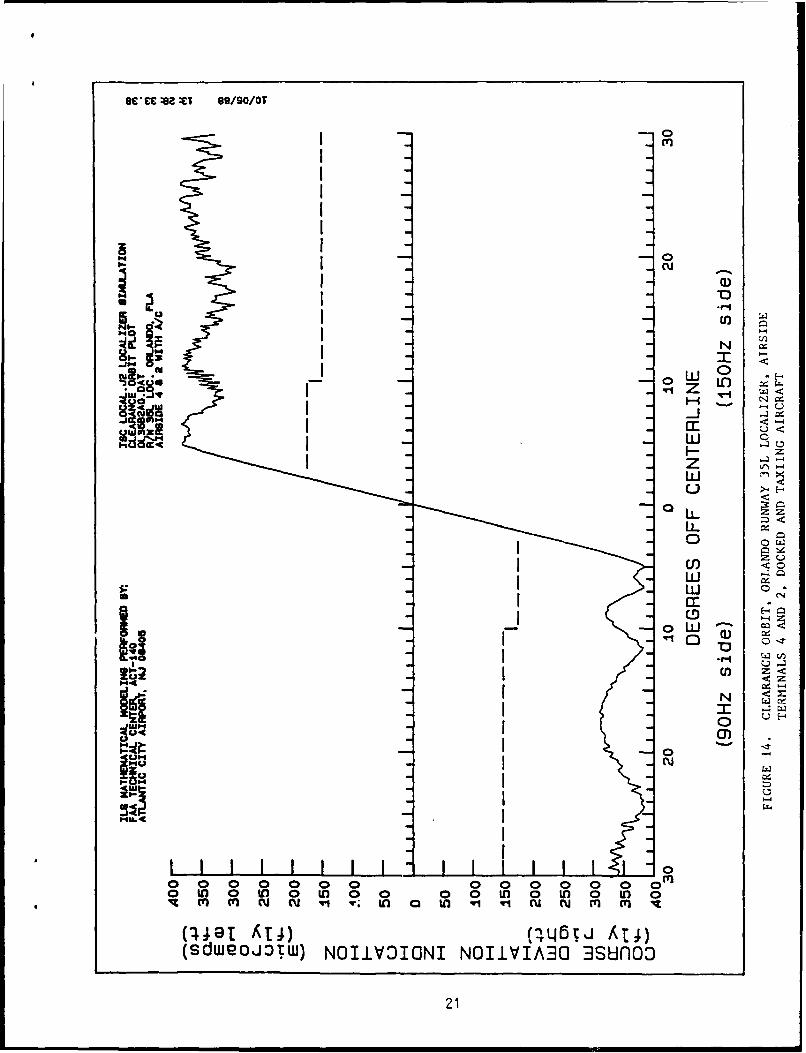
14 Clearance Orbit, Orlando Runway 35L Localizer, Airside 21Terminals 4 and 2, Docked and Taxiing Aircraft
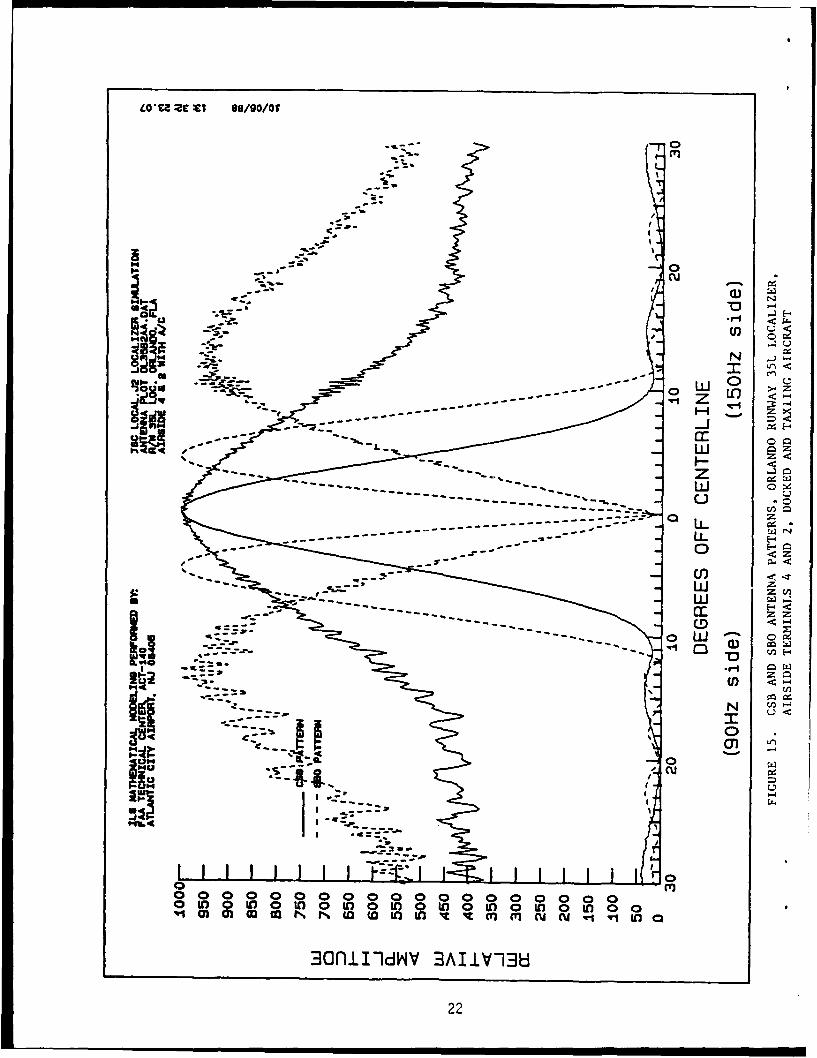
15 CSB and SBO Antenna Patterns, Orlando Runway 35L Localizer, 22Airside Terminals 4 and 2, Docked and Taxiing Aircraft
v

LIST OF TABLES
Table Page
1 Localizer Antenna Model Input Data Summary 4
2 Localizer Reflecting Surfaces Data Summary (3 sheets) 7
vi
EXECUTIVE SUMMARY
This instrument landing system (ILS) math modeling study was performed at therequest of the Southern Region to compute the effects of two airside terminalswith docked and taxiing aircraft on the performance of an ILS localizer proposedfor runway 35L which is under construction at the Orlando International Airport.Reflections from other structures on the airport are not considered in thismodeling study. The localizer was modeled using a physical optics mathematicalmodel developed by the Transportation Systems Center. As requested by ASO-433, aWilcox Mark II, 14-element, dual frequency log periodic antenna array wasmodeled. Derogative effects from the two airside terminals and simulated dockedand taxiing aircraft in several reflecting source configurations were considered.Modeled course structure results indicate that category II/III localizerperformance should be obtained for runway 35L with both airside terminals anddocked and taxiing aircraft at the currently proposed locations. Computedclearance orbit results indicate satisfactory linearity, course crc.'sover, andsignal clearance levels.
vii
INTRODUCTION
PURPOSE.
The purpose of this math modeling study was to provide computer modeled
performance data for an instrument landing system (ILS) localizer proposed forrunway 35L at the Orlando International Airport.
BACKGROUND.
The Southern Region will be installing an ILS localizer to serve runway 35L whichis under construction at the Orlando International Airport. In support of this
project, ASO-433 has requested a math modeling study through the Navigation and
Landing Division, APS-400, which, in turn, was forwarded to the Federal AviationAdministration (FAA) Technical Center for accomplishment. Localizer mathmodeling was requested for a Wilcox Mark II, 14-element, dual frequency logperiodic dipole (LPD) antenna array to provide category II/III performance.
ASO-433 requested modeling of several terminal airside configurations: airsideterminal 4 only, with and without docked and taxiing aircraft; and airsideterminals 4 and 2, with and without docked and taxiing aircraft. This modelingeffort was performed under project T0605A. The Program Manager is Mr. Edmund A.
Zyzys. Additional information regarding this study may be obtained by contactingMessrs. James D. Rambone or John E. Walls at FTS 482-4572 or (609) 484-4572.
DISCUSSION
ILS MATH MODELS.
The FAA Technical Center conducts ILS mathematical computer model studies throughapplication of physical optics or geometric theory of diffraction techniques tocompute anticipated ILS performance. The modeling for runway 35L localizer was
performed using the physical optics localizer model developed by the
Transportation Systems Center (TSC) and converted to the Technical Center'smainframe computer. References i through 3 describe the modeling technique andimplementation. Reference 4 provides validation data for the localizer model.
The coordinate system used in this computer model is a right-handed system withthe origin located at the threshold of the runway. The positive x-axis isdirected out from the threshold along runway centerline exterded, the positivey-axis is directed to the left, the positive z-axis is directed up. Alpha, theangle between the base of a reflector and the x-axis, is measured in the
counterclockwise direction. A reflector facing in the negative y-direction hasan alpha of 00. Delta is the angle between the surface of the reflector and thevertical direction. A reflector with a delta of 00 is perpendicular to the
ground. Delta is equal to -900 for a horizontal reflector facing down. Asurface illuminated by radio frequency (RF) energy from the antenna iF modeled bya rectangular flat or cylindrical surface. The surface is considered to be of
infinite conductivity over the total surface and to have zero thickness. Thisassumption will result in a worst-case performance prediction. The model doesnot compute multiple reflections or diffractions. Course deviation indicator(CDI) deflections are computed as follows. First, the magnitude and phase ofthe RF signals arriving at the aircraft location are determined for each surface
independently. Next, a resultant RF signal is computed by vectorially combining
the independent signals. CDI deflection is then computed from the resultant RFsignal.
ILS MODELING PERFORMED.
Figure 1 shows the general orientation of the runway. The TSC localizer modelwas used to model the effects of the airside terminals and simulated docked andtaxiing aircraft. As requested, the Wilcox Mark II, 14-element, dual frequencyLPD antenna was modeled at the proposed ILS localizer site. Localizer coursestructure and clearance orbit computer runs were made for each of the reflectivesource configurations. Table I summarizes the localizer model input data.Antenna currents and phases used for the antenna array are also given in table 1.
The following criteria was used in selecting the surfaces for input to the model:(I) use all surfaces potentially illuminated by direct RF energy from thelocalizer antenna; (2) the airside terminals can shadow aircraft and each other;(3) aircraft cannot shadow terminals or other aircraft; (4) reflected RF energyis not shadowed; and (5) the effects from other structures on the airport are notconsidered.
The reflecting surfaces modeled are identified in figure 2. The aircraft(Boeing-747's, Boeing-757's, and Lockheed-1011's) were simulated at specificlocations on the airport ramp areas, as given on an airside terminal layoutchart, Schcme IIIA, provided by ASO-433. The simulated B-747 aircraft arenumbered 17, 18, 19, 25, 26, 27, 28, and 29. The aircraft numbered 10, 11, 12,13, 14, 20, and 21 are simulated L-10ll's. The remaining aircraft were simulatedas B-757's. Rectangular plates were used to simulate the aircraft fuselage andtail (figure 3). The taxiing aircraft are modeled as parked in the locationsshown. The location and dimensions of all reflecting surfaces are detailed intable 2. Cylinderq were used to simulate two corners of the airsides (A and F infigure 2). A cylinder was also used to simulate the Delta ramp operationscontrol tower (surface J in figure 2). Rectangular plates were used to simulatethe other reflecting surfaces.
The reflecting source configurations modeled, per ASO-433 request, are asfollows:
1. Airside 4 only (surfaces F through J).
2. Airside 4 with aircraft (airside 4 plus aircraft I through 16, 24 through27, and 30 through 33).
3. Airside 4 and 2 with no aircraft (surfaces A through J).
4. Airside 4 and 2 with aircraft (configuration 2 plus airside 2 surfaces Athrough E, and airside 2 aircraft 1, and 14 through 33).
DATA PRESENTATION.
Modeled output results for the localizer are provided on three types of plots:(1) course structure plots, (2) clearance orbit plots, and (3) carrier plussideband (CSB) and sideband only (SBO) antenna pattern plots. The simulatedflightpaths for the course structure runs are centerline approaches starting60,000 feet from runway threshold. The aircraft crosses the runway threshold at
2
<u
00w)
0CJ2 L
0
0
0~
00
00
zJ-JOJ
I.4)
0
zz
0-i
W-
Lf)U"
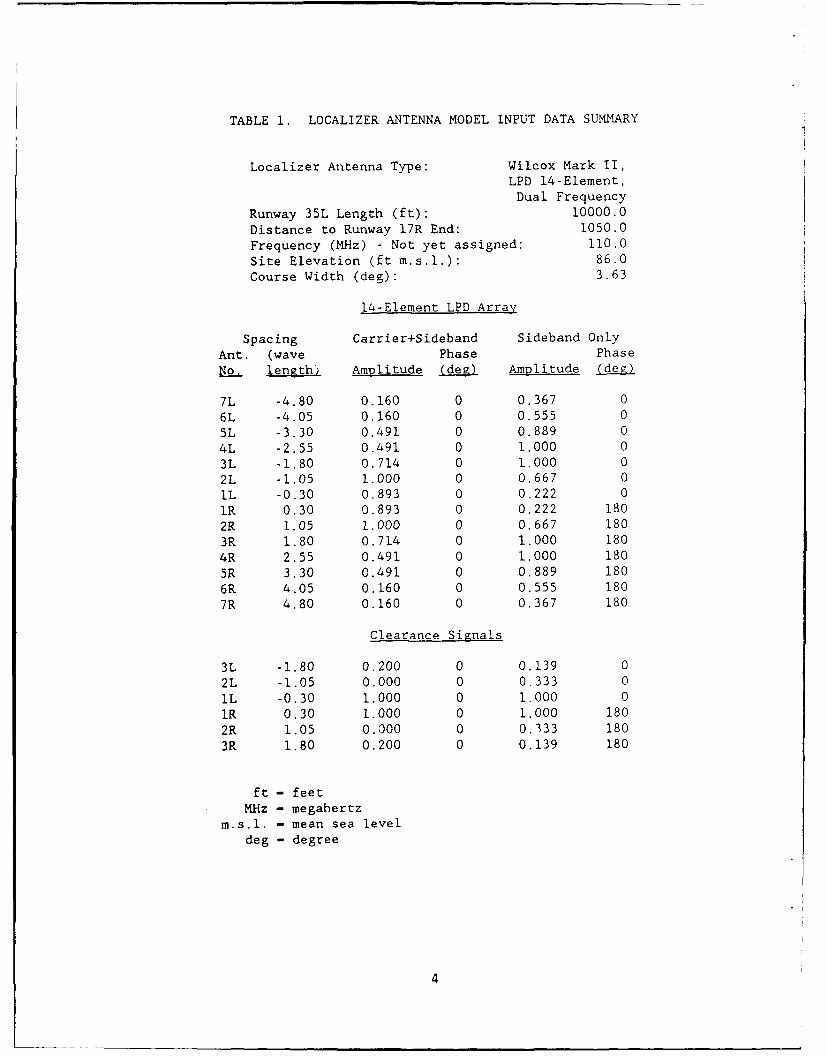
TABLE 1. LOCALIZER ANTENNA MODEL INPUT DATA SUMMARY
Localizer Antenna Type: Wilcox Mark II,
LPD 14-Element,
Dual Frequency
Runway 35L Length (ft): 10000.0
Distance to Runway 17R End: 1050.0
Frequency (MHz) - Not yet assigned: 110.0
Site Elevation (ft m.s.l.): 86.0
Course Width (deg): 3.63
14-Element LPD Array
Spacing Carrier+Sideband Sideband Only
Ant. (wave Phase Phase
No. length) Amplitude (dez) Amplitude (deg)
7L -4.80 0.160 0 0.367 0
6L -4.05 0.160 0 0.555 0
5L -3.30 0.491 0 0.889 0
4L -2.55 0.491 0 1.000 0
3L -1.80 0.714 0 1.000 0
2L -1.05 1.000 0 0,667 0
IL -0.30 0.893 0 0.222 0
IR 0.30 0.893 0 0.222 180
2R 1.05 1.000 0 0.667 180
3R 1.80 0.714 0 1.000 180
4R 2.55 0.491 0 1.000 180
5R 3.30 0.491 0 0.889 180
6R 4.05 0.160 0 0.555 180
7R 4.80 0.160 0 0.367 180
Clearance Signals
3L -1.80 0.200 0 0.139 0
2L -1.05 0.000 0 0.333 0
IL -0.30 1.000 0 1.000 0
IR 0.30 1.000 0 1.000 180
2R 1.05 0.000 0 0.333 180
3R 1.80 0.200 0 0.139 180
ft - feet
MHz - megahertzm.s.l. - mean sea level
deg - degree
U)U
<t
(1-3cr t'-4 AMIU
Mz
OCE
:)zIL
wUX
-ARC -
A- z -
a 3 aCLL~j : kmpill
oz
U) -)C
cc +-2
8 9+'12: li
<5
II
I_~1
H
~o*I
TI.I H
4,U
I 4:
Ba 4:UI
a H
* I
IiUI
I* IaU
L~1
6
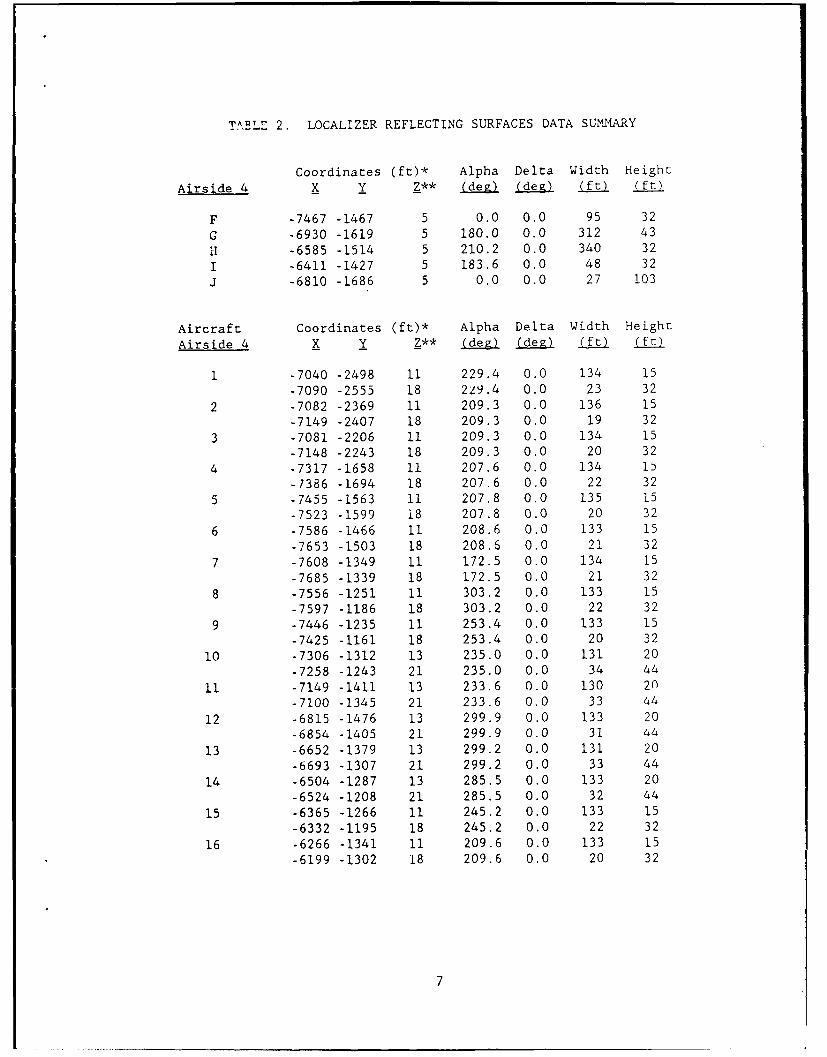
TABLZ 2. LOCALIZER REFLECTING SURFACES DATA SUMMARY
Coordinates (ft)* Alpha Delta Width Height
Airside 4 X Y Z** (dez) (deg) (ft) (ft)
F -7467 -1467 5 0.0 0.0 95 32
G -6930 -1619 5 180.0 0.0 312 43
I1 -6585 -1514 5 210.2 0.0 340 32
I -6411 -1427 5 183.6 0.0 48 32
J -6810 -1686 5 0.0 0.0 27 103
Aircraft Coordinates (ft)* Alpha Delta Width Height
Airside 4 X Y Z** (deg) (deg) (ft) (ft)
1 -7040 -2498 11 229.4 0.0 134 15
-7090 -2555 18 2z9.4 0.0 23 32
2 -7082 -2369 11 209.3 0.0 136 15
-7149 -2407 18 209.3 0.0 19 32
3 -7081 -2206 11 209.3 0.0 134 15
-7148 -2243 18 209.3 0.0 20 32
4 -7317 -1658 11 207.6 0.0 134 15
-7386 -1694 18 207.6 0.0 22 32
5 -7455 -1563 11 207.8 0.0 135 15
-7523 -1599 i8 207.8 0.0 20 32
6 -7586 -1466 11 208.6 0.0 133 15
-7653 -1503 18 208.6 0.0 21 32
7 -7608 -1349 11 172.5 0.0 134 15
-7685 -1339 18 172.5 0.0 21 32
8 -7556 -1251 11 303.2 0.0 133 15
-7597 -1186 18 303.2 0.0 22 32
9 -7446 -1235 11 253.4 0.0 133 15
-7425 -1161 18 253.4 0.0 20 32
10 -7306 -1312 13 235.0 0.0 131 20
-7258 -1243 21 235.0 0.0 34 44
11 -7149 -1411 13 233.6 0.0 130 20
-7100 -1345 21 233.6 0.0 33 44
12 -6815 -1476 13 299.9 0.0 133 20
-6854 -1405 21 299.9 0.0 31 44
13 -6652 -1379 13 299.2 0.0 131 20
-6693 -1307 21 299.2 0.0 33 44
14 -6504 -1287 13 285.5 0.0 133 20
-6524 -1208 21 285.5 0.0 32 44
15 -6365 -1266 11 245.2 0.0 133 15
-6332 -1195 18 245.2 0.0 22 32
16 -6266 -1341 11 209.6 0.0 133 15
-6199 -1302 18 209.6 0.0 20 32
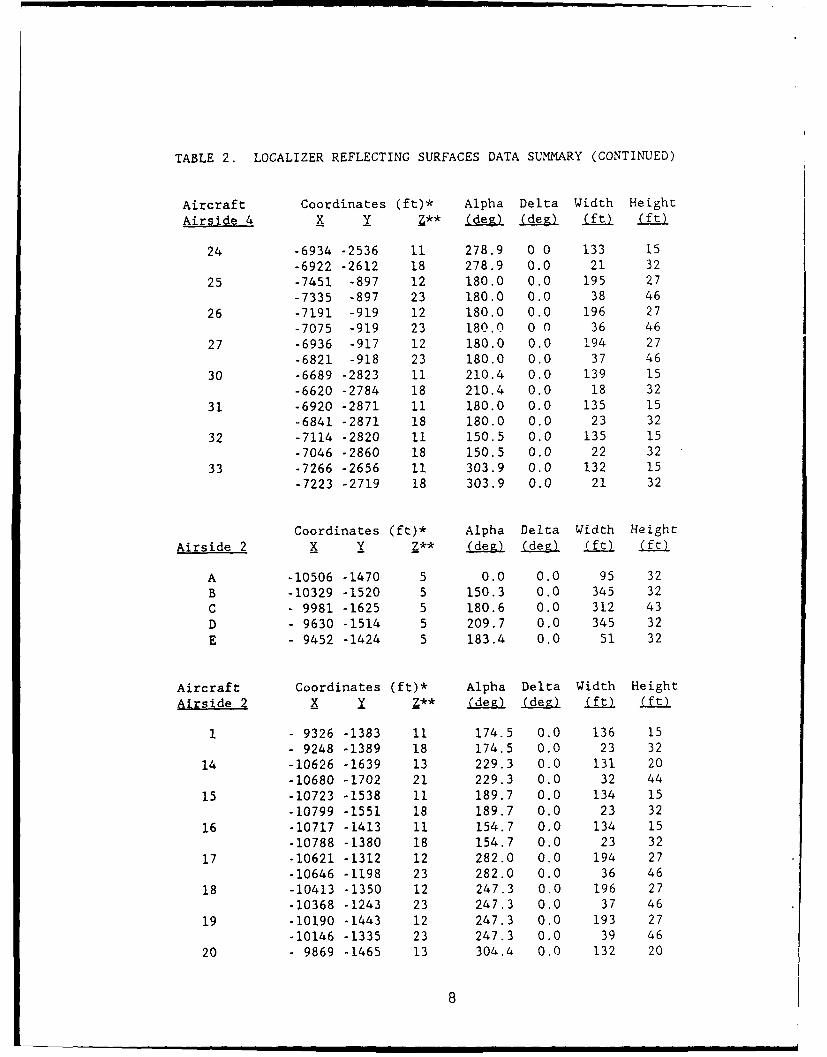
TABLE 2. LOCALIZER REFLECTING SURFACES DATA SUMMARY (CONTINUED)
Aircraft Coordinates (ft)* Alpha Delta Width Height
Airside 4 X Y Z** (deg) (deg) (ft) (ft)
24 -6934 -2536 11 278.9 0 0 133 15
-6922 -2612 18 278.9 0.0 21 32
25 -7451 -897 12 180.0 0.0 195 27
-7335 -897 23 180.0 0.0 38 46
26 -7191 -919 12 180.0 0.0 196 27
-7075 -919 23 180.0 0 0 36 46
27 -6936 -917 12 180.0 0.0 194 27
-6821 -918 23 180.0 0.0 37 46
30 -6689 -2823 11 210.4 0.0 139 15-6620 -2784 18 210.4 0.0 18 32
31 -6920 -2871 11 180.0 0.0 135 15
-6841 -2871 18 180.0 0.0 23 32
32 -7114 -2820 11 150.5 0.0 135 15
-7046 -2860 18 150.5 0.0 22 32
33 -7266 -2656 11 303.9 0.0 132 15
-7223 -2719 18 303.9 0.0 21 32
Coordinates (ft)* Alpha Delta Width Height
Airside 2 X Y Z** (dev-) (degl (ft) (ft)
A -10506 -1470 5 0.0 0.0 95 32
B -10329 -1520 5 150.3 0.0 345 32
C - 9981 -1625 5 180.6 0.0 312 43
D - 9630 -1514 5 209.7 0.0 345 32
E - 9452 -1424 5 183.4 0.0 51 32
Aircraft Coordinates (ft)* Alpha Delta Width Height
Airside 2 X Y Z** (deg) (deE) (ft) (ft)
1 - 9326 -1383 11 174.5 0.0 136 15- 9248 -1389 18 174.5 0.0 23 32
14 -10626 -1639 13 229.3 0.0 131 20-10680 -1702 21 229.3 0.0 32 44
15 -10723 -1538 11 189.7 0.0 134 15-10799 -1551 18 189.7 0.0 23 32
16 -10717 -1413 11 154.7 0.0 134 15
-10788 -1380 18 154.7 0.0 23 32
17 -10621 -1312 12 282.0 0.0 194 27
-10646 -1198 23 282.0 0.0 36 46
18 -10413 -1350 12 247.3 0.0 196 27
-10368 -1243 23 247.3 0.0 37 46
19 -10190 -1443 12 247.3 0.0 193 27
-10146 -1335 23 247.3 0.0 39 46
20 - 9869 -1465 13 304.4 0.0 132 20
8
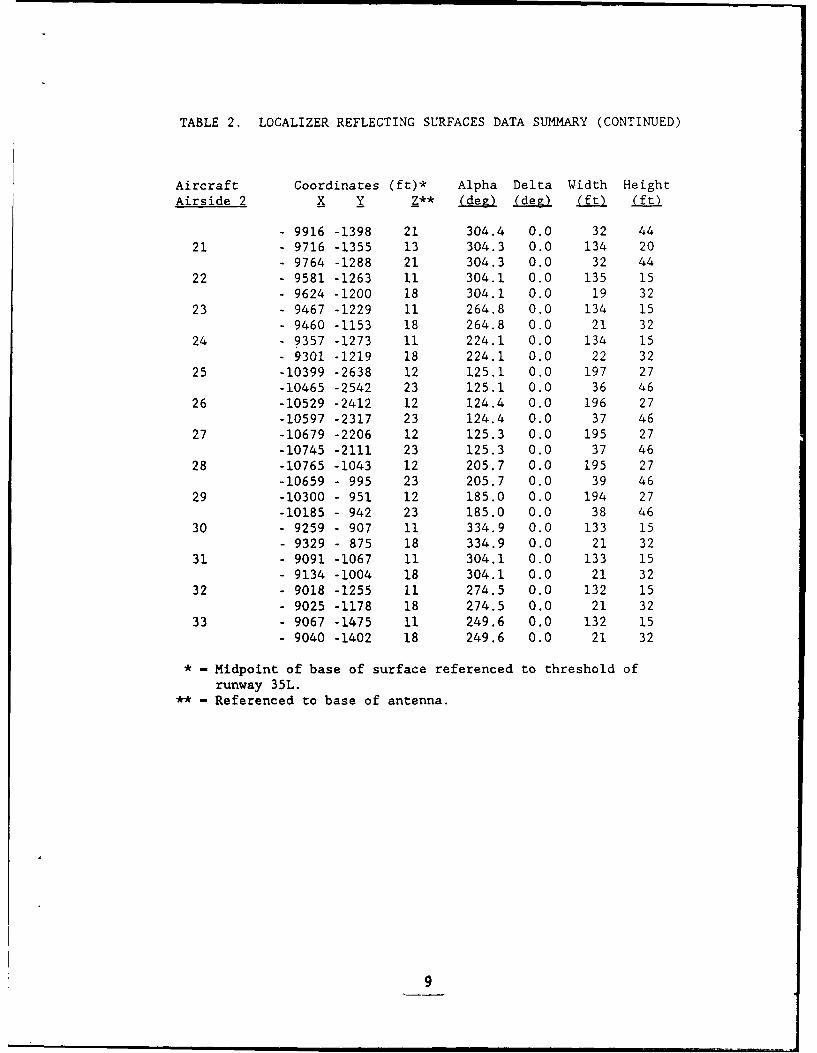
TABLE 2. LOCALIZER REFLECTING SURFACES DATA SUMMARY (CONTINUED)
Aircraft Coordinates (ft)* Alpha Delta Width Height
Airside 2 X Y Z** (dez) (dev) (ft) (ft)
- 9916 -1398 21 304.4 0.0 32 44
21 - 9716 -1355 13 304.3 0.0 134 20
- 9764 -1288 21 304.3 0.0 32 44
22 - 9581 -1263 11 304.1 0.0 135 15
- 9624 -1200 18 304.1 0.0 19 32
23 - 9467 -1229 11 264.8 0.0 134 15- 9460 -1153 18 264.8 0.0 21 32
24 - 9357 -1273 11 224.1 0.0 134 15- 9301 -1219 18 224.1 0.0 22 32
25 -10399 -2638 12 125.1 0.0 197 27-10465 -2542 23 125.1 0.0 36 46
26 -10529 -2412 12 124.4 0.0 196 27-10597 -2317 23 124.4 0.0 37 46
27 -10679 -2206 12 125.3 0.0 195 27
-10745 -2111 23 125.3 0.0 37 46
28 -10765 -1043 12 205.7 0.0 195 27
-10659 - 995 23 205.7 0.0 39 46
29 -10300 - 951 12 185.0 0.0 194 27-10185 - 942 23 185.0 0.0 38 46
30 - 9259 - 907 11 334.9 0.0 133 15
- 9329 - 875 18 334.9 0.0 21 3231 - 9091 -1067 11 304.1 0.0 133 15
- 9134 -1004 18 304.1 0.0 21 3232 - 9018 -1255 11 274.5 0.0 132 15
- 9025 -1178 18 274.5 0.0 21 3233 - 9067 -1475 11 249.6 0.0 132 15
- 9040 -1402 18 249.6 0.0 21 32
* - Midpoint of base of surface referenced to threshold of
runway 35L.** - Referenced to base of antenna.
the threshold crossing heitiL aILd coLiL .O aL this altitude to a point justshort of the stop end of the runway. Distances shown on the horizontal axis ofthe course structure plots are referenced to the approach threshold. Negativevalues are shown for distances between the threshold and the localizer.Positive values apply to distances on the approach path toward the outer marker.Angular values on the horizontal axes of the CSB and SBO antenna pattern plotsand on the clearance orbit plots were run with flight arcs of 35,000 feet ataltitudes of 1,000 feet with respect to the localizer site.
The vertical axes of the course structure and clearance orbit plots are themodel output values of CDI deflection in microamps (0.4-second time constantapplied for smoothing). The vertical axes of the antenna pattern plots use arelative scale with the pattern normalized to its peak value. The usual rangefor the vertical scale of modeled course structure data plots is +40 to -40microamps. This range has been reduced to +10 to -10 microamps for the coursestructure plots provided in this study in order to better display small values ofCDI deflection. This choice of scale eliminates the display of category 1limits from the plot and shows only the final segment of the category IItolerance limits. Category III tolerance limits (not shown) extend the5-microamp tolerance shown for category II performance to a point on the runway3,000 feet from threshold. The limits then increase linearly to 10 microamps ata point which is 2,000 feet from the stop end of the runway.
Modeled localizer output data are provided in figures 4 through 15. Figures 4through 6 provide computed performance results with airside 4 as the onlyreflecting source. Modeled course structure is plotted in figure 4. Computedclearance orbit results are given in figure 5. Figure 6 shows the computed CSBand SBO antenna pattern plots. Figures 7 through 9 provide similar plots for thereflecting surface configuration consisting of airside 4 with simulated dockedand taxiing aircraft. Figures 10 through 12 show computed performance resultsfor the two airside terminals with no simulated aircraft. The computedperformance results for the reflecting surface combination consisting of bothairsides 4 and 2 with simulated docked and taxiing aircraft at each airside areprovided in figures 13 through 15.
DATA ANALYSIS.
Modeled course structure results for airside 4 alone and airsides 4 and 2 withno aircraft (figures 4 and 10, respectively) show computed CDI deflections thatare well within category II/III course structure tolerance limits. Figure 7(airside 4 with docked and taxiing aircraft) and figure 13 (airsides 4 and 2 withdocked and taxiing aircraft) course structure results show computed CDIdeflections that are slightly larger, but still well within the category II/IIItolerance limits. The computed clearance orbit plots (figures 5, 8, 11, and 14)indicate satisfactory linearity, course crossover, and clearance levels. Figures6, 9, 12, and 15, CSB and SBO antenna patterns for the Mark II antenna array,show some roughness in the computed clearance signals of the pattern.
CONCLUSIONS
Modeled results indicate that category II/III localizer performance should beobtained for runway 35L with the Wilcox Mark II, 14-element, dual frequency logperiodic dipole (LPD) antenna array with both airside terminals and docked andtaxiing aircraft located as proposed. Computed clearance orbit results indicatesatisfactory linearity, course crossover, and clearance levels.
10
4V IO -91P :a 99/90/CT
0- 4
a)
0.)Iw~II '4-
~II0 m
oi0~iICCgLL
wU'
o umIs
(swo- ow N-IOIN NOIIVIA30 - CO 3-
U Ra:of :a 99/90/Ov
I 0 -
Iu zI n
zU"
sits-
w -
C-)
0
En
( D 0oW~
0 "0
0
Iz uI N
0 0 0 0 0
(sdweojotw) NOI.VOIOINI NOIIVIABO 3s~floo
12
0
IC!I
onZ.9-
- --
-- ~ ~ - --
-------------- J
- -L
wIL
z
CnI Caw
U) 0
00
B3flhIldWV 3AIiI38~
13
CE190OOI :0 8/90/oT
a),Ow,
0 0 1-4
(U
'0
12U, (
PC -C
cn w
wo c
0 w
- - - - rLL1
--162 14
illIn
(sdweojoxw) NOIiVOIONI NOIIVIABO BS~floo
14
aag~ ; e; 99/90/or
00
IU 0
ICu i
I --
IQ
If 01 J z
U)
OE-4
N x
0 0 o 0 0 0 0 0 0 00 0 0 0 0 0 0 0 0 m 0In~~~C mI4 a AT ) 4-I ll
(sdwoj:Iw) O~ioiaN NOIVIA0 3~nN
I15
o~co~a~; 8/90/07
99
IL
- II
a'0 z
00- -- - Li
I< 0
zz0w .
cn -40
CDj
N~~~ m c nnmm
3-ilW 3A) cI38
16'
to
LO 4-J
uuuu
9 0 0f
94C c
ro-O
gig 0
In
I!!J
~~1 W
0
- k- En
17-
We8:9 " 99/90/Ov
I 0
I 00
C -D
8 NI0<
own
uZI-
ci
w
cr-~
0
I C )CT)Lil
I '0
p I a T 44IJA;(sdweo~~jo~w0 NOLOGINLVA03uo
18)
0
'Ca)
- 04
9 U) -j
-I
LUJ
LUJ
-4
LUJz LU
zzM
44Z
3- i-lH 3AII-13
L~e
31
O6"Lo z ET ee/go/Or
100In I-
oion.IjUV <
4-)
-a
0
Ln,o r <(C14
U- wH
oo
UO
200
scEc~ea ; 99/90/oT
cvu
0 i
I OJI
I LIU ) .
En 0
LILD
I U )
7I N
I-AmQ
0 0 00n00 ~
n~~~~ M
(4;aI A )If tI6 A(sdwojot) NOLVOINI N~iVI30 0,oo
21-
zolec~gi gg/go/ov
C. -j
-S0
- - ---- - - - - - - -
-- -- ------- L
w
cr-o
qrw 'w
Ila)
L 1 1 1 1 0
3ofilhdWV 3AIiV-138
22
REFERENCES
1. Chin, G., et al., Instrument Landing System Scattering, Report
DOT/FAA-RD-72-137, 1972.
2. Chin, G., et al., User's Manual for ILSLOC: Simulation for Derogation
Effects on the Localizer Portion of the Instrument Landing System, Report
DOT/FAA-RD-73-13, 1973.
3. Chin, G., et al., Instrument Landing System Performance Prediction, Report
DOT/FAA-RD-73-200, 1974.
4. Chin, G., et al., ILS Localizer Performance Study, Part I. Dallas-Fort Worth
Regional Airport and Model Validation- Syracuse Hancock Airport, Report
DOT/FAA-RD-72-96, 1972.
23