Embed Size (px)
Citation preview
B Fold Enrichment (Lep vs Mock) 0 2 4 6 8
Positive regulation of cell differentiation
Negative regulation of epithelial-mesenchymal-transition
Cell junction organization
Cell developmental process
Cell morphogenesis
**
Supplementary Figure S1
AMock
Leptin
47
253
STAT3
STAT3
G9a
G9a
732 473
6111804
E
miR-200c NUMB GATA3 FOXA2 miR-34a HOXA5
LeptinMock
** *
* * *
Leptin+shSTAT3
*
0
0.2
0.4
0.6
0.8
1
1.2
1.4
Fo
ld c
han
ge
of
m
RN
A l
evel
Leptin+shG9a
MiR-200c
HEI193-MDM1.fcs
PE-A
Coun
t
0 256 512 768 10240
8
16
HEI193.fcs
PE-A
Coun
t
0 256 512 768 10240
6
11
HEI193.fcs
PE-A
Coun
t
0 256 512 768 10240
15
29
HEI193-MDM1.fcs
PE-A
Coun
t
0 256 512 768 10240
18
35
40
0
40
0
Mock Leptin
3kb
7072862
STAT3
G9a
3kb
ch12: 7072862
H3K9Me230
0
C
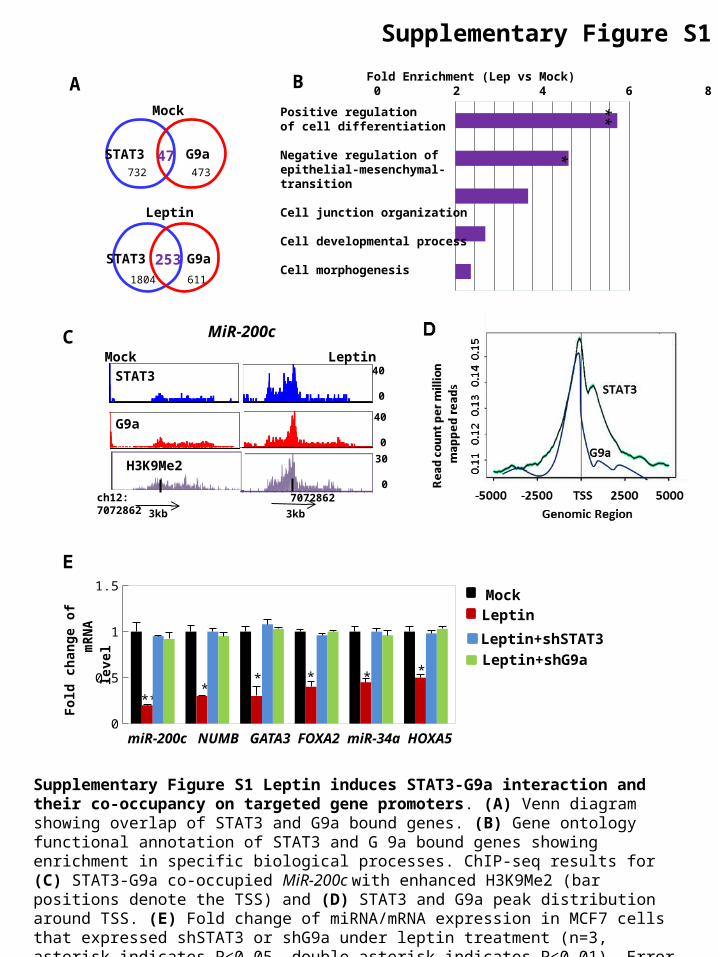
Supplementary Figure S1 Leptin induces STAT3-G9a interaction and their co-occupancy on targeted gene promoters. (A) Venn diagram showing overlap of STAT3 and G9a bound genes. (B) Gene ontology functional annotation of STAT3 and G 9a bound genes showing enrichment in specific biological processes. ChIP-seq results for (C) STAT3-G9a co-occupied MiR-200c with enhanced H3K9Me2 (bar positions denote the TSS) and (D) STAT3 and G9a peak distribution around TSS. (E) Fold change of miRNA/mRNA expression in MCF7 cells that expressed shSTAT3 or shG9a under leptin treatment (n=3, asterisk indicates P<0.05, double asterisk indicates P<0.01). Error bars denote ±SD.
*
0
10
20
30
40
Pe
rce
nta
ge
of
CD
24-
CD
44+
ce
lls (
%)
LeptinMock
Con-Vec miR-200c
*
B
miR
-200
cC
on
-Vec
Leptin: - +
miR-200c Con-VecLeptin: - + - +
Actin
E-cad
N-cad
C D
0
50
100
150
Nu
mb
er o
f sp
her
e p
er 1
000
cell
s
LeptinMock
Con-Vec miR-200c Con-Vec miR-200c
*
*
MCF12A MCF7
E- + Leptin:
miR-200c
Con-Vec
F
Su
pp
lemen
tary Fig
ure 2
0
1
2
3
4
Fo
ld c
han
ge
of
miR
NA
miR
-200
c-3p
miR
-124
-3p
miR
-34a
-5p
miR
-20b
-5p
Let-
7f-5
p
miR
-210
-3p
m
iR-2
1-5p
miR
-125
a-5p
**
MockLeptin
* * * * *
*
*
A
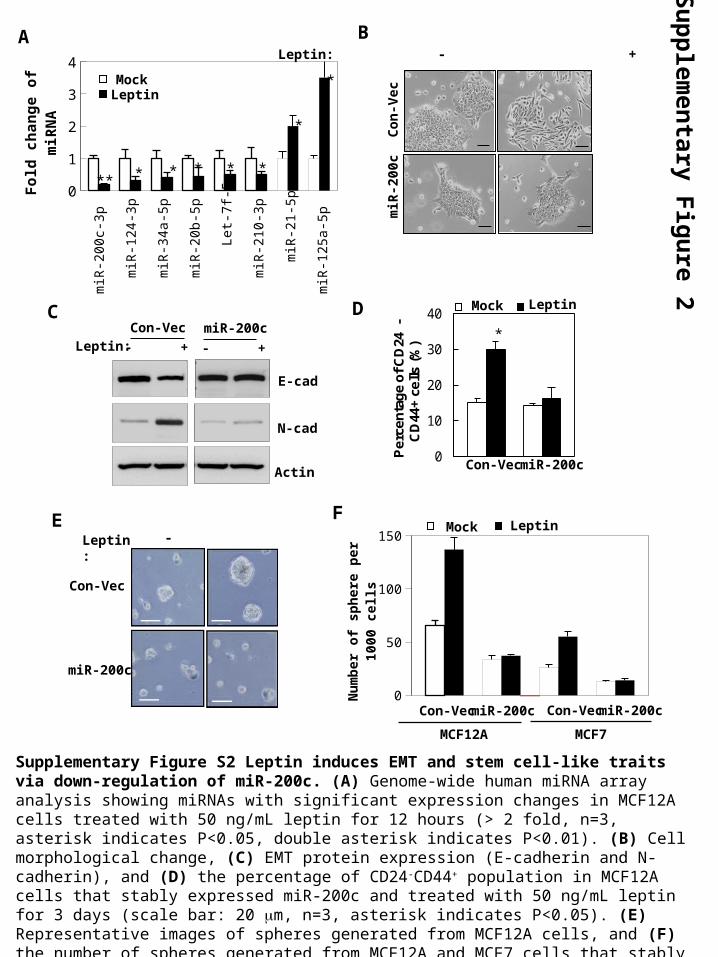
Supplementary Figure S2 Leptin induces EMT and stem cell-like traits via down-regulation of miR-200c. (A) Genome-wide human miRNA array analysis showing miRNAs with significant expression changes in MCF12A cells treated with 50 ng/mL leptin for 12 hours (> 2 fold, n=3, asterisk indicates P<0.05, double asterisk indicates P<0.01). (B) Cell morphological change, (C) EMT protein expression (E-cadherin and N-cadherin), and (D) the percentage of CD24-CD44+ population in MCF12A cells that stably expressed miR-200c and treated with 50 ng/mL leptin for 3 days (scale bar: 20 mm, n=3, asterisk indicates P<0.05). (E) Representative images of spheres generated from MCF12A cells, and (F) the number of spheres generated from MCF12A and MCF7 cells that stably expressed miR-200c and treated with 50 ng/mL leptin for 7 days (scale bar: 100 mm, n=3, asterisk indicates P<0.05). Error bars denote ±SD.
p-STAT3
STAT3
Actin
OBR
Leptin: - +sh-Vec sh-STAT3
- +
G9a
Actin
OBR
sh-Vec sh-G9a- + Leptin: - +
A B
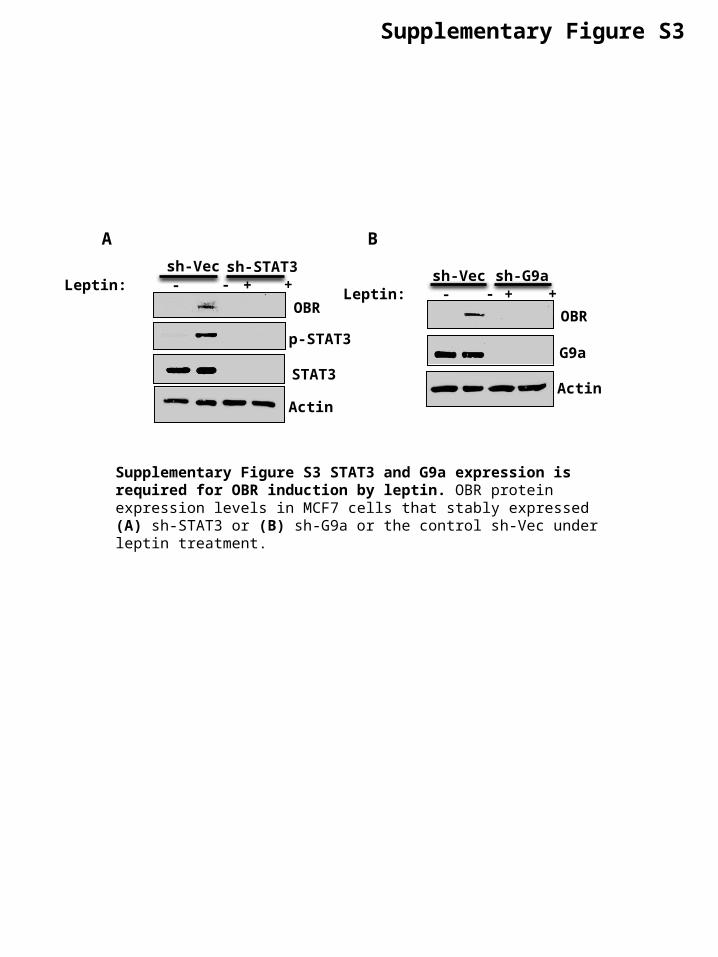
Supplementary Figure S3 STAT3 and G9a expression is required for OBR induction by leptin. OBR protein expression levels in MCF7 cells that stably expressed (A) sh-STAT3 or (B) sh-G9a or the control sh-Vec under leptin treatment.
Supplementary Figure S3
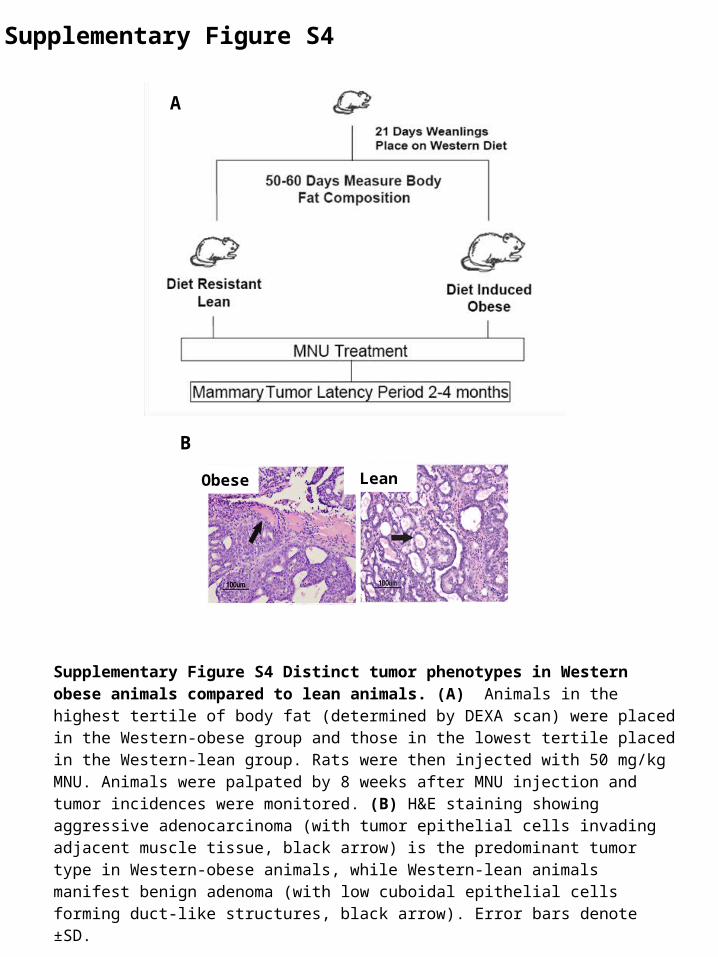
Supplementary Figure S4
Supplementary Figure S4 Distinct tumor phenotypes in Western obese animals compared to lean animals. (A) Animals in the highest tertile of body fat (determined by DEXA scan) were placed in the Western-obese group and those in the lowest tertile placed in the Western-lean group. Rats were then injected with 50 mg/kg MNU. Animals were palpated by 8 weeks after MNU injection and tumor incidences were monitored. (B) H&E staining showing aggressive adenocarcinoma (with tumor epithelial cells invading adjacent muscle tissue, black arrow) is the predominant tumor type in Western-obese animals, while Western-lean animals manifest benign adenoma (with low cuboidal epithelial cells forming duct-like structures, black arrow). Error bars denote ±SD.
A
B
Obese LeanLean
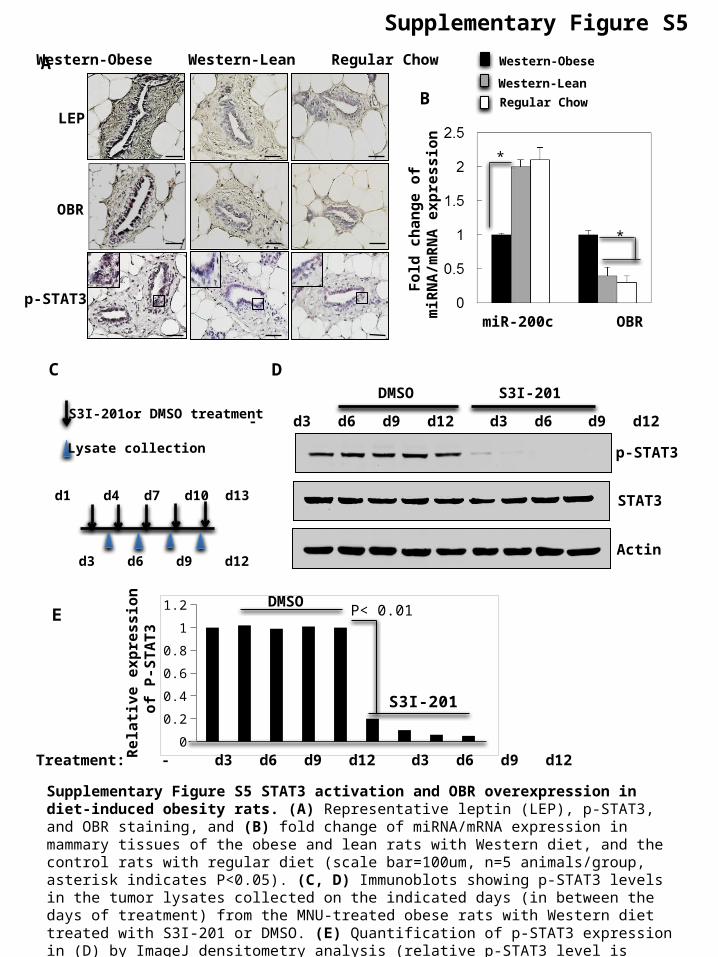
Supplementary Figure S5 STAT3 activation and OBR overexpression in diet-induced obesity rats. (A) Representative leptin (LEP), p-STAT3, and OBR staining, and (B) fold change of miRNA/mRNA expression in mammary tissues of the obese and lean rats with Western diet, and the control rats with regular diet (scale bar=100um, n=5 animals/group, asterisk indicates P<0.05). (C, D) Immunoblots showing p-STAT3 levels in the tumor lysates collected on the indicated days (in between the days of treatment) from the MNU-treated obese rats with Western diet treated with S3I-201 or DMSO. (E) Quantification of p-STAT3 expression in (D) by ImageJ densitometry analysis (relative p-STAT3 level is normalized with total STAT3 and Actin, n=5 animals/group). Error bars denote ±SD.
LEP
OBR
p-STAT3
Western-Obese Western-Lean Regular ChowA
B
miR-200c OBR
Fo
ld c
ha
ng
e o
f m
iRN
A/m
RN
A e
xp
res
sio
n
*
*
Western-Lean
Regular Chow
Western-Obese
- d3 d6 d9 d12 d3 d6 d9 d12
DMSO S3I-201
p-STAT3
STAT3
Actin
d1 d4 d7 d10 d13
d3 d6 d9 d12
S3I-201or DMSO treatment
Lysate collection
C D
E
Re
lati
ve
ex
pre
ss
ion
of
P-S
TAT
3
0
2
4
6
8
10
12
S3I-201
Treatment: - d3 d6 d9 d12 d3 d6 d9 d12
DMSO P< 0.01
Supplementary Figure S5