Embed Size (px)
Citation preview
B
Day 1_0Gy Day 1_8Gy
DIM 1
DIM
2
-0.0
6-0
.04
-0.0
2-0
.00
0.02
0.04
0.00 0.02 0.04-0.02-0.04
Top 50 Ions From RF – 100% Accuracy
A C
-0.2 -0.1 0.0
Upregulated in 8Gy GroupS Plot
p[1]P(Loadings)
p(c
orr)
[1]P
(C
orre
lati
on)
0.1 0.2Downregulated in 8Gy Group
0.0
0.2
0.4
0.6
0.8
1.0
-1.0
-0.8
-0.6
-0.4
-0.2
Day1_0Gy Day1_8Gy0.2 0.60.2 1
Colour Key
Supplementary Figure S1: UPLC-ESI-TOFMS GI metabolomics 1 day post-radiation exposure: CD2F1 mice were either sham irradiated or exposed to study 8Gy of γ radiation. The mice were euthanized 1 day, post-radiation exposure for blood and organ collection. Comparative metabolomic profiling of GI tissue was performed as described (see methods). Panel A. OPLS loadings S-plot comparing features from control GI (sham) with irradiated group. Panel B. Two dimensional accuracy plot for top 50 features interrogated using Random Forests. The X-axis denotes the interclass separation while the Y-axis displays the intra-class variability. Panel C. Heat map visualization of the feature rankings comparing relative levels in control and irradiated GI samples. Each row represents a unique feature with a characteristic mass to charge and retention time value.
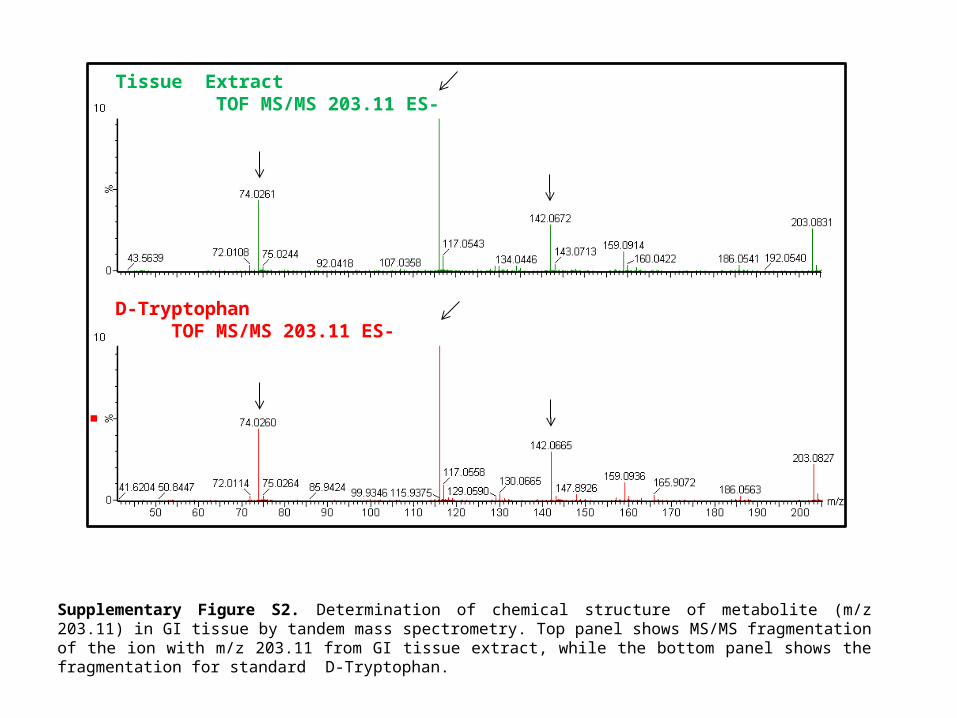
Supplementary Figure S2. Determination of chemical structure of metabolite (m/z 203.11) in GI tissue by tandem mass spectrometry. Top panel shows MS/MS fragmentation of the ion with m/z 203.11 from GI tissue extract, while the bottom panel shows the fragmentation for standard D-Tryptophan.
Tissue Extract TOF MS/MS 203.11 ES-
D-Tryptophan TOF MS/MS 203.11 ES-
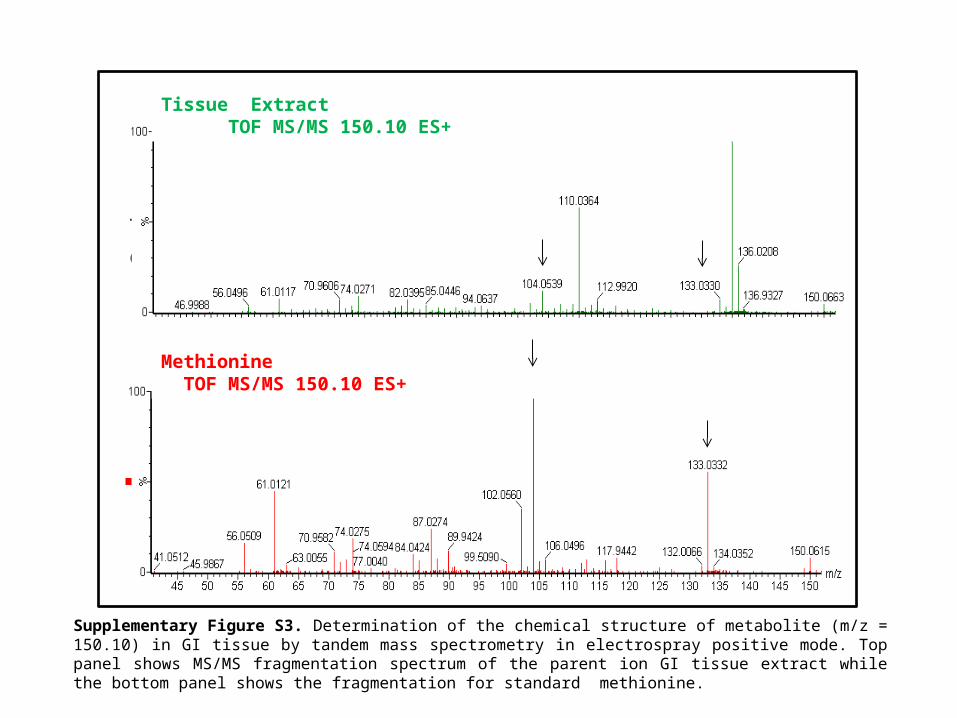
Supplementary Figure S3. Determination of the chemical structure of metabolite (m/z = 150.10) in GI tissue by tandem mass spectrometry in electrospray positive mode. Top panel shows MS/MS fragmentation spectrum of the parent ion GI tissue extract while the bottom panel shows the fragmentation for standard methionine.
Tissue extract
standard
Tissue Extract TOF MS/MS 150.10 ES+
Methionine TOF MS/MS 150.10 ES+
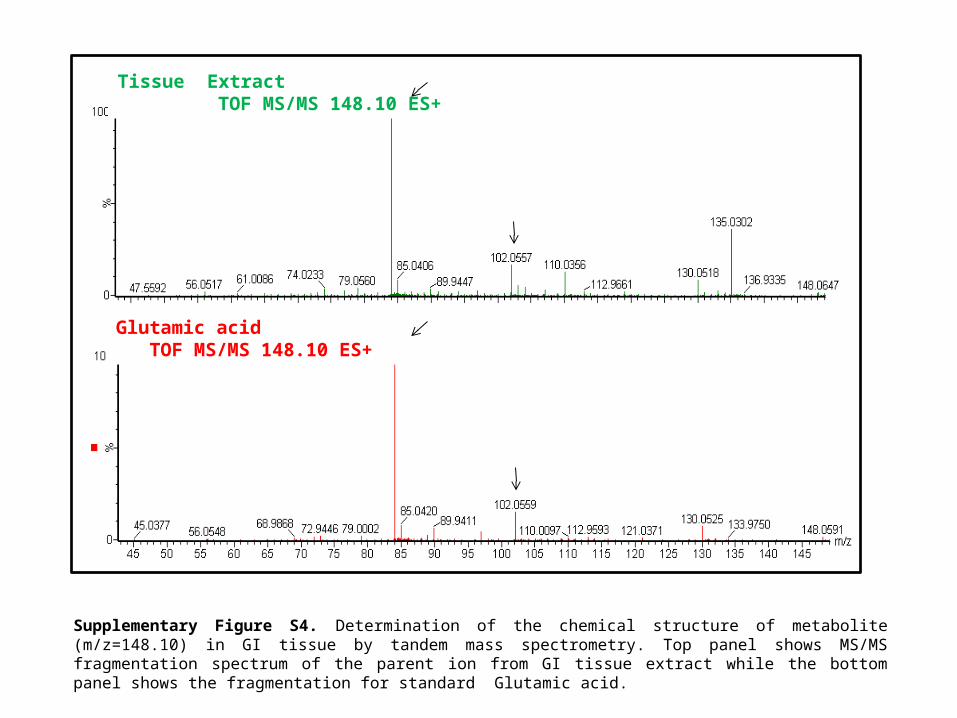
Supplementary Figure S4. Determination of the chemical structure of metabolite (m/z=148.10) in GI tissue by tandem mass spectrometry. Top panel shows MS/MS fragmentation spectrum of the parent ion from GI tissue extract while the bottom panel shows the fragmentation for standard Glutamic acid.
Tissue Extract TOF MS/MS 148.10 ES+
Glutamic acid TOF MS/MS 148.10 ES+

Supplementary Figure S5. Determination of the chemical structure of metabolite (m/z= 179.049) in GI tissue by tandem mass spectrometry. Top panel shows MS/MS fragmentation of the parent ion from GI tissue extract while bottom panel shows the fragmentation for standard Cys-Gly.
Tissue Extract TOF MS/MS 179.049 ES+
Cys-Gly TOF MS/MS 179.049 ES+
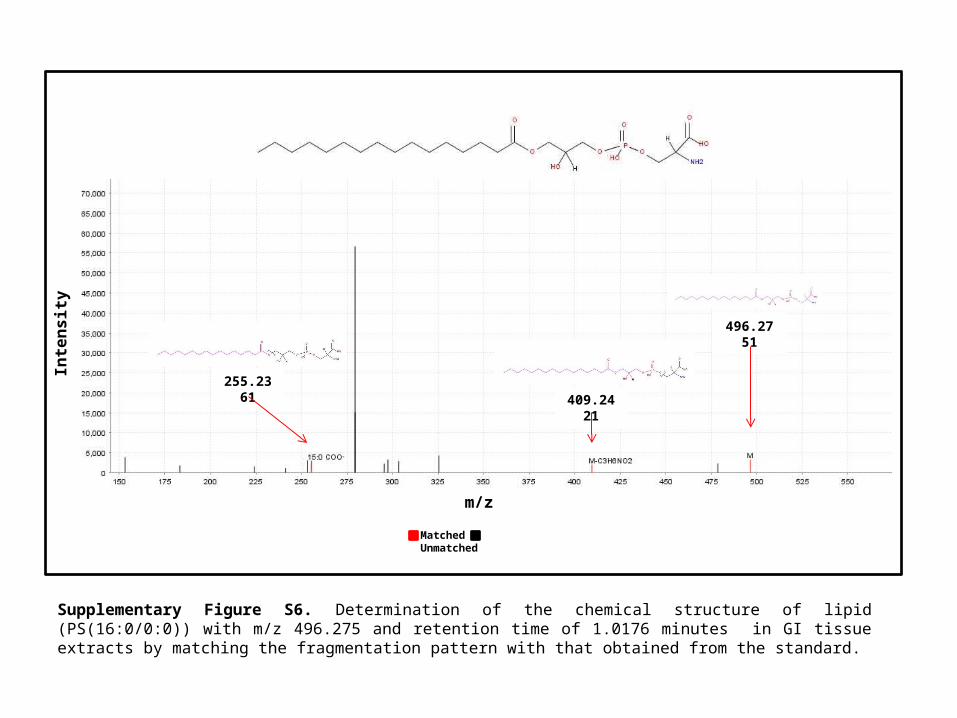
Supplementary Figure S6. Determination of the chemical structure of lipid (PS(16:0/0:0)) with m/z 496.275 and retention time of 1.0176 minutes in GI tissue extracts by matching the fragmentation pattern with that obtained from the standard.
Matched Unmatched
m/z
Inte
nsi
ty
255.2361
409.2421
496.2751
140.0131
196.0404
Matched Unmatched
m/z
Inte
nsi
ty
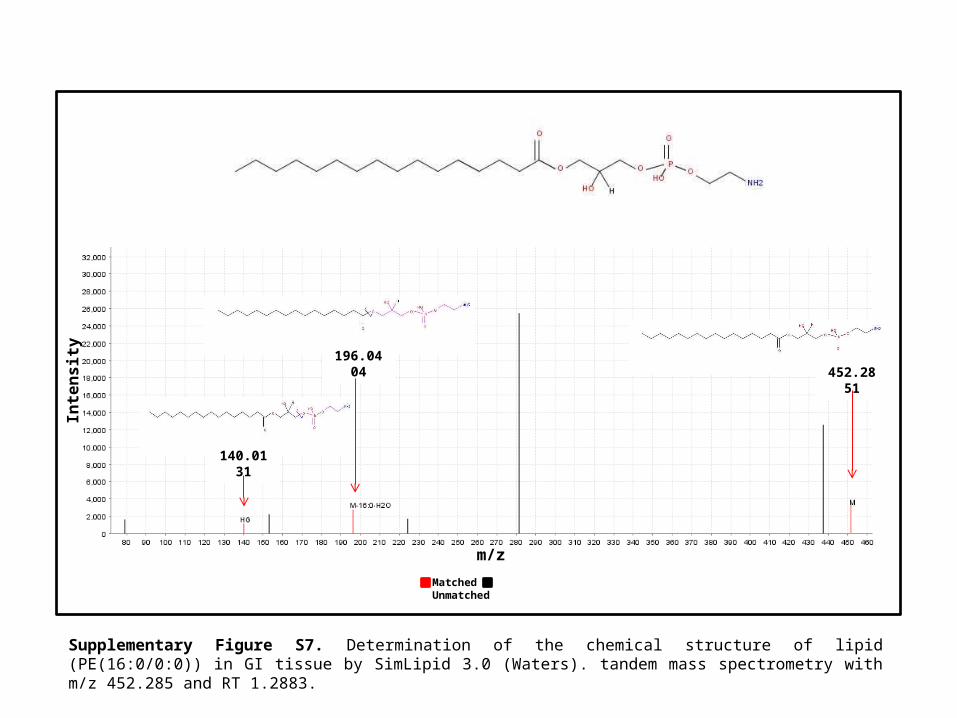
Supplementary Figure S7. Determination of the chemical structure of lipid (PE(16:0/0:0)) in GI tissue by SimLipid 3.0 (Waters). tandem mass spectrometry with m/z 452.285 and RT 1.2883.
452.2851
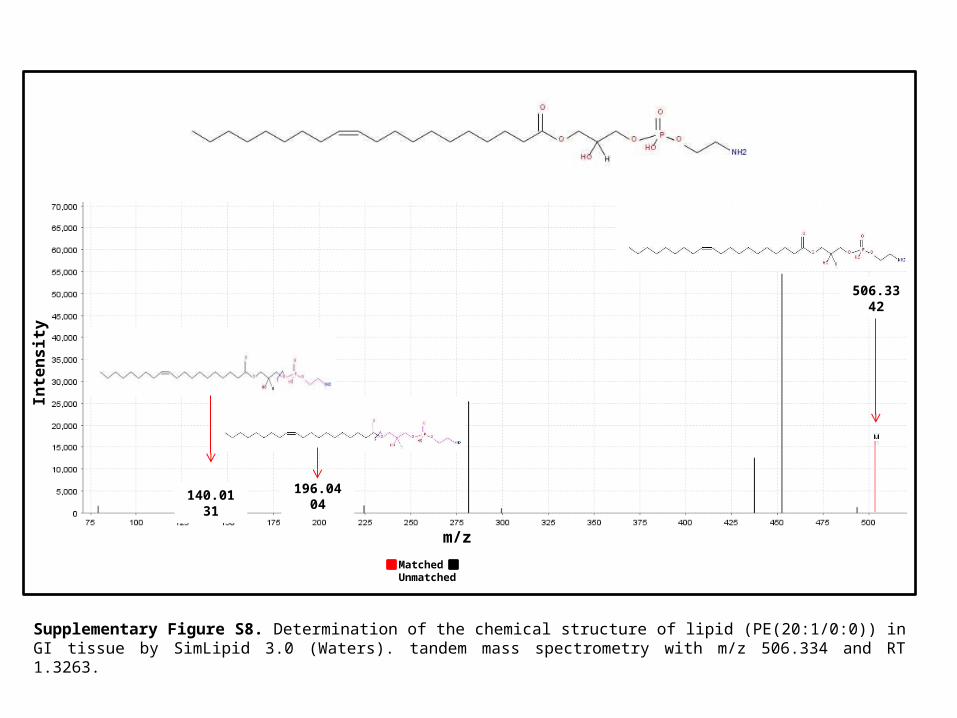
Supplementary Figure S8. Determination of the chemical structure of lipid (PE(20:1/0:0)) in GI tissue by SimLipid 3.0 (Waters). tandem mass spectrometry with m/z 506.334 and RT 1.3263.
140.0131 196.0404
Matched Unmatched
m/z
Inte
nsi
ty
506.3342
S. No m/zRT
(minutes)ESI
ModeFold Change (Rad/Sham)
Radiation Dose
P-Value
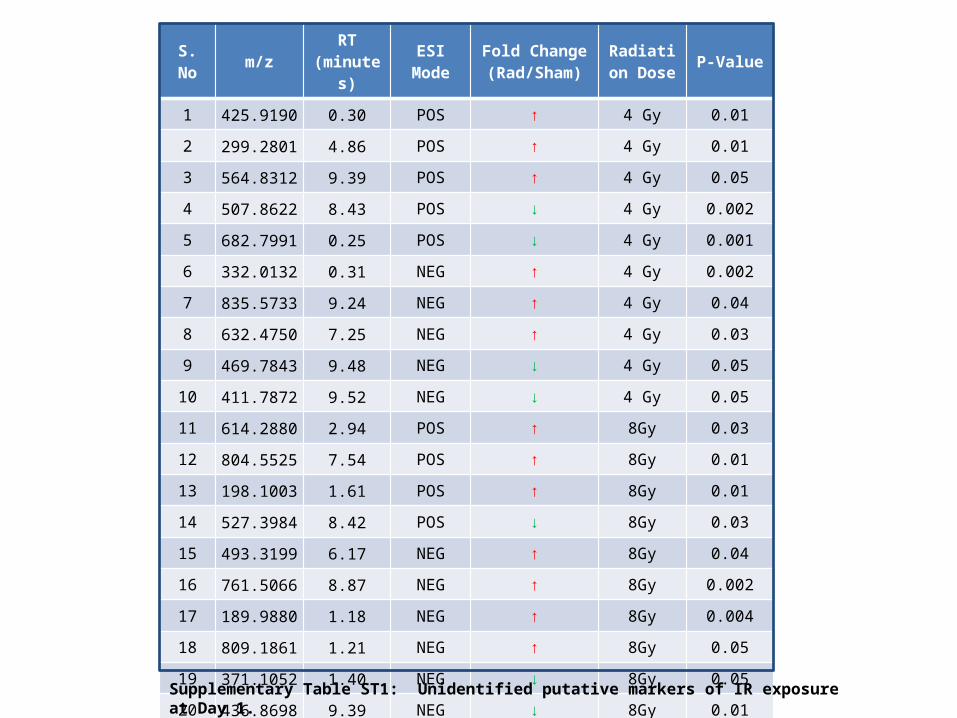
1 425.9190 0.30 POS ↑ 4 Gy 0.01
2 299.2801 4.86 POS ↑ 4 Gy 0.01
3 564.8312 9.39 POS ↑ 4 Gy 0.05
4 507.8622 8.43 POS ↓ 4 Gy 0.002
5 682.7991 0.25 POS ↓ 4 Gy 0.001
6 332.0132 0.31 NEG ↑ 4 Gy 0.002
7 835.5733 9.24 NEG ↑ 4 Gy 0.04
8 632.4750 7.25 NEG ↑ 4 Gy 0.03
9 469.7843 9.48 NEG ↓ 4 Gy 0.05
10 411.7872 9.52 NEG ↓ 4 Gy 0.05
11 614.2880 2.94 POS ↑ 8Gy 0.03
12 804.5525 7.54 POS ↑ 8Gy 0.01
13 198.1003 1.61 POS ↑ 8Gy 0.01
14 527.3984 8.42 POS ↓ 8Gy 0.03
15 493.3199 6.17 NEG ↑ 8Gy 0.04
16 761.5066 8.87 NEG ↑ 8Gy 0.002
17 189.9880 1.18 NEG ↑ 8Gy 0.004
18 809.1861 1.21 NEG ↑ 8Gy 0.05
19 371.1052 1.40 NEG ↓ 8Gy 0.05
20 436.8698 9.39 NEG ↓ 8Gy 0.01
Supplementary Table ST1: Unidentified putative markers of IR exposure at Day 1.
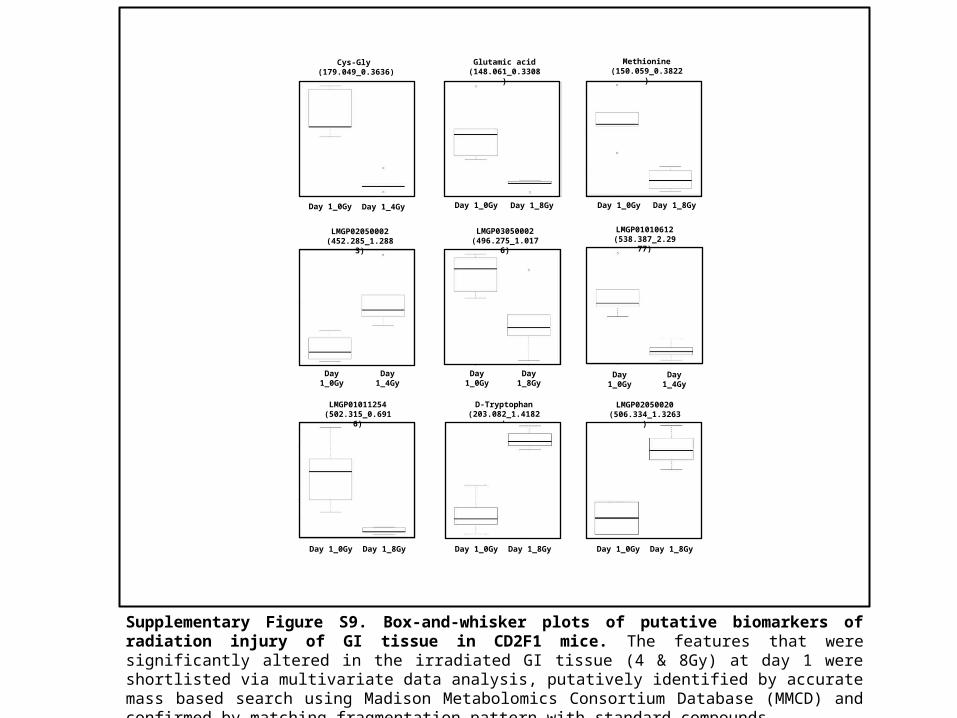
Supplementary Figure S9. Box-and-whisker plots of putative biomarkers of radiation injury of GI tissue in CD2F1 mice. The features that were significantly altered in the irradiated GI tissue (4 & 8Gy) at day 1 were shortlisted via multivariate data analysis, putatively identified by accurate mass based search using Madison Metabolomics Consortium Database (MMCD) and confirmed by matching fragmentation pattern with standard compounds.
Day 1_0Gy Day 1_8Gy
LMGP01011254 (502.315_0.6916)
Day 1_0Gy Day 1_4Gy
LMGP01010612 (538.387_2.2977)
Day 1_0Gy Day 1_8Gy
LMGP03050002 (496.275_1.0176)
Day 1_0Gy Day 1_4Gy
LMGP02050002 (452.285_1.2883)
Day 1_0Gy Day 1_8Gy
Methionine (150.059_0.3822)
Glutamic acid (148.061_0.3308)
Day 1_0Gy Day 1_8Gy
Cys-Gly (179.049_0.3636)
Day 1_0Gy Day 1_4Gy
D-Tryptophan (203.082_1.4182)
Day 1_0Gy Day 1_8Gy
LMGP02050020 (506.334_1.3263)
Day 1_0Gy Day 1_8Gy
B
Day 4_8Gy Day 4_0Gy
DIM 1
DIM
2
-0.0
6-0
.04
-0.0
2-0
.00
0.02
0.04
0.00 0.02 0.04-0.02-0.04
Top 50 Ions From RF – 100% Accuracy
A C
-0.2 -0.1 0.0
Upregulated in 8Gy GroupS Plot
p[1]P(Loadings)
p(c
orr)
[1]P
(C
orre
lati
on)
0.1 0.2Downregulated in 8Gy Group
0.0
0.2
0.4
0.6
0.8
1.0
-1.0
-0.8
-0.6
-0.4
-0.2
Day4_0Gy Day4_8Gy
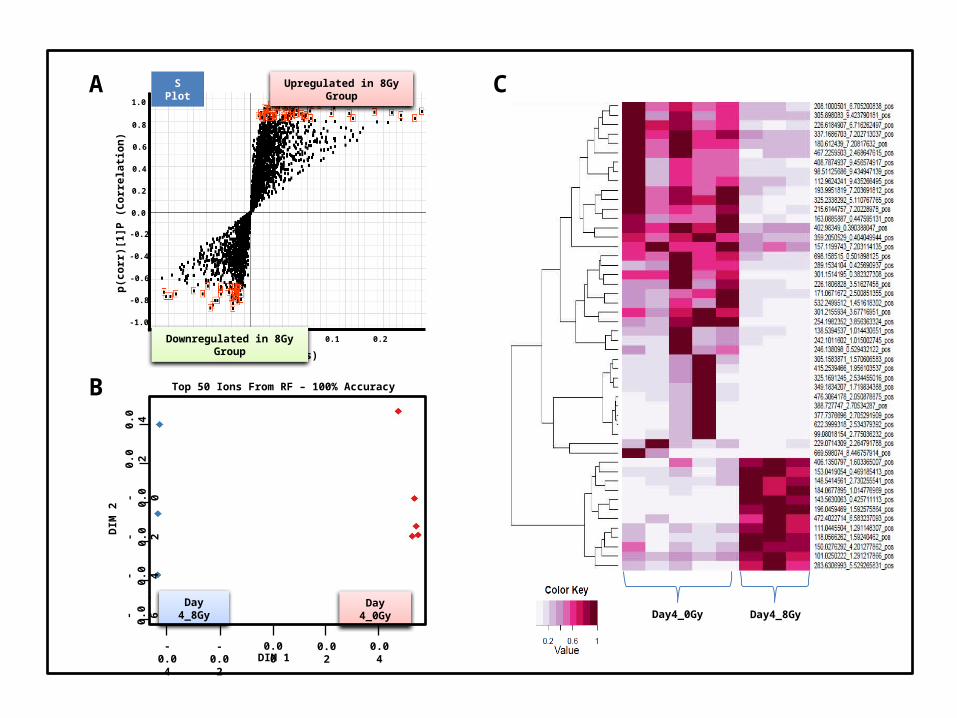
Supplementary Figure S10: UPLC-ESI-TOFMS based GI metabolomics at 4 days post-IR exposure: CD2F1 mice were either sham irradiated or exposed to study 8Gy of γ radiation and euthanized after 4 days. Comparative metabolomic profiling of GI tissue was performed as described (see methods). Panel A. OPLS loadings S-plot comparing features from sham with irradiated group. Panel B. Two dimensional accuracy plot for top 50 features interrogated using Random Forests. The X-axis denotes the interclass separation while the Y-axis displays the intra-class variability. Panel C. Heat map visualization of the feature rankings comparing relative levels in control and irradiated GI samples. Each row represents a unique feature with a characteristic mass to charge and retention time value.
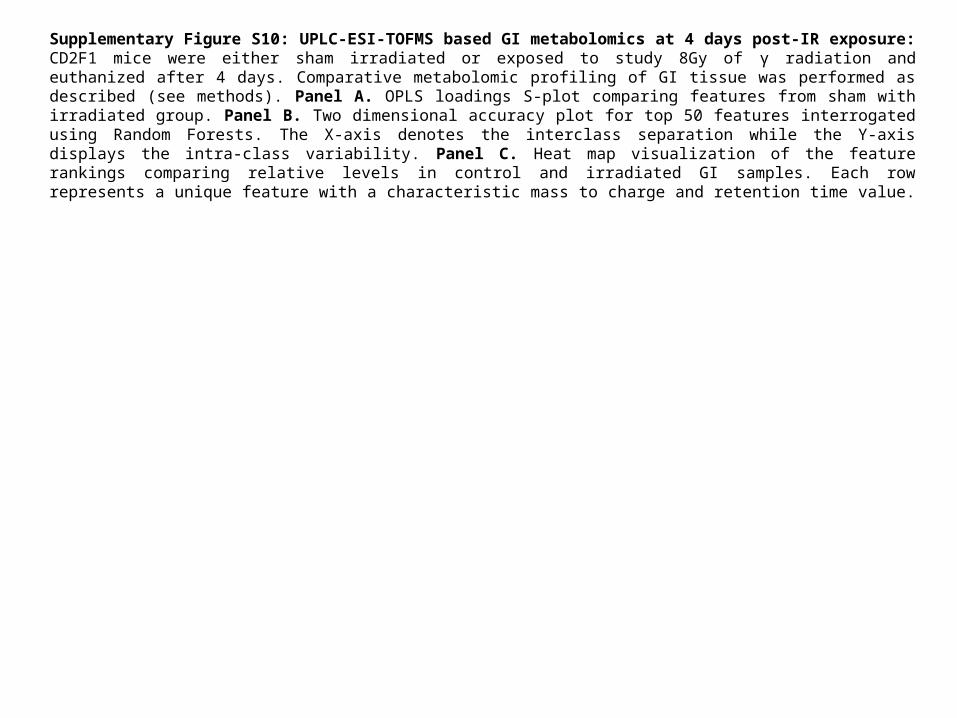
Supplementary Figure S11. Determination of the chemical structure of metabolite (m/z = 146.20) by tandem mass spectrometry. Top panel shows MS/MS fragmentation spectrum of the parent ion from GI tissue extract while the bottom panel shows the fragmentation for standard spermidine.
Tissue Extract TOF MS/MS 146.20 ES+
Spermidine TOF MS/MS 146.20 ES+
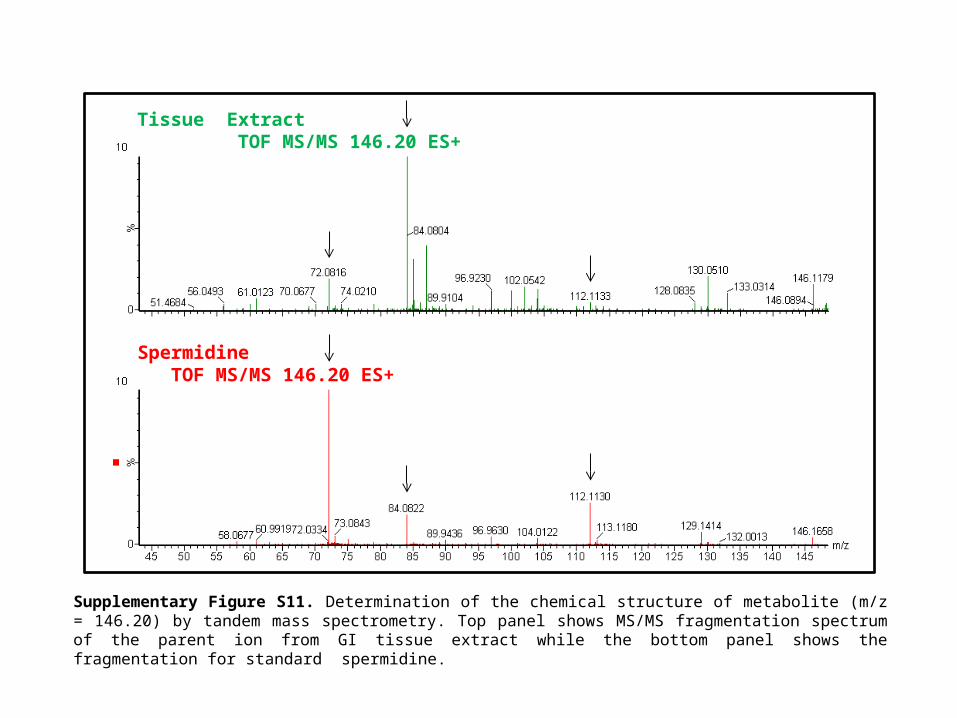
Supplementary Figure S12. Determination of the chemical structure of metabolite (m/z = 311.16) by tandem mass spectrometry. Top panel shows MS/MS fragmentation spectrum of the parent ion with m/z 311.169 while the bottom panel shows the fragmentation for standard Eicosenoic acid.
Tissue Extract TOF MS/MS 311.16 ES+
Eicosenoic acid TOF MS/MS 311.16 ES+
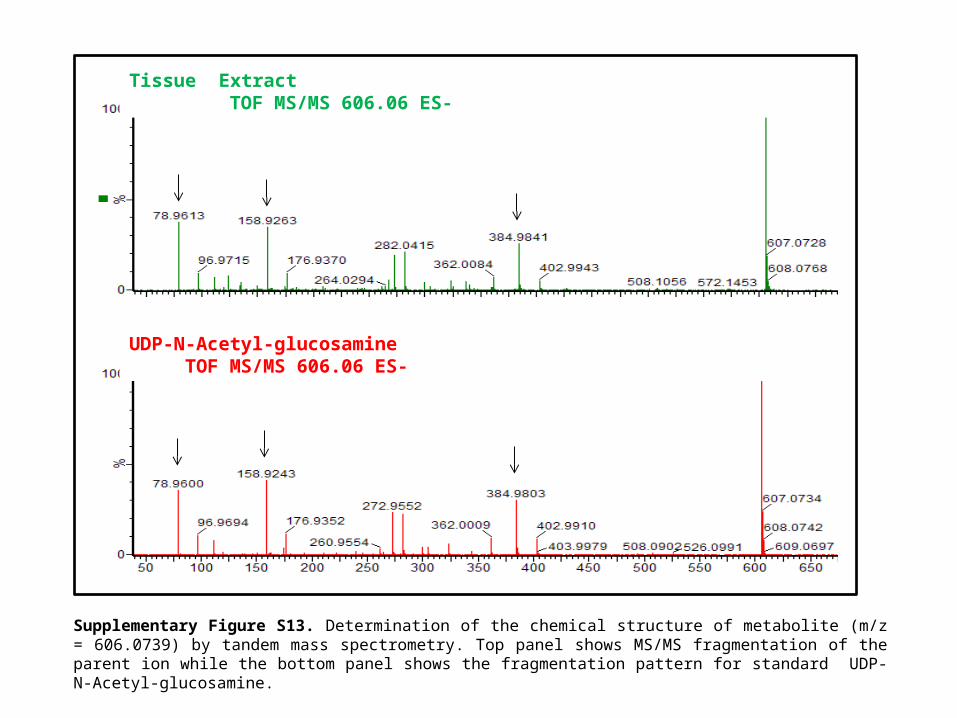
Supplementary Figure S13. Determination of the chemical structure of metabolite (m/z = 606.0739) by tandem mass spectrometry. Top panel shows MS/MS fragmentation of the parent ion while the bottom panel shows the fragmentation pattern for standard UDP-N-Acetyl-glucosamine.
Tissue Extract TOF MS/MS 606.06 ES-
UDP-N-Acetyl-glucosamine TOF MS/MS 606.06 ES-
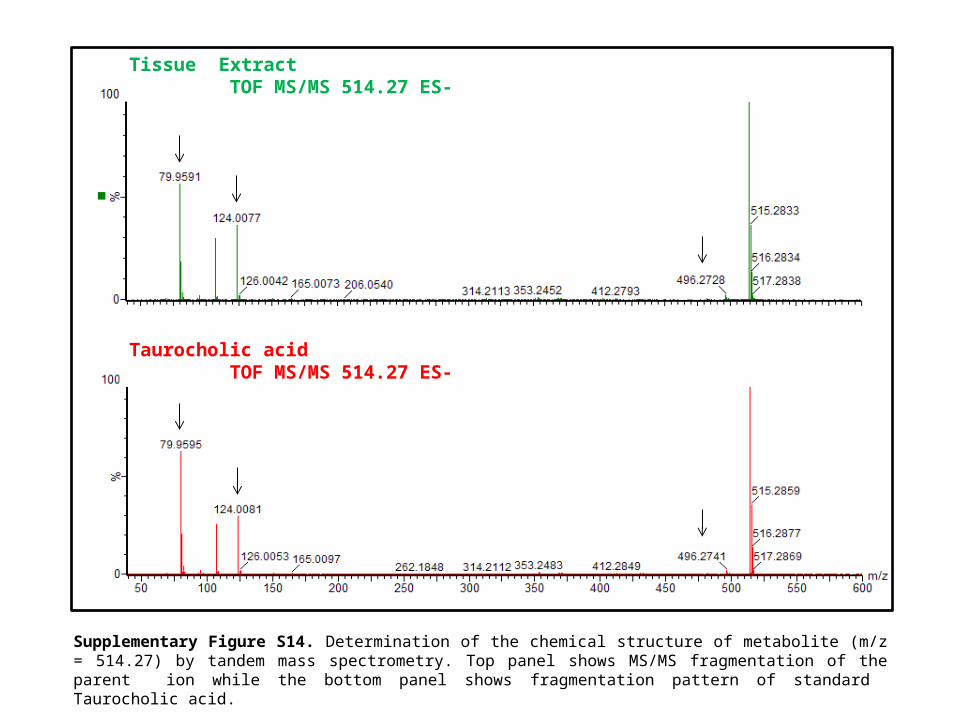
Supplementary Figure S14. Determination of the chemical structure of metabolite (m/z = 514.27) by tandem mass spectrometry. Top panel shows MS/MS fragmentation of the parent ion while the bottom panel shows fragmentation pattern of standard Taurocholic acid.
Tissue Extract TOF MS/MS 514.27 ES-
Taurocholic acid TOF MS/MS 514.27 ES-
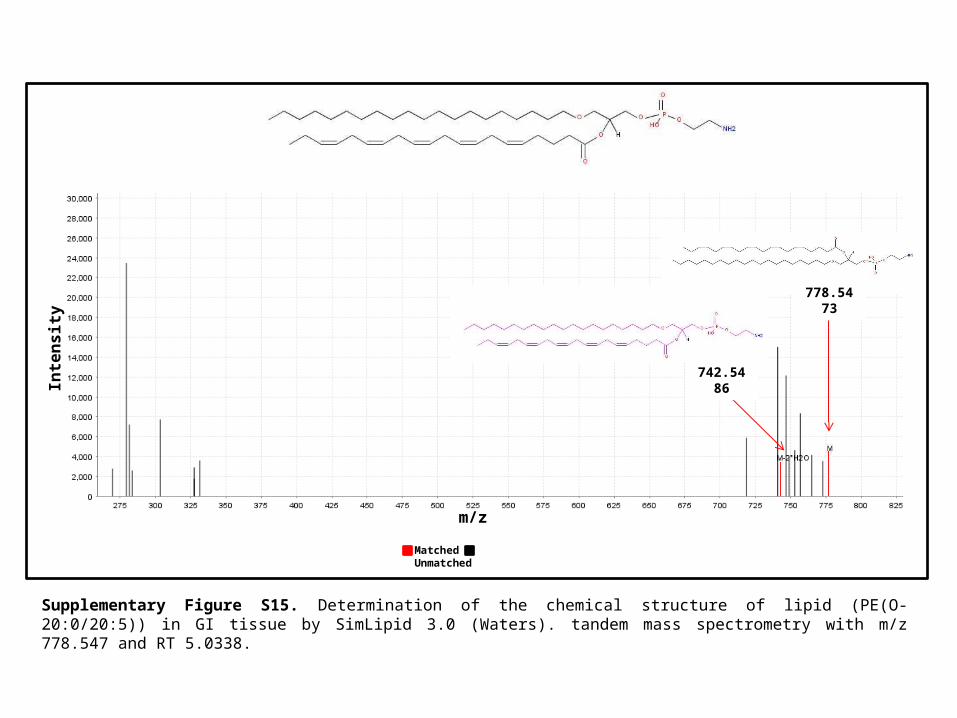
Supplementary Figure S15. Determination of the chemical structure of lipid (PE(O-20:0/20:5)) in GI tissue by SimLipid 3.0 (Waters). tandem mass spectrometry with m/z 778.547 and RT 5.0338.
Matched Unmatched
m/z
Inte
nsi
ty
742.5486
778.5473
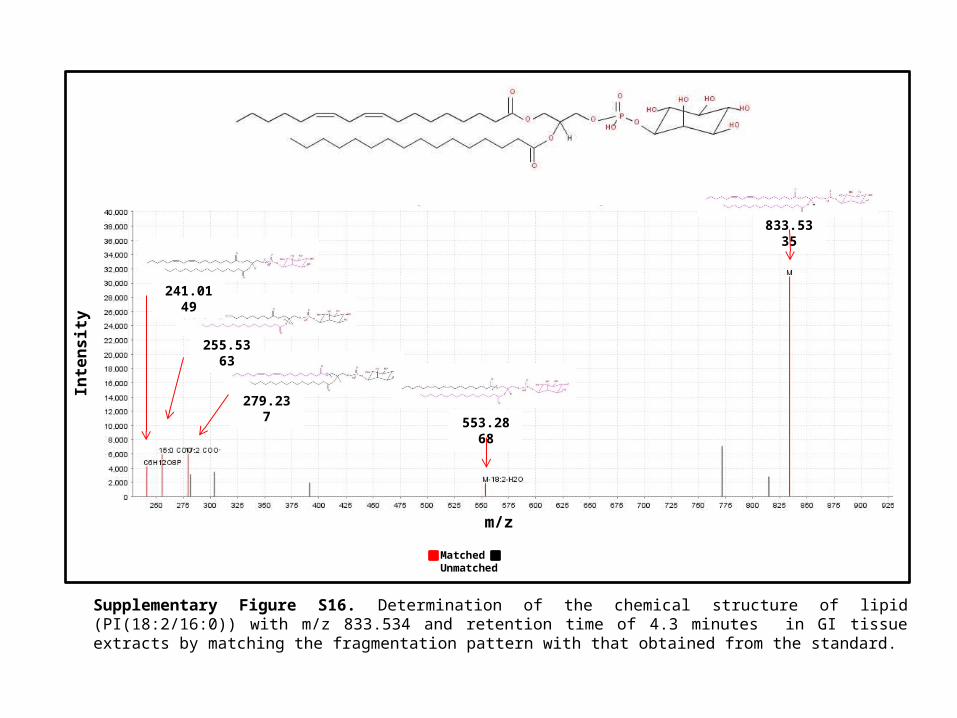
241.0149
255.5363
279.237
553.2868
833.5335
Matched Unmatched
m/z
Inte
nsi
ty
Supplementary Figure S16. Determination of the chemical structure of lipid (PI(18:2/16:0)) with m/z 833.534 and retention time of 4.3 minutes in GI tissue extracts by matching the fragmentation pattern with that obtained from the standard.
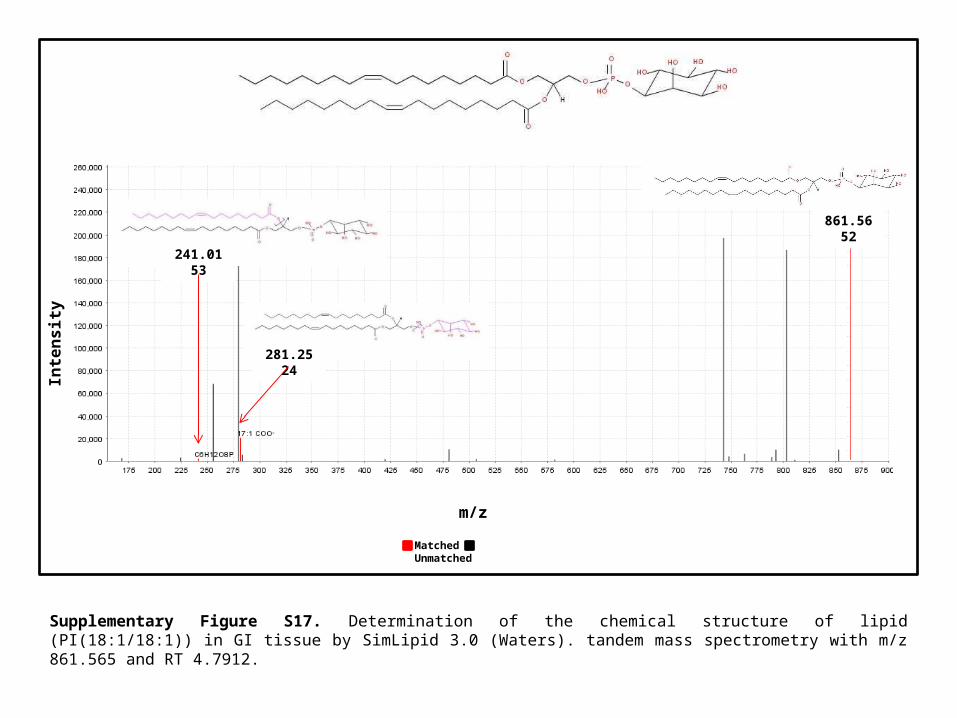
Supplementary Figure S17. Determination of the chemical structure of lipid (PI(18:1/18:1)) in GI tissue by SimLipid 3.0 (Waters). tandem mass spectrometry with m/z 861.565 and RT 4.7912.
241.0153
281.2524
Matched Unmatched
m/z
Inte
nsi
ty
861.5652
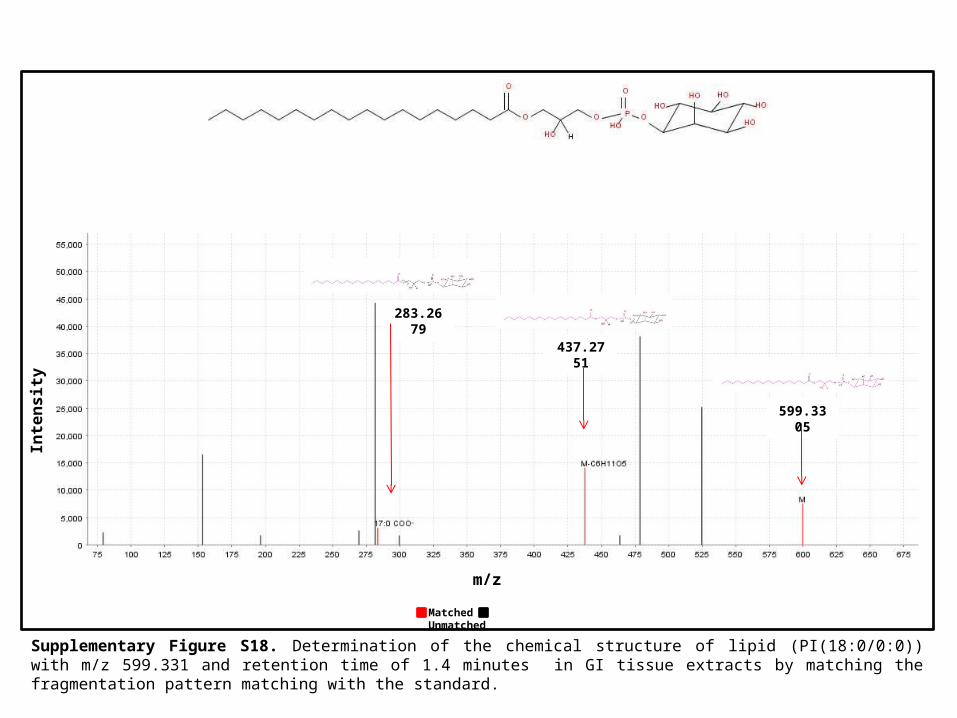
Supplementary Figure S18. Determination of the chemical structure of lipid (PI(18:0/0:0)) with m/z 599.331 and retention time of 1.4 minutes in GI tissue extracts by matching the fragmentation pattern matching with the standard.
283.2679
437.2751
599.3305
Matched Unmatched
m/z
Inte
nsi
ty
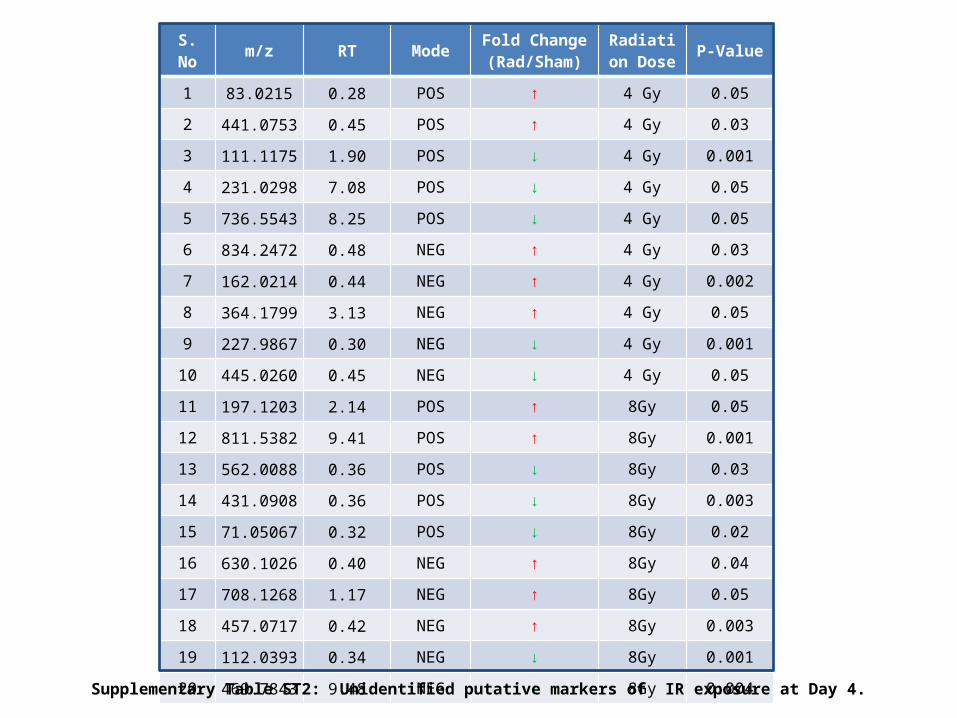
S. No m/z RT ModeFold Change (Rad/Sham)
Radiation Dose
P-Value
1 83.0215 0.28 POS ↑ 4 Gy 0.05
2 441.0753 0.45 POS ↑ 4 Gy 0.03
3 111.1175 1.90 POS ↓ 4 Gy 0.001
4 231.0298 7.08 POS ↓ 4 Gy 0.05
5 736.5543 8.25 POS ↓ 4 Gy 0.05
6 834.2472 0.48 NEG ↑ 4 Gy 0.03
7 162.0214 0.44 NEG ↑ 4 Gy 0.002
8 364.1799 3.13 NEG ↑ 4 Gy 0.05
9 227.9867 0.30 NEG ↓ 4 Gy 0.001
10 445.0260 0.45 NEG ↓ 4 Gy 0.05
11 197.1203 2.14 POS ↑ 8Gy 0.05
12 811.5382 9.41 POS ↑ 8Gy 0.001
13 562.0088 0.36 POS ↓ 8Gy 0.03
14 431.0908 0.36 POS ↓ 8Gy 0.003
15 71.05067 0.32 POS ↓ 8Gy 0.02
16 630.1026 0.40 NEG ↑ 8Gy 0.04
17 708.1268 1.17 NEG ↑ 8Gy 0.05
18 457.0717 0.42 NEG ↑ 8Gy 0.003
19 112.0393 0.34 NEG ↓ 8Gy 0.001
20 469.7843 9.48 NEG ↓ 8Gy 0.004
Supplementary Table ST2: Unidentified putative markers of IR exposure at Day 4.
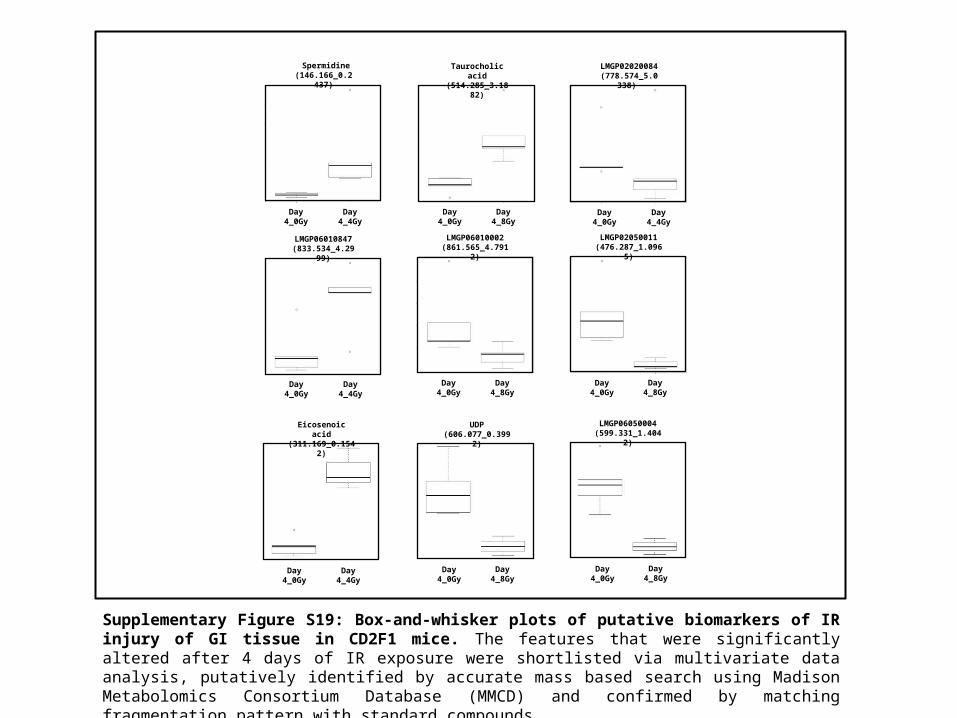
Supplementary Figure S19: Box-and-whisker plots of putative biomarkers of IR injury of GI tissue in CD2F1 mice. The features that were significantly altered after 4 days of IR exposure were shortlisted via multivariate data analysis, putatively identified by accurate mass based search using Madison Metabolomics Consortium Database (MMCD) and confirmed by matching fragmentation pattern with standard compounds.
Day 4_0Gy Day 4_8Gy
LMGP02050011 (476.287_1.0965)
Day 4_0Gy Day 4_8Gy
LMGP06010002 (861.565_4.7912)
Day 4_0Gy Day 4_8Gy
Taurocholic acid (514.285_3.1882)
Day 4_0Gy Day 4_4Gy
Spermidine (146.166_0.2437)
Day 4_0Gy Day 4_4Gy
LMGP02020084 (778.574_5.0338)
Day 4_0Gy Day 4_4Gy
LMGP06010847 (833.534_4.2999)
UDP (606.077_0.3992)
Day 4_0Gy Day 4_8Gy
Eicosenoic acid (311.169_0.1542)
Day 4_0Gy Day 4_4Gy
LMGP06050004 (599.331_1.4042)
Day 4_0Gy Day 4_8Gy
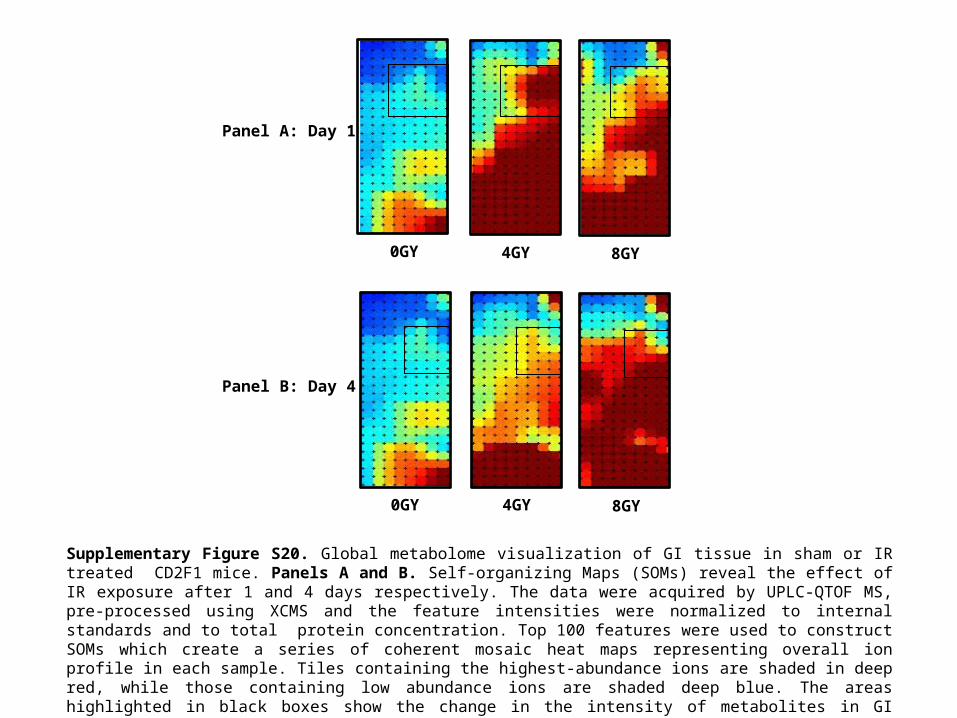
Supplementary Figure S20. Global metabolome visualization of GI tissue in sham or IR treated CD2F1 mice. Panels A and B. Self-organizing Maps (SOMs) reveal the effect of IR exposure after 1 and 4 days respectively. The data were acquired by UPLC-QTOF MS, pre-processed using XCMS and the feature intensities were normalized to internal standards and to total protein concentration. Top 100 features were used to construct SOMs which create a series of coherent mosaic heat maps representing overall ion profile in each sample. Tiles containing the highest-abundance ions are shaded in deep red, while those containing low abundance ions are shaded deep blue. The areas highlighted in black boxes show the change in the intensity of metabolites in GI tissue in a time and dose dependent manner.
Panel A: Day 1
Panel B: Day 4
0GY 4GY 8GY
0GY 4GY 8GY
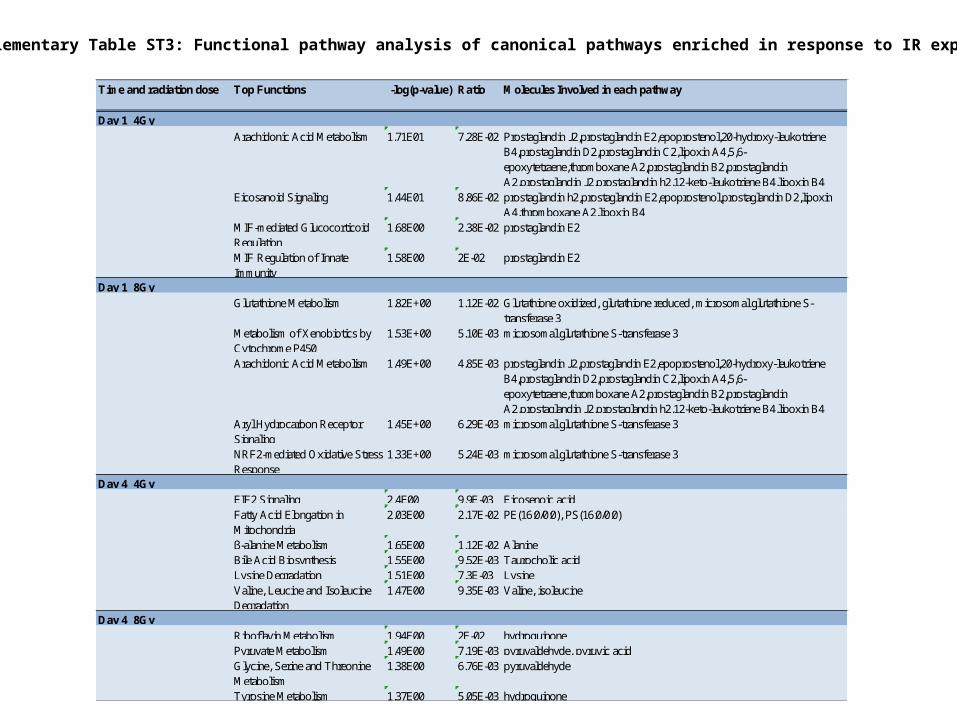
Time and radiation dose Top Functions -log(p-value) Ratio Molecules Involved in each pathway
Day 1_4Gy
Arachidonic Acid Metabolism 1.71E01 7.28E-02 Prostaglandin J2,prostaglandin E2,epoprostenol,20-hydroxy-leukotriene B4,prostaglandin D2,prostaglandin C2,lipoxin A4,5,6-epoxytetraene,thromboxane A2,prostaglandin B2,prostaglandin A2,prostaglandin J2,prostaglandin h2,12-keto-leukotriene B4,lipoxin B4
Eicosanoid Signaling 1.44E01 8.86E-02 prostaglandin h2,prostaglandin E2,epoprostenol,prostaglandin D2,lipoxin A4,thromboxane A2,lipoxin B4
MIF-mediated Glucocorticoid Regulation
1.68E00 2.38E-02 prostaglandin E2
MIF Regulation of Innate Immunity
1.58E00 2E-02 prostaglandin E2
Day 1_8GyGlutathione Metabolism 1.82E+00 1.12E-02 Glutathione oxidized, glutathione reduced, microsomal glutathione S-
transferase 3Metabolism of Xenobiotics by Cytochrome P450
1.53E+00 5.10E-03 microsomal glutathione S-transferase 3
Arachidonic Acid Metabolism 1.49E+00 4.85E-03 prostaglandin J2,prostaglandin E2,epoprostenol,20-hydroxy-leukotriene B4,prostaglandin D2,prostaglandin C2,lipoxin A4,5,6-epoxytetraene,thromboxane A2,prostaglandin B2,prostaglandin A2,prostaglandin J2,prostaglandin h2,12-keto-leukotriene B4,lipoxin B4
Aryl Hydrocarbon Receptor Signaling
1.45E+00 6.29E-03 microsomal glutathione S-transferase 3
NRF2-mediated Oxidative Stress Response
1.33E+00 5.24E-03 microsomal glutathione S-transferase 3
Day 4_4GyEIF2 Signaling 2.4E00 9.9E-03 Eicosenoic acidFatty Acid Elongation in Mitochondria
2.03E00 2.17E-02 PE(16:0/0:0), PS(16:0/0:0)
β-alanine Metabolism 1.65E00 1.12E-02 AlanineBile Acid Biosynthesis 1.55E00 9.52E-03 Taurocholic acidLysine Degradation 1.51E00 7.3E-03 LysineValine, Leucine and Isoleucine Degradation
1.47E00 9.35E-03 Valine, isoleucine
Day 4_8GyRiboflavin Metabolism 1.94E00 2E-02 hydroquinonePyruvate Metabolism 1.49E00 7.19E-03 pyruvaldehyde, pyruvic acidGlycine, Serine and Threonine Metabolism
1.38E00 6.76E-03 pyruvaldehyde
Tyrosine Metabolism 1.37E00 5.05E-03 hydroquinone
Supplementary Table ST3: Functional pathway analysis of canonical pathways enriched in response to IR exposure
B
Day 1_4Gy_KidneyDay 1_4Gy_GI
DIM 1
DIM
2
-0.0
6-0
.04
-0.0
2-0
.00
0.02
0.04
0.00 0.02 0.04-0.02-0.04
Top 50 Ions From RF – 100% Accuracy
A C
Day1_4Gy_GI Day1_4Gy_Kidney0.2 0.60.2 1
Colour Key
Number of variables
RF
Acc
ura
cy [
%]
020
4060
8010
0
60 80 1004020
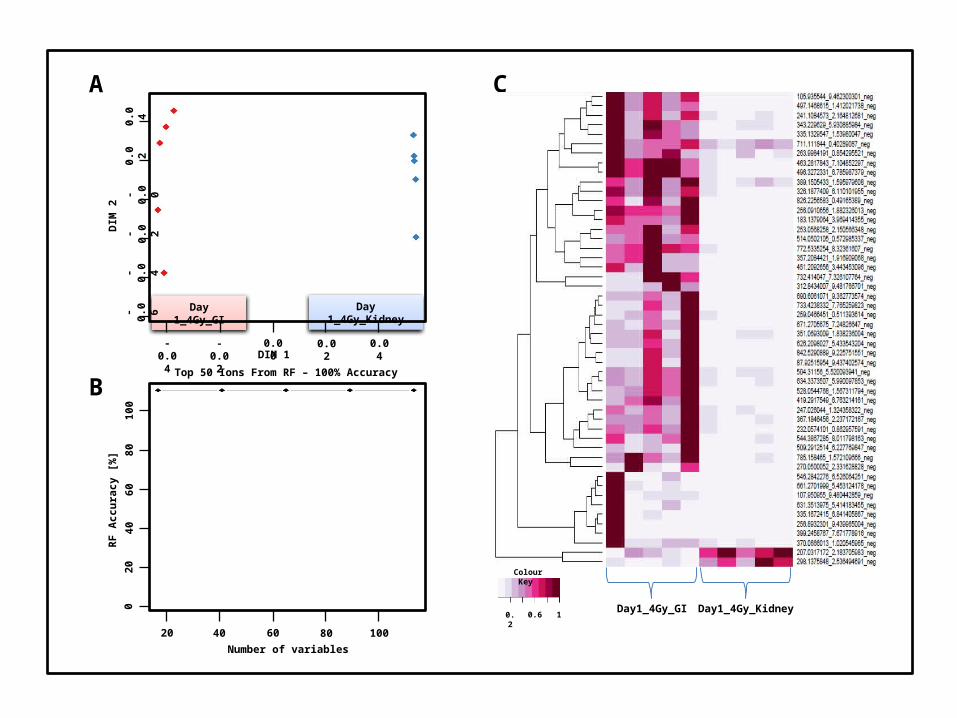
Supplementary Figure S21: UPLC-ESI-TOFMS based comparative metabolomic profiling of GI and Kidney tissue at 4 days, post-IR exposure: CD2F1 mice were either sham irradiated or exposed to 4Gy of γ radiation and euthanized after 4 days. Panel A. Two dimensional separation plot for top 50 features interrogated using Random Forests. Panel B. Normalized accuracy plot showing unambiguous separation of the two groups Panel C. Heat map visualization of feature rankings comparing relative levels in the irradiated GI and Kidney tissue. Each row represents a unique feature with a characteristic mass to charge and retention time value.
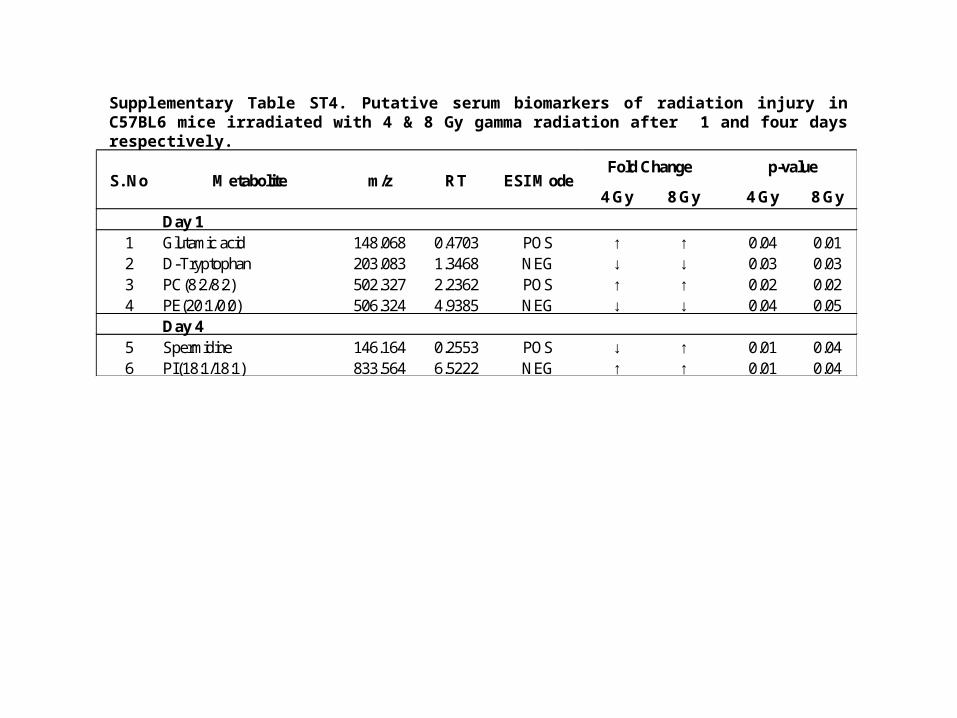
Supplementary Table ST4. Putative serum biomarkers of radiation injury in C57BL6 mice irradiated with 4 & 8 Gy gamma radiation after 1 and four days respectively.
4 Gy 8 Gy 4 Gy 8 Gy
Day 1 1 Glutamic acid 148.068 0.4703 POS ↑ ↑ 0.04 0.012 D-Tryptophan 203.083 1.3468 NEG ↓ ↓ 0.03 0.033 PC(8:2/8:2) 502.327 2.2362 POS ↑ ↑ 0.02 0.024 PE(20:1/0:0) 506.324 4.9385 NEG ↓ ↓ 0.04 0.05
Day 4 5 Spermidine 146.164 0.2553 POS ↓ ↑ 0.01 0.046 PI(18:1/18:1) 833.564 6.5222 NEG ↑ ↑ 0.01 0.04
Fold Change p-valueS. No Metabolite m/z RT ESI Mode


![[XLS] · Web view0 0.2 0.5 1 0 0.02 0.04 0.1 0.2 0.35 0.5 0.7 0.75 1 1.5 2.5 3.7 12.5 0 0.2 0.5 1 0 0.02 0.04 0.1 0.2 0.35 0.5 0.7 0.75 1 1.5 2.5 3.7 12.5 0 0.2 0.5 1 0 0.02 0.04](https://img.pdfslide.us/doc/110x75/5af0fdb97f8b9ac2468eca80/xls-view0-02-05-1-0-002-004-01-02-035-05-07-075-1-15-25-37-125-0.jpg)


![Hydrophobic interaction and hydrogen-bond network for a ...0 2 4 6 8 10 [au] simulation time [ps]-0.04-0.02 0 0.02 0.04 0.06 0.08 0 0.2 0.4 0.6 0.8 1 constraint force [au] simulation](https://img.pdfslide.us/doc/110x75/5f0ba34f7e708231d4317cb3/hydrophobic-interaction-and-hydrogen-bond-network-for-a-0-2-4-6-8-10-au-simulation.jpg)


![[XLS] · Web view0.01 734179 0.02 734195 0.04 701523 819832 0.02 720983 0.02 770833 2.5000000000000001E-3 819816 770841 5.0000000000000001E-3 819824 821624 720734 5.0000000000000001E-3](https://img.pdfslide.us/doc/110x75/5aa445417f8b9a185d8bc7e2/xls-view001-734179-002-734195-004-701523-819832-002-720983-002-770833-25000000000000001e-3.jpg)


![0.00 0.02 0.04 0.06 0.08 0.10 0.12 0.14 0.16 [A] (M) - Applications of... · 2020-02-04 · 0.00 0.02 0.04 0.06 0.08 0.10 0.12 0.14 0.16 0.0 5.0x10⁻⁷ 1.0x10⁻⁶ 1.5x10⁻⁶ 2.0x10⁻⁶ 2.5x10-6](https://img.pdfslide.us/doc/110x75/5e91edc8615c062292493193/000-002-004-006-008-010-012-014-016-a-m-applications-of-2020-02-04.jpg)