Embed Size (px)
Citation preview
Kate Swann
Managing DirectorArgos

Agenda
• Argos proposition and business model
• Financial performance
• Drivers of growth
• Agenda for growth going forward
• Summary

Proposition and Business Model
0
10
20
30
40
50
60
70
80
Conve
nienc
ePric
e
Range
Quality
Service
/ Adv
ice Other
Habit /
Inertia
Source: Argos market research
Argos: More choice, less hassle, low pricesArgos: More choice, less hassle, low prices
% of consumers
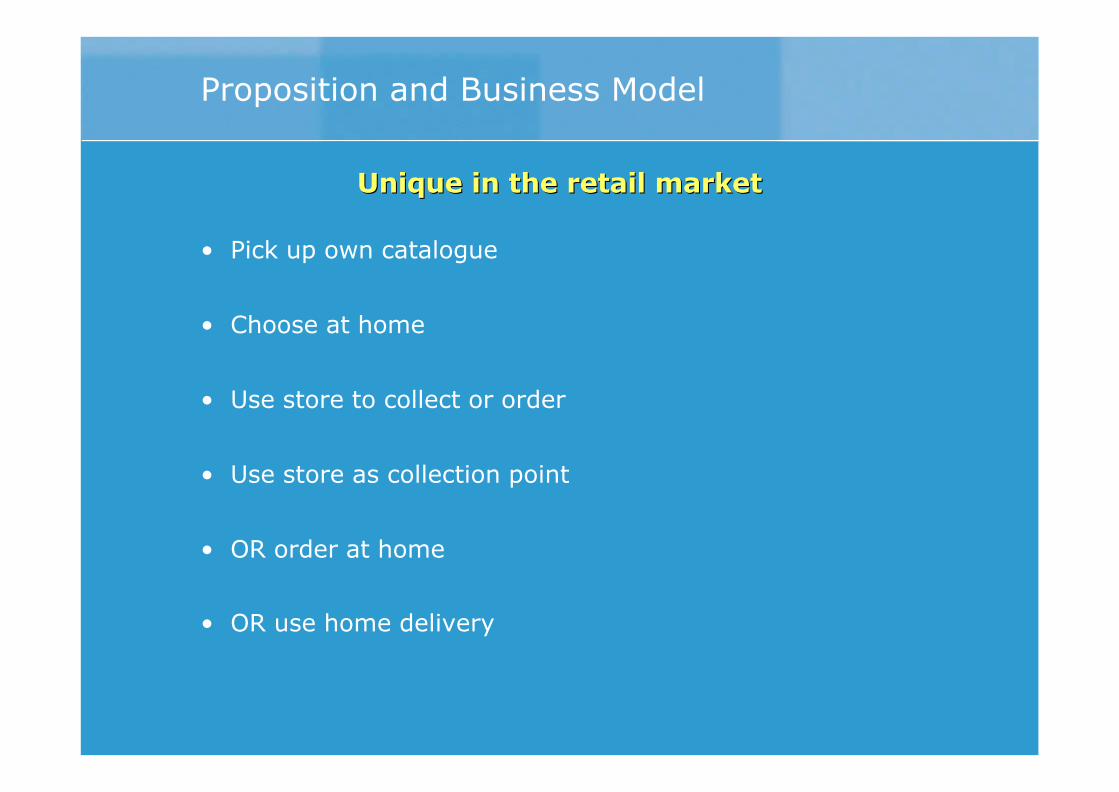
Unique in the retail marketUnique in the retail market
• Pick up own catalogue
• Choose at home
• Use store to collect or order
• Use store as collection point
• OR order at home
• OR use home delivery
Proposition and Business Model

Low cost operatorLow cost operator
• Secondary/non prime locations
• Small shop floor
• Large stockroom
• Catalogue display space
• Catalogue collection
• Daily delivery
• Lower store staff costs
• Very little shrinkage
Proposition and Business Model

0
500
1,000
1,500
2,000
2,500
98 99 00 01 H1 00 H1 01
SalesSales£m
Financial Performance
Excluding Argos Additions and jungle.com
Year to March
+3%+7%
+11%
+14%+17%

0
20
40
60
80
100
120
140
160
180
98 99 00 01
Financial Performance
Operating profitOperating profit£m
Year to March
-4%+14%
+22%
Excluding Argos Additions and jungle.com
0
10
20
30
40
50
60
70
80
98 99 00 01
%
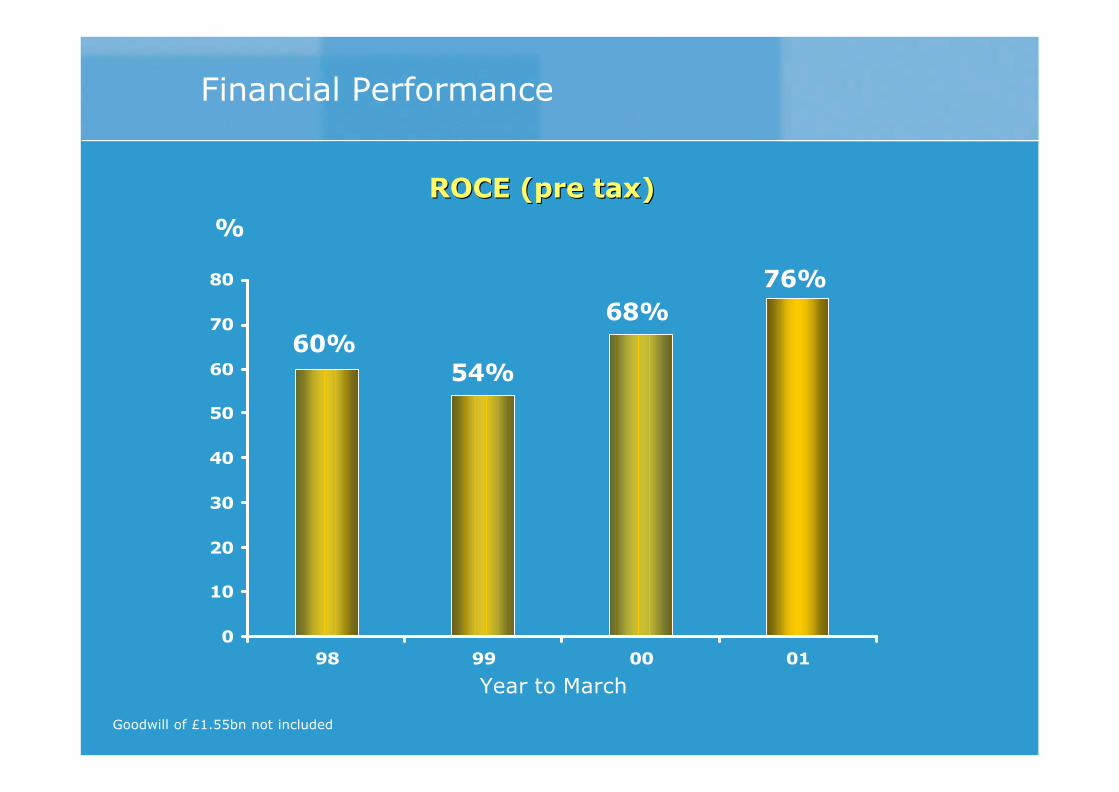
Financial Performance
ROCE (pre tax)ROCE (pre tax)
Year to March
54%60%
68%76%
Goodwill of £1.55bn not included

0
2
4
6
8
10
12
14
16
18
20
Source: British Retail Consortium non-food, non-clothing sales
Financial Performance
Argos sales growth rate Argos sales growth rate continues to be above marketcontinues to be above market
Others (excl. Argos)Argos
Eight week rolling growth
2000 2001
% growth
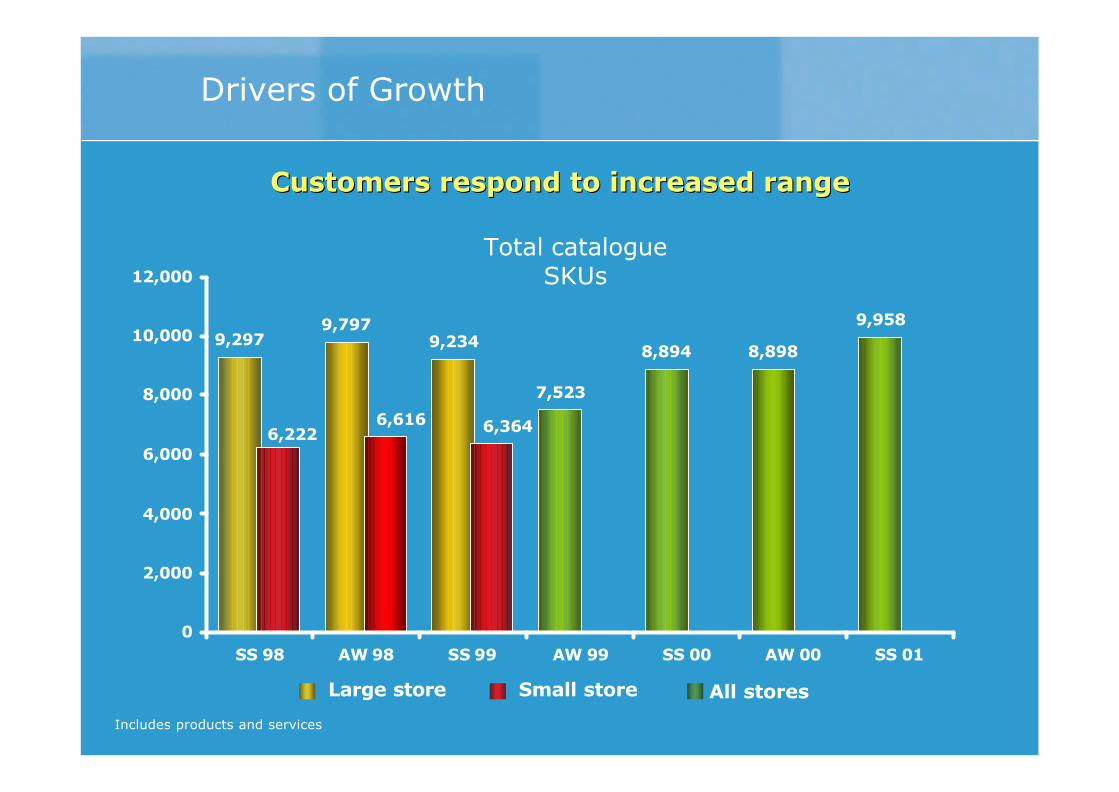
9,2979,797
9,234
7,523
8,894 8,898
9,958
6,3646,6166,222
0
2,000
4,000
6,000
8,000
10,000
12,000
SS 98 AW 98 SS 99 AW 99 SS 00 AW 00 SS 01
Total catalogue SKUs
Customers respond to increased rangeCustomers respond to increased range
Drivers of Growth
Small storeLarge store All stores
Includes products and services
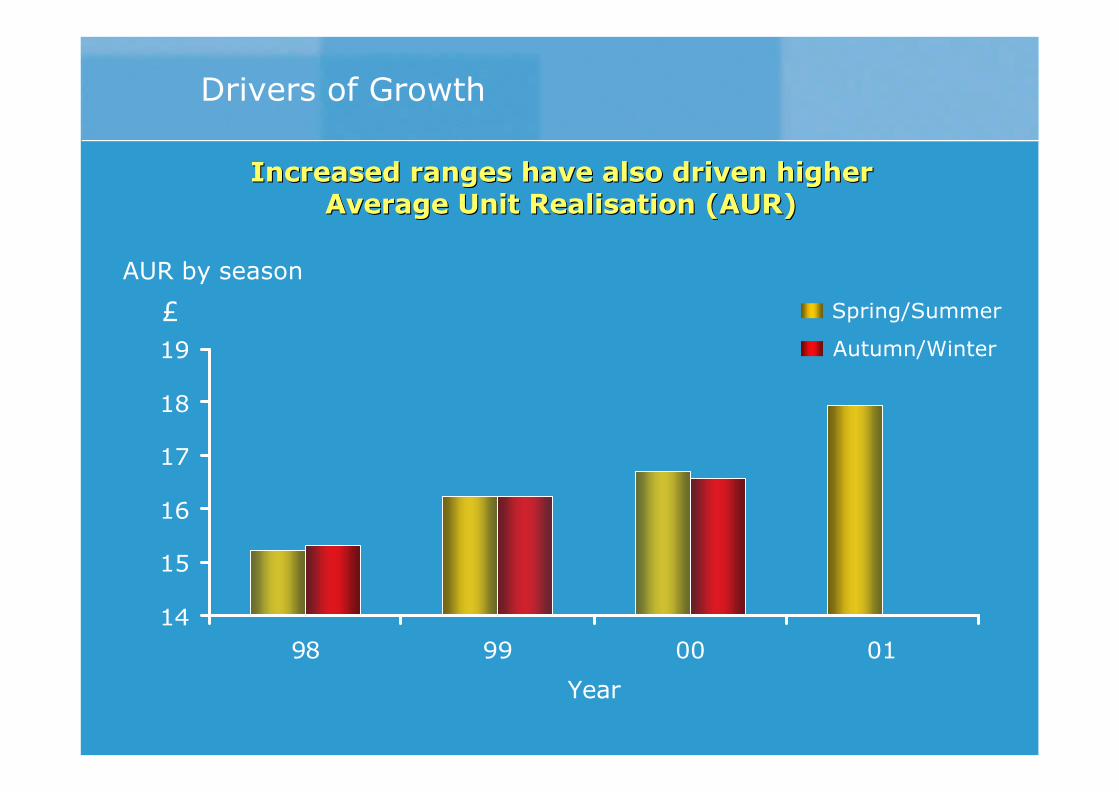
14
15
16
17
18
19
98 99 00 01
AUR by season
Spring/Summer
Autumn/Winter
Increased ranges have also driven higher Increased ranges have also driven higher Average Unit Realisation (AUR)Average Unit Realisation (AUR)
Drivers of Growth
£
Year
Drivers of Growth
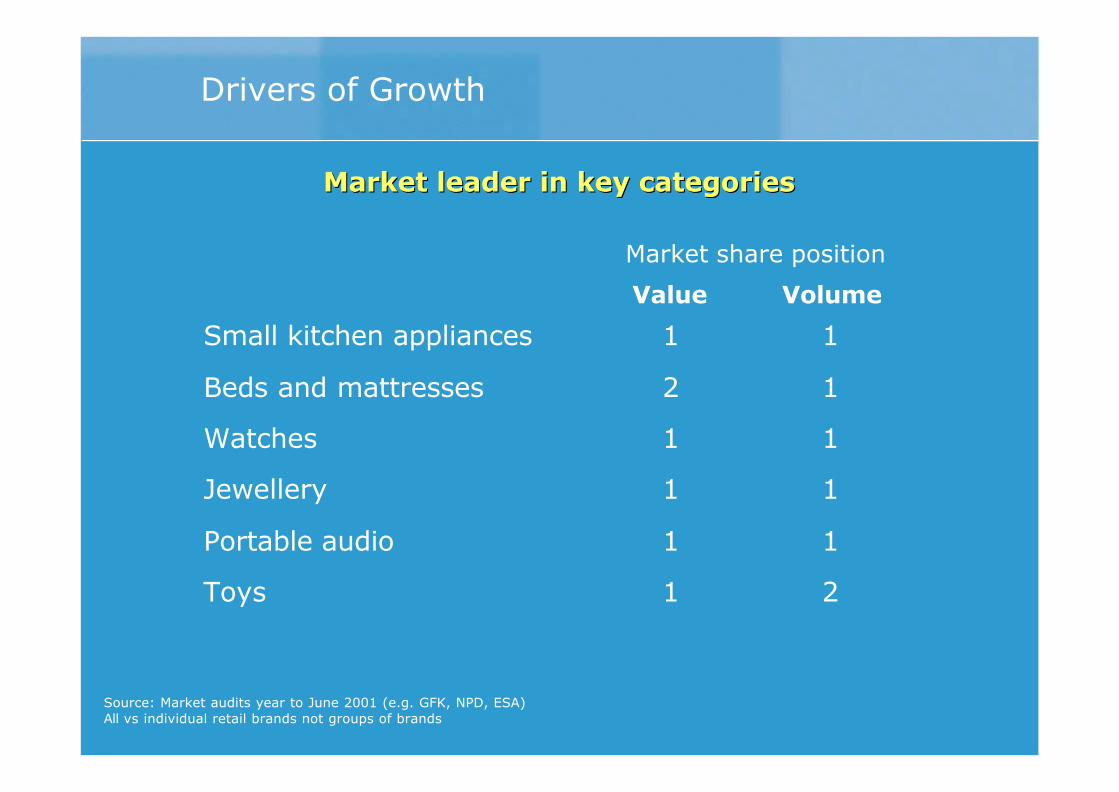
Value Volume
Small kitchen appliances 1 1
Beds and mattresses 2 1
Watches 1 1
Jewellery 1 1
Portable audio 1 1
Toys 1 2
Source: Market audits year to June 2001 (e.g. GFK, NPD, ESA)All vs individual retail brands not groups of brands
Market leader in key categoriesMarket leader in key categories
Market share position
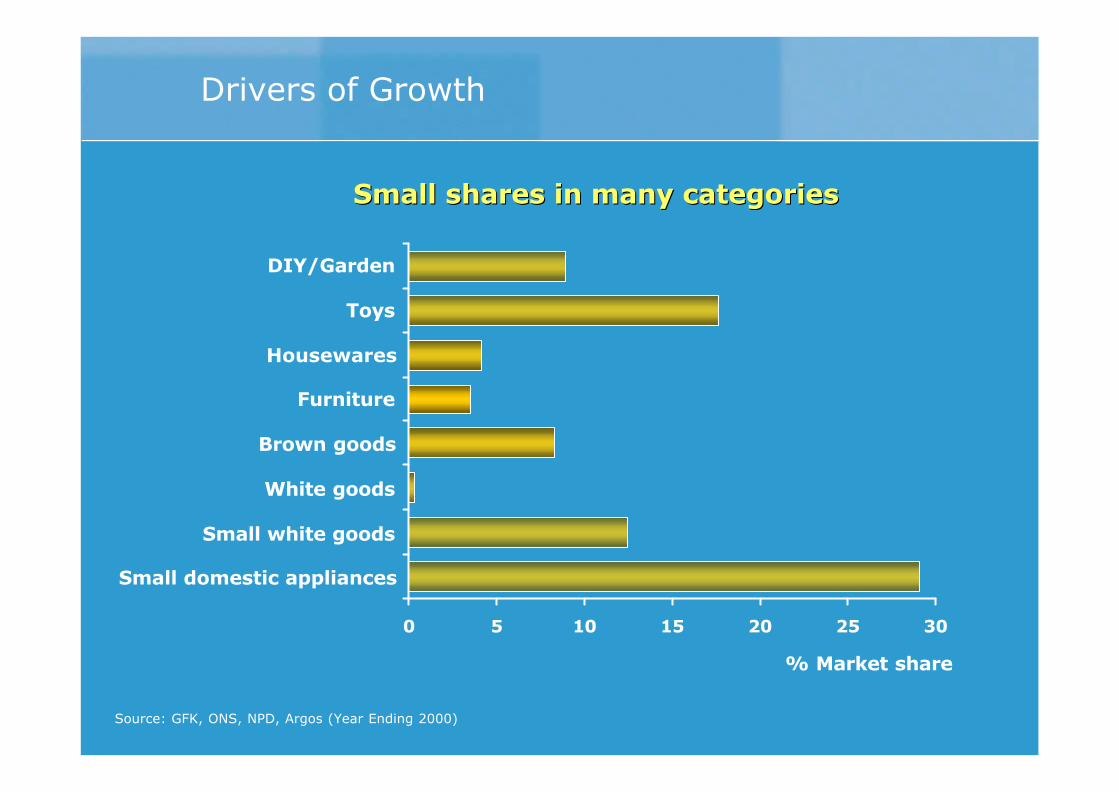
Source: GFK, ONS, NPD, Argos (Year Ending 2000)
0 5 10 15 20 25 30
% Market share
DIY/Garden
Toys
Housewares
Furniture
Brown goods
White goods
Small white goods
Small domestic appliances
Drivers of Growth
Small shares in many categoriesSmall shares in many categories

Investment to improve the shopping experienceInvestment to improve the shopping experience
Drivers of Growth

July 99 - July 00- +/-June 00 June 01
Modern 77 79 +2
Cares about my needs 52 55 +3
Always has new ideas 50 52 +2
Changing for better 48 51 +3
Exciting 23 24 +1
Dull 15 15 -
Source: Core track October 2001
Drivers of Growth
Argos imagery - total agreement (all respondents)
Improved consumer perceptionImproved consumer perception

Serviceability %
7696 97 98 99 00 01*
78
80
82
84
86
88
90
Drivers of Growth
Serviceability has fallen as demand has risenServiceability has fallen as demand has risen
Serviceability is defined as value of sales as % of total sales demand
Year* Estimate

• 13 stores opened in last 12 months
• Easily exceeding IRR targets of 10% post tax
• Stand alone stores and multistore towns have exceeded
targets
• Fit out costs of these stores have fallen by over 20%
Drivers of Growth
Performance of new stores exceeded expectationsPerformance of new stores exceeded expectations

Argos Stores In Cambridge
0 0.5 1
miles
A1307
A1309
A11
34
A1303
A603
A1307
A11
34
A1303
A14Cambridge Retail ParkCambridge Retail ParkCambridge Retail ParkCambridge Retail ParkCambridge Retail ParkCambridge Retail ParkCambridge Retail ParkCambridge Retail ParkCambridge Retail Park
Cambridge city ctrCambridge city ctrCambridge city ctrCambridge city ctrCambridge city ctrCambridge city ctrCambridge city ctrCambridge city ctrCambridge city ctr
Cambridge Cambridge multistoremultistore towntown
• One mile
apart
• One store
sales = c.£6m
• Two stores
sales = c.£12m
Drivers of Growth
Cambridge city centre
Cambridge retail park
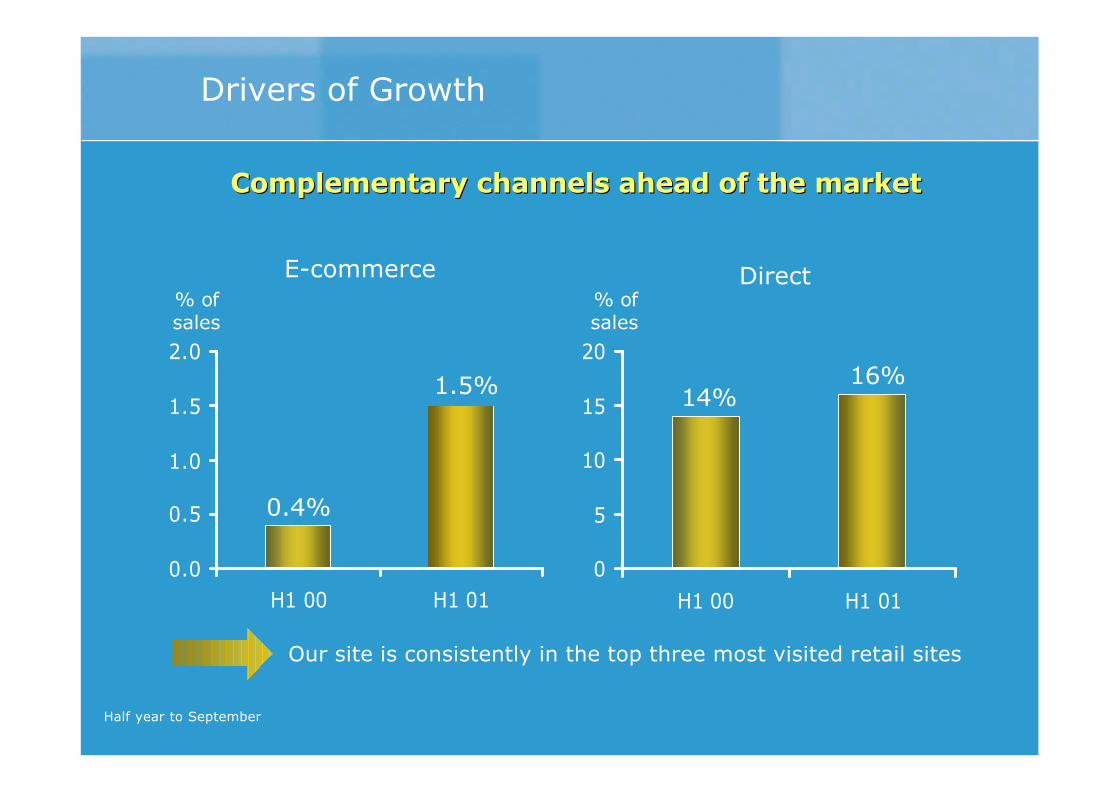
Complementary channels ahead of the marketComplementary channels ahead of the market
Our site is consistently in the top three most visited retail sites
Drivers of Growth
E-commerce Direct
0.0
0.5
1.0
1.5
2.0
H1 00 H1 010
5
10
15
20
H1 00 H1 01
0.4%
1.5% 14%16%
% ofsales
% ofsales
Half year to September
7
1214
0
2
4
6
8
10
12
14
16
00 01 02*
0
200
400
600
800
1,000
1,200
1,400
1,600
98 99 00 01 02Year
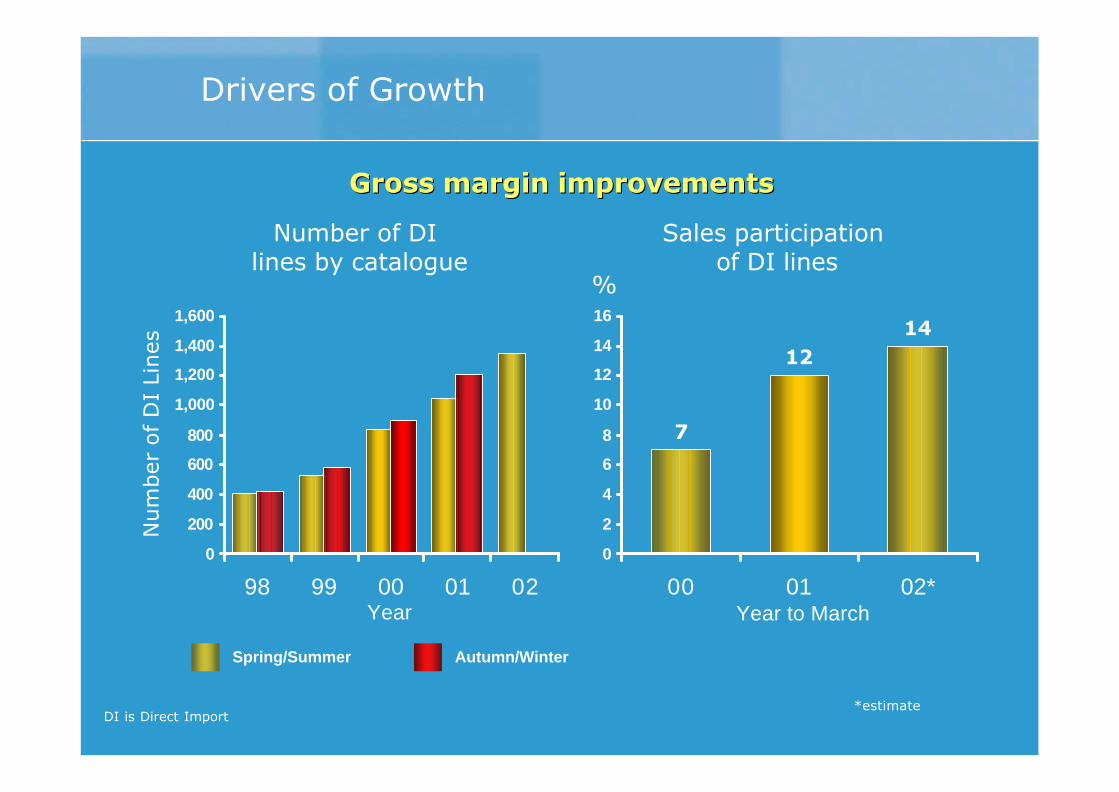
Drivers of Growth
Gross margin improvementsGross margin improvements
*estimateDI is Direct Import
Spring/Summer Autumn/Winter
Number of DI lines by catalogue
Num
ber
of D
I Li
nes
Sales participation of DI lines
%
Year to March
Agenda for Growth
Key opportunitiesKey opportunities
• Small shares
• More choice
• Invest in infrastructure
• Improve serviceability
• Broaden our franchise
• Enhance store convenience
• Develop convenience based channels
• Maintain strong value perception
Agenda for Growth
• Stores supply chain
• Argos Direct infrastructure and proposition
• New stores
• Improved in-store experience
• Extra range
Key initiativesKey initiatives