Embed Size (px)
Citation preview
An introduction
April 2011
1© CHARTER 2011
Contents
1. Introduction to Charter
2. ESAB
3. Howden
4. Charter – financial highlights
5. Appendices
• Charter Chairman and CEO biographies
• Manufacturing locations
2© CHARTER 2011
Further information is available at www.charter.ie
Introduction to Charter
Charter International plc has two international engineering businesses, one focused on welding, cutting and automation (‘ESAB’), and the other on air and gas handling (‘Howden’).
3© CHARTER 2011
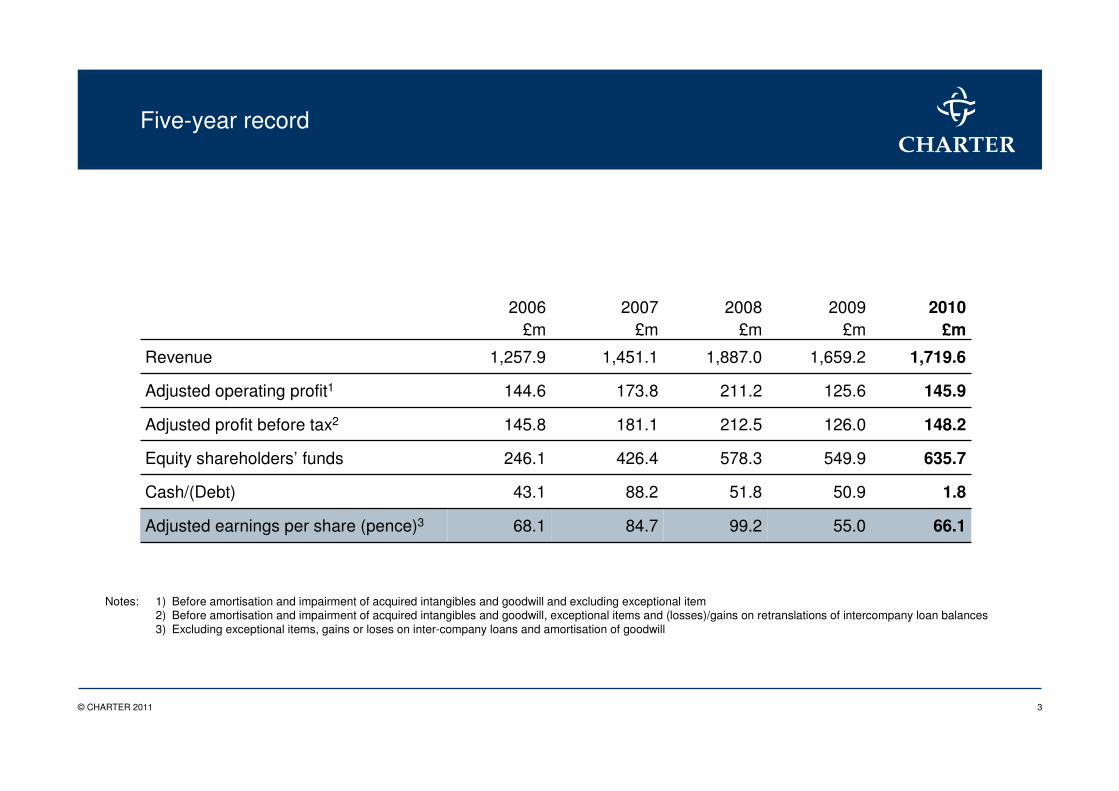
Five-year record
Notes: 1) Before amortisation and impairment of acquired intangibles and goodwill and excluding exceptional item2) Before amortisation and impairment of acquired intangibles and goodwill, exceptional items and (losses)/gains on retranslations of intercompany loan balances3) Excluding exceptional items, gains or loses on inter-company loans and amortisation of goodwill
55.0
50.9
549.9
126.0
125.6
1,659.2
2009£m
66.1
1.8
635.7
148.2
145.9
1,719.6
2010£m
99.2
51.8
578.3
212.5
211.2
1,887.0
2008£m
84.768.1Adjusted earnings per share (pence)3
88.243.1Cash/(Debt)
426.4246.1Equity shareholders’ funds
181.1145.8Adjusted profit before tax2
173.8144.6Adjusted operating profit1
1,451.1
2007£m
1,257.9Revenue
2006£m
4© CHARTER 2011
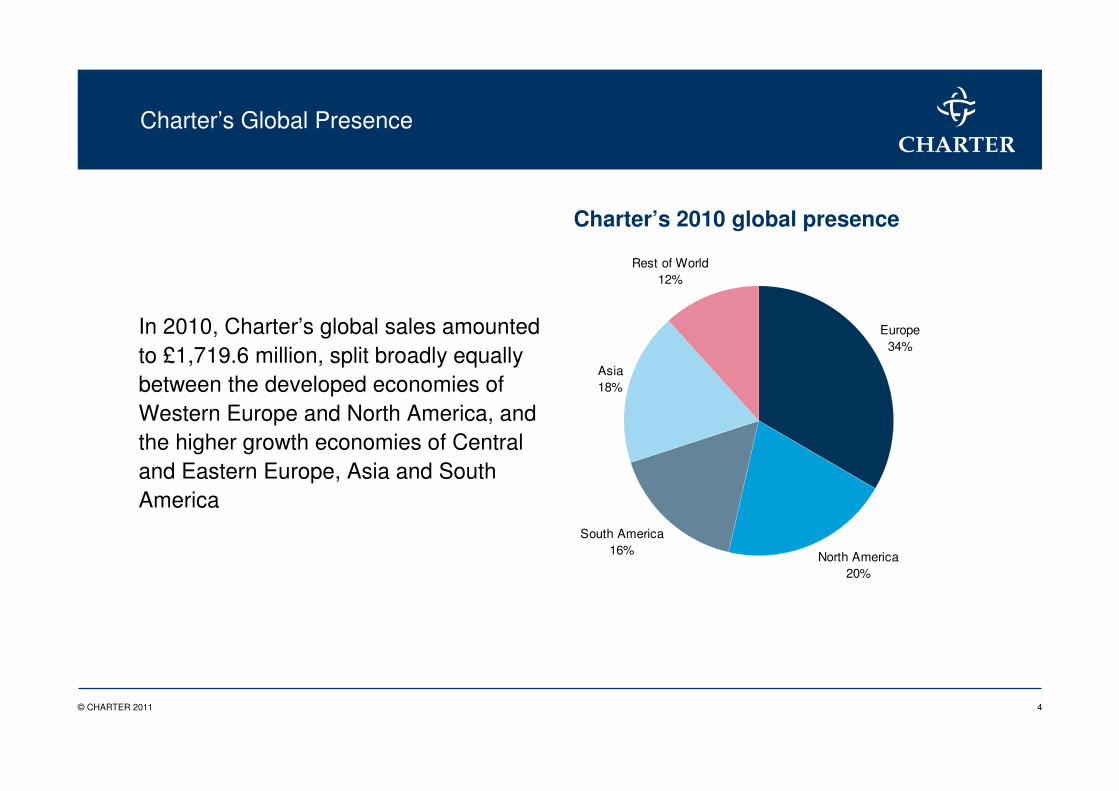
Charter’s Global Presence
In 2010, Charter’s global sales amounted to £1,719.6 million, split broadly equally between the developed economies of Western Europe and North America, and the higher growth economies of Central and Eastern Europe, Asia and South America
Charter’s 2010 global presence
Europe34%
North America20%
South America16%
Asia18%
Rest of World12%
5© CHARTER 2011
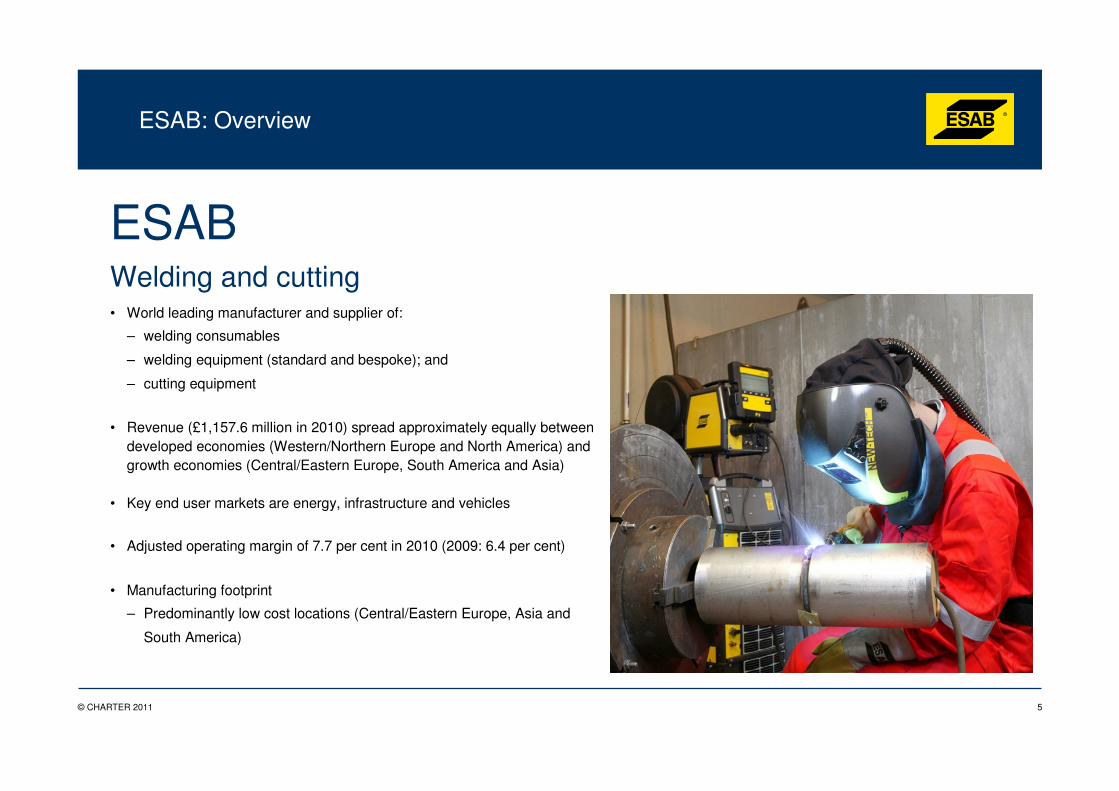
ESAB: Overview
• World leading manufacturer and supplier of:
– welding consumables
– welding equipment (standard and bespoke); and
– cutting equipment
• Revenue (£1,157.6 million in 2010) spread approximately equally between developed economies (Western/Northern Europe and North America) and growth economies (Central/Eastern Europe, South America and Asia)
• Key end user markets are energy, infrastructure and vehicles
• Adjusted operating margin of 7.7 per cent in 2010 (2009: 6.4 per cent)
• Manufacturing footprint
– Predominantly low cost locations (Central/Eastern Europe, Asia and
South America)
ESABWelding and cutting
6© CHARTER 2011
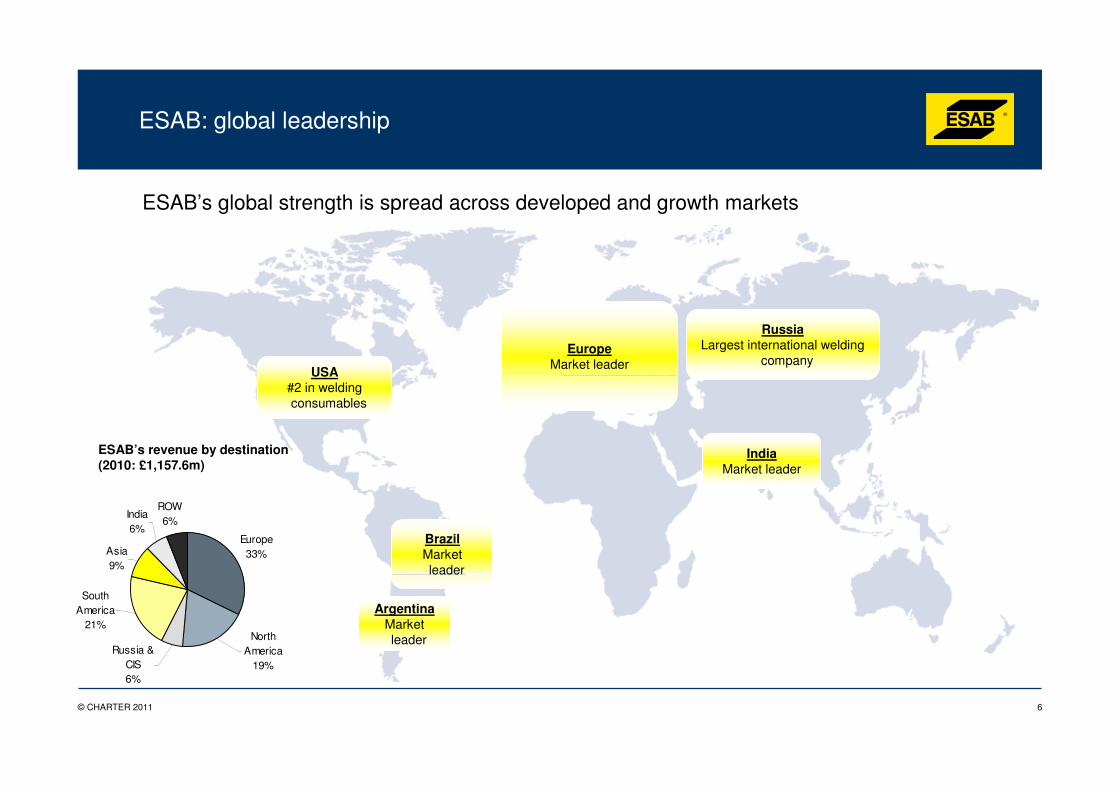
ESAB’s global strength is spread across developed and growth markets
USA#2 in welding consumables
ArgentinaMarket leader
BrazilMarket leader
EuropeMarket leader
RussiaLargest international welding
company
IndiaMarket leader
ESAB’s revenue by destination (2010: £1,157.6m)
ESAB: global leadership
Europe33%Asia
9%
India6%
ROW6%
South America
21%
Russia & CIS6%
North America
19%
7© CHARTER 2011
“To be the global leader, to be our customers’ preferred partner and the global authority in welding and cutting”
Our Vision
ESAB: vision
8© CHARTER 2011
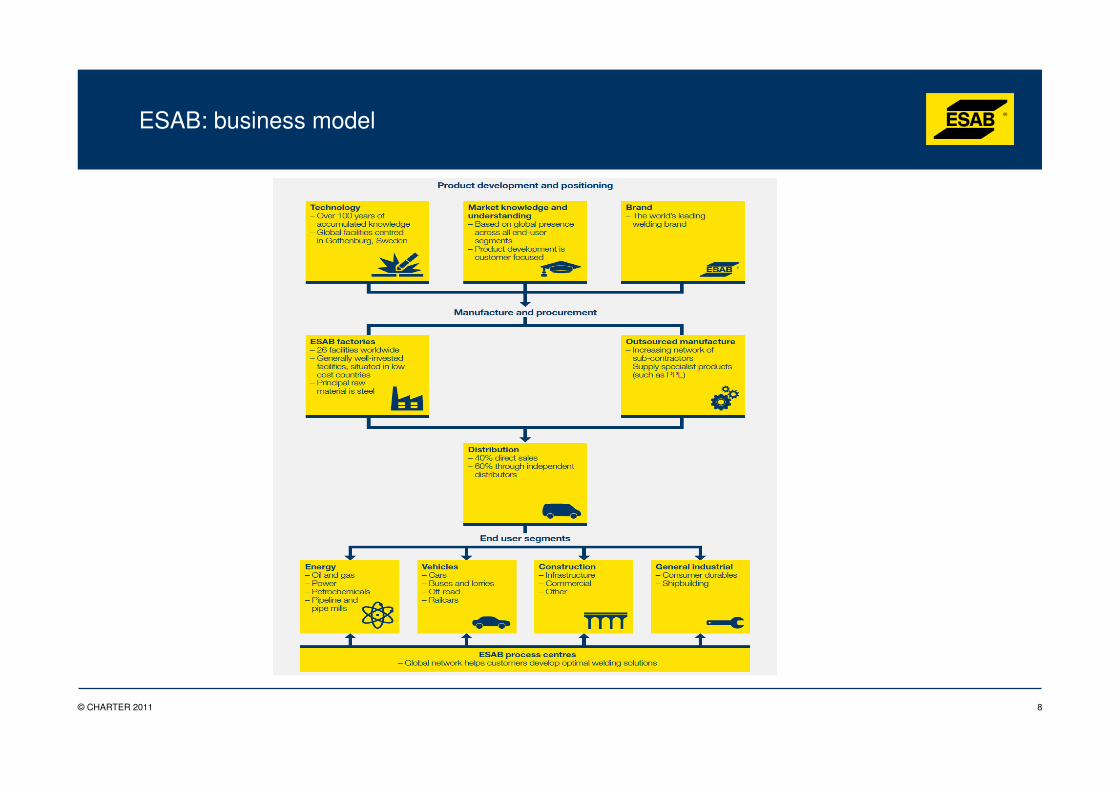
ESAB: business model
9© CHARTER 2011
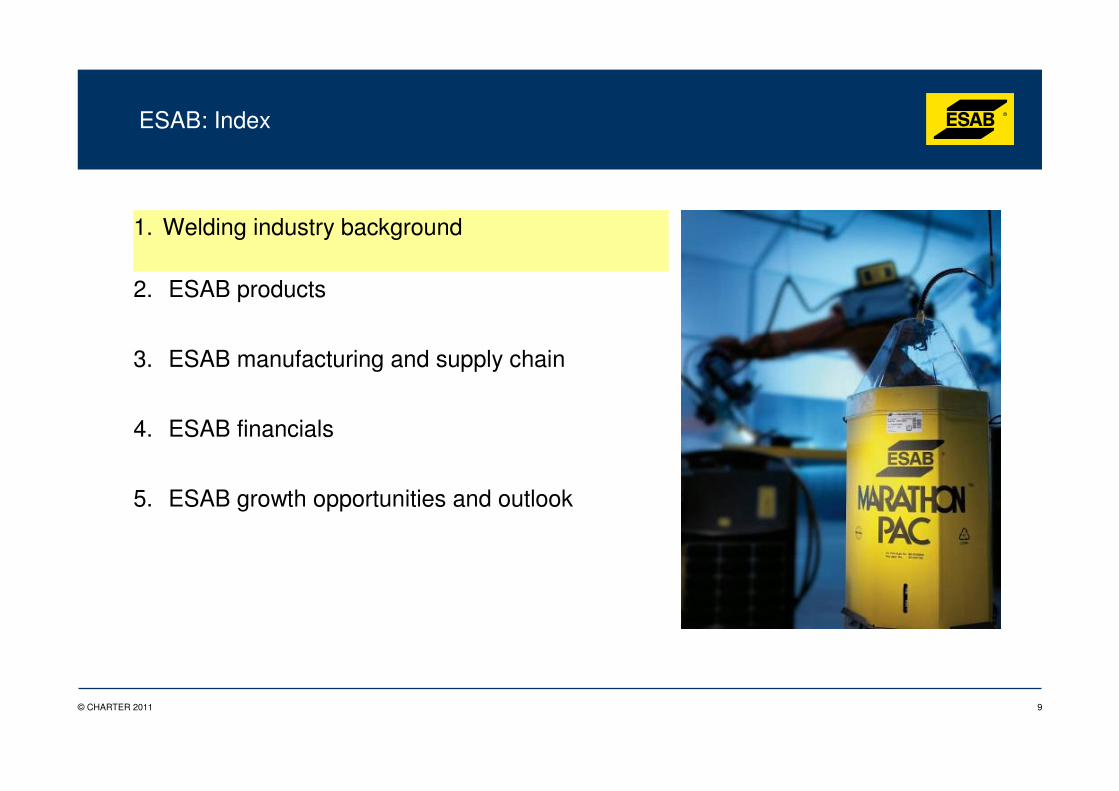
ESAB: Index
1. Welding industry background
3. ESAB manufacturing and supply chain
2. ESAB products
4. ESAB financials
5. ESAB growth opportunities and outlook
10© CHARTER 2011
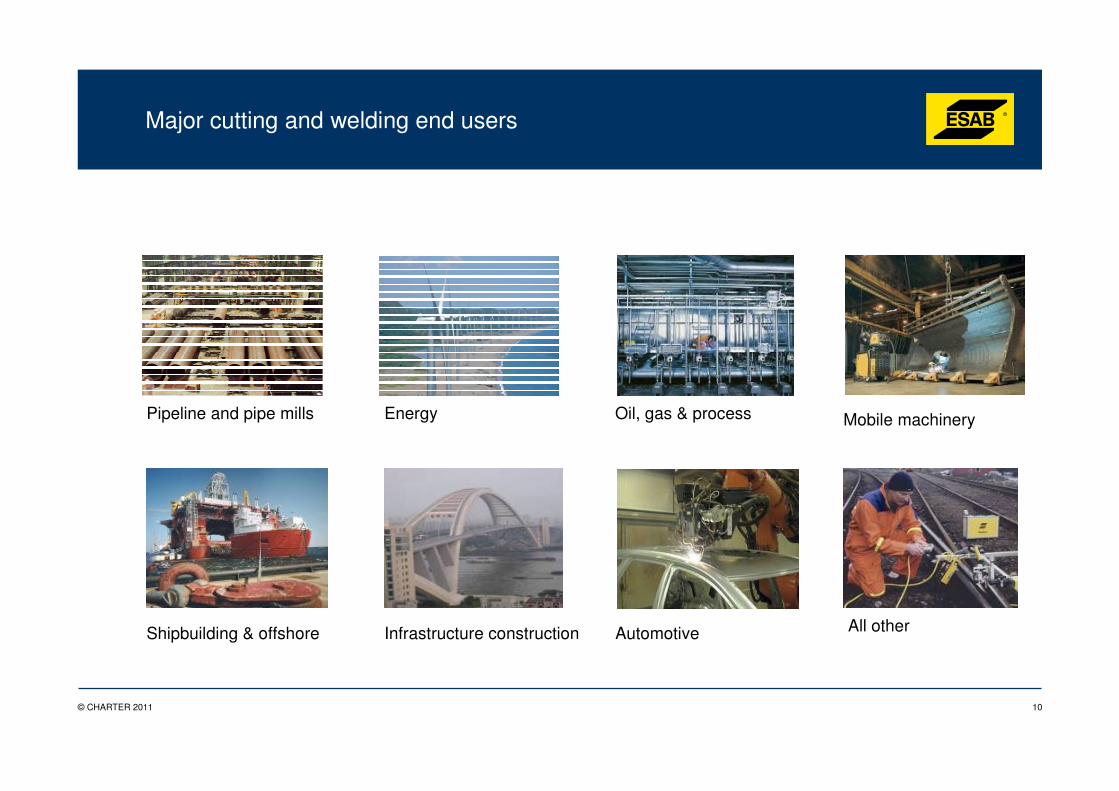
Major cutting and welding end users
Mobile machinery
All otherAutomotiveInfrastructure constructionShipbuilding & offshore
Oil, gas & process EnergyPipeline and pipe mills
11© CHARTER 2011
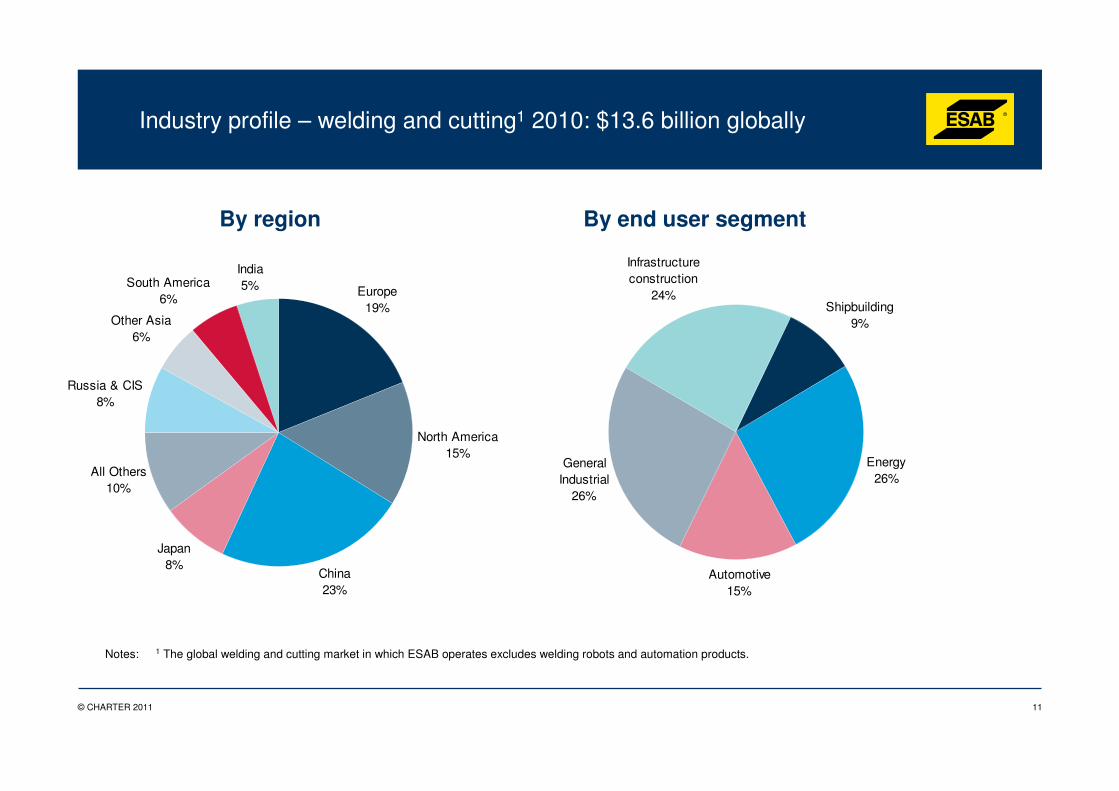
Europe19%
North America15%
China23%
Japan8%
All Others10%
Russia & CIS8%
Other Asia6%
South America6%
India5%
Industry profile – welding and cutting1 2010: $13.6 billion globally
By region By end user segment
Notes: 1 The global welding and cutting market in which ESAB operates excludes welding robots and automation products.
Infrastructure construction
24%Shipbuilding
9%
Energy26%
Automotive15%
General Industrial
26%
12© CHARTER 2011
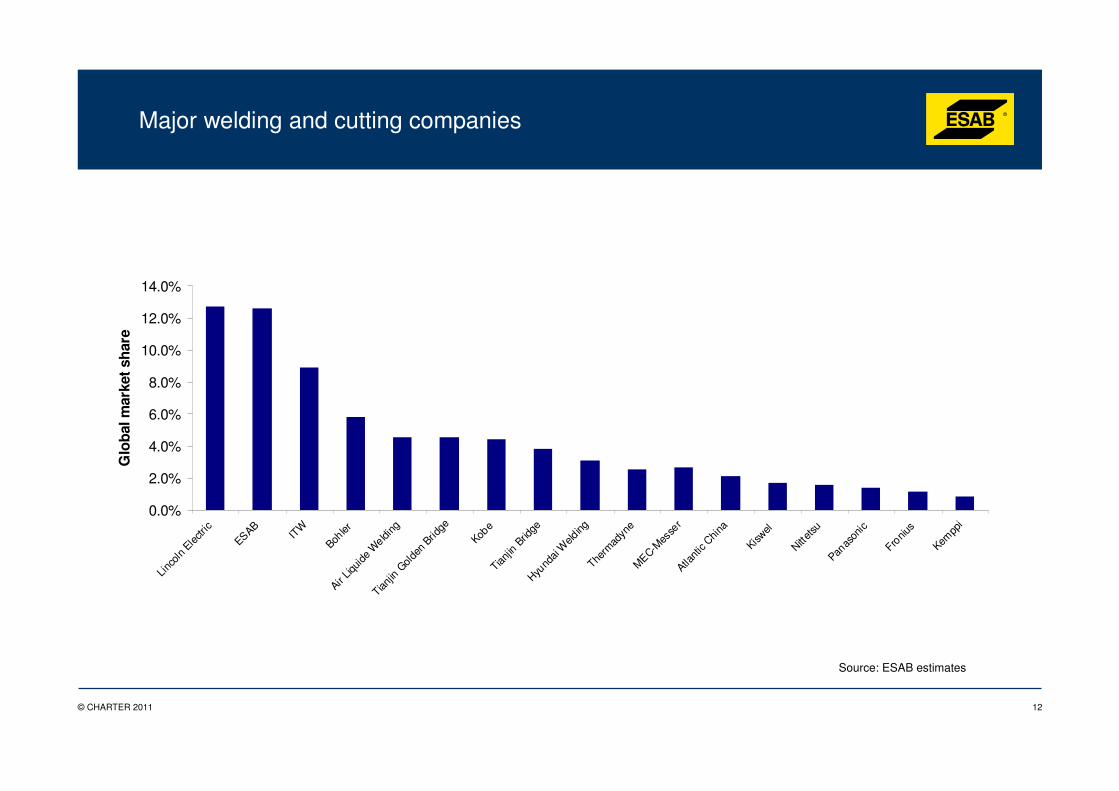
Major welding and cutting companies
Source: ESAB estimates
0.0%
2.0%
4.0%
6.0%
8.0%
10.0%
12.0%
14.0%
Linc
oln
Electr
ic
ESAB
ITW
Bohler
Air Liq
uide
Weldi
ng
Tianjin
Gol
den
Bridge
Kobe
Tianjin
Brid
geHyu
ndai
Weld
ingThe
rmad
yne
MEC-M
esse
rAtla
ntic
China
Kiswel
Nittets
u
Panas
onic
Froniu
s
Kempp
i
Glo
bal
mar
ket
shar
e
13© CHARTER 2011
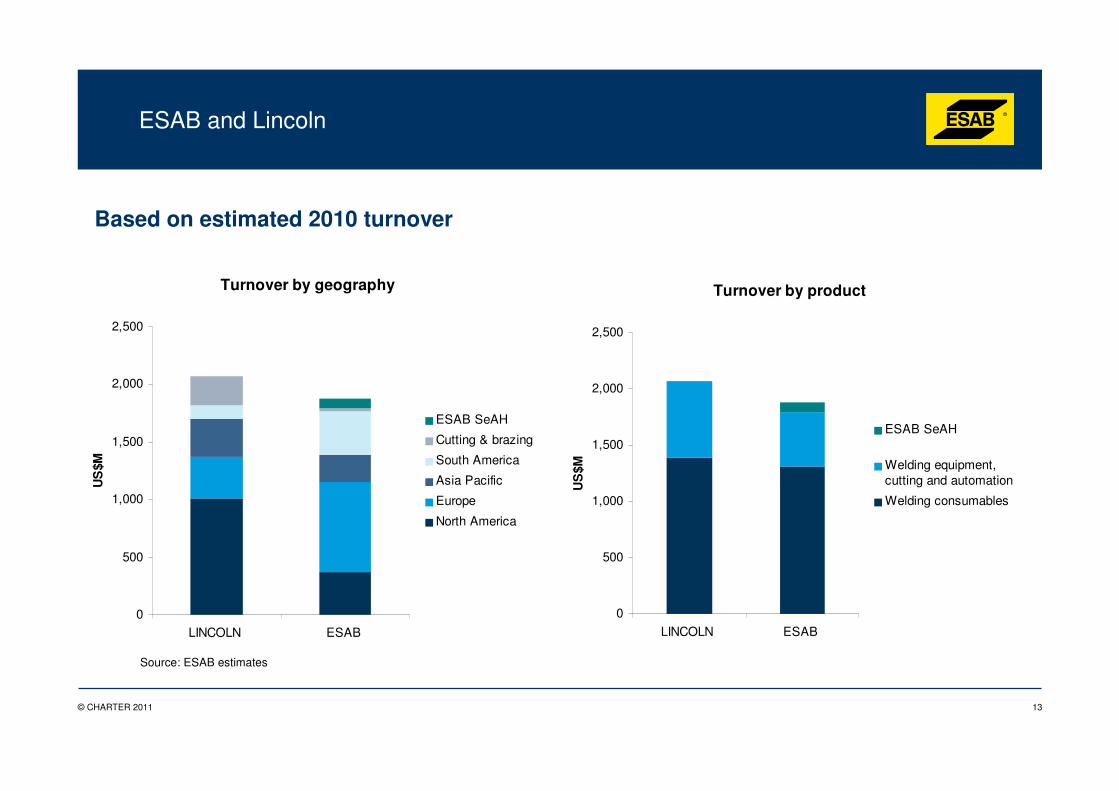
ESAB and Lincoln
Based on estimated 2010 turnover
Source: ESAB estimates
Turnover by geography
0
500
1,000
1,500
2,000
2,500
LINCOLN ESAB
US
$M
ESAB SeAH
Cutting & brazing
South America
Asia Pacific
Europe
North America
Turnover by product
0
500
1,000
1,500
2,000
2,500
LINCOLN ESAB
US
$M
ESAB SeAH
Welding equipment,cutting and automation
Welding consumables
14© CHARTER 2011
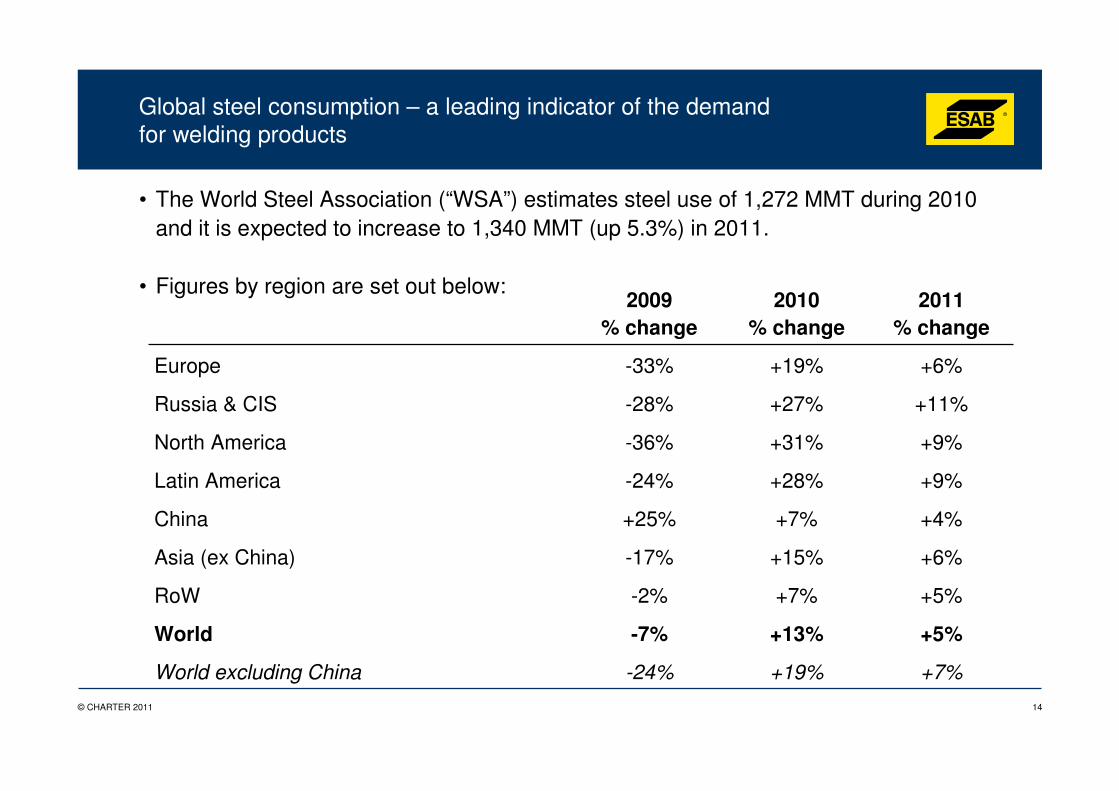
Global steel consumption – a leading indicator of the demand for welding products
• The World Steel Association (“WSA”) estimates steel use of 1,272 MMT during 2010 and it is expected to increase to 1,340 MMT (up 5.3%) in 2011.
• Figures by region are set out below:
+9%+28%-24%Latin America
+9%+31%-36%North America
+11%+27%-28%Russia & CIS
2009% change
2010% change
2011% change
Europe -33% +19% +6%
China +25% +7% +4%
Asia (ex China) -17% +15% +6%
RoW -2% +7% +5%
World -7% +13% +5%
World excluding China -24% +19% +7%
15© CHARTER 2011
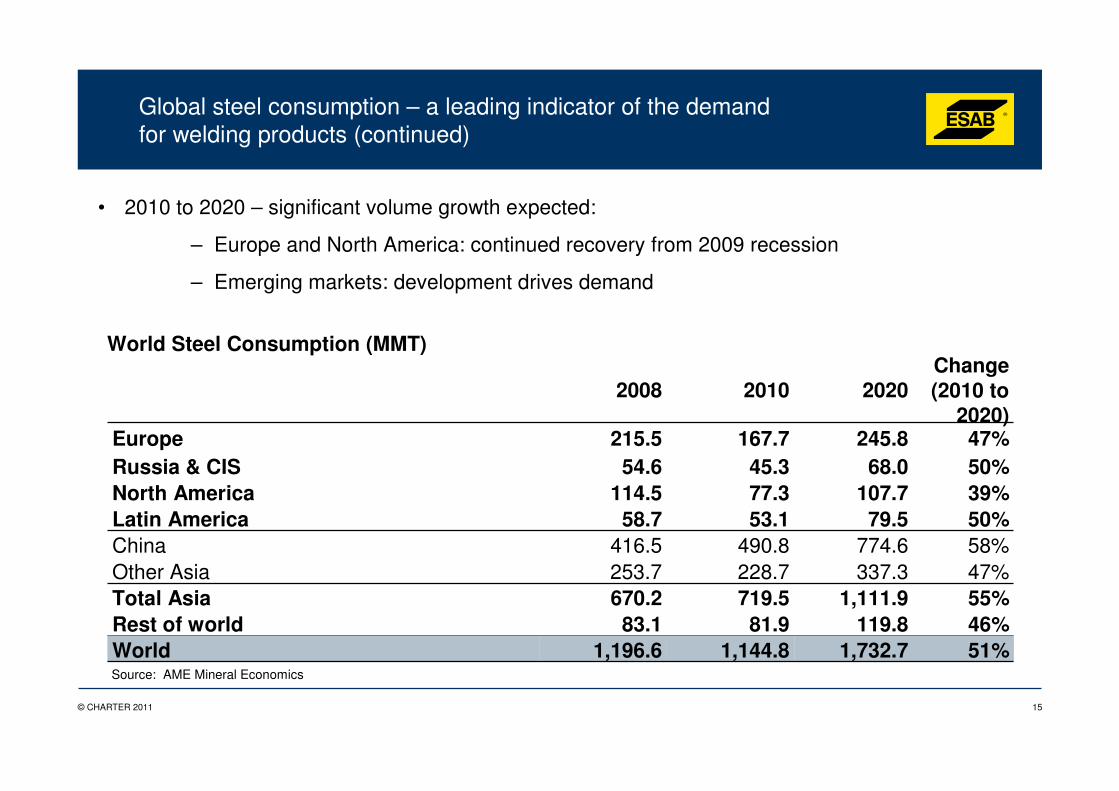
World Steel Consumption (MMT)
2008 2010 2020Change (2010 to
2020)Europe 215.5 167.7 245.8 47%Russia & CIS 54.6 45.3 68.0 50%North America 114.5 77.3 107.7 39%Latin America 58.7 53.1 79.5 50%China 416.5 490.8 774.6 58%Other Asia 253.7 228.7 337.3 47%Total Asia 670.2 719.5 1,111.9 55%Rest of world 83.1 81.9 119.8 46%World 1,196.6 1,144.8 1,732.7 51%
• 2010 to 2020 – significant volume growth expected:
– Europe and North America: continued recovery from 2009 recession
– Emerging markets: development drives demand
Source: AME Mineral Economics
Global steel consumption – a leading indicator of the demand for welding products (continued)

16© CHARTER 2011
ESAB: Index
1. Welding industry background
3. ESAB manufacturing and supply chain
2. ESAB products
4. ESAB financials
5. ESAB growth opportunities and outlook
17© CHARTER 2011
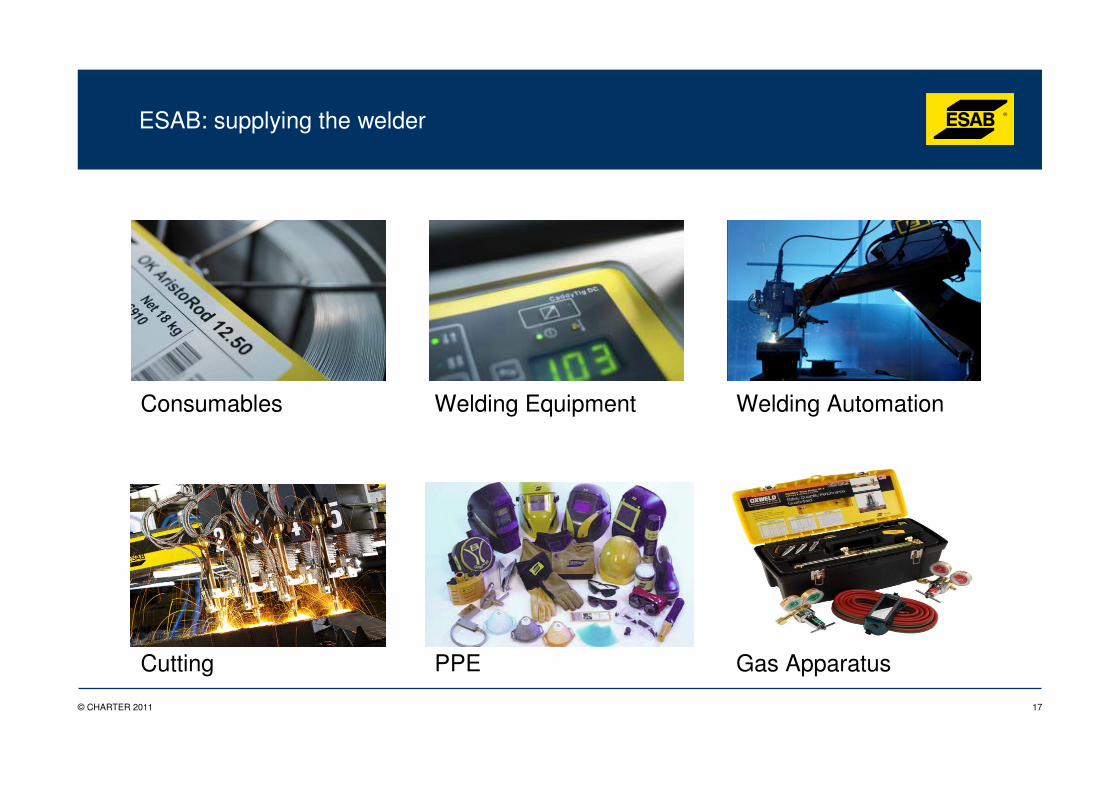
Welding Equipment Welding Automation
Gas Apparatus
Consumables
PPECutting
ESAB: supplying the welder
18© CHARTER 2011
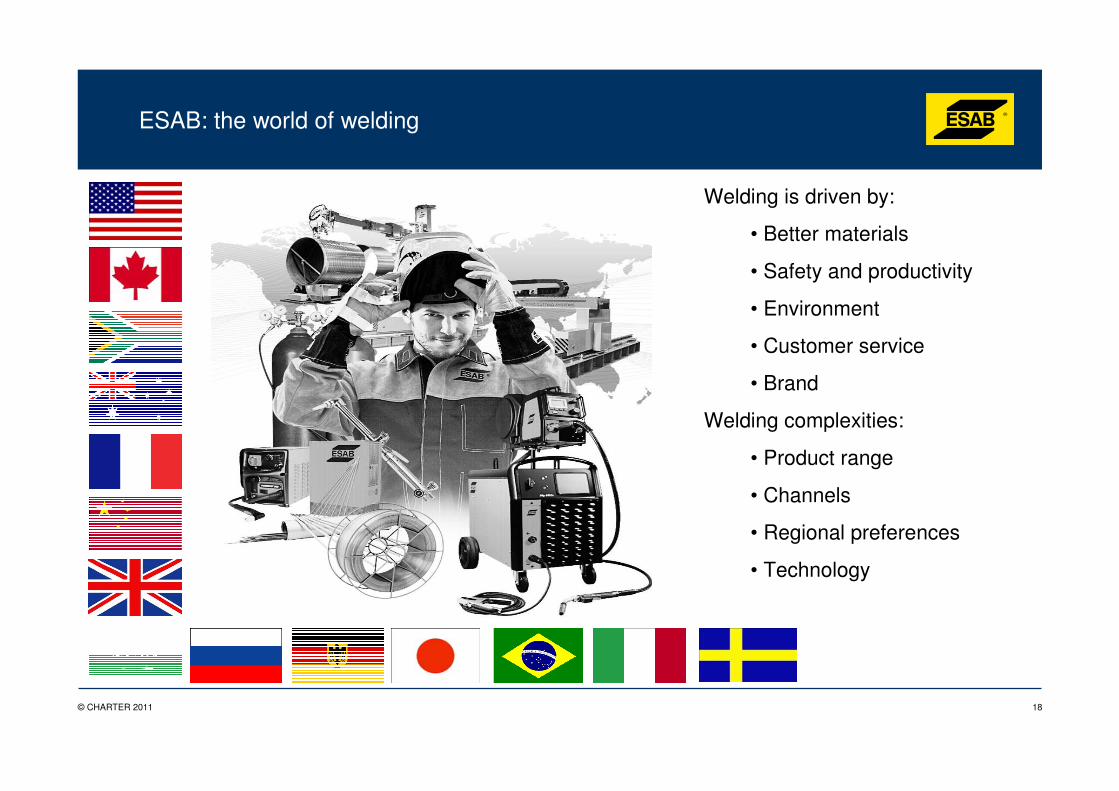
Welding is driven by:
• Better materials
• Safety and productivity
• Environment
• Customer service
• Brand
Welding complexities:
• Product range
• Channels
• Regional preferences
• Technology
ESAB: the world of welding
19© CHARTER 2011
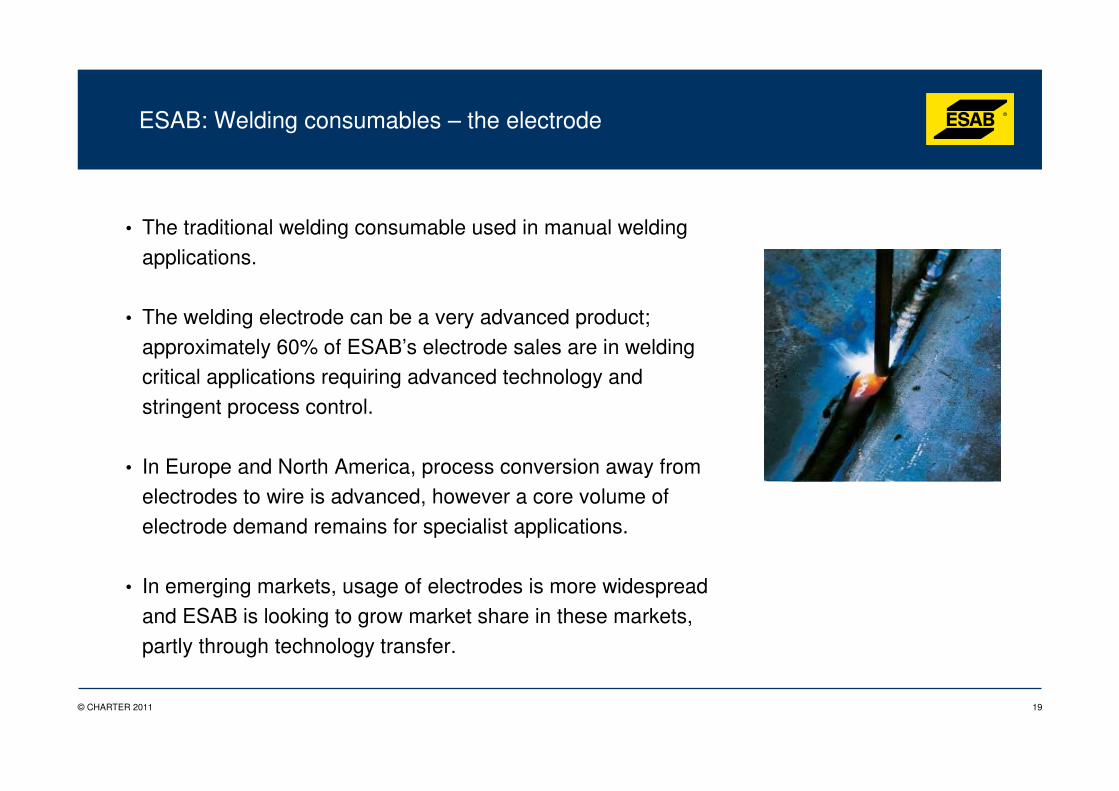
ESAB: Welding consumables – the electrode
• The traditional welding consumable used in manual welding
applications.
• The welding electrode can be a very advanced product;
approximately 60% of ESAB’s electrode sales are in welding critical applications requiring advanced technology and
stringent process control.
• In Europe and North America, process conversion away from electrodes to wire is advanced, however a core volume of
electrode demand remains for specialist applications.
• In emerging markets, usage of electrodes is more widespread
and ESAB is looking to grow market share in these markets,
partly through technology transfer.

20© CHARTER 2011
ESAB: Welding consumables – welding wire
• The welding consumable used in automated welding applications.
• Includes solid wires, and also flux-cored wires.
• A more standardised product than electrodes, but
ESAB has developed a range of technologically advanced proprietary products.
• The Marathon PacTM wire delivery system can offer
truly non-stop production in robot applications, such as automotive production lines.
21© CHARTER 2011
Source: ESAB estimates
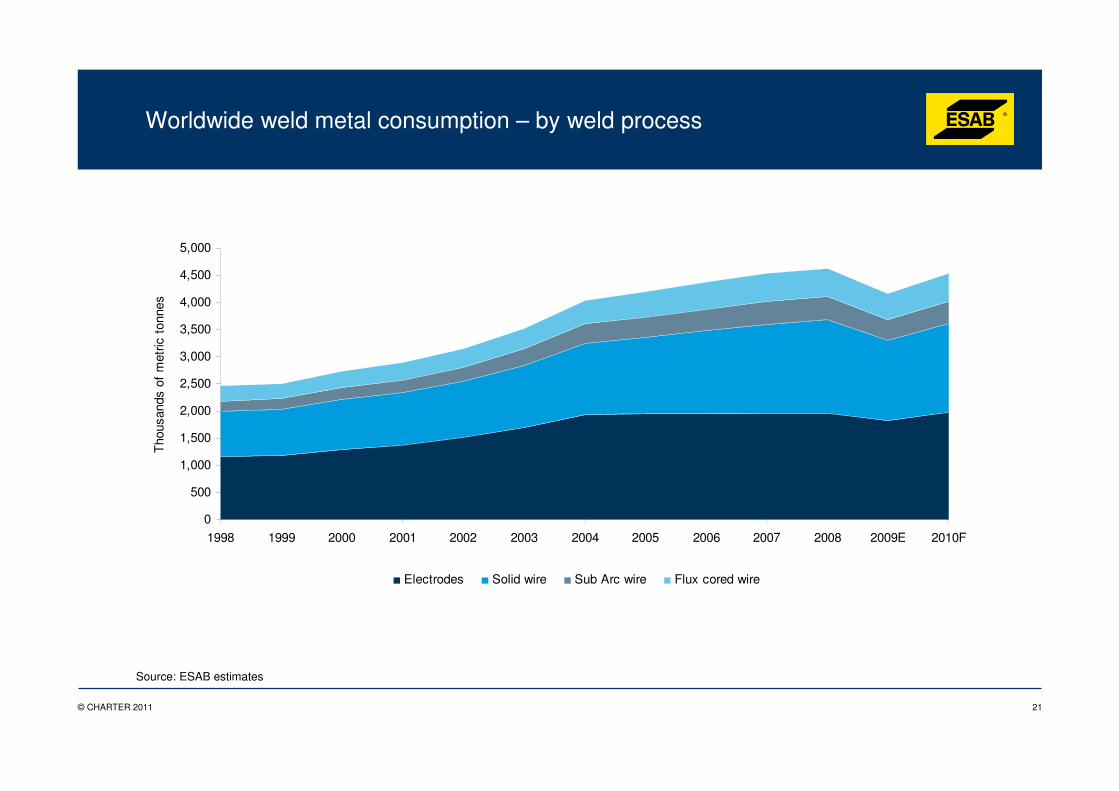
Worldwide weld metal consumption – by weld process
0
500
1,000
1,500
2,000
2,500
3,000
3,500
4,000
4,500
5,000
1998 1999 2000 2001 2002 2003 2004 2005 2006 2007 2008 2009E 2010F
Tho
usan
ds o
f m
etric
ton
nes
Electrodes Solid wire Sub Arc wire Flux cored wire
22© CHARTER 2011
Source: ESAB estimates
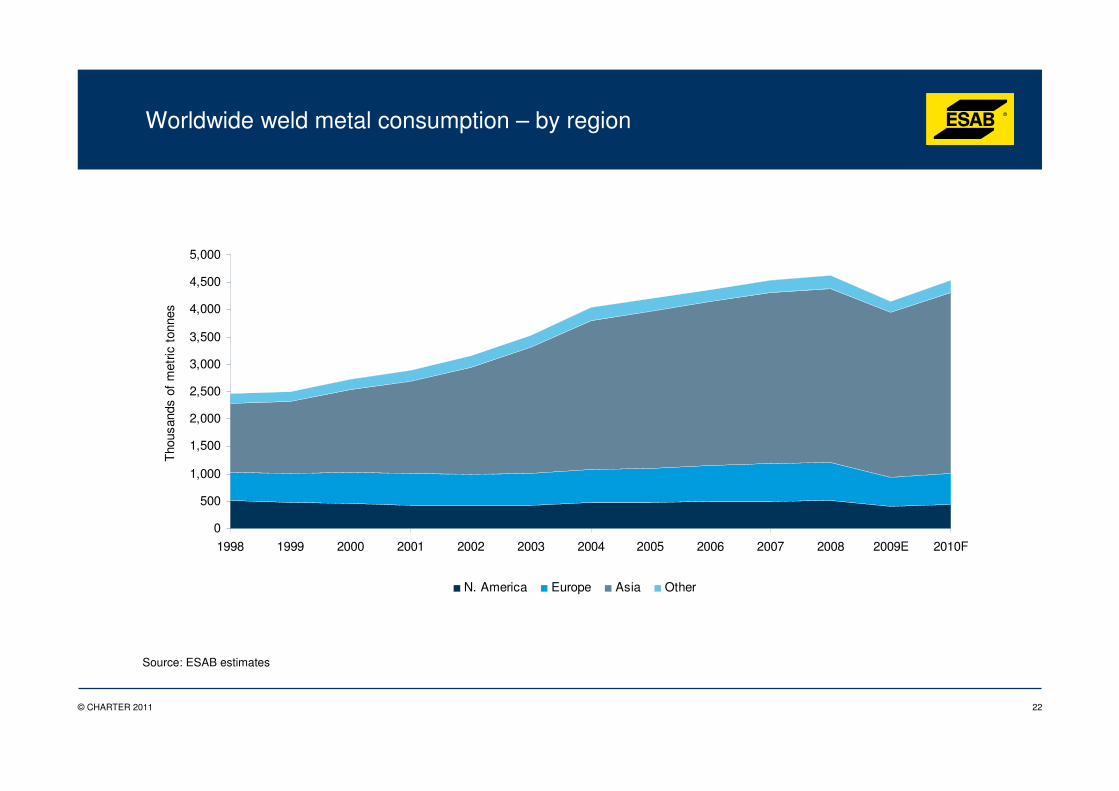
Worldwide weld metal consumption – by region
0
500
1,000
1,500
2,000
2,500
3,000
3,500
4,000
4,500
5,000
1998 1999 2000 2001 2002 2003 2004 2005 2006 2007 2008 2009E 2010F
Tho
usan
ds o
f m
etric
ton
nes
N. America Europe Asia Other
23© CHARTER 2011
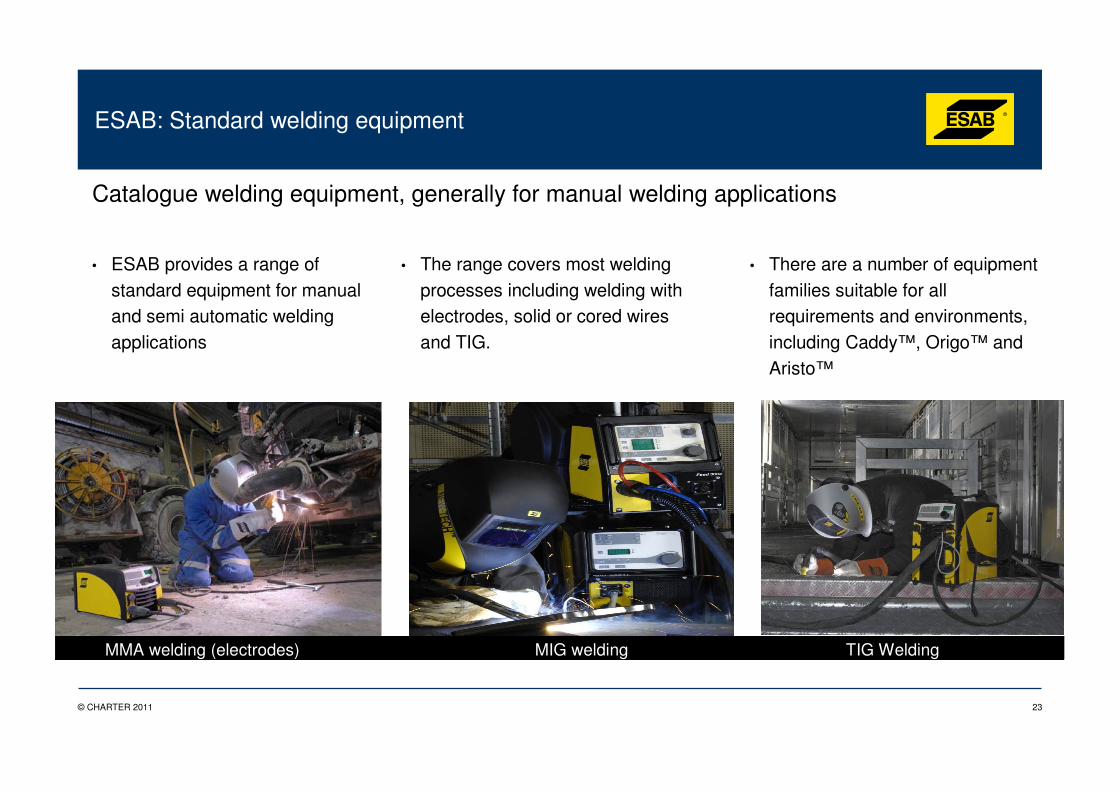
Catalogue welding equipment, generally for manual welding applications
• ESAB provides a range of standard equipment for manual and semi automatic welding applications
• The range covers most welding processes including welding with electrodes, solid or cored wires and TIG.
• There are a number of equipment families suitable for all requirements and environments, including Caddy™, Origo™ and Aristo™
MIG weldingMMA welding (electrodes) TIG Welding
ESAB: Standard welding equipment
24© CHARTER 2011
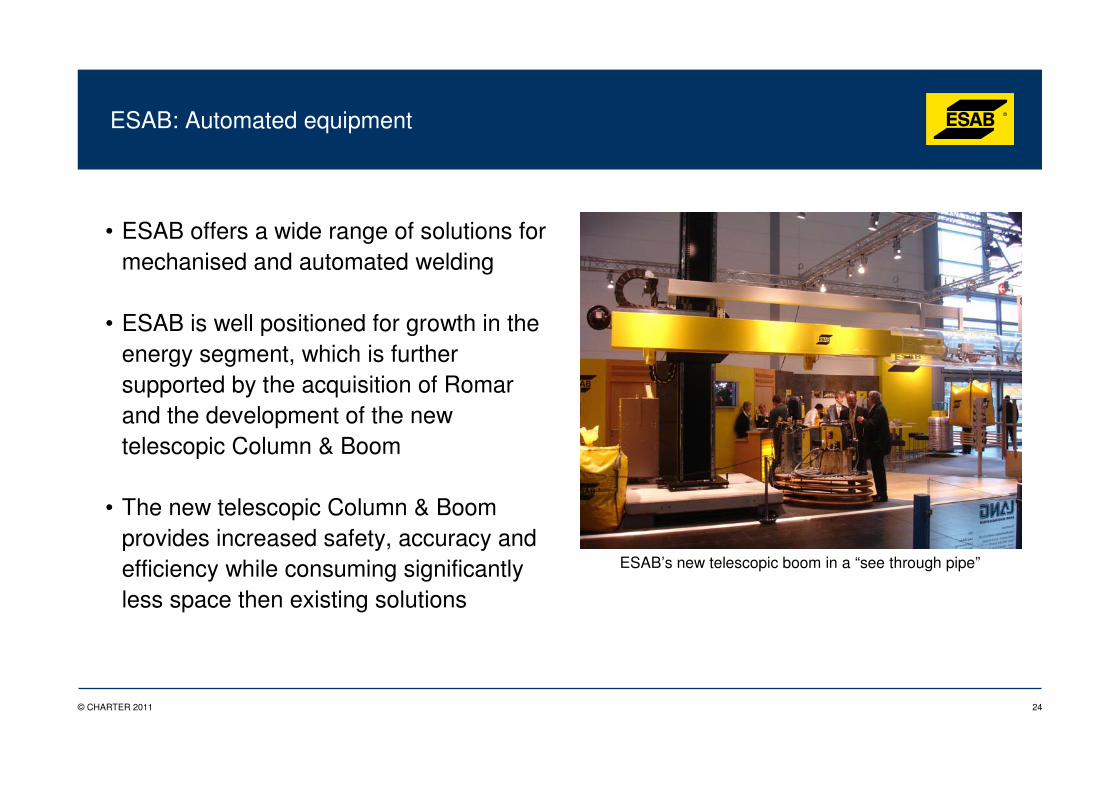
ESAB: Automated equipment
• ESAB offers a wide range of solutions for mechanised and automated welding
• ESAB is well positioned for growth in the energy segment, which is further supported by the acquisition of Romar and the development of the new telescopic Column & Boom
• The new telescopic Column & Boom provides increased safety, accuracy and efficiency while consuming significantly less space then existing solutions
ESAB’s new telescopic boom in a “see through pipe”
25© CHARTER 2011
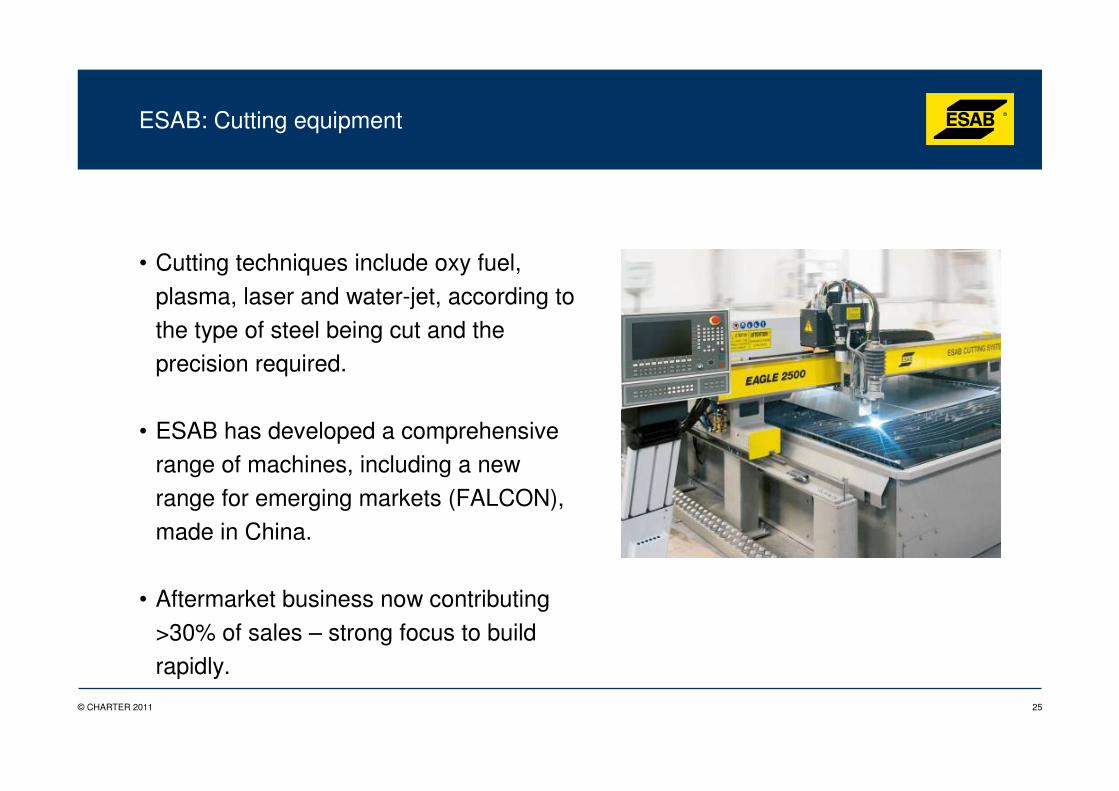
ESAB: Cutting equipment
• Cutting techniques include oxy fuel,
plasma, laser and water-jet, according to
the type of steel being cut and the precision required.
• ESAB has developed a comprehensive range of machines, including a new
range for emerging markets (FALCON),
made in China.
• Aftermarket business now contributing
>30% of sales – strong focus to build rapidly.
26© CHARTER 2011
ESAB: Index
1. Welding industry background
3. ESAB manufacturing and supply chain
2. ESAB products
4. ESAB financials
5. ESAB growth opportunities and outlook
27© CHARTER 2011
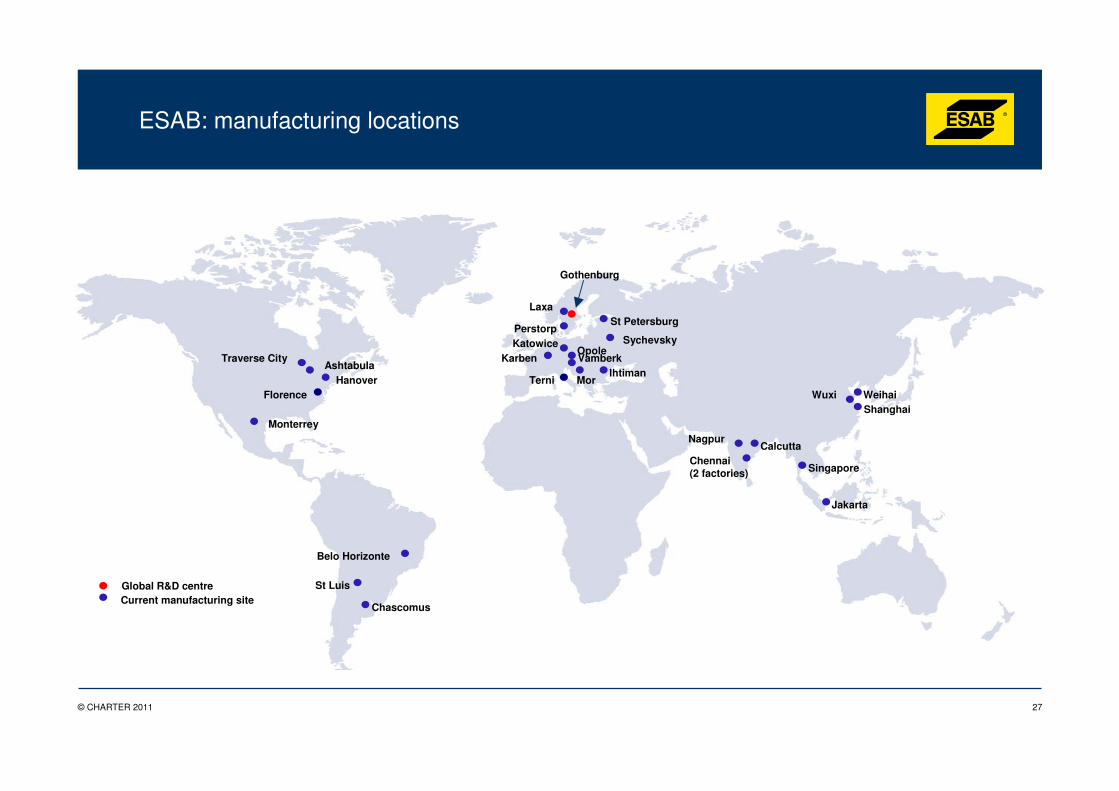
ESAB: manufacturing locations
Traverse CityAshtabula
HanoverFlorence
Monterrey
Belo Horizonte
St Luis
Chascomus
Jakarta
SingaporeChennai(2 factories)
CalcuttaNagpur
ShanghaiWeihaiWuxi
IhtimanTerni
Karben
Mor
KatowiceOpoleVamberk
St PetersburgLaxa
Perstorp
Current manufacturing siteGlobal R&D centre
Gothenburg
Sychevsky
28© CHARTER 2011
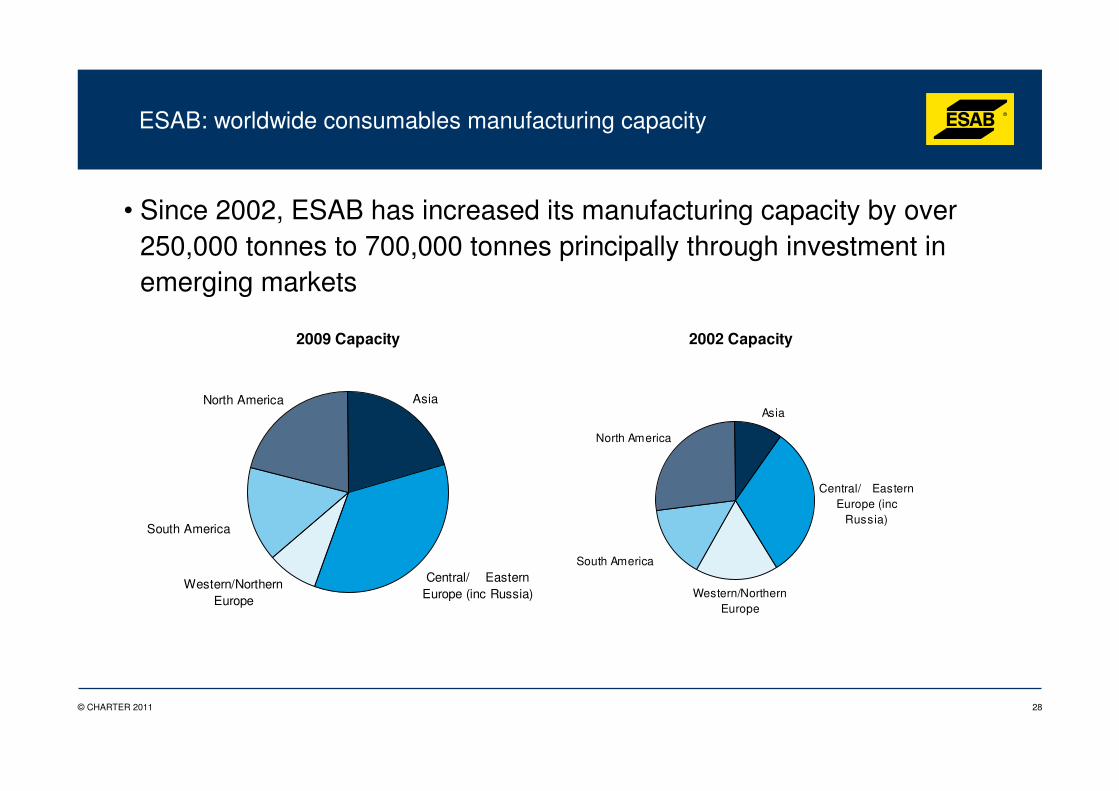
ESAB: worldwide consumables manufacturing capacity
• Since 2002, ESAB has increased its manufacturing capacity by over 250,000 tonnes to 700,000 tonnes principally through investment in emerging markets
2009 Capacity
South America
North America Asia
Central/ Eastern Europe (inc Russia)
Western/Northern Europe
2002 Capacity
Western/Northern Europe
Central/ Eastern Europe (inc
Russia)
Asia
North America
South America
29© CHARTER 2011
ESAB: Index
1. Welding industry background
3. ESAB manufacturing and supply chain
2. ESAB products
4. ESAB financials
5. ESAB growth opportunities and outlook
30© CHARTER 2011
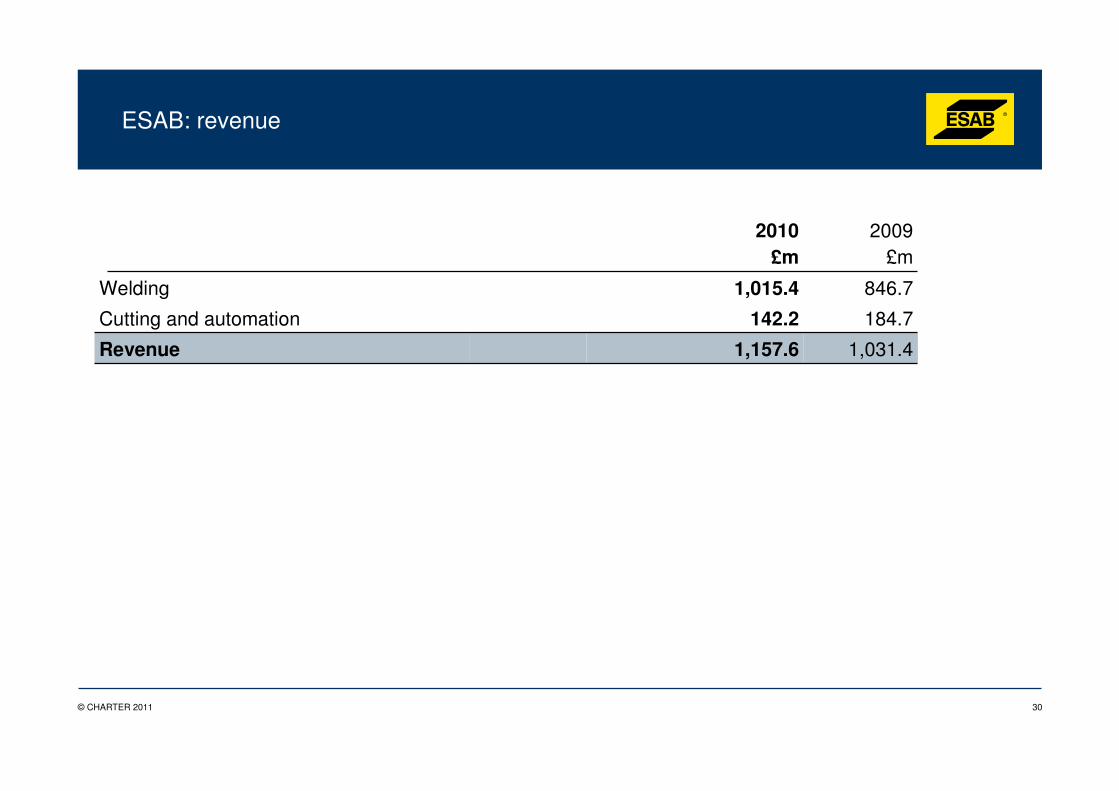
ESAB: revenue
1,031.4
184.7
846.7
£m20092010
£m
Welding 1,015.4
Cutting and automation 142.2
Revenue 1,157.6
31© CHARTER 2011
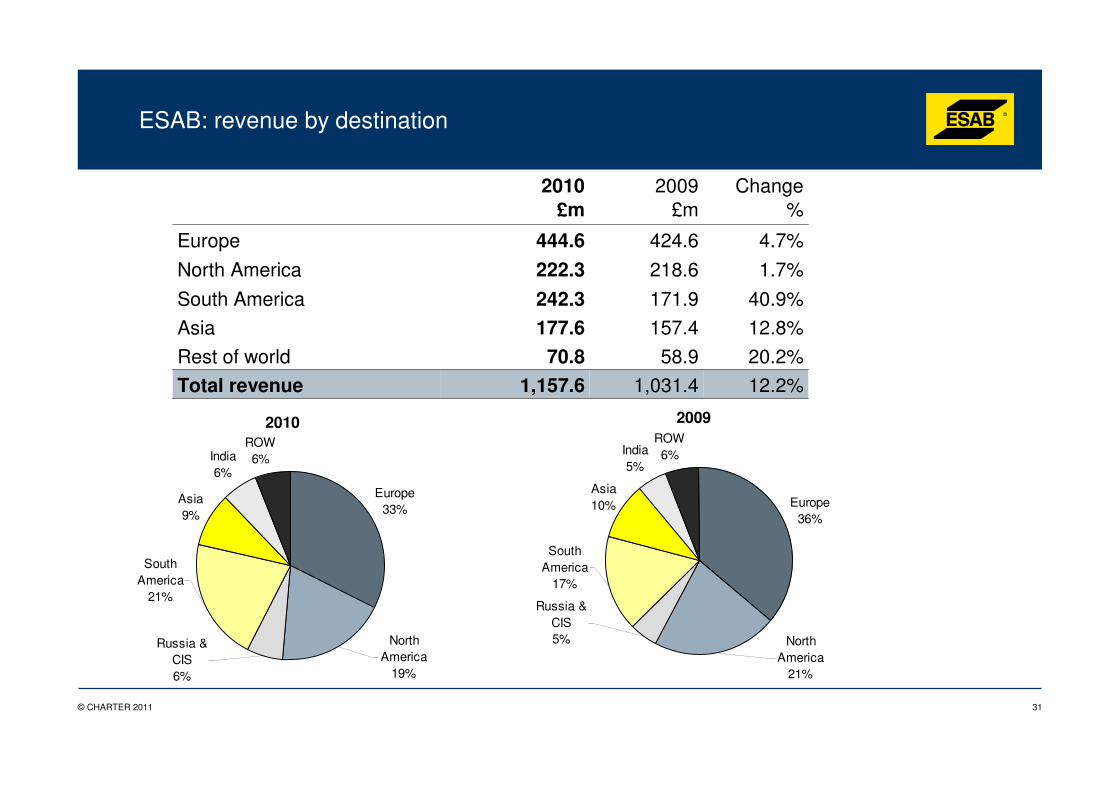
ESAB: revenue by destination
2010 2009 Change£m £m %
Europe 444.6 424.6 4.7%
North America 222.3 218.6 1.7%
South America 242.3 171.9 40.9%
Asia 177.6 157.4 12.8%
Rest of world 70.8 58.9 20.2%
Total revenue 1,157.6 1,031.4 12.2%
Europe33%
Asia9%
India6%
ROW6%
South America
21%
North America
19%
Russia & CIS6%
Europe36%
Asia10%
India5%
ROW6%
South America
17%
Russia & CIS5% North
America21%
20092010
32© CHARTER 2011
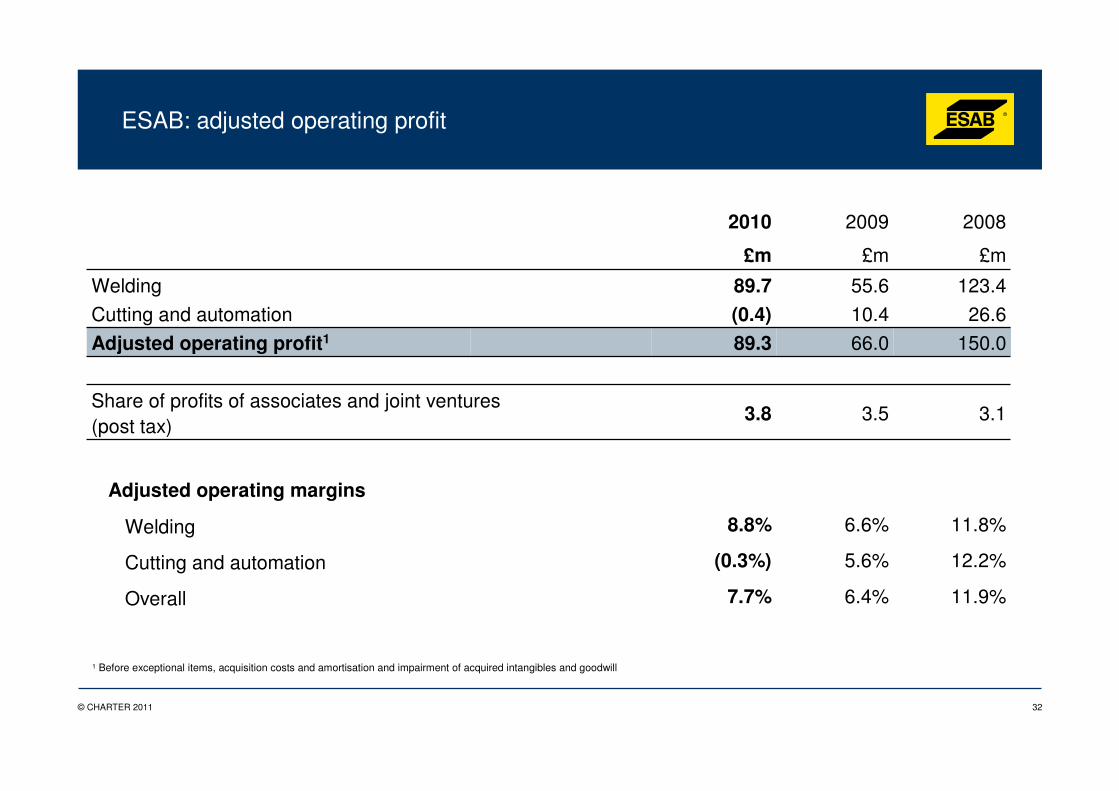
ESAB: adjusted operating profit
11.9%
12.2%
11.8%
3.1
150.0
26.6
123.4
£m
2008
7.7%
(0.3%)
8.8%
3.8
89.3(0.4)89.7
£m
2010 2009
£m
Welding 55.6
Cutting and automation 10.4
Adjusted operating profit1 66.0
Share of profits of associates and joint ventures (post tax)
3.5
Adjusted operating margins
Welding 6.6%
Cutting and automation 5.6%
Overall 6.4%
1 Before exceptional items, acquisition costs and amortisation and impairment of acquired intangibles and goodwill
33© CHARTER 2011
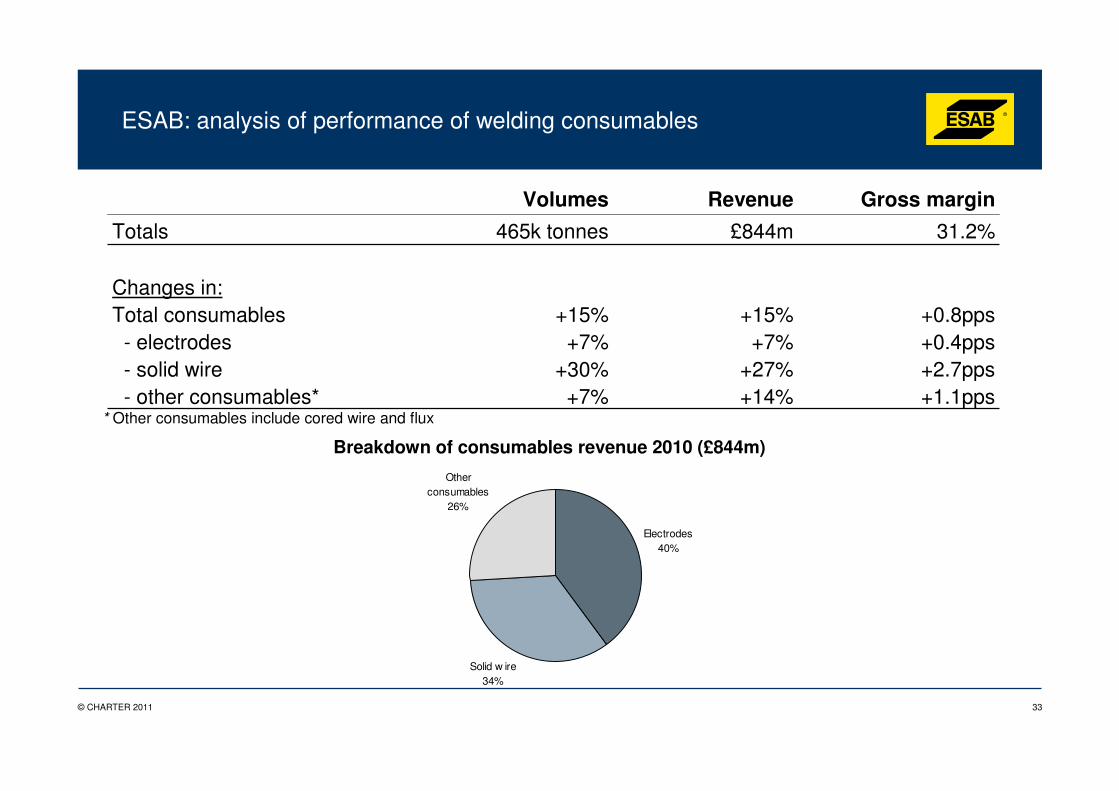
Volumes Revenue Gross margin
Totals 465k tonnes £844m 31.2%
Changes in:Total consumables +15% +15% +0.8pps
- electrodes +7% +7% +0.4pps- solid wire +30% +27% +2.7pps- other consumables* +7% +14% +1.1pps
* Other consumables include cored wire and flux
Breakdown of consumables revenue 2010 (£844m)
ESAB: analysis of performance of welding consumables
Electrodes40%
Solid w ire34%
Other consumables
26%

34© CHARTER 2011
ESAB: Index
1. Welding industry background
3. ESAB manufacturing and supply chain
2. ESAB products
4. ESAB financials
5. ESAB growth opportunities and outlook
35© CHARTER 2011
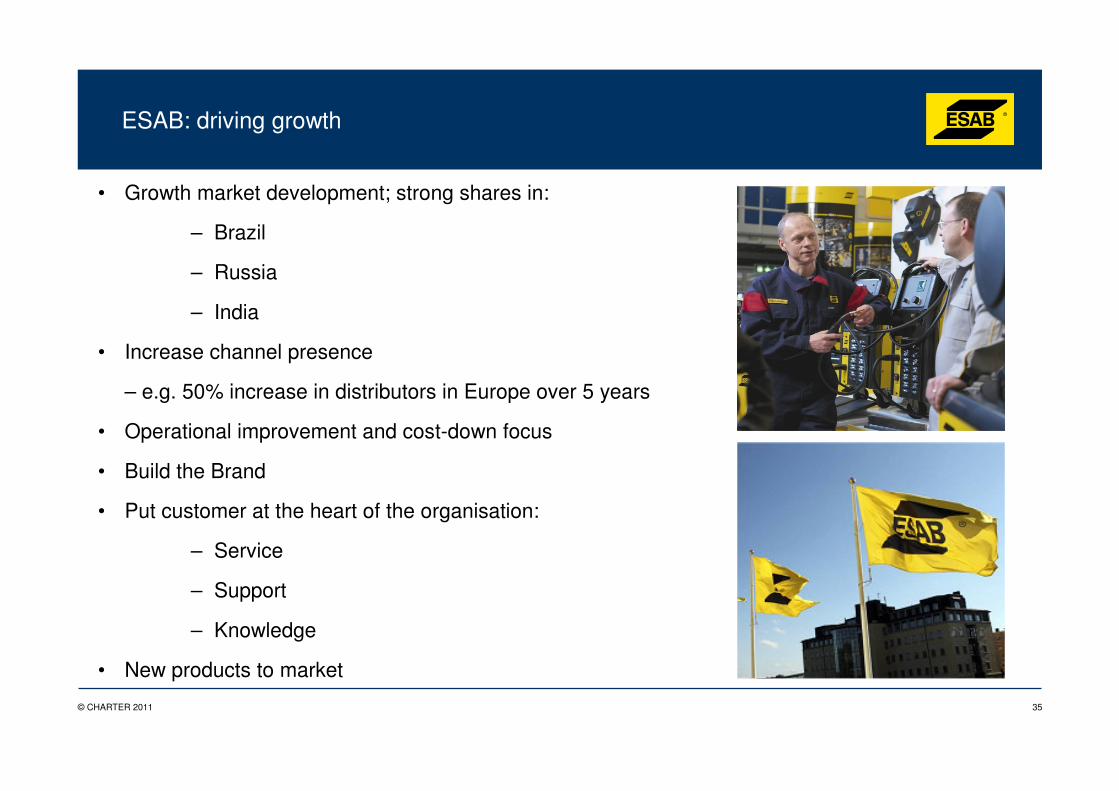
• Growth market development; strong shares in:
– Brazil
– Russia
– India
• Increase channel presence
– e.g. 50% increase in distributors in Europe over 5 years
• Operational improvement and cost-down focus
• Build the Brand
• Put customer at the heart of the organisation:
– Service
– Support
– Knowledge
• New products to market
ESAB: driving growth
36© CHARTER 2011
ESAB: corporate developments - Sychevsky
Background
ESAB has grown sales in Russia to circa US$100 million in 2010
Extensive network of 200 distributors serviced by factories in St Petersburg and
Central Europe
Acquisition of Russian electrode manufacturer
Located circa 300km west of Moscow
High-end electrodes; key end user segment is energy
Provides additional 6,000 tonnes of capacity; capable of further expansion
Value accretive for Charter shareholders
37© CHARTER 2011
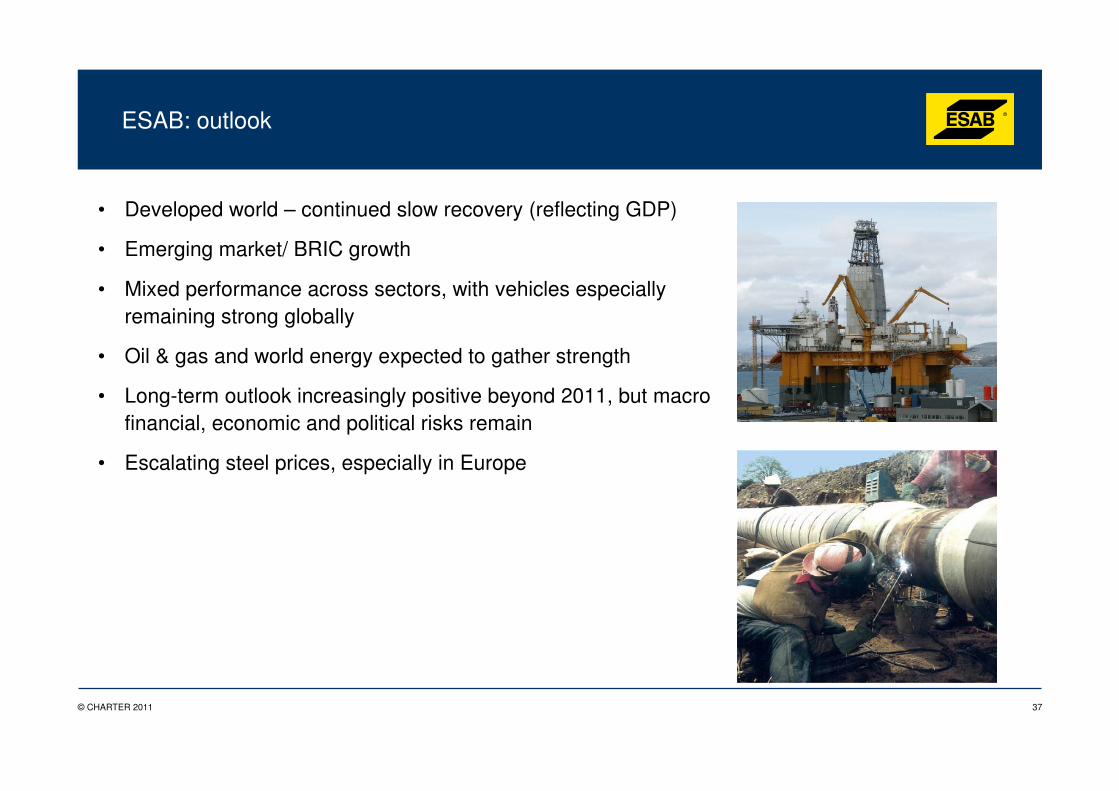
• Developed world – continued slow recovery (reflecting GDP)
• Emerging market/ BRIC growth
• Mixed performance across sectors, with vehicles especially remaining strong globally
• Oil & gas and world energy expected to gather strength
• Long-term outlook increasingly positive beyond 2011, but macro financial, economic and political risks remain
• Escalating steel prices, especially in Europe
ESAB: outlook
38© CHARTER 2011
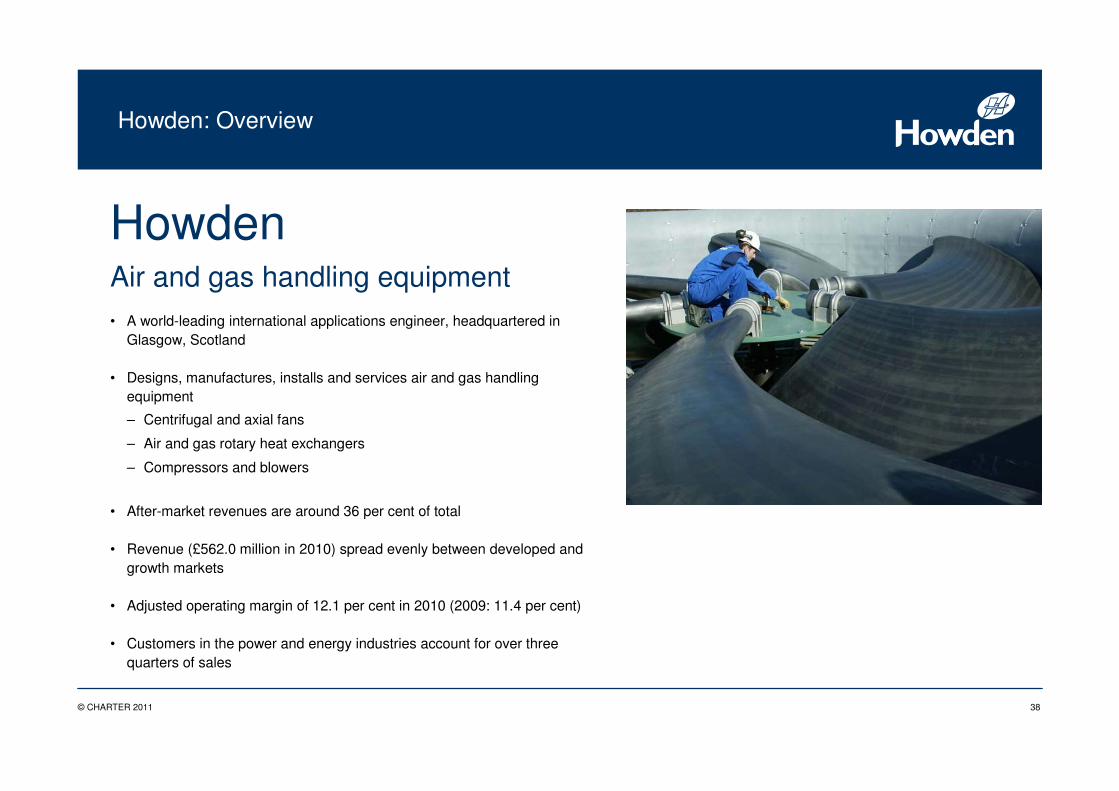
Howden: Overview
HowdenAir and gas handling equipment• A world-leading international applications engineer, headquartered in
Glasgow, Scotland
• Designs, manufactures, installs and services air and gas handling equipment
– Centrifugal and axial fans
– Air and gas rotary heat exchangers
– Compressors and blowers
• After-market revenues are around 36 per cent of total
• Revenue (£562.0 million in 2010) spread evenly between developed and growth markets
• Adjusted operating margin of 12.1 per cent in 2010 (2009: 11.4 per cent)
• Customers in the power and energy industries account for over three quarters of sales
39© CHARTER 2011
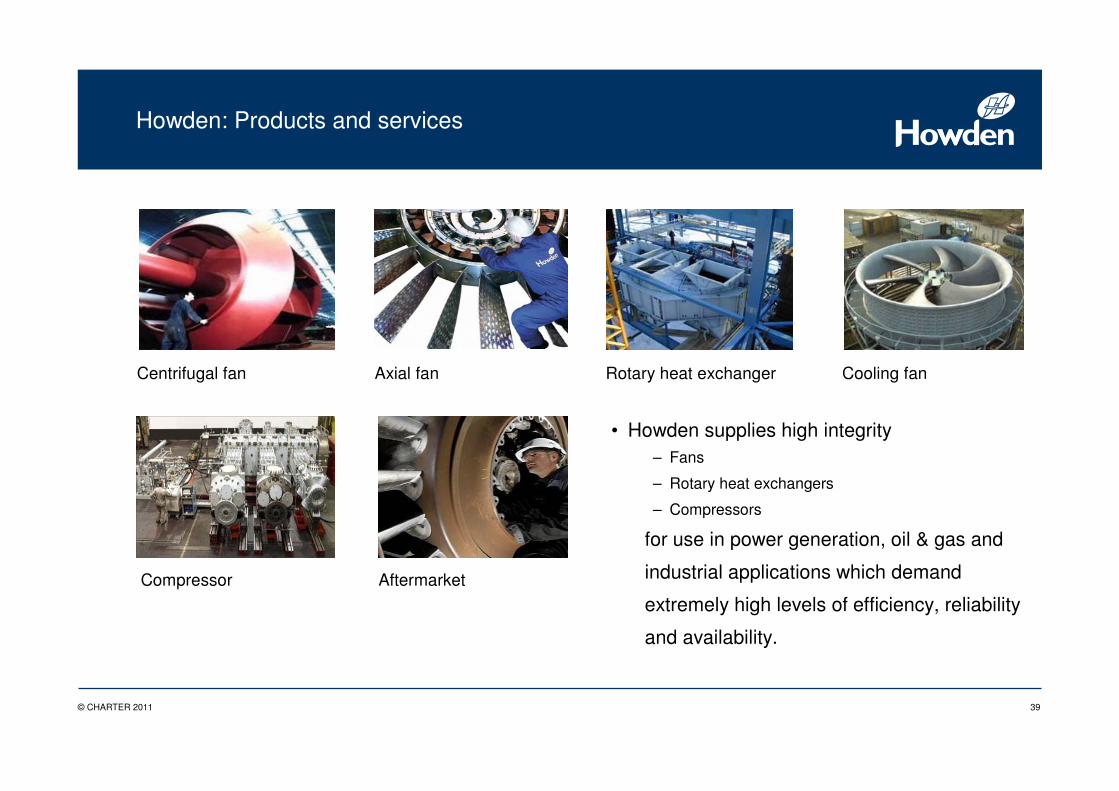
Howden: Products and services
• Howden supplies high integrity – Fans
– Rotary heat exchangers
– Compressors
for use in power generation, oil & gas and
industrial applications which demand
extremely high levels of efficiency, reliability
and availability.
Rotary heat exchanger Cooling fanAxial fanCentrifugal fan
Compressor Aftermarket
40© CHARTER 2011
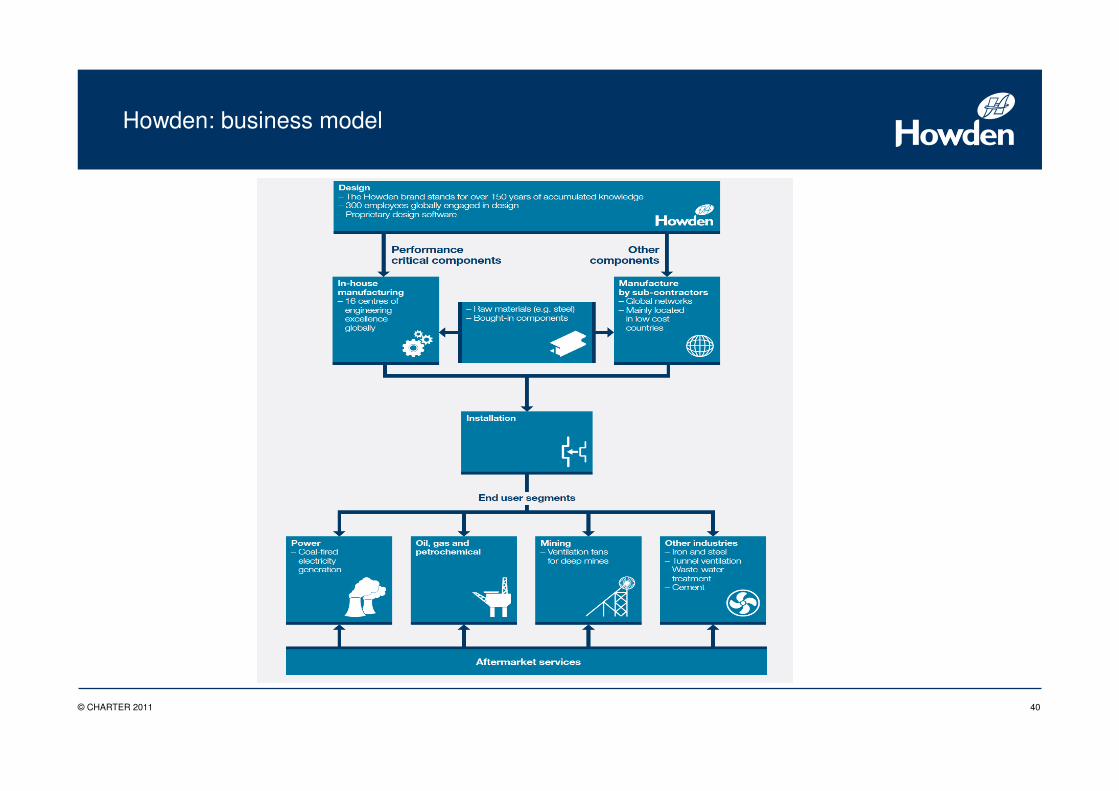
Howden: business model
41© CHARTER 2011
Howden: Index
1. Strategic overview
3. Thomassen Compression Systems
2. Coal-fired power
4. Summarised financials
5. Business development and growth drivers
42© CHARTER 2011
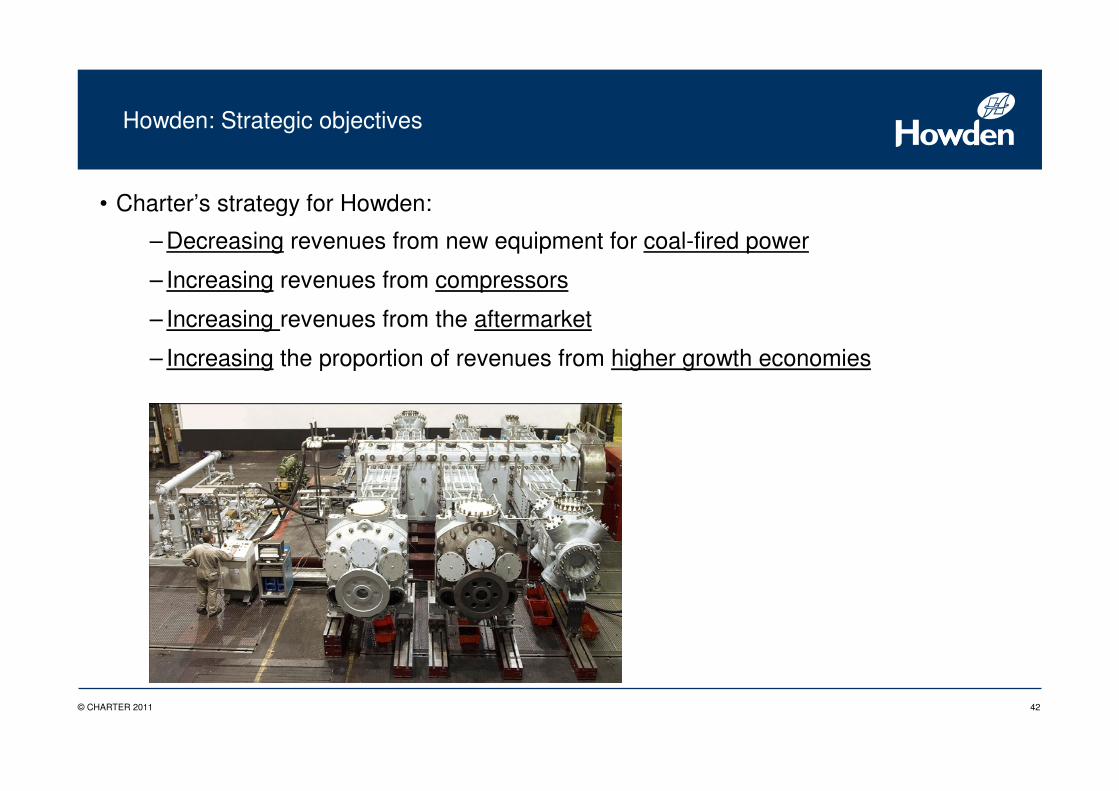
Howden: Strategic objectives
• Charter’s strategy for Howden:
– Decreasing revenues from new equipment for coal-fired power
– Increasing revenues from compressors
– Increasing revenues from the aftermarket
– Increasing the proportion of revenues from higher growth economies
43© CHARTER 2011
Howden: steps taken to reposition the business
• Rationalised product range
– 2002: wide range of fans (including HVAC) and other products
– 2011: tightly focussed on engineered fans and compressors
• Coal-fired power
– 2002: depressed conditions
– 2011: strong long-term outlook for power, especially in China and India
• Compressor business
– 2002: small
– 2011: likely to account for around one-quarter of revenues
44© CHARTER 2011
Howden: steps taken to reposition the business (continued)
• Manufacturing
– 2002: integrated general manufacturing from steel fabrication to assembly
– 2011: emphasis on design, value-added manufacture, installation and service, with
extensive outsourcing
• Aftermarket
– 2011: revenues represent one-third of Howden’s total; the business is well positioned
to benefit from high sales of new equipment in recent years
• Global coverage
– Howden’s business is spread across the world, assisted by recent developments in
India (L&T joint venture) and Brazil (new facility)
45© CHARTER 2011
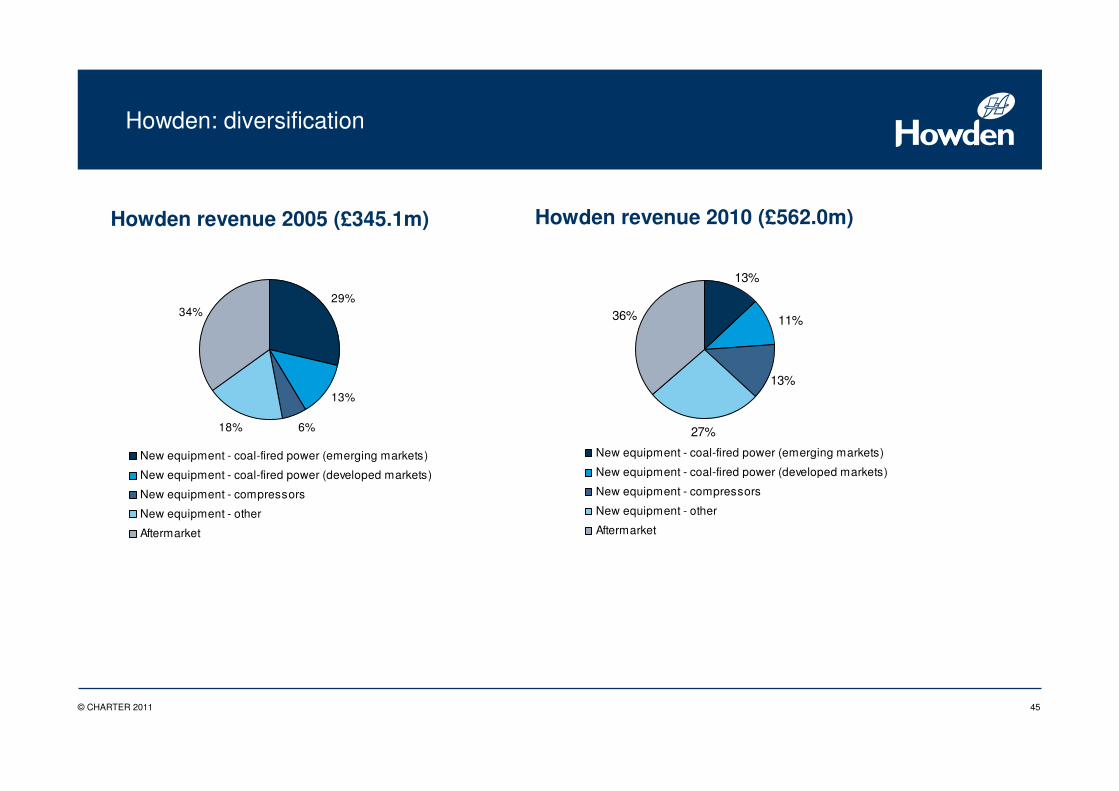
27%
36%
13%
11%
13%
New equipment - coal-fired power (emerging markets)
New equipment - coal-fired power (developed markets)
New equipment - compressors
New equipment - other
Aftermarket
6%18%
34%29%
13%
New equipment - coal-fired power (emerging markets)
New equipment - coal-fired power (developed markets)
New equipment - compressors
New equipment - other
Aftermarket
Howden revenue 2005 (£345.1m) Howden revenue 2010 (£562.0m)
Howden: diversification
46© CHARTER 2011
Howden: Index
1. Strategic overview
3. Thomassen Compression Systems
2. Coal-fired power
4. Summarised financials
5. Business development and growth drivers
47© CHARTER 2011
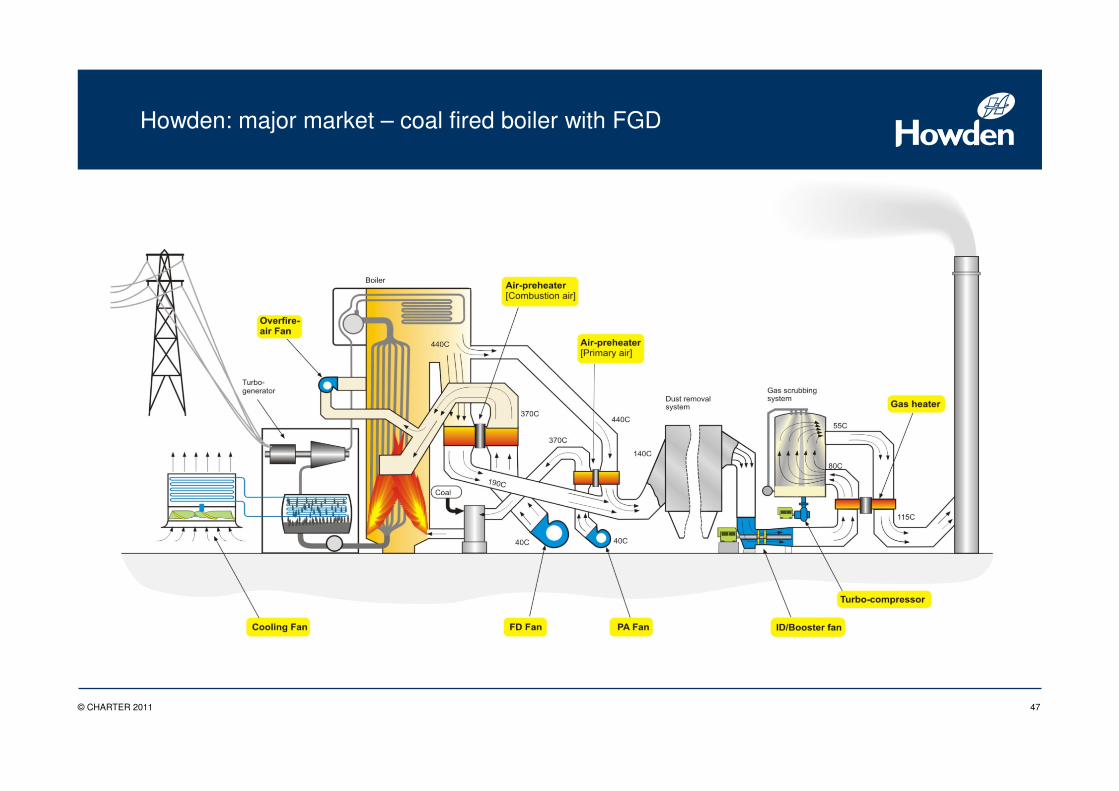
Howden: major market – coal fired boiler with FGD
48© CHARTER 2011
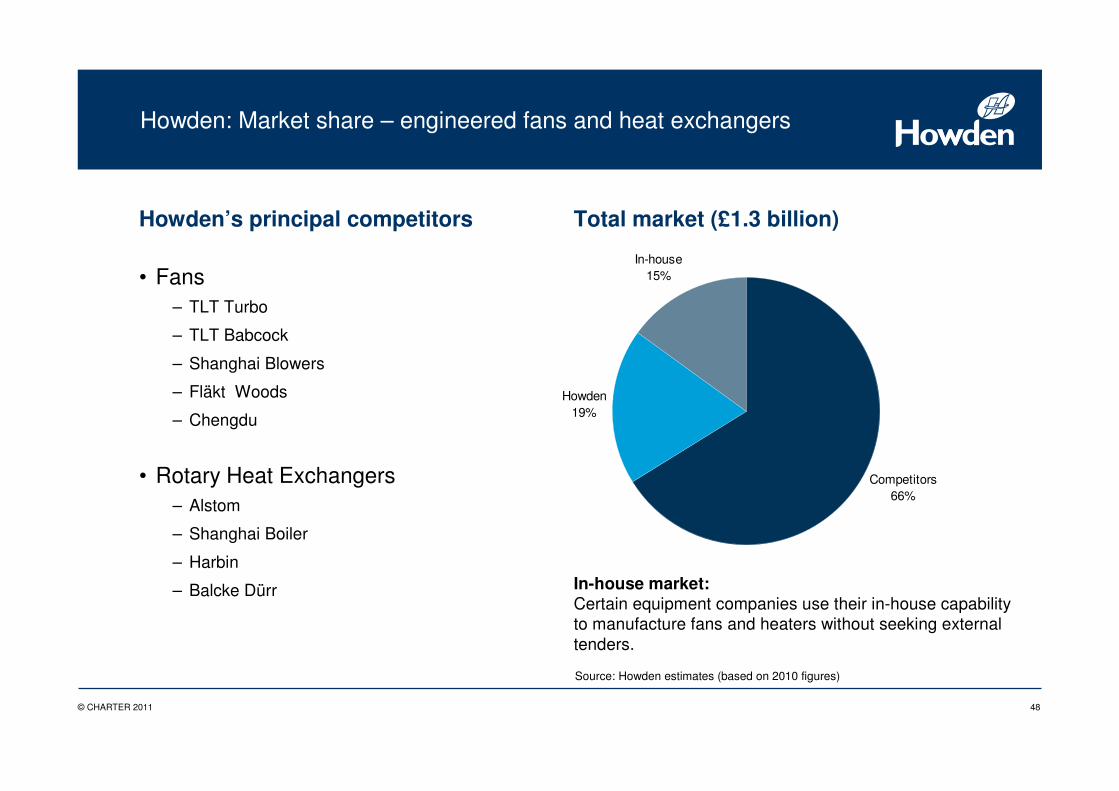
Howden: Market share – engineered fans and heat exchangers
Howden’s principal competitors
• Fans– TLT Turbo
– TLT Babcock
– Shanghai Blowers
– Fläkt Woods
– Chengdu
• Rotary Heat Exchangers– Alstom
– Shanghai Boiler
– Harbin
– Balcke Dürr
Source: Howden estimates (based on 2010 figures)
In-house market:Certain equipment companies use their in-house capability to manufacture fans and heaters without seeking external tenders.
Total market (£1.3 billion)
Competitors66%
Howden 19%
In-house15%
49© CHARTER 2011 49
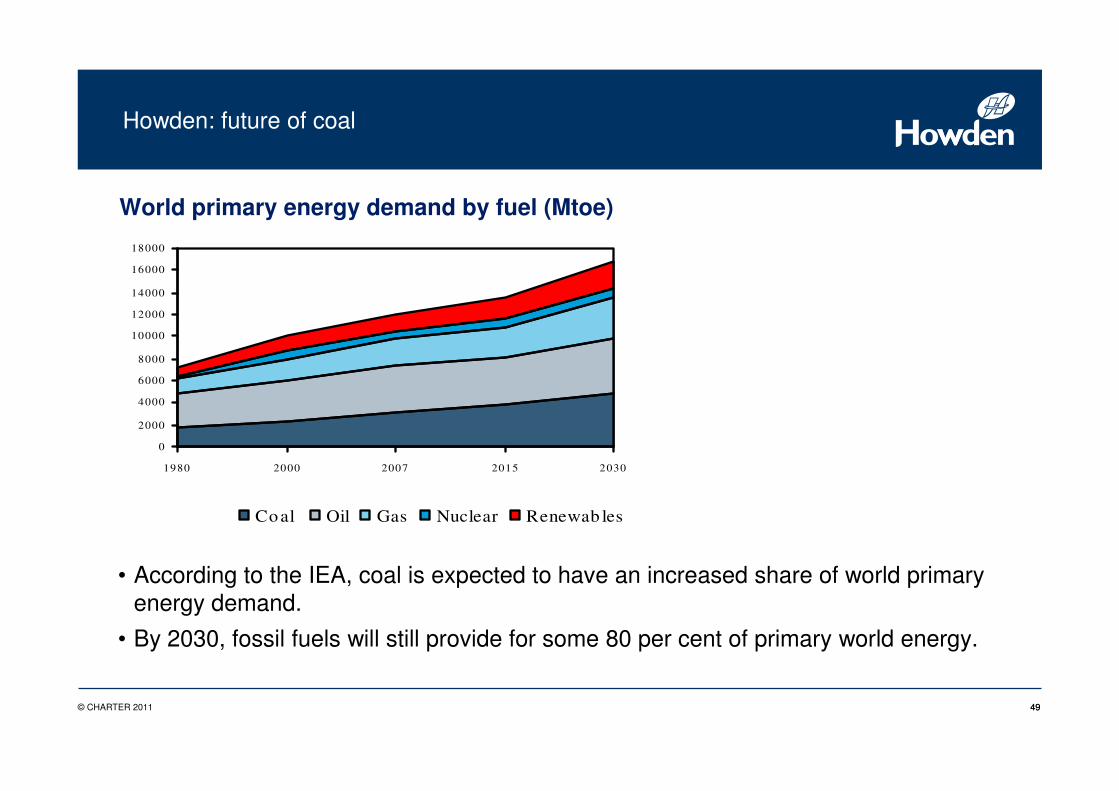
Howden: future of coal
• According to the IEA, coal is expected to have an increased share of world primary energy demand.
• By 2030, fossil fuels will still provide for some 80 per cent of primary world energy.
World primary energy demand by fuel (Mtoe)
0
2000
4000
6000
8000
10000
12000
14000
16000
18000
1980 2000 2007 2015 2030
Co al Oil Gas Nuclear Renewab les
50© CHARTER 2011 50
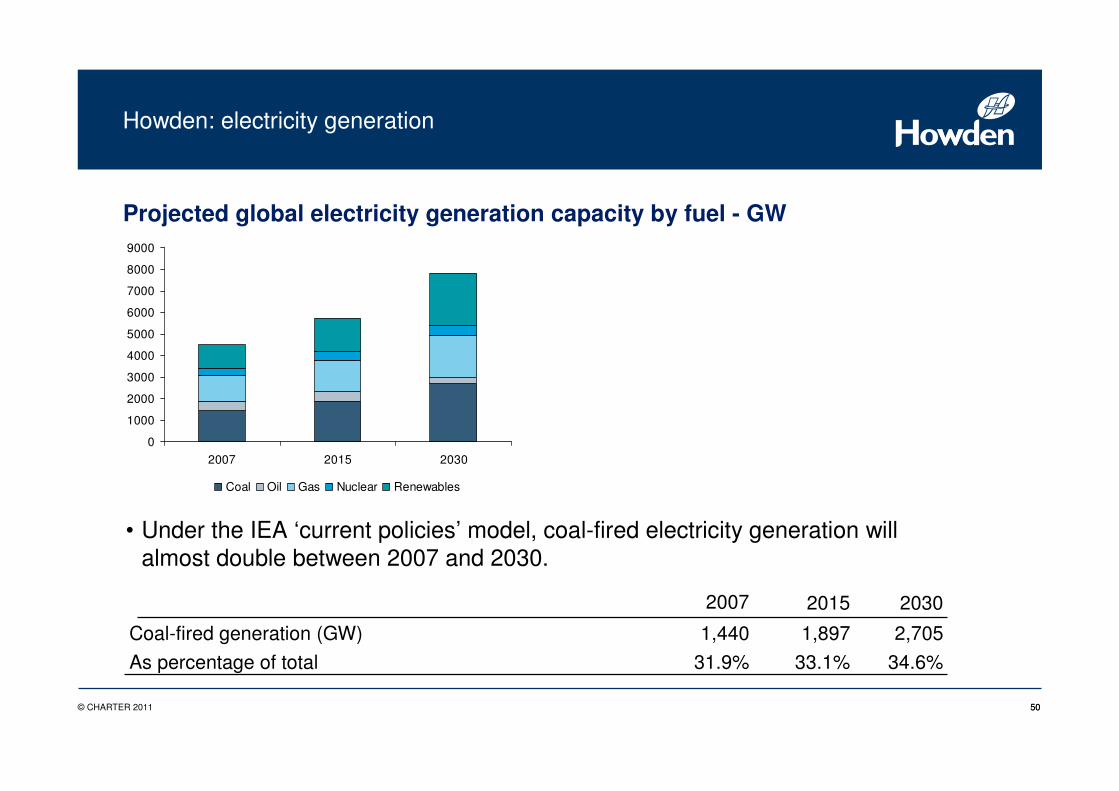
Howden: electricity generation
• Under the IEA ‘current policies’ model, coal-fired electricity generation will almost double between 2007 and 2030.
31.9%
1,440
2007 2015 2030
Coal-fired generation (GW) 1,897 2,705
As percentage of total 33.1% 34.6%
Projected global electricity generation capacity by fuel - GW
0
1000
2000
3000
4000
5000
6000
7000
8000
9000
2007 2015 2030
Coal Oil Gas Nuclear Renewables
51© CHARTER 2011 51
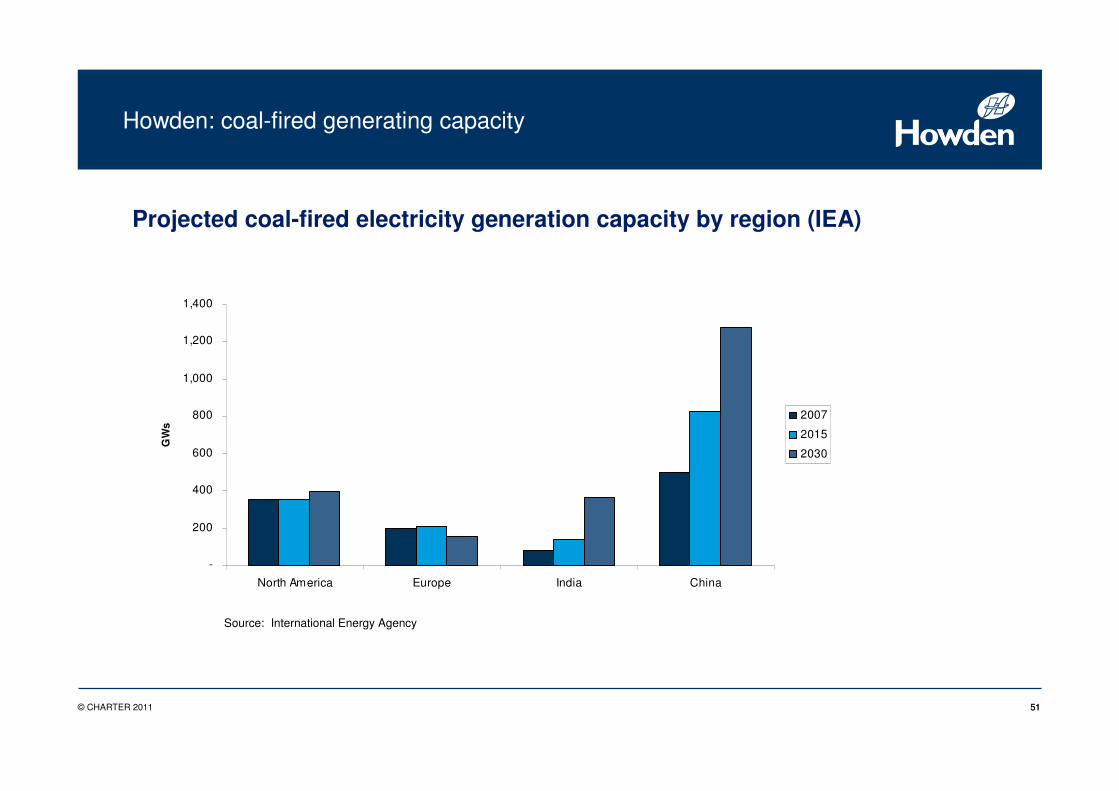
Howden: coal-fired generating capacity
Projected coal-fired electricity generation capacity by region (IEA)
-
200
400
600
800
1,000
1,200
1,400
North America Europe India China
GW
s
2007
2015
2030
Source: International Energy Agency
52© CHARTER 2011
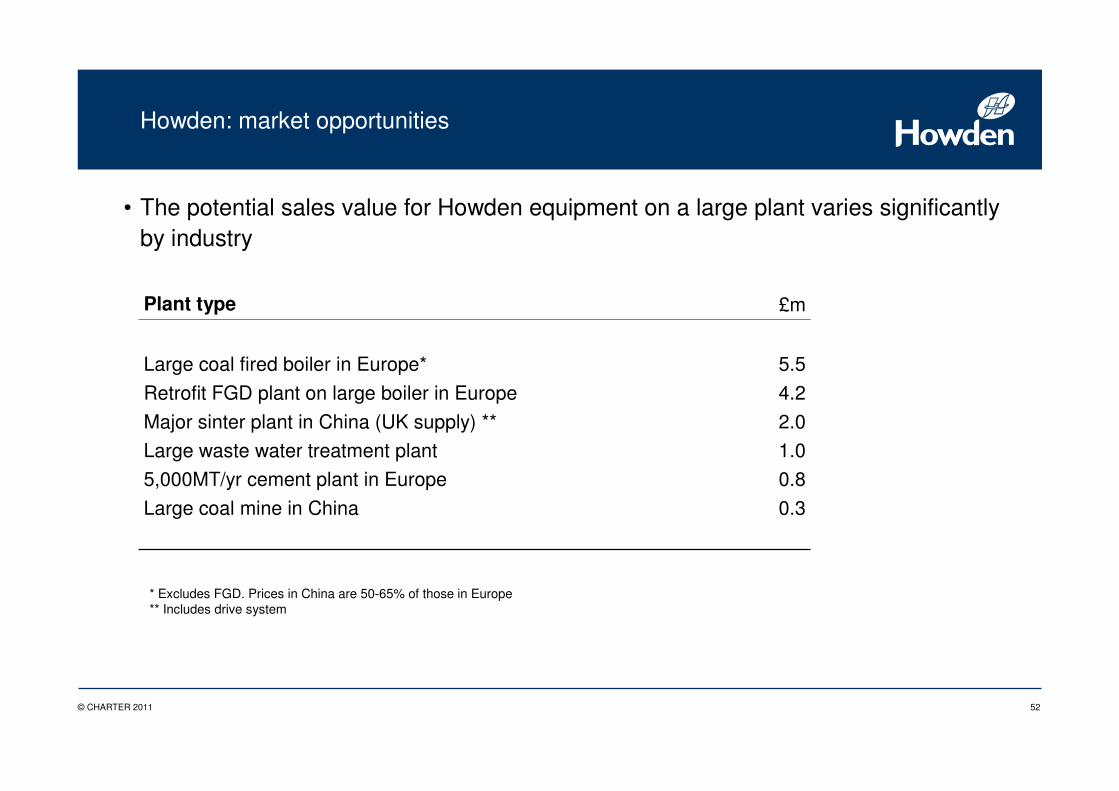
Howden: market opportunities
• The potential sales value for Howden equipment on a large plant varies significantly by industry
0.85,000MT/yr cement plant in Europe
0.3Large coal mine in China
2.0Major sinter plant in China (UK supply) **
4.2Retrofit FGD plant on large boiler in Europe
1.0
5.5
£m
Large coal fired boiler in Europe*
Large waste water treatment plant
Plant type
* Excludes FGD. Prices in China are 50-65% of those in Europe** Includes drive system
53© CHARTER 2011
Howden: Index
1. Strategic overview
3. Thomassen Compression Systems
2. Coal-fired power
4. Summarised financials
5. Business development and growth drivers
54© CHARTER 2011
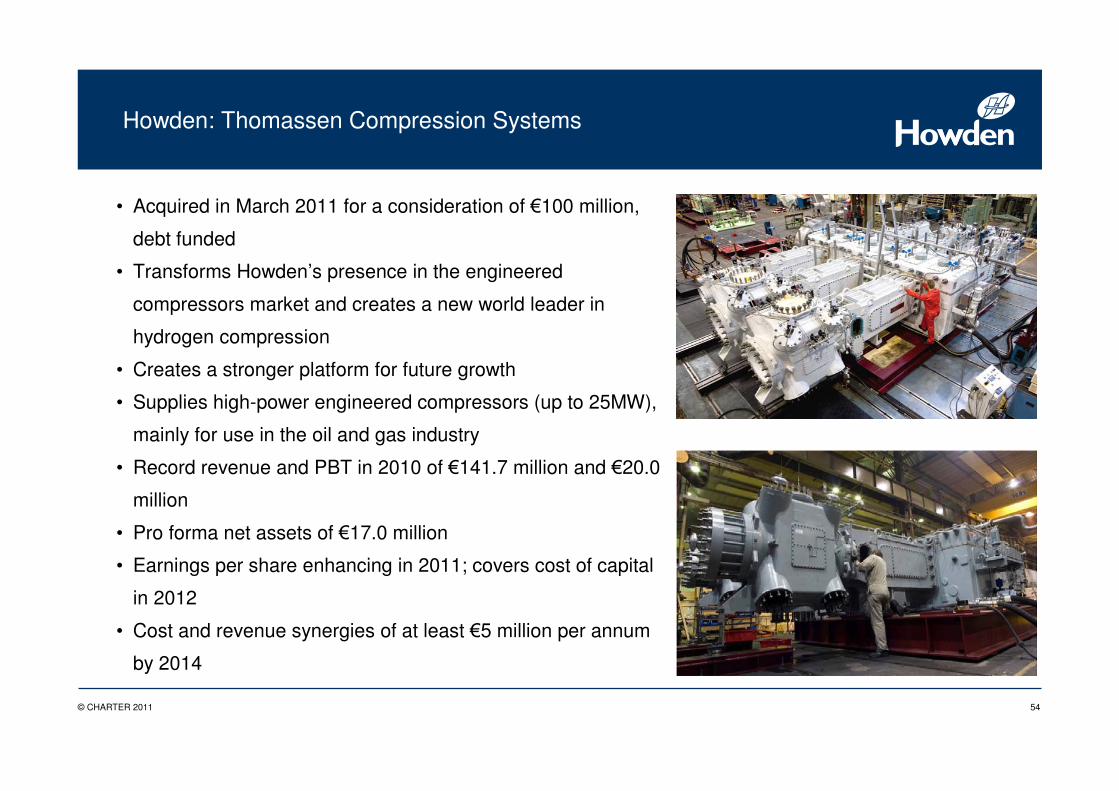
Howden: Thomassen Compression Systems
• Acquired in March 2011 for a consideration of �100 million,
debt funded
• Transforms Howden’s presence in the engineered
compressors market and creates a new world leader in
hydrogen compression
• Creates a stronger platform for future growth
• Supplies high-power engineered compressors (up to 25MW),
mainly for use in the oil and gas industry
• Record revenue and PBT in 2010 of �141.7 million and �20.0
million
• Pro forma net assets of �17.0 million
• Earnings per share enhancing in 2011; covers cost of capital
in 2012
• Cost and revenue synergies of at least �5 million per annum
by 2014
55© CHARTER 2011
Howden: Thomassen Compression Systems (continued)
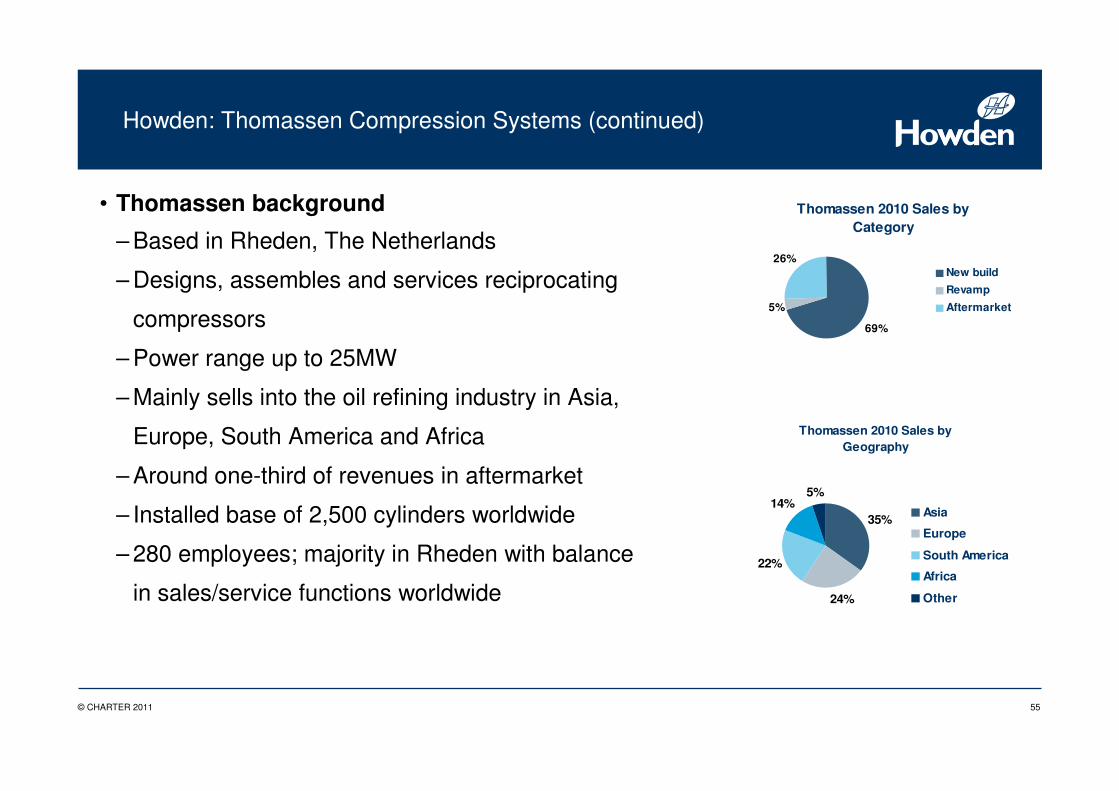
• Thomassen background
– Based in Rheden, The Netherlands
– Designs, assembles and services reciprocating
compressors
– Power range up to 25MW
– Mainly sells into the oil refining industry in Asia,
Europe, South America and Africa
– Around one-third of revenues in aftermarket
– Installed base of 2,500 cylinders worldwide
– 280 employees; majority in Rheden with balance
in sales/service functions worldwide
Thomassen 2010 Sales by Category
69%
5%
26%New build
Revamp
Aftermarket
Thomassen 2010 Sales by Geography
35%
24%
22%
14%5%
Asia
Europe
South America
Africa
Other
56© CHARTER 2011
Howden: Index
1. Strategic overview
3. Thomassen Compression Systems
2. Coal-fired power
4. Summarised financials
5. Business development and growth drivers
57© CHARTER 2011
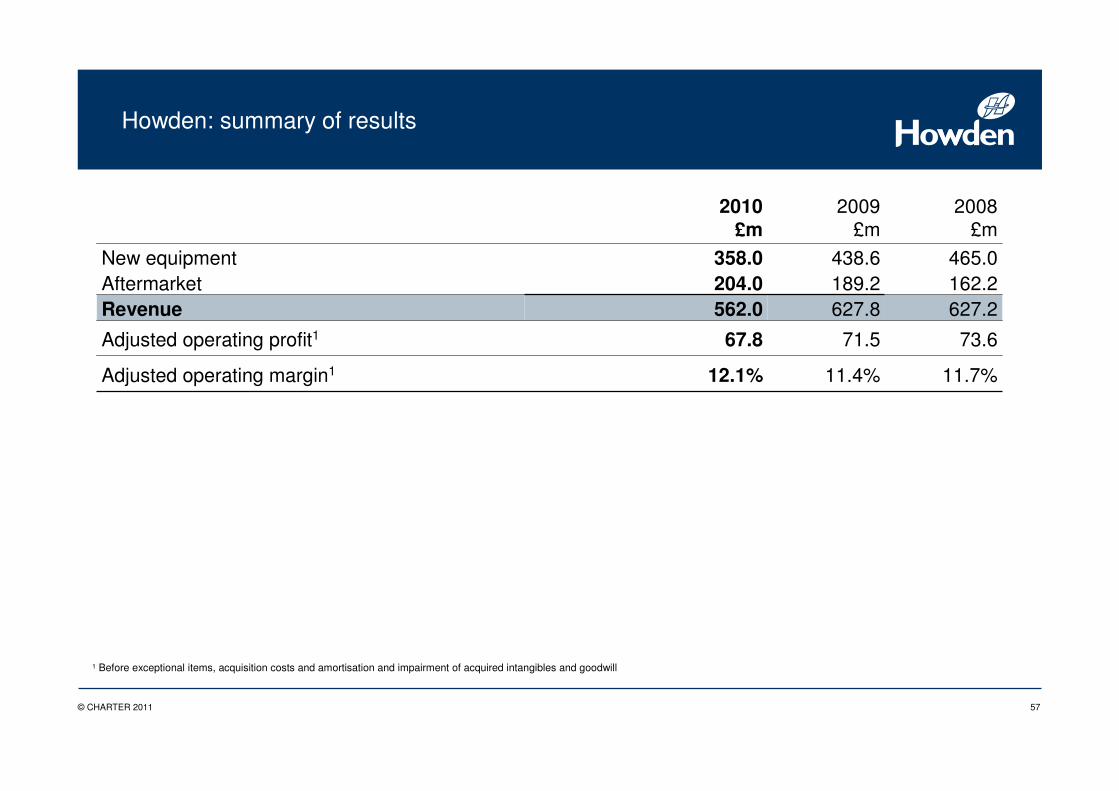
Howden: summary of results
11.7%
73.6
627.2162.2465.0
£m2008
12.1%
67.8
562.0204.0358.0
£m2010 2009
£m
New equipment 438.6Aftermarket 189.2Revenue 627.8
Adjusted operating profit1 71.5
Adjusted operating margin1 11.4%
1 Before exceptional items, acquisition costs and amortisation and impairment of acquired intangibles and goodwill
58© CHARTER 2011
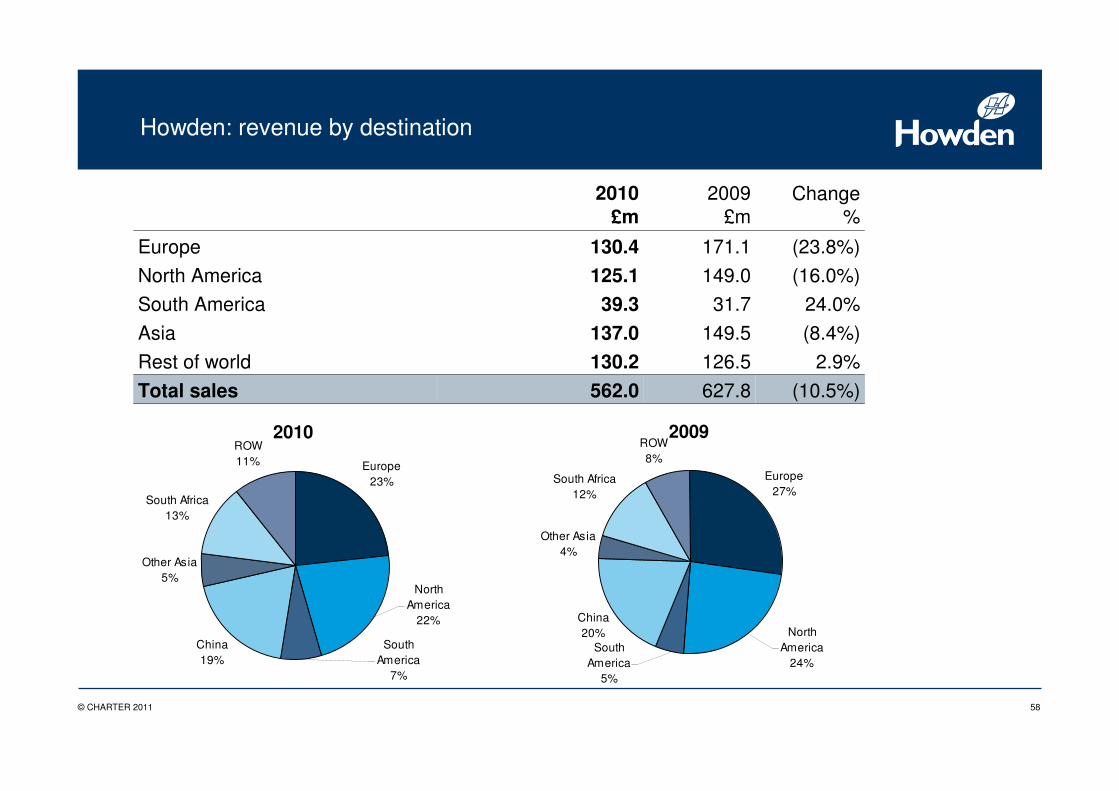
Howden: revenue by destination
2010 2009 Change£m £m %
Europe 130.4 171.1 (23.8%)
North America 125.1 149.0 (16.0%)
South America 39.3 31.7 24.0%
Asia 137.0 149.5 (8.4%)
Rest of world 130.2 126.5 2.9%
Total sales 562.0 627.8 (10.5%)
Europe23%
China19%
Other Asia5%
South Africa13%
ROW11%
North America
22%
South America
7%
Europe27%
China20%
Other Asia4%
South Africa12%
ROW8%
North America
24%South
America5%
20092010
59© CHARTER 2011 59
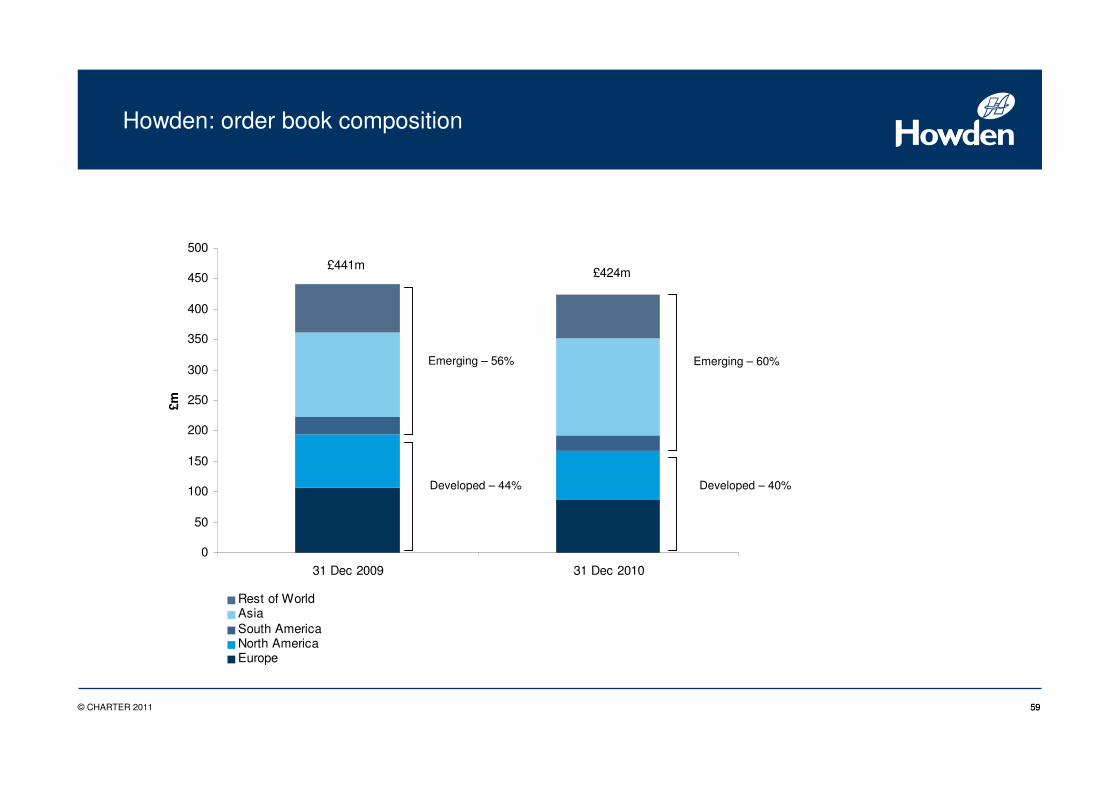
Howden: order book composition
0
50
100
150
200
250
300
350
400
450
500
31 Dec 2009 31 Dec 2010
£m
Rest of WorldAsiaSouth AmericaNorth AmericaEurope
£424m£441m
Emerging – 56% Emerging – 60%
Developed – 44% Developed – 40%
60© CHARTER 2011 60
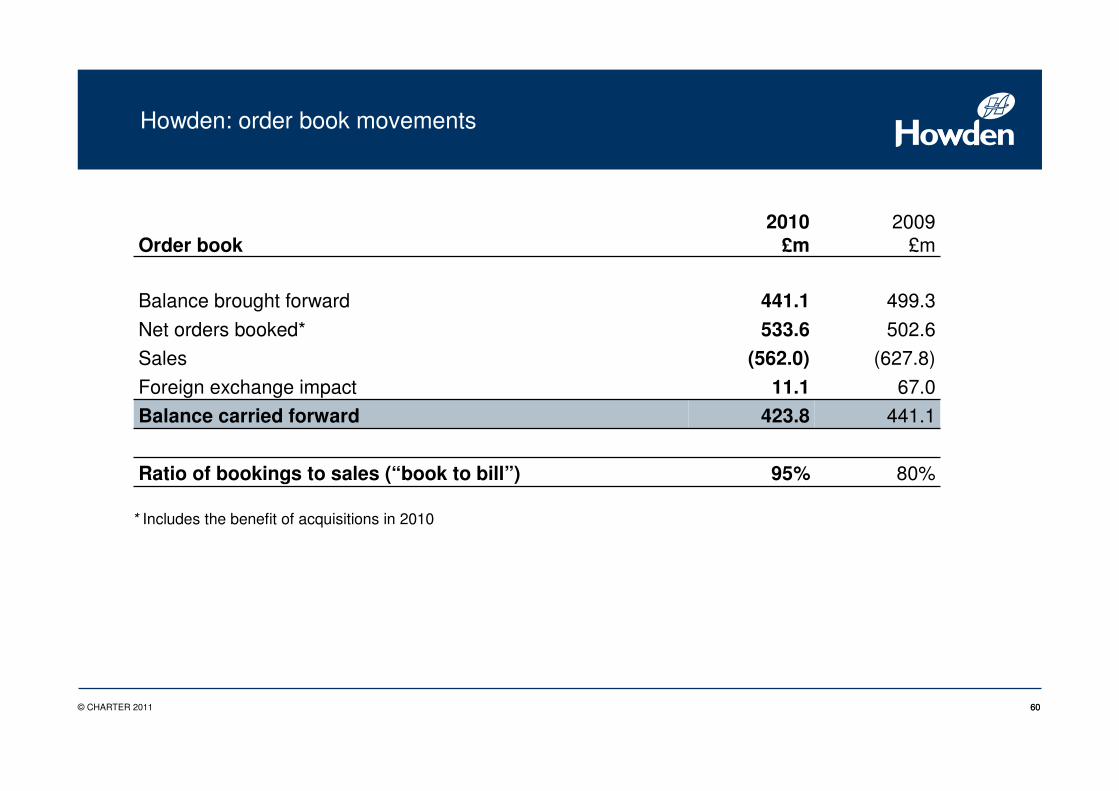
Howden: order book movements
2010 2009Order book £m £m
Balance brought forward 441.1 499.3
Net orders booked* 533.6 502.6
Sales (562.0) (627.8)
Foreign exchange impact 11.1 67.0
Balance carried forward 423.8 441.1
Ratio of bookings to sales (“book to bill”) 95% 80%
* Includes the benefit of acquisitions in 2010
61© CHARTER 2011 61
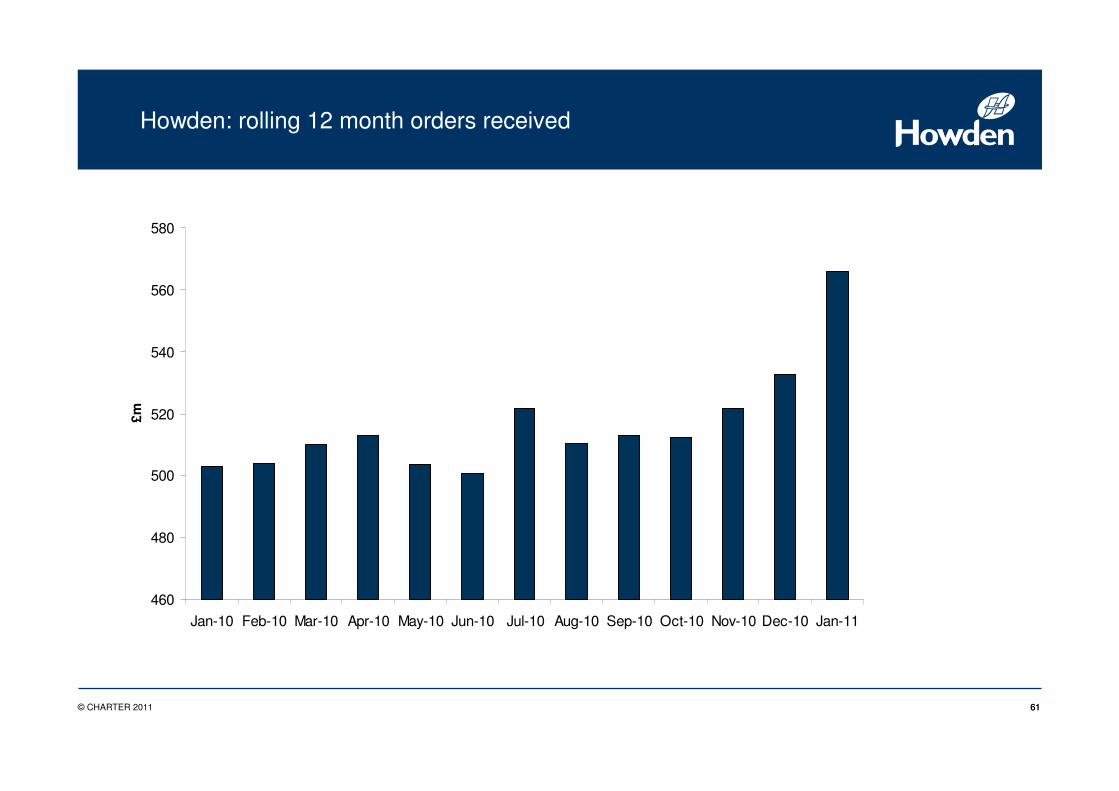
Howden: rolling 12 month orders received
460
480
500
520
540
560
580
Jan-10 Feb-10 Mar-10 Apr-10 May-10 Jun-10 Jul-10 Aug-10 Sep-10 Oct-10 Nov-10 Dec-10 Jan-11
£m
62© CHARTER 2011
Howden: Index
1. Strategic overview
3. Thomassen Compression Systems
2. Coal-fired power
4. Summarised financials
5. Business development and growth drivers
63© CHARTER 2011
• China– Howden Hua – a leading Chinese player with Western
technologies
– 5 plants;
– 1,000 employees;
– 300 graduate engineers;
– Supplying critical components to US and Europe.
– Significant prospects
– Major opportunity to introduce Thomassen compressors
through established Howden channels;
– Power market stronger;
– 25% growth in power aftermarket;
– Other new products
– Transportation
– Wastewater
Howden: business development - BRIC
64© CHARTER 2011
• India– JV with Larsen & Toubro in May 2010; targeting 30% of Indian new build
power market
– Strengthening opportunities in steel and oil & gas sectors
– Economic growth and infrastructure development support future growth
– At the end of 2010, Howden had around £29m of outstanding orders to
customers in India
• Brazil– Acquired leading Brazilian competitor – 2008
– Developed facility – 2010
– Sales into ethanol, mining and oil & gas sectors
– Growth and resources drive opportunities
• Russia– Oil & gas – compressor opportunities
– Infrastructure and Olympics
– Resources – mining
– Future opportunity – power infrastructure
Howden: business development - BRIC
65© CHARTER 2011
• South Africa
– Mining – fans and refrigeration
– Power shortages – new build and maintenance
– Steel – strong position
– Aftermarket – leading position; recently signed a 5 year
maintenance contract with Eskom
• Australia
– Coal bed methane (CBM)
– A new market for screw compressors
– First contract for 72 bare shaft screw
compressors (in excess of £10m)
– Next order imminent
– Mining investment
– Strong aftermarket
– New compressor packaging acquisition
Howden: business development – resource-driven economies
66© CHARTER 2011
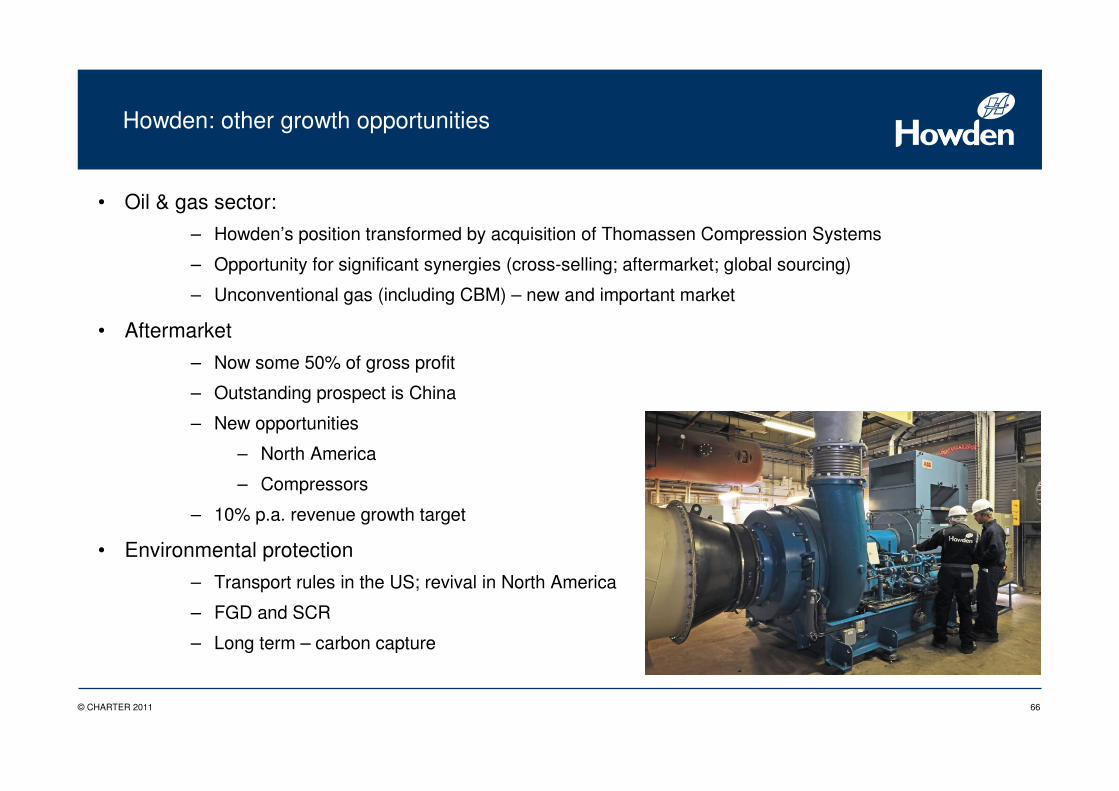
• Oil & gas sector:
– Howden’s position transformed by acquisition of Thomassen Compression Systems
– Opportunity for significant synergies (cross-selling; aftermarket; global sourcing)
– Unconventional gas (including CBM) – new and important market
• Aftermarket
– Now some 50% of gross profit
– Outstanding prospect is China
– New opportunities
– North America
– Compressors
– 10% p.a. revenue growth target
• Environmental protection
– Transport rules in the US; revival in North America
– FGD and SCR
– Long term – carbon capture
Howden: other growth opportunities
67© CHARTER 2011
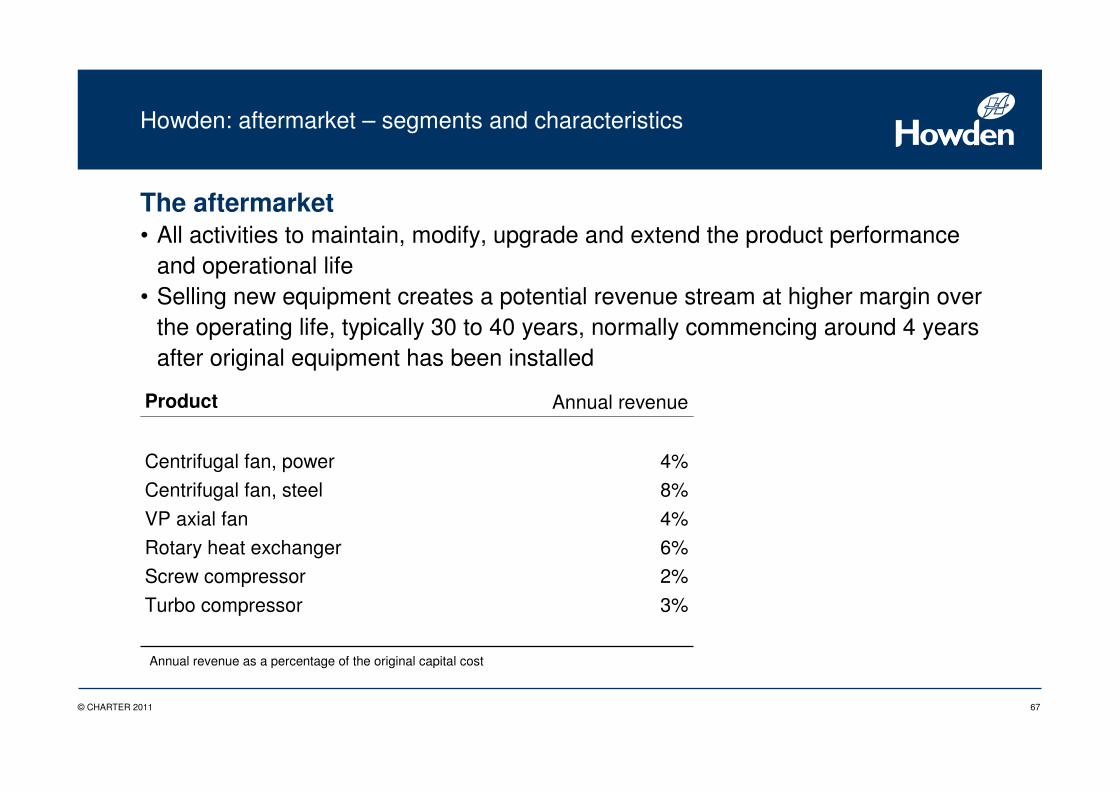
Howden: aftermarket – segments and characteristics
The aftermarket• All activities to maintain, modify, upgrade and extend the product performance
and operational life• Selling new equipment creates a potential revenue stream at higher margin over
the operating life, typically 30 to 40 years, normally commencing around 4 years after original equipment has been installed
2%Screw compressor
3%Turbo compressor
4%VP axial fan
8%Centrifugal fan, steel
6%
4%
Annual revenue
Centrifugal fan, power
Rotary heat exchanger
Product
Annual revenue as a percentage of the original capital cost

Financial highlights Charter International plc
69© CHARTER 2011
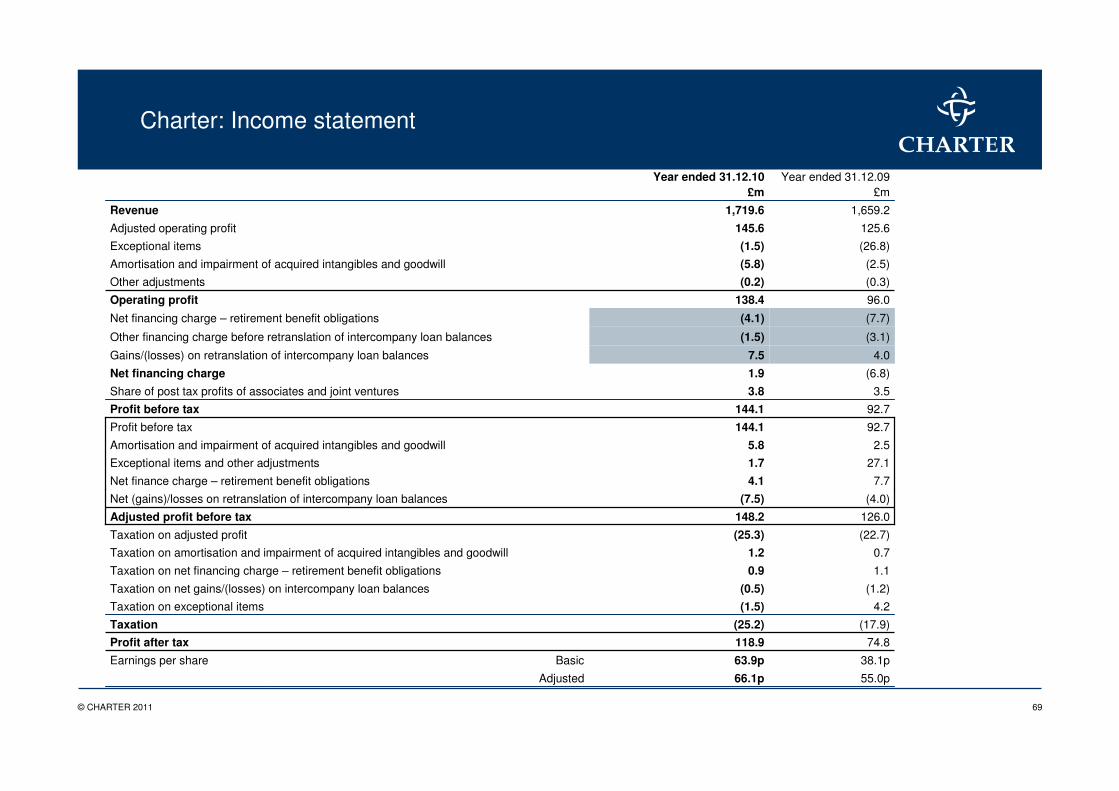
Charter: Income statement
(2.5) (5.8)Amortisation and impairment of acquired intangibles and goodwill
(7.7)(4.1)Net financing charge – retirement benefit obligations
1.10.9Taxation on net financing charge – retirement benefit obligations
7.74.1Net finance charge – retirement benefit obligations
(0.3)(0.2)Other adjustments
66.1p
63.9p
118.9
(25.2)
(1.5)
(0.5)
1.2
(25.3)
148.2
(7.5)
1.7
5.8
144.1
144.1
3.8
1.9
138.4
(1.5)
145.6
1,719.6
Year ended 31.12.10 £m
27.1Exceptional items and other adjustments
(26.8)Exceptional items
(4.0)Net (gains)/losses on retranslation of intercompany loan balances
2.5Amortisation and impairment of acquired intangibles and goodwill
126.0Adjusted profit before tax
92.7Profit before tax
Adjusted
Basic
1,659.2Revenue
125.6Adjusted operating profit
96.0Operating profit
(3.1)(1.5)Other financing charge before retranslation of intercompany loan balances
4.07.5Gains/(losses) on retranslation of intercompany loan balances
(6.8)Net financing charge
3.5Share of post tax profits of associates and joint ventures
92.7Profit before tax
(22.7)Taxation on adjusted profit
0.7Taxation on amortisation and impairment of acquired intangibles and goodwill
(1.2)Taxation on net gains/(losses) on intercompany loan balances
4.2Taxation on exceptional items
(17.9)Taxation
74.8Profit after tax
38.1pEarnings per share
55.0p
Year ended 31.12.09 £m
70© CHARTER 2011
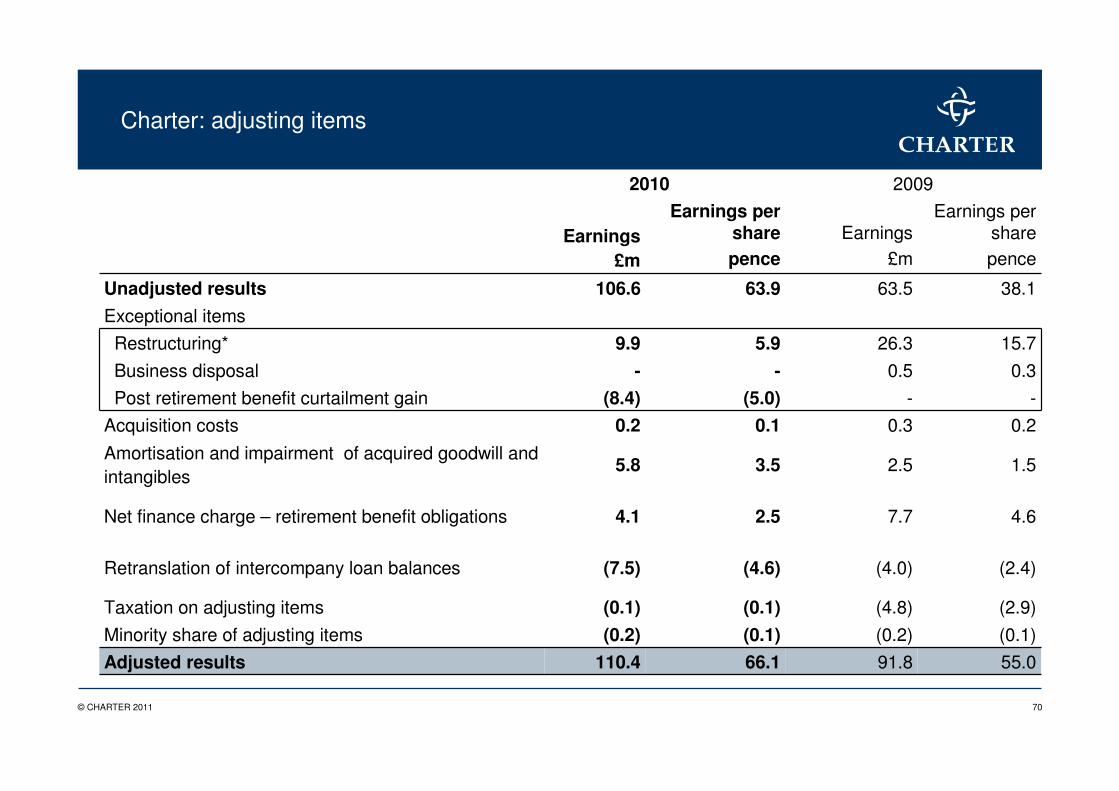
2010 2009
EarningsEarnings per
share EarningsEarnings per
share
£m pence £m pence
Unadjusted results 106.6 63.9 63.5 38.1
Exceptional items
Restructuring* 9.9 5.9 26.3 15.7
Business disposal - - 0.5 0.3
Post retirement benefit curtailment gain (8.4) (5.0) - -
Acquisition costs 0.2 0.1 0.3 0.2
Amortisation and impairment of acquired goodwill and intangibles
5.8 3.5 2.5 1.5
Net finance charge – retirement benefit obligations 4.1 2.5 7.7 4.6
Retranslation of intercompany loan balances (7.5) (4.6) (4.0) (2.4)
Taxation on adjusting items (0.1) (0.1) (4.8) (2.9)
Minority share of adjusting items (0.2) (0.1) (0.2) (0.1)
Adjusted results 110.4 66.1 91.8 55.0
Charter: adjusting items
71© CHARTER 2011
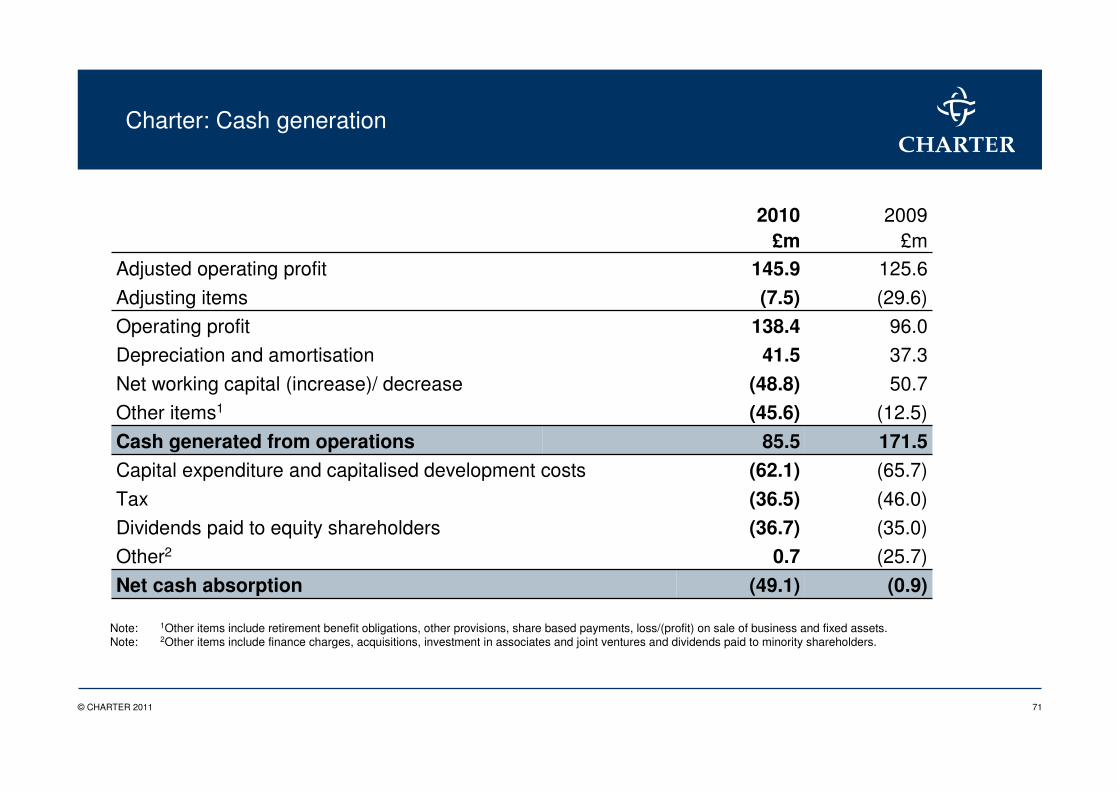
Charter: Cash generation
2010 2009£m £m
Adjusted operating profit 145.9 125.6
Adjusting items (7.5) (29.6)
Operating profit 138.4 96.0
Depreciation and amortisation 41.5 37.3
Net working capital (increase)/ decrease (48.8) 50.7
Other items1 (45.6) (12.5)
Cash generated from operations 85.5 171.5Capital expenditure and capitalised development costs (62.1) (65.7)
Tax (36.5) (46.0)
Dividends paid to equity shareholders (36.7) (35.0)
Other2 0.7 (25.7)
Net cash absorption (49.1) (0.9)
Note: 1Other items include retirement benefit obligations, other provisions, share based payments, loss/(profit) on sale of business and fixed assets.Note: 2Other items include finance charges, acquisitions, investment in associates and joint ventures and dividends paid to minority shareholders.
72© CHARTER 2011
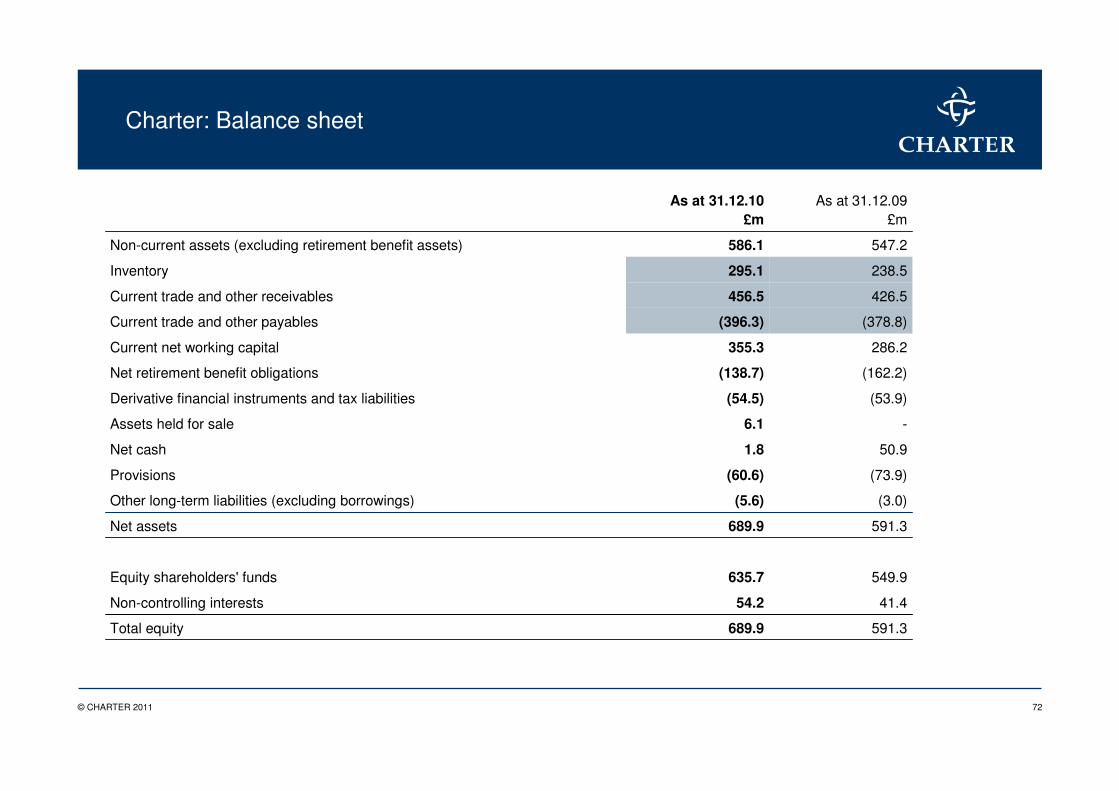
Charter: Balance sheet
-6.1Assets held for sale
689.9
54.2
635.7
689.9
(5.6)
(60.6)
1.8
(54.5)
(138.7)
355.3
(396.3)
456.5
295.1
586.1
As at 31.12.10£m
(53.9)Derivative financial instruments and tax liabilities
591.3Total equity
547.2Non-current assets (excluding retirement benefit assets)
238.5Inventory
426.5Current trade and other receivables
(378.8)Current trade and other payables
286.2Current net working capital
(162.2)Net retirement benefit obligations
50.9Net cash
(73.9)Provisions
(3.0)Other long-term liabilities (excluding borrowings)
591.3Net assets
549.9Equity shareholders' funds
41.4Non-controlling interests
As at 31.12.09£m
73© CHARTER 2011
Charter: Summary
• Market leadership
– ESAB: a world leader in welding with growing market share
– Howden: the global leader in air and gas handling
• Well positioned
– Business spread between developed and emerging economies
– Approximately 70 per cent of sales going either to emerging markets or the energy sector
• Manufacturing footprint
– Predominantly in low cost areas
– Timely restructuring of ESAB’s manufacturing base
• Charter – strong balance sheet
– Total Equity Shareholders’ Funds of £635.7 million and net cash of £1.8 million at 31 December 2010
• Dividend
– Increased dividend covered 2.9 times by earnings
• Well positioned to deliver growth potential in both businesses

Appendix 1
75© CHARTER 2011
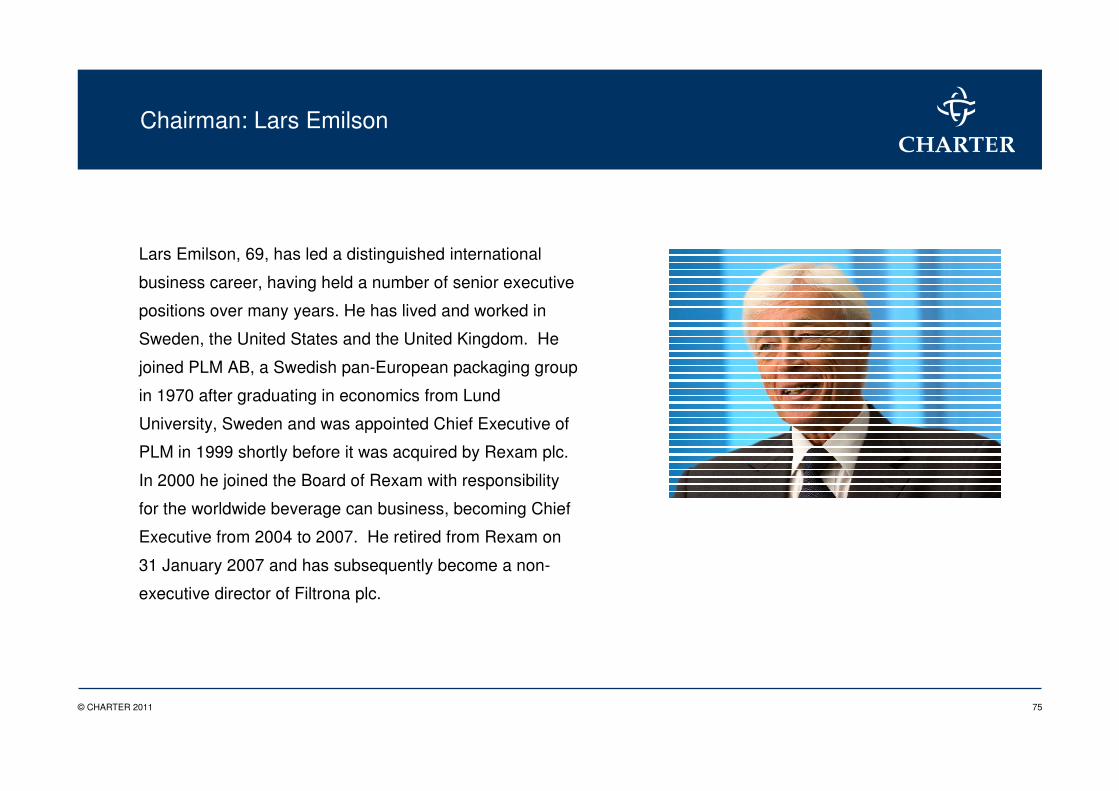
Chairman: Lars Emilson
Lars Emilson, 69, has led a distinguished international
business career, having held a number of senior executive
positions over many years. He has lived and worked in
Sweden, the United States and the United Kingdom. He
joined PLM AB, a Swedish pan-European packaging group
in 1970 after graduating in economics from Lund
University, Sweden and was appointed Chief Executive of
PLM in 1999 shortly before it was acquired by Rexam plc.
In 2000 he joined the Board of Rexam with responsibility
for the worldwide beverage can business, becoming Chief
Executive from 2004 to 2007. He retired from Rexam on
31 January 2007 and has subsequently become a non-
executive director of Filtrona plc.
76© CHARTER 2011
Chief Executive Officer: Michael Foster
Michael Foster, 58, joined Charter plc as a Non-
Executive Director in December 2001 and became an
Executive Director on 1 January 2005. He became
Chief Executive on 1 July 2006. He was formerly
Executive Director, responsible for UK, USA and
Ireland at RMC Group plc. He gained an Honours
Degree in Engineering and Electrical Sciences at
Cambridge University and is qualified as a solicitor.

Appendix 2
78© CHARTER 2011
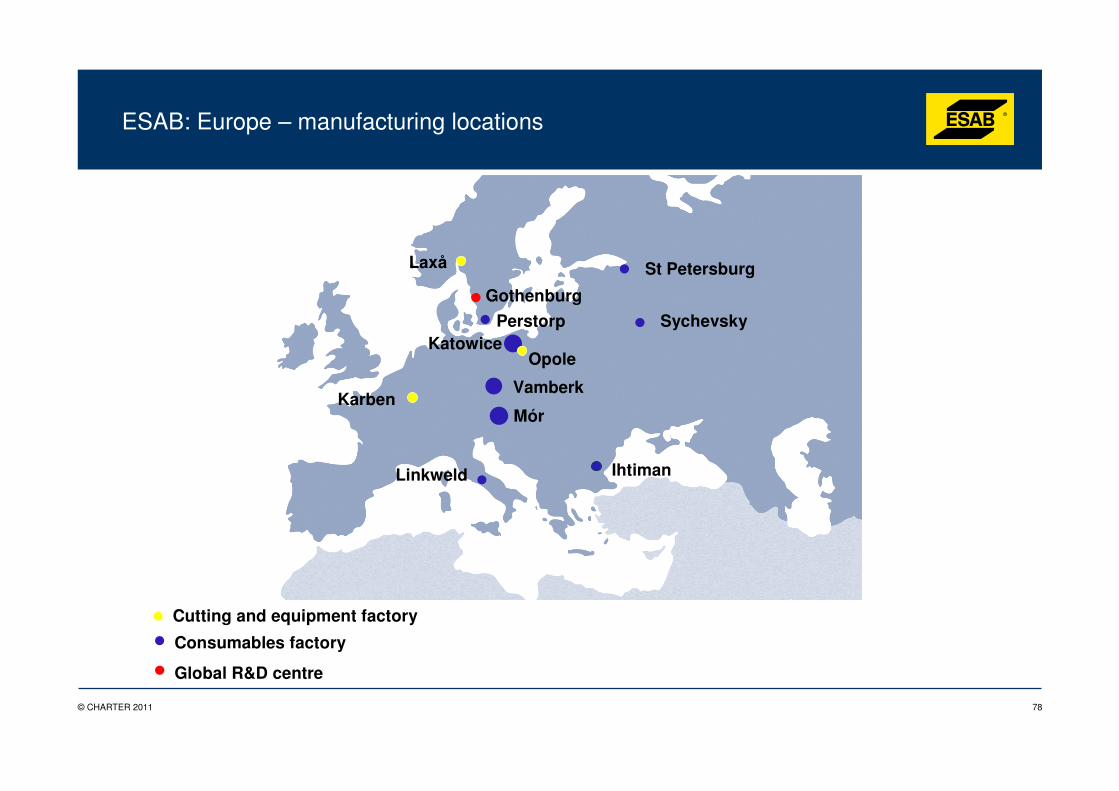
ESAB: Europe – manufacturing locations
St Petersburg
KatowicePerstorp
Vamberk
Mór
Ihtiman
Karben
Opole
Laxå
Cutting and equipment factory
Consumables factory
Global R&D centre
Linkweld
Gothenburg
Sychevsky
79© CHARTER 2011
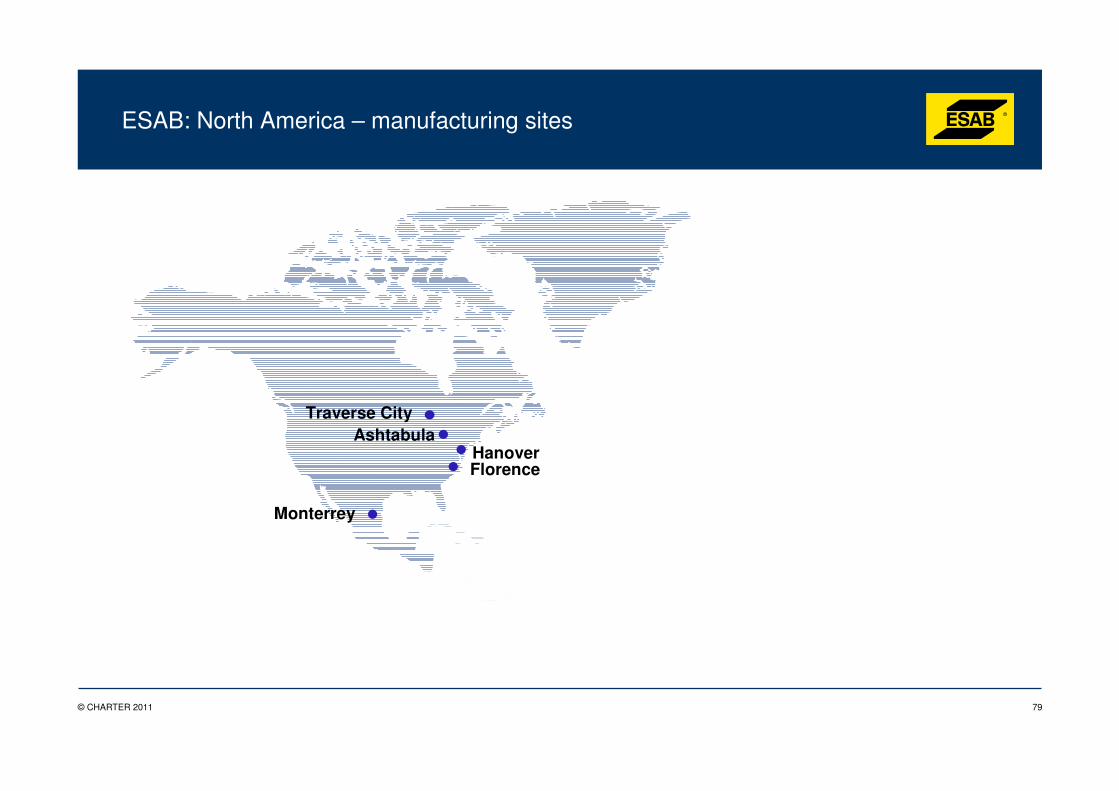
Traverse CityAshtabula
HanoverFlorence
Monterrey
ESAB: North America – manufacturing sites
80© CHARTER 2011
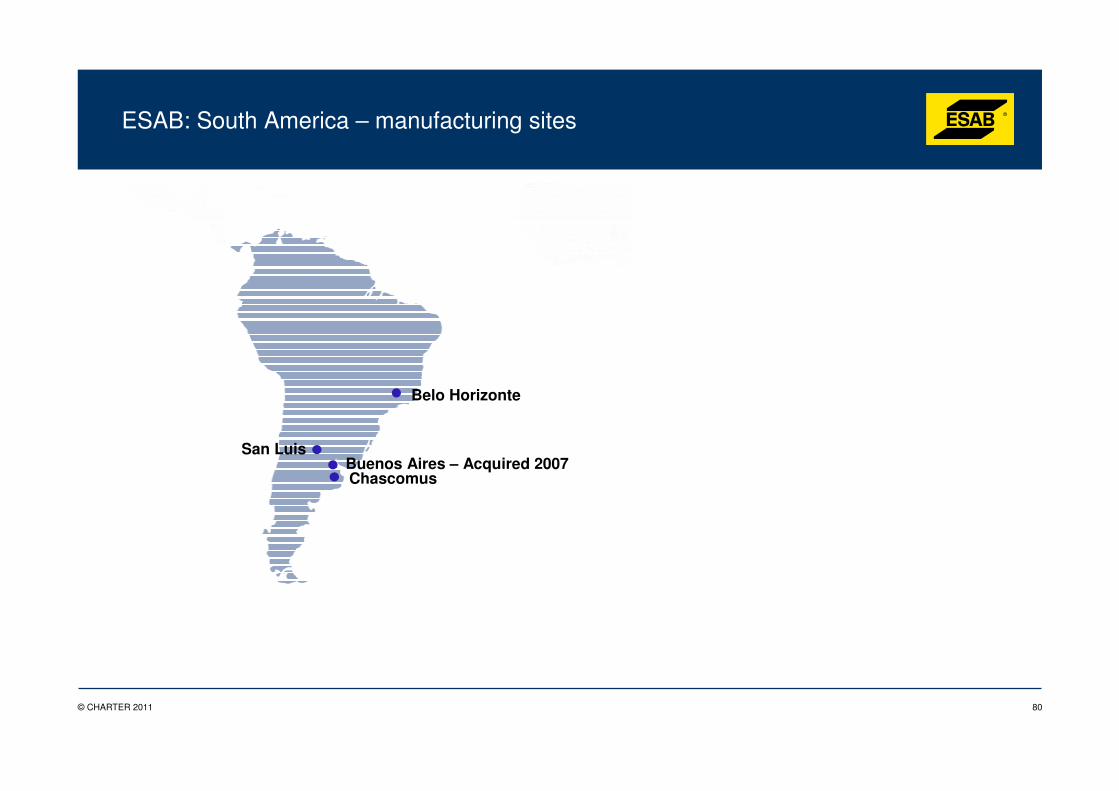
Belo Horizonte
Chascomus
San LuisBuenos Aires – Acquired 2007
ESAB: South America – manufacturing sites
81© CHARTER 2011
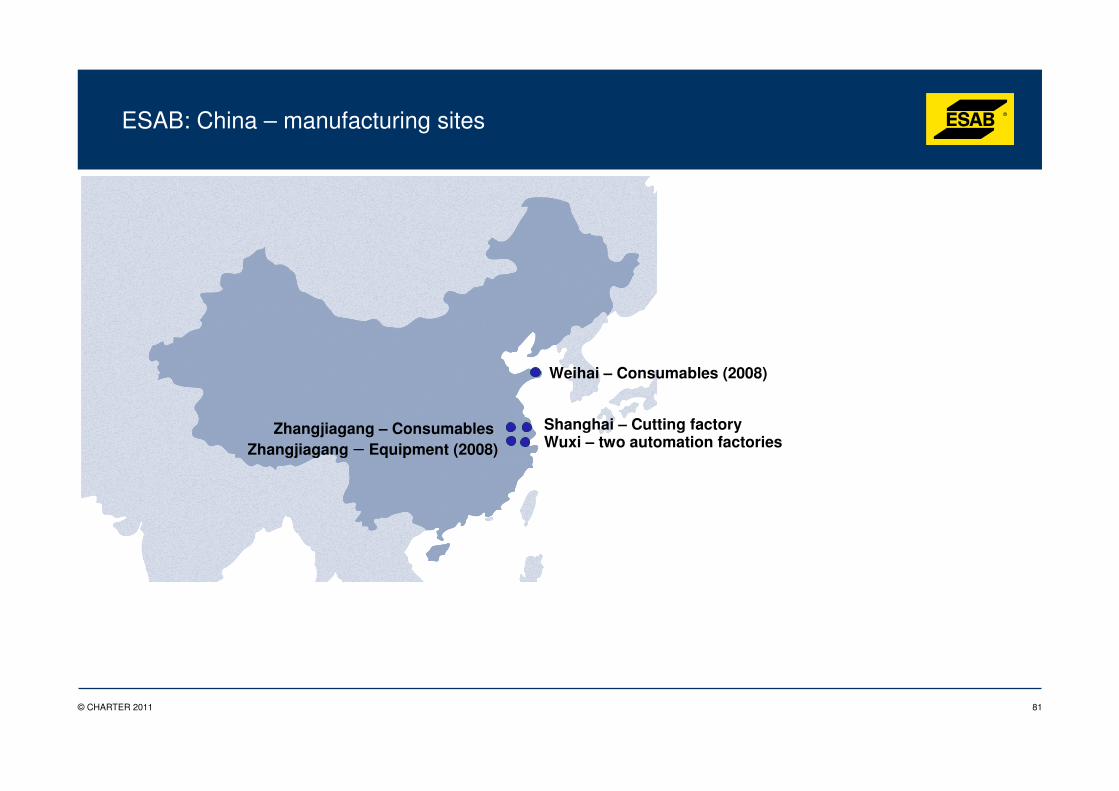
Weihai – Consumables (2008)
Shanghai – Cutting factoryZhangjiagang – Consumables Zhangjiagang – Equipment (2008)
ESAB: China – manufacturing sites
Wuxi – two automation factories
82© CHARTER 2011
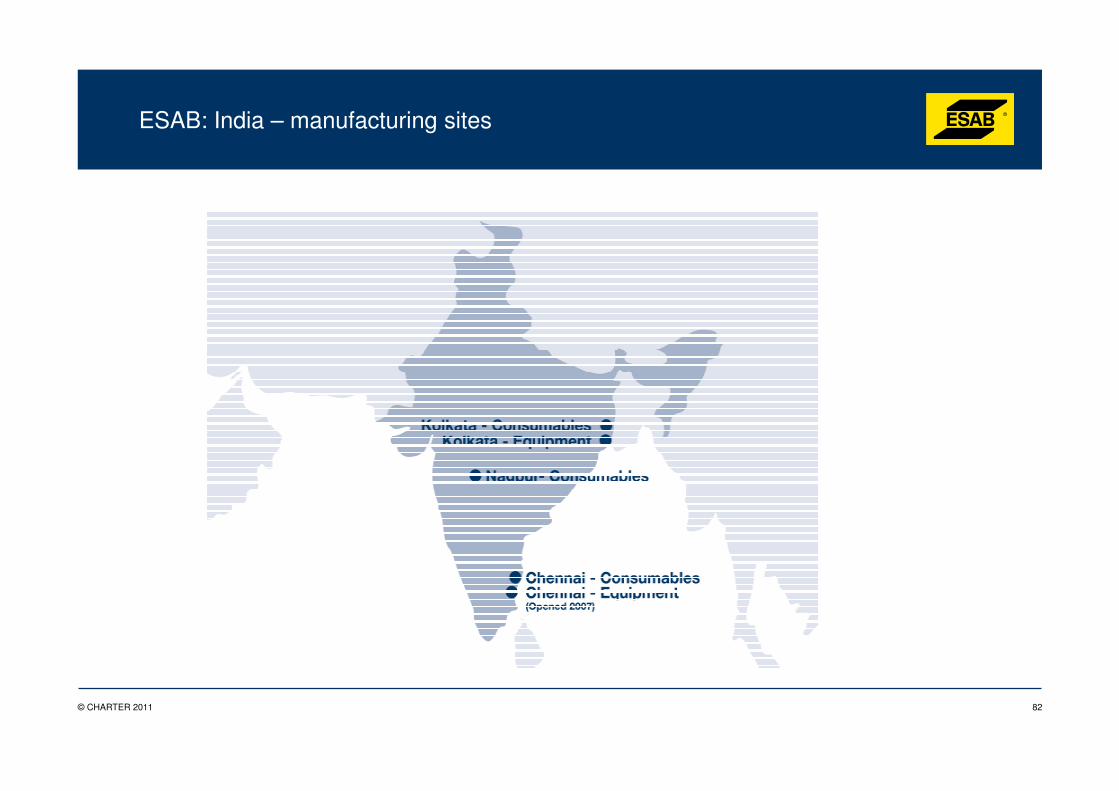
ESAB: India – manufacturing sites
83© CHARTER 2011
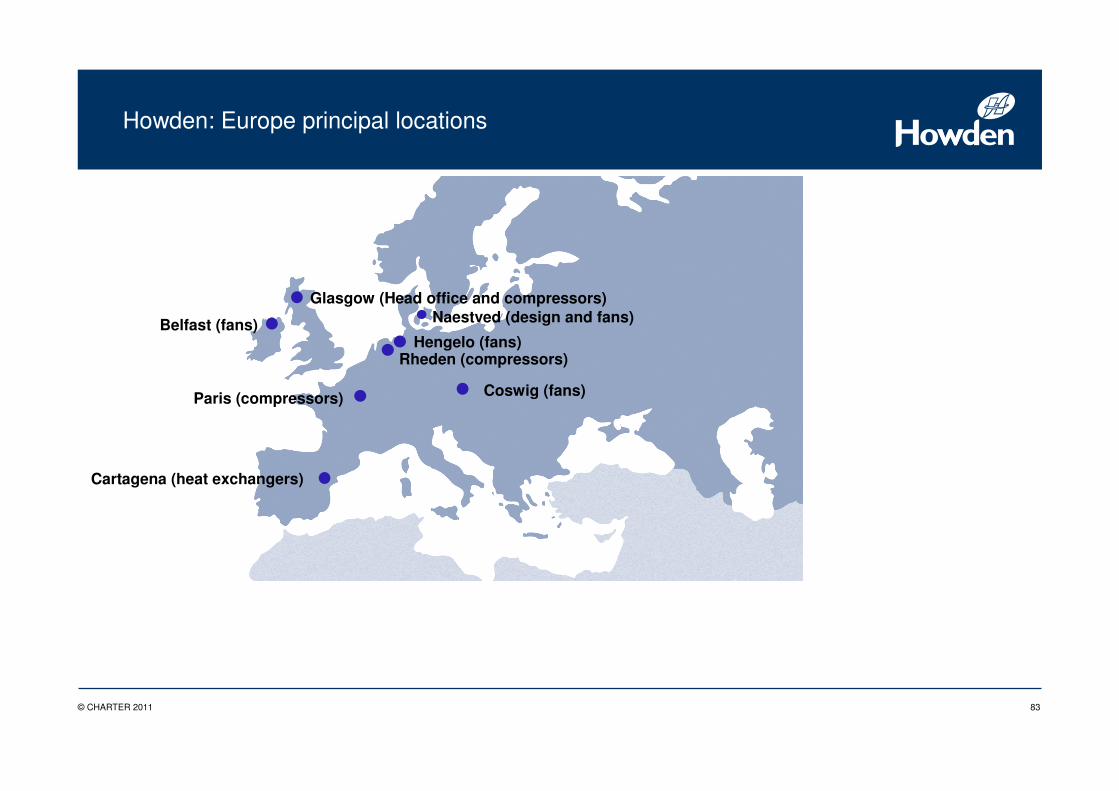
Howden: Europe principal locations
Coswig (fans)
Hengelo (fans)
Glasgow (Head office and compressors)
Belfast (fans)
Paris (compressors)
Cartagena (heat exchangers)
Naestved (design and fans)
Rheden (compressors)
84© CHARTER 2011
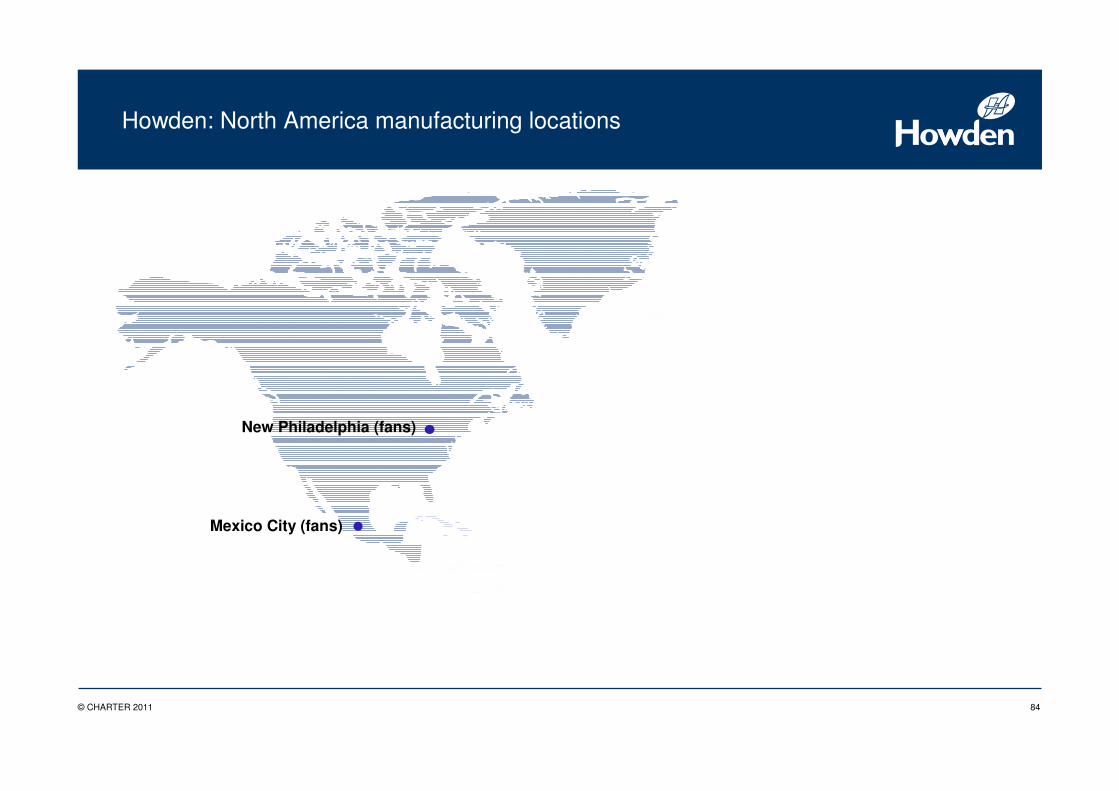
New Philadelphia (fans)
Mexico City (fans)
Howden: North America manufacturing locations
85© CHARTER 2011
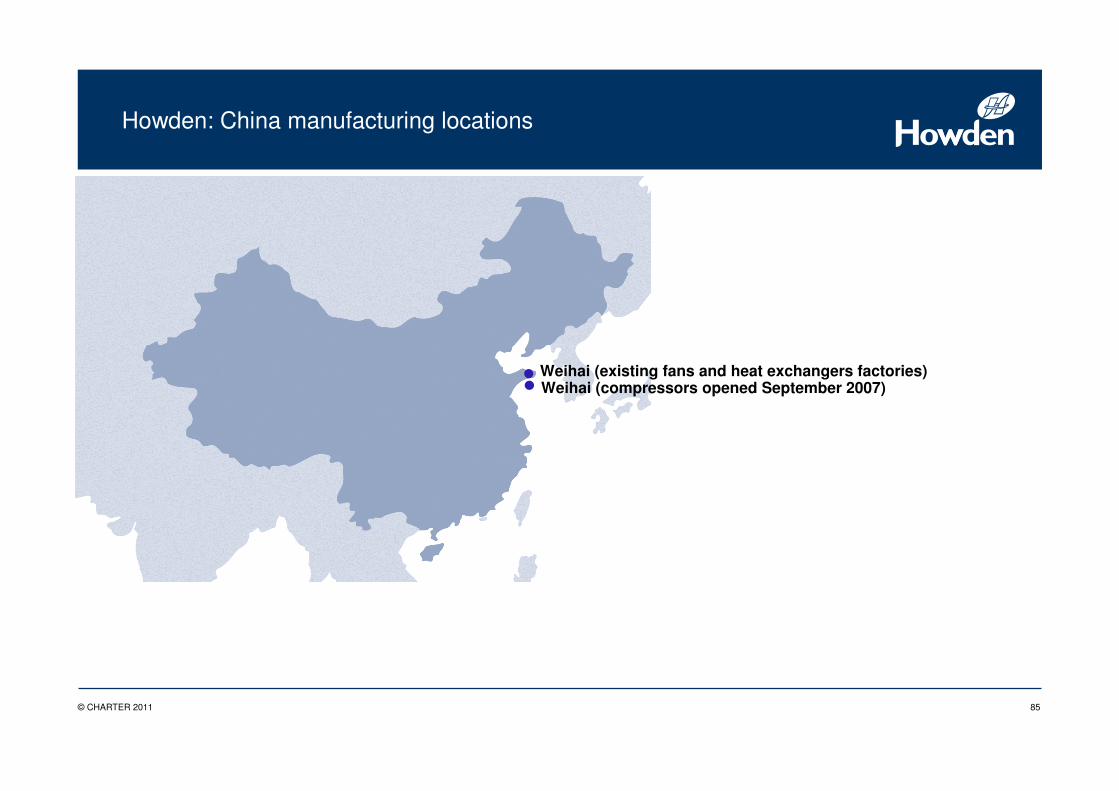
Howden: China manufacturing locations
Weihai (existing fans and heat exchangers factories)Weihai (compressors opened September 2007)
86© CHARTER 2011
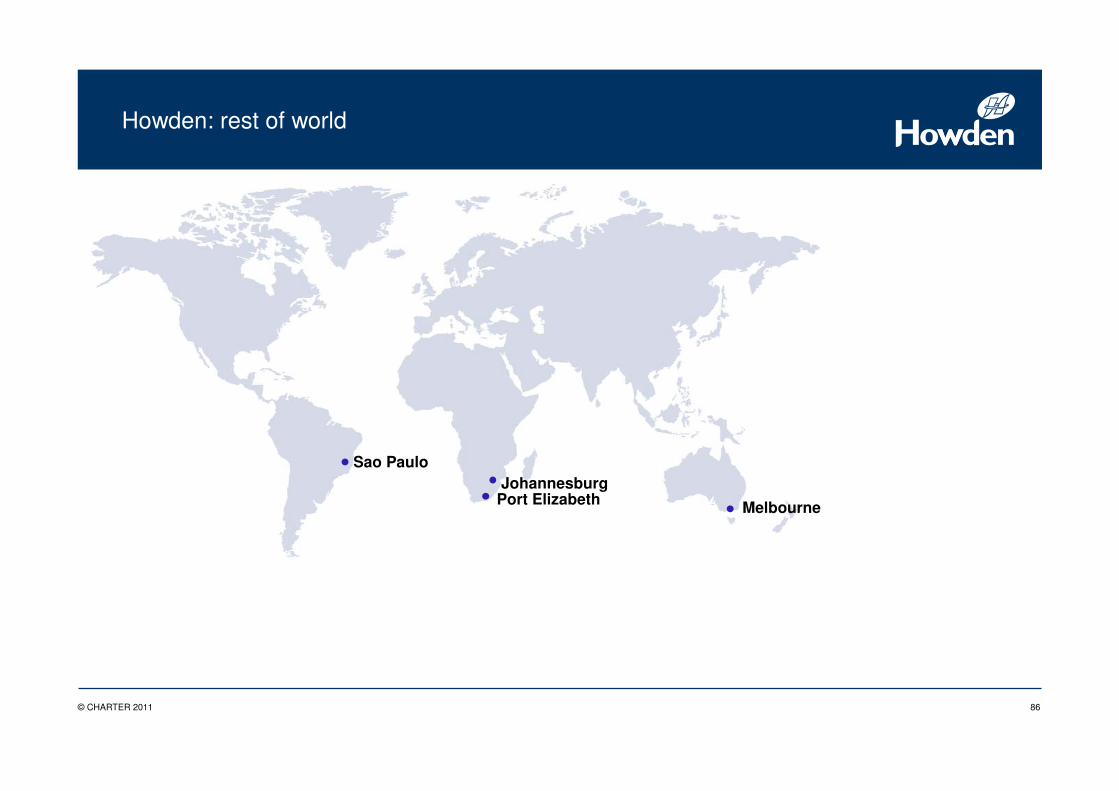
Johannesburg
Melbourne
Sao Paulo
Howden: rest of world
Port Elizabeth
87© CHARTER 2011
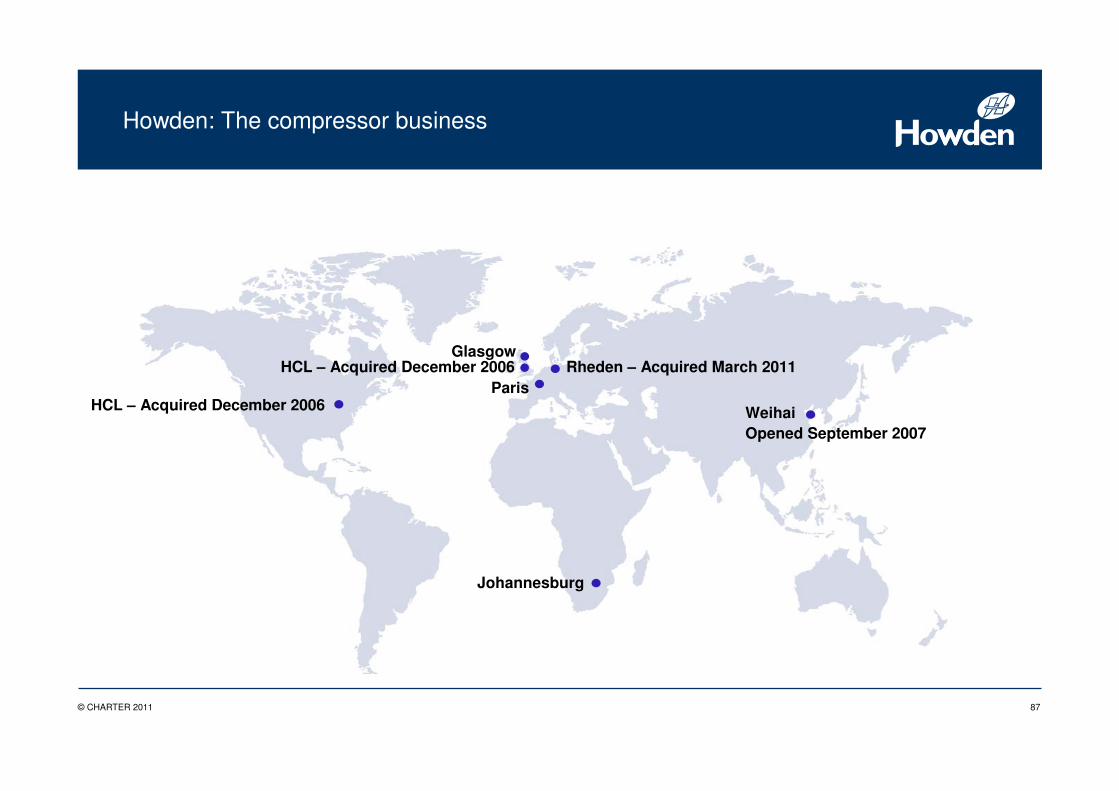
Howden: The compressor business
HCL – Acquired December 2006Paris
HCL – Acquired December 2006
Johannesburg
Glasgow
WeihaiOpened September 2007
Rheden – Acquired March 2011