Embed Size (px)
DESCRIPTION
Due to improvements in methods of production and design, owning a Special Light Sport Aircraft (S-LSA) has become increasingly popular over the past few years. However, with the expected increase in oil prices plus stricter environmental regulations, the ever rising operating cost limits the market for this type of aircraft. Through the recent advancements in electric motor design and battery technologies, new avenues are enabled for the next generation of S-LSAs which allow them to be more affordable, more reliable, and safer than models presently in production. This proposal describes the design of Azalzan, a fully electric S-LSA which implements state of the art electric propulsion technology as well as innovative features, promising an overall reduction in the operating cost through the elimination of the dependency on aviation fuel.
Citation preview

2010-2011 AIAA Foundation
Team Aircraft Design Competition
-Proposal-
USC Advanced Commercial Concepts Presents:
Azalzan
University of Southern California
University of California, Los Angeles
California State University, Los Angeles.

2
Table of Contents Nomenclature .................................................................................................................................................. 4 Acknowledgement .......................................................................................................................................... 7 Executive Summary ........................................................................................................................................ 8 Requirements Matrix ................................................................................................................................... 10 Configuration Highlights ........................................................................................................................... 11 1.0 Design Methodology ....................................................................................................................... 12 2.0 Preliminary Sizing ............................................................................................................................ 13 2.1 Preliminary Aerodynamic Analysis ......................................................................................................... 13 2.2 Battery Technology Evaluation ............................................................................................................... 14 2.3 Mission Analysis ........................................................................................................................................ 15 2.4 Preliminary Weight Analysis .................................................................................................................... 16 2.5 Performance Sizing Chart ........................................................................................................................ 17 3.0 Market Analysis ................................................................................................................................. 18 4.0 Configuration Trade-offs ................................................................................................................ 21 4.1 Sensitivity Analysis .................................................................................................................................... 21 4.2 Configuration Selection ............................................................................................................................ 22 5.0 Configuration Description ............................................................................................................. 24 5.1 Fuselage Geometry .................................................................................................................................... 24 5.2 Cockpit & Ergonomics ............................................................................................................................. 24 5.3 Cockpit Access ........................................................................................................................................... 26 5.4 Cargo Stowage ........................................................................................................................................... 26 5.5 Wing Planform, Winglets, and Folding Mechanism ............................................................................. 27 5.6 Empennage ................................................................................................................................................. 28 5.7 Propeller ...................................................................................................................................................... 28 5.8 Electric Motor ............................................................................................................................................ 29 5.9 Landing Gear.............................................................................................................................................. 30 5.10 3-View Foldout ........................................................................................................................................ 31 5.11 Inboard Profile ......................................................................................................................................... 32 6.0 Aerodynamics .................................................................................................................................... 33 6.1 Airfoil Design ............................................................................................................................................. 33 6.2 Wing Planform Optimization .................................................................................................................. 34 6.3 Winglets....................................................................................................................................................... 36 6.4 High Lift Devices ...................................................................................................................................... 36 6.5 Wetted Area Distribution ......................................................................................................................... 37 6.6 Detailed Drag Polars and Breakdown .................................................................................................... 38 6.7 Full Airplane CFD Drag Verification ..................................................................................................... 39 7.0 Structural Analysis ............................................................................................................................ 43 7.1 Loads V-n Diagram ................................................................................................................................... 43 7.2 Fuselage Structure ..................................................................................................................................... 44 7.3 Landing Gear Attachment and Structure ............................................................................................... 45 7.4 Wing Structure ........................................................................................................................................... 46 7.5 Wing Flutter Considerations .................................................................................................................... 48 7.6 Empennage Structure................................................................................................................................ 51 7.7 Manufacturing Methods ........................................................................................................................... 51 8.0 Propulsion ........................................................................................................................................... 52 8.1 Electromotor Type Selection ................................................................................................................... 52 8.2 Propeller ...................................................................................................................................................... 52 9.0 Electrical Systems ............................................................................................................................. 55 9.1 Electrical Storage ....................................................................................................................................... 55 9.2 Electric Distribution Architecture .......................................................................................................... 56

3
9.3 Avionics and Secondary Electrical Components .................................................................................. 56 9.4 Electric System ........................................................................................................................................... 58 10.0 Systems Integration ......................................................................................................................... 60 10.1 Heat Management ................................................................................................................................... 60 10.2 CFD Verifications ................................................................................................................................... 61 10.3 Flight Control System ............................................................................................................................. 63 10.4 Steering and Brakes ................................................................................................................................. 63 10.5 Mechanical Systems Integration Foldout ............................................................................................. 65 11.0 Weight Justification & Analysis ................................................................................................... 66 11.1 Detailed Weight Analysis ....................................................................................................................... 66 11.2 Class III Weight Estimation .................................................................................................................. 67 11.3 Exploded Weight Group Foldout ......................................................................................................... 68 11.4 Center of Gravity Analysis ..................................................................................................................... 69 12.0 Stability and Control ........................................................................................................................ 70 12.1 Loading Cases .......................................................................................................................................... 70 12.2 Balance, CG Travel, and Wing Location ............................................................................................. 70 12.3 Tail Sizing and Trim Diagram ............................................................................................................... 71 12.4 Stability & Control Derivatives ............................................................................................................. 71 12.5 Aileron Sizing ........................................................................................................................................... 73 12.6 Dynamic Stability ..................................................................................................................................... 73 12.7 Propeller Tilting ....................................................................................................................................... 74 13.0 Performance ....................................................................................................................................... 75 13.1 Performance of Installed Powerplant ................................................................................................... 75 13.2 Takeoff Performance .............................................................................................................................. 75 13.3 Climb Performance ................................................................................................................................. 76 13.4 Maximum Cruise Speed .......................................................................................................................... 76 13.5 Maneuvering Performance ..................................................................................................................... 77 13.6 Endurance ................................................................................................................................................ 77 13.7 Landing Trajectory .................................................................................................................................. 78 13.8 Stall Speed ................................................................................................................................................. 78 13.9 Noise Assessment.................................................................................................................................... 79 14.0 Maintenance & Operations ........................................................................................................... 80 14.1 T-Hangar & Storage ................................................................................................................................ 80 14.2 Battery Recharging Performance .......................................................................................................... 81 14.3 Battery Lifecycle & Replacement .......................................................................................................... 81 14.4 Extended Endurance Battery Package ................................................................................................. 82 14.5 Regular Inspections ................................................................................................................................. 83 14.6 Accessibility Picture ................................................................................................................................ 84 15.0 Safety Features and Analysis ......................................................................................................... 85 15.1 Deep Stalls and Propeller Tilting .......................................................................................................... 85 15.2 Parachute Deployment ........................................................................................................................... 85 15.3 G Seats, Seatbelts, and Airbags ............................................................................................................. 86 15.4 Wings Folded ........................................................................................................................................... 86 15.5 Lightning Strike ....................................................................................................................................... 87 16.0 Cost & Risk Analysis ................................................................................................................... 88 16.1 Market Forecast ....................................................................................................................................... 88 16.2 Project Risk Assessment ......................................................................................................................... 88 16.3 Itemized Cost Estimation ...................................................................................................................... 89 16.4 Operating Cost ......................................................................................................................................... 92 References ....................................................................................................................................................... 93

4
Nomenclature A Blade wetted area α Angle of attack ARW Wing aspect ratio γ Average flight path angle Ca/Cw Aileron chord to wing chord ratio CD Airplane drag coefficient
cleanTO DD C,C 00 Airplanes zero-lift drag coefficient at takeoff, clean configuration
bladedC Average Blade Drag Coefficient CGR Climb Gradient
)Clean(SmaxLC Maximum lift coefficient for clean stall configuration
TOmaxLC
Maximum lift coefficient at takeoff
MaxR,optLC Lift coefficient correspond to the optimum range performance
alC Airplane rolling-moment-coefficient due to ailerons deflection
,αmC Airplane pitching-moment-coefficient-due-to-AOA derivative
)(PTmTC Airplane moment-coefficient-due-to-thrust-from-prop-tilting
βlC Airplane rolling-moment-coefficient-due-to-yaw rate-derivative
βnC Airplane yawing-moment-coefficient-due-to-side-slip-derivative CP Coefficient of Pressure d/D Ratio of the radome diameter to the average diameter of the mid fuselage Dp Diameter of the propeller Δh Change in altitude
long,Pζ Longitudinal phugoid mode damping ratio
SPζ Short period mode damping ratio
fiη Flap inboard station, in term of wing half span
fOη Flap outboard station, in term of wing half span
BxxI , ByyI ,
BzzI Moment of inertia along the body axis
PLevel Level for phugoid stability
SPLevel ξ Level for short period damping
Lift-to-Drag ratio at takeoff wλ Wing taper ratio
Λw
Wing sweep angle
ΛLE Leading edge wing sweep mb Blade mass NPfree Free stick neutral point npull-up Load factor during pull-up maneuver nturn Load factor during turning maneuver P1,2 Intermediate parameters to compute Phillip’s angle PSpExPwr Specific Excess Power
TOΠ Engine setting at takeoff Q1 Dynamic Pressure
R/C Rate of climb
TODL

5
Rturn Radius of maneuvering turn Sair Distance from obstacle height to the point of touchdown SL Landing distance SLG Ground roll landing distance SMfree Stick free static margin
TOS Total field length
TOGS Take-off ground run distance
WS Wing surface area SM Static margin t(1→3) Time to climb
P21T Time to half amplitude in phugoid mode
Tavail Thrust available Treq Thrust required v0 Initial tangential blade velocity at blade center of mass VA Approach speed
MaxCrV Maximum cruise speed
LOFV Speed at liftoff Vm Speed in maneuver VS Stall speed VSL Landing stall speed
TOSV Takeoff stall speed WE Empty weight Wfix Weight of Fixed Equipment WPL Weight of the payload WPP Weight of the powerplant WStructure Weight of the structure WTO Takeoff weight WTO,Extended Takeoff weight, extended mission WTO, Light Takeoff weight, light mission ( )
maxTOSW Maximum take-off wing loading
( )maxTOT
W Maximum take-off power loading
φ Thrust vector inclination with respect to freestream airflow X coordinate of the wing apex (i.e. distance b/w wing quarter chord station and
the nose reference point)
acx ,wfacx ,
hacx X coordinate of aerodynamic center in terms of mean aerodynamic chord CGX , CGY , CGZ Location of center of gravity
cgx X coordinate of center of gravity in terms of mean aerodynamic chord
long,Pnω Longitudinal phugoid mode undamped natural frequency
P.S,nω Short period undamped natural frequency Ω Phillip’s angle (Impingement angle) of a released blade
WapexX

6
Acronyms: AAA Advanced Aircraft Analysis AIAA American Institute of Aeronautics and Astronautics AIMC Aircraft Information Management Computer ACE Actuator Control Electronics CAD Computer Aided Design AR Aspect Ratio CFD Computational Fluid Dynamics CFRP Carbon-fiber reinforced plastics cfm Cubic Feet per Minute CG Center of Gravity DOC Direct Operating Cost DSM Design Structure Matrix EPNdB Effective Perceived Noise in Decibels ESDU Engineering Sciences Data Unit E/E Electrical/Electronics EIS Entry into Service Date ERP Extended Range Pack FAA Federation Aviation Administration FAR Federal Air Regulation FEA Finite Element Analysis fpm Feet per minute GAMA General Aviation Manufacturers Association ICA Initial Cruise Altitude ISA International Standard Atmosphere L/D Lift-to-Drag Ratio LAMA Light Aircraft Manufacturers Association LSA Light Sport Aircraft MFD Multi-Function Display MLW Maximum Landing Weight NLF Natural Laminar Flow RDTE Research Development Testing and Evaluation RFP Request for Proposal RMPU Remote Power Management Unit RPM Revolutions per Minute SAE Society of Automotive Engineers SAR Specific Air Range S-LSA Special Light Sport Aircraft UACC University of Southern California Advanced Commercial Concepts USAF United States Air Force

7
Acknowledgement We would like to express our appreciation for the help and support given by the faculty of
USC’s Aerospace and Mechanical Engineering department. First of all, we wish to thank the people who
were integral to the creation of this project: Dr. Geoff Spedding, Mr. Blaine Rawdon, and Mr. Mark Page. With
their experience in the field of aircraft design, they have been very supportive in all the phases of this
project. During the first year of his retirement, Dr. Ron Blackwelder contributed greatly to all aspects of
this project, including organizational support for team members. Dr. Daniel P. Raymer, president of the
Conceptual Design Corporation, also contributed greatly by providing well needed advice and feedback.
Special thanks are also due to Marc Aubertine in USC’s engineering writing program for his contribution
to the organization and composition of this proposal. During the development of this aircraft, UACC
was provided with information regarding subsystem components and technologies presently under
development in various fields: Martin Gabrielsson, CIO of Amapola Flyg, Sweden, provided great
information regarding the present development of an iPad based avionics cluster. Dr. Lutgard C. De
Jonghe, Faculty Senior Scientist at Lawrence Berkeley National Labs and Dr. Binod Kumar, from the
University of Dayton Research Institute, provided UACC with critical information regarding the
advancements in Lithium-Air battery technology. Also, great mentorship was provided by Mr. Marty
Bradley of The Boeing Company with regard to electric aircraft architecture and subsystems.
We would also like to express appreciation for faculty and staff both at USC and UCLA, whose
contributions made this project possible. Firstly, USC´s Aerospace Engineering Department faculty and
staff including Dr. David Wilcox, Dr. Hai Wang, Samantha Graves, David Salter, and Silvana Martinez-Vargas
contributed greatly by providing organizational support. Dr. Jeff D. Eldredge, Associate Professor of
UCLA’s Department of Aerospace and Mechanical Engineering, assisted the team with regard to
aerodynamic design. Last but not least, we wish to give thanks to all our friends and family for being
there, providing both an understanding and supportive attitude in a multitude of ways.
May 2011, Los Angeles USC’s Advanced Commercial Concepts Team
8
Executive Summary ue to improvements in methods of production and design, owning a Special Light Sport
Aircraft (S-LSA) has become increasingly popular over the past few years. However, with
the expected increase in oil prices plus stricter environmental regulations, the ever rising operating
cost limits the market for this type of aircraft. Through the recent advancements in electric motor
design and battery technologies, new avenues are enabled for the next generation of S-LSAs which
allow them to be more affordable, more reliable, and safer than models presently in production.
This proposal describes the design of Azalzan, a fully electric S-LSA which implements state
of the art electric propulsion technology as well as innovative features, promising an overall
reduction in the operating cost through the elimination of the dependency on aviation fuel. Azalzan
also implements a specialized prop-tilting mechanism to improve its safety in recovering from a
deep stall (a situation not uncommon with S-LSAs). As with all aircraft designs, emphasis is placed
on obtaining a fail-safe configuration that complies with industry and federal standards for Light
Sport Aircraft.
From the standpoint of aerodynamic configuration, Azalzan utilizes high aspect ratio folding
wings that provide compatibility with current airport infrastructure while increasing overall
aerodynamic efficiency. Natural laminar flow technologies, verified using high resolution
Computational Fluid Dynamics (CFD) simulations, are employed heavily in order to further reduce
the friction drag produced by the airframe. The high aspect ratio wing planform dictates a need for
particular attention to the structural design of the wing components to avoid aero-elastic flutter.
Numerical methods and tools were developed to accomplish this task and ensure that the speed at
which flutter of the wing structure occurs is well above the maximum speed anticipated in the flight
envelope for Azalzan. Carbon fiber composite components were used extensively throughout the
structure enabling substantial weight reductions, as well as making the high aspect ratio wing
planform structurally feasible.
D

9
Azalzan features a specially designed, high performance Lithium-Air battery package, with
the configuration providing room for an additional battery unit for extended-range missions. The
electrical circuit and power management system has been fully designed and analyzed, enabling the
accurate quantification of energy consumption and heat generation at each component to be
addressed by the thermal management system.
During the conceptual design phase of the project, it was realized that the utilization of a
fully electric power architecture presents difficulties with respect to thermal management. Due to
limited volume and large amounts of dissipated heat, as well as the inherent inefficiency of
composite structures in conducting thermal energy, design and implementation of effective heat
management solutions received significant attention. High fidelity numerical tools were utilized to
perform thermal simulations ensuring the effectiveness of the designed system even in the most
critical flight scenarios.
As the intended users of the aircraft include aviation enthusiasts and private pilots who
would use the aircraft for leisure purposes, particular attention was paid to the ergonomics of the
cockpit interior, payload compatibility, and occupant visibility. Further, noise reduction played a
decisive role in determining the technology level for the propeller system integrated into the design.
A wide variety of expertise was utilized due to the large number of disciplines involved and
the high level of detail intended for the project. Team members from the University of Southern
California, University of California, Los Angeles, and California State University, Los Angeles
majoring in Aerospace Engineering, Mechanical Engineering, Electrical Engineering, Computer
Science, and Physics collaborated on various aspects of the project to develop the final design.
Given the high level of detail considered and the high fidelity of the analysis methods
utilized, it is the unilateral belief of UACC that Azalzan represents an astute blend of design
innovation, technology integration, and cost effectiveness presently unmatched by any similar craft
in the market.
10
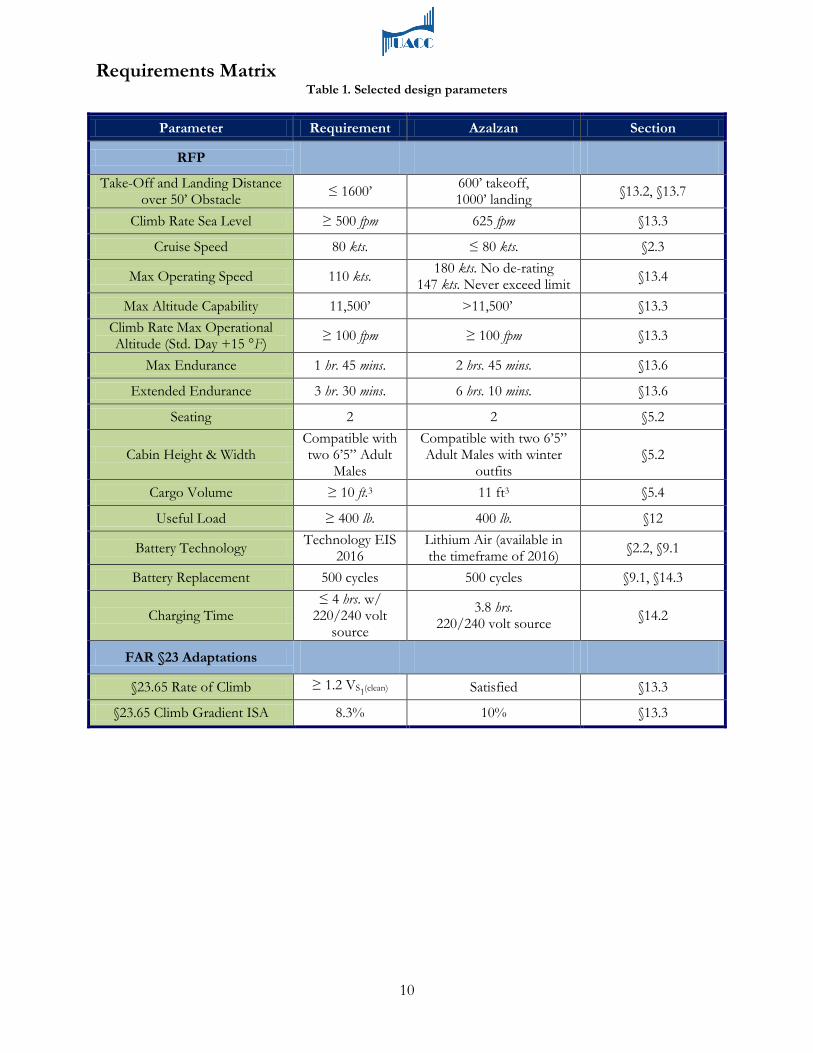
Requirements Matrix Table 1. Selected design parameters
Parameter Requirement Azalzan Section
RFP
Take-Off and Landing Distance over 50’ Obstacle ≤ 1600’ 600’ takeoff,
1000’ landing §13.2, §13.7
Climb Rate Sea Level ≥ 500 fpm 625 fpm §13.3
Cruise Speed 80 kts. ≤ 80 kts. §2.3
Max Operating Speed 110 kts. 180 kts. No de-rating 147 kts. Never exceed limit §13.4
Max Altitude Capability 11,500’ >11,500’ §13.3 Climb Rate Max Operational Altitude (Std. Day +15 °F) ≥ 100 fpm ≥ 100 fpm §13.3
Max Endurance 1 hr. 45 mins. 2 hrs. 45 mins. §13.6
Extended Endurance 3 hr. 30 mins. 6 hrs. 10 mins. §13.6
Seating 2 2 §5.2
Cabin Height & Width Compatible with two 6’5” Adult
Males
Compatible with two 6’5” Adult Males with winter
outfits §5.2
Cargo Volume ≥ 10 ft.3 11 ft3 §5.4
Useful Load ≥ 400 lb. 400 lb. §12
Battery Technology Technology EIS 2016
Lithium Air (available in the timeframe of 2016) §2.2, §9.1
Battery Replacement 500 cycles 500 cycles §9.1, §14.3
Charging Time ≤ 4 hrs. w/
220/240 volt source
3.8 hrs. 220/240 volt source §14.2
FAR §23 Adaptations
§23.65 Rate of Climb ≥ 1.2 VS1(clean) Satisfied §13.3
§23.65 Climb Gradient ISA 8.3% 10% §13.3

Nat
ural
Lam
inar
Flo
w
fuse
lage
U
ltra
high
visi
bilit
y tw
o pa
ssen
ger c
ockp
it V
ery
low
noi
se c
abin
Nat
ural
Lam
inar
Flo
w
high
asp
ect r
atio
fo
ldin
g w
ings
Adv
ance
d hi
gh
effic
ienc
y w
ingl
ets
80 h
p lig
htw
eigh
t low
m
aint
enan
ce D
C
Thru
st v
ecto
ring
prop
elle
r tilt
ing
syst
em fo
r STO
L op
erat
ions
Cus
tom
des
igne
d 8
blad
e ca
rbon
fib
er lo
w n
oise
hig
h ef
ficie
ncy
prop
elle
r
Thru
st p
rodu
cing
act
ive
ther
mal
m
anag
emen
t sys
tem
Equ
ippe
d w
ith a
n em
erge
ncy
reco
very
par
achu
te
Hig
h ca
paci
ty lo
w w
eigh
t lit
hium
air
expa
ndab
le
rang
e ba
ttery
Ultr
a hi
gh li
ft hi
gh d
efle
ctio
n pr
opel
ler a
ugm
ente
d fla
ps
12
1.0 Design Methodology he general design philosophy of Azalzan has been substantially influenced by
methodology presented by Jan Roskam1 and Ed Heinemann2
Design Structure Matrix (DSM), a modern method of development management, was used
in order to determine the optimum design process. This method, described by Eppinger et al.
. It should be noted that
these methods are often quite extensive and cover technical aspects of the analysis in great detail.
The majority of calculations performed and referenced within this proposal use published graphs
and tables in order to determine the constants and parameters, often consisting of multiple time-
consuming iterations. While the theoretical backgrounds of these methods are discussed in various
parts of this proposal, many of the mathematical models and statistical data used in the design
process are not presented in their entirety in the interest of brevity.
3
, is
used to organize interrelated tasks in the design process in a way that minimizes feedback cycles and
determines possible parallel analyses. The PSM 32 code, developed by Blitzkrieg Software, was
utilized to implement the DSM in the routine process of developing Azalzan. Utilizing this code, the
entire design process was re-ordered based on the degree of dependency of each sub-process on the
outputs of others. As a result, the design approach presented by Roskam has been slightly modified
so as to allow for additional parallel processes, as dictated by specific needs of the Azalzan concept,
and consequently, improved development speed.
T
13
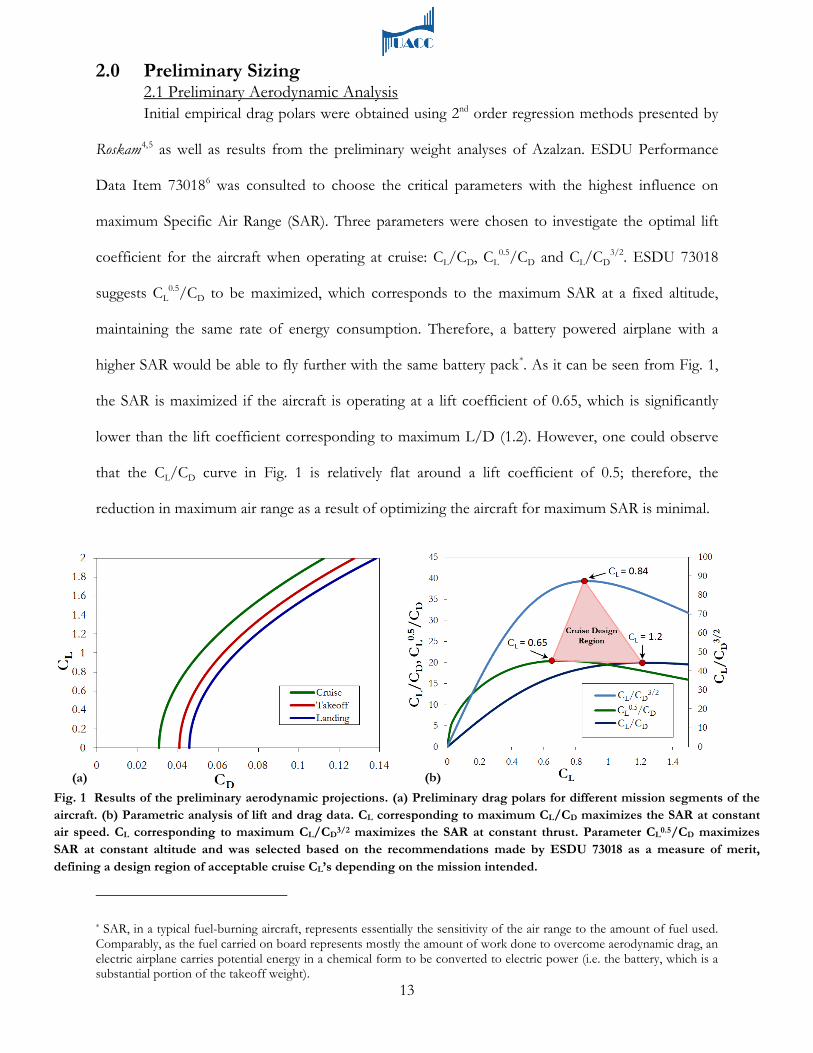
2.0 Preliminary Sizing 2.1 Preliminary Aerodynamic Analysis Initial empirical drag polars were obtained using 2nd order regression methods presented by
Roskam4,5 as well as results from the preliminary weight analyses of Azalzan. ESDU Performance
Data Item 730186 was consulted to choose the critical parameters with the highest influence on
maximum Specific Air Range (SAR). Three parameters were chosen to investigate the optimal lift
coefficient for the aircraft when operating at cruise: CL/CD, CL0.5/CD and CL/CD
3/2. ESDU 73018
suggests CL0.5/CD to be maximized, which corresponds to the maximum SAR at a fixed altitude,
maintaining the same rate of energy consumption. Therefore, a battery powered airplane with a
higher SAR would be able to fly further with the same battery pack*
. As it can be seen from Fig. 1,
the SAR is maximized if the aircraft is operating at a lift coefficient of 0.65, which is significantly
lower than the lift coefficient corresponding to maximum L/D (1.2). However, one could observe
that the CL/CD curve in Fig. 1 is relatively flat around a lift coefficient of 0.5; therefore, the
reduction in maximum air range as a result of optimizing the aircraft for maximum SAR is minimal.
* SAR, in a typical fuel-burning aircraft, represents essentially the sensitivity of the air range to the amount of fuel used. Comparably, as the fuel carried on board represents mostly the amount of work done to overcome aerodynamic drag, an electric airplane carries potential energy in a chemical form to be converted to electric power (i.e. the battery, which is a substantial portion of the takeoff weight).
Fig. 1 Results of the preliminary aerodynamic projections. (a) Preliminary drag polars for different mission segments of the aircraft. (b) Parametric analysis of lift and drag data. CL corresponding to maximum CL/CD maximizes the SAR at constant air speed. CL corresponding to maximum CL/CD3/2 maximizes the SAR at constant thrust. Parameter CL0.5/CD maximizes SAR at constant altitude and was selected based on the recommendations made by ESDU 73018 as a measure of merit, defining a design region of acceptable cruise CL’s depending on the mission intended.
(a) (b)

14
Table 2 Summary of battery technology study. * denotes cost values that have been extrapolated from battery technology cost trends.
2.2 Battery Technology Evaluation
In reviewing literature relevant to technology developed for high energy density battery
packs, and in examining studies on the future of battery technologies for aerospace applications, it
was determined that metal-air battery concepts will be a viable technology available in the timeframe
of 2016. In particular, a paper published by K. M. Abraham7 expressed very favorable opinions on
the performance of metal-air batteries available for aerospace applications. Significant improvements
in energy density are observed among next generation metal-air batteries that would make them a
viable replacement for present state-of-the-art Lithium-Ion batteries. Performing a case study of
performance and cost of various battery technologies, summarized in Table 2, it was observed that
Lithium-Air batteries have the highest overall specific energy and energy density of all current and
near future battery technologies. Although the specific costs of Lithium-Air batteries are projected
to be substantially higher than Lithium-Ion batteries, it appears that this general difference is more
than compensated by their improvements in specific energy and energy density. Such improvements
make them ideal for applications in aerospace design, where space is limited and weight has
significant effect on vehicle performance. Further investigation into the operation of Lithium-Air
batteries8
revealed that their generic operating temperatures are very high (122 oF to 158 oF) due to
their exothermic internal chemistry. This potentially leads to a need for a compact cooling system to
prevent the temperatures from exceeding their optimal range.
Battery Type Specific Energy (Whr/kg )
Energy Density (Whr/L)
Cost ($/kg)
Lithium-Ion: LiMn2O4 100 243 15 LiFePO4 108 145 12
LG LiPo Gen 3 95 155 11.84* LG Li-Ion 200 480 31
Tadiran XOL 252 645 40.50*
Lithium-Air:
Li-Air (PolyPlus) 700 1000 122.25* Li-Air (UDRI) 1000 1000 177*

15
Table 3 Summary of Mission Energy Requirements
2.3 Mission Analysis
In order to determine the mass of the battery, it was necessary to compute the amount of
energy required to perform the mission outlined by the RFP. Using the results of the preliminary
aerodynamic analysis as well as basic physical principles, the work done by the major forces acting
on the airplane (namely Drag, Lift, and Gravitational Forces) was computed considering the mission
presented in Fig. 2 and summarized in Table 3.
From this analysis it was determined that the mission profile will involve a total of 30,000
Wh. of mechanical work done by the airplane. In order to account for loses due to propeller
inefficiency, battery heat loses, and other energy loses in the circuit, an overall efficiency factor
needed to be computed. Yuneec International states that the efficiency for an 80 hp DC brushless
motor for aerospace applications is about 90%9
Flight Condition
. In personal correspondence with UACC, Dr.
Lutgard C. De Jonghe claims that the efficiency for a high performance Lithium-Air battery pack is
Altitude (ft)
Speed (kts.)
Duration (min)
Preliminary CD
Energy (Whr)
Energy Fraction
1. Takeoff 0 45 10 0.077 1,200 4 % 2. Climb 4,750 60 15 0.046 7,000 23 % 3. Cruise 9,500 80 60 0.037 15,000 50 % 4. Descent 6,000 60 7.7 0.048 1,300 4.33 % 5. Loiter 2,500 60 30 0.044 4,500 15 % 6. Descent 1,250 60 7.7 0.044 600 2 % 7. Landing 0 40 3 0.089 400 1.33 %
Fig. 2 Mission Profile. Note that the red solid line signifies the reserve mission, and the red hashed line signifies landing with the loiter segment in reserve.

16
approximately 70% at relatively high drain rates10. It was also assumed that a ground adjustable
propeller with the efficiency of 85% can be designed to operate satisfactorily at all mission
segments11. Another efficiency factor of 98% was assumed to account for power loses due to circuit
inefficiencies, electric power extraction to run the cooling system, avionics, and lighting. Therefore
the overall efficiency was computed from multiplying all the individual efficiencies yielding an
efficiency factor of about 52%, accounting for all power extractions and thermal loses. This
computation yielded the first order estimate of battery capacity to be 67 kWhr. Inquires were made
to the University of Dayton Research Institute (a leading institution in the field of metal-air battery
technologies) with regard to the energy density of a generic Lithium-Air battery with an expected
EIS of 2016. In response, Dr. Binod Kumar12
2.4 Preliminary Weight Analysis
cited an energy density of 1,000 kWhr./kg., resulting in
an approximately 160 lb. battery required.
Using the weight fractions obtained from Roskam8, initial estimations for the empty weight of
the aircraft were performed. This analysis was done using regression coefficients presented by
Roskam that are derived using available weight data for similarly sized airplanes. Table 4 presents the
results of this analysis. Note that these results only
reflect the statistical trends in light sport aircraft design
and are later refined in two phases using higher order
methods of estimating weight, to be presented in Ch.11.
Despite the electric propulsion system, the weight
estimation method that is used for traditional aircraft
was assumed to yield similar powerplant weights for
either fuel-powered or electric system architectures. This
assumption was later verified to be sufficiently accurate for the purpose of preliminary design, as will
be presented in Ch. 11.
Component FMTOW Weight (lb.)
Fuselage 0.16 190 Wing 0.15 180
Empennage 0.03 30 Landing Gear 0.07 85
Engine Cowling 0.01 15 Structure 0.42 500
Powerplant 0.05 60 Battery 0.13 160
Fixed Equipment 0.07 80 Empty Weight 0.67 800 Passengers &
Payload 0.33 400
MTOW 1.0 1200
Table 4. Summary of initial weight analysis
17
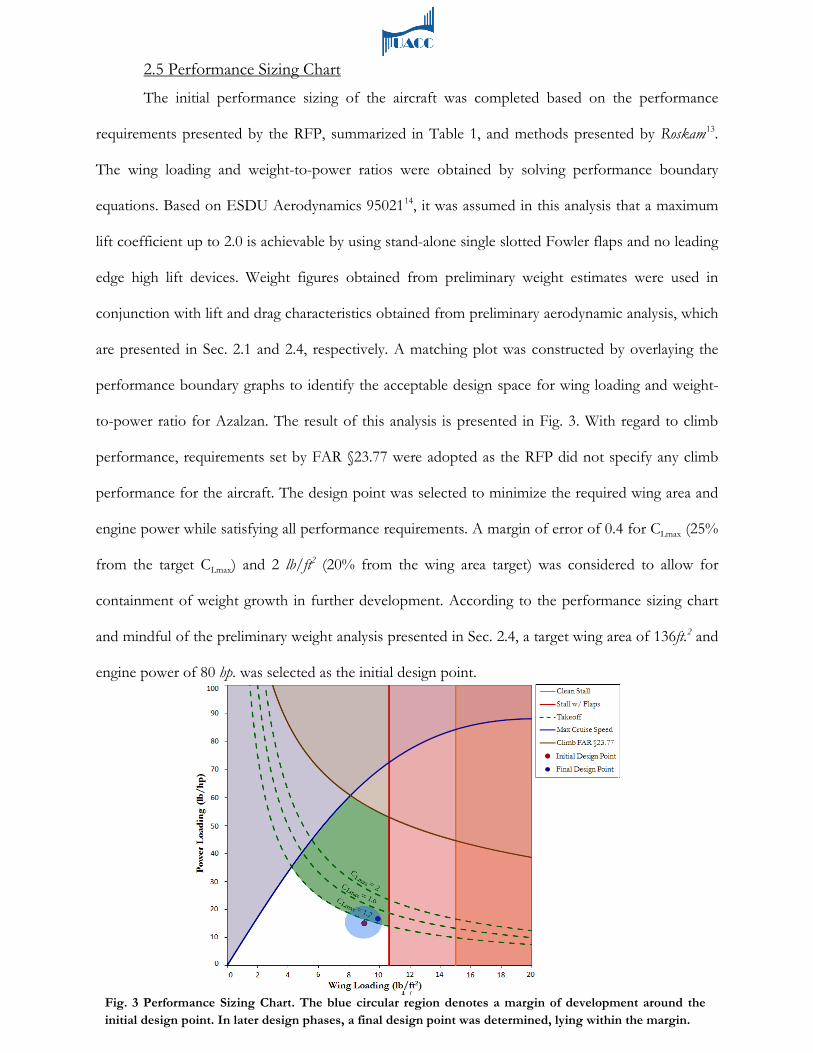
2.5 Performance Sizing Chart
The initial performance sizing of the aircraft was completed based on the performance
requirements presented by the RFP, summarized in Table 1, and methods presented by Roskam13.
The wing loading and weight-to-power ratios were obtained by solving performance boundary
equations. Based on ESDU Aerodynamics 9502114
, it was assumed in this analysis that a maximum
lift coefficient up to 2.0 is achievable by using stand-alone single slotted Fowler flaps and no leading
edge high lift devices. Weight figures obtained from preliminary weight estimates were used in
conjunction with lift and drag characteristics obtained from preliminary aerodynamic analysis, which
are presented in Sec. 2.1 and 2.4, respectively. A matching plot was constructed by overlaying the
performance boundary graphs to identify the acceptable design space for wing loading and weight-
to-power ratio for Azalzan. The result of this analysis is presented in Fig. 3. With regard to climb
performance, requirements set by FAR §23.77 were adopted as the RFP did not specify any climb
performance for the aircraft. The design point was selected to minimize the required wing area and
engine power while satisfying all performance requirements. A margin of error of 0.4 for CLmax (25%
from the target CLmax) and 2 lb/ft2 (20% from the wing area target) was considered to allow for
containment of weight growth in further development. According to the performance sizing chart
and mindful of the preliminary weight analysis presented in Sec. 2.4, a target wing area of 136ft.2 and
engine power of 80 hp. was selected as the initial design point.
Fig. 3 Performance Sizing Chart. The blue circular region denotes a margin of development around the initial design point. In later design phases, a final design point was determined, lying within the margin.
18
3.0 Market Analysis Starting with the release of the Light Sport Aircraft rules in 2005, the market has seen a
steady rise in the popularity of this class of airplane. According to FAA estimates, at the end of
2009, there were 6,547 active LSAs. The FAA predicts this number to continue to increase at the
rate of 450 per year until 2013 when it should start to abate and continue rising thereafter at a rate of
300 per year.15
Reviewing comparable designs currently in operation, it was observed that a heavy emphasis
is placed on cockpit visibility. Additionally, manufacturers actively market such a feature to be used
for the purposes of sight-seeing and leisure flights. Extrapolating from this trend, UACC decided to
provide astute visibility and ergonomics for the cockpit to improve sales.
Outside of the US, there is also a strong market for this type of airplane. The
European Microlight Federation is looking to expand the microlight rules into an LSA category the
same way that LSA in the US was born of the ultralight movement. This is expected to be adopted
at standards very close to the US standards as that over 65% of the US sold S-LSAs are
manufactured in Europe.2 Further, an all-electric LSA would have additional value in Europe where
the primary distracter from personal aviation is the cost (attributed to both fuel and fees.) Based on
this, we recommend an initial release into the US market with the future direction of expanding to
Europe and Asia Pacific.
Typically, LSAs utilize high performance internal combustion engines and low blade number
propellers installed forward of the cockpit. Such a configuration, combined with the tendency to
minimize weight by reducing the amount of acoustic insulation, leads to aggravated noise levels in
the cockpit, reducing the overall passenger comfort. In response, it was decided that a configuration
that inherently minimizes cockpit and community noise levels would be preferable if no major
sacrifice has to be made in airplane performance.
A general survey of presently operational airplanes was performed by reviewing the data
collected and published by the General Aviation Manufacturers Association16 (GAMA) and the
Light Aircraft Manufacturers Association17 (LAMA). The statistics gathered by GAMA were
19
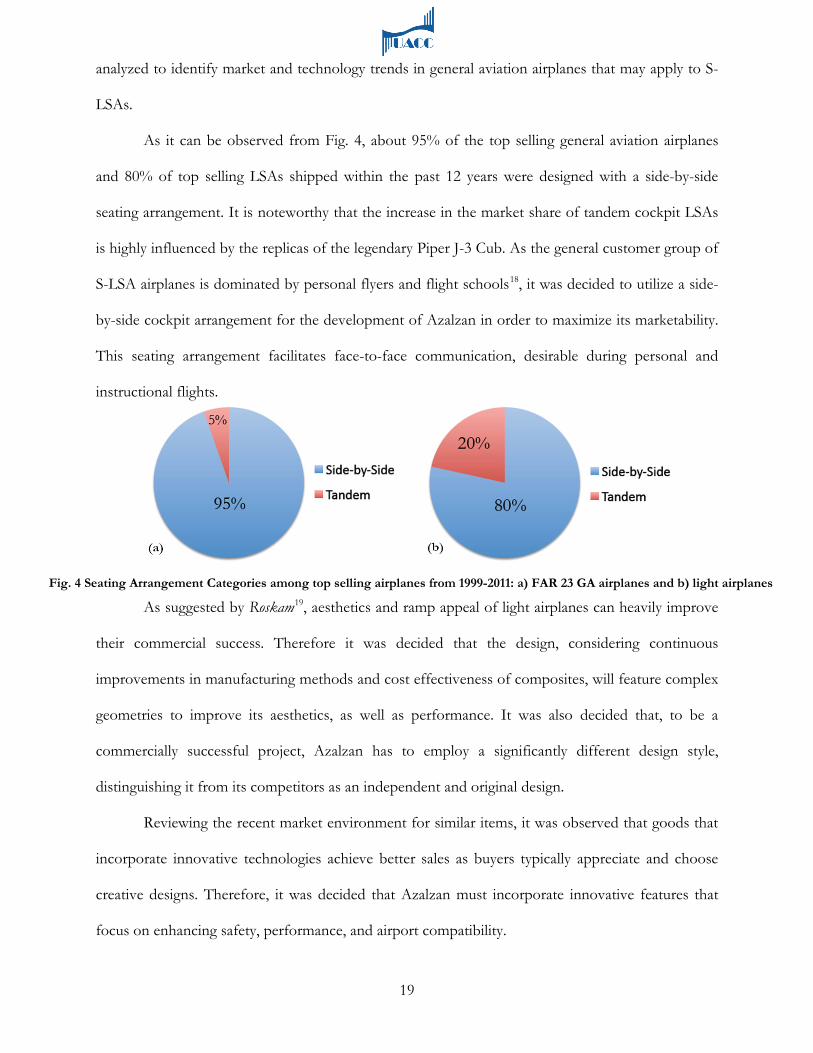
Fig. 4 Seating Arrangement Categories among top selling airplanes from 1999-2011: a) FAR 23 GA airplanes and b) light airplanes
analyzed to identify market and technology trends in general aviation airplanes that may apply to S-
LSAs.
As it can be observed from Fig. 4, about 95% of the top selling general aviation airplanes
and 80% of top selling LSAs shipped within the past 12 years were designed with a side-by-side
seating arrangement. It is noteworthy that the increase in the market share of tandem cockpit LSAs
is highly influenced by the replicas of the legendary Piper J-3 Cub. As the general customer group of
S-LSA airplanes is dominated by personal flyers and flight schools18
, it was decided to utilize a side-
by-side cockpit arrangement for the development of Azalzan in order to maximize its marketability.
This seating arrangement facilitates face-to-face communication, desirable during personal and
instructional flights.
As suggested by Roskam19
Reviewing the recent market environment for similar items, it was observed that goods that
incorporate innovative technologies achieve better sales as buyers typically appreciate and choose
creative designs. Therefore, it was decided that Azalzan must incorporate innovative features that
focus on enhancing safety, performance, and airport compatibility.
, aesthetics and ramp appeal of light airplanes can heavily improve
their commercial success. Therefore it was decided that the design, considering continuous
improvements in manufacturing methods and cost effectiveness of composites, will feature complex
geometries to improve its aesthetics, as well as performance. It was also decided that, to be a
commercially successful project, Azalzan has to employ a significantly different design style,
distinguishing it from its competitors as an independent and original design.

20
a) b)
c)
Reviewing the statistics gathered from GAMA and LAMA, UACC identified a possible,
lucrative market for an S-LSA with very short takeoff and landing abilities. It was determined that a
large number of licensed LSA pilots have access to vast remote, flat grasslands and underutilized
barns, allowing them to own and operate bush planes. It is realized that very short takeoff and
landing (STOL) characteristics are essential to the operation of airplanes in such a setup. If the
airplane is capable of making very short, low speed takeoffs, it can obtain a winning edge over well
established and older airplanes by outperforming them in takeoff and landing distance.
Performing a survey of literature, two major design trends in low cost, STOL light airplanes
were observed. First, some of the well established designs in this class use very large wing planforms
and extremely light-weight truss-braced structures that allow for STOL performance, while
sacrificing usable payload and passenger comfort. In contrast, a group of contemporary STOL
aircraft utilizes thrust vectoring and powered flap systems to achieve STOL performance. Figure 5
presents examples of these types of aircraft.
UACC decided that STOL performance characteristics are very valuable additions to the
design concept of an S-LSA airplane and, therefore considered such additions as parts of the design
philosophy of Azalzan.
Fig. 5 a) Fi-156 “Storch” b) Piper J-3 Cub c) DornierDo-29 Two main approaches to light weight, STOL airplanes. a) and b) demonstrate the classic approach of large wing area and light weight, cramped cockpit, while c) presents a contemporary solution to achieve STOL performance through thrust vectoring and powered flap systems.

21
Fig. 6 Results of the sensitivity of range to AR at various ARs, at cruise and loiter. Note that each data point is a fully sized airplane.
4.0 Configuration Trade-offs 4.1 Sensitivity Analysis
A basic sensitivity analysis was performed in order to obtain a more detailed understanding
of the relationship between the performance figures and the planform geometry, mainly the aspect
ratio. As the range is the factor limiting the practicality of an electric airplane, the effects of aspect
ratio and range received particular attention. To compute the effects of the change of aspect ratio on
the air range of the airplane, Eq. 1 was used,
(1)
Partials ARCD ∂∂ and DCR ∂∂ were computed numerically by changing the aspect ratio
and obtaining the respective steady state drag coefficient and range during cruise and loiter within
the environment of the Advanced Aircraft Analysis tool as well as an in-house developed performance
tool. Cruise and loiter were selected due to their long durations and their large impact on sizing the
battery for the aircraft. The sensitivity of range to aspect ratio was plotted versus aspect ratio and
can be seen in Fig. 6. It is noteworthy that the range performance is optimized where the ARR ∂∂
derivative is very small but positive. It can also be observed that the ARR ∂∂ derivative during loiter
does not change significantly and therefore was found to not be a design parameter for wing
geometry. Reviewing the results of this analysis, it was decided that a relatively high aspect ratio wing
(~18-19) will be needed to optimize the range
performance of the airplane at cruise. Relatively
higher aspect ratios (~20-25) are routinely seen in
sailplane configurations with comparable maximum
speeds and, given the increased stiffness of modern
composite wing structures, such very high aspect ratios
may be used with no adverse effect.
( )CruiseDCruise
DCruise C
RAR
CAR
R
∂∂⋅
∂∂=∂
∂
22
4.2 Configuration Selection
Once the seat arrangement and the aspect ratio were selected for Azalzan, it was possible to
explore the different possible configurations by evaluating the available options for main component
configurations, as summarized in Table 4. The components for which available configurations were
explored were wings, empennage, motor installation, and propeller placement.
For the wings, three possible vertical locations were evaluated: low wing, mid wing, and high
wing. A high wing installation was selected, in which the lift distribution of the wing is less
interrupted by the presence of the fuselage. This results in a higher lift generated by the wing,
contributing to a better takeoff performance.
An analogous process was followed for landing gear layout and engine mounting. A tricycle
landing gear was selected given its superior ground handling characteristics. A mid-engine
configuration was selected for its improved balance characteristics, due to its proximity to region of
desirable CG location. Finally, and after having selected the location of the engine and the overall
configuration layout of the airplane, a wing-mounted propeller system was selected given promising
improvements to high lift aerodynamics through powered flaps. Also, a wing-mounted propeller
combined with a high wing configuration allows for improved ground clearance for the deflection of
the propellers, facilitating thrust vectoring.
For the empennage, three possible configurations were also evaluated: conventional layout,
in which the horizontal stabilizer is attached to the fuselage; cruciform, in which the horizontal
stabilizer is attached to the vertical stabilizer; and V-tail, in which vertical and horizontal stabilizers
are combined into diagonal surfaces that perform the functions of both. Given the induced swirl in
the flow aft of the propellers, a cruciform empennage layout was selected for Azalzan to prevent the
horizontal tail from heavily disturbed airflow.
After this synthesis was completed, the configuration of Azalzan was developed into high
levels of detail to allow for higher order analyses to be performed. A description of the final
configuration is presented in Sec. 5 of this document.

23
Wing Location
Options
High
Mid
Low
Justification High wings allow the lift distribution of the wing to be less interrupted by the presence of the fuselage. This results in a higher lift generated by the wing, contributing to a better takeoff performance.
Landing Gear
Options
Tricycle
Tail Wheel
Justification Aircraft with tricycle landing gear have better ground handling characteristics than aircraft with tail wheel landing gear. Takeoff visibility is also improved relative to a tail wheel configuration. Finally, tricycle landing gear aircraft are more desirable for instructional use due to their improved view of the runway.
Engine Location
Options
Front
Mid
Rear
Justification Locating the engine in the middle section of the fuselage makes it easier to provide cooling air for the engine than mounting it in the rear. It is also preferred for balance considerations over rear and front mounted engines, as it will have a lower effect on the location of the CG of the aircraft.
Prop Placement
Options
Front
Rear
Wing-Mounted
Justification A wing-mounted propeller system gives promising improvements to high lift aerodynamics through powered flaps. Also, a wing-mounted propeller combined with a high wing configuration allows for improved ground clearance for the deflection of the propellers, facilitating thrust vectoring.
Empennage
Options
Conventional
Cruciform
V-Tail
Justification A cruciform empennage layout alleviates the horizontal tail from heavily disturbed airflow.
Table 4. Configuration Selection
24
5.0 Configuration Description This section describes the final configuration of Azalzan. This serves as a point of reference
regarding the geometries and features discussed in later sections of this document that deal with
engineering analysis and design of specific aspects of Azalzan.
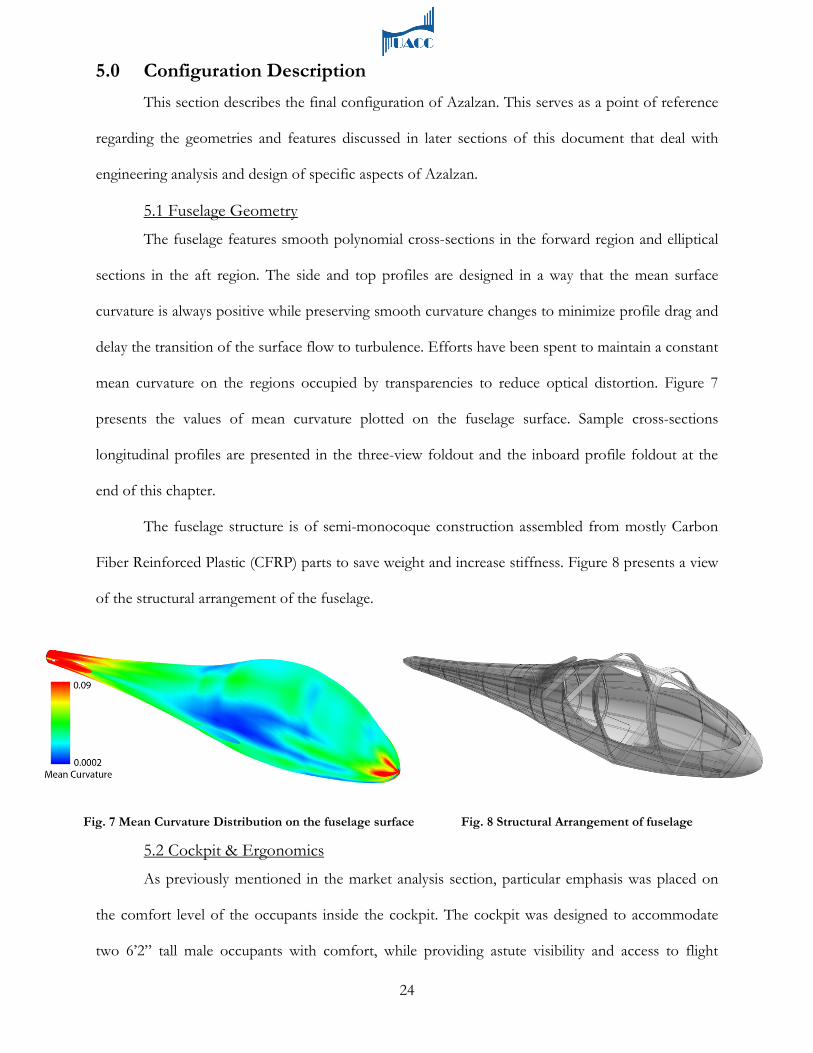
5.1 Fuselage Geometry
The fuselage features smooth polynomial cross-sections in the forward region and elliptical
sections in the aft region. The side and top profiles are designed in a way that the mean surface
curvature is always positive while preserving smooth curvature changes to minimize profile drag and
delay the transition of the surface flow to turbulence. Efforts have been spent to maintain a constant
mean curvature on the regions occupied by transparencies to reduce optical distortion. Figure 7
presents the values of mean curvature plotted on the fuselage surface. Sample cross-sections
longitudinal profiles are presented in the three-view foldout and the inboard profile foldout at the
end of this chapter.
The fuselage structure is of semi-monocoque construction assembled from mostly Carbon
Fiber Reinforced Plastic (CFRP) parts to save weight and increase stiffness. Figure 8 presents a view
of the structural arrangement of the fuselage.
5.2 Cockpit & Ergonomics
As previously mentioned in the market analysis section, particular emphasis was placed on
the comfort level of the occupants inside the cockpit. The cockpit was designed to accommodate
two 6’2” tall male occupants with comfort, while providing astute visibility and access to flight
Fig. 8 Structural Arrangement of fuselage Fig. 7 Mean Curvature Distribution on the fuselage surface

25
Fig. 9 Visibility Pattern from pilot seat
controls. The design provides 25o over-the-nose visibility while providing unobstructed visibility to
the sides suitable for sightseeing flights.
Figure 9 presents the final visibility pattern
of the cockpit. The adjustable seats were
designed to provide good lumbar and lateral
support as well as crash survivability. The
control column was designed to allow for
+9° and -17° deflection in the pitch
direction, and ±8o in the roll direction. Cockpit pedals were designed to allow for maximum rudder
surface deflections by ±2” of pedal movement, as can be seen in Fig. 10.
Fig. 10 Cockpit Cutaway Highlights
26
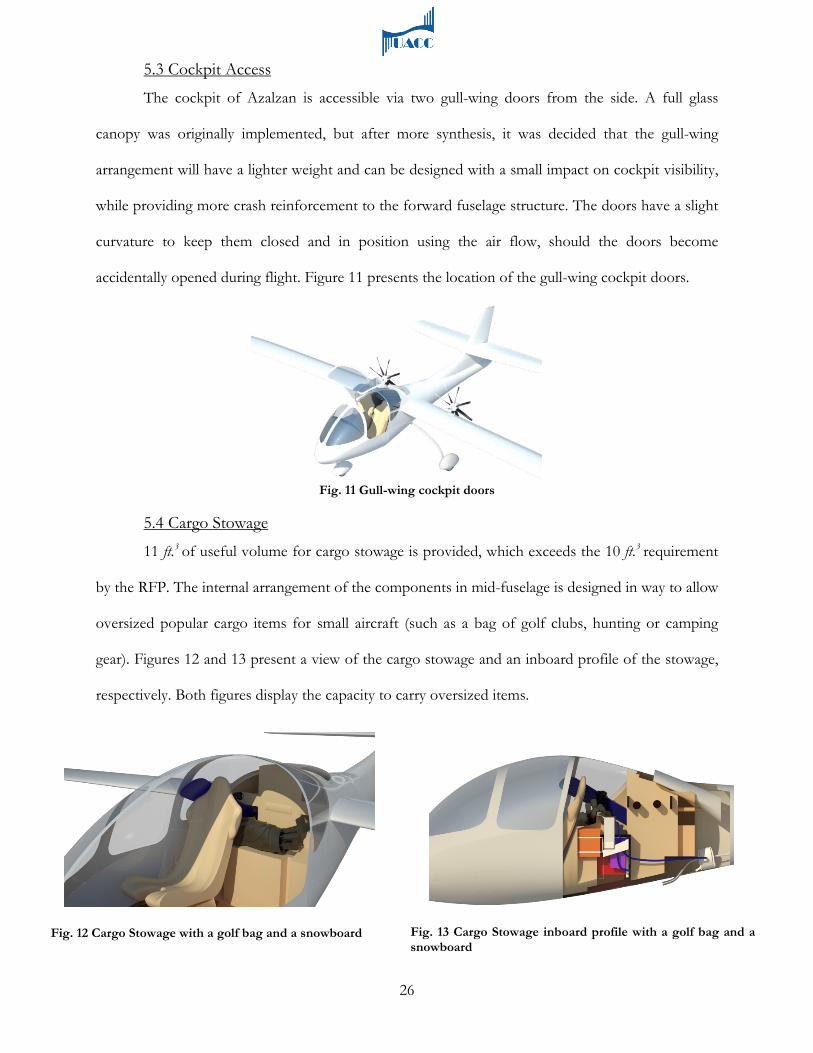
5.3 Cockpit Access
The cockpit of Azalzan is accessible via two gull-wing doors from the side. A full glass
canopy was originally implemented, but after more synthesis, it was decided that the gull-wing
arrangement will have a lighter weight and can be designed with a small impact on cockpit visibility,
while providing more crash reinforcement to the forward fuselage structure. The doors have a slight
curvature to keep them closed and in position using the air flow, should the doors become
accidentally opened during flight. Figure 11 presents the location of the gull-wing cockpit doors.
Fig. 11 Gull-wing cockpit doors
5.4 Cargo Stowage
11 ft.3 of useful volume for cargo stowage is provided, which exceeds the 10 ft.3 requirement
by the RFP. The internal arrangement of the components in mid-fuselage is designed in way to allow
oversized popular cargo items for small aircraft (such as a bag of golf clubs, hunting or camping
gear). Figures 12 and 13 present a view of the cargo stowage and an inboard profile of the stowage,
respectively. Both figures display the capacity to carry oversized items.
Fig. 12 Cargo Stowage with a golf bag and a snowboard Fig. 13 Cargo Stowage inboard profile with a golf bag and a snowboard

27
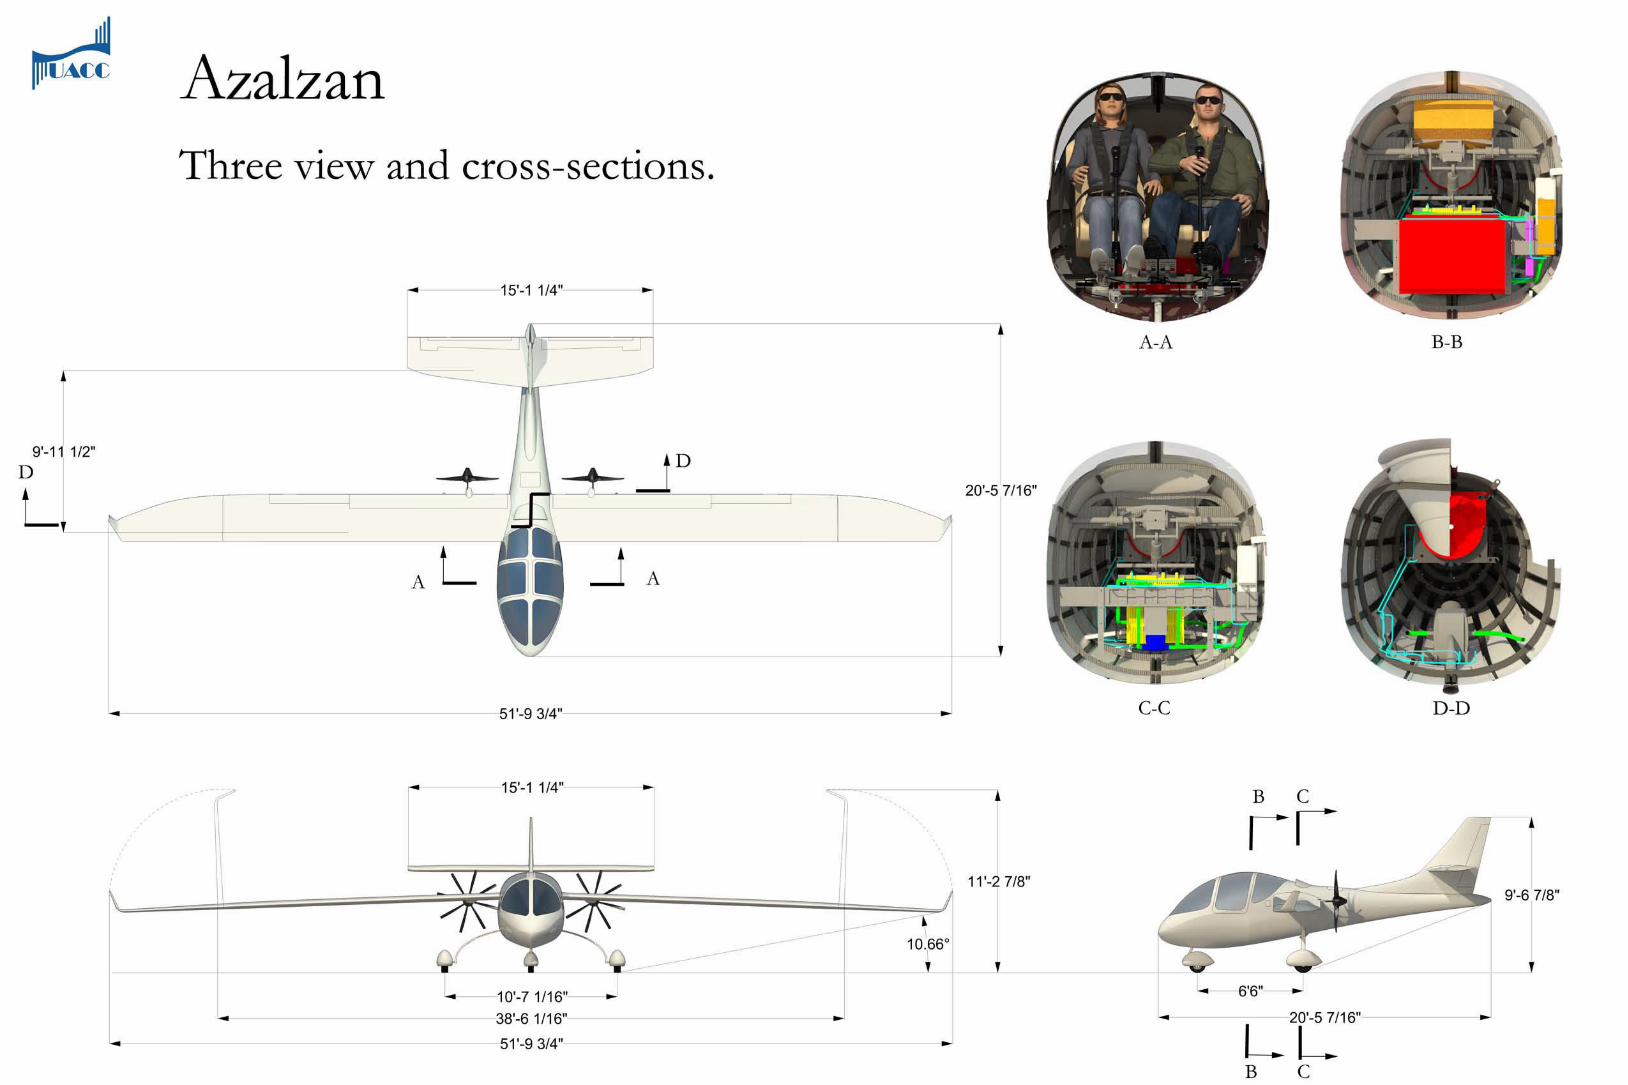
5.5 Wing Planform, Winglets, and Folding Mechanism
The wing planform for Azalzan has an equivalent area of 136.3 ft.2 and a span of 50’,
resulting in an aspect ratio of 18.35. The quarter chord sweep of the wing is -1.4o while the leading
edge is unswept. The taper ratio of the wing is 0.38, selected to optimize the Oswald’s Efficiency
factor for the wing at cruise. Choices surrounding planform are driven by aerodynamic trade studies
and optimizations that are highly influenced by the concept of NLF. The low sweep of the wing
planform, combined with relatively low Reynolds numbers and custom designed NLF airfoils, allows
for extensive laminar flow (approximately 60%) on upper and lower surfaces of the wing, drastically
reducing the friction drag of the configuration at cruise conditions. Sections 6.2 and 6.7 of this
proposal present the wing planform optimization and CFD verification for NLF characteristics,
respectively. To further increase the efficiency of the wing planform, a 1.28’ high winglet is canted
from the vertical at 6°. The outboard 7’ of the wing is capable of folding via an internal electric
folding mechanism to allow taxiing in narrow taxiways and to maintain compatibility with standard
T-Hangers, as required by the RFP. The wing is equipped with two sets of single slotted Fowler
flaps on the trailing edge extending up to 45% of the wing halfspan. An aileron surface starts at 45%
of the wing halfspan and ends at 73% of the wing halfspan, coinciding with the location of the
folding line of the outboard wing. Figure 14 presents the wing planform for Azalzan.
Fig. 14 Wing Planform
28
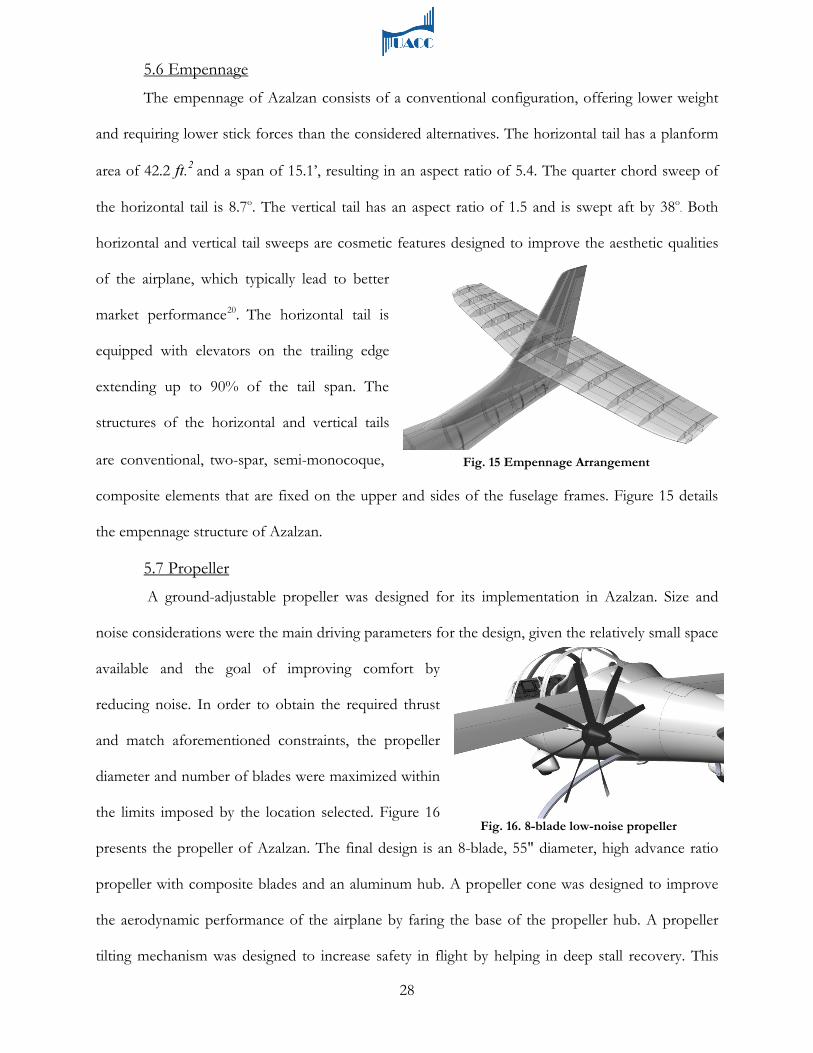
5.6 Empennage
The empennage of Azalzan consists of a conventional configuration, offering lower weight
and requiring lower stick forces than the considered alternatives. The horizontal tail has a planform
area of 42.2 ft.2 and a span of 15.1’, resulting in an aspect ratio of 5.4. The quarter chord sweep of
the horizontal tail is 8.7o. The vertical tail has an aspect ratio of 1.5 and is swept aft by 38o. Both
horizontal and vertical tail sweeps are cosmetic features designed to improve the aesthetic qualities
of the airplane, which typically lead to better
market performance20
5.7 Propeller
. The horizontal tail is
equipped with elevators on the trailing edge
extending up to 90% of the tail span. The
structures of the horizontal and vertical tails
are conventional, two-spar, semi-monocoque,
composite elements that are fixed on the upper and sides of the fuselage frames. Figure 15 details
the empennage structure of Azalzan.
A ground-adjustable propeller was designed for its implementation in Azalzan. Size and
noise considerations were the main driving parameters for the design, given the relatively small space
available and the goal of improving comfort by
reducing noise. In order to obtain the required thrust
and match aforementioned constraints, the propeller
diameter and number of blades were maximized within
the limits imposed by the location selected. Figure 16
presents the propeller of Azalzan. The final design is an 8-blade, 55" diameter, high advance ratio
propeller with composite blades and an aluminum hub. A propeller cone was designed to improve
the aerodynamic performance of the airplane by faring the base of the propeller hub. A propeller
tilting mechanism was designed to increase safety in flight by helping in deep stall recovery. This
Fig. 15 Empennage Arrangement
Fig. 16. 8-blade low-noise propeller

29
system tilts the propeller generating a vertical thrust component, which results in a nose down
pitching moment. This feature will be further discussed in Section 12.7. The propeller design and
performance will be described in detail in Section 8.2.
5.8 Electric Motor
Azalzan is powered by a Yuneec PowerDrive60 DC brushless electric motor for aerospace
applications. It is capable of producing a maximum of 80 hp. and 240 N-m of torque at 2,400 RPM.
It is designed to operate at a voltage of 166 V and current of 340 A. It is essentially an air-cooled
electric motor, which dissipates 3,000 W of heat yielding an overall mechanical efficiency of 90%. It
requires an airflow rate of 1.2kg/sec. rate at cruise to maintain its optimal operating temperature,
which is provided by a dedicated S-duct located on the upper side of the fuselage. The electric motor
weight is 66 lb. and requires a power management unit to regulate its voltage and current at different
RPMs. The power control unit is installed in the dorsal electronics bay and occupies 170 in.3 of
volume. The electric motor is installed via a simple truss in the mid fuselage section and can be
accessed from a dedicated access panel from below. Figures 17 and 18 present the electric motor as
installed inside the fuselage. The power from the motor is transmitted to the propellers through a
gearing system comprised of one central and two wing-mounted bevel gears. The main driveshaft is
90” long, 7/8” diameter and made of SAE 4131 steel.
Fig. 17 Electric Motor Integration attached to fuselage frames
Fig. 18 Propeller-Drive Shaft integration
30
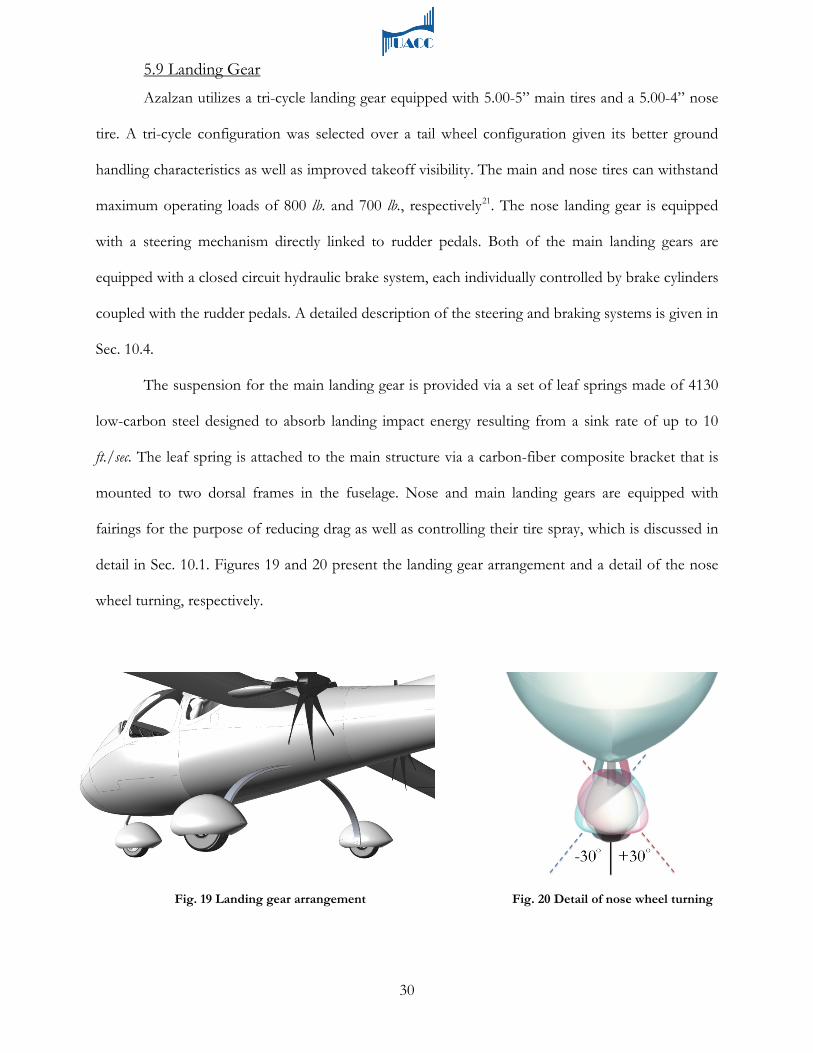
5.9 Landing Gear
Azalzan utilizes a tri-cycle landing gear equipped with 5.00-5” main tires and a 5.00-4” nose
tire. A tri-cycle configuration was selected over a tail wheel configuration given its better ground
handling characteristics as well as improved takeoff visibility. The main and nose tires can withstand
maximum operating loads of 800 lb. and 700 lb., respectively21
The suspension for the main landing gear is provided via a set of leaf springs made of 4130
low-carbon steel designed to absorb landing impact energy resulting from a sink rate of up to 10
ft./sec. The leaf spring is attached to the main structure via a carbon-fiber composite bracket that is
mounted to two dorsal frames in the fuselage. Nose and main landing gears are equipped with
fairings for the purpose of reducing drag as well as controlling their tire spray, which is discussed in
detail in Sec. 10.1. Figures 19 and 20 present the landing gear arrangement and a detail of the nose
wheel turning, respectively.
. The nose landing gear is equipped
with a steering mechanism directly linked to rudder pedals. Both of the main landing gears are
equipped with a closed circuit hydraulic brake system, each individually controlled by brake cylinders
coupled with the rudder pedals. A detailed description of the steering and braking systems is given in
Sec. 10.4.
Fig. 19 Landing gear arrangement Fig. 20 Detail of nose wheel turning

33
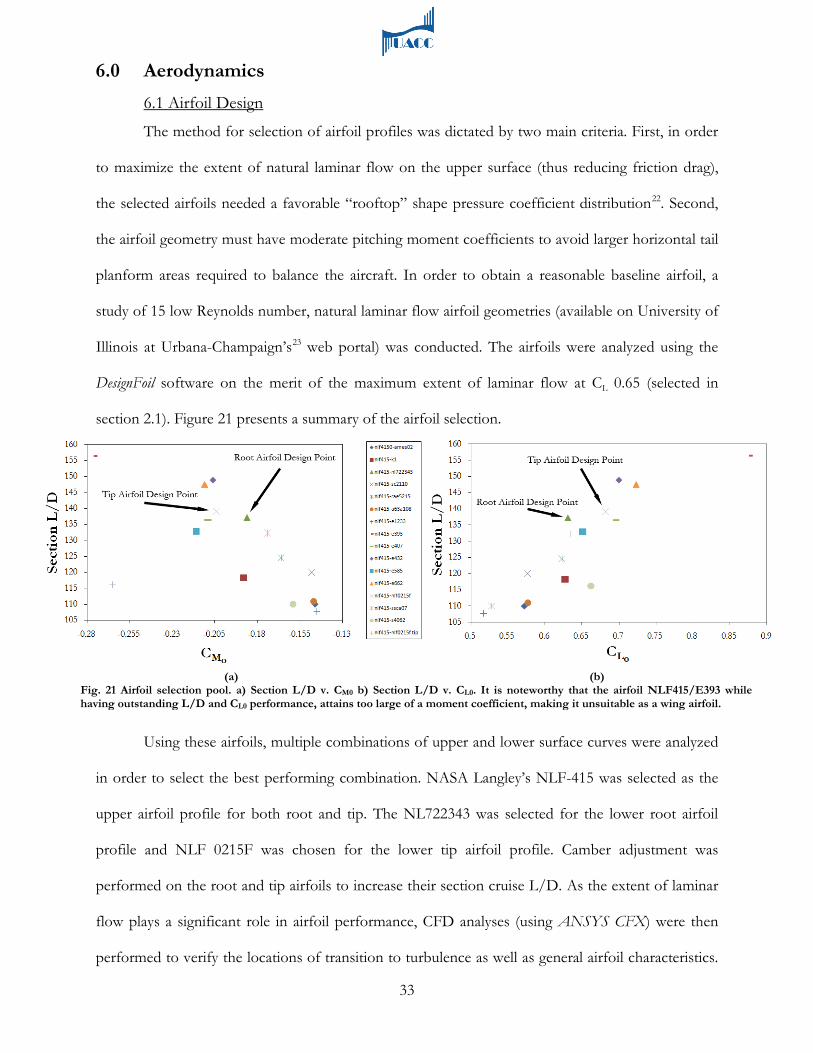
6.0 Aerodynamics 6.1 Airfoil Design
The method for selection of airfoil profiles was dictated by two main criteria. First, in order
to maximize the extent of natural laminar flow on the upper surface (thus reducing friction drag),
the selected airfoils needed a favorable “rooftop” shape pressure coefficient distribution22. Second,
the airfoil geometry must have moderate pitching moment coefficients to avoid larger horizontal tail
planform areas required to balance the aircraft. In order to obtain a reasonable baseline airfoil, a
study of 15 low Reynolds number, natural laminar flow airfoil geometries (available on University of
Illinois at Urbana-Champaign’s23
web portal) was conducted. The airfoils were analyzed using the
DesignFoil software on the merit of the maximum extent of laminar flow at CL 0.65 (selected in
section 2.1). Figure 21 presents a summary of the airfoil selection.
Using these airfoils, multiple combinations of upper and lower surface curves were analyzed
in order to select the best performing combination. NASA Langley’s NLF-415 was selected as the
upper airfoil profile for both root and tip. The NL722343 was selected for the lower root airfoil
profile and NLF 0215F was chosen for the lower tip airfoil profile. Camber adjustment was
performed on the root and tip airfoils to increase their section cruise L/D. As the extent of laminar
flow plays a significant role in airfoil performance, CFD analyses (using ANSYS CFX) were then
performed to verify the locations of transition to turbulence as well as general airfoil characteristics.
(a) (b) Fig. 21 Airfoil selection pool. a) Section L/D v. CM0 b) Section L/D v. CL0. It is noteworthy that the airfoil NLF415/E393 while having outstanding L/D and CL0 performance, attains too large of a moment coefficient, making it unsuitable as a wing airfoil.
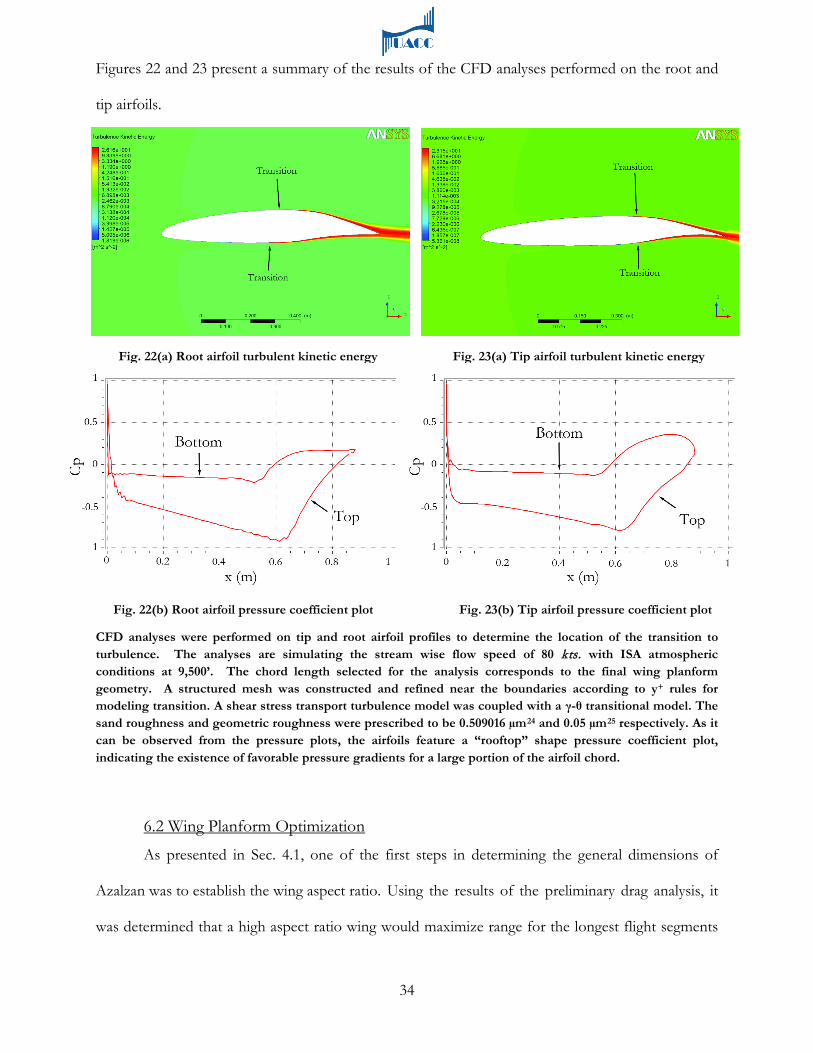
34
Figures 22 and 23 present a summary of the results of the CFD analyses performed on the root and
tip airfoils.
CFD analyses were performed on tip and root airfoil profiles to determine the location of the transition to turbulence. The analyses are simulating the stream wise flow speed of 80 kts. with ISA atmospheric conditions at 9,500’. The chord length selected for the analysis corresponds to the final wing planform geometry. A structured mesh was constructed and refined near the boundaries according to y+ rules for modeling transition. A shear stress transport turbulence model was coupled with a γ-θ transitional model. The sand roughness and geometric roughness were prescribed to be 0.509016 µm24 and 0.05 µm25
respectively. As it can be observed from the pressure plots, the airfoils feature a “rooftop” shape pressure coefficient plot, indicating the existence of favorable pressure gradients for a large portion of the airfoil chord.
6.2 Wing Planform Optimization
As presented in Sec. 4.1, one of the first steps in determining the general dimensions of
Azalzan was to establish the wing aspect ratio. Using the results of the preliminary drag analysis, it
was determined that a high aspect ratio wing would maximize range for the longest flight segments
Fig. 22(a) Root airfoil turbulent kinetic energy
Fig. 22(b) Root airfoil pressure coefficient plot
Fig. 23(a) Tip airfoil turbulent kinetic energy
Fig. 23(b) Tip airfoil pressure coefficient plot
35
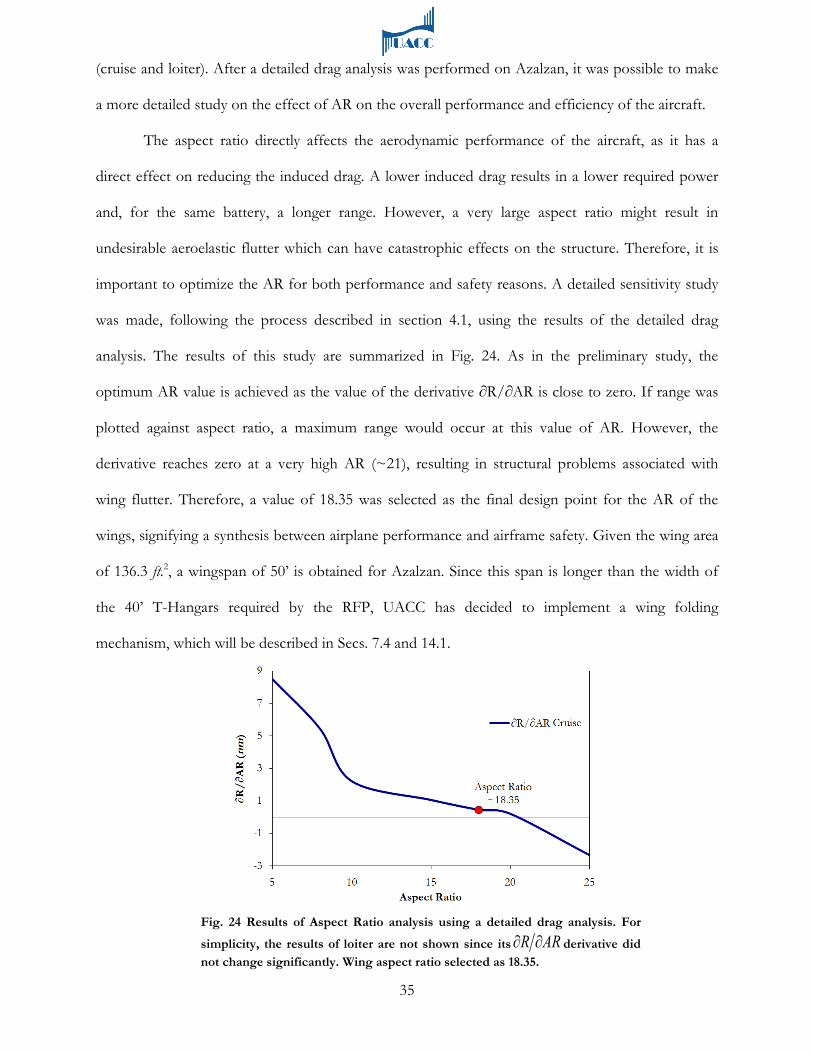
(cruise and loiter). After a detailed drag analysis was performed on Azalzan, it was possible to make
a more detailed study on the effect of AR on the overall performance and efficiency of the aircraft.
The aspect ratio directly affects the aerodynamic performance of the aircraft, as it has a
direct effect on reducing the induced drag. A lower induced drag results in a lower required power
and, for the same battery, a longer range. However, a very large aspect ratio might result in
undesirable aeroelastic flutter which can have catastrophic effects on the structure. Therefore, it is
important to optimize the AR for both performance and safety reasons. A detailed sensitivity study
was made, following the process described in section 4.1, using the results of the detailed drag
analysis. The results of this study are summarized in Fig. 24. As in the preliminary study, the
optimum AR value is achieved as the value of the derivative ∂R/∂AR is close to zero. If range was
plotted against aspect ratio, a maximum range would occur at this value of AR. However, the
derivative reaches zero at a very high AR (~21), resulting in structural problems associated with
wing flutter. Therefore, a value of 18.35 was selected as the final design point for the AR of the
wings, signifying a synthesis between airplane performance and airframe safety. Given the wing area
of 136.3 ft.2, a wingspan of 50’ is obtained for Azalzan. Since this span is longer than the width of
the 40’ T-Hangars required by the RFP, UACC has decided to implement a wing folding
mechanism, which will be described in Secs. 7.4 and 14.1.
Fig. 24 Results of Aspect Ratio analysis using a detailed drag analysis. For
simplicity, the results of loiter are not shown since its ARR ∂∂ derivative did not change significantly. Wing aspect ratio selected as 18.35.
36
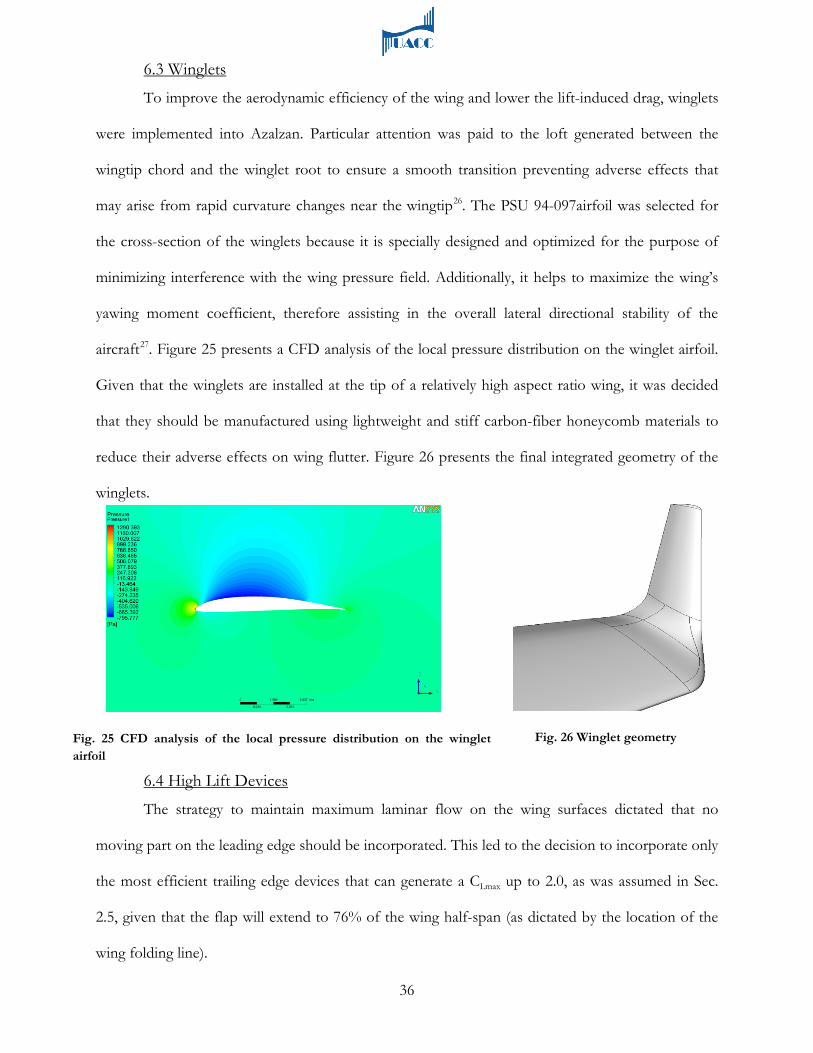
6.3 Winglets
To improve the aerodynamic efficiency of the wing and lower the lift-induced drag, winglets
were implemented into Azalzan. Particular attention was paid to the loft generated between the
wingtip chord and the winglet root to ensure a smooth transition preventing adverse effects that
may arise from rapid curvature changes near the wingtip26. The PSU 94-097airfoil was selected for
the cross-section of the winglets because it is specially designed and optimized for the purpose of
minimizing interference with the wing pressure field. Additionally, it helps to maximize the wing’s
yawing moment coefficient, therefore assisting in the overall lateral directional stability of the
aircraft27
. Figure 25 presents a CFD analysis of the local pressure distribution on the winglet airfoil.
Given that the winglets are installed at the tip of a relatively high aspect ratio wing, it was decided
that they should be manufactured using lightweight and stiff carbon-fiber honeycomb materials to
reduce their adverse effects on wing flutter. Figure 26 presents the final integrated geometry of the
winglets.
6.4 High Lift Devices
The strategy to maintain maximum laminar flow on the wing surfaces dictated that no
moving part on the leading edge should be incorporated. This led to the decision to incorporate only
the most efficient trailing edge devices that can generate a CLmax up to 2.0, as was assumed in Sec.
2.5, given that the flap will extend to 76% of the wing half-span (as dictated by the location of the
wing folding line).
Fig. 26 Winglet geometry
Fig. 25 CFD analysis of the local pressure distribution on the winglet airfoil
37
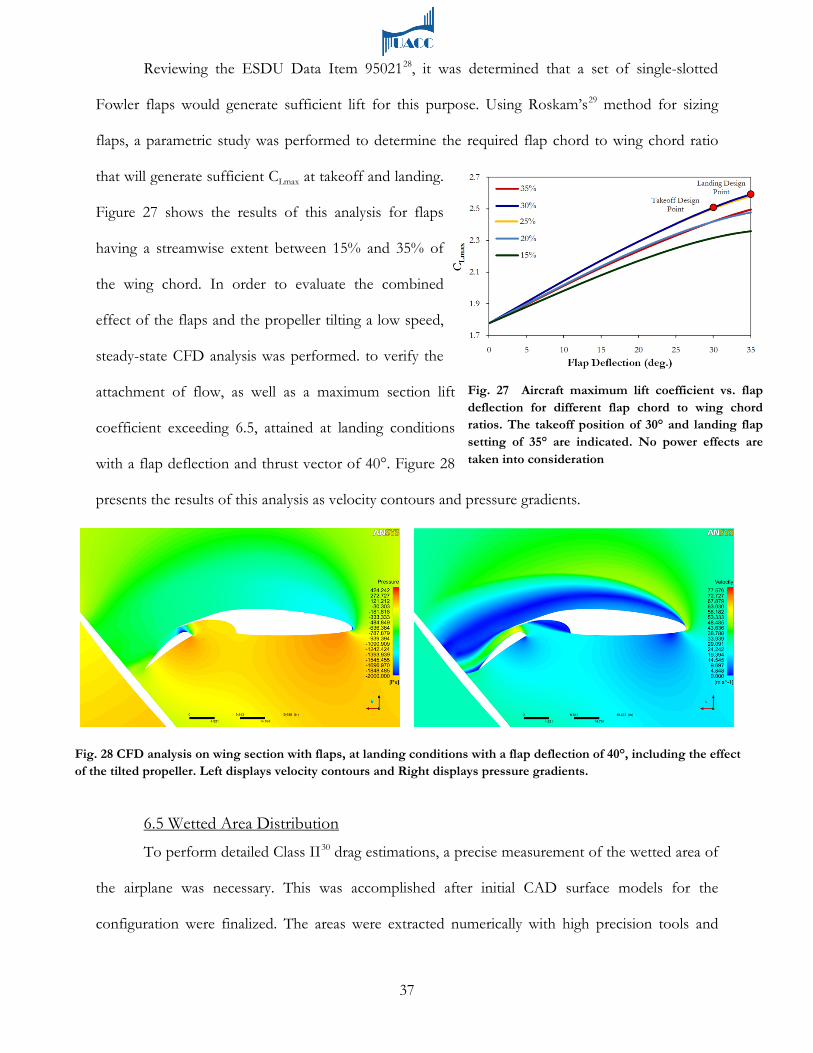
Fig. 27 Aircraft maximum lift coefficient vs. flap deflection for different flap chord to wing chord ratios. The takeoff position of 30° and landing flap setting of 35° are indicated. No power effects are taken into consideration
Reviewing the ESDU Data Item 9502128, it was determined that a set of single-slotted
Fowler flaps would generate sufficient lift for this purpose. Using Roskam’s29
method for sizing
flaps, a parametric study was performed to determine the required flap chord to wing chord ratio
that will generate sufficient CLmax at takeoff and landing.
Figure 27 shows the results of this analysis for flaps
having a streamwise extent between 15% and 35% of
the wing chord. In order to evaluate the combined
effect of the flaps and the propeller tilting a low speed,
steady-state CFD analysis was performed. to verify the
attachment of flow, as well as a maximum section lift
coefficient exceeding 6.5, attained at landing conditions
with a flap deflection and thrust vector of 40°. Figure 28
presents the results of this analysis as velocity contours and pressure gradients.
6.5 Wetted Area Distribution
To perform detailed Class II30 drag estimations, a precise measurement of the wetted area of
the airplane was necessary. This was accomplished after initial CAD surface models for the
configuration were finalized. The areas were extracted numerically with high precision tools and
Fig. 28 CFD analysis on wing section with flaps, at landing conditions with a flap deflection of 40°, including the effect of the tilted propeller. Left displays velocity contours and Right displays pressure gradients.

38
were used in the drag calculations that are presented in the sections to follow. Table 5 and Fig. 29
summarize the result of the wetted area distribution analysis.
6.6 Detailed Drag Polars and Breakdown
To obtain a more accurate estimate of the lift and drag forces, a detailed analysis of the
aerodynamics of the aircraft was performed using the methods presented by Roskam31. The high lift
drag polar methodology is adopted from Torenbeek32
and used to correct the nominal drag polars to
account for drag due to deployed flaps at takeoff and landing. The results of the airfoil CFD analysis
related to the verification of the extent of laminar flow, presented in Sec. 6.1, were used to compute
the wing drag. Figure 30 presents the results of detailed drag analysis using 5th order drag polar
equations, which will be used later in Ch. 13 to verify the satisfaction of performance requirements.
Figure 31 presents the drag breakdown of Azalzan at cruise conditions.
Component Wetted Area (ft2) % Total
Fuselage 153.98 24.50 Wing 316.86 50.42
Winglets 5.37 0.85 Horizontal Tail 82.18 13.08
Vertical Tail 38.5 6.13 Intake 8.03 1.28
Landing Gear Strut 6.49 1.03 Landing Gear Faring 13.60 2.16
Tires (Exposed) 3.40 0.55
Table 5 Summary of Wetted Area Distribution analysis
Fig. 29 Pie Chart Representation of Wetted Area Distribution
Fig. 30 Drag Polars @ Takeoff, Climb, Cruise, and Landing
Fig. 31 Drag Breakdown @ Cruise
39
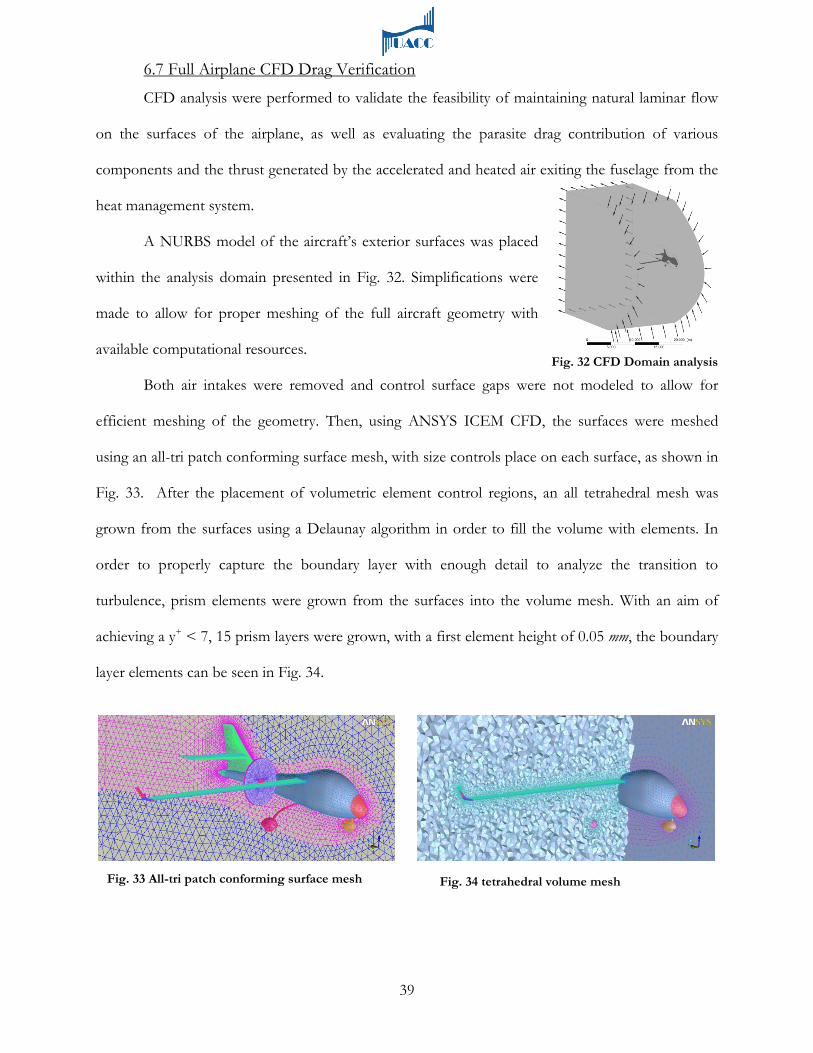
6.7 Full Airplane CFD Drag Verification
CFD analysis were performed to validate the feasibility of maintaining natural laminar flow
on the surfaces of the airplane, as well as evaluating the parasite drag contribution of various
components and the thrust generated by the accelerated and heated air exiting the fuselage from the
heat management system.
A NURBS model of the aircraft’s exterior surfaces was placed
within the analysis domain presented in Fig. 32. Simplifications were
made to allow for proper meshing of the full aircraft geometry with
available computational resources.
Both air intakes were removed and control surface gaps were not modeled to allow for
efficient meshing of the geometry. Then, using ANSYS ICEM CFD, the surfaces were meshed
using an all-tri patch conforming surface mesh, with size controls place on each surface, as shown in
Fig. 33. After the placement of volumetric element control regions, an all tetrahedral mesh was
grown from the surfaces using a Delaunay algorithm in order to fill the volume with elements. In
order to properly capture the boundary layer with enough detail to analyze the transition to
turbulence, prism elements were grown from the surfaces into the volume mesh. With an aim of
achieving a y+ < 7, 15 prism layers were grown, with a first element height of 0.05 mm, the boundary
layer elements can be seen in Fig. 34.
Fig. 33 All-tri patch conforming surface mesh Fig. 34 tetrahedral volume mesh
Fig. 32 CFD Domain analysis

40
This resulted in 8,706,320 elements
connected by 2,591,791 nodes, with 5,091,445
elements being tetrahedral and 3,348,237
elements being prisms. Figure 35 shows a
detailed view of the final mesh composition
on lifting surfaces.
ANSYS CFX-pre was used to apply appropriate boundary conditions on the model and to
configure the solver for a steady-state analysis. The atmospheric conditions were set to those at
cruise with a pressure of 69,674 Pa, temperature of 27.9 ˚F, and a flow field velocity of 107.4 ktas.
Turbulence was modeled using a high resolution shear stress transport model with ϒ-θ transitional
turbulence, which allowed for the prediction of the transition from laminar to turbulent flow on the
surface of the aircraft. No-slip boundary conditions were applied to all airplane surfaces, assuming a
sand roughness of 0.51μm33, and a geometric roughness height of 0.05 μm 34
The analysis was then performed using ANSYS CFX solver installed on a 64 bit computer
with an eight core Intel i7 Q 720 processor clocked at 1.6 GHz and allocating 8 Gb of RAM. The
analysis was converged to RMS values below 10-3 over 100 iterations, which took about 6 hours.
. The geometric height
was used to correlate the transitional turbulence model. Both these heights correlate to a polished
surface. The effects of the propeller were modeled using the results presented in Sec. 8.2 for the
propeller’s flow field on a disk shaped boundary. The exit flow from the thermal control system was
modeled as a mass flow from the end of the tail cone.
The result of the analysis was then post processed using ANSYS CFX-post module. Pressure
coefficient and kinetic energy plots were generated to verify the existence of favorable pressure
gradient on the external surfaces of the aircraft, as well as attachment of the flow, and turbulence
transition locations. Figures 36 through 38 present the highlights of these results.
Fig. 35 Prism volume mesh refinement to capture boundary layer features.

41
As it can be seen in Figs. 39 and 40, the wing surfaces have substantial extents of favorable
pressure gradient, so the lower surface of the wings are maintaining 70% of planform wetted area in
laminar flow, while the upper surface maintains an average value of 60% laminar flow.
Fig. 36 Pressure Coefficient contour plot at Cruise Fig. 37 Pressure Coefficient contour plot at Cruise
Fig. 38 Turbulence Kinetic Energy
Fig. 39 Pressure Coefficient contour top Fig. 40 Pressure Coefficient contour bottom

42
The fuselage forebody is also capable of maintaining significant amounts of laminar flow,
estimated to cover 25% of the fuselage wetted area. This is assuming that transparency and door
sealing is done with adequate precision to prevent the tripping of the surface flow and the door and
transparency edges.
Integrating shear forces acting on various surfaces of the aircraft, the breakdown of the total
parasite drag was obtain and is shown in Fig. 41.
Fig. 41 Breakdown of total parasite drag

43
7.0 Structural Analysis 7.1 Loads V-n Diagram
In order to obtain the maneuver envelope for Azalzan, the guidelines provided by FARs for
general aviation aircraft were adopted due to the lack of directly applicable design codes for S-LSAs.
The maneuver envelope was constructed using guidelines provided by FAR §23.335 to determine
the critical case load factors for the structural design process of Azalzan. This study indicated that
the airframe is to be designed for a positive pull-up load factor of 3.8 g to occur at 88 keas at 9,500’
and a negative push-over load factor of -1.52 g to occur at speeds between 55 and 83 keas. It was
determined that the maneuver speed of Azalzan is 85 keas. The dive speed at cruise altitude is
computed to be 117 keas.
The shear and bending moment diagrams for wing and fuselage were computed along
Libove’s principal axes35
to perform structural analysis and sizing using AAA’s load module, which
computes the total load by taking into account aerodynamic and dynamic loads in addition to
concentrated and distributed weight sources on the lifting surfaces and fuselage structures. To
accomplish this analysis, the aerodynamic loads acting on the wing structure were estimated using
various high order methods presented in ESDU Data Item 8304072, the result of which is shown in
terms of lift, drag, and moment diagrams in Fig. 42. The moment coefficient plotted is computed
around the elastic axis of the wing considering both lift and twisting forces acting on the structure.
Fig. 42 Wing Loading

44
The loads acting on the wing structure were calculated by considering both the derived
distribution of lift and drag forces as well as the torsional moment acting on the wing structure. The
total acting forces and moments on the wing were computed by summing the aforementioned
aerodynamic forces with the concentrated weight of the wing structure. These values were
multiplied by a load factor of 3.8 to comply with the critical loading cases predicted by FAR §23.337.
The final V-n diagram is shown in Fig. 43.
7.2 Fuselage Structure
The structure of the fuselage consists of three major sections that are manufactured using
carbon-fiber reinforced plastics (CFRP) with varying thickness depending on the longitudinal station
of the section. Figure 44 presents the structural breakdown of the sub-assemblies of the fuselage.
Fig. 43 Maneuver Envelope
Fig. 44 Fuselage Structural Isometric
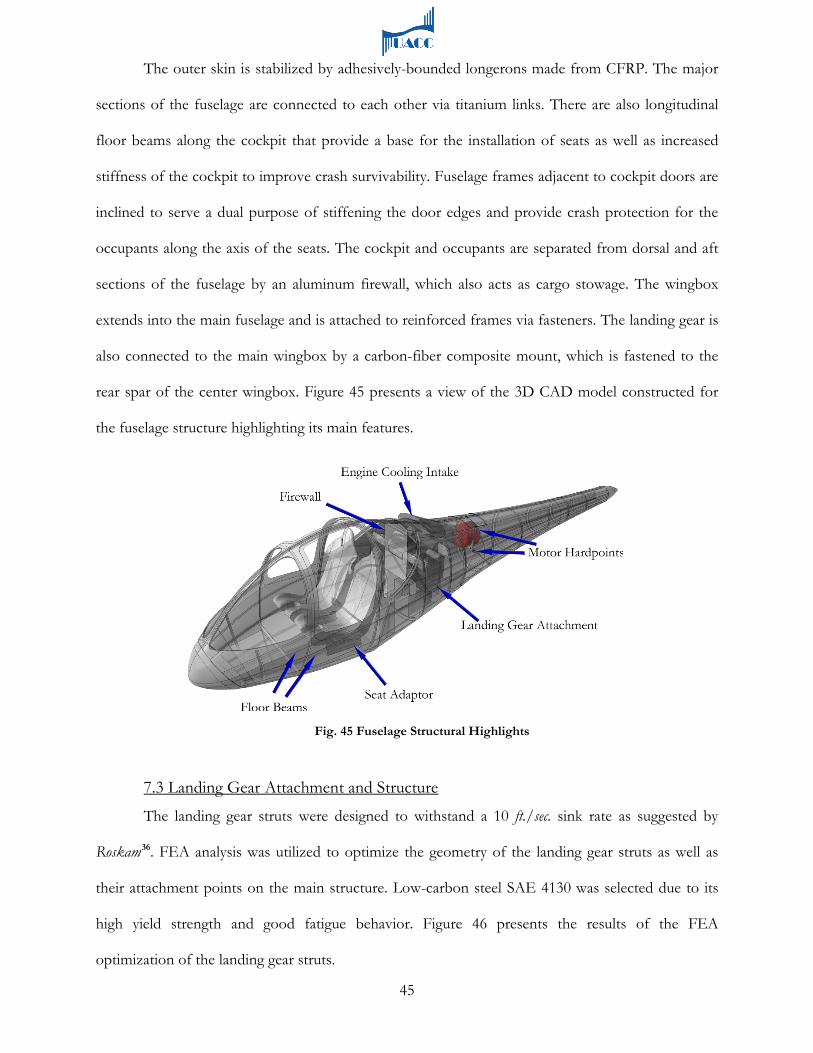
45
The outer skin is stabilized by adhesively-bounded longerons made from CFRP. The major
sections of the fuselage are connected to each other via titanium links. There are also longitudinal
floor beams along the cockpit that provide a base for the installation of seats as well as increased
stiffness of the cockpit to improve crash survivability. Fuselage frames adjacent to cockpit doors are
inclined to serve a dual purpose of stiffening the door edges and provide crash protection for the
occupants along the axis of the seats. The cockpit and occupants are separated from dorsal and aft
sections of the fuselage by an aluminum firewall, which also acts as cargo stowage. The wingbox
extends into the main fuselage and is attached to reinforced frames via fasteners. The landing gear is
also connected to the main wingbox by a carbon-fiber composite mount, which is fastened to the
rear spar of the center wingbox. Figure 45 presents a view of the 3D CAD model constructed for
the fuselage structure highlighting its main features.
7.3 Landing Gear Attachment and Structure
The landing gear struts were designed to withstand a 10 ft./sec. sink rate as suggested by
Roskam36. FEA analysis was utilized to optimize the geometry of the landing gear struts as well as
their attachment points on the main structure. Low-carbon steel SAE 4130 was selected due to its
high yield strength and good fatigue behavior. Figure 46 presents the results of the FEA
optimization of the landing gear struts.
Fig. 45 Fuselage Structural Highlights
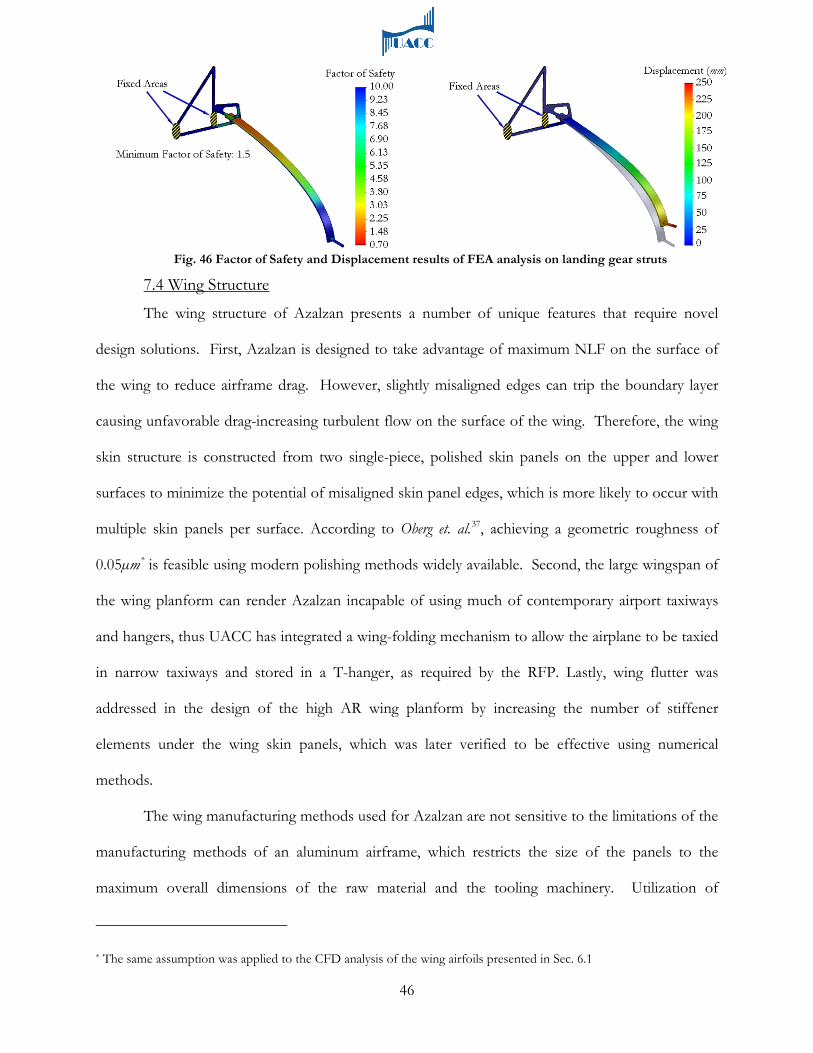
46
7.4 Wing Structure
The wing structure of Azalzan presents a number of unique features that require novel
design solutions. First, Azalzan is designed to take advantage of maximum NLF on the surface of
the wing to reduce airframe drag. However, slightly misaligned edges can trip the boundary layer
causing unfavorable drag-increasing turbulent flow on the surface of the wing. Therefore, the wing
skin structure is constructed from two single-piece, polished skin panels on the upper and lower
surfaces to minimize the potential of misaligned skin panel edges, which is more likely to occur with
multiple skin panels per surface. According to Oberg et. al.37, achieving a geometric roughness of
0.05µm*
The wing manufacturing methods used for Azalzan are not sensitive to the limitations of the
manufacturing methods of an aluminum airframe, which restricts the size of the panels to the
maximum overall dimensions of the raw material and the tooling machinery. Utilization of
is feasible using modern polishing methods widely available. Second, the large wingspan of
the wing planform can render Azalzan incapable of using much of contemporary airport taxiways
and hangers, thus UACC has integrated a wing-folding mechanism to allow the airplane to be taxied
in narrow taxiways and stored in a T-hanger, as required by the RFP. Lastly, wing flutter was
addressed in the design of the high AR wing planform by increasing the number of stiffener
elements under the wing skin panels, which was later verified to be effective using numerical
methods.
* The same assumption was applied to the CFD analysis of the wing airfoils presented in Sec. 6.1
Fig. 46 Factor of Safety and Displacement results of FEA analysis on landing gear struts
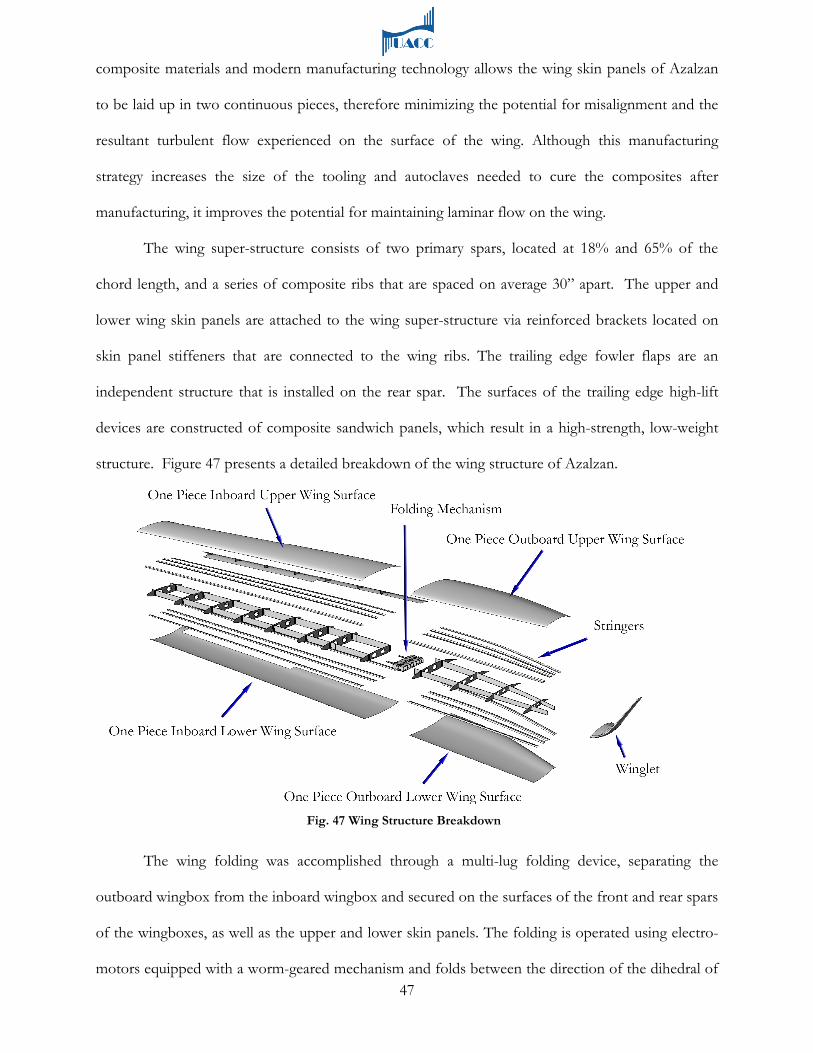
47
composite materials and modern manufacturing technology allows the wing skin panels of Azalzan
to be laid up in two continuous pieces, therefore minimizing the potential for misalignment and the
resultant turbulent flow experienced on the surface of the wing. Although this manufacturing
strategy increases the size of the tooling and autoclaves needed to cure the composites after
manufacturing, it improves the potential for maintaining laminar flow on the wing.
The wing super-structure consists of two primary spars, located at 18% and 65% of the
chord length, and a series of composite ribs that are spaced on average 30” apart. The upper and
lower wing skin panels are attached to the wing super-structure via reinforced brackets located on
skin panel stiffeners that are connected to the wing ribs. The trailing edge fowler flaps are an
independent structure that is installed on the rear spar. The surfaces of the trailing edge high-lift
devices are constructed of composite sandwich panels, which result in a high-strength, low-weight
structure. Figure 47 presents a detailed breakdown of the wing structure of Azalzan.
The wing folding was accomplished through a multi-lug folding device, separating the
outboard wingbox from the inboard wingbox and secured on the surfaces of the front and rear spars
of the wingboxes, as well as the upper and lower skin panels. The folding is operated using electro-
motors equipped with a worm-geared mechanism and folds between the direction of the dihedral of
Fig. 47 Wing Structure Breakdown

48
the wing and the direction perpendicular to the ground. The folding mechanism is secured before
taxi and takeoff by mechanically operated latch pins that are inserted into the connector plate
installed on both sides of the folding mechanism. Figure 48 shows the operation of the folding
mechanism and Fig. 49 presents a close-up view of the locking mechanism.
7.5 Wing Flutter Considerations
Due to the high aspect ratio of Azalzan, flutter characteristics of the wing had to be
considered. Numerous techniques exist for exploring the flutter characteristics of typical aircraft,
ranging from pure analytic methods to procedures treating wings as a large set of coupled, damped
and driven mechanical oscillators. Typically, these procedures are difficult to implement and do not
yield dependable results unless considerable effort is expended to model the structural wing
coefficients with as much detail as possible.
In lieu of such procedures, UACC opted for a semi-analytic method that makes use of
known flutter velocities for a variety of similar aircraft and maps these flutter velocities to velocities
for similar aircraft with the aspect ratio of Azalzan. The procedure is based on a method of flutter
analysis given by Molyneux et al.38
Using this method as a basis, UACC adopted a method of mapping flutter velocities
between two crafts of similar construction, each with finite aspect ratio (as opposed to mapping
which gives an analytic method for converting between flutter
velocities of craft with infinite aspect ratio to craft of similar construct with finite aspect ratio. The
method is completed by an empirically determined function which can be used to perform this
conversion.
Fig. 48 Demonstration of wing folding Fig. 49 Close up of wing folding mechanism
49
between two crafts of similar construct, one with finite aspect ratio, the other with infinite aspect
ratio - as detailed by Molyneux et al.).
Molyneux et al. present an argument that the effect of aspect ratio on flutter velocity can be
modeled by first considering a similar wing of infinite aspect ratio. It can be shown, by modifying
the relevant quantities in the coupled oscillator equation, that the calculated flutter velocity for a
finite aspect ratio craft is related to the calculated flutter velocity for an infinite aspect ratio craft of
similar make by the following equation:
, (2)
where V0 is the flutter velocity for an infinite aspect ratio, Vflutter is the flutter velocity for a finite
aspect ratio (the quantity of interest) and f(AR) is a function only of aspect ratio. The argument
detailed in Molyneux et al. only shows that this equation is valid to merely consider the effect of
aspect ratio by multiplicative scaling by some undetermined function (of aspect ratio only).
However, it does not provide the exact form of the function - it only argues that a form with this
dependence is sufficient to account for the relationship between aspect ratio and flutter velocity*
Determination of f(AR) is necessary to complete Molyneux et al.’s procedure. Though
possible analytically, it is simpler and more reliable to find f(AR) empirically. Following this idea,
UACC analyzed several sets of similar wing planforms with comparable aerodynamic and structural
derivatives for each wing in a given set but varying in aspect ratio.
.
Using an analytically determined value for V0 (based on an infinite aspect ratio wing with the
same structural and aerodynamic derivatives), f(AR) was determined empirically yielding the
following overall form:
, (3)
This equation is sufficient to account for variation of flutter speed due to aspect ratio.
Now, for a new set of wings, Molyneux et al. suggests that V0 be calculated from a set of 2D
* This is the extent of the result of the analytic portion of the method. For more detail on the derivation of this form, consult Molyneux et al.
f(AR)VV 0flutter =
+=
AR0.81VV 0flutter

50
aerodynamic strip derivatives for our wings. However, V0 can be computed using simpler methods:
a craft with known Vflutter and AR can be used to calculate V0 for the particular family of wings
sharing its aerodynamic and structural derivatives. From here, the formula can be reapplied to yield
a new equation giving the flutter velocity for a new aircraft in terms of the known flutter velocity of
another aircraft. Under this modification of the original method, the following equation giving the
flutter velocity for Azalzan is obtained:
, (4)
where Vs is the measured or calculated flutter velocity of a structurally and aerodynamically similar
reference aircraft, AR1 is the aspect ratio of Azalzan, ARs is the reference aspect ratio, and Vflutter is
the calculated flutter velocity for the craft. Using listed values of VNE and VD for various aircraft
which are relatively similar to Azalzan, as well as regulations concerning the relationship between
these velocities and flutter velocity, lower bounds for the flutter velocities of these various aircraft
were derived. Using Eq.4 and the calculated flutter velocities (as well as the corresponding aspect
ratios) of the reference aircraft, it is possible to create a list of possible Vflutter’s.
The sample aircraft were assumed to cover an extensive range of structural and
aerodynamic characteristics similar enough to Azalzan so that it falls somewhere within the
parameter space mapped out by the sample aircraft. Therefore, the lowest estimate of Vflutter given
by these aircraft is a worst case scenario for Azalzan, since the previously estimated values for the
various Vs are already pessimistic. Thus, it was found that it is highly unlikely for Azalzan to have a
flutter velocity below this worst case estimate. Therefore, if the estimated flutter velocity exceeds
the velocity necessary for regular operation, Azalzan satisfies the flutter requirements with high
probability. Due to the extremely conservative and empirical nature of this estimate, UACC believes
that its results are as dependable as those obtained by performing a computationally intensive
analysis, but requiring significantly less effort. Using the procedure, a worst case value of 147 kts. for
Vflutter was calculated, which is above the operational speed requirements, as discussed in Ch. 13.
++=
S1sflutter AR
0.8AR0.81VV
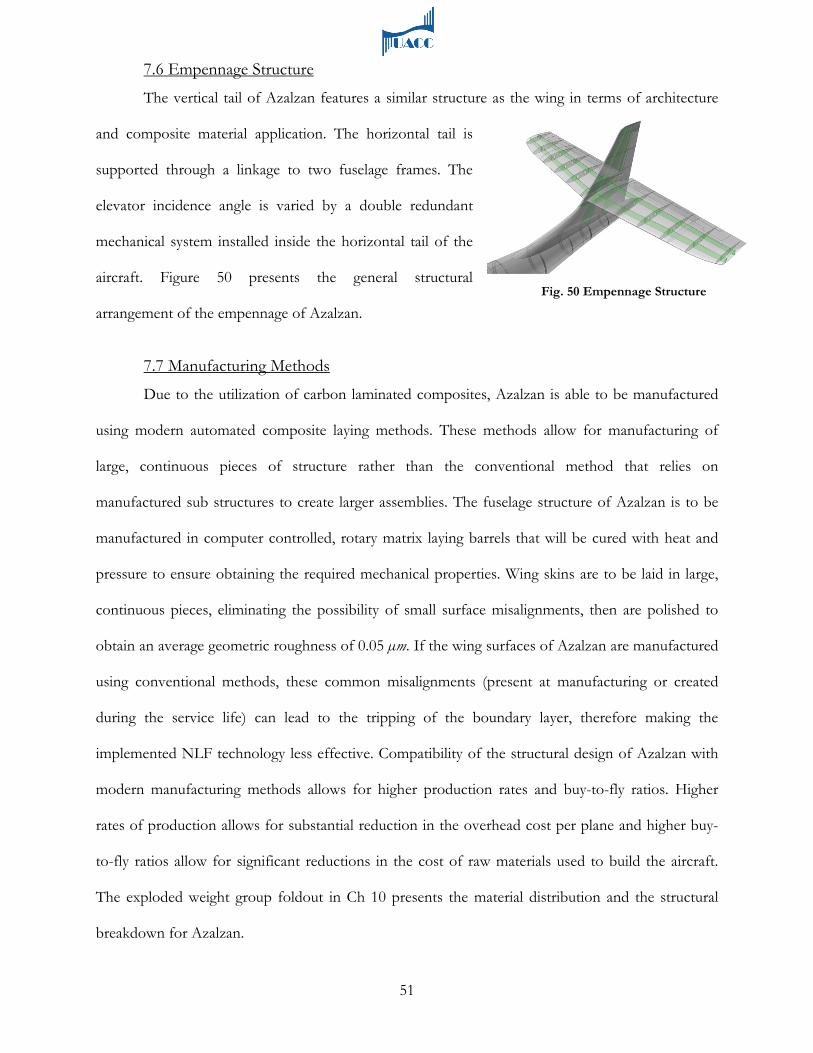
51
7.6 Empennage Structure
The vertical tail of Azalzan features a similar structure as the wing in terms of architecture
and composite material application. The horizontal tail is
supported through a linkage to two fuselage frames. The
elevator incidence angle is varied by a double redundant
mechanical system installed inside the horizontal tail of the
aircraft. Figure 50 presents the general structural
arrangement of the empennage of Azalzan.
7.7 Manufacturing Methods
Due to the utilization of carbon laminated composites, Azalzan is able to be manufactured
using modern automated composite laying methods. These methods allow for manufacturing of
large, continuous pieces of structure rather than the conventional method that relies on
manufactured sub structures to create larger assemblies. The fuselage structure of Azalzan is to be
manufactured in computer controlled, rotary matrix laying barrels that will be cured with heat and
pressure to ensure obtaining the required mechanical properties. Wing skins are to be laid in large,
continuous pieces, eliminating the possibility of small surface misalignments, then are polished to
obtain an average geometric roughness of 0.05 µm. If the wing surfaces of Azalzan are manufactured
using conventional methods, these common misalignments (present at manufacturing or created
during the service life) can lead to the tripping of the boundary layer, therefore making the
implemented NLF technology less effective. Compatibility of the structural design of Azalzan with
modern manufacturing methods allows for higher production rates and buy-to-fly ratios. Higher
rates of production allows for substantial reduction in the overhead cost per plane and higher buy-
to-fly ratios allow for significant reductions in the cost of raw materials used to build the aircraft.
The exploded weight group foldout in Ch 10 presents the material distribution and the structural
breakdown for Azalzan.
Fig. 50 Empennage Structure

52
8.0 Propulsion 8.1 Electromotor Type Selection
In order to maintain a low overall weight figure and a high efficiency, various types of
electric motors were studied to be used as a powerplant for Azalzan. Given that available battery
technologies only produce direct current (DC), a tradeoff was observed between using a lower
weight AC motor in need of a separate power inverter unit (DC/AC converter) and using a heavier
DC motor with no need of a converter. Performing a survey of existing types of electro-motors
from various manufacturers, UACC concluded that a DC brushless motor is the best available
electro-motor type for the configuration. DC brushless motors typically have higher efficiencies than
other comparable DC motors and have a simpler mechanical construction with no need of complex
control circuits to regulate RPM39
*Calculated; ** Approximate
. Table 6 presents a summary of the most promising choices of
electric motors studied.
8.2 Propeller
The propeller design for Azalzan was based on the limits defined by the performance of the
motor selected and the goal of reducing noise to increase passenger comfort. The performance of
the motor defines the range of RPMs in which the propeller is to operate, by knowing the RPM
value at which the motor produces the maximum power. Minimizing the noise produced by the
Yuneec Power Drive 60 UQM Powerphase 75 AC Propulsion Drive BRUSA ASM8.24.10
Type Brushless DC Brushless DC AC Induction AC Induction Weight (lb.) 66 90 110 150
Accessory Weight (lb.) 20 35 66 21 Operational Weight (lb.) 86 125 176 172
Max Power (hp) 81 100 268 82 Power Density (hp/lb) 1.23 1.11 2.44 0.55
Max Torque (lb-ft) 410* 176 N/A 400 Max Efficiency 92 94 90** 93
Table 6 Summary of Motor Selection Study
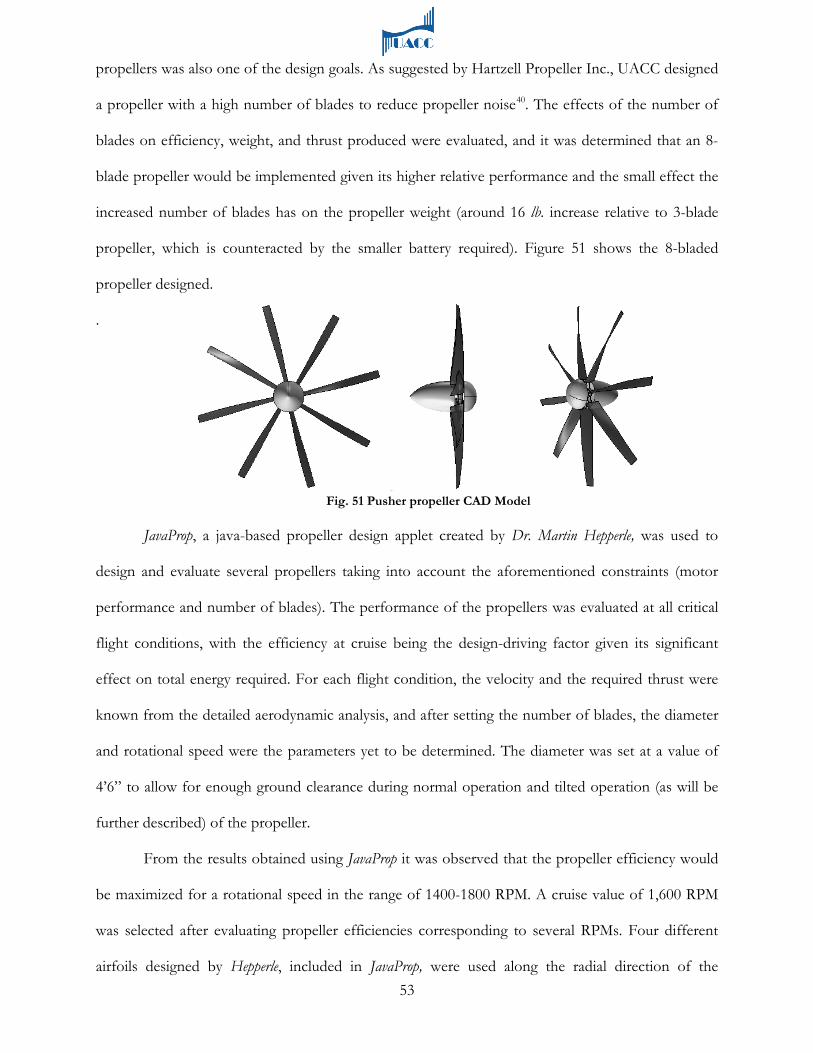
53
propellers was also one of the design goals. As suggested by Hartzell Propeller Inc., UACC designed
a propeller with a high number of blades to reduce propeller noise40
.
. The effects of the number of
blades on efficiency, weight, and thrust produced were evaluated, and it was determined that an 8-
blade propeller would be implemented given its higher relative performance and the small effect the
increased number of blades has on the propeller weight (around 16 lb. increase relative to 3-blade
propeller, which is counteracted by the smaller battery required). Figure 51 shows the 8-bladed
propeller designed.
JavaProp, a java-based propeller design applet created by Dr. Martin Hepperle, was used to
design and evaluate several propellers taking into account the aforementioned constraints (motor
performance and number of blades). The performance of the propellers was evaluated at all critical
flight conditions, with the efficiency at cruise being the design-driving factor given its significant
effect on total energy required. For each flight condition, the velocity and the required thrust were
known from the detailed aerodynamic analysis, and after setting the number of blades, the diameter
and rotational speed were the parameters yet to be determined. The diameter was set at a value of
4’6” to allow for enough ground clearance during normal operation and tilted operation (as will be
further described) of the propeller.
From the results obtained using JavaProp it was observed that the propeller efficiency would
be maximized for a rotational speed in the range of 1400-1800 RPM. A cruise value of 1,600 RPM
was selected after evaluating propeller efficiencies corresponding to several RPMs. Four different
airfoils designed by Hepperle, included in JavaProp, were used along the radial direction of the
Fig. 51 Pusher propeller CAD Model

54
propeller, for which the applet optimizes the
propeller twist distribution. The result is a
propeller with a cruise efficiency of 91%. The
efficiency and thrust curves of the propeller at
cruise are shown in Fig. 52. Additionally, the
propeller presents high efficiencies in other flight
conditions, with all the efficiency values being above 75%.
A tilting mechanism was designed to allow for the propeller to be tilted a maximum of 40°
downwards. An electric linear actuator located in the fuselage rotates a hollow shaft axially aligned
with the driveshaft. The hollow shaft in turn transmits its rotational motion to the propeller shaft via
a rubber belt, which transmits the required torque to turn a U-joint in the propeller driveshaft.
Tilting the propeller downwards affects the dynamics of the aircraft in two ways: First, the
resulting inclined thrust has a component directed upwards, which adds to the lift of the airplane.
Second, the combined effects of propeller tilting and flap deflection greatly increase the maximum
lift of the aircraft, as will be further described in section 12 .Figures 53 and 54 depict the propeller
tilting mechanism.
54
Fig. 53 Propeller tilting mechanism close up
Fig. 52 Results of propeller efficiency analysis @ cruise
Fig. 54 Propeller tilting mechanism detail

55
Fig. 55 Battery pack
9.0 Electrical Systems 9.1 Electrical Storage
As it was previously stated in Sec. 2.2, lithium-air batteries possess sufficient energy while
having the lowest weight and development risk of all comparable battery types. A survey of
developers of modern battery technologies indicated that at present there are two main entities that
are working towards commercialization of lithium-air battery technology, namely PolyPlus of
Berkeley, CA and the University of Dayton Research Institute in Dayton, OH. Contact was made
with the published researchers41
It was determined that, given their solid-state nature, there are no special safety concerns
regarding lithium-air batteries, such as explosions or catastrophic failures. From the correspondence,
it was also determined that lithium-air batteries possess an efficiency of 70% at high drain rates and
an estimated energy density of 1,000 Whr/kg. The lithium-air electro-chemical process is determined
to be highly exothermic, which requires a dedicated high-performance cooling system integrated
with the battery pack. It was also established that, by 2016, such batteries will be made available
commercially. An estimated minimum five-year shelf life and over 500 charge cycles are projected
for a commercialized lithium-air battery unit. It was also confirmed that the lithium-air battery unit
has to be operated at relatively high temperatures, generally greater than 120 °F. Given this
information and the most accurate estimation of the required
amount of energy to fly the mission specified by the RFP (presented
in Sec. 2.3), a lithium-air battery pack was designed taking into
account its integration with the dorsal fuselage section. Figure 55
presents a view of the battery pack design. Considering that the
battery pack is made up of hundreds of small cells
in these organizations and, as a result of their cooperation,
information was obtained regarding the performance and viability of using a lithium-air battery as
the primary energy source for aerospace applications in the near future.
42, the outer geometry of the pack can be tailored
to fit in otherwise unused spaces in the aircraft. The battery pack was designed to utilize some of the

56
unused space in the lower fuselage section. An onboard battery charger/monitor rectifies alternating
current from a conventional electrical outlet to direct current required to charge the battery. The
performance of the charger will be discussed further in Sec. 14.2.
9.2 Electric Distribution Architecture
The presence of a high-voltage motor as well as low-voltage components dictates that the
electric architecture of Azalzan must feature two voltages of 166 V and 28 V, respectively. This
requires the implementation of a DC-DC converter to extract the 28 V electric current from the
high-voltage (161-190 V) battery. The high current demand of the motor (342 A max.) requires two
wires to carry each of the three phases to minimize voltage loss and eliminate the need for a
complex, heavy, and expensive circuit breaker. The architecture was fully simulated in the Simulink
environment to verify the behavior of the system via validating steady-state currents, motor speed,
and mechanical torque produced by the motor in various flight conditions. A sample signal reading
is presented after the electrical system foldout.
The requirement of specific voltages and currents for the motor to operate as desired at
every flight condition makes it necessary to implement an advanced power management system.
This system acts as a controller, determining the optimal current and voltage levels that must be
supplied by the battery to the motor. The unit creates the desired three-phase output for the motor
from a DC current provided by the battery. Another smaller control system is used to regulate the
low-voltage (28 V) electric circuit, comprised of the prop-tilting actuator, cockpit lighting, and
instrumentation.
9.3 Avionics and Secondary Electrical Components
A number of secondary electrical components are present in Azalzan, including the avionics
system, the lighting system, and the prop-tilting actuator. The avionics package consists of a
combination of multi-function displays (MFDs) and backup analog instruments. The main element
is the Garmin GTN™ 750, a 7” digital MFD that has all of the relevant flight indicators, e.g. artificial
horizon, altitude, rate of climb, airspeed, horizontal situation indicator, and G-meter. Additional
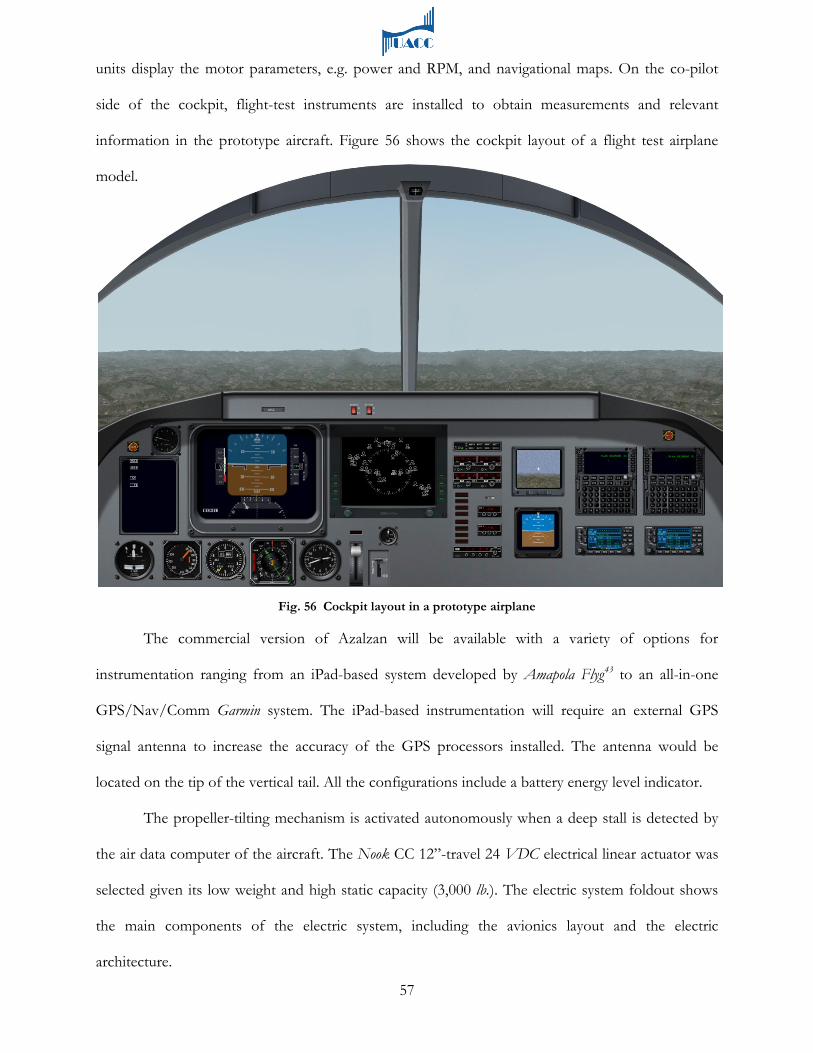
57
units display the motor parameters, e.g. power and RPM, and navigational maps. On the co-pilot
side of the cockpit, flight-test instruments are installed to obtain measurements and relevant
information in the prototype aircraft. Figure 56 shows the cockpit layout of a flight test airplane
model.
Fig. 56 Cockpit layout in a prototype airplane
The commercial version of Azalzan will be available with a variety of options for
instrumentation ranging from an iPad-based system developed by Amapola Flyg43
The propeller-tilting mechanism is activated autonomously when a deep stall is detected by
the air data computer of the aircraft. The Nook CC 12”-travel 24 VDC electrical linear actuator was
selected given its low weight and high static capacity (3,000 lb.). The electric system foldout shows
the main components of the electric system, including the avionics layout and the electric
architecture.
to an all-in-one
GPS/Nav/Comm Garmin system. The iPad-based instrumentation will require an external GPS
signal antenna to increase the accuracy of the GPS processors installed. The antenna would be
located on the tip of the vertical tail. All the configurations include a battery energy level indicator.
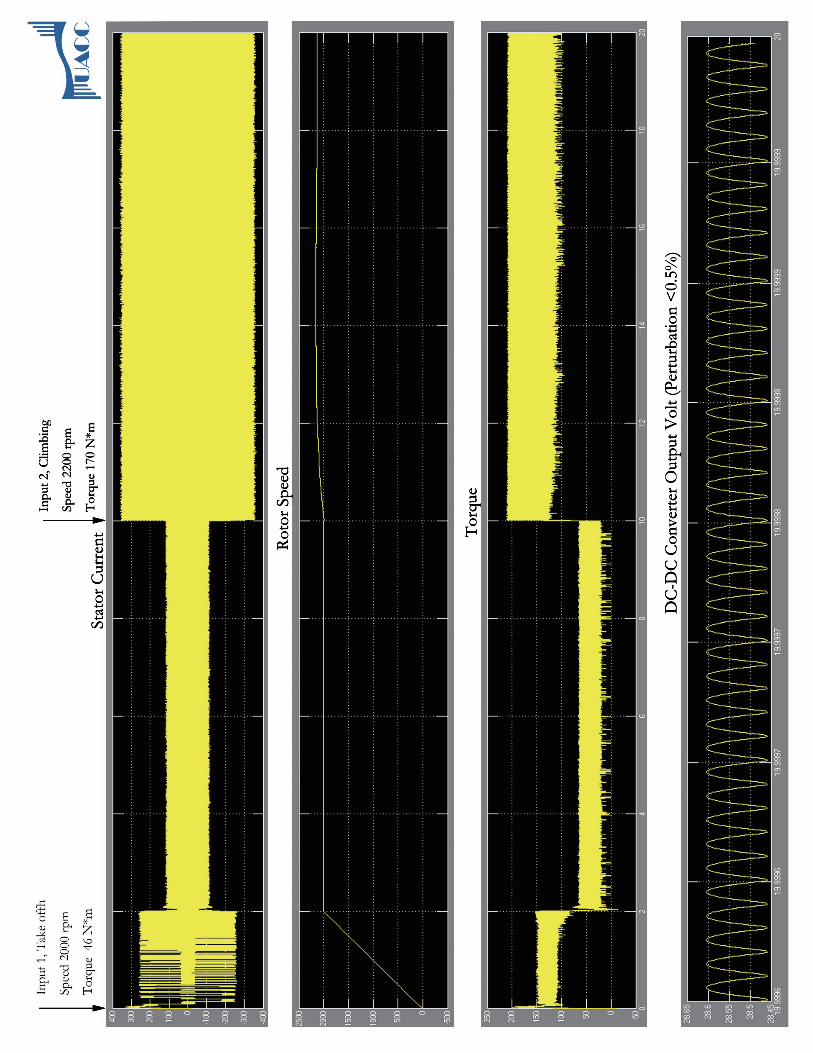
Stator Current Rotor Speed
Torque
DC-DC Converter Output Volt (Perturbation <0.5%)
Input 2, Climbing
Speed 2200 rpm
Torque 170 N*m

Stator Current
Rotor Speed
Torque
DC-DC Converter Output Volt (Perturbation <0.5%)
Input 2, Climbing
Speed 2200 rpm
Torque 170 N*m

60
10.0 Systems Integration 10.1 Heat Management
The use of high-powered electric and electronic systems results in a large quantity of heat
that must be dissipated to maintain optimum operating conditions. An advanced heat management
system was designed combining liquid-cooled and air-cooled systems to dispose large amounts of
excess heat. As suggested by Tesla Motors44, a liquid-air plate-fin heat exchanger was used for
cooling the battery pack due to its low weight and high volume-to-surface area ratio45. The heat
exchanger for the system was sized using methods outlined by Hesselgreaves46
The heat exchanger was designed to dissipate a maximum of 17 kW of heat as dictated by
the battery heat generation during takeoff. It was determined that a maximum water flow rate
required to remove the heat generated to be 3.0 gal./min. The maximum airflow at standard
conditions is 195 cfm. To circulate the cooling fluid, the Flojet Quad Pump 4000 Series, an
electrically-driven water pump capable of inducing 5.0 gal./min., was selected because it satisfied the
required flow rate while having the lowest weight. Figure 57 shows the location of the battery
cooling system in the fuselage.
to determine its overall
volume and weight as well as the required mass flow of the cooling liquid and air. The heat
generated by the battery, summarized in Table 7, was
calculated in order to size the heat exchanger. The heat
was calculated by assuming that the battery power
inefficiency was dissipated in the form of heat.
Flight Condition Power (kW) Heat (kW) Takeoff 37.7 17.0
Climb 12.2 5.2 Cruise 12.3 5.3
Descend 92.7 4.0 Landing 10.0 4.3
Fig. 57 Battery cooling system
Table 7 Power used and heat generated at critical flight conditions.
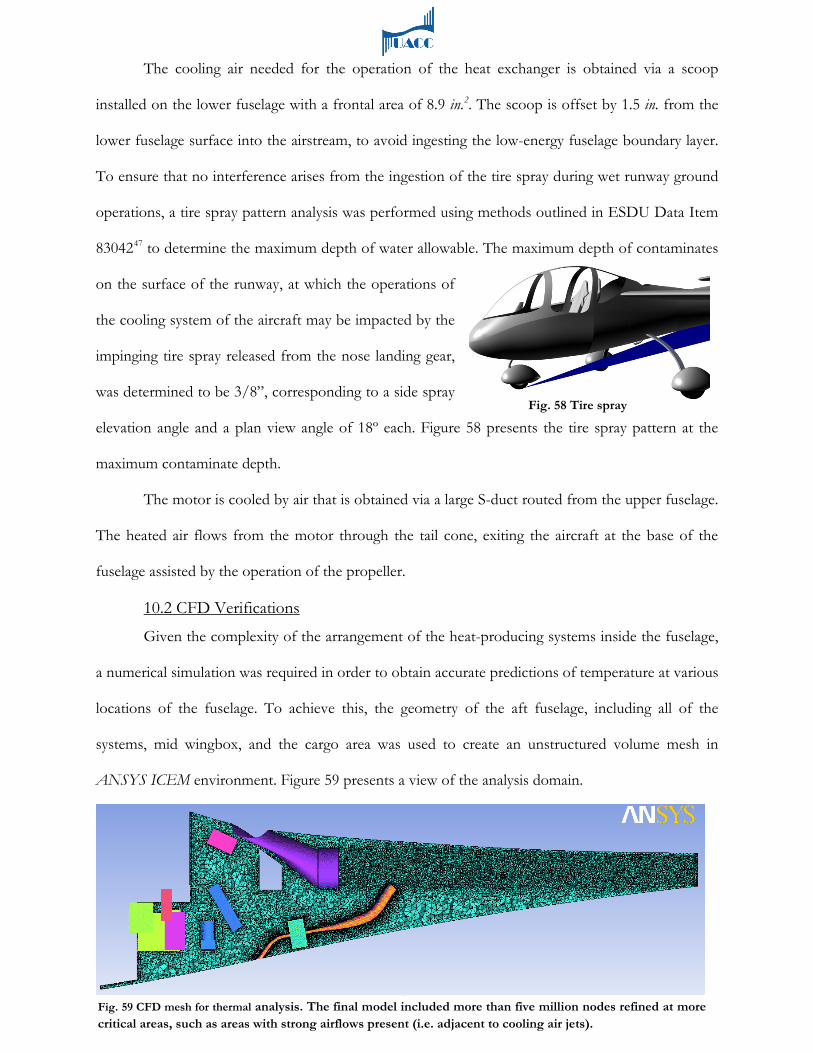
61
The cooling air needed for the operation of the heat exchanger is obtained via a scoop
installed on the lower fuselage with a frontal area of 8.9 in.2. The scoop is offset by 1.5 in. from the
lower fuselage surface into the airstream, to avoid ingesting the low-energy fuselage boundary layer.
To ensure that no interference arises from the ingestion of the tire spray during wet runway ground
operations, a tire spray pattern analysis was performed using methods outlined in ESDU Data Item
8304247
The motor is cooled by air that is obtained via a large S-duct routed from the upper fuselage.
The heated air flows from the motor through the tail cone, exiting the aircraft at the base of the
fuselage assisted by the operation of the propeller.
to determine the maximum depth of water allowable. The maximum depth of contaminates
on the surface of the runway, at which the operations of
the cooling system of the aircraft may be impacted by the
impinging tire spray released from the nose landing gear,
was determined to be 3/8”, corresponding to a side spray
elevation angle and a plan view angle of 18º each. Figure 58 presents the tire spray pattern at the
maximum contaminate depth.
10.2 CFD Verifications
Given the complexity of the arrangement of the heat-producing systems inside the fuselage,
a numerical simulation was required in order to obtain accurate predictions of temperature at various
locations of the fuselage. To achieve this, the geometry of the aft fuselage, including all of the
systems, mid wingbox, and the cargo area was used to create an unstructured volume mesh in
ANSYS ICEM environment. Figure 59 presents a view of the analysis domain.
Fig. 58 Tire spray
Fig. 59 CFD mesh for thermal analysis. The final model included more than five million nodes refined at more critical areas, such as areas with strong airflows present (i.e. adjacent to cooling air jets).
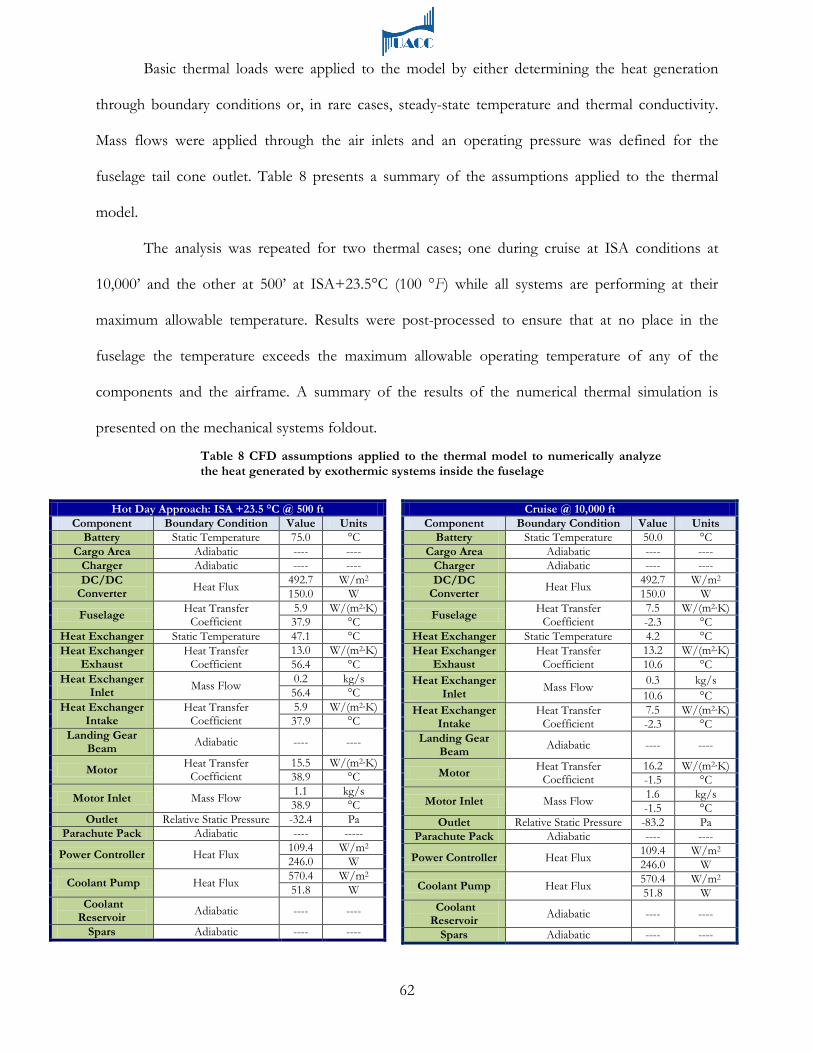
62
Basic thermal loads were applied to the model by either determining the heat generation
through boundary conditions or, in rare cases, steady-state temperature and thermal conductivity.
Mass flows were applied through the air inlets and an operating pressure was defined for the
fuselage tail cone outlet. Table 8 presents a summary of the assumptions applied to the thermal
model.
The analysis was repeated for two thermal cases; one during cruise at ISA conditions at
10,000’ and the other at 500’ at ISA+23.5°C (100 °F) while all systems are performing at their
maximum allowable temperature. Results were post-processed to ensure that at no place in the
fuselage the temperature exceeds the maximum allowable operating temperature of any of the
components and the airframe. A summary of the results of the numerical thermal simulation is
presented on the mechanical systems foldout.
Hot Day Approach: ISA +23.5 °C @ 500 ft Component Boundary Condition Value Units
Battery Static Temperature 75.0 °C Cargo Area Adiabatic ---- ----
Charger Adiabatic ---- ---- DC/DC
Converter Heat Flux 492.7 W/m2 150.0 W
Fuselage Heat Transfer Coefficient
5.9 W/(m2∙K) 37.9 °C
Heat Exchanger Static Temperature 47.1 °C Heat Exchanger
Exhaust Heat Transfer
Coefficient 13.0 W/(m2∙K) 56.4 °C
Heat Exchanger Inlet Mass Flow 0.2 kg/s
56.4 °C Heat Exchanger
Intake Heat Transfer
Coefficient 5.9 W/(m2∙K) 37.9 °C
Landing Gear Beam Adiabatic ---- ----
Motor Heat Transfer Coefficient
15.5 W/(m2∙K) 38.9 °C
Motor Inlet Mass Flow 1.1 kg/s 38.9 °C
Outlet Relative Static Pressure -32.4 Pa Parachute Pack Adiabatic ---- -----
Power Controller Heat Flux 109.4 W/m2 246.0 W
Coolant Pump Heat Flux 570.4 W/m2 51.8 W
Coolant Reservoir Adiabatic ---- ----
Spars Adiabatic ---- ----
Cruise @ 10,000 ft Component Boundary Condition Value Units
Battery Static Temperature 50.0 °C Cargo Area Adiabatic ---- ----
Charger Adiabatic ---- ---- DC/DC
Converter Heat Flux 492.7 W/m2 150.0 W
Fuselage Heat Transfer Coefficient
7.5 W/(m2∙K) -2.3 °C
Heat Exchanger Static Temperature 4.2 °C Heat Exchanger
Exhaust Heat Transfer
Coefficient 13.2 W/(m2∙K) 10.6 °C
Heat Exchanger Inlet Mass Flow 0.3 kg/s
10.6 °C Heat Exchanger
Intake Heat Transfer
Coefficient 7.5 W/(m2∙K) -2.3 °C
Landing Gear Beam Adiabatic ---- ----
Motor Heat Transfer Coefficient
16.2 W/(m2∙K) -1.5 °C
Motor Inlet Mass Flow 1.6 kg/s -1.5 °C
Outlet Relative Static Pressure -83.2 Pa Parachute Pack Adiabatic ---- ----
Power Controller Heat Flux 109.4 W/m2 246.0 W
Coolant Pump Heat Flux 570.4 W/m2 51.8 W
Coolant Reservoir Adiabatic ---- ----
Spars Adiabatic ---- ----
Table 8 CFD assumptions applied to the thermal model to numerically analyze the heat generated by exothermic systems inside the fuselage
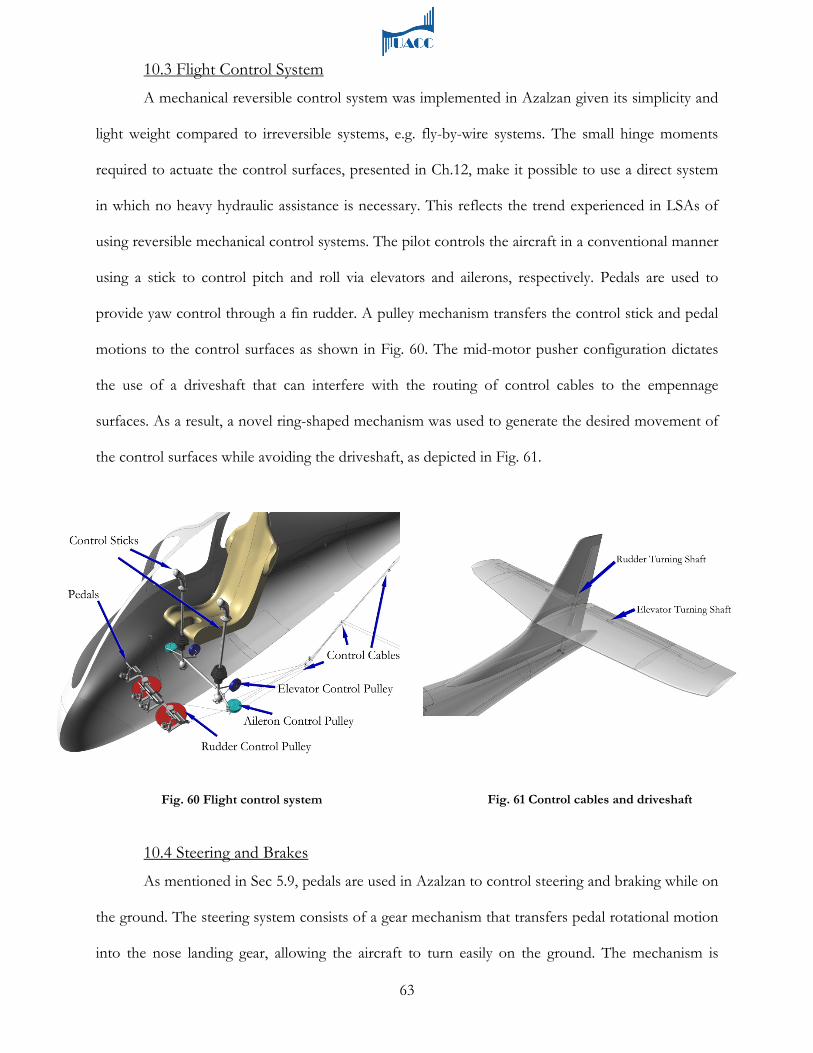
63
10.3 Flight Control System
A mechanical reversible control system was implemented in Azalzan given its simplicity and
light weight compared to irreversible systems, e.g. fly-by-wire systems. The small hinge moments
required to actuate the control surfaces, presented in Ch.12, make it possible to use a direct system
in which no heavy hydraulic assistance is necessary. This reflects the trend experienced in LSAs of
using reversible mechanical control systems. The pilot controls the aircraft in a conventional manner
using a stick to control pitch and roll via elevators and ailerons, respectively. Pedals are used to
provide yaw control through a fin rudder. A pulley mechanism transfers the control stick and pedal
motions to the control surfaces as shown in Fig. 60. The mid-motor pusher configuration dictates
the use of a driveshaft that can interfere with the routing of control cables to the empennage
surfaces. As a result, a novel ring-shaped mechanism was used to generate the desired movement of
the control surfaces while avoiding the driveshaft, as depicted in Fig. 61.
10.4 Steering and Brakes
As mentioned in Sec 5.9, pedals are used in Azalzan to control steering and braking while on
the ground. The steering system consists of a gear mechanism that transfers pedal rotational motion
into the nose landing gear, allowing the aircraft to turn easily on the ground. The mechanism is
Fig. 61 Control cables and driveshaft Fig. 60 Flight control system
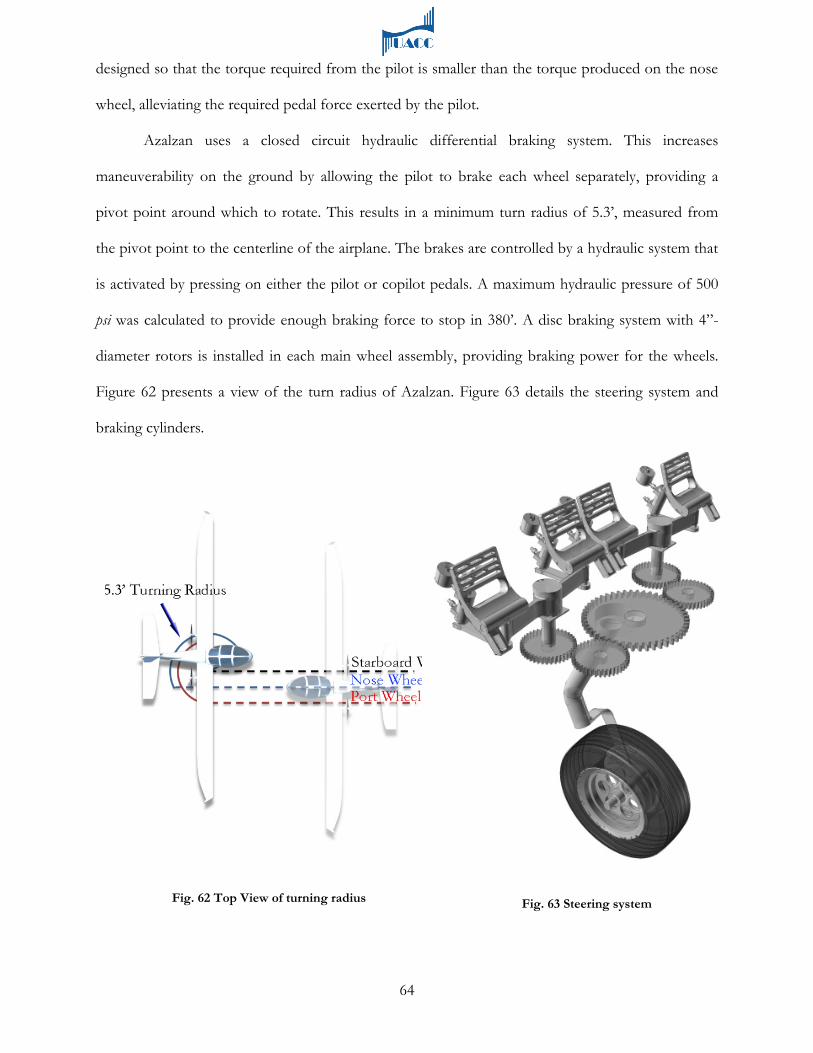
64
designed so that the torque required from the pilot is smaller than the torque produced on the nose
wheel, alleviating the required pedal force exerted by the pilot.
Azalzan uses a closed circuit hydraulic differential braking system. This increases
maneuverability on the ground by allowing the pilot to brake each wheel separately, providing a
pivot point around which to rotate. This results in a minimum turn radius of 5.3’, measured from
the pivot point to the centerline of the airplane. The brakes are controlled by a hydraulic system that
is activated by pressing on either the pilot or copilot pedals. A maximum hydraulic pressure of 500
psi was calculated to provide enough braking force to stop in 380’. A disc braking system with 4”-
diameter rotors is installed in each main wheel assembly, providing braking power for the wheels.
Figure 62 presents a view of the turn radius of Azalzan. Figure 63 details the steering system and
braking cylinders.
Fig. 63 Steering system Fig. 62 Top View of turning radius
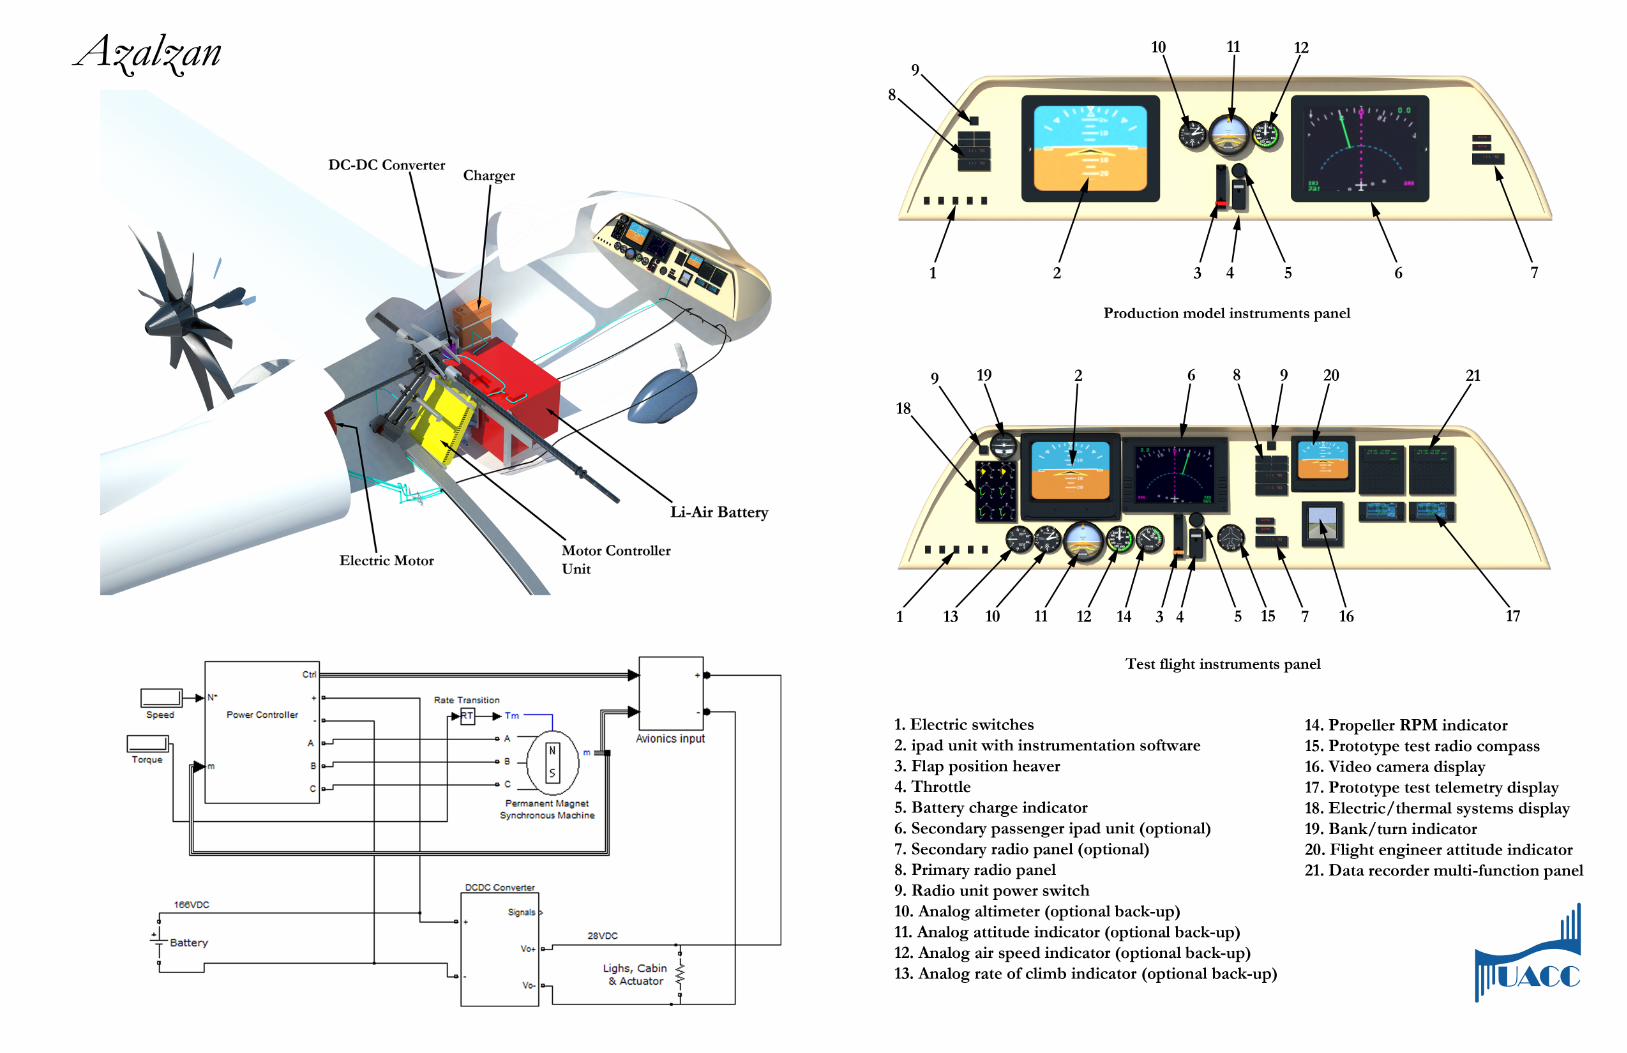

70
12.0 Stability and Control 12.1 Loading Cases
As suggested by the RFP, the alternative loadings of the airplane were investigated by
determining the CG location for three critical cases; a single light passenger (120 lb.) with no luggage,
two light-heavy passengers (170 lb.) with luggage (60 lb.), and two heavy passengers (200 lb.) without
luggage. Additionally, the option for trading one passenger for an additional battery was
accommodated for. It was concluded after the analysis (as will be presented in following sections)
that Azalzan is capable of accommodating all loading cases required by the RFP with sufficient
longitudinal static margin and negligible degrading of handling performance.
12.2 Balance, CG Travel, and Wing Location
Static stability of the configuration was achieved by performing a parametric study of the
impact of the longitudinal location of the wing on the magnitude of static margin using the methods
presented by Roskam52. Mass properties analysis of Azalzan indicated that a CG travel range
equivalent to 19.8% of mean aerodynamic chord of the aircraft is possible among all different
loading cases dictated by the RFP. A minimum target positive stick free static margin of 20%53
was
selected for the mid-cruise segment of the flight to ensure the inherent static stability of the aircraft.
The result of this parametric study can be seen in Figure 66.
Fig. 66 Wing location trade study

66
11.0 Weight Justification & Analysis 11.1 Detailed Weight Analysis
A detailed weight analysis (Class II48) collaborates the methods established by Cessna49, the
United States Air Force, General Dynamics, and Torenbeek50 to accurately project the weight of the
aircraft by verified methods based on geometry of the airplane51
. However, the versatility and utility
of these methods are not without faults. Specifically, these methods are overly general and are best
applied to standard aircraft configurations and fall short when applied to aircraft with
unconventional characteristics like Azalzan, e.g. high aspect ratios, wing folding mechanisms, and
heavy use of composite materials. For example, the Cessna weight methods predicted an overly large
value for the wing weight that contradicted common sense. Due to this deficiency, UACC later
pursued a Class III part-by-part weight estimation that broke down the design of Azalzan into an
appropriate custom weight estimation. Table 10 presents the results of the Class II weight
estimation.
Weight Component Cessna Method (lb.)
USAF Method (lb.)
GD Method (lb.)
Torenbeek Method (lb.)
Average Values (lb.)
Wing 130 123 ------- 125 126 Horizontal Tail 28 28 ------- ------- 26
Vertical Tail 10 8 ------- ------- 8 Fuselage 122 87 ------- ------- 104
Nose Landing Gear 8 1 ------- 28 14 Main Landing Gear 35 2 ------- 73 43
Structure 332 249 ------- 226 323 Propeller ------- ------- 66 66 61
Propeller Motor 136 ------- ------- 130 66 Tilting System ------- ------- ------- ------- 14
Battery ------- ------- ------- ------- 160 Propeller Shaft ------- ------- 25 23 63
Power Plant 136 ------- 91 219 364 Air Induction System ------- ------- ------- 1 1 Flight Control System 27 108 ------- 32 47
Avionics ------- ------- ------- 66 43 Electrical System 43 85 ------- 39 47
Cooling ------- 33 ------- 5 15 Furnishings 34 ------- ------- 31 20 Other Items ------- ------- ------- 5 3 Parachute ------- ------- ------- ------- 33
Fixed Equipment 103 226 ------- 178 208 Empty Weight ------- ------- ------- ------- 895
Maximum Takeoff Weight ------- ------- ------- ------- 1,295
Table 10 Summary of Class II weight estimation
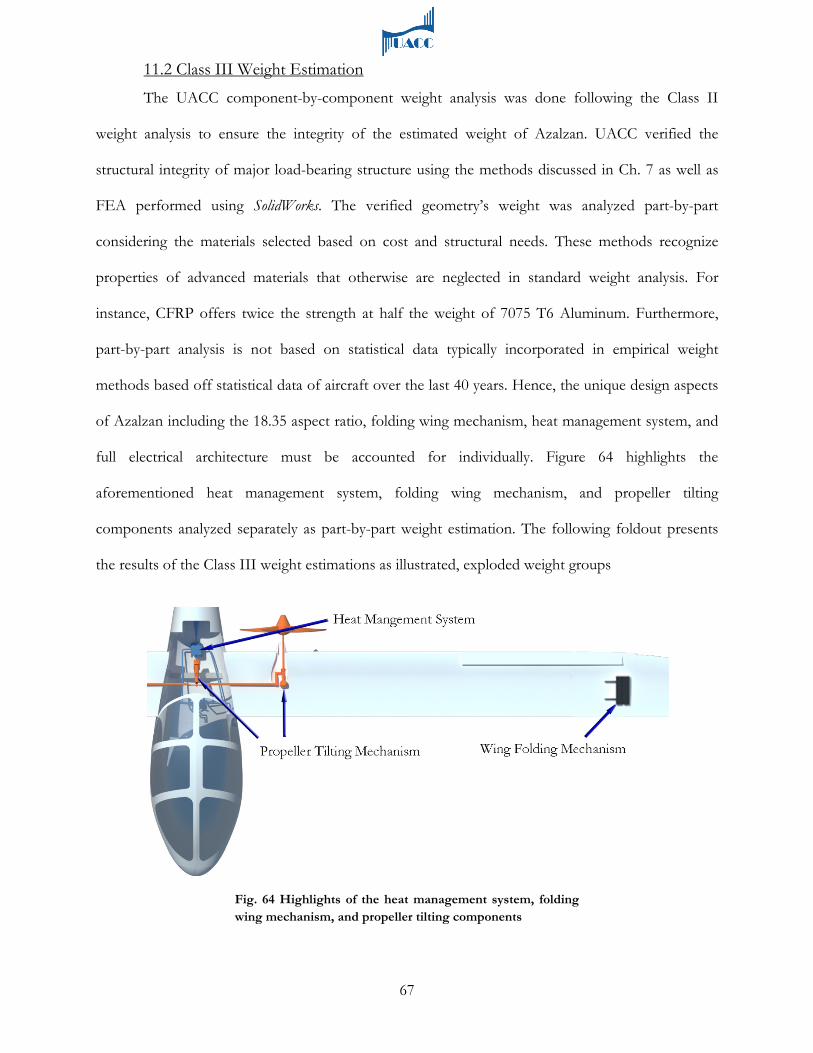
67
11.2 Class III Weight Estimation
The UACC component-by-component weight analysis was done following the Class II
weight analysis to ensure the integrity of the estimated weight of Azalzan. UACC verified the
structural integrity of major load-bearing structure using the methods discussed in Ch. 7 as well as
FEA performed using SolidWorks. The verified geometry’s weight was analyzed part-by-part
considering the materials selected based on cost and structural needs. These methods recognize
properties of advanced materials that otherwise are neglected in standard weight analysis. For
instance, CFRP offers twice the strength at half the weight of 7075 T6 Aluminum. Furthermore,
part-by-part analysis is not based on statistical data typically incorporated in empirical weight
methods based off statistical data of aircraft over the last 40 years. Hence, the unique design aspects
of Azalzan including the 18.35 aspect ratio, folding wing mechanism, heat management system, and
full electrical architecture must be accounted for individually. Figure 64 highlights the
aforementioned heat management system, folding wing mechanism, and propeller tilting
components analyzed separately as part-by-part weight estimation. The following foldout presents
the results of the Class III weight estimations as illustrated, exploded weight groups
Fig. 64 Highlights of the heat management system, folding wing mechanism, and propeller tilting components

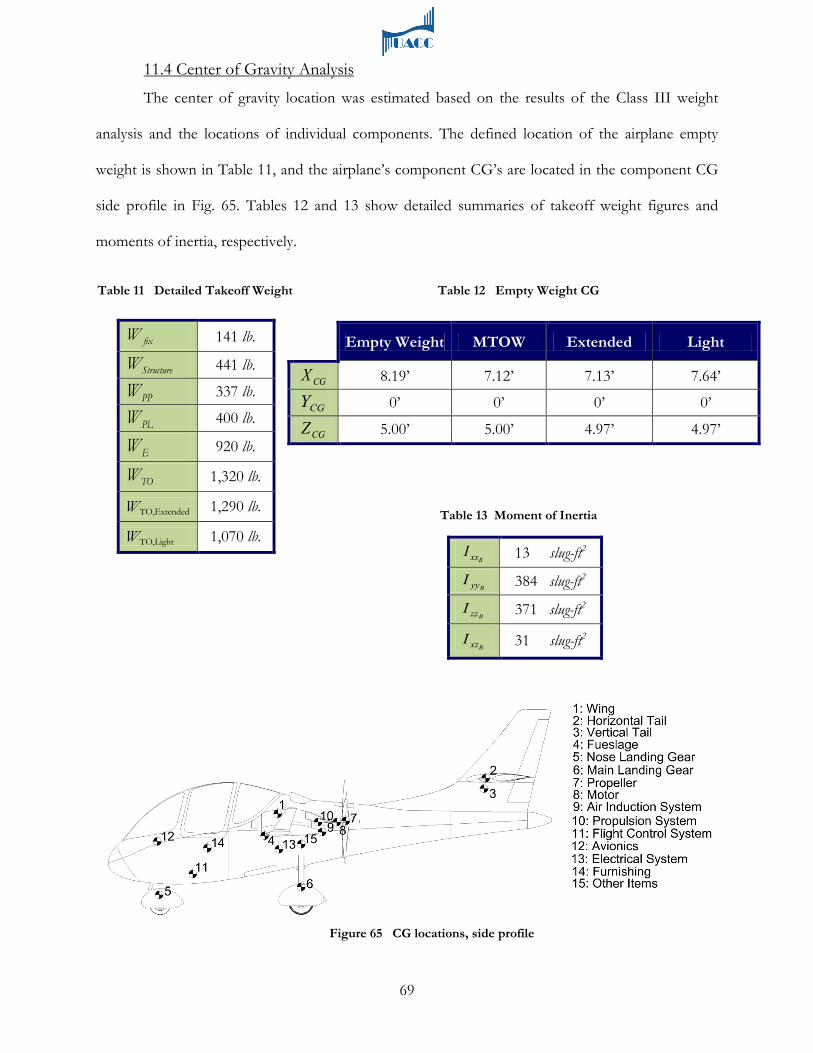
69
11.4 Center of Gravity Analysis
The center of gravity location was estimated based on the results of the Class III weight
analysis and the locations of individual components. The defined location of the airplane empty
weight is shown in Table 11, and the airplane’s component CG’s are located in the component CG
side profile in Fig. 65. Tables 12 and 13 show detailed summaries of takeoff weight figures and
moments of inertia, respectively.
fixW 141 lb.
StructureW 441 lb.
PPW 337 lb.
PLW 400 lb.
EW 920 lb.
TOW 1,320 lb.
WTO,Extended 1,290 lb.
WTO,Light 1,070 lb.
Empty Weight MTOW Extended Light
CGX 8.19’ 7.12’ 7.13’ 7.64’
CGY 0’ 0’ 0’ 0’
CGZ 5.00’ 5.00’ 4.97’ 4.97’
13 slug-ft2
ByyI 384 slug-ft2
BzzI 371 slug-ft2
BxzI 31 slug-ft2
BxxI
Table 12 Empty Weight CG
Table 13 Moment of Inertia
Table 11 Detailed Takeoff Weight
Figure 65 CG locations, side profile

71
UACC concluded that a longitudinal wing apex of 72” will provide sufficient positive static
margin at forward and aft locations of the CG, therefore ensuring the maintenance of the static
stability of the aircraft under all loading conditions.
12.3 Tail Sizing and Trim Diagram
The empennage of Azalzan was sized to satisfy basic stability and control requirements set
by MIL-F-878554 and recommended by Roskam55
αmC
as well as being able to initiate the takeoff rotation.
MIL-F-8785 recommends that in order to maintain static longitudinal stability, the air vehicle must
possess negative values of and αmC at all flight conditions. A horizontal tail area of 42.2 ft.2 ,
capable of maintaining a αmC and
αmC of at least -0.2 rad-1 , was selected by performing a parametric
study that varied the area of a generic horizontal tail planform and then computed the
corresponding αmC and
αmC using methods presented by Roskam56
. A trim diagram was generated
assuming it is equipped with an elevator capable of deflecting ± 20° in order to verify the capacity of
the airplane to maintain trim at all loading conditions. This trim diagram can be seen in Fig. 67.
12.4 Stability & Control Derivatives
MIL-F-878557 requires that every aircraft should have a neutral point located behind the
most aft center of gravity in order to maintain static longitudinal stability in all flight conditions. The
location of the aircraft’s neutral point was determined using the method presented by Roskam58. A
selection of the results with the load case of two 170 lb. passengers and 60 lb. of cargo is presented
in Table 14. As it can be seen from this table, the magnitude of the static margin is always positive
Fig. 67 Trim diagram with current cruise condition

72
indicating that the location of the center of gravity is always ahead of the aerodynamic center of the
aircraft in all critical flight segments.
In order for the aircraft to remain statically stable, the pitching moment coefficient due to
the angle of attack (αmC ), and pitching moment coefficient due to angle of attack rate derivative
(αmC ) both should be negative. In order to verify the lateral and directional static stability of the
aircraft, yawing-moment coefficient-due-to-sideslip derivatives (βnC ), and rolling-moment-
coefficient-due-to-sideslip derivatives (βlC ) were computed. As Roskam suggests, to maintain lateral
and direction static stability, βnC , should be positive while
βlC should have a negative value. These
derivatives were computed using methods presented by Roskam76 and can be seen in Table 15.
Segment Takeoff Cruise Landing
cgx 0.2165 0.2165 0.2165
acx 0.7002 0.6603 0.71
SMfree 49.74% 38% 51.03%
Segment Takeoff Cruise Landing
αmC [rad-1] -3.80 -3.09 -3.80
αmC
[rad-1] -8.42 -7.08 -8.48
βnC [rad-1] 0.0264 0.0238 0.0255
βlC [rad-1] -0.0434 -0.0554 -0.0362
Table 15. Important longitudinal and lateral-directional static stability derivatives
Table 14. Location of CG, aerodynamic center, and corresponding free stick static margin at takeoff, cruise, and landing conditions
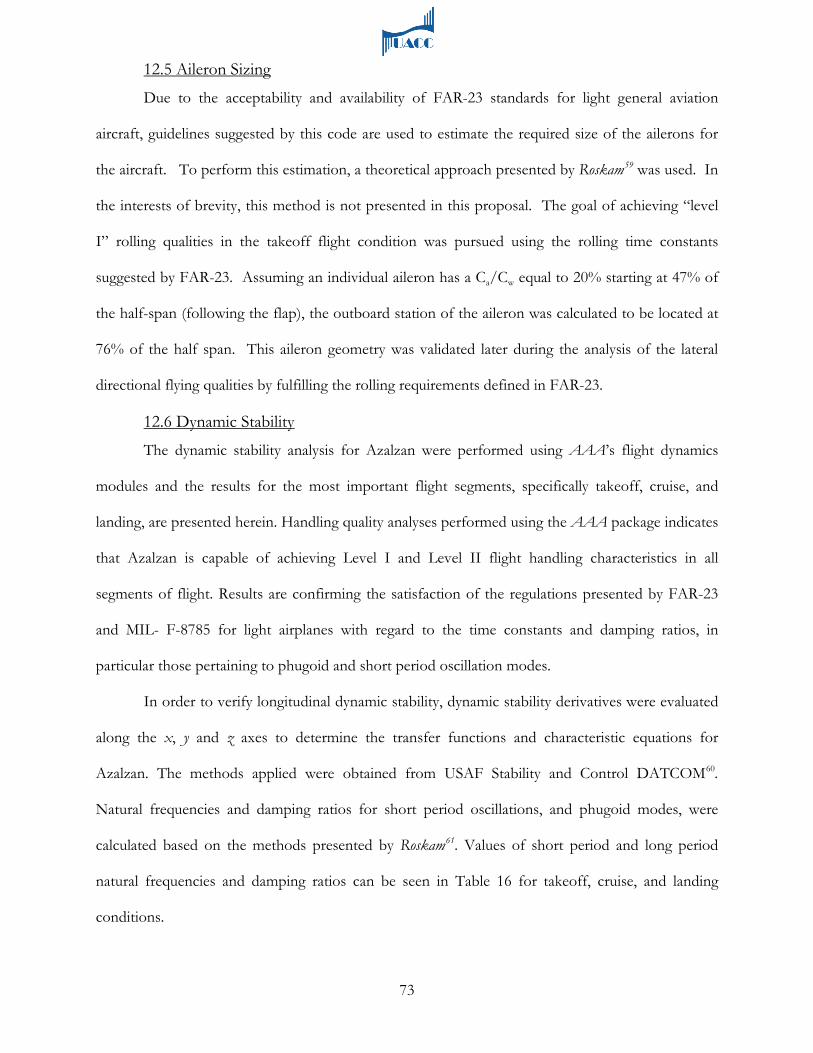
73
12.5 Aileron Sizing
Due to the acceptability and availability of FAR-23 standards for light general aviation
aircraft, guidelines suggested by this code are used to estimate the required size of the ailerons for
the aircraft. To perform this estimation, a theoretical approach presented by Roskam59
12.6 Dynamic Stability
was used. In
the interests of brevity, this method is not presented in this proposal. The goal of achieving “level
I” rolling qualities in the takeoff flight condition was pursued using the rolling time constants
suggested by FAR-23. Assuming an individual aileron has a Ca/Cw equal to 20% starting at 47% of
the half-span (following the flap), the outboard station of the aileron was calculated to be located at
76% of the half span. This aileron geometry was validated later during the analysis of the lateral
directional flying qualities by fulfilling the rolling requirements defined in FAR-23.
The dynamic stability analysis for Azalzan were performed using AAA’s flight dynamics
modules and the results for the most important flight segments, specifically takeoff, cruise, and
landing, are presented herein. Handling quality analyses performed using the AAA package indicates
that Azalzan is capable of achieving Level I and Level II flight handling characteristics in all
segments of flight. Results are confirming the satisfaction of the regulations presented by FAR-23
and MIL- F-8785 for light airplanes with regard to the time constants and damping ratios, in
particular those pertaining to phugoid and short period oscillation modes.
In order to verify longitudinal dynamic stability, dynamic stability derivatives were evaluated
along the x, y and z axes to determine the transfer functions and characteristic equations for
Azalzan. The methods applied were obtained from USAF Stability and Control DATCOM60.
Natural frequencies and damping ratios for short period oscillations, and phugoid modes, were
calculated based on the methods presented by Roskam61
. Values of short period and long period
natural frequencies and damping ratios can be seen in Table 16 for takeoff, cruise, and landing
conditions.
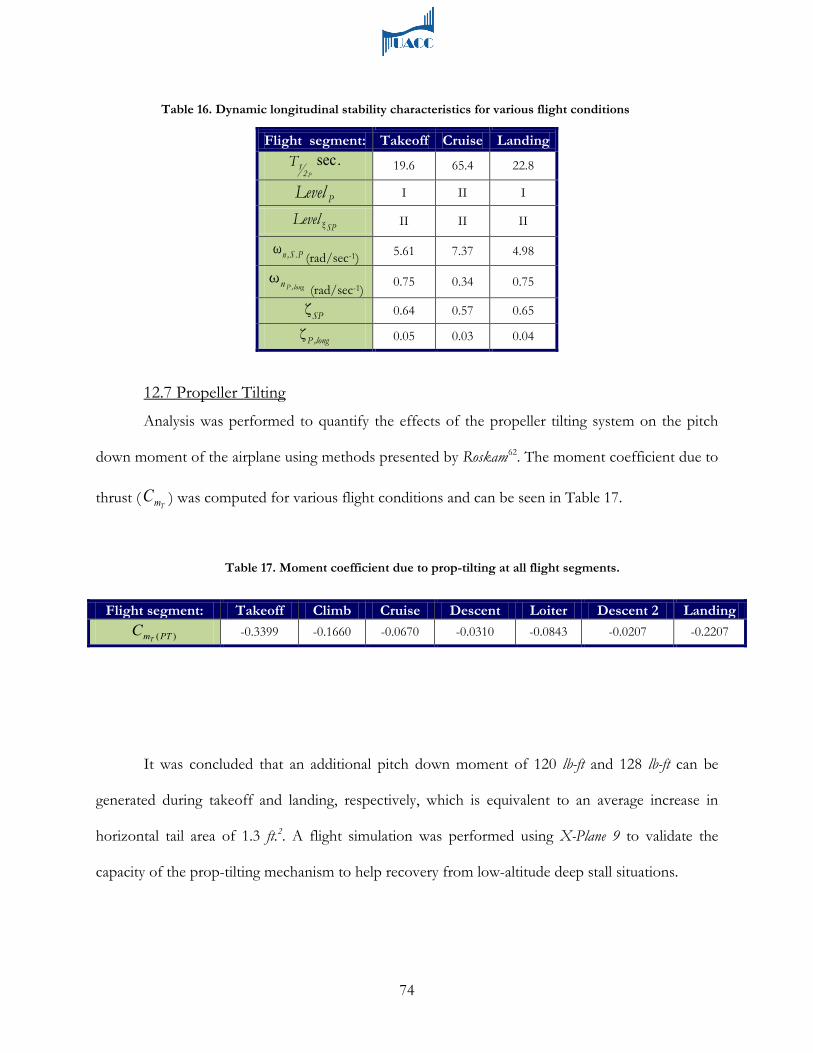
74
12.7 Propeller Tilting
Analysis was performed to quantify the effects of the propeller tilting system on the pitch
down moment of the airplane using methods presented by Roskam62
TmC
. The moment coefficient due to
thrust ( ) was computed for various flight conditions and can be seen in Table 17.
It was concluded that an additional pitch down moment of 120 lb-ft and 128 lb-ft can be
generated during takeoff and landing, respectively, which is equivalent to an average increase in
horizontal tail area of 1.3 ft.2. A flight simulation was performed using X-Plane 9 to validate the
capacity of the prop-tilting mechanism to help recovery from low-altitude deep stall situations.
Flight segment: Takeoff Cruise Landing
P21T .sec 19.6 65.4 22.8
PLevel I II I
SPLevel ξ II II II
P.S,nω(rad/sec-1) 5.61 7.37 4.98
long,Pnω(rad/sec-1)
0.75 0.34 0.75
SPζ 0.64 0.57 0.65
long,Pζ 0.05 0.03 0.04
Flight segment: Takeoff Climb Cruise Descent Loiter Descent 2 Landing )(PTmT
C -0.3399 -0.1660 -0.0670 -0.0310 -0.0843 -0.0207 -0.2207
Table 16. Dynamic longitudinal stability characteristics for various flight conditions
Table 17. Moment coefficient due to prop-tilting at all flight segments.
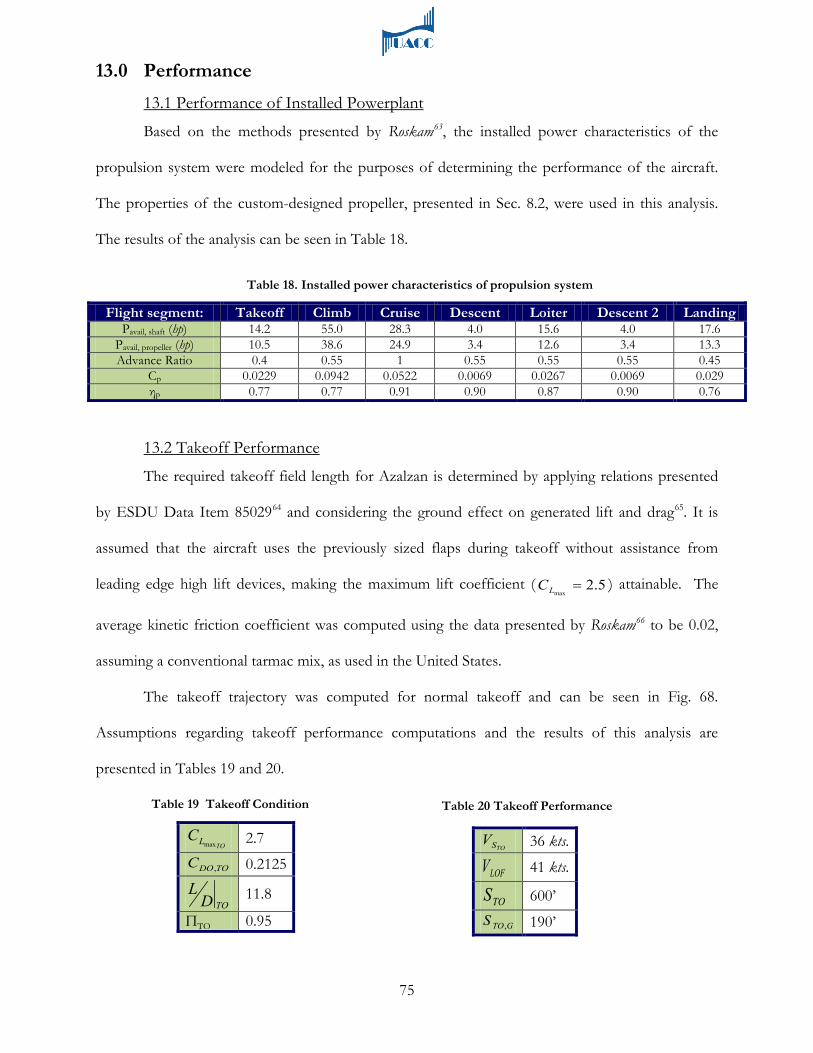
75
13.0 Performance 13.1 Performance of Installed Powerplant
Based on the methods presented by Roskam63
, the installed power characteristics of the
propulsion system were modeled for the purposes of determining the performance of the aircraft.
The properties of the custom-designed propeller, presented in Sec. 8.2, were used in this analysis.
The results of the analysis can be seen in Table 18.
13.2 Takeoff Performance
The required takeoff field length for Azalzan is determined by applying relations presented
by ESDU Data Item 8502964 and considering the ground effect on generated lift and drag65
5.2max
=LC
. It is
assumed that the aircraft uses the previously sized flaps during takeoff without assistance from
leading edge high lift devices, making the maximum lift coefficient ( ) attainable. The
average kinetic friction coefficient was computed using the data presented by Roskam66
The takeoff trajectory was computed for normal takeoff and can be seen in Fig. 68.
Assumptions regarding takeoff performance computations and the results of this analysis are
presented in Tables 19 and 20.
to be 0.02,
assuming a conventional tarmac mix, as used in the United States.
Flight segment: Takeoff Climb Cruise Descent Loiter Descent 2 Landing Pavail, shaft (hp)
14.2 55.0 28.3 4.0 15.6 4.0 17.6
Pavail, propeller (hp) 10.5 38.6 24.9 3.4 12.6 3.4 13.3 Advance Ratio 0.4 0.55 1 0.55 0.55 0.55 0.45
Cp 0.0229 0.0942 0.0522 0.0069 0.0267 0.0069 0.029 ηp 0.77 0.77 0.91 0.90 0.87 0.90 0.76
TOLCmax
2.7
TODOC , 0.2125
TODL 11.8
ΠTO 0.95
TOSV 36 kts.
LOFV 41 kts.
TOS 600’
GTOS , 190’
Table 19 Takeoff Condition Table 20 Takeoff Performance
Table 18. Installed power characteristics of propulsion system

76
Fig. 68 Takeoff trajectory
13.3 Climb Performance
In order to calculate the maximum rate of climb for Azalzan, and in general, the climb
performance of the aircraft relations presented by Roskam67
were used. The rate of climb was plotted
versus velocity to capture the performance of the aircraft in climb at various altitudes. This graph is
shown in Fig. 69. Analyses were performed in order to determine the time required to climb from
sea level to 9,500’ based on the mission profile presented by the RFP. The results and assumptions
for this analysis are presented in Table 21.
13.4 Maximum Cruise Speed
An analysis was performed of the required and available power at cruise for Azalzan. From
this analysis it was determined that the maximum possible cruise speed at 9,500’ is 151 kts. At this
velocity, the required power to overcome drag equals the maximum power of the motor. However,
the flutter characteristics, presented in Sec. 7.5, and the structural design of Azalzan dictate that the
aircraft may not exceed 147 kts. This requires an electronic de-rating system to be installed on
Azalzan, which would impose a nominal rating of 75% on the maximum power available of the
electric motor at cruise.
Δh
9,500’
Α
0.56°
R/C
625 fpm
CGR
0.1
PSpExPwr 743 fpm
t(1→3) 15.2 min.
Table 21 Results of climb performance
Fig. 69 Climb performance
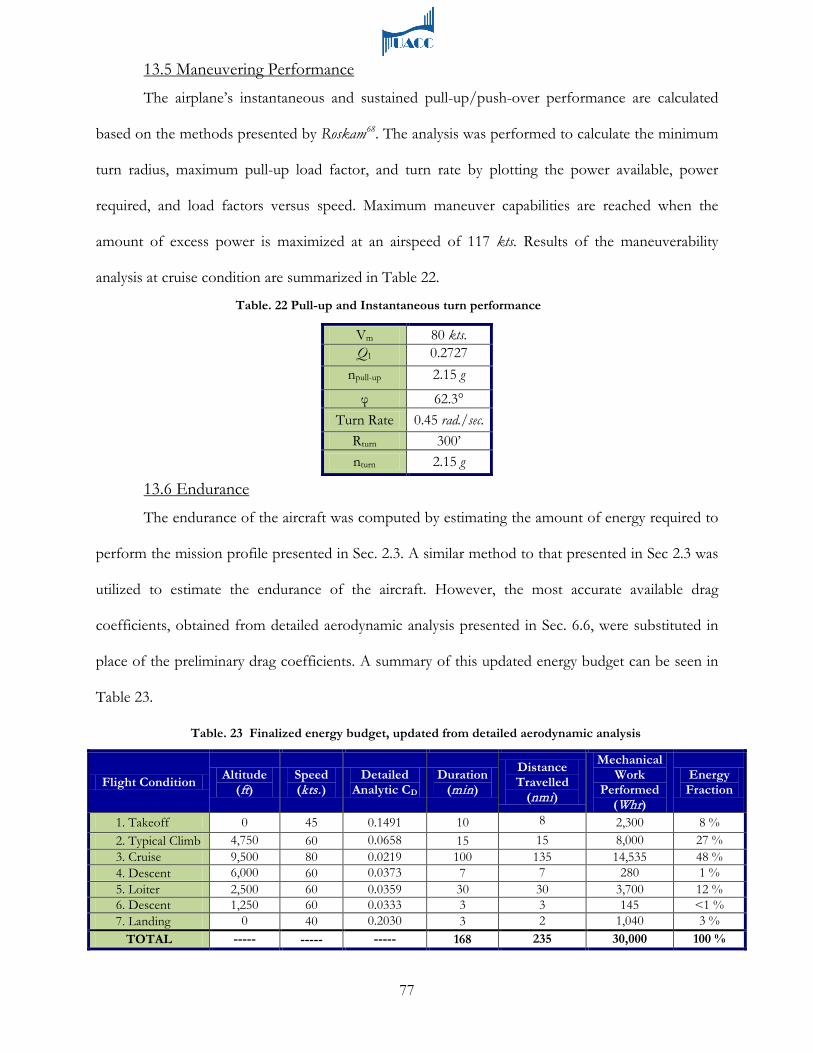
77
13.5 Maneuvering Performance
The airplane’s instantaneous and sustained pull-up/push-over performance are calculated
based on the methods presented by Roskam68
. The analysis was performed to calculate the minimum
turn radius, maximum pull-up load factor, and turn rate by plotting the power available, power
required, and load factors versus speed. Maximum maneuver capabilities are reached when the
amount of excess power is maximized at an airspeed of 117 kts. Results of the maneuverability
analysis at cruise condition are summarized in Table 22.
13.6 Endurance
The endurance of the aircraft was computed by estimating the amount of energy required to
perform the mission profile presented in Sec. 2.3. A similar method to that presented in Sec 2.3 was
utilized to estimate the endurance of the aircraft. However, the most accurate available drag
coefficients, obtained from detailed aerodynamic analysis presented in Sec. 6.6, were substituted in
place of the preliminary drag coefficients. A summary of this updated energy budget can be seen in
Table 23.
Vm 80 kts.
Q1 0.2727
npull-up
2.15 g
φ
62.3° Turn Rate
0.45 rad./sec.
Rturn
300’ nturn 2.15 g
Flight Condition Altitude (ft)
Speed (kts.)
Detailed Analytic CD
Duration (min)
Distance Travelled
(nmi)
Mechanical Work
Performed (Whr)
Energy Fraction
1. Takeoff 0 45 0.1491 10 8 2,300 8 % 2. Typical Climb 4,750 60 0.0658 15 15 8,000 27 % 3. Cruise 9,500 80 0.0219 100 135 14,535 48 % 4. Descent 6,000 60 0.0373 7 7 280 1 % 5. Loiter 2,500 60 0.0359 30 30 3,700 12 % 6. Descent 1,250 60 0.0333 3 3 145 <1 % 7. Landing 0 40 0.2030 3 2 1,040 3 %
TOTAL ----- ----- ----- 168 235 30,000 100 %
Table. 23 Finalized energy budget, updated from detailed aerodynamic analysis
Table. 22 Pull-up and Instantaneous turn performance
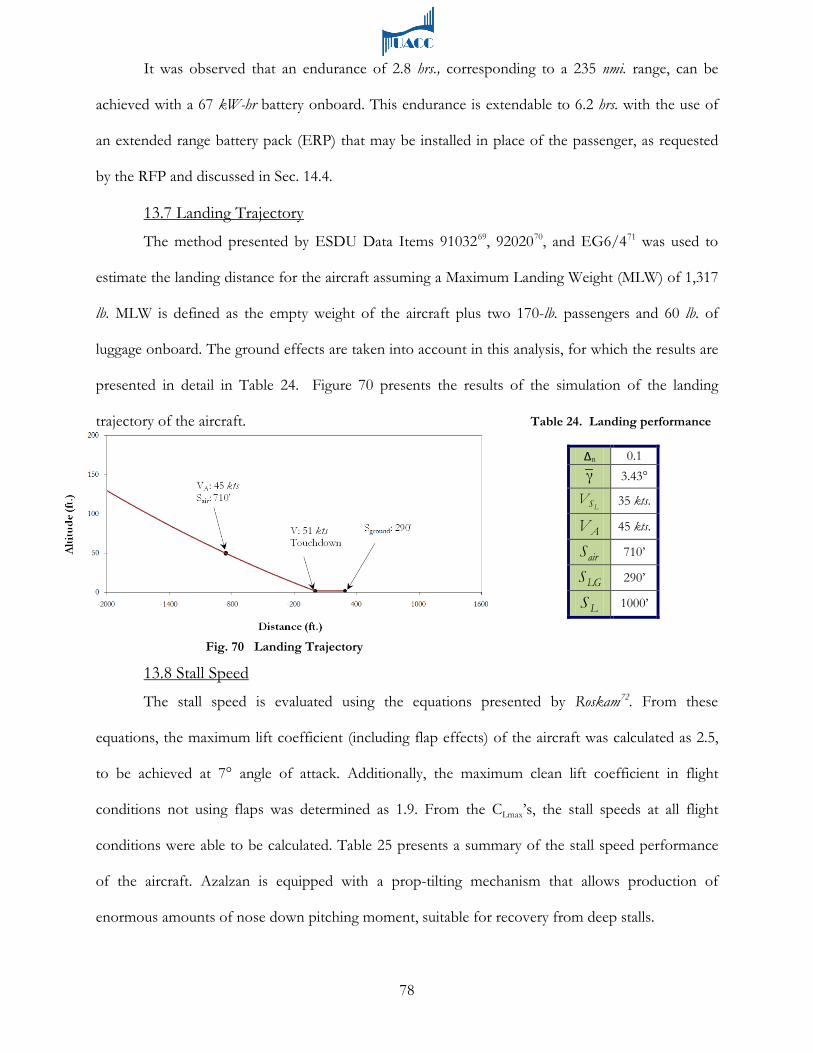
78
It was observed that an endurance of 2.8 hrs., corresponding to a 235 nmi. range, can be
achieved with a 67 kW-hr battery onboard. This endurance is extendable to 6.2 hrs. with the use of
an extended range battery pack (ERP) that may be installed in place of the passenger, as requested
by the RFP and discussed in Sec. 14.4.
13.7 Landing Trajectory
The method presented by ESDU Data Items 9103269, 9202070, and EG6/471
was used to
estimate the landing distance for the aircraft assuming a Maximum Landing Weight (MLW) of 1,317
lb. MLW is defined as the empty weight of the aircraft plus two 170-lb. passengers and 60 lb. of
luggage onboard. The ground effects are taken into account in this analysis, for which the results are
presented in detail in Table 24. Figure 70 presents the results of the simulation of the landing
trajectory of the aircraft.
13.8 Stall Speed
The stall speed is evaluated using the equations presented by Roskam72
. From these
equations, the maximum lift coefficient (including flap effects) of the aircraft was calculated as 2.5,
to be achieved at 7° angle of attack. Additionally, the maximum clean lift coefficient in flight
conditions not using flaps was determined as 1.9. From the CLmax’s, the stall speeds at all flight
conditions were able to be calculated. Table 25 presents a summary of the stall speed performance
of the aircraft. Azalzan is equipped with a prop-tilting mechanism that allows production of
enormous amounts of nose down pitching moment, suitable for recovery from deep stalls.
Δn 0.1 γ 3.43°
LSV 35 kts.
AV 45 kts.
airS 710’
LGS 290’
LS 1000’
Fig. 70 Landing Trajectory
Table 24. Landing performance

79
13.9 Noise Assessment
Cabin noise is of crucial interest in determining user comfort level. Post analysis evaluation
of readily calculable factors contributing to overall cabin noise level yields the conclusion that the
most significant factor in the noise level is the propeller noise. All other noise is at least an order of
magnitude smaller by comparison, and under logarithmic addition, will give a small increase on top
of the noise level given by the propeller.
The noise level of the propeller measured in-cabin must then be calculated. Using a purely
empirical method developed by Marte et al.73
Constructing the windshield with a sound attenuating glass epoxy of approximately 6mm
thickness results in an average of 31 dB attenuation across most of the audible frequency range. This
results in an effective sound level of approximately 107 dB. This estimate is said to be accurate to -5
to +9 dB and is substantially quieter than present day SLSAs. This noise level is very similar to the
noise levels experienced by commercial jetliner passengers.
, the noise due to the propeller (without intervening
material such as a windshield) at cruise is computed to be approximately 138 dB.
Based on a set of simulated measurements taken at these locations (taking both distance and
angle of inclination with respect to prop axis during the three critical regimes), the maximum
relevant dB levels were calculated at takeoff, approach, and sideline, as presented in Table 26.
Flight segment: Takeoff Climb Cruise Descent Loiter Descent Landing VS [kts.]
35 38 54 51 48 47 35
Takeoff Approach Sideline Max dB level 29 dB 44 dB 33 dB
Table 25. Stall speeds
Table 26. Summary of Noise results
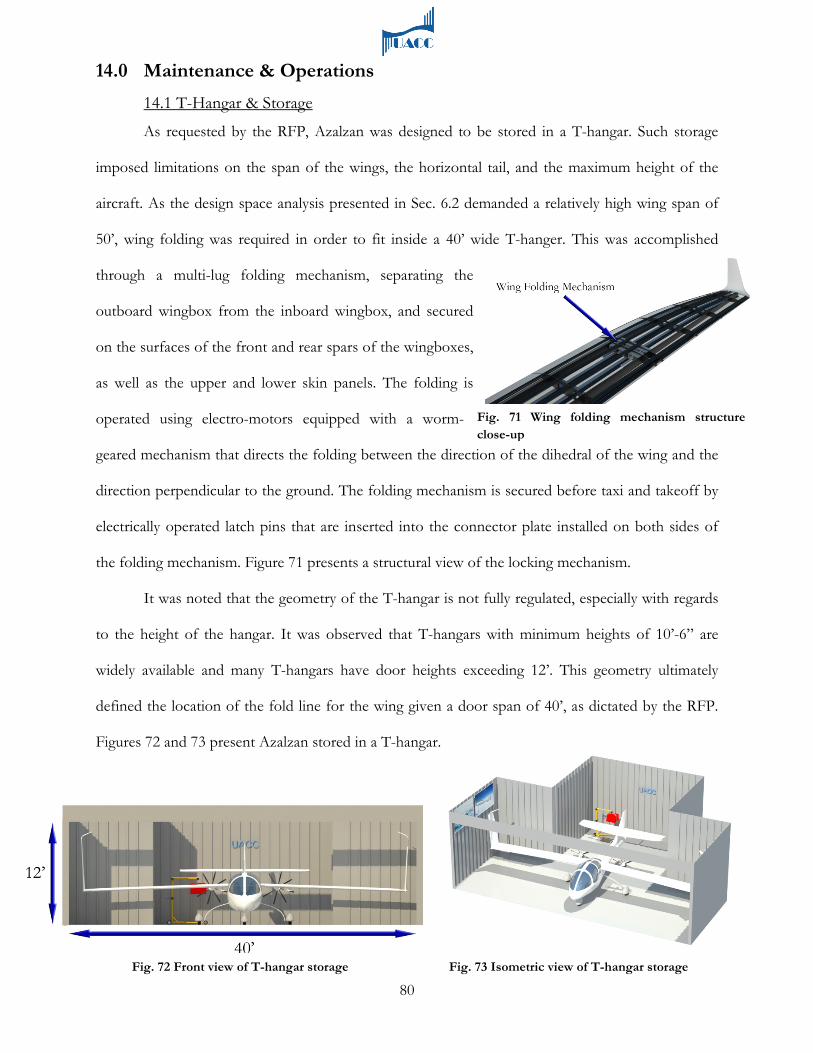
80
14.0 Maintenance & Operations 14.1 T-Hangar & Storage
As requested by the RFP, Azalzan was designed to be stored in a T-hangar. Such storage
imposed limitations on the span of the wings, the horizontal tail, and the maximum height of the
aircraft. As the design space analysis presented in Sec. 6.2 demanded a relatively high wing span of
50’, wing folding was required in order to fit inside a 40’ wide T-hanger. This was accomplished
through a multi-lug folding mechanism, separating the
outboard wingbox from the inboard wingbox, and secured
on the surfaces of the front and rear spars of the wingboxes,
as well as the upper and lower skin panels. The folding is
operated using electro-motors equipped with a worm-
geared mechanism that directs the folding between the direction of the dihedral of the wing and the
direction perpendicular to the ground. The folding mechanism is secured before taxi and takeoff by
electrically operated latch pins that are inserted into the connector plate installed on both sides of
the folding mechanism. Figure 71 presents a structural view of the locking mechanism.
It was noted that the geometry of the T-hangar is not fully regulated, especially with regards
to the height of the hangar. It was observed that T-hangars with minimum heights of 10’-6” are
widely available and many T-hangars have door heights exceeding 12’. This geometry ultimately
defined the location of the fold line for the wing given a door span of 40’, as dictated by the RFP.
Figures 72 and 73 present Azalzan stored in a T-hangar.
Fig. 71 Wing folding mechanism structure close-up
Fig. 72 Front view of T-hangar storage Fig. 73 Isometric view of T-hangar storage

81
Fig. 74 Location of the onboard charger
14.2 Battery Recharging Performance
As mentioned in Sec. 9.1, Azalzan has an onboard battery charger for use during ground
operations. In order to minimize the charging time while maximizing the compatibility with the
current electrical grid, the SAE J1772 electrical
connector standard74
14.3 Battery Lifecycle & Replacement
was adopted in Azalzan. This
standard allows for a maximum charging power 19.2
kW when connected to a 240 VAC socket, which is
standard and widely available. This will result in a full
charge in 3.8 hrs. Figure 74 shows the onboard charger located in the mid fuselage.
As part of the product lifecycle evaluation of Azalzan, an estimation of the durability of the
battery was performed. For this purpose, UACC contacted a leading expert in the field of advanced
Li-air battery technology, Dr. Binod Kumar, regarding the maximum charge-discharge cycles and shelf
life of Li-air batteries. In private correspondence with Dr. Kumar, an estimated 500 charge cycles and
five year shelf life was determined to be achievable with this battery technology.
Even though lithium is corrosive and may be hazardous for the environment, the
manufacture and operation of Li-air batteries have proven to be both environmentally conscious and
safe for human use in a wide range of applications. Furthermore, the solid-state nature of Li-air
batteries makes them safe even when subject to punctures or other mechanical failures75. A means
for disposing the battery is necessary due to the use of lithium as the anode material of the battery.
However, given the wide use of lithium-ion and other types of lithium-based batteries, there is an
established infrastructure to take care of the batteries once their end-of-life is reached. It should be
noted that apart from regular verification of the correct functioning of the battery and its charge
level indicator, the Li-air battery does not required any scheduled maintenance throughout its
lifecycle.
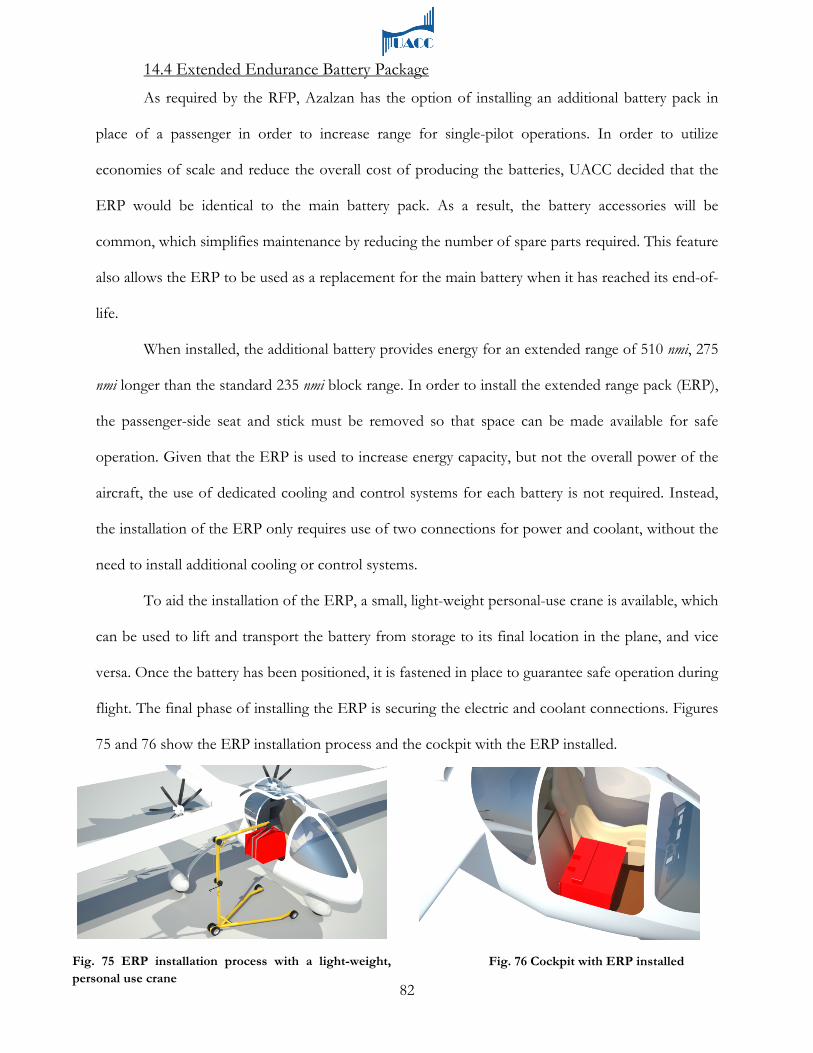
82
14.4 Extended Endurance Battery Package
As required by the RFP, Azalzan has the option of installing an additional battery pack in
place of a passenger in order to increase range for single-pilot operations. In order to utilize
economies of scale and reduce the overall cost of producing the batteries, UACC decided that the
ERP would be identical to the main battery pack. As a result, the battery accessories will be
common, which simplifies maintenance by reducing the number of spare parts required. This feature
also allows the ERP to be used as a replacement for the main battery when it has reached its end-of-
life.
When installed, the additional battery provides energy for an extended range of 510 nmi, 275
nmi longer than the standard 235 nmi block range. In order to install the extended range pack (ERP),
the passenger-side seat and stick must be removed so that space can be made available for safe
operation. Given that the ERP is used to increase energy capacity, but not the overall power of the
aircraft, the use of dedicated cooling and control systems for each battery is not required. Instead,
the installation of the ERP only requires use of two connections for power and coolant, without the
need to install additional cooling or control systems.
To aid the installation of the ERP, a small, light-weight personal-use crane is available, which
can be used to lift and transport the battery from storage to its final location in the plane, and vice
versa. Once the battery has been positioned, it is fastened in place to guarantee safe operation during
flight. The final phase of installing the ERP is securing the electric and coolant connections. Figures
75 and 76 show the ERP installation process and the cockpit with the ERP installed.
Fig. 75 ERP installation process with a light-weight, personal use crane
Fig. 76 Cockpit with ERP installed
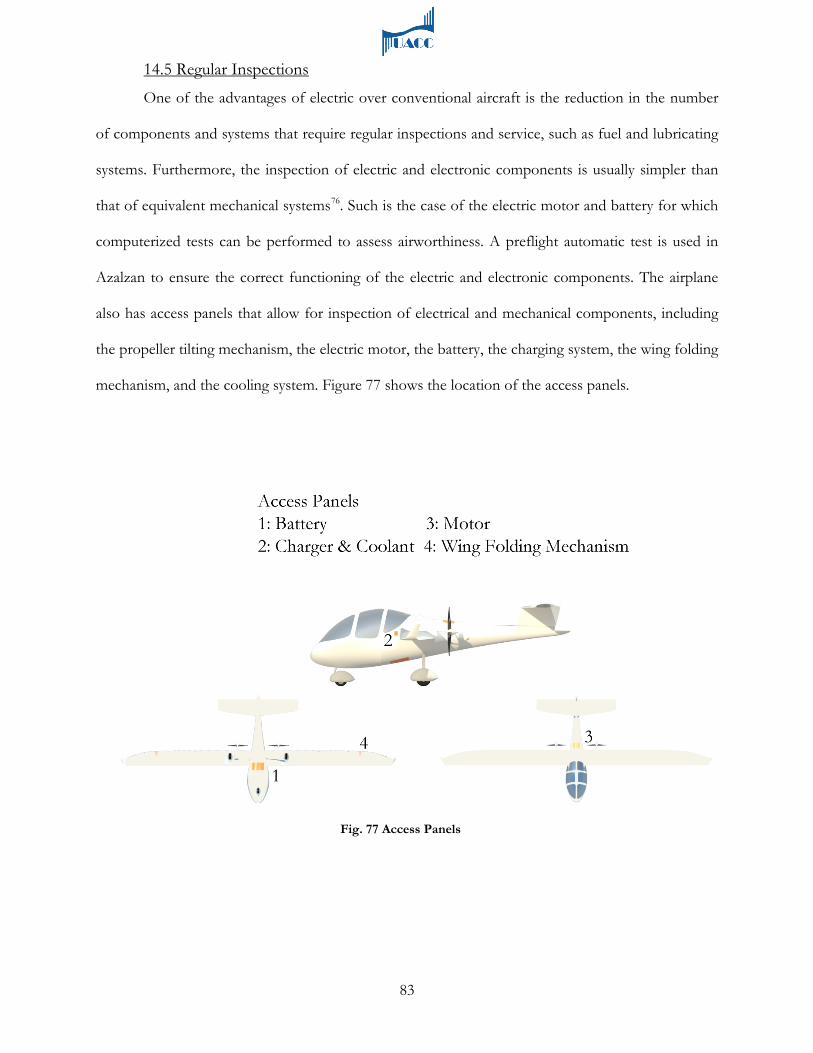
83
14.5 Regular Inspections
One of the advantages of electric over conventional aircraft is the reduction in the number
of components and systems that require regular inspections and service, such as fuel and lubricating
systems. Furthermore, the inspection of electric and electronic components is usually simpler than
that of equivalent mechanical systems76
. Such is the case of the electric motor and battery for which
computerized tests can be performed to assess airworthiness. A preflight automatic test is used in
Azalzan to ensure the correct functioning of the electric and electronic components. The airplane
also has access panels that allow for inspection of electrical and mechanical components, including
the propeller tilting mechanism, the electric motor, the battery, the charging system, the wing folding
mechanism, and the cooling system. Figure 77 shows the location of the access panels.
Fig. 77 Access Panels
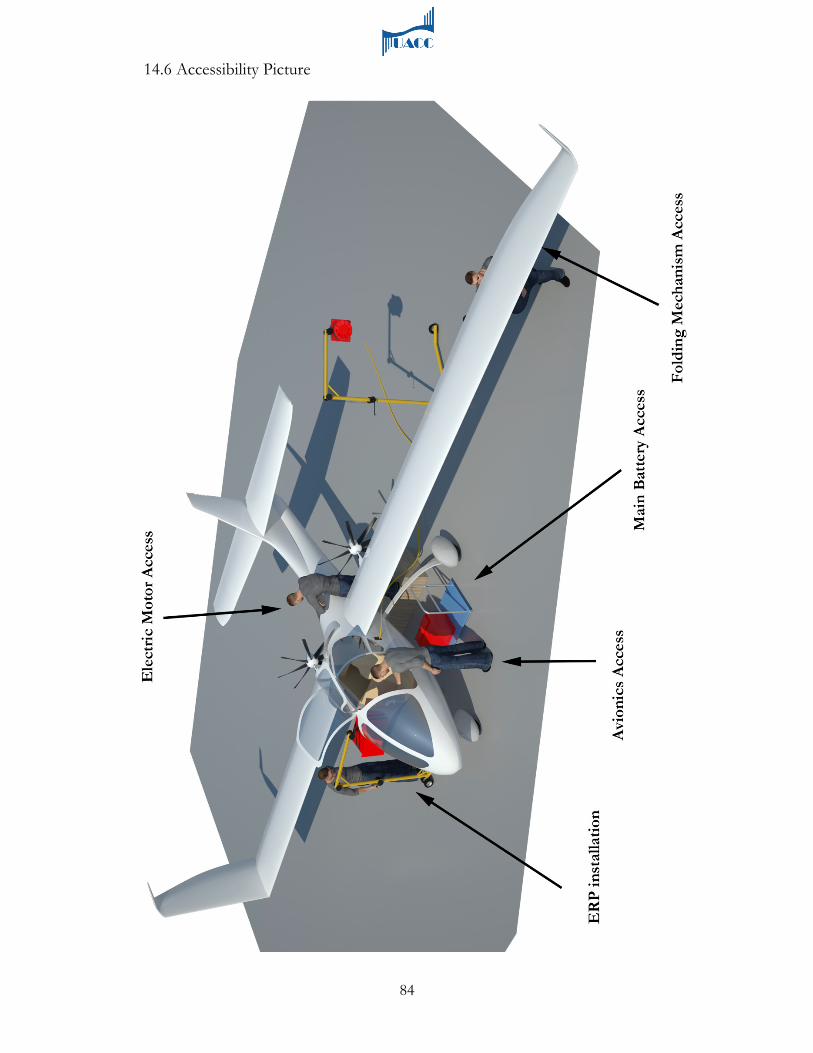
84
14.6 Accessibility Picture
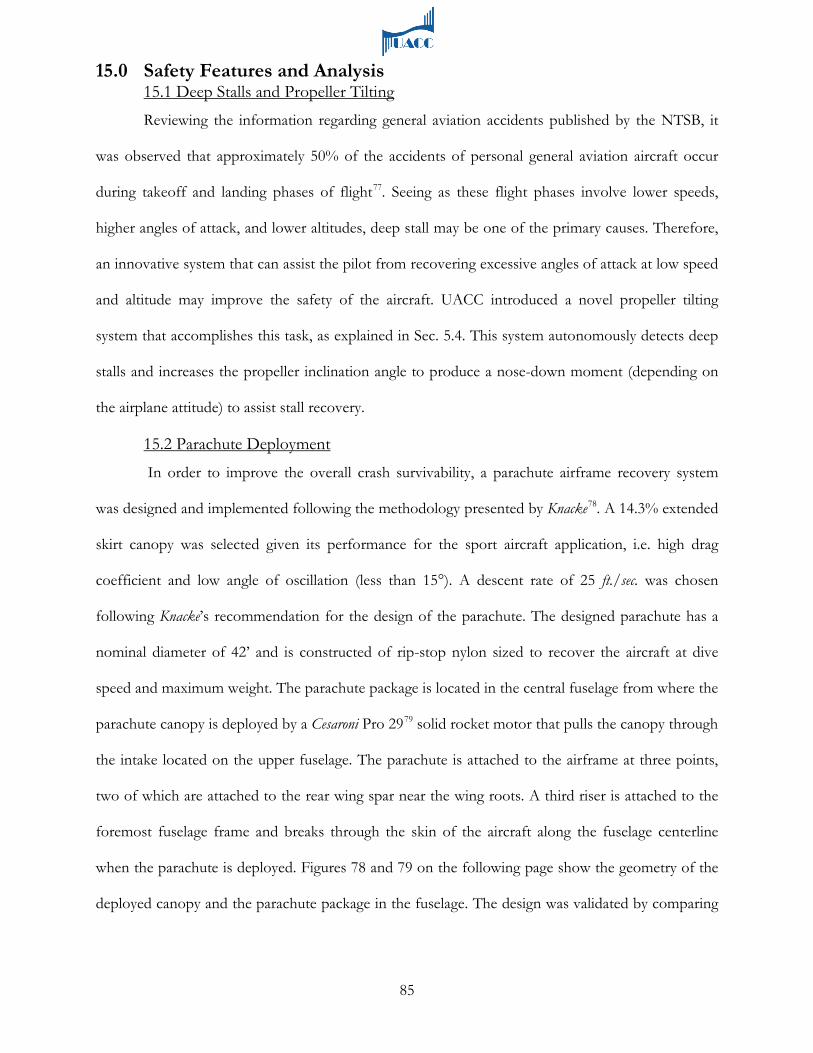
85
15.0 Safety Features and Analysis 15.1 Deep Stalls and Propeller Tilting
Reviewing the information regarding general aviation accidents published by the NTSB, it
was observed that approximately 50% of the accidents of personal general aviation aircraft occur
during takeoff and landing phases of flight77
15.2 Parachute Deployment
. Seeing as these flight phases involve lower speeds,
higher angles of attack, and lower altitudes, deep stall may be one of the primary causes. Therefore,
an innovative system that can assist the pilot from recovering excessive angles of attack at low speed
and altitude may improve the safety of the aircraft. UACC introduced a novel propeller tilting
system that accomplishes this task, as explained in Sec. 5.4. This system autonomously detects deep
stalls and increases the propeller inclination angle to produce a nose-down moment (depending on
the airplane attitude) to assist stall recovery.
In order to improve the overall crash survivability, a parachute airframe recovery system
was designed and implemented following the methodology presented by Knacke78. A 14.3% extended
skirt canopy was selected given its performance for the sport aircraft application, i.e. high drag
coefficient and low angle of oscillation (less than 15°). A descent rate of 25 ft./sec. was chosen
following Knacke’s recommendation for the design of the parachute. The designed parachute has a
nominal diameter of 42’ and is constructed of rip-stop nylon sized to recover the aircraft at dive
speed and maximum weight. The parachute package is located in the central fuselage from where the
parachute canopy is deployed by a Cesaroni Pro 2979 solid rocket motor that pulls the canopy through
the intake located on the upper fuselage. The parachute is attached to the airframe at three points,
two of which are attached to the rear wing spar near the wing roots. A third riser is attached to the
foremost fuselage frame and breaks through the skin of the aircraft along the fuselage centerline
when the parachute is deployed. Figures 78 and 79 on the following page show the geometry of the
deployed canopy and the parachute package in the fuselage. The design was validated by comparing
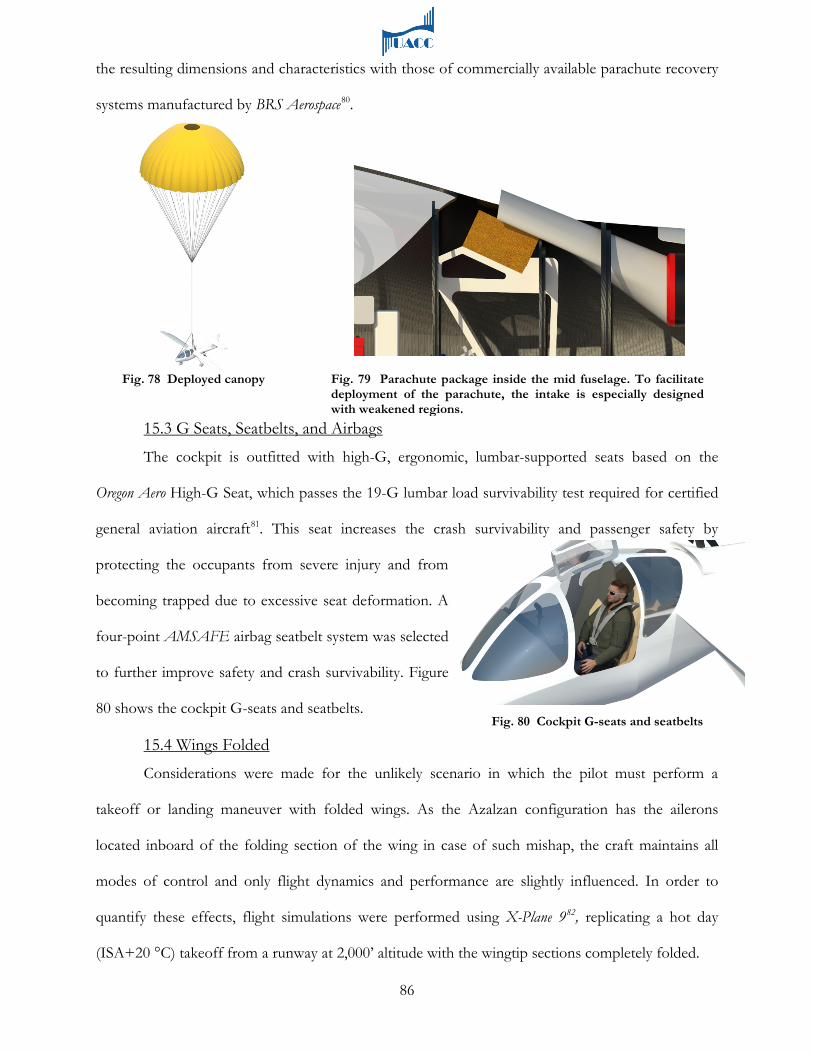
86
the resulting dimensions and characteristics with those of commercially available parachute recovery
systems manufactured by BRS Aerospace80
.
15.3 G Seats, Seatbelts, and Airbags
The cockpit is outfitted with high-G, ergonomic, lumbar-supported seats based on the
Oregon Aero High-G Seat, which passes the 19-G lumbar load survivability test required for certified
general aviation aircraft81
15.4 Wings Folded
. This seat increases the crash survivability and passenger safety by
protecting the occupants from severe injury and from
becoming trapped due to excessive seat deformation. A
four-point AMSAFE airbag seatbelt system was selected
to further improve safety and crash survivability. Figure
80 shows the cockpit G-seats and seatbelts.
Considerations were made for the unlikely scenario in which the pilot must perform a
takeoff or landing maneuver with folded wings. As the Azalzan configuration has the ailerons
located inboard of the folding section of the wing in case of such mishap, the craft maintains all
modes of control and only flight dynamics and performance are slightly influenced. In order to
quantify these effects, flight simulations were performed using X-Plane 982, replicating a hot day
(ISA+20 °C) takeoff from a runway at 2,000’ altitude with the wingtip sections completely folded.
Fig. 79 Parachute package inside the mid fuselage. To facilitate deployment of the parachute, the intake is especially designed with weakened regions.
Fig. 80 Cockpit G-seats and seatbelts
Fig. 78 Deployed canopy
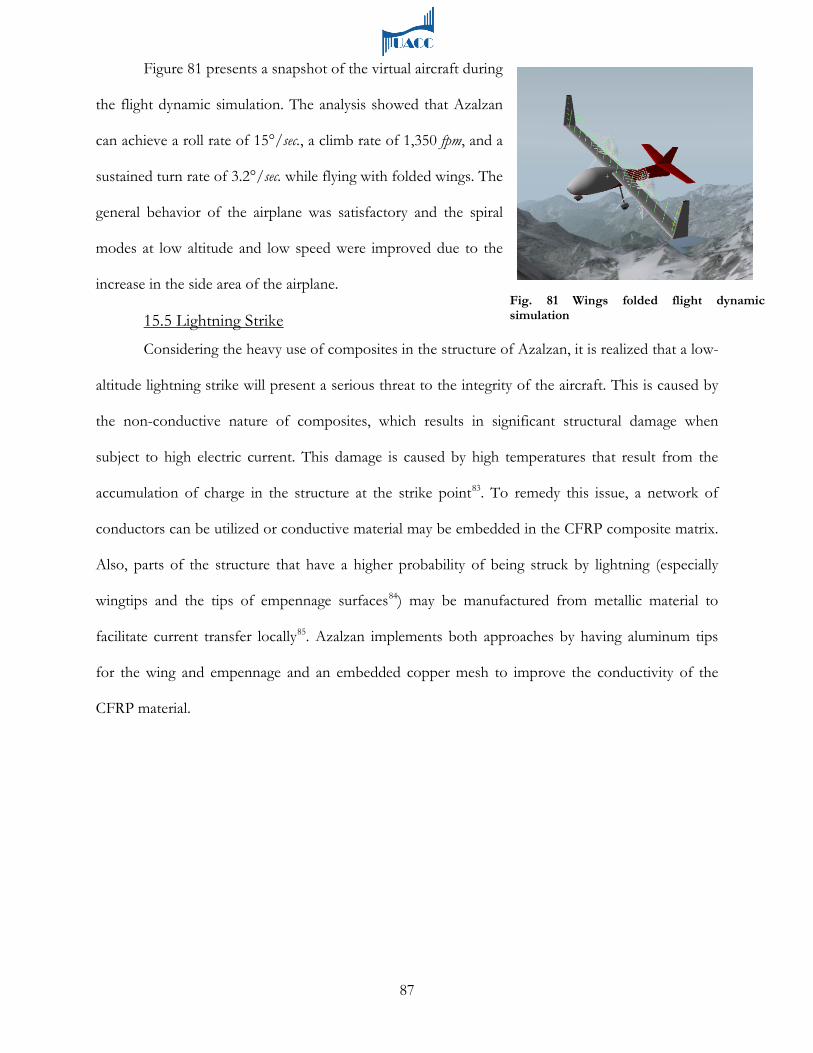
87
Figure 81 presents a snapshot of the virtual aircraft during
the flight dynamic simulation. The analysis showed that Azalzan
can achieve a roll rate of 15°/sec., a climb rate of 1,350 fpm, and a
sustained turn rate of 3.2°/sec. while flying with folded wings. The
general behavior of the airplane was satisfactory and the spiral
modes at low altitude and low speed were improved due to the
increase in the side area of the airplane.
15.5 Lightning Strike
Considering the heavy use of composites in the structure of Azalzan, it is realized that a low-
altitude lightning strike will present a serious threat to the integrity of the aircraft. This is caused by
the non-conductive nature of composites, which results in significant structural damage when
subject to high electric current. This damage is caused by high temperatures that result from the
accumulation of charge in the structure at the strike point83. To remedy this issue, a network of
conductors can be utilized or conductive material may be embedded in the CFRP composite matrix.
Also, parts of the structure that have a higher probability of being struck by lightning (especially
wingtips and the tips of empennage surfaces84) may be manufactured from metallic material to
facilitate current transfer locally85
. Azalzan implements both approaches by having aluminum tips
for the wing and empennage and an embedded copper mesh to improve the conductivity of the
CFRP material.
Fig. 81 Wings folded flight dynamic simulation

88
Fig. 82 Results of number of LSAs and pilots forecasted from 2005-2031
16.0 Cost & Risk Analysis 16.1 Market Forecast
The LSA category was introduced by the FAA in 2004 with the implementation of Rule 69
FR 4477286. Since then, over 7,000 aircraft and 120,000 pilots have been registered or certified in the
US in the LSA category. The FAA forecasts an average long-term annual growth of 3.3% in the LSA
fleet in the US and 6.1% in the number of
sport pilots87. Figure 82 shows the number of
LSA-type aircraft and pilots forecasted by the
FAA for 2005-2031. From this data, an
average of 300 new LSAs will be added to the
US fleet each year starting in 2013.
Considering that North America accounts for 53.4% of the total worldwide market for small
aircraft88
Assuming a 20-year production run of 500 or 1,500 aircraft would result in an average of 25
or 75 aircraft per year, respectively. From the projected worldwide annual sales of LSAs, an 4% to
12.5% market share is achievable depending on the rate of production. Given the ever-rising cost of
aviation fuel and very low operating costs of an electric airplane, Azalzan is expected to present a
significant market advantage over competitor S-LSAs.
, UACC expects a worldwide market of over 600 LSA-units per year.
16.2 Project Risk Assessment
UACC has determined that the highest development risk item from the standpoint of the
project schedule for Azalzan is the Li-air battery pack. Correspondence with present-day developers
indicates that they have high certainty of the pack being available well in advance of the 2016 entry
into service for Azalzan. However, should this projection fail to materialize, i.e. there is a delay in the
development or certification of the battery, alternatives must be considered. There will be two
options for Azalzan, the first of which is to use readily available alternative battery technologies that
may cause a significant reduction in the range and endurance of the aircraft due to their higher

89
weight and reduced energy capacity. UACC has considered other possible battery technologies that
could be applied in Azalzan, including lithium-ion and zinc-air. Li-ion batteries have been developed
and are approaching their maximum practical capacity89, which is around four times smaller than
that of Li-air batteries. This would result in an increase of approximately 560 lb. to store the same
amount of energy, which would result in a significant reduction in range and endurance.
Rechargeable zinc-air batteries have been developed, and companies such as ReVolt are already
planning on commercializing this type of battery in the near future90. Zinc-air batteries can store a
similar amount of energy per unit volume as Lithium-air batteries91
The second option is to delay the entry-into-service date to allow for the maturation of the
Li-air battery technology. This option presents the lowest risk of meeting the performance target for
the aircraft, which is a crucial marketing advantage for Azalzan. However, it would increase the
development costs and may delay and reduce the return on the original investment.
, which will make it possible to
have the same size of battery as the one already designed. However, given the larger weight of Zn-air
batteries, the range and endurance would be reduced by about 12.5 %. This would result in a
maximum range of 205 nmi. and a maximum endurance of 2.5 hrs. for a Zn-air battery version of
Azalzan. It should be noted that this version of Azalzan would still fulfill the RFP endurance
requirements.
16.3 Itemized Cost Estimation
To obtain the most accurate estimation of the unit cost of Azalzan, a method was
synthesized using parts of methods presented by Roskam and the RAND Corporation. The method
presented by Roskam92 is applicable only to aircraft with metallic structures. This requires a
modification to capture significant features of this aircraft that are otherwise unaccounted for, such
as the extensive use of composite materials. For this purpose, parts of a methodology developed by
the RAND Corporation93 were used. This methodology assesses the effect of the type of the structural
materials on the overall airframe cost by assigning complexity and cost factors to each material
relative to aluminum. The method then calculates projected component costs of engineering,
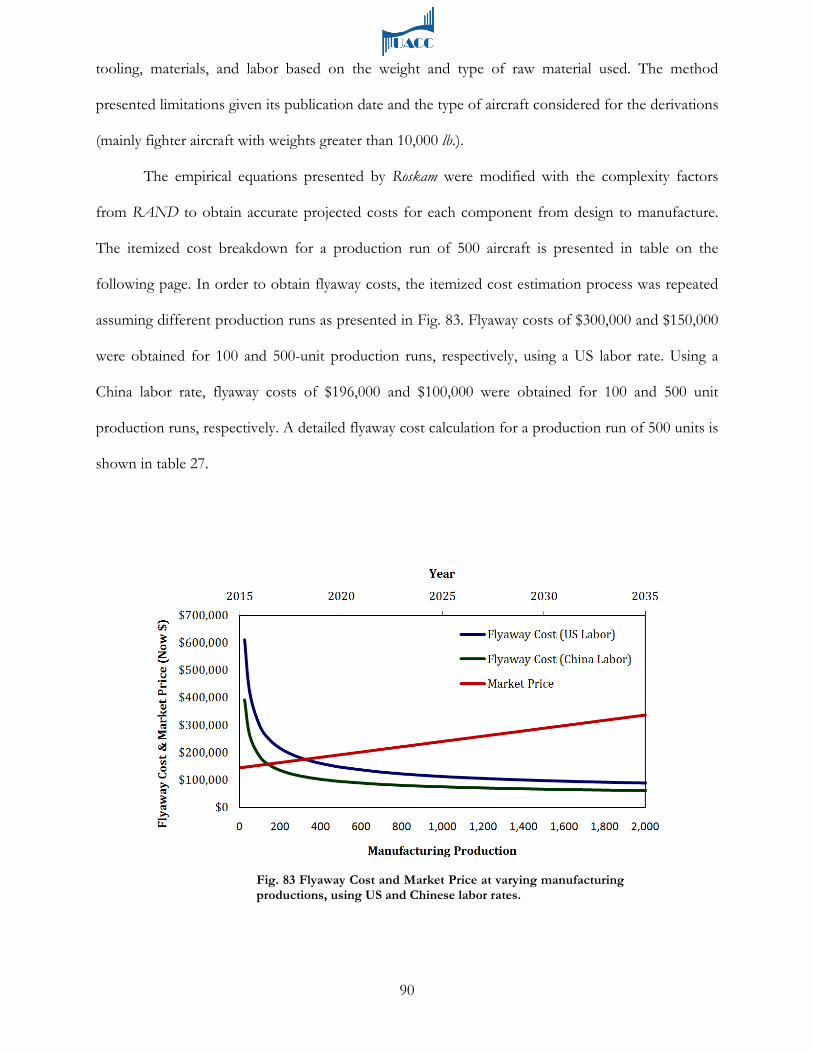
90
tooling, materials, and labor based on the weight and type of raw material used. The method
presented limitations given its publication date and the type of aircraft considered for the derivations
(mainly fighter aircraft with weights greater than 10,000 lb.).
The empirical equations presented by Roskam were modified with the complexity factors
from RAND to obtain accurate projected costs for each component from design to manufacture.
The itemized cost breakdown for a production run of 500 aircraft is presented in table on the
following page. In order to obtain flyaway costs, the itemized cost estimation process was repeated
assuming different production runs as presented in Fig. 83. Flyaway costs of $300,000 and $150,000
were obtained for 100 and 500-unit production runs, respectively, using a US labor rate. Using a
China labor rate, flyaway costs of $196,000 and $100,000 were obtained for 100 and 500 unit
production runs, respectively. A detailed flyaway cost calculation for a production run of 500 units is
shown in table 27.
Fig. 83 Flyaway Cost and Market Price at varying manufacturing productions, using US and Chinese labor rates.

91
Tab
le 2
7 Fl
yaw
ay c
ost c
alcu
latio
n fo
r a p
rodu
ctio
n ru
n of
500
Uni
ts.
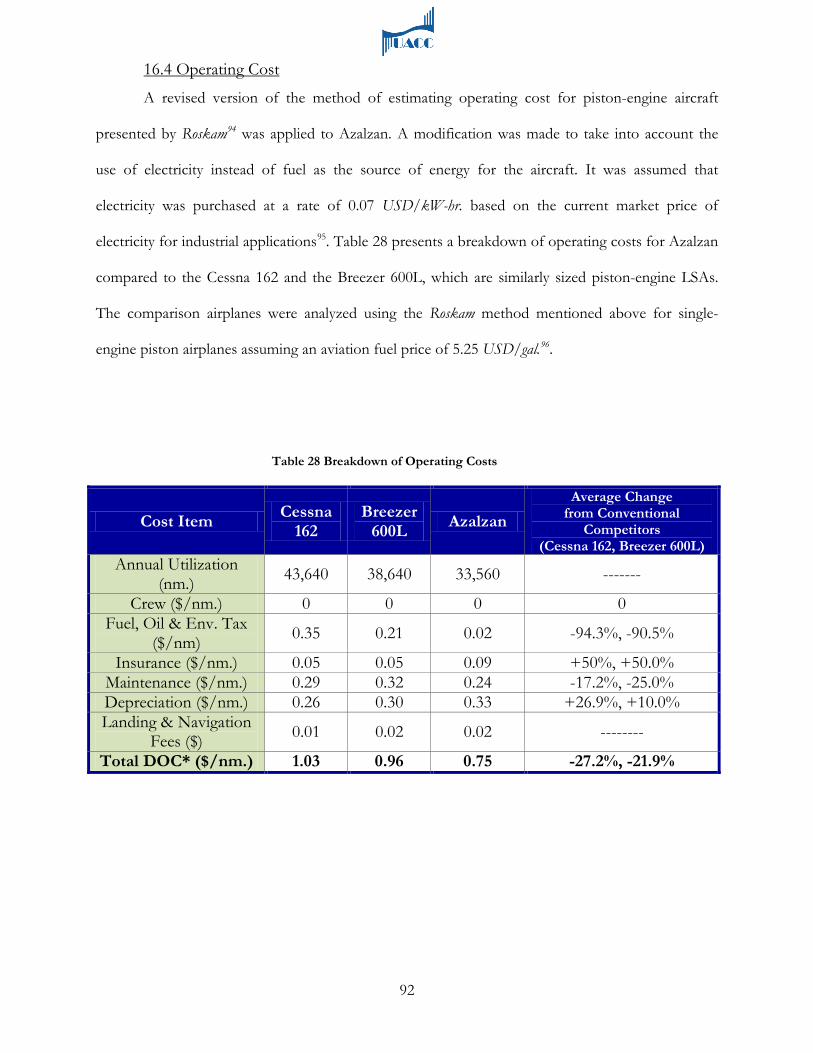
92
16.4 Operating Cost
A revised version of the method of estimating operating cost for piston-engine aircraft
presented by Roskam94 was applied to Azalzan. A modification was made to take into account the
use of electricity instead of fuel as the source of energy for the aircraft. It was assumed that
electricity was purchased at a rate of 0.07 USD/kW-hr. based on the current market price of
electricity for industrial applications95. Table 28 presents a breakdown of operating costs for Azalzan
compared to the Cessna 162 and the Breezer 600L, which are similarly sized piston-engine LSAs.
The comparison airplanes were analyzed using the Roskam method mentioned above for single-
engine piston airplanes assuming an aviation fuel price of 5.25 USD/gal.96
.
Cost Item Cessna 162
Breezer 600L Azalzan
Average Change from Conventional
Competitors (Cessna 162, Breezer 600L)
Annual Utilization (nm.) 43,640 38,640 33,560 -------
Crew ($/nm.) 0 0 0 0 Fuel, Oil & Env. Tax
($/nm) 0.35 0.21 0.02 -94.3%, -90.5%
Insurance ($/nm.) 0.05 0.05 0.09 +50%, +50.0% Maintenance ($/nm.) 0.29 0.32 0.24 -17.2%, -25.0% Depreciation ($/nm.) 0.26 0.30 0.33 +26.9%, +10.0% Landing & Navigation
Fees ($) 0.01 0.02 0.02 --------
Total DOC* ($/nm.) 1.03 0.96 0.75 -27.2%, -21.9%
Table 28 Breakdown of Operating Costs

93
References
1Roskam, Jan., Airplane Design, Part I through VIII , DAR Corporation, 2003 2 Heinemann, E., Raussa, R. and Van Every, K., Aircraft Design, The Nautical and Aviation Publication Co., 1985 3Eppinger, Steven D. and Ulrich, Karl T., Product Design and Development, Second Edition, Irwin McGraw-Hill, Boston, 2000 4Roskam, Jan. Airplane Design Part I Sec. 341 p. 118-187. DAR Corporation. 1987 5Roskam, Jan. Airplane Design Part II Fig. 12.7 p.286. DAR Corporation. 1997 6 “Engineering Science Data Unit”. Volumes on Performance, item 73018. “Estimation of Cruise Range: Propeller-Driven Aircraft.”August 1975 7 K. M. Abraham. A Brief History of Non-aqueous Metal-Air Batteries. ECS Transactions, 3(42) 67-71. 2008 8 MIT Professor 9 Yuneec International. Power Drive System Specifications. Acquired May 2011. http://yuneeccouk.site.securepod.com/PowerMotor_Tech_spec.html 10 Per suggestion of Dr. Lutgard C. De Jonghe, Faculty Senior Scientist at Lawrence Berkeley National Laboratory and Chairman of PolyPlus Battery Company 11 Appendix to Request for Proposal Document for Individual Aircraft Design Competition. AIAA. 2006-2007 12 University of Dayton Research Institute. Energy Storage & Generation. Electromechanical Power. Group Leader/Distinguished Research Engineer. Professor in the department of Aerospace and Mechanical Engineering, University of Dayton, OH. 13 Roskam, Jan. Airplane Design Part I Sects. 3.1-3.6 pgs 90-168. DAR Corporation 1997 14 “Engineering Science Data Unit”. Volumes on Aerodynamics, item 95021. “Wing Lift Coefficient Increment at Zero Angle of Attack” 15 FAA. “Aerospace Forecast Fiscal Years 2010-2030”. page 47 16 General Aviation Manufactures Association. Industry Facts and Statistics. Statistical Databook and Industry Outlook publications 1999-2011. Acquired March 2011. http://www.gama.aero/media-center/industry-facts-and-statistics/statistical-databook-and-industry-outlook 17 Dan Johnson, President and Chairman of the Light Aircraft Manufacturers Association. Market Sales Information for LSA. Acquired March 2011. http://www.bydanjohnson.com/index.cfm?b=1&m=5 18 FAA. General Aviation and Part 135 Activity Surveys – CY 2009. Table 1.1. Acquired March 2011. http://www.faa.gov/data_research/aviation_data_statistics/general_aviation/CY2009/ 19 Roskam, Jan. Airplane Design. Part III. DAR Corporation. 2003. Pgs 252-253 20 Roskam , Jan. Roskam’s Airplane War Stories. DAR Corporation. 2002. Pg 82: Cessna 172’s sales have been increased by almost 30% as a result of similar changes affecting the look of the design. 21 Roskam, Jan. Airplane Design Part IV. DAR Corporation, 1997. 22 Redeker, G., Horstmann, K.H., Köster, H., and Quast A. Investigations on High Reynolds Number Laminar Flow Airfoils. Journal of Aircraft Vol. 25 7. July 1988. 23 University of Illinois at Urbana-Champaign Applied Aerodynamics Group. Department of Aerospace Engineering. Airfoil Coordinates Database. Acquired Sept-Dec. 2009. 24 Roskam, Jan. Airplane Design Part VI. DAR Corporation. 1990. Section 4.12.2, pgs 110-111 25 Oberg, Eric, et. al. Machinery’s Handbook. Industrial Press. 28th Edition. Feb 2008 26 “Engineering Science Data Unit”. Volumes on Aircraft Aerodynamics, item 98013. “Aerodynamic Principles of Winglets.” June, 1998. 27 Maughmer, Mark D. Design of Winglets for High-Performance Sailplanes. AIAA Journal of Aircraft. Vol. 40 6. Dec. 2003 28 “Engineering Science Data Unit”. Volumes on Aerodynamics, item 95021. “Wing Lift Coefficient Increment at Zero Angle of Attack” 29 Roskam, Jan. citing Torenbeek, E. Synthesis of Subsonic Airplane Design. Appendix G, p. 533. 1981 30 Roskam, Jan. Airplane Design Part VI. DAR Corporation. 1990. p. 21. 31 Roskam, Jan. Airplane Design. Part VI. DAR Corporation. 1990. All Sections relevant to Class II drag polar analysis for light airplanes were used. 32 Torenbeek, E. Synthesis of Subsonic Airplane Design. Chapters pertaining to low speed aerodynamic predictions. 1981

94
33 Roskam, Jan. Airplane Design Part VI. DAR Corporation. 1990. Section 4.12.2, pgs 110-111 34 Oberg, Eric, et. al. Machinery’s Handbook. Industrial Press. 28th Edition. Feb 2008 35 Advanced Aircraft Analysis help file on Structure. DAR Corporation. Keyword Libove’s Axis. Wichita, Kansas. 2009. 36 Roskam, Jan. Airplane Design. Part IV. DAR Corporation, 1990. Section 2.4. Pg. 4. Note: Roskam derives his requirements from FAR §23.725. 37 Oberg, Eric, et. al. Machinery’s Handbook. Industrial Press. 28th Edition. Feb 2008 38 Molyneux, W.G., Hall, H. The Aerodynamic Effects of Aspect Ratio and Sweepback on Wing Flutter, Aeronautical Research Council-Reports & Memorandum . Her majesties Stationary Office, 1957 39 Krishnan, R. Permanent Magnet Synchronous and Brushless DC Motor Devices. CRC Press. 2010. 40 Hartzell Propeller Inc. Advanced Propeller Design and Manufacturing. Technical Questions. 2009 41 Dr. Lutgard C. De Jonghe, Faculty Senior Scientist at Lawrence Berkeley National Laboratory and Chairman of PolyPlus Battery Company, and Dr. Binod Kumar, University of Dayton Research Institute. Energy Storage & Generation. Electromechanical Power. Group Leader/Distinguished Research Engineer. Professor in the department of Aerospace and Mechanical Engineering, University of Dayton, OH. 42 Berchevsky, Gene et. al. The Tesla Roadster Battery System. Tesla Motors, 2006. 43 Fokker Technologies. Fokker Services introduces Electronic Flight Bag hardware and mounting solution for iPad. 2011 44 Berdichevsky, G., et. al. The Tesla Roadster Battery System. Tesla Motors, 2006. 45 Shah, R.K. and Sekulić, D. Fundamentals of Heat Exchanger Design. John Wiley & Sons, 2003. 46 Hesselgreaves, John E. Compact Heat Exchangers: Selection, Design, and Operation. Pergamon, 2001. 47 “Engineering Science Data Unit”. Volumes on Aircraft Performance, item 83042. “Estimation of Spray Patterns Generated from the Sides of Aircraft Tires Running in Water or Slush.” Amendment A. April, 1998. 48 Roskam, Jan. Airplane Design Part V. DAR Corporation, 1997. p. 25 49 Schmitt, R.L. et. al. Weight Estimation Handbook for Light Aircraft. Cessna Aircraft Company, 1959. 50 Torenbeek, E. Synthesis of Subsonic Airplane Design. Kluwer Boston Inc., 1982. 51 Roskam, Jan. Airplane Design. Part V. DAR Corporation, 1990. 52 Roskam, Jan. Airplane Flight Dynamics and Automated Flight Controls. Part I Sec. 4.2.2. p. 205. 2003 53 Roskam, Jan. Airplane Design Part II. Section 11.1, pp. 24-25. DAR Corporation, 1997. 54 Military Specification MIL-F-8785 B Flying Qualities of Piloted Airplanes; 1969: Air Force Flight Dynamics Laboratory, WP AFB, Dayton, Ohio. 55 Roskam, Jan. Airplane Flight Dynamics and Automatic Flight Controls, Part I, DAR Corporation, 2003, p. 186. 56 Roskam, Jan. Airplane Flight Dynamics and Automatic Flight Controls, Part I, DAR Corporation, 2003, p. 143. 57 Military Specification MIL-F-8785 B Flying Qualities of Piloted Airplanes; 1969: Air Force Flight Dynamics Laboratory, WP AFB, Dayton, Ohio. 58 Roskam, Jan. Airplane Flight Dynamica and Automatic Flight Controls, Part I, DAR Corporation, 2003, p. 205. 59 Roskam, Jan. Airplane Flight Dynamics and Automatic Flight Controls, Part I, DAR Corporation, 1997, Secs. 5.3.2 & 5.3.10 60 Hoak. D.E.,”USAF Stability and Control DATCOM, Write Paterson AFB, OH 61 Roskam, Jan. Airplane Flight Dynamics and Automatic Flight Controls Part I, Section 5.2.4 & 5.2.5 PP 329-337 DAR Corp. 2003 62 Roskam, Jan. Airplane Design Part VI. Sec. 10. P 371-377. DAR Corporation. 1991. 63 Roskam, Jan. Airplane Design Part VI. Section 6.4, pp. 193-198. DAR Corporation, 1990. 64 “Engineering Science Data Unit”. Volumes on Performance, item 85029. “Calculation of Ground Performance in Takeoff and Landing”. Amendment A. March 2006. 65 “Engineering Science Data Unit”. Volumes on Aerodynamics, item 71007. “Low Speed Normal Force and Pitching Moment of Slender Wings in Ground Effects”. June 1971 66 Roskam, Jan. Airplane Design Part VII Sec. 5.2 p. 117-123. DAR Corporation. 1991 67 Roskam, Jan. Airplane Design Part VII Sec 5.3. p. 124-130. DAR Corporation. 1991. 68 Roskam, Jan. Airplane Design Part VII Sec 5.7. p. 150-155. DAR Corporation. 1991. 69 Engineering Science Data Unit. Volumes on Performance, item 91032. “Estimation of Airborne Performance and Landing”. October 1991.

95
70 Engineering Science Data Unit. Volumes on Performance, item 92020. “Energy Method for Analysis of Measured Airspeed Change in Landing Airborne Maneuvers.” Amendment A, December 1996. 71 Engineering Science Data Unit. Volumes on Performance, item EG6/4. “Estimation of Ground Run During Landing.” Amendment B, February 1992. 72 Roskam, Jan. Airplane Design, Part VII. Sec. 5.1, pp. 113-116. DAR Corporation, 1991. 73 Marte, Jack E. A Review of Aerodynamic Noise from Propellers, Rotors, and Lift Fans. National Aeronautics and Space Administration. Jet Propulsion Laboratory. Technical Report 32-1462. 1970 74 SAE International. SAE Electric Vehicle Conductive Charge Coupler. 2001. 75 Kumar, B. Personal correspondence. 2011. 76 Gunawardana, S. Electric Airplane Research Program. Stanford University. 2009. 77 National Transport Safety Board. Annual Review of Aircraft Accident Data: U.S. General Aviation. 2005. 78 Knacke, Theo W. Parachute Recovery Systems Design Manual. Naval Weapons Center, 1991. 79 Cesaroni Technology. Pro 29 2010 Catalog. V 1.0. Sarasota, FL. 80 BRS Aerospace. Recovery Systems Spec Sheet. 81 Orgeon Aero High-G Seat. http://www.oregonaero.com/seat-systems/oem-high-g. Accessed April 3, 2011. 82 Laminar Research. X-Plane v. 9.00. Created by Austin Meyer. http://www.x-plane.com. 83 Szatkowski, George. Lightning Strike Protection for Composite Aircraft. NASA Langley Research Center, 2009. 84 Roskam, Jan. Airplane Design. Part III. DAR Corporation. 1991. 85 Szatkowski, George. Lightning Strike Protection for Composite Aircraft. NASA Langley Research Center, 2009. 86 Federal Aviation Administration. “Certification of Aircraft and Airmen for the Operation of Light-Sport Aircraft”. July, 2004. 87 Federal Aviation Administration. “2011-2031 Aerospace Forecast”. 2011. 88 General Aviation Manufacturer Association. “General Aviation: Statistical Databook & Industry Outlook”. 2010. 89 Linden, David and Reddy, Thomas. “Handbook of Batteries” 3rd Edition. McGraw-Hill, 2001. 90 Bullis, Kevin. High-Energy Batteries Coming to Market. Technology Review, MIT. 2009. 91Linden, David and Reddy, Thomas. “Handbook of Batteries” 3rd Edition. McGraw-Hill, 2001. 92 Roskam, Jan. Airplane Design. Part VIII. DAR Corporation, 1991. 93 Resetar, Susan et. al. “Advanced Airframe Structural Materials: A Primer and Cost Estimating Methodology”. RAND Corporation, 1991. 94 Roskam, Jan. Airplane Design. Part VIII. DAR Corporation, 1991. 95 US Energy Information Administration. “Monthly Electric Sales and Revenue Report with State Distribution Reports” Jan. 2011. 96 Cessna. Skycatcher: Performance and Specifications. http://www.cessna.com/single-engine/skytcatcher/skycatcher-performance.html. Accessed May 2011.


