Embed Size (px)
DESCRIPTION
AY 2009 Instructional Program Review Data Delivery Plan. Data Description Process – Timeline Rev. 11-4-09. Purpose. - PowerPoint PPT Presentation
Citation preview
AY 2009 Instructional Program AY 2009 Instructional Program Review Data Delivery PlanReview Data Delivery Plan
Data DescriptionData DescriptionProcess – TimelineProcess – Timeline
Rev. 11-4-09Rev. 11-4-09
PurposePurposeThe primary purpose of this presentation is to provide clarity to all instructional programs on how the The primary purpose of this presentation is to provide clarity to all instructional programs on how the data is calculated for both our local Comprehensive and the system required Annual Program data is calculated for both our local Comprehensive and the system required Annual Program Reviews.Reviews.
We have been asked to produce an annual program review for each and every one of our We have been asked to produce an annual program review for each and every one of our instructional programs and units. They are required of each system CC and will be taken to the U of instructional programs and units. They are required of each system CC and will be taken to the U of H Board of Regents for their review.H Board of Regents for their review.
So who has to do a program review this year? If you are normally scheduled to do a comprehensive So who has to do a program review this year? If you are normally scheduled to do a comprehensive or are “Jumping” you will do a comprehensive review this year. Additionally, every instructional and or are “Jumping” you will do a comprehensive review this year. Additionally, every instructional and non-instructional program will do an Annual Program Review this year.non-instructional program will do an Annual Program Review this year.
Not sure if you’re scheduled for a comprehensive review or not? Not sure if you’re scheduled for a comprehensive review or not?
Click here for the Click here for the Program-Unit Review ScheduleProgram-Unit Review Schedule
22
What are we doing to improve our program review process?What are we doing to improve our program review process?
Based upon observation and the feedback we received from you last year from our program review process improvement survey, the following changes have been Based upon observation and the feedback we received from you last year from our program review process improvement survey, the following changes have been implemented.implemented.
Over the course of the summer the program review website was developed and most of the documentation was updated to reduce the amount of time it takes to get Over the course of the summer the program review website was developed and most of the documentation was updated to reduce the amount of time it takes to get you the data you need for your review.you the data you need for your review.
Labels were added to each instructional data sheet to clarify the period of time the data was taken from.Labels were added to each instructional data sheet to clarify the period of time the data was taken from.
Health calls come to you pre-populated this year from the system office to ensure the consistent application of calculations across the UHCC system.Health calls come to you pre-populated this year from the system office to ensure the consistent application of calculations across the UHCC system.
Your overall program budget this year breaks out the general funded costs from the special/federal grant dollars to highlight how much of your budget is dependent Your overall program budget this year breaks out the general funded costs from the special/federal grant dollars to highlight how much of your budget is dependent upon grants.upon grants.
Academic Subject Certificates and a new data element, “Other Certificates Awarded” were added this year so programs receive credit for those credentials as well.Academic Subject Certificates and a new data element, “Other Certificates Awarded” were added this year so programs receive credit for those credentials as well.
Academic year data is provided for 0809 this year to include spring data as well as fall.Academic year data is provided for 0809 this year to include spring data as well as fall.
Your data file has been embedding into the coversheet to reduce your formatting time.Your data file has been embedding into the coversheet to reduce your formatting time.
Only one document will be required for annuals this year.Only one document will be required for annuals this year.
Four separate training sessions will be given this year in order to focus on specific groups. They are:Four separate training sessions will be given this year in order to focus on specific groups. They are:– 1.1. ATE Division ProgramsATE Division Programs– 2.2. Hospitality, Business Ed, and Nursing Division ProgramsHospitality, Business Ed, and Nursing Division Programs– 3.3. Liberal Arts Division ProgramsLiberal Arts Division Programs– 4.4. UnitsUnits
33
What’s a Jumper?What’s a Jumper?
A Jumper is a locally defined term that is used to describe an instructional A Jumper is a locally defined term that is used to describe an instructional program or non-instructional program (unit) that has decided to jump out of program or non-instructional program (unit) that has decided to jump out of their normally scheduled slot for their comprehensive program reviews and their normally scheduled slot for their comprehensive program reviews and into this years cycle.into this years cycle.
Why would anyone want to do that? Jumping into this years comprehensive Why would anyone want to do that? Jumping into this years comprehensive cycle means that you will have an opportunity to be considered for any cycle means that you will have an opportunity to be considered for any budgetary decisions that will be made in this years budget process.budgetary decisions that will be made in this years budget process.
Jumpers will still have to do their comprehensive review on their next Jumpers will still have to do their comprehensive review on their next scheduled review. Jumping does not affect the existing schedule—you are scheduled review. Jumping does not affect the existing schedule—you are voluntarily doing an extra review to be considered in this budget cycle.voluntarily doing an extra review to be considered in this budget cycle.
44
I belong to an Instructional Program… which template do I use?I belong to an Instructional Program… which template do I use?
Your programs data table has been embedded into your coversheet (for annuals) or the Your programs data table has been embedded into your coversheet (for annuals) or the comprehensive program review template you will need for your review. You should have comprehensive program review template you will need for your review. You should have everything you need to begin writing your review.everything you need to begin writing your review.
The blank templates and coversheets are linked below as well if you should need them.The blank templates and coversheets are linked below as well if you should need them.
UHCC Annual Instructional Program Review Coversheet UHCC Annual Instructional Program Review Coversheet
((ALLALL Instructional programs will need to complete this—even if you’re completing a Instructional programs will need to complete this—even if you’re completing a comprehensive review)comprehensive review)
Instructional Comprehensive Program Review Template Instructional Comprehensive Program Review Template (Use this template ONLY if you are scheduled for a comprehensive program review this year (Use this template ONLY if you are scheduled for a comprehensive program review this year
or are jumping)or are jumping)
55
What’s new this year in the Annual Report of Program Data table?What’s new this year in the Annual Report of Program Data table?
All of the changes listed below are for the 0809 academic year only. The Fall 06 and Fall 07 data All of the changes listed below are for the 0809 academic year only. The Fall 06 and Fall 07 data is from last years program review, using last years routines, and using fall data only.is from last years program review, using last years routines, and using fall data only.
New and Replacement Jobs are now prorated for programs offered by more than one college on New and Replacement Jobs are now prorated for programs offered by more than one college on the same island (if 3 community colleges on Oahu offer the same program they will divide the the same island (if 3 community colleges on Oahu offer the same program they will divide the county jobs up proportionate to the number of majors at each college). This is for County data only.county jobs up proportionate to the number of majors at each college). This is for County data only.
Annual data (summer-- for programs with required summer attendance, fall, spring). [note: this is Annual data (summer-- for programs with required summer attendance, fall, spring). [note: this is not the traditional academic year. Annual data starting with Summer will allow us to get degree not the traditional academic year. Annual data starting with Summer will allow us to get degree and certificate data for all 3 years]and certificate data for all 3 years]
New measures for Distance EducationNew measures for Distance Education
Health Calls (overall, demand, efficiency, effectiveness) pre populated according to scoring rubric Health Calls (overall, demand, efficiency, effectiveness) pre populated according to scoring rubric set by UHCC I-PRC and are pre-populated this year. set by UHCC I-PRC and are pre-populated this year.
New process to follow when Perkins IV Core Indicator goals are not metNew process to follow when Perkins IV Core Indicator goals are not met
66
Instructional Program Review Data ElementsInstructional Program Review Data Elements
Wherever possible, previous year data was copied directly in from last years program Wherever possible, previous year data was copied directly in from last years program review. Therefore, the columns labeled Fall 06 and Fall 07 reflect what was reported to review. Therefore, the columns labeled Fall 06 and Fall 07 reflect what was reported to you last year.you last year.
The system office reported your 0809 data using today’s routines, which may vary from The system office reported your 0809 data using today’s routines, which may vary from what was reported last year. This is due to the system office using “improved” routines what was reported last year. This is due to the system office using “improved” routines over the ones used last year.over the ones used last year.
Student information data this year comes exclusively from the Operational Data Store Student information data this year comes exclusively from the Operational Data Store (ODS). Organizationally this means that all community colleges are getting the data from (ODS). Organizationally this means that all community colleges are getting the data from the same place and at the same snapshot in time (this is a good thing).the same place and at the same snapshot in time (this is a good thing).
The following slides will explain in detail what data has been provided to you for your The following slides will explain in detail what data has been provided to you for your comprehensive-annual instructional program review write ups and how it has been comprehensive-annual instructional program review write ups and how it has been calculated.calculated.
77
#1#1 New and Replacement Positions (State)New and Replacement Positions (State)
This data element represents the combined new and replacement jobs for This data element represents the combined new and replacement jobs for the the StateState of Hawaii in your trade, projected for the period 2005-2011 for of Hawaii in your trade, projected for the period 2005-2011 for AY0607, 2008-2014 for AY0708 and 2010-2016 for AY0809. AY0607, 2008-2014 for AY0708 and 2010-2016 for AY0809.
Economic Modeling Specialists Inc (EMSI) compiles data based on Economic Modeling Specialists Inc (EMSI) compiles data based on Standard Occupational Codes (SOC) that the college has linked to the Standard Occupational Codes (SOC) that the college has linked to the instructional program.instructional program.
..
From their website, “…EMSI specializes in reports that analyze and quantify From their website, “…EMSI specializes in reports that analyze and quantify the total economic benefits of community and technical colleges in their the total economic benefits of community and technical colleges in their region, and also creates data-driven strategic planning tools that help region, and also creates data-driven strategic planning tools that help colleges maximize their impact through labor market responsiveness…” colleges maximize their impact through labor market responsiveness…”
88
#2#2 New and Replacement Positions (County prorated) New and Replacement Positions (County prorated)
This data element represents the combined new and replacement jobs for This data element represents the combined new and replacement jobs for the the CountyCounty of Hawaii in your trade, projected for the period 2005-2011 for of Hawaii in your trade, projected for the period 2005-2011 for AY0607, 2008-2014 for AY0708 and 2010-2016 for AY0809. AY0607, 2008-2014 for AY0708 and 2010-2016 for AY0809.
Economic Modeling Specialists Inc (EMSI) compiles data based on Economic Modeling Specialists Inc (EMSI) compiles data based on Standard Occupational Codes (SOC) that the college has linked to the Standard Occupational Codes (SOC) that the college has linked to the instructional program.instructional program.
For multiple community colleges in the same county the number of positions For multiple community colleges in the same county the number of positions has been prorated based upon the proportion of majors at each CC.has been prorated based upon the proportion of majors at each CC.
99
#3#3 Number of MajorsNumber of Majors
Since the number of majors in 0809 is an annual count, .5 majors Since the number of majors in 0809 is an annual count, .5 majors were assigned for each major in both fall and spring, then added up were assigned for each major in both fall and spring, then added up for the year. This method was preferred over counting unduplicated for the year. This method was preferred over counting unduplicated majors.majors.
Note that the 2 previous reporting periods are Fall majors only.Note that the 2 previous reporting periods are Fall majors only.
1010

#4#4 SSH Program majors in Program ClassesSSH Program majors in Program Classes
This is the sum of all student semester hours taken by program This is the sum of all student semester hours taken by program majors in our locally defined program classes for the academic year majors in our locally defined program classes for the academic year 0809.0809.
For Practical Nursing this includes SSH earned in Summer.For Practical Nursing this includes SSH earned in Summer.
Excludes Directed Studies (99 series). Excludes Directed Studies (99 series).
Includes Cooperative Education.Includes Cooperative Education.
Not sure what your program classes are? Click here to find out:Not sure what your program classes are? Click here to find out:
Program Course ListingProgram Course Listing
1111
#5#5 SSH Non-Majors in Program ClassesSSH Non-Majors in Program Classes
This is the sum student semester hours taken by non-This is the sum student semester hours taken by non-program majors in our locally defined program courses.program majors in our locally defined program courses.
For Practical Nursing this includes SSH earned in For Practical Nursing this includes SSH earned in Summer.Summer.
Excludes Directed Studies (99 series). Excludes Directed Studies (99 series).
Includes Cooperative Education (93 series).Includes Cooperative Education (93 series).
1212

#6#6 SSH in All Program ClassesSSH in All Program Classes
The sum of student semester hours taken by all students in our The sum of student semester hours taken by all students in our locally defined program courses.locally defined program courses.
For Practical Nursing this includes SSH earned in Summer.For Practical Nursing this includes SSH earned in Summer.
Excludes Directed Studies (99 series). Excludes Directed Studies (99 series).
Includes Cooperative Education (93 series).Includes Cooperative Education (93 series).
1313
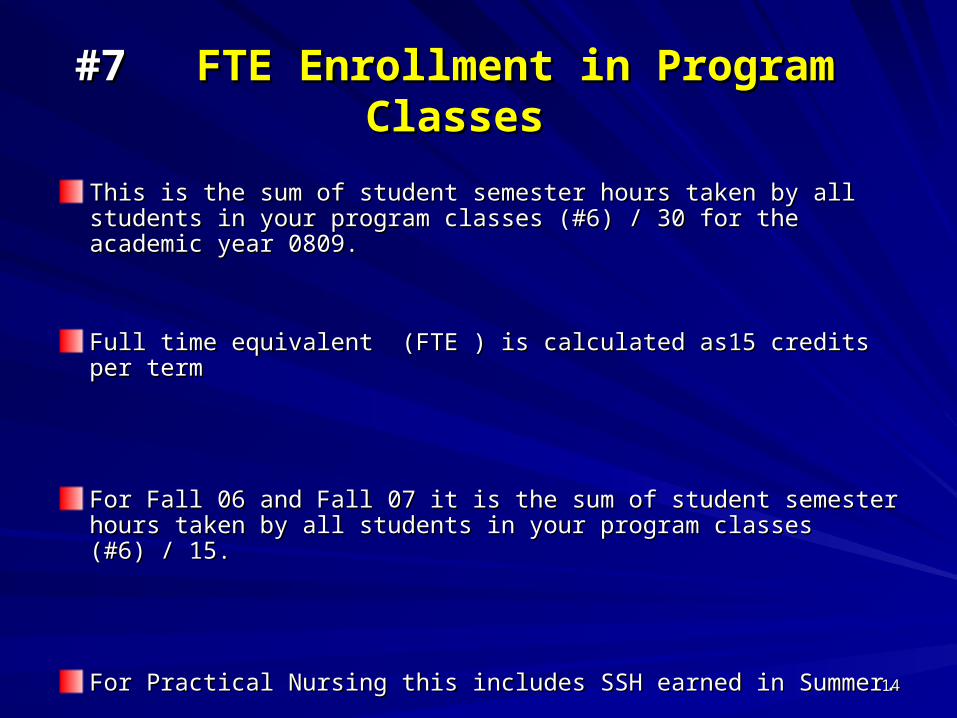
#7#7 FTE Enrollment in Program ClassesFTE Enrollment in Program Classes
This is the sum of student semester hours taken by all students in This is the sum of student semester hours taken by all students in your program classes (#6) / 30 for the academic year 0809.your program classes (#6) / 30 for the academic year 0809.
Full time equivalent (FTE ) is calculated as15 credits per termFull time equivalent (FTE ) is calculated as15 credits per term
For Fall 06 and Fall 07 it is the sum of student semester hours taken For Fall 06 and Fall 07 it is the sum of student semester hours taken by all students in your program classes (#6) / 15.by all students in your program classes (#6) / 15.
For Practical Nursing this includes SSH earned in Summer.For Practical Nursing this includes SSH earned in Summer.
1414
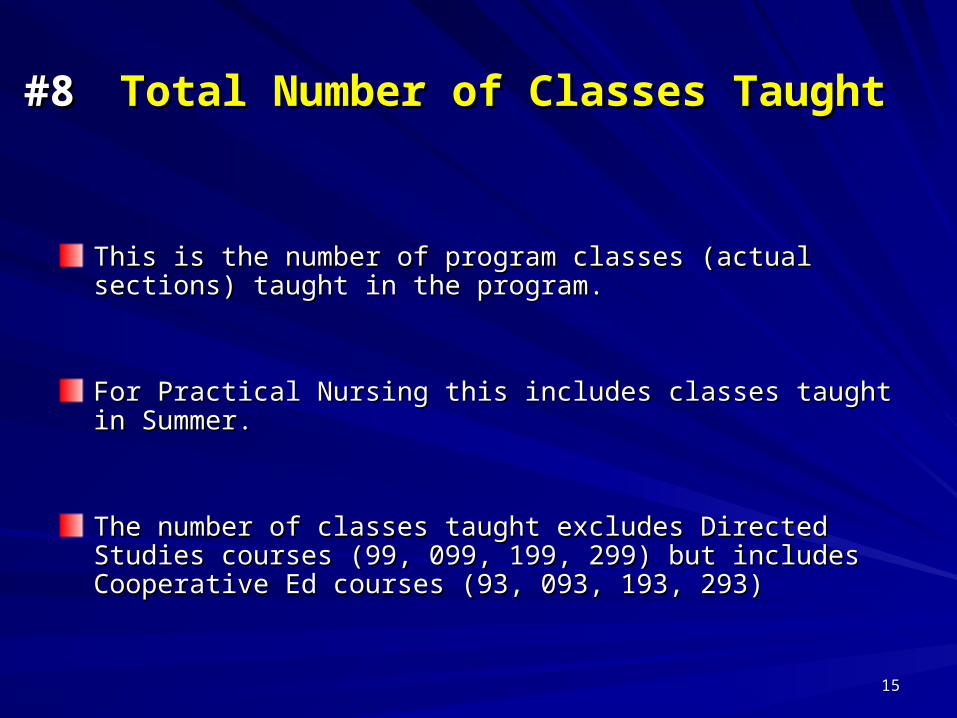
#8#8 Total Number of Classes TaughtTotal Number of Classes Taught
This is the number of program classes (actual sections) taught in This is the number of program classes (actual sections) taught in the program.the program.
For Practical Nursing this includes classes taught in Summer.For Practical Nursing this includes classes taught in Summer.
The number of classes taught excludes Directed Studies courses The number of classes taught excludes Directed Studies courses (99, 099, 199, 299) but includes Cooperative Ed courses (93, 093, (99, 099, 199, 299) but includes Cooperative Ed courses (93, 093, 193, 293)193, 293)
1515
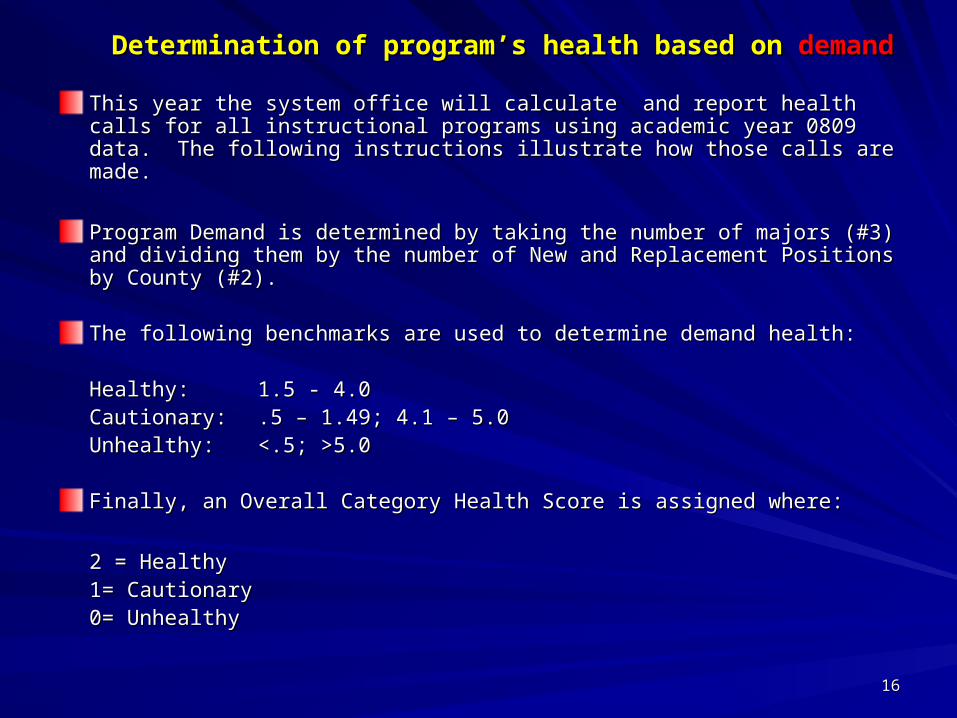
Determination of program’s health based on Determination of program’s health based on demanddemand
This year the system office will calculate and report health calls for all This year the system office will calculate and report health calls for all instructional programs using academic year 0809 data. The following instructional programs using academic year 0809 data. The following instructions illustrate how those calls are made.instructions illustrate how those calls are made.
Program Demand is determined by taking the number of majors (#3) and Program Demand is determined by taking the number of majors (#3) and dividing them by the number of New and Replacement Positions by County dividing them by the number of New and Replacement Positions by County (#2).(#2).
The following benchmarks are used to determine demand health:The following benchmarks are used to determine demand health:
Healthy:Healthy: 1.5 - 4.01.5 - 4.0Cautionary:Cautionary: .5 – 1.49; 4.1 – 5.0.5 – 1.49; 4.1 – 5.0Unhealthy:Unhealthy: <.5; >5.0<.5; >5.0
Finally, an Overall Category Health Score is assigned where:Finally, an Overall Category Health Score is assigned where:
2 = Healthy2 = Healthy1= Cautionary1= Cautionary0= Unhealthy0= Unhealthy
1616
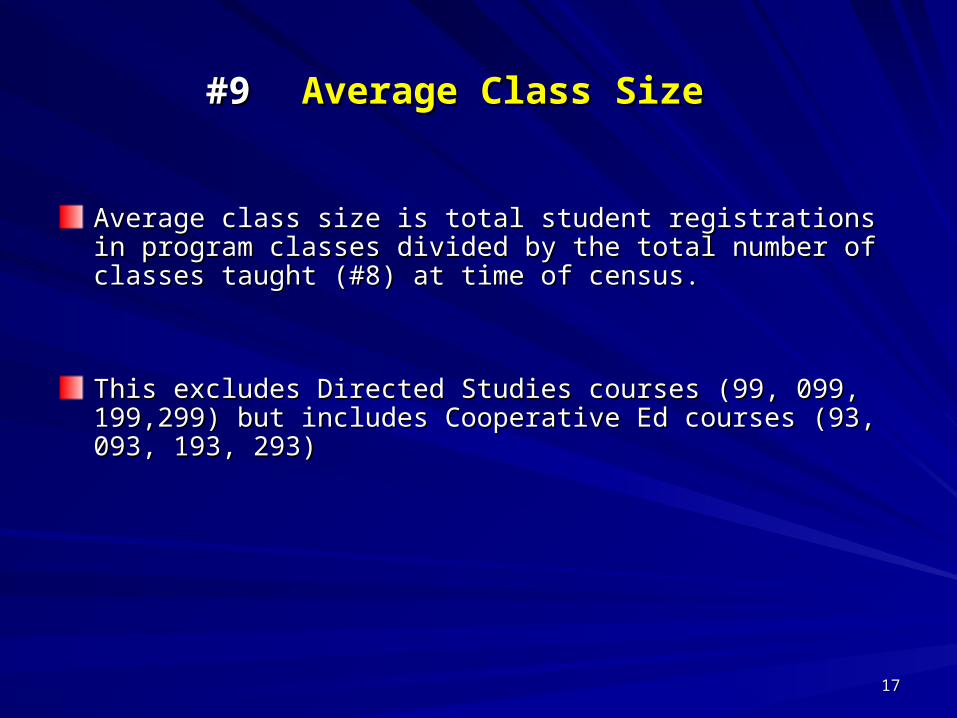
#9#9 Average Class SizeAverage Class Size
Average class size is total student registrations in program classes Average class size is total student registrations in program classes divided by the total number of classes taught (#8) at time of census.divided by the total number of classes taught (#8) at time of census.
This excludes Directed Studies courses (99, 099, 199,299) but This excludes Directed Studies courses (99, 099, 199,299) but includes Cooperative Ed courses (93, 093, 193, 293)includes Cooperative Ed courses (93, 093, 193, 293)
1717
#10#10 Fill RateFill Rate
Class fill rate is total student registrations in program Class fill rate is total student registrations in program classes (number of seats filled) divided by the maximum classes (number of seats filled) divided by the maximum enrollments (number of seats offered).enrollments (number of seats offered).
Taken at Fall and Spring census for 0809.Taken at Fall and Spring census for 0809.
1818
#11#11 FTE BOR Appointed FacultyFTE BOR Appointed Faculty
FTE of BOR Appointed Program Faculty is the sum of appointments to your FTE of BOR Appointed Program Faculty is the sum of appointments to your program (1.0, 0.5, etc) excluding Lecturers and other non-BOR appointees.program (1.0, 0.5, etc) excluding Lecturers and other non-BOR appointees.
Remember that these are positions that were appointed to your program—whether Remember that these are positions that were appointed to your program—whether or not these people are actually teaching classes.or not these people are actually teaching classes.
This information now comes directly from system HR. If this is not correct for your This information now comes directly from system HR. If this is not correct for your program we can work to get it updated in the HR system.program we can work to get it updated in the HR system.
Click here to find out who the BOR Appointed Program Faculty are for your Click here to find out who the BOR Appointed Program Faculty are for your program:program:
Instructional Program BOR AppointmentsInstructional Program BOR Appointments
1919
#12 #12 Majors to FTE BOR Appointed Faculty Majors to FTE BOR Appointed Faculty
The number of majors (from data element #3) divided by the The number of majors (from data element #3) divided by the number of FTE BOR Appointed Program Faculty (from data element number of FTE BOR Appointed Program Faculty (from data element #11) .#11) .
Note: this is not all students taking your classes…just the majors.Note: this is not all students taking your classes…just the majors.
2020
#13a#13a Analytical FTE Faculty (Workload)Analytical FTE Faculty (Workload)
Analytical FTE Faculty is a workload measure and is determined by Analytical FTE Faculty is a workload measure and is determined by summing the semester hours taught by instructors in their program summing the semester hours taught by instructors in their program courses, and then dividing by 15 for Fall semester s (or 27 for the courses, and then dividing by 15 for Fall semester s (or 27 for the year) for the full time equivalent value.year) for the full time equivalent value.
Analytic FTE Faculty includes the semester hours taught by both Analytic FTE Faculty includes the semester hours taught by both Faculty and Lecturers. Therefore, it can be used to compare to the Faculty and Lecturers. Therefore, it can be used to compare to the value of (#11) FTE BOR Appointed faculty, to highlight program value of (#11) FTE BOR Appointed faculty, to highlight program offerings being covered by lecturers.offerings being covered by lecturers.
2121
#13#13 Majors to Analytic FTE FacultyMajors to Analytic FTE Faculty
Total number of majors (from data element #3) divided Total number of majors (from data element #3) divided by Analytic FTE faculty (from data element #13a) for the by Analytic FTE faculty (from data element #13a) for the academic year 0809 .academic year 0809 .
2222
#13c#13c Analytic FTE Faculty @ 12 cr. Analytic FTE Faculty @ 12 cr.
Starting in Fall 2007 we added a data element to the review for programs that Starting in Fall 2007 we added a data element to the review for programs that operate on contact hours instead of credit hours. For these programs we will operate on contact hours instead of credit hours. For these programs we will calculate workload faculty fte by dividing credits taught by 12 instead of 15 calculate workload faculty fte by dividing credits taught by 12 instead of 15 per Fall semester, and dividing by 21.6 for 0809.per Fall semester, and dividing by 21.6 for 0809.
If you do not have a #13c in the data set provided to you, please ignore this If you do not have a #13c in the data set provided to you, please ignore this additional detail. It was only added to the data sheets for programs operating additional detail. It was only added to the data sheets for programs operating on contact hours.on contact hours.
The contact hours calculation for Faculty FTE is not recognized by the The contact hours calculation for Faculty FTE is not recognized by the system office so we are adding it to the program review as it makes more system office so we are adding it to the program review as it makes more sense for programs operating on contact hours. It is also used in the sense for programs operating on contact hours. It is also used in the calculation of data elements 13c, 14, 14a, and15.calculation of data elements 13c, 14, 14a, and15.
Programs identified as operating on contact hours are: AG, ABRP, AEC, Programs identified as operating on contact hours are: AG, ABRP, AEC, AMT, CARP, DISL, DMA, EIMT, ET, FSER, MWIM, NURS, PRCN, CHO, and AMT, CARP, DISL, DMA, EIMT, ET, FSER, MWIM, NURS, PRCN, CHO, and TEAM. (note: AEC newly added this year)TEAM. (note: AEC newly added this year)
This data element is added as a supplement to the instructional program This data element is added as a supplement to the instructional program review for Hawaii Community College. review for Hawaii Community College.
2323
#13b#13b Majors to Analytic FTE Faculty @ 12 cr.Majors to Analytic FTE Faculty @ 12 cr.
Number of majors (#3) in your program divided by the contact hour Number of majors (#3) in your program divided by the contact hour calculation for analytic fte from previous slide.calculation for analytic fte from previous slide.
2424
#14#14 OverallOverall Program Budget AllocationProgram Budget Allocation
The overall program budget allocation = General Funded Budget The overall program budget allocation = General Funded Budget Allocations + Special/Federal Budget Allocations (grant dollars).Allocations + Special/Federal Budget Allocations (grant dollars).
The general funded budget allocation = personnel costs + b budgetThe general funded budget allocation = personnel costs + b budget
With the exception of the 3 Nursing programs, we calculate With the exception of the 3 Nursing programs, we calculate personnel costs for AY09 by multiplying the Analytic FTE Faculty, personnel costs for AY09 by multiplying the Analytic FTE Faculty, which includes lecturers, by the AY 2009 UHPA faculty which includes lecturers, by the AY 2009 UHPA faculty rank 4 rank 4 rate rate per credit hour value of $1676, then by 30 credits.per credit hour value of $1676, then by 30 credits.
For the 3 Nursing programs, we calculate personnel costs for AY09 For the 3 Nursing programs, we calculate personnel costs for AY09 by multiplying the Analytic FTE Faculty, which includes lecturers, by by multiplying the Analytic FTE Faculty, which includes lecturers, by the AY 2009 UHPA faculty the AY 2009 UHPA faculty rank 5 rank 5 rate per credit hour value of rate per credit hour value of $1879, then by 30 credits.$1879, then by 30 credits.
2525
#15#15 Cost per SSHCost per SSH
This is the cost to run your program based on student semester This is the cost to run your program based on student semester hours.hours.
Costs come from Program Budget Allocation (data element #14) Costs come from Program Budget Allocation (data element #14) divided by student semester hours for all students in program divided by student semester hours for all students in program classes (from data element #6)classes (from data element #6)
2626
#16#16 Number of Low Enrolled (<10) ClassesNumber of Low Enrolled (<10) Classes
This is the number of Program classes (actual sections) This is the number of Program classes (actual sections) taught (#8) with 9 or fewer students enrolled at census.taught (#8) with 9 or fewer students enrolled at census.
Excludes Directed Studies (99 series)Excludes Directed Studies (99 series)
Includes Coop Ed (93 series)Includes Coop Ed (93 series)
2727
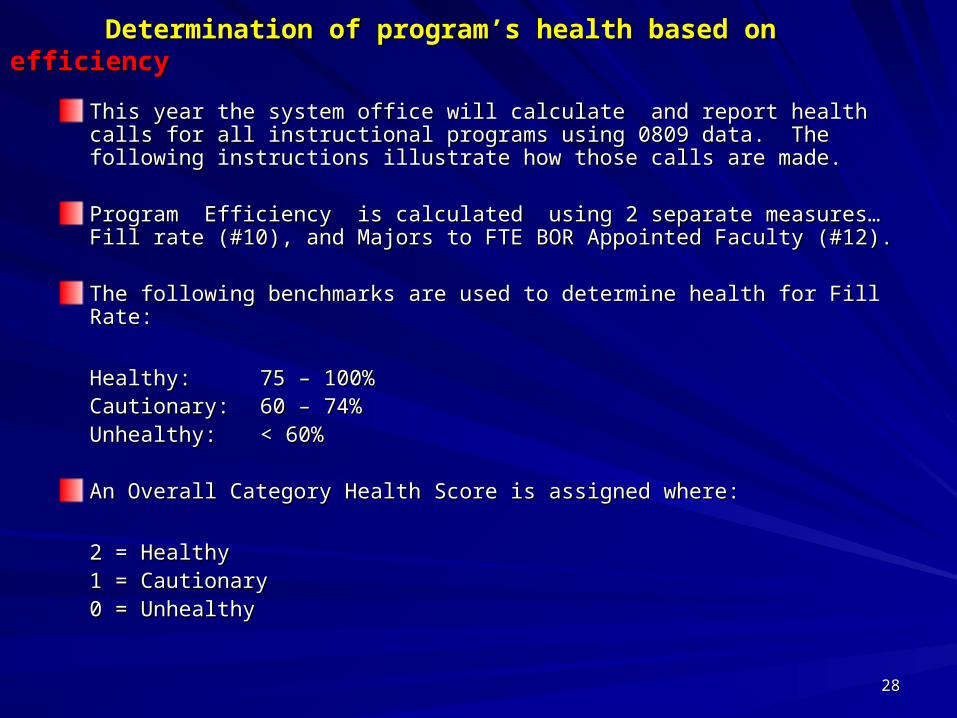
Determination of program’s health based on Determination of program’s health based on efficiencyefficiency
This year the system office will calculate and report health calls for all This year the system office will calculate and report health calls for all instructional programs using 0809 data. The following instructions illustrate instructional programs using 0809 data. The following instructions illustrate how those calls are made.how those calls are made.
Program Efficiency is calculated using 2 separate measures…Fill rate Program Efficiency is calculated using 2 separate measures…Fill rate (#10), and Majors to FTE BOR Appointed Faculty (#12). (#10), and Majors to FTE BOR Appointed Faculty (#12).
The following benchmarks are used to determine health for Fill Rate:The following benchmarks are used to determine health for Fill Rate:
Healthy:Healthy: 75 – 100%75 – 100%Cautionary:Cautionary: 60 – 74%60 – 74%Unhealthy:Unhealthy: < 60%< 60%
An Overall Category Health Score is assigned where:An Overall Category Health Score is assigned where:
2 = Healthy2 = Healthy1 = Cautionary1 = Cautionary0 = Unhealthy0 = Unhealthy
2828
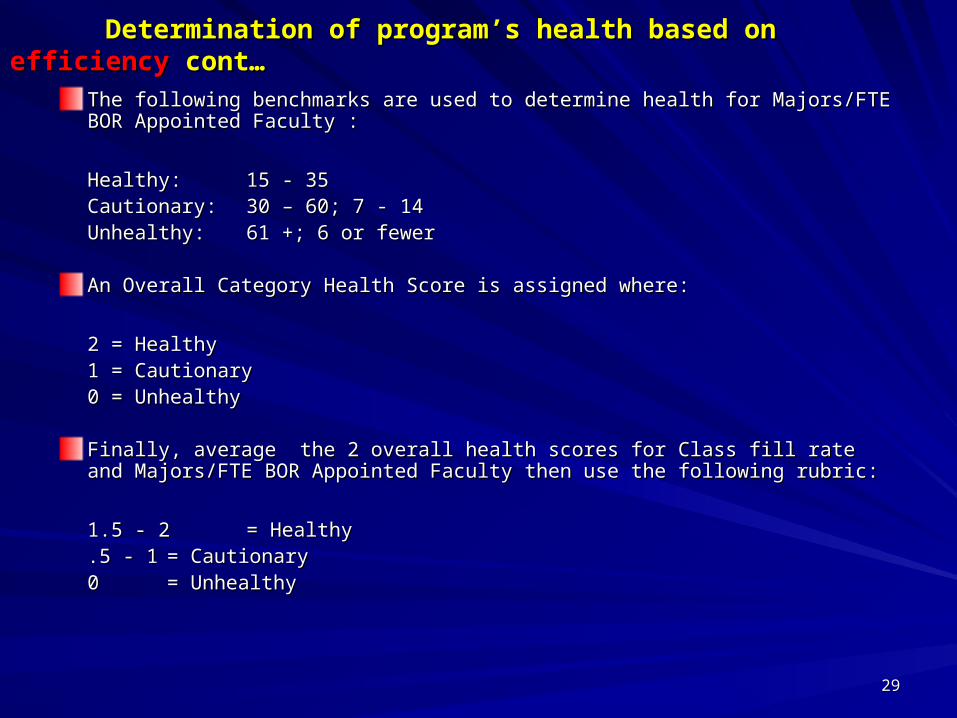
Determination of program’s health based on Determination of program’s health based on efficiencyefficiency cont… cont…
The following benchmarks are used to determine health for Majors/FTE BOR Appointed The following benchmarks are used to determine health for Majors/FTE BOR Appointed Faculty :Faculty :
Healthy:Healthy: 15 - 3515 - 35Cautionary:Cautionary: 30 – 60; 7 - 1430 – 60; 7 - 14Unhealthy:Unhealthy: 61 +; 6 or fewer61 +; 6 or fewer
An Overall Category Health Score is assigned where:An Overall Category Health Score is assigned where:
2 = Healthy2 = Healthy1 = Cautionary1 = Cautionary0 = Unhealthy0 = Unhealthy
Finally, average the 2 overall health scores for Class fill rate and Majors/FTE BOR Finally, average the 2 overall health scores for Class fill rate and Majors/FTE BOR Appointed Faculty then use the following rubric:Appointed Faculty then use the following rubric:
1.5 - 2 1.5 - 2 = Healthy= Healthy.5 - 1.5 - 1 = Cautionary= Cautionary00 = Unhealthy= Unhealthy
2929
#17#17 Successful Completion (Grades>=C)Successful Completion (Grades>=C)
The percentage of successful completions is new to our program The percentage of successful completions is new to our program review beginning in academic year 0809.review beginning in academic year 0809.
This is the percentage of students in program courses at Fall and This is the percentage of students in program courses at Fall and Spring census who at the end of the semester have earned a Spring census who at the end of the semester have earned a grades equivalent to “C” or higher.grades equivalent to “C” or higher.
3030
#18#18 Withdrawals (grade = W)Withdrawals (grade = W)
The percentage of withdrawals is new to our program review The percentage of withdrawals is new to our program review beginning in academic year 0809.beginning in academic year 0809.
This is the percentage of students actively enrolled as of Fall and This is the percentage of students actively enrolled as of Fall and Spring census, who at the end of the semester have a grade of “W”.Spring census, who at the end of the semester have a grade of “W”.
3131
#19#19 Persistence Fall to SpringPersistence Fall to Spring
Fall to Spring Persistence is the number of your program Fall to Spring Persistence is the number of your program majors (#3), who at subsequent spring semester are majors (#3), who at subsequent spring semester are enrolled and are still majors in the program at time of enrolled and are still majors in the program at time of census. census.
Example: Example: 31 majors start in Fall31 majors start in Fall
21 majors of the original 31 persist into Spring21 majors of the original 31 persist into Spring21/31 = .6774 or 67.74%21/31 = .6774 or 67.74%
3232
#20#20 Unduplicated Degrees/Certificates AwardedUnduplicated Degrees/Certificates Awarded
Unduplicated Degrees/Certificates Awarded is new to our program review beginning Unduplicated Degrees/Certificates Awarded is new to our program review beginning in academic year 0809. This is a count of your program majors that received either a in academic year 0809. This is a count of your program majors that received either a degree or a certificate, and is the measurement used in the determination of the degree or a certificate, and is the measurement used in the determination of the effectiveness health call.effectiveness health call.
Unlike other student data that is tracked within the academic year, Unlike other student data that is tracked within the academic year, degrees/certificates are awarded within the fiscal year. The UH Fiscal year begins degrees/certificates are awarded within the fiscal year. The UH Fiscal year begins July 1July 1stst and runs through June 30th. The system office tries to send us your data by and runs through June 30th. The system office tries to send us your data by August 15August 15thth. Since the degrees/certificate data has not been updated in the ODS by . Since the degrees/certificate data has not been updated in the ODS by that time we would normally not see degrees/certificates for 0809. that time we would normally not see degrees/certificates for 0809.
To account for this, a decision was made that the degrees/certificates data for 0809 To account for this, a decision was made that the degrees/certificates data for 0809 would come from summer of the previous year. In other words, the academic year would come from summer of the previous year. In other words, the academic year data you see for 0809 is actually summer 08, fall 08, and spring 09—not the data you see for 0809 is actually summer 08, fall 08, and spring 09—not the degrees/certificates earners in the 0809 traditional academic year (fall – spring – degrees/certificates earners in the 0809 traditional academic year (fall – spring – summer).summer).
3333
#20a#20a Number of Degrees AwardedNumber of Degrees Awarded
This is a count of credentials and shows duplicate credentials received by This is a count of credentials and shows duplicate credentials received by the same student. It is the number of degrees conferred by your program the same student. It is the number of degrees conferred by your program majors. majors.
Again, for 0809 it is the number of degrees conferred in the fiscal year, Again, for 0809 it is the number of degrees conferred in the fiscal year, Summer 08, Fall 08, and Spring 09.Summer 08, Fall 08, and Spring 09.
3434
#20b#20b Certificates of Achievement AwardedCertificates of Achievement Awarded
The number of certificates of achievement conferred by your program The number of certificates of achievement conferred by your program majors in the fiscal year.majors in the fiscal year.
For 0809 it is the number of CA certificates conferred in the fiscal year, For 0809 it is the number of CA certificates conferred in the fiscal year, Summer 08, Fall 08, and Spring 09.Summer 08, Fall 08, and Spring 09.
3535

#20c#20c Academic Subject Certificates AwardedAcademic Subject Certificates Awarded
The number of academic subject certificates conferred by your program The number of academic subject certificates conferred by your program majors in the fiscal year.majors in the fiscal year.
For 0809 it is the number of ASC certificates conferred in the fiscal year, For 0809 it is the number of ASC certificates conferred in the fiscal year, Summer 08, Fall 08, and Spring 09.Summer 08, Fall 08, and Spring 09.
3636
#20d#20d OtherOther Certificates AwardedCertificates Awarded
The number of certificates conferred by your program majors in the fiscal The number of certificates conferred by your program majors in the fiscal year except CA, and ASC.year except CA, and ASC.
For 0809 it is the number of certificates (except CA, and ASC ) conferred in For 0809 it is the number of certificates (except CA, and ASC ) conferred in the fiscal year, Summer 08, Fall 08, and Spring 09.the fiscal year, Summer 08, Fall 08, and Spring 09.
3737
#21#21 Transfers to UH 4-yr programsTransfers to UH 4-yr programs
This is the number of your program majors (#3) with home campus This is the number of your program majors (#3) with home campus at UH Manoa, UH West Oahu, or UH Hilo for the first time in Fall at UH Manoa, UH West Oahu, or UH Hilo for the first time in Fall 08…08…
Who, prior to Fall 08 had a UH Community College as home Who, prior to Fall 08 had a UH Community College as home campus.campus.
A student is included in the count of program transfers in as many A student is included in the count of program transfers in as many programs in which they have been a major at the college.programs in which they have been a major at the college.
3838
#21a#21a Transfers with degree from programTransfers with degree from program
Students included in #21 (transfers to UH 4-year) who have Students included in #21 (transfers to UH 4-year) who have received a degree from the community college program prior to received a degree from the community college program prior to transfer.transfer.
3939
#21b#21b Transfers without degree from programTransfers without degree from program
Students included in #21 (transfers to UH 4-year) who have not Students included in #21 (transfers to UH 4-year) who have not received a degree from the community college program prior to received a degree from the community college program prior to transfer.transfer.
4040
Determination of program’s health based on Determination of program’s health based on effectivenesseffectiveness
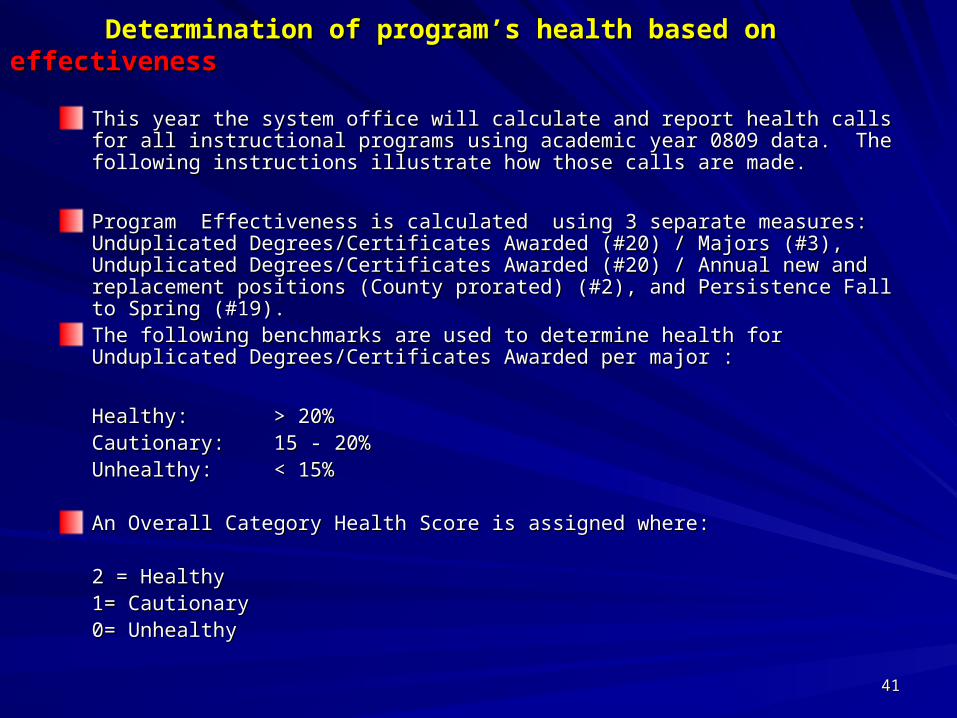
This year the system office will calculate and report health calls for all instructional This year the system office will calculate and report health calls for all instructional programs using academic year 0809 data. The following instructions illustrate how programs using academic year 0809 data. The following instructions illustrate how those calls are made.those calls are made.
Program Effectiveness is calculated using 3 separate measures: Unduplicated Program Effectiveness is calculated using 3 separate measures: Unduplicated Degrees/Certificates Awarded (#20) / Majors (#3), Unduplicated Degrees/Certificates Degrees/Certificates Awarded (#20) / Majors (#3), Unduplicated Degrees/Certificates Awarded (#20) / Annual new and replacement positions (County prorated) (#2), and Awarded (#20) / Annual new and replacement positions (County prorated) (#2), and Persistence Fall to Spring (#19).Persistence Fall to Spring (#19).The following benchmarks are used to determine health for Unduplicated The following benchmarks are used to determine health for Unduplicated Degrees/Certificates Awarded per major :Degrees/Certificates Awarded per major :
Healthy:Healthy: > 20%> 20%Cautionary:Cautionary: 15 - 20%15 - 20%Unhealthy:Unhealthy: < 15%< 15%
An Overall Category Health Score is assigned where:An Overall Category Health Score is assigned where:
2 = Healthy2 = Healthy1= Cautionary1= Cautionary0= Unhealthy0= Unhealthy
4141
Determination of program’s health based on Determination of program’s health based on effectivenesseffectiveness cont… cont…
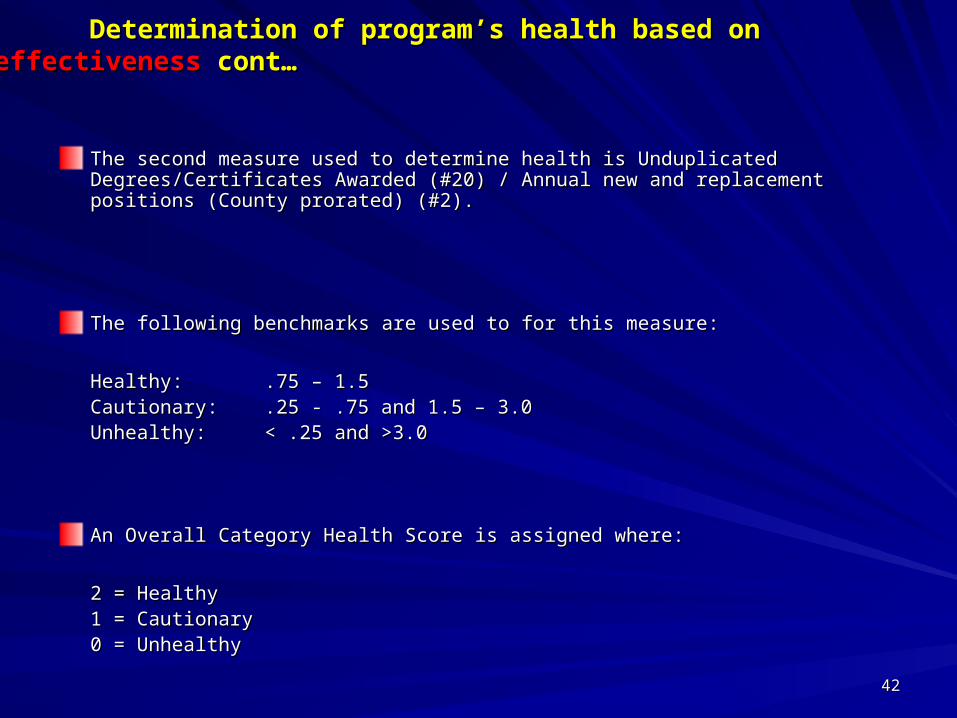
The second measure used to determine health is Unduplicated Degrees/Certificates The second measure used to determine health is Unduplicated Degrees/Certificates Awarded (#20) / Annual new and replacement positions (County prorated) (#2).Awarded (#20) / Annual new and replacement positions (County prorated) (#2).
The following benchmarks are used to for this measure:The following benchmarks are used to for this measure:
Healthy:Healthy: .75 – 1.5.75 – 1.5Cautionary:Cautionary: .25 - .75 and 1.5 – 3.0.25 - .75 and 1.5 – 3.0Unhealthy:Unhealthy: < .25 and >3.0< .25 and >3.0
An Overall Category Health Score is assigned where:An Overall Category Health Score is assigned where:
2 = Healthy2 = Healthy1 = Cautionary1 = Cautionary0 = Unhealthy0 = Unhealthy
4242
Determination of program’s health based on Determination of program’s health based on effectivenesseffectiveness cont… cont…
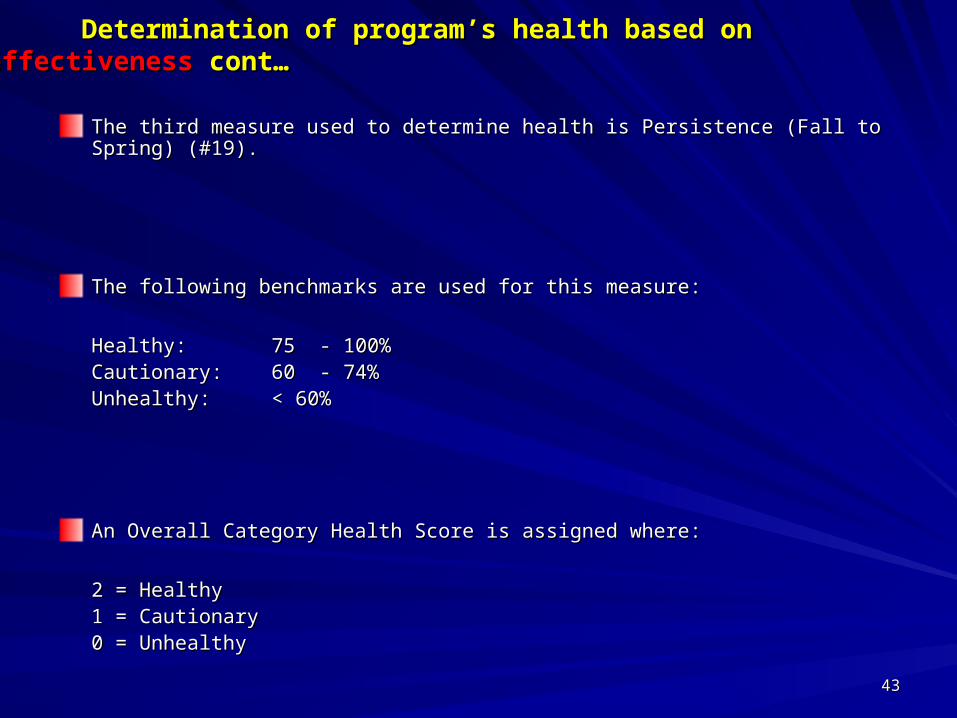
The third measure used to determine health is Persistence (Fall to Spring) (#19).The third measure used to determine health is Persistence (Fall to Spring) (#19).
The following benchmarks are used for this measure:The following benchmarks are used for this measure:
Healthy:Healthy: 75 - 100%75 - 100%Cautionary:Cautionary: 60 - 74%60 - 74%Unhealthy:Unhealthy: < 60%< 60%
An Overall Category Health Score is assigned where:An Overall Category Health Score is assigned where:
2 = Healthy2 = Healthy1 = Cautionary1 = Cautionary0 = Unhealthy0 = Unhealthy
4343
Determination of program’s health based on Determination of program’s health based on effectivenesseffectiveness cont… cont…
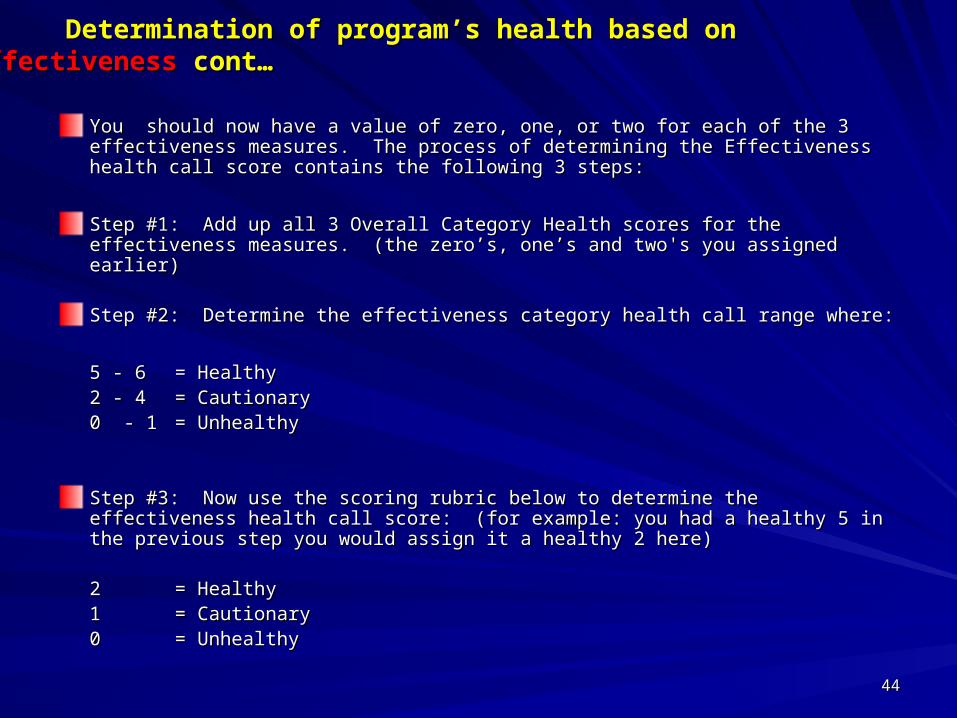
You should now have a value of zero, one, or two for each of the 3 effectiveness You should now have a value of zero, one, or two for each of the 3 effectiveness measures. The process of determining the Effectiveness health call score contains the measures. The process of determining the Effectiveness health call score contains the following 3 steps:following 3 steps:
Step #1: Add up all 3 Overall Category Health scores for the effectiveness measures. Step #1: Add up all 3 Overall Category Health scores for the effectiveness measures. (the zero’s, one’s and two's you assigned earlier)(the zero’s, one’s and two's you assigned earlier)
Step #2: Determine the effectiveness category health call range where:Step #2: Determine the effectiveness category health call range where:
5 - 6 5 - 6 = Healthy= Healthy2 - 4 2 - 4 = Cautionary= Cautionary0 - 1 0 - 1 = Unhealthy= Unhealthy
Step #3: Now use the scoring rubric below to determine the effectiveness health call Step #3: Now use the scoring rubric below to determine the effectiveness health call score: (for example: you had a healthy 5 in the previous step you would assign it a score: (for example: you had a healthy 5 in the previous step you would assign it a healthy 2 here)healthy 2 here)
2 2 = Healthy= Healthy1 1 = Cautionary= Cautionary0 0 = Unhealthy= Unhealthy
4444
Determination of program’s Determination of program’s overalloverall health health
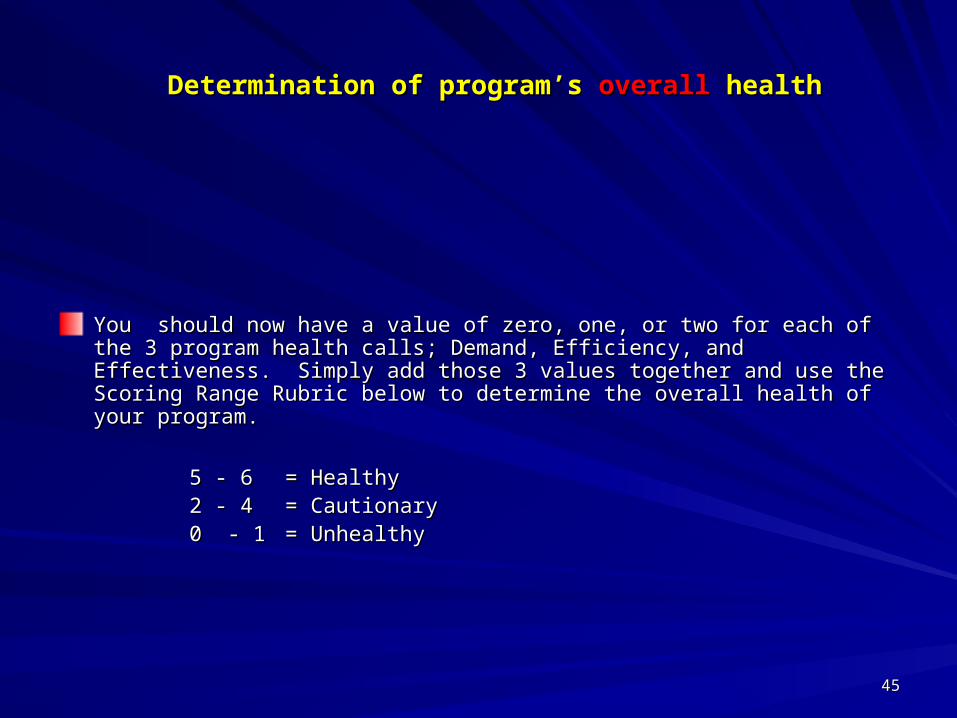
You should now have a value of zero, one, or two for each of the 3 program health You should now have a value of zero, one, or two for each of the 3 program health calls; Demand, Efficiency, and Effectiveness. Simply add those 3 values together calls; Demand, Efficiency, and Effectiveness. Simply add those 3 values together and use the Scoring Range Rubric below to determine the overall health of your and use the Scoring Range Rubric below to determine the overall health of your program.program.
5 - 6 5 - 6 = Healthy= Healthy2 - 4 2 - 4 = Cautionary= Cautionary0 - 1 0 - 1 = Unhealthy= Unhealthy
4545
#22#22 Number of Distance Education Classes TaughtNumber of Distance Education Classes Taught
The number of distance education classes taught is new to our The number of distance education classes taught is new to our program review beginning in academic year 0809.program review beginning in academic year 0809.
Measures the number of classes taught using the mode of delivery, Measures the number of classes taught using the mode of delivery, “Distance Completely On-Line” (DCO).“Distance Completely On-Line” (DCO).
If the method of instruction for teaching your class was determined If the method of instruction for teaching your class was determined to be Distance Education, the college will indicate the mode of to be Distance Education, the college will indicate the mode of delivery, in this case Distance Completely On-Line.delivery, in this case Distance Completely On-Line.
4646
#23#23 Enrollment Distance Education ClassesEnrollment Distance Education Classes
The enrollment in distance education classes is new to our program The enrollment in distance education classes is new to our program review beginning in academic year 0809.review beginning in academic year 0809.
Distance Completely On-Line ClassesDistance Completely On-Line Classes
As of Fall and Spring census, the number of students actively As of Fall and Spring census, the number of students actively enrolled in all classes owned by the program and identified as enrolled in all classes owned by the program and identified as Distance Completely On-Line.Distance Completely On-Line.
4747
#24#24 Fill RateFill Rate
The fill rate for distance education classes is new to our program The fill rate for distance education classes is new to our program review beginning in academic year 0809.review beginning in academic year 0809.
Distance Completely On Line ClassesDistance Completely On Line Classes
Fill rate is total student registrations in DCO program classes Fill rate is total student registrations in DCO program classes (number of seats filled) divided by the maximum enrollments (number of seats filled) divided by the maximum enrollments (number of seats offered).(number of seats offered).
Taken at Fall and Spring census for 0809.Taken at Fall and Spring census for 0809.
4848
#25#25 Successful Completion (Grade>=C)Successful Completion (Grade>=C)
The percentage of successful completions in distance education The percentage of successful completions in distance education classes is new to our program review beginning in academic year classes is new to our program review beginning in academic year 0809.0809.
Distance Completely On Line ClassesDistance Completely On Line Classes
This is the percentage of students in DCO program courses at Fall This is the percentage of students in DCO program courses at Fall and Spring census who at the end of the semester have earned a and Spring census who at the end of the semester have earned a grades equivalent to “C” or higher.grades equivalent to “C” or higher.
4949
#26#26 Withdrawals (Grade=W)Withdrawals (Grade=W)
The percentage of withdrawals in distance education classes is new The percentage of withdrawals in distance education classes is new to our program review beginning in academic year 0809.to our program review beginning in academic year 0809.
Distance Completely On Line ClassesDistance Completely On Line Classes
This is the percentage of students actively enrolled in DCO classes This is the percentage of students actively enrolled in DCO classes as of Fall and Spring census, who at the end of the semester have a as of Fall and Spring census, who at the end of the semester have a grade of “W”.grade of “W”.
5050
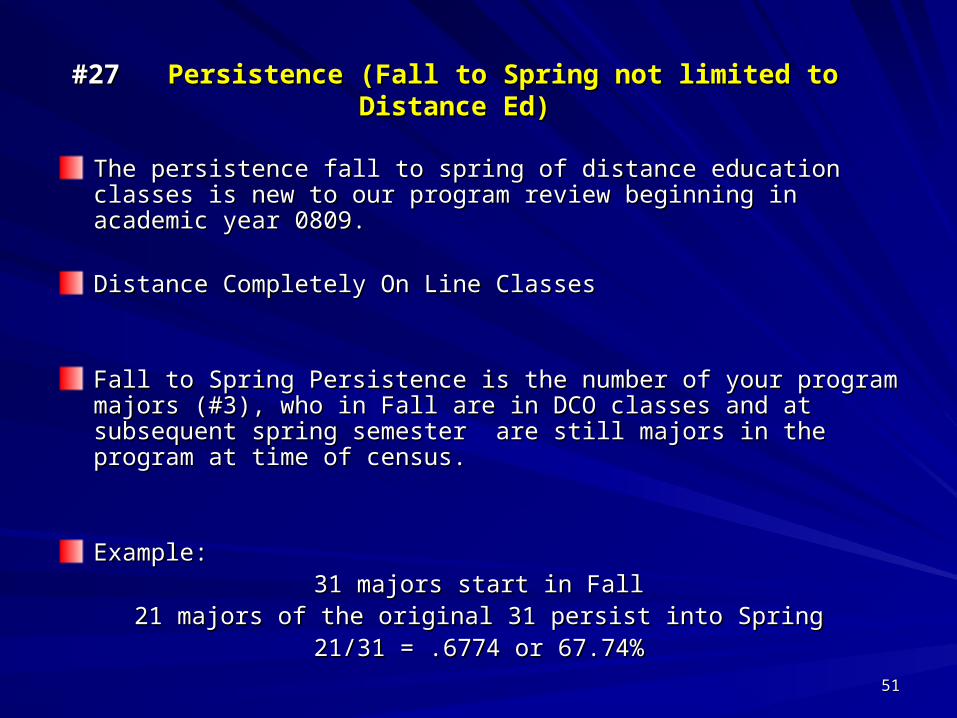
#27#27 Persistence (Fall to Spring not limited to Distance Ed)Persistence (Fall to Spring not limited to Distance Ed)
The persistence fall to spring of distance education classes is new to our The persistence fall to spring of distance education classes is new to our program review beginning in academic year 0809.program review beginning in academic year 0809.
Distance Completely On Line ClassesDistance Completely On Line Classes
Fall to Spring Persistence is the number of your program majors (#3), who Fall to Spring Persistence is the number of your program majors (#3), who in Fall are in DCO classes and at subsequent spring semester are still in Fall are in DCO classes and at subsequent spring semester are still majors in the program at time of census. majors in the program at time of census.
Example: Example: 31 majors start in Fall31 majors start in Fall
21 majors of the original 31 persist into Spring21 majors of the original 31 persist into Spring21/31 = .6774 or 67.74%21/31 = .6774 or 67.74%
5151
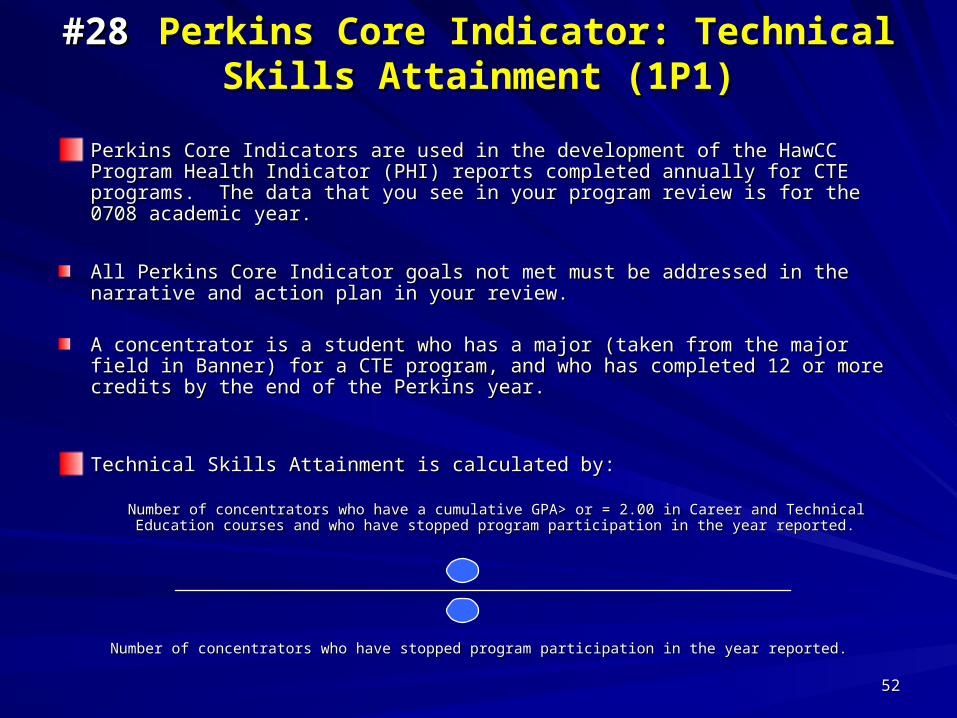
#28#28 Perkins Core Indicator: Technical Skills Perkins Core Indicator: Technical Skills Attainment (1P1)Attainment (1P1)
Perkins Core Indicators are used in the development of the HawCC Program Health Perkins Core Indicators are used in the development of the HawCC Program Health Indicator (PHI) reports completed annually for CTE programs. The data that you see Indicator (PHI) reports completed annually for CTE programs. The data that you see in your program review is for the 0708 academic year.in your program review is for the 0708 academic year.
All Perkins Core Indicator goals not met must be addressed in the narrative and All Perkins Core Indicator goals not met must be addressed in the narrative and action plan in your review.action plan in your review.
A concentrator is a student who has a major (taken from the major field in Banner) for A concentrator is a student who has a major (taken from the major field in Banner) for a CTE program, and who has completed 12 or more credits by the end of the Perkins a CTE program, and who has completed 12 or more credits by the end of the Perkins year.year.
Technical Skills Attainment is calculated by:Technical Skills Attainment is calculated by:
Number of concentrators who have a cumulative GPA> or =Number of concentrators who have a cumulative GPA> or = 2.00 in Career and Technical Education courses and 2.00 in Career and Technical Education courses and who have stopped program participation in the year reported.who have stopped program participation in the year reported.
Number of concentrators who have stopped program participation in the year reported.Number of concentrators who have stopped program participation in the year reported.5252
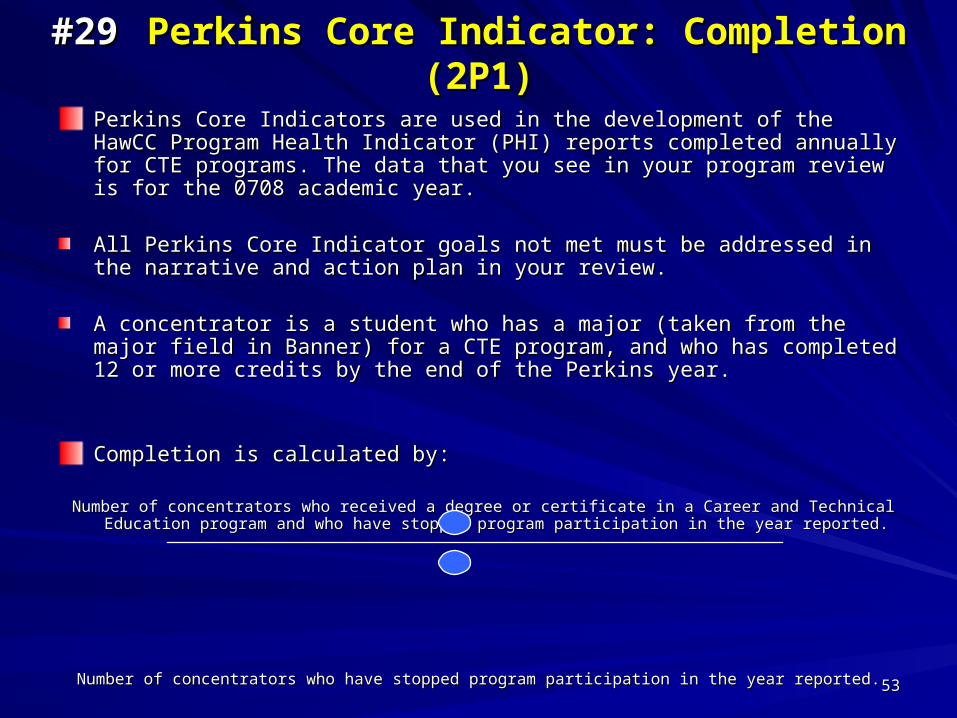
#29#29 Perkins Core Indicator: Completion (2P1)Perkins Core Indicator: Completion (2P1)
Perkins Core Indicators are used in the development of the HawCC Program Health Perkins Core Indicators are used in the development of the HawCC Program Health Indicator (PHI) reports completed annually for CTE programs. The data that you see Indicator (PHI) reports completed annually for CTE programs. The data that you see in your program review is for the 0708 academic year.in your program review is for the 0708 academic year.
All Perkins Core Indicator goals not met must be addressed in the narrative and All Perkins Core Indicator goals not met must be addressed in the narrative and action plan in your review.action plan in your review.
A concentrator is a student who has a major (taken from the major field in Banner) for A concentrator is a student who has a major (taken from the major field in Banner) for a CTE program, and who has completed 12 or more credits by the end of the Perkins a CTE program, and who has completed 12 or more credits by the end of the Perkins year.year.
Completion is calculated by:Completion is calculated by:
Number of concentrators who received a degree or certificate in a Career and Technical Education program and who Number of concentrators who received a degree or certificate in a Career and Technical Education program and who have stopped program participation in the year reported.have stopped program participation in the year reported.
Number of concentrators who have stopped program participation in the year reported.Number of concentrators who have stopped program participation in the year reported.
5353
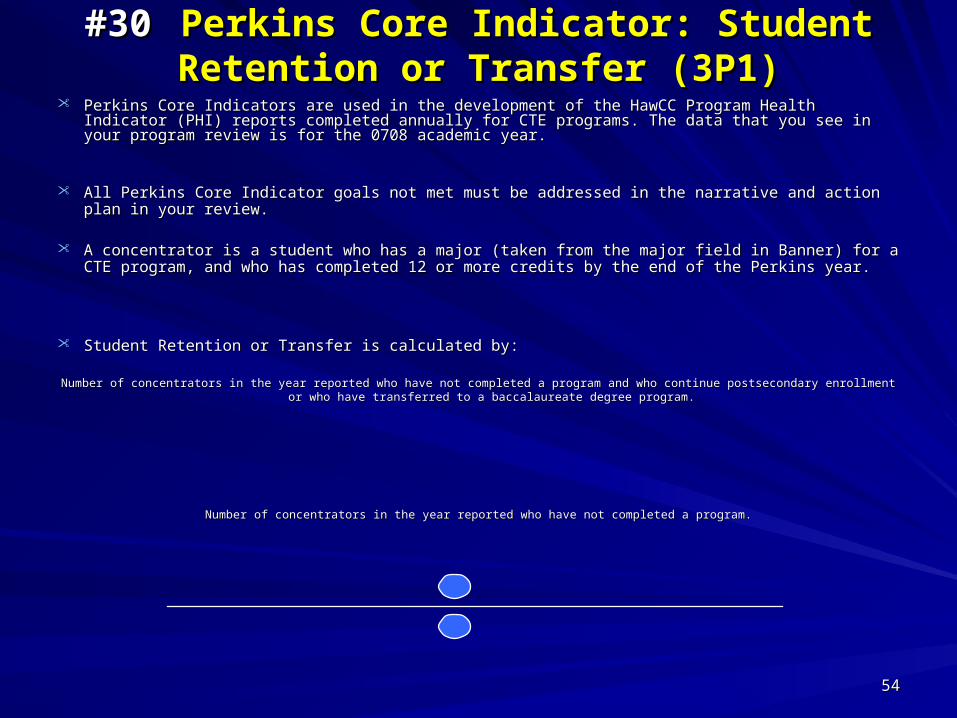
#30#30 Perkins Core Indicator: Student Retention or Perkins Core Indicator: Student Retention or Transfer (3P1)Transfer (3P1)
Perkins Core Indicators are used in the development of the HawCC Program Health Indicator (PHI) reports Perkins Core Indicators are used in the development of the HawCC Program Health Indicator (PHI) reports completed annually for CTE programs. The data that you see in your program review is for the 0708 completed annually for CTE programs. The data that you see in your program review is for the 0708 academic year.academic year.
All Perkins Core Indicator goals not met must be addressed in the narrative and action plan in your review.All Perkins Core Indicator goals not met must be addressed in the narrative and action plan in your review.
A concentrator is a student who has a major (taken from the major field in Banner) for a CTE program, and A concentrator is a student who has a major (taken from the major field in Banner) for a CTE program, and who has completed 12 or more credits by the end of the Perkins year.who has completed 12 or more credits by the end of the Perkins year.
Student Retention or Transfer is calculated by:Student Retention or Transfer is calculated by:
Number of concentrators in the year reported who have not completed a program and who continue postsecondary enrollment or who have transferred Number of concentrators in the year reported who have not completed a program and who continue postsecondary enrollment or who have transferred to a baccalaureate degree program.to a baccalaureate degree program.
Number of concentrators in the year reported who have not completed a program.Number of concentrators in the year reported who have not completed a program.
5454
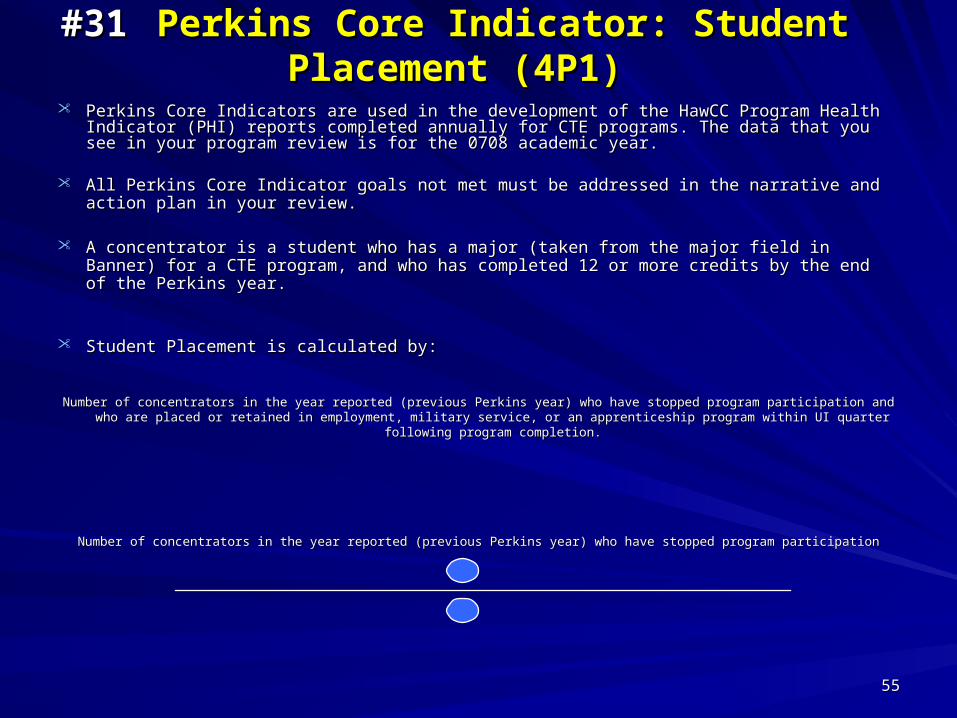
#31#31 Perkins Core Indicator: Student Placement Perkins Core Indicator: Student Placement (4P1)(4P1)
Perkins Core Indicators are used in the development of the HawCC Program Health Indicator Perkins Core Indicators are used in the development of the HawCC Program Health Indicator (PHI) reports completed annually for CTE programs. The data that you see in your program review (PHI) reports completed annually for CTE programs. The data that you see in your program review is for the 0708 academic year.is for the 0708 academic year.
All Perkins Core Indicator goals not met must be addressed in the narrative and action plan in your All Perkins Core Indicator goals not met must be addressed in the narrative and action plan in your review.review.
A concentrator is a student who has a major (taken from the major field in Banner) for a CTE A concentrator is a student who has a major (taken from the major field in Banner) for a CTE program, and who has completed 12 or more credits by the end of the Perkins year.program, and who has completed 12 or more credits by the end of the Perkins year.
Student Placement is calculated by:Student Placement is calculated by:
Number of concentrators in the year reported (previous Perkins year) who have stopped program participation and who are placed or Number of concentrators in the year reported (previous Perkins year) who have stopped program participation and who are placed or retained in employment, military service, or an apprenticeship program within UI quarter following program completion.retained in employment, military service, or an apprenticeship program within UI quarter following program completion.
Number of concentrators in the year reported (previous Perkins year) who have stopped program participationNumber of concentrators in the year reported (previous Perkins year) who have stopped program participation
5555
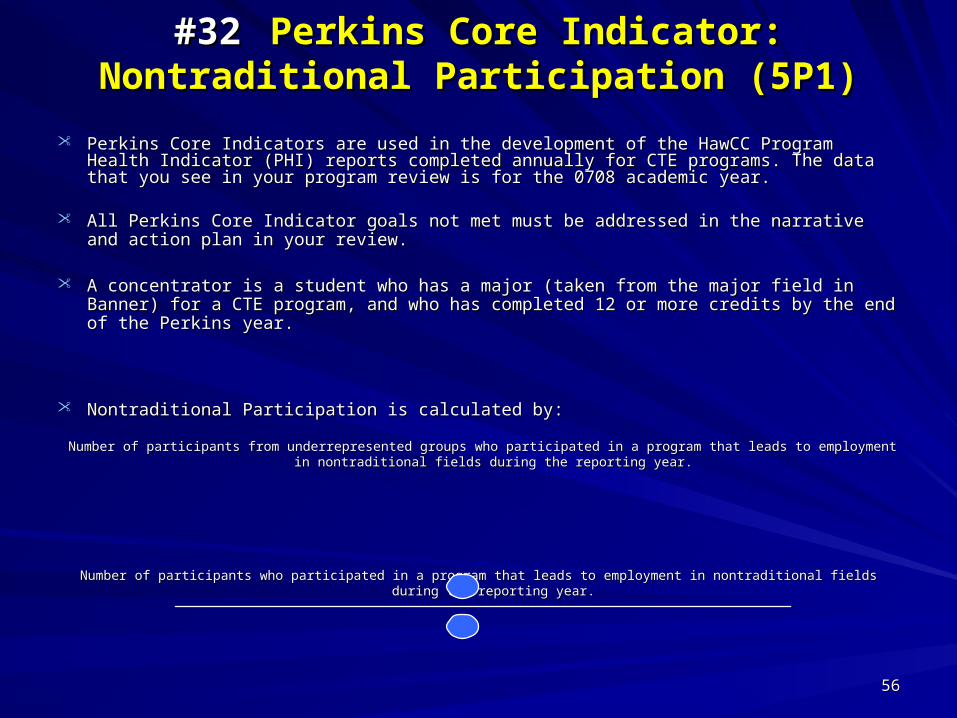
#32#32 Perkins Core Indicator: Nontraditional Perkins Core Indicator: Nontraditional Participation (5P1)Participation (5P1)
Perkins Core Indicators are used in the development of the HawCC Program Health Indicator Perkins Core Indicators are used in the development of the HawCC Program Health Indicator (PHI) reports completed annually for CTE programs. The data that you see in your program (PHI) reports completed annually for CTE programs. The data that you see in your program review is for the 0708 academic year.review is for the 0708 academic year.
All Perkins Core Indicator goals not met must be addressed in the narrative and action plan in All Perkins Core Indicator goals not met must be addressed in the narrative and action plan in your review.your review.
A concentrator is a student who has a major (taken from the major field in Banner) for a CTE A concentrator is a student who has a major (taken from the major field in Banner) for a CTE program, and who has completed 12 or more credits by the end of the Perkins year.program, and who has completed 12 or more credits by the end of the Perkins year.
Nontraditional Participation is calculated by:Nontraditional Participation is calculated by:
Number of participants from underrepresented groups who participated in a program that leads to employment in nontraditional Number of participants from underrepresented groups who participated in a program that leads to employment in nontraditional fields during the reporting year.fields during the reporting year.
Number of participants who participated in a program that leads to employment in nontraditional fields during the reporting year.Number of participants who participated in a program that leads to employment in nontraditional fields during the reporting year.
5656
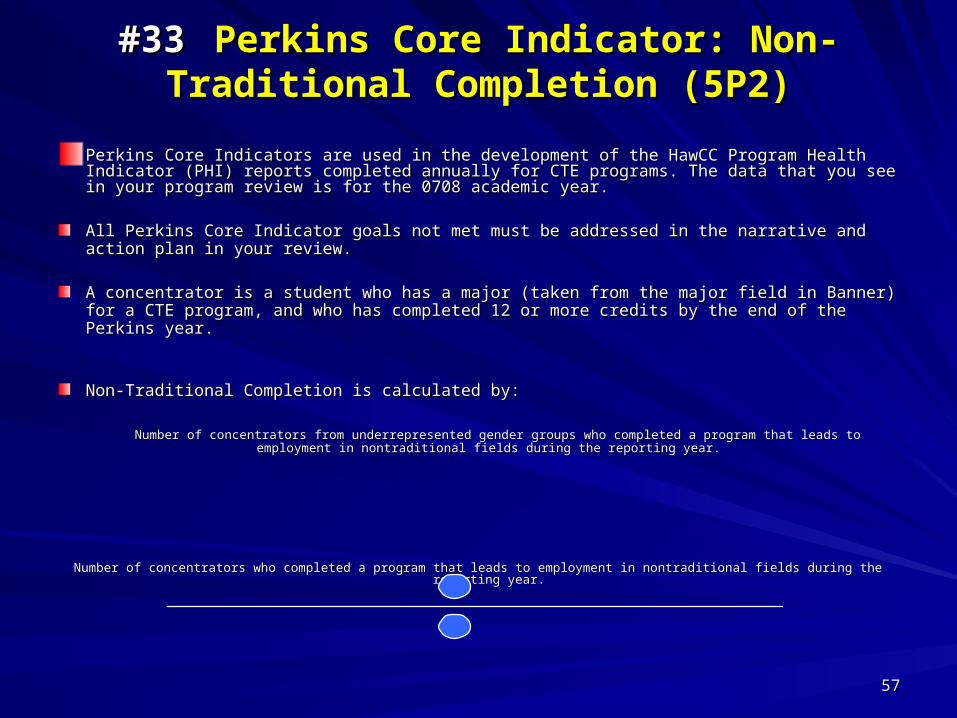
#33#33 Perkins Core Indicator: Non-Traditional Perkins Core Indicator: Non-Traditional Completion (5P2)Completion (5P2)
Perkins Core Indicators are used in the development of the HawCC Program Health Indicator (PHI) Perkins Core Indicators are used in the development of the HawCC Program Health Indicator (PHI) reports completed annually for CTE programs. The data that you see in your program review is for reports completed annually for CTE programs. The data that you see in your program review is for the 0708 academic year.the 0708 academic year.
All Perkins Core Indicator goals not met must be addressed in the narrative and action plan in your All Perkins Core Indicator goals not met must be addressed in the narrative and action plan in your review.review.
A concentrator is a student who has a major (taken from the major field in Banner) for a CTE A concentrator is a student who has a major (taken from the major field in Banner) for a CTE program, and who has completed 12 or more credits by the end of the Perkins year.program, and who has completed 12 or more credits by the end of the Perkins year.
Non-Traditional Completion is calculated by:Non-Traditional Completion is calculated by:
Number of concentrators from underrepresented gender groups who completed a program that leads to employment in Number of concentrators from underrepresented gender groups who completed a program that leads to employment in nontraditional fields during the reporting year. nontraditional fields during the reporting year.
Number of concentrators who completed a program that leads to employment in nontraditional fields during the reporting year. Number of concentrators who completed a program that leads to employment in nontraditional fields during the reporting year.
5757
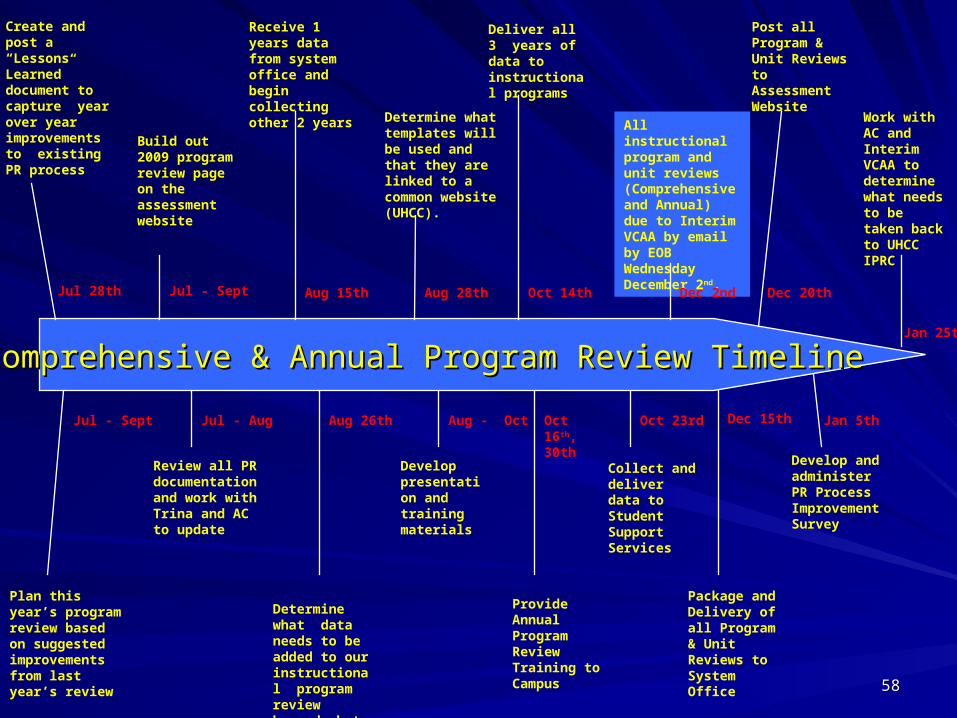
Comprehensive & Annual Program Review TimelineComprehensive & Annual Program Review Timeline
Develop presentation and training materials
Provide Annual Program Review Training to Campus
Package and Delivery of all Program & Unit Reviews to System Office
Post all Program & Unit Reviews to Assessment Website
Aug 26th
All instructional program and unit reviews (Comprehensive and Annual) due to Interim VCAA by email by EOB Wednesday December 2nd.
Deliver all 3 years of data to instructional programs
Collect and deliver data to Student Support Services
Build out 2009 program review page on the assessment website
Plan this year’s program review based on suggested improvements from last year’s review
Create and post a “Lessons Learned” document to capture year over year improvements to existing PR process
Determine what templates will be used and that they are linked to a common website (UHCC).
Review all PR documentation and work with Trina and AC to update
Determine what data needs to be added to our instructional program review beyond what system delivers
Develop and administer PR Process Improvement Survey
Work with AC and Interim VCAA to determine what needs to be taken back to UHCC IPRC
Receive 1 years data from system office and begin collecting other 2 years
Aug 15th
Dec 15thOct 16th, 30th
Aug 28th
Jul - Sept
Jul 28th
Jan 5th
Dec 20th
Jan 25th
Jul - Aug Aug - Oct
Jul - Sept Dec 2ndOct 14th
Oct 23rd
5858
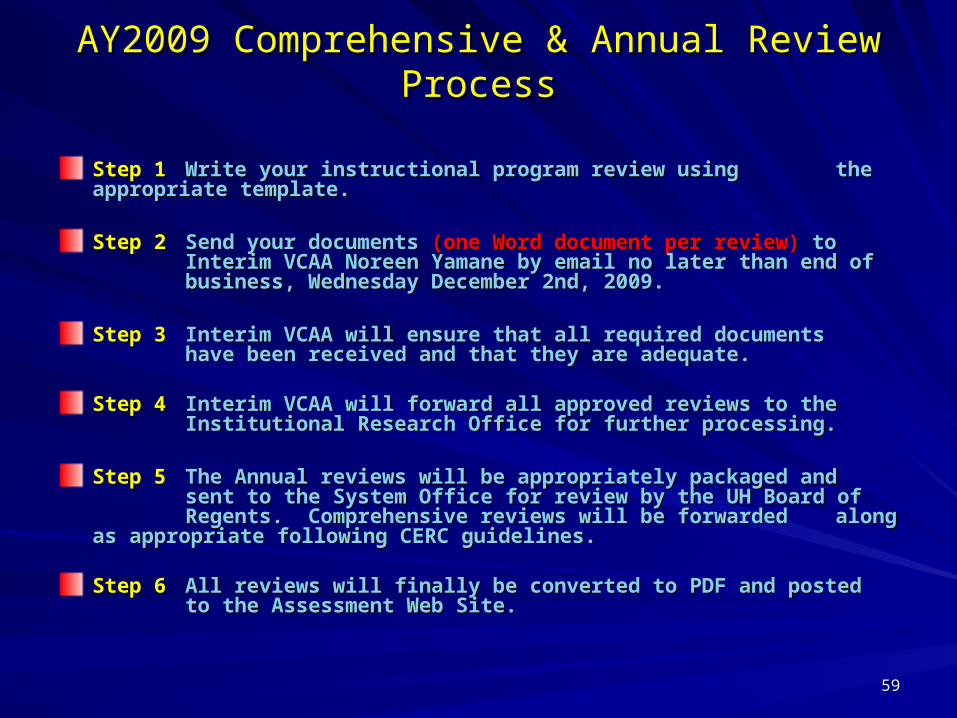
AY2009 Comprehensive & Annual Review ProcessAY2009 Comprehensive & Annual Review Process
Step 1Step 1 Write your instructional program review using Write your instructional program review using the appropriate template.the appropriate template.
Step 2Step 2 Send yourSend your documents documents (one Word document per review) (one Word document per review) to to Interim VCAA Noreen Yamane by email no later than end of Interim VCAA Noreen Yamane by email no later than end of business, Wednesday December 2nd, 2009. business, Wednesday December 2nd, 2009.
Step 3Step 3 Interim VCAA will ensure that all required documents Interim VCAA will ensure that all required documents have been received and that they are adequate.have been received and that they are adequate.
Step 4Step 4 Interim VCAA will forward all approved reviews to the Interim VCAA will forward all approved reviews to the Institutional Research Office for further processing.Institutional Research Office for further processing.
Step 5Step 5 The Annual reviews will be appropriately packaged and The Annual reviews will be appropriately packaged and sent to the System Office for review by the UH Board of sent to the System Office for review by the UH Board of Regents. Comprehensive reviews will be forwarded Regents. Comprehensive reviews will be forwarded along as appropriate following CERC guidelines.along as appropriate following CERC guidelines.
Step 6Step 6 All reviews will finally be converted to PDF and posted All reviews will finally be converted to PDF and posted to the Assessment Web Site.to the Assessment Web Site.
5959

Questions?Questions?The intention of this presentation was to provide a single source for all of the The intention of this presentation was to provide a single source for all of the documentation related to the Comprehensive & Annual Program Review documentation related to the Comprehensive & Annual Program Review process. I have linked all of the documents you should need directly into process. I have linked all of the documents you should need directly into this presentation.this presentation.
For additional details on instructional data elements see: For additional details on instructional data elements see:
UHCC Annual Instructional Program Review GlossaryUHCC Annual Instructional Program Review Glossary
If you need more information on this process please feel free to contact me:If you need more information on this process please feel free to contact me:
Shawn FloodShawn Flood 974-7512974-7512
Mahalo!Mahalo!
6060