Embed Size (px)
Citation preview
AXA OYAK
2006 Annual Report
Be Life Confident

AXA OYAK
CONTENTS
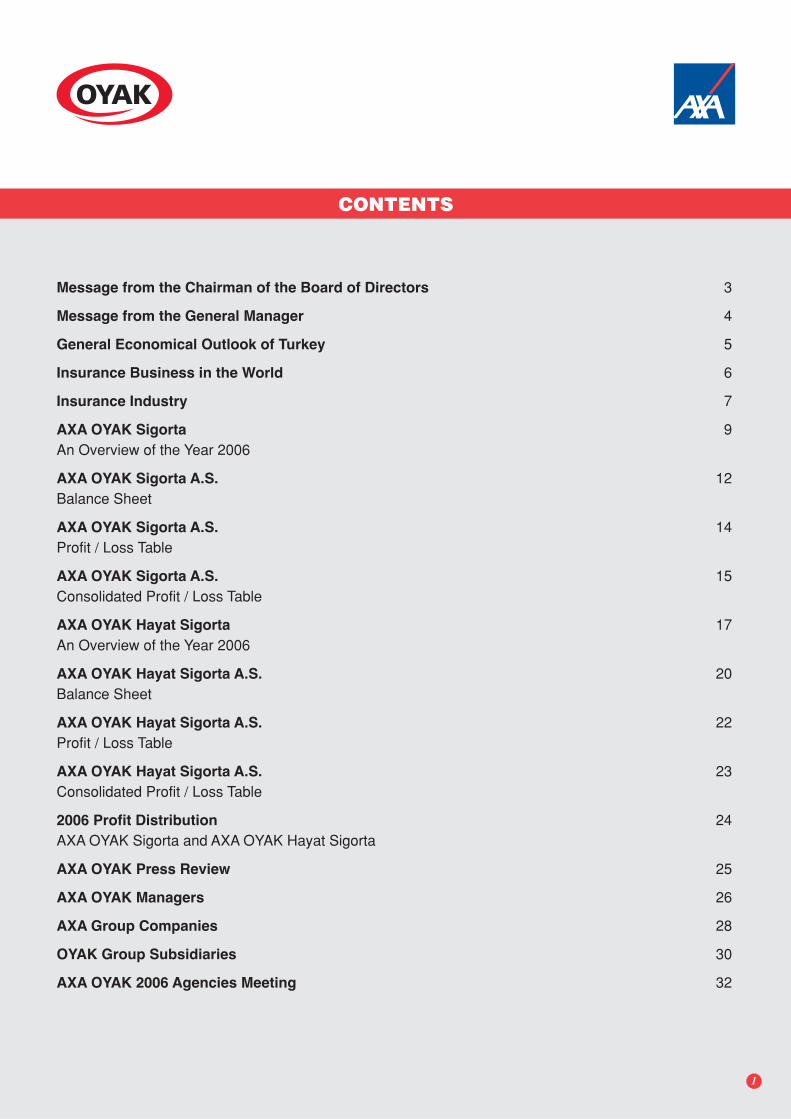
Message from the Chairman of the Board of Directors 3
Message from the General Manager 4
General Economical Outlook of Turkey 5
Insurance Business in the World 6
Insurance Industry 7
AXA OYAK Sigorta 9An Overview of the Year 2006
AXA OYAK Sigorta A.S. 12Balance Sheet
AXA OYAK Sigorta A.S. 14Profit / Loss Table
AXA OYAK Sigorta A.S. 15Consolidated Profit / Loss Table
AXA OYAK Hayat Sigorta 17An Overview of the Year 2006
AXA OYAK Hayat Sigorta A.S. 20Balance Sheet
AXA OYAK Hayat Sigorta A.S. 22Profit / Loss Table
AXA OYAK Hayat Sigorta A.S. 23Consolidated Profit / Loss Table
2006 Profit Distribution 24AXA OYAK Sigorta and AXA OYAK Hayat Sigorta
AXA OYAK Press Review 25
AXA OYAK Managers 26
AXA Group Companies 28
OYAK Group Subsidiaries 30
AXA OYAK 2006 Agencies Meeting 32
1

12 3
4 5 67 8
Hakk› Cemal ErerdiAXA OYAK General Manager
8
2
1 Dr. Ali Caner ÖnerAXA OYAK Member of the Board
2 Prof. Dr. Ali Hüsrev BozerAXA OYAK Member of the Board
3 Dinç K›z›ldemirAXA OYAK Member of the Board
4 Dr. Mehmet Ayd›n Müderriso¤luAXA OYAK Chairman of the Board
5 Jean Raymond T. AbatAXA OYAK Member of the Board
6 Elie SissoAXA OYAK Member of the Board
7 Nurhan ÖzdamarAXA OYAK Member of the Board
Fahrettin Do¤anAXA OYAKMember of Auditing Committee
Fatma Canl›AXA OYAK
Member of Auditing Committee
Paolo Andrea RossiAXA OYAK Member of the BoardHe is not in the Photograph
AXA OYAK
MESSAGE FROM THE CHAIRMAN OF THE BOARD OF DIRECTORS
Dear AXA OYAK employees,
2006 has been a year of economic growth for the world,
where developed countries showed a 3% growth and
developing countries a 7.9% growth rate. Growth in the
worlds 3 largest economies, USA, EU and Japan materialised
at 3.3%, 2.6% and 2.2% respectively. The main reason
behind the growth in these economies has been the 9%
increase in world trade volume. On the other hand the year
2006 has seen an increase in economical risk. The trend
in increasing inflation has been at the forefront of this risk,
inflation rates for developed countries reached the 2.3%
level while developing countries reached 5.3%. Another risk
has been the increasing budget deficit of the largest
economies in the world. While America had a budget deficit
of 3.8%, Japan's was 5% and Europe's deficit materialised
at 2%. Current account deficit is also another risk that has
been identified; America's economy is faced with a current
account deficit of 800 billion USD. It is of great interest on
how America will close this deficit in 2007. It is widely
accepted that the world economy will be affected by
America's performance in 2007.
When looking at Turkey's economy we are able to see that
the consecutive growth in the past 4 years has continued
in 2006. Turkey will have to be more cautious in the coming
period as this unprecedented performance in the economy
has been coupled together with an increasing current
account deficit and its inability to reach its targeted inflation
rate. It is also widely expected that politics will also affect
the economy due to the upcoming elections in May and
November 2007.
Written premium in the insurance sector for 2006 materialised
at 9.5 billion TRY. According to the 7.8 billion TRY written
premium in the 2005 the sector grew by 21%, considerably
higher than the inflation rate (CPI: 9.65%). The consistent
real growth in our country's insurance sector leads us to
have an optimistic view for the future; however the insurance
sector is changing its "shell". Although the sector showed
real growth in 2006 it was unable to show the same
performance in profitability, a high proportion of companies
and various business classes even showed considerable
losses. With technical profitability nearing 0%, we are able
to see that better potential customer targeting techniques
and better use of management systems will not only increase
the efficiency of the sector but will also add value to it. The
increase in foreign interest in the Turkish insurance sector
in 2006 can be put down to this opportunity and need. If
we return to our company we are able to see that
AXA OYAK Sigorta produce a premium of 945 million TRY
making it the second largest company with a market share
of 12%. AXA OYAK Hayat was able to enter the top 5
companies with a premium production of 127 million TRY.
In a fiercely competitive environment both our companies
showed great financial performance with excellent profitability
results.
Since 2003 the newly organised management has worked
towards internal organisation and restructuring in order to
bring about the necessary change for effective
professionalism and efficient working mentality under the
roof of AXA OYAK. Due to this customer and agency
satisfaction has been increased and our aim is to develop
the necessary measures in order to maintain this success
and to implement them as soon as possible.
I give my gratitude firstly to our customers, staff, agencies
and affiliates for contributing to the success of the company
in a difficult year.
M. Ayd›n MÜDERR‹SO⁄LU
AXA OYAK Holding Chairman of the Board
3
AXA OYAK
MESSAGE FROM THE GENERAL MANAGERApart from the general success seen in 2006 we are ableto identify two important successes that stand out from therest, firstly, the position fire insurance has come to in thepast 4 years and secondly the technical profit in cascoinsurance. With the strategies employed for fire insuranceby AXA OYAK Sigorta the company has been able toincrease its market share from 9.3% to 14.24%, moving itfrom 5th position to the market leader in 4 years. Byemploying intelligent politics and segmentation in Cascoinsurance AXA OYAK became the only company to makea profit in this business class in 2006.
AXA OYAK Group is aware that our success is related tohow much we are able to decrease prices on insurancepolicies while increasing the service quality offered to ourcustomers. We do not share the view that in a freecompetition environment "Competitiveness should not bein price but in service quality". In parallel to our understandingwe are constantly working to decrease our costs in all fieldsin order to give our agencies an advantage and to researchhow we might reflect this towards our end customer.
I truly believe that AXA OYAK Companies will remainfinancially powerful, stand behind their promises, pay theirclaims on time, be innovative and increase their strongcreative identity and performance.
H. Cemal ERERD‹
AXA OYAK Holding General Manager
4
AXA OYAK Sigorta Return on Capital
Non-Life Sector Return on Capital
AXA OYAK Hayat Sigorta Return on Capital
Life Sector Return on Capital
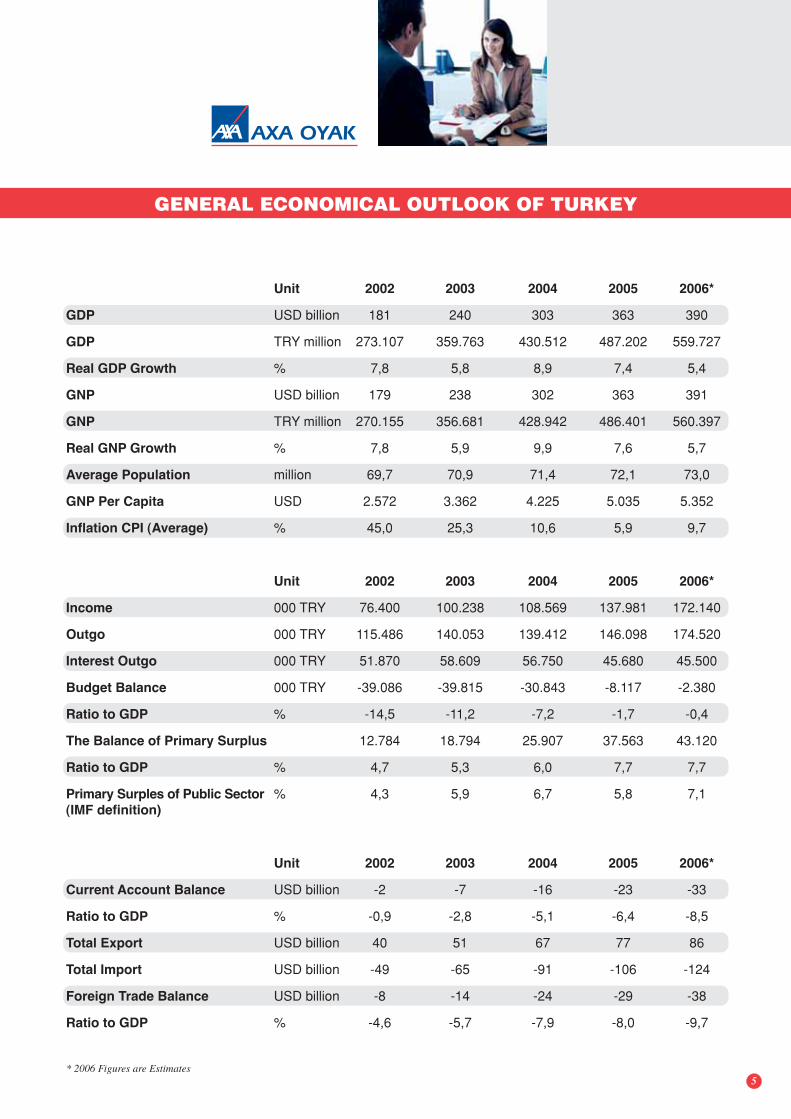
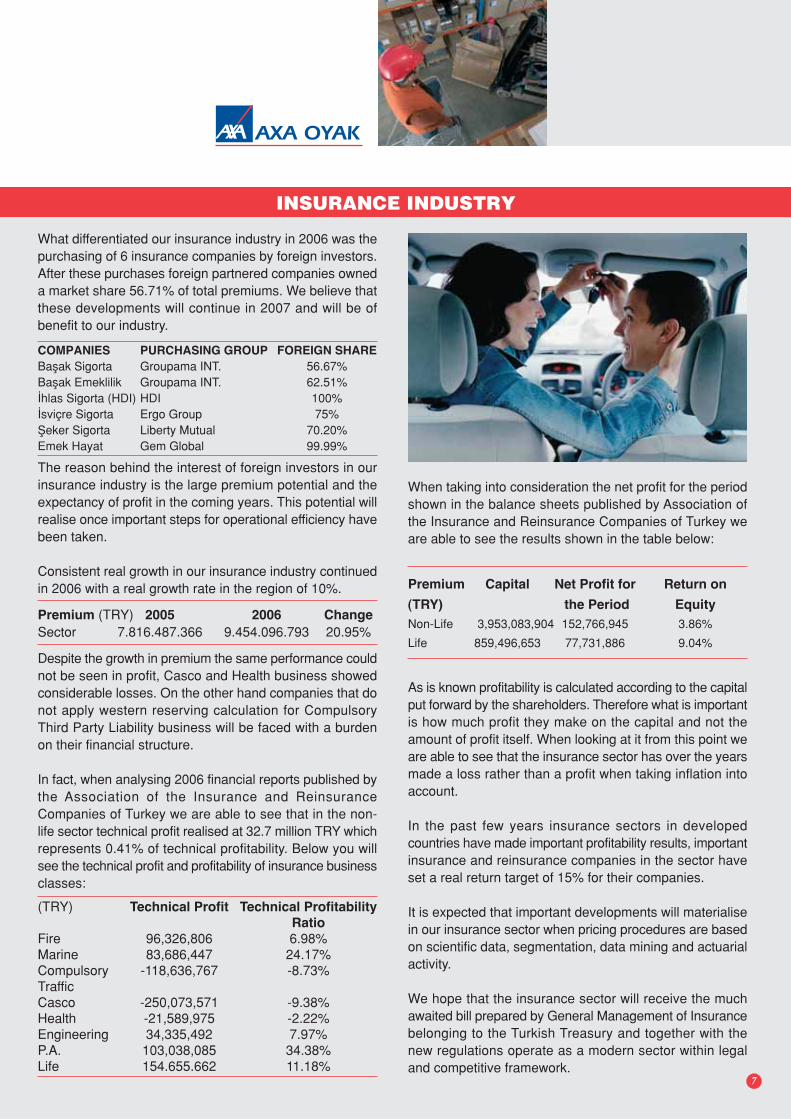
2006 has been a successful year for the AXA OYAK Group.Along with premium growth, profitability has also shownimportant developments. While the insurance sector had areturn on equity of 4.7% for 2006, AXA OYAK Sigorta hada ratio of 33.9% with AXA OYAK Hayat's materialising at35.5%. While the total technical profit of all the insurancecompanies operating in the non-life business branchesmaterialised at 26.6 billion TRY, AXA OYAK Sigorta had atechnical profit of 57.0 billion TRY (218% of the sectorsprofit), this clearly shows the extent of the company'ssuccess.
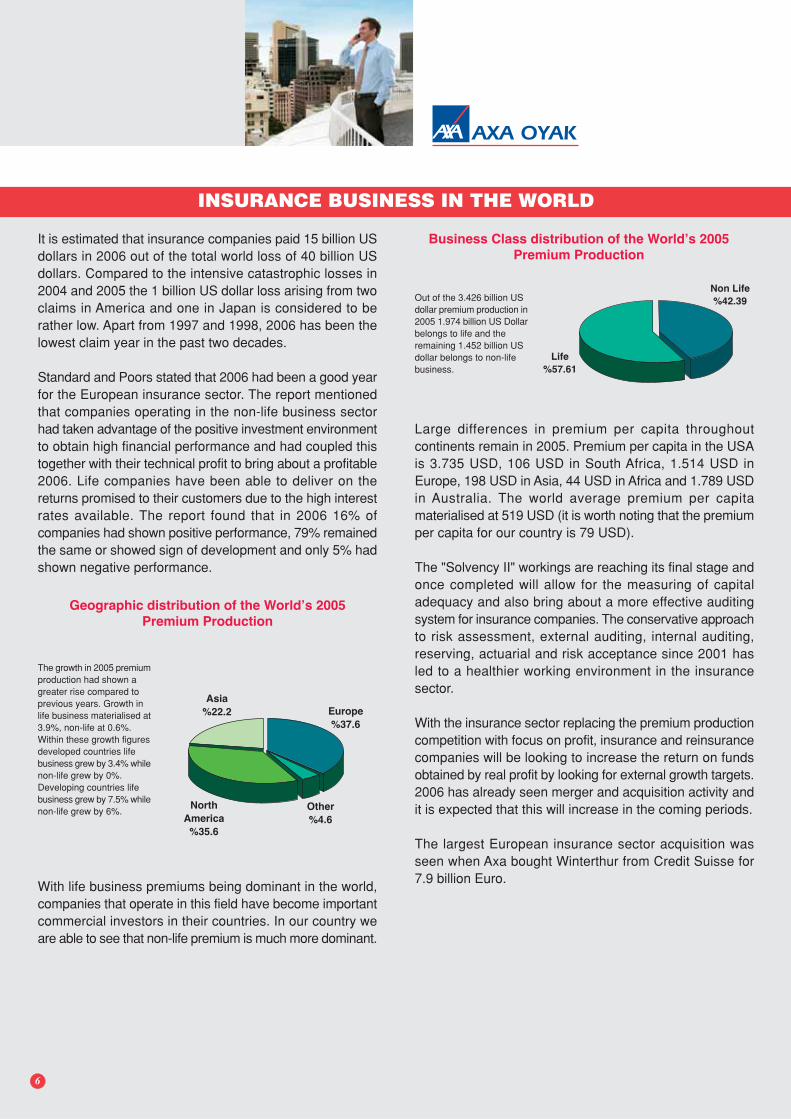
The development of our companies profit between 2002and 2006 is quite fascinating, premium has increased 2fold since 2002 and net profit has increased by 9.4 times.The reason behind the success of AXA OYAK (a uniquegroup employing the "profitable growth" understanding) hasbeen its employees and agencies which have embracedand applied the important changes needed for success.Due to the fierce competition in the market the companyinitially faced difficulties when taking decisions consideredto be radical, however we are now in a position to takeadvantage of these decisions due to the positive results wehave seen by incorporating differentiation and using it asa competitive advantage. Because of this we are able tolook to the future with more optimistic expectations.
AXA OYAK GroupPremium
AXA OYAK GroupNet Profit
AXA OYAK
Unit 2002 2003 2004 2005 2006*
GDP USD billion 181 240 303 363 390
GDP TRY million 273.107 359.763 430.512 487.202 559.727
Real GDP Growth % 7,8 5,8 8,9 7,4 5,4
GNP USD billion 179 238 302 363 391
GNP TRY million 270.155 356.681 428.942 486.401 560.397
Real GNP Growth % 7,8 5,9 9,9 7,6 5,7
Average Population million 69,7 70,9 71,4 72,1 73,0
GNP Per Capita USD 2.572 3.362 4.225 5.035 5.352
Inflation CPI (Average) % 45,0 25,3 10,6 5,9 9,7
Unit 2002 2003 2004 2005 2006*
Income 000 TRY 76.400 100.238 108.569 137.981 172.140
Outgo 000 TRY 115.486 140.053 139.412 146.098 174.520
Interest Outgo 000 TRY 51.870 58.609 56.750 45.680 45.500
Budget Balance 000 TRY -39.086 -39.815 -30.843 -8.117 -2.380
Ratio to GDP % -14,5 -11,2 -7,2 -1,7 -0,4
The Balance of Primary Surplus 12.784 18.794 25.907 37.563 43.120
Ratio to GDP % 4,7 5,3 6,0 7,7 7,7
Primary Surples of Public Sector % 4,3 5,9 6,7 5,8 7,1(IMF definition)
Unit 2002 2003 2004 2005 2006*
Current Account Balance USD billion -2 -7 -16 -23 -33
Ratio to GDP % -0,9 -2,8 -5,1 -6,4 -8,5
Total Export USD billion 40 51 67 77 86
Total Import USD billion -49 -65 -91 -106 -124
Foreign Trade Balance USD billion -8 -14 -24 -29 -38
Ratio to GDP % -4,6 -5,7 -7,9 -8,0 -9,7
GENERAL ECONOMICAL OUTLOOK OF TURKEY
5* 2006 Figures are Estimates
Large differences in premium per capita throughoutcontinents remain in 2005. Premium per capita in the USAis 3.735 USD, 106 USD in South Africa, 1.514 USD inEurope, 198 USD in Asia, 44 USD in Africa and 1.789 USDin Australia. The world average premium per capitamaterialised at 519 USD (it is worth noting that the premiumper capita for our country is 79 USD).
The "Solvency II" workings are reaching its final stage andonce completed will allow for the measuring of capitaladequacy and also bring about a more effective auditingsystem for insurance companies. The conservative approachto risk assessment, external auditing, internal auditing,reserving, actuarial and risk acceptance since 2001 hasled to a healthier working environment in the insurancesector.
With the insurance sector replacing the premium productioncompetition with focus on profit, insurance and reinsurancecompanies will be looking to increase the return on fundsobtained by real profit by looking for external growth targets.2006 has already seen merger and acquisition activity andit is expected that this will increase in the coming periods.
The largest European insurance sector acquisition wasseen when Axa bought Winterthur from Credit Suisse for7.9 billion Euro.
AXA OYAK
It is estimated that insurance companies paid 15 billion USdollars in 2006 out of the total world loss of 40 billion USdollars. Compared to the intensive catastrophic losses in2004 and 2005 the 1 billion US dollar loss arising from twoclaims in America and one in Japan is considered to berather low. Apart from 1997 and 1998, 2006 has been thelowest claim year in the past two decades.
Standard and Poors stated that 2006 had been a good yearfor the European insurance sector. The report mentionedthat companies operating in the non-life business sectorhad taken advantage of the positive investment environmentto obtain high financial performance and had coupled thistogether with their technical profit to bring about a profitable2006. Life companies have been able to deliver on thereturns promised to their customers due to the high interestrates available. The report found that in 2006 16% ofcompanies had shown positive performance, 79% remainedthe same or showed sign of development and only 5% hadshown negative performance.
INSURANCE BUSINESS IN THE WORLD
With life business premiums being dominant in the world,companies that operate in this field have become importantcommercial investors in their countries. In our country weare able to see that non-life premium is much more dominant.
Asia
%22.2 Europe
%37.6
Other
%4.6
North
America
%35.6
Life
%57.61
Non Life
%42.39
6
Geographic distribution of the World’s 2005
Premium Production
The growth in 2005 premiumproduction had shown agreater rise compared toprevious years. Growth inlife business materialised at3.9%, non-life at 0.6%.Within these growth figuresdeveloped countries lifebusiness grew by 3.4% whilenon-life grew by 0%.Developing countries lifebusiness grew by 7.5% whilenon-life grew by 6%.
Business Class distribution of the World’s 2005
Premium Production
Out of the 3.426 billion USdollar premium production in2005 1.974 billion US Dollarbelongs to life and theremaining 1.452 billion USdollar belongs to non-lifebusiness.
AXA OYAK
INSURANCE INDUSTRY
What differentiated our insurance industry in 2006 was thepurchasing of 6 insurance companies by foreign investors.After these purchases foreign partnered companies owneda market share 56.71% of total premiums. We believe thatthese developments will continue in 2007 and will be ofbenefit to our industry.
COMPANIES PURCHASING GROUP FOREIGN SHARE
Baflak Sigorta Groupama INT. 56.67%Baflak Emeklilik Groupama INT. 62.51%‹hlas Sigorta (HDI) HDI 100%‹sviçre Sigorta Ergo Group 75%fieker Sigorta Liberty Mutual 70.20%Emek Hayat Gem Global 99.99%
The reason behind the interest of foreign investors in ourinsurance industry is the large premium potential and theexpectancy of profit in the coming years. This potential willrealise once important steps for operational efficiency havebeen taken.
Consistent real growth in our insurance industry continuedin 2006 with a real growth rate in the region of 10%. Premium Capital Net Profit for Return on
(TRY) the Period Equity
Non-Life 3,953,083,904 152,766,945 3.86%
Life 859,496,653 77,731,886 9.04%
7
When taking into consideration the net profit for the periodshown in the balance sheets published by Association ofthe Insurance and Reinsurance Companies of Turkey weare able to see the results shown in the table below:
Premium (TRY) 2005 2006 Change
Sector 7.816.487.366 9.454.096.793 20.95%
Despite the growth in premium the same performance couldnot be seen in profit, Casco and Health business showedconsiderable losses. On the other hand companies that donot apply western reserving calculation for CompulsoryThird Party Liability business will be faced with a burdenon their financial structure.
In fact, when analysing 2006 financial reports published bythe Association of the Insurance and ReinsuranceCompanies of Turkey we are able to see that in the non-life sector technical profit realised at 32.7 million TRY whichrepresents 0.41% of technical profitability. Below you willsee the technical profit and profitability of insurance businessclasses:
(TRY) Technical Profit Technical Profitability
Ratio
Fire 96,326,806 6.98%Marine 83,686,447 24.17%Compulsory -118,636,767 -8.73%TrafficCasco -250,073,571 -9.38%Health -21,589,975 -2.22%Engineering 34,335,492 7.97%P.A. 103,038,085 34.38%Life 154.655.662 11.18%
As is known profitability is calculated according to the capitalput forward by the shareholders. Therefore what is importantis how much profit they make on the capital and not theamount of profit itself. When looking at it from this point weare able to see that the insurance sector has over the yearsmade a loss rather than a profit when taking inflation intoaccount.
In the past few years insurance sectors in developedcountries have made important profitability results, importantinsurance and reinsurance companies in the sector haveset a real return target of 15% for their companies.
It is expected that important developments will materialisein our insurance sector when pricing procedures are basedon scientific data, segmentation, data mining and actuarialactivity.
We hope that the insurance sector will receive the muchawaited bill prepared by General Management of Insurancebelonging to the Turkish Treasury and together with thenew regulations operate as a modern sector within legaland competitive framework.

8
AXA OYAK SIGORTA
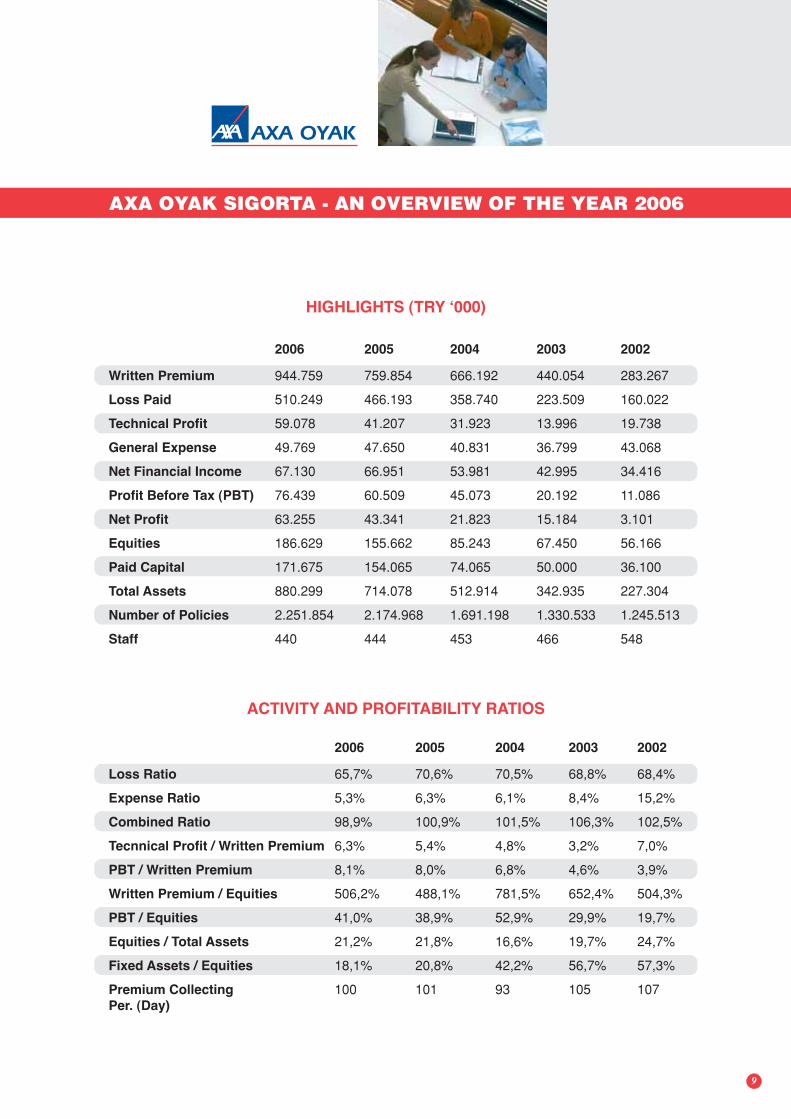
2006 2005 2004 2003 2002
Written Premium 944.759 759.854 666.192 440.054 283.267
Loss Paid 510.249 466.193 358.740 223.509 160.022
Technical Profit 59.078 41.207 31.923 13.996 19.738
General Expense 49.769 47.650 40.831 36.799 43.068
Net Financial Income 67.130 66.951 53.981 42.995 34.416
Profit Before Tax (PBT) 76.439 60.509 45.073 20.192 11.086
Net Profit 63.255 43.341 21.823 15.184 3.101
Equities 186.629 155.662 85.243 67.450 56.166
Paid Capital 171.675 154.065 74.065 50.000 36.100
Total Assets 880.299 714.078 512.914 342.935 227.304
Number of Policies 2.251.854 2.174.968 1.691.198 1.330.533 1.245.513
Staff 440 444 453 466 548
HIGHLIGHTS (TRY ‘000)
ACTIVITY AND PROFITABILITY RATIOS
2006 2005 2004 2003 2002
Loss Ratio 65,7% 70,6% 70,5% 68,8% 68,4%
Expense Ratio 5,3% 6,3% 6,1% 8,4% 15,2%
Combined Ratio 98,9% 100,9% 101,5% 106,3% 102,5%
Tecnnical Profit / Written Premium 6,3% 5,4% 4,8% 3,2% 7,0%
PBT / Written Premium 8,1% 8,0% 6,8% 4,6% 3,9%
Written Premium / Equities 506,2% 488,1% 781,5% 652,4% 504,3%
PBT / Equities 41,0% 38,9% 52,9% 29,9% 19,7%
Equities / Total Assets 21,2% 21,8% 16,6% 19,7% 24,7%
Fixed Assets / Equities 18,1% 20,8% 42,2% 56,7% 57,3%
Premium Collecting 100 101 93 105 107Per. (Day)
AXA OYAK
AXA OYAK SIGORTA - AN OVERVIEW OF THE YEAR 2006
9
AXA OYAK
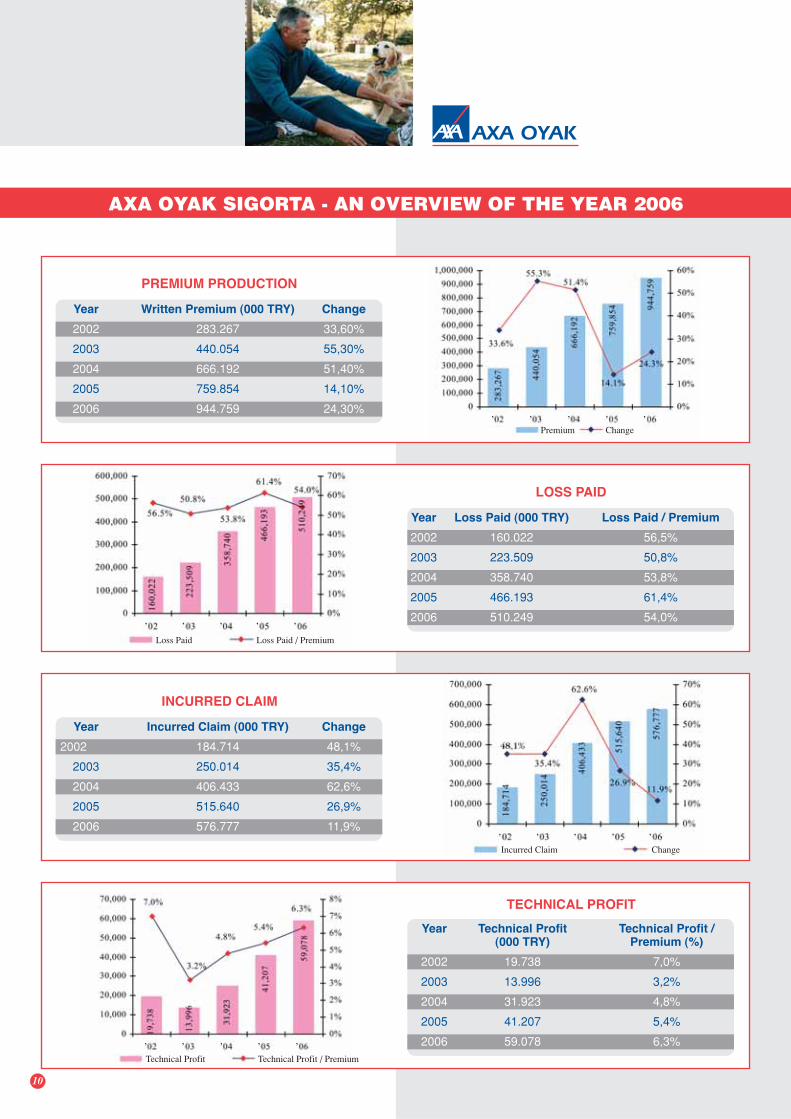
Year Written Premium (000 TRY) Change
2002 283.267 33,60%
2003 440.054 55,30%
2004 666.192 51,40%
2005 759.854 14,10%
2006 944.759 24,30%
PREMIUM PRODUCTION
Year Loss Paid (000 TRY) Loss Paid / Premium
2002 160.022 56,5%
2003 223.509 50,8%
2004 358.740 53,8%
2005 466.193 61,4%
2006 510.249 54,0%
LOSS PAID
Year Incurred Claim (000 TRY) Change
2002 184.714 48,1%
2003 250.014 35,4%
2004 406.433 62,6%
2005 515.640 26,9%
2006 576.777 11,9%
INCURRED CLAIM
Year Technical Profit Technical Profit /(000 TRY) Premium (%)
2002 19.738 7,0%
2003 13.996 3,2%
2004 31.923 4,8%
2005 41.207 5,4%
2006 59.078 6,3%
TECHNICAL PROFIT
10
‚ ‚ ‚ ‚ ‚
‚ ‚ ‚ ‚ ‚
‚ ‚ ‚ ‚ ‚
‚ ‚ ‚ ‚ ‚
Premium Change
Loss Paid Loss Paid / Premium
Incurred Claim Change
Technical Profit Technical Profit / Premium
AXA OYAK SIGORTA - AN OVERVIEW OF THE YEAR 2006
AXA OYAK
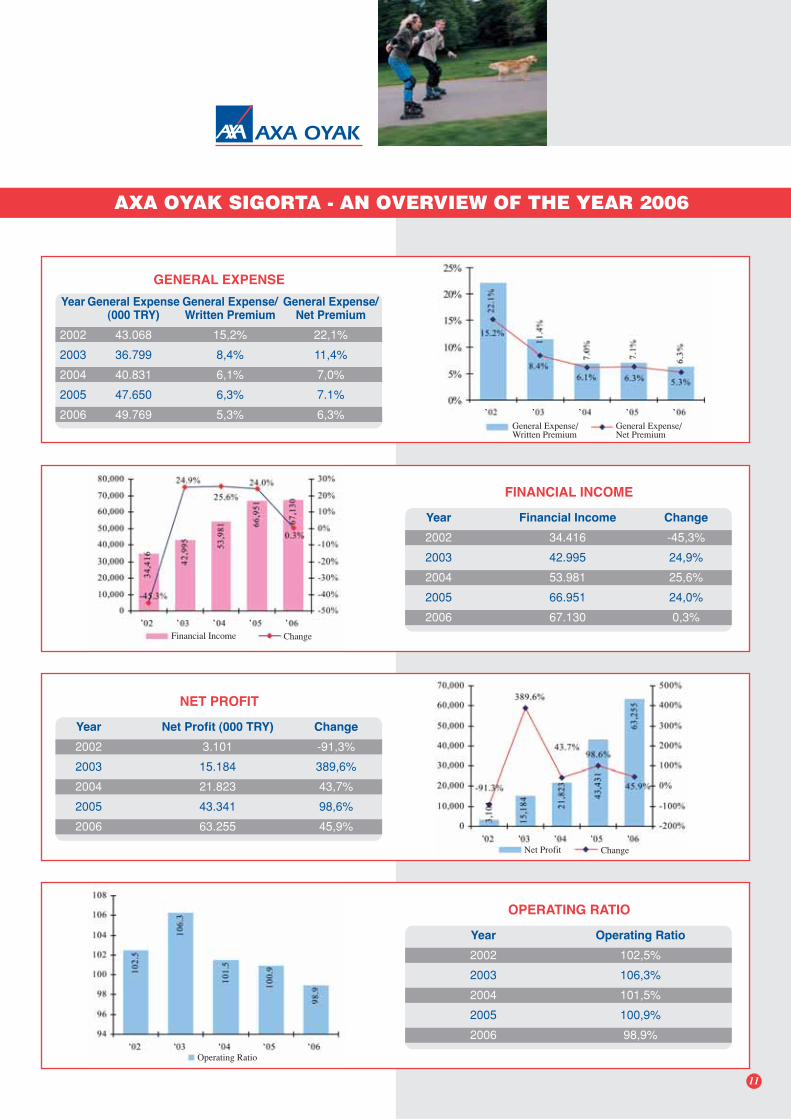
GENERAL EXPENSE
Year General Expense General Expense/ General Expense/(000 TRY) Written Premium Net Premium
2002 43.068 15,2% 22,1%
2003 36.799 8,4% 11,4%
2004 40.831 6,1% 7,0%
2005 47.650 6,3% 7.1%
2006 49.769 5,3% 6,3%
FINANCIAL INCOME
Year Financial Income Change
2002 34.416 -45,3%
2003 42.995 24,9%
2004 53.981 25,6%
2005 66.951 24,0%
2006 67.130 0,3%
NET PROFIT
Year Net Profit (000 TRY) Change
2002 3.101 -91,3%
2003 15.184 389,6%
2004 21.823 43,7%
2005 43.341 98,6%
2006 63.255 45,9%
Year Operating Ratio
2002 102,5%
2003 106,3%
2004 101,5%
2005 100,9%
2006 98,9%
OPERATING RATIO
11
‚ ‚ ‚ ‚ ‚
‚ ‚ ‚ ‚ ‚
‚ ‚ ‚ ‚ ‚
‚ ‚ ‚ ‚ ‚
General Expense/Written Premium
General Expense/Net Premium
Financial Income Change
Net Profit Change
Operating Ratio
AXA OYAK SIGORTA - AN OVERVIEW OF THE YEAR 2006
AXA OYAK
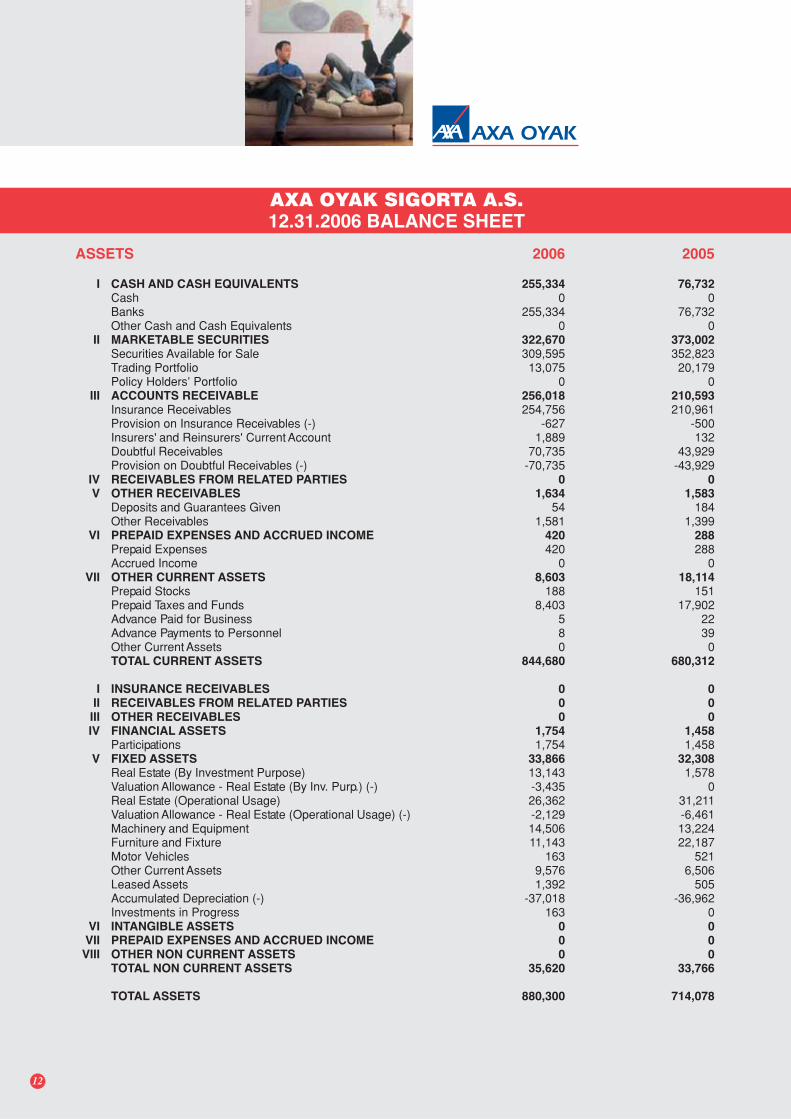
ASSETS 2006 2005
I CASH AND CASH EQUIVALENTS 255,334 76,732Cash 0 0Banks 255,334 76,732Other Cash and Cash Equivalents 0 0
II MARKETABLE SECURITIES 322,670 373,002Securities Available for Sale 309,595 352,823Trading Portfolio 13,075 20,179Policy Holders’ Portfolio 0 0
III ACCOUNTS RECEIVABLE 256,018 210,593Insurance Receivables 254,756 210,961Provision on Insurance Receivables (-) -627 -500Insurers' and Reinsurers' Current Account 1,889 132Doubtful Receivables 70,735 43,929Provision on Doubtful Receivables (-) -70,735 -43,929
IV RECEIVABLES FROM RELATED PARTIES 0 0V OTHER RECEIVABLES 1,634 1,583
Deposits and Guarantees Given 54 184Other Receivables 1,581 1,399
VI PREPAID EXPENSES AND ACCRUED INCOME 420 288Prepaid Expenses 420 288Accrued Income 0 0
VII OTHER CURRENT ASSETS 8,603 18,114Prepaid Stocks 188 151Prepaid Taxes and Funds 8,403 17,902Advance Paid for Business 5 22Advance Payments to Personnel 8 39Other Current Assets 0 0TOTAL CURRENT ASSETS 844,680 680,312
I INSURANCE RECEIVABLES 0 0II RECEIVABLES FROM RELATED PARTIES 0 0III OTHER RECEIVABLES 0 0IV FINANCIAL ASSETS 1,754 1,458
Participations 1,754 1,458V FIXED ASSETS 33,866 32,308
Real Estate (By Investment Purpose) 13,143 1,578Valuation Allowance - Real Estate (By Inv. Purp.) (-) -3,435 0Real Estate (Operational Usage) 26,362 31,211Valuation Allowance - Real Estate (Operational Usage) (-) -2,129 -6,461Machinery and Equipment 14,506 13,224Furniture and Fixture 11,143 22,187Motor Vehicles 163 521Other Current Assets 9,576 6,506Leased Assets 1,392 505Accumulated Depreciation (-) -37,018 -36,962Investments in Progress 163 0
VI INTANGIBLE ASSETS 0 0VII PREPAID EXPENSES AND ACCRUED INCOME 0 0VIII OTHER NON CURRENT ASSETS 0 0
TOTAL NON CURRENT ASSETS 35,620 33,766
TOTAL ASSETS 880,300 714,078
AXA OYAK SIGORTA A.S.12.31.2006 BALANCE SHEET
12
AXA OYAK
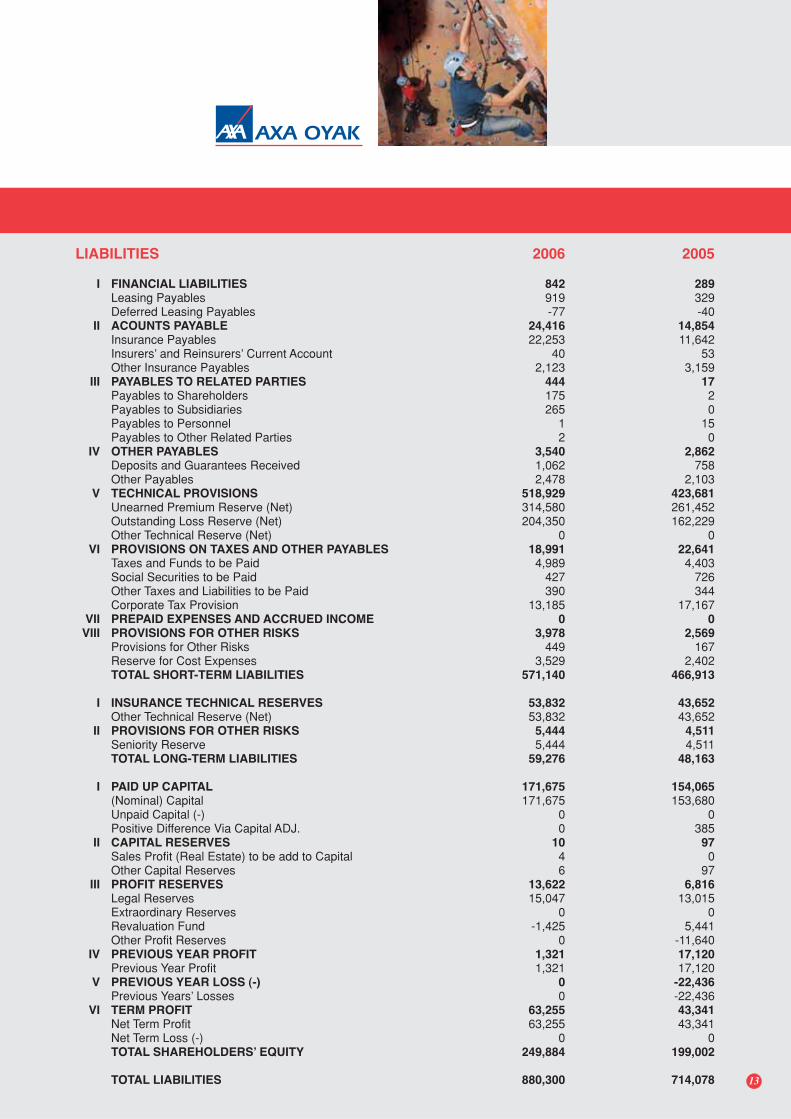
LIABILITIES 2006 2005
I FINANCIAL LIABILITIES 842 289Leasing Payables 919 329Deferred Leasing Payables -77 -40
II ACOUNTS PAYABLE 24,416 14,854Insurance Payables 22,253 11,642Insurers’ and Reinsurers’ Current Account 40 53Other Insurance Payables 2,123 3,159
III PAYABLES TO RELATED PARTIES 444 17Payables to Shareholders 175 2Payables to Subsidiaries 265 0Payables to Personnel 1 15Payables to Other Related Parties 2 0
IV OTHER PAYABLES 3,540 2,862Deposits and Guarantees Received 1,062 758Other Payables 2,478 2,103
V TECHNICAL PROVISIONS 518,929 423,681Unearned Premium Reserve (Net) 314,580 261,452Outstanding Loss Reserve (Net) 204,350 162,229Other Technical Reserve (Net) 0 0
VI PROVISIONS ON TAXES AND OTHER PAYABLES 18,991 22,641Taxes and Funds to be Paid 4,989 4,403Social Securities to be Paid 427 726Other Taxes and Liabilities to be Paid 390 344Corporate Tax Provision 13,185 17,167
VII PREPAID EXPENSES AND ACCRUED INCOME 0 0VIII PROVISIONS FOR OTHER RISKS 3,978 2,569
Provisions for Other Risks 449 167Reserve for Cost Expenses 3,529 2,402TOTAL SHORT-TERM LIABILITIES 571,140 466,913
I INSURANCE TECHNICAL RESERVES 53,832 43,652Other Technical Reserve (Net) 53,832 43,652
II PROVISIONS FOR OTHER RISKS 5,444 4,511Seniority Reserve 5,444 4,511TOTAL LONG-TERM LIABILITIES 59,276 48,163
I PAID UP CAPITAL 171,675 154,065(Nominal) Capital 171,675 153,680Unpaid Capital (-) 0 0Positive Difference Via Capital ADJ. 0 385
II CAPITAL RESERVES 10 97Sales Profit (Real Estate) to be add to Capital 4 0Other Capital Reserves 6 97
III PROFIT RESERVES 13,622 6,816Legal Reserves 15,047 13,015Extraordinary Reserves 0 0Revaluation Fund -1,425 5,441Other Profit Reserves 0 -11,640
IV PREVIOUS YEAR PROFIT 1,321 17,120Previous Year Profit 1,321 17,120
V PREVIOUS YEAR LOSS (-) 0 -22,436Previous Years’ Losses 0 -22,436
VI TERM PROFIT 63,255 43,341Net Term Profit 63,255 43,341Net Term Loss (-) 0 0TOTAL SHAREHOLDERS’ EQUITY 249,884 199,002
TOTAL LIABILITIES 880,300 714,078 13
AXA OYAK
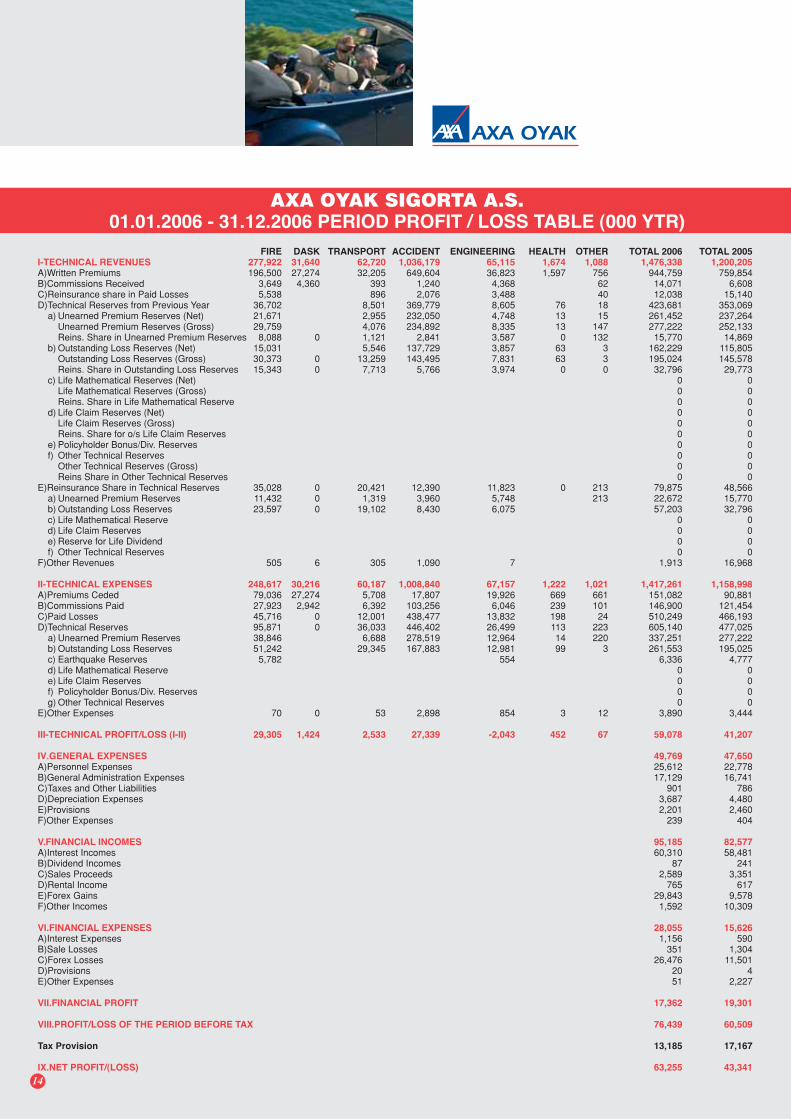
FIRE DASK TRANSPORT ACCIDENT ENGINEERING HEALTH OTHER TOTAL 2006 TOTAL 2005I-TECHNICAL REVENUES 277,922 31,640 62,720 1,036,179 65,115 1,674 1,088 1,476,338 1,200,205A)Written Premiums 196,500 27,274 32,205 649,604 36,823 1,597 756 944,759 759,854B)Commissions Received 3,649 4,360 393 1,240 4,368 62 14,071 6,608C)Reinsurance share in Paid Losses 5,538 896 2,076 3,488 40 12,038 15,140D)Technical Reserves from Previous Year 36,702 8,501 369,779 8,605 76 18 423,681 353,069
a) Unearned Premium Reserves (Net) 21,671 2,955 232,050 4,748 13 15 261,452 237,264Unearned Premium Reserves (Gross) 29,759 4,076 234,892 8,335 13 147 277,222 252,133Reins. Share in Unearned Premium Reserves 8,088 0 1,121 2,841 3,587 0 132 15,770 14,869
b) Outstanding Loss Reserves (Net) 15,031 5,546 137,729 3,857 63 3 162,229 115,805Outstanding Loss Reserves (Gross) 30,373 0 13,259 143,495 7,831 63 3 195,024 145,578Reins. Share in Outstanding Loss Reserves 15,343 0 7,713 5,766 3,974 0 0 32,796 29,773
c) Life Mathematical Reserves (Net) 0 0Life Mathematical Reserves (Gross) 0 0Reins. Share in Life Mathematical Reserve 0 0
d) Life Claim Reserves (Net) 0 0Life Claim Reserves (Gross) 0 0Reins. Share for o/s Life Claim Reserves 0 0
e) Policyholder Bonus/Div. Reserves 0 0f) Other Technical Reserves 0 0
Other Technical Reserves (Gross) 0 0Reins Share in Other Technical Reserves 0 0
E)Reinsurance Share in Technical Reserves 35,028 0 20,421 12,390 11,823 0 213 79,875 48,566a) Unearned Premium Reserves 11,432 0 1,319 3,960 5,748 213 22,672 15,770b) Outstanding Loss Reserves 23,597 0 19,102 8,430 6,075 57,203 32,796c) Life Mathematical Reserve 0 0d) Life Claim Reserves 0 0e) Reserve for Life Dividend 0 0f) Other Technical Reserves 0 0
F)Other Revenues 505 6 305 1,090 7 1,913 16,968
II-TECHNICAL EXPENSES 248,617 30,216 60,187 1,008,840 67,157 1,222 1,021 1,417,261 1,158,998A)Premiums Ceded 79,036 27,274 5,708 17,807 19,926 669 661 151,082 90,881B)Commissions Paid 27,923 2,942 6,392 103,256 6,046 239 101 146,900 121,454C)Paid Losses 45,716 0 12,001 438,477 13,832 198 24 510,249 466,193D)Technical Reserves 95,871 0 36,033 446,402 26,499 113 223 605,140 477,025
a) Unearned Premium Reserves 38,846 6,688 278,519 12,964 14 220 337,251 277,222b) Outstanding Loss Reserves 51,242 29,345 167,883 12,981 99 3 261,553 195,025c) Earthquake Reserves 5,782 554 6,336 4,777d) Life Mathematical Reserve 0 0e) Life Claim Reserves 0 0f) Policyholder Bonus/Div. Reserves 0 0g) Other Technical Reserves 0 0
E)Other Expenses 70 0 53 2,898 854 3 12 3,890 3,444
III-TECHNICAL PROFIT/LOSS (I-II) 29,305 1,424 2,533 27,339 -2,043 452 67 59,078 41,207
IV.GENERAL EXPENSES 49,769 47,650A)Personnel Expenses 25,612 22,778B)General Administration Expenses 17,129 16,741C)Taxes and Other Liabilities 901 786D)Depreciation Expenses 3,687 4,480E)Provisions 2,201 2,460F)Other Expenses 239 404
V.FINANCIAL INCOMES 95,185 82,577A)Interest Incomes 60,310 58,481B)Dividend Incomes 87 241C)Sales Proceeds 2,589 3,351D)Rental Income 765 617E)Forex Gains 29,843 9,578F)Other Incomes 1,592 10,309
VI.FINANCIAL EXPENSES 28,055 15,626A)Interest Expenses 1,156 590B)Sale Losses 351 1,304C)Forex Losses 26,476 11,501D)Provisions 20 4E)Other Expenses 51 2,227
VII.FINANCIAL PROFIT 17,362 19,301
VIII.PROFIT/LOSS OF THE PERIOD BEFORE TAX 76,439 60,509
Tax Provision 13,185 17,167
IX.NET PROFIT/(LOSS) 63,255 43,341
AXA OYAK SIGORTA A.S.01.01.2006 - 31.12.2006 PERIOD PROFIT / LOSS TABLE (000 YTR)
14
15
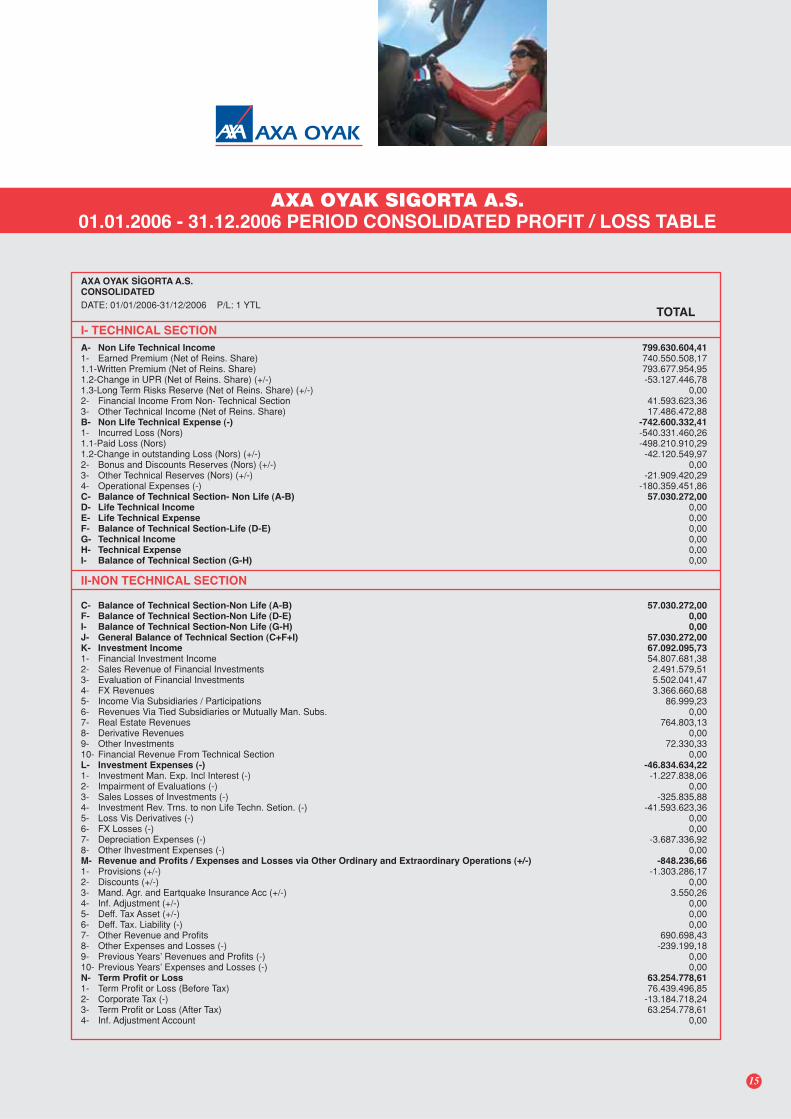
AXA OYAK S‹GORTA A.S.CONSOLIDATED
DATE: 01/01/2006-31/12/2006 P/L: 1 YTL
A- Non Life Technical Income1- Earned Premium (Net of Reins. Share)1.1-Written Premium (Net of Reins. Share)1.2-Change in UPR (Net of Reins. Share) (+/-)1.3-Long Term Risks Reserve (Net of Reins. Share) (+/-)2- Financial Income From Non- Technical Section3- Other Technical Income (Net of Reins. Share)B- Non Life Technical Expense (-)1- Incurred Loss (Nors)1.1-Paid Loss (Nors)1.2-Change in outstanding Loss (Nors) (+/-)2- Bonus and Discounts Reserves (Nors) (+/-)3- Other Technical Reserves (Nors) (+/-)4- Operational Expenses (-)C- Balance of Technical Section- Non Life (A-B)D- Life Technical IncomeE- Life Technical ExpenseF- Balance of Technical Section-Life (D-E)G- Technical IncomeH- Technical ExpenseI- Balance of Technical Section (G-H)
799.630.604,41740.550.508,17793.677.954,95-53.127.446,78
0,0041.593.623,3617.486.472,88
-742.600.332,41-540.331.460,26-498.210.910,29-42.120.549,97
0,00-21.909.420,29
-180.359.451,8657.030.272,00
0,000,000,000,000,000,00
TOTAL
II-NON TECHNICAL SECTION
57.030.272,000,000,00
57.030.272,0067.092.095,7354.807.681,382.491.579,515.502.041,473.366.660,68
86.999,230,00
764.803,130,00
72.330,330,00
-46.834.634,22-1.227.838,06
0,00-325.835,88
-41.593.623,360,000,00
-3.687.336,920,00
-848.236,66-1.303.286,17
0,003.550,26
0,000,000,00
690.698,43-239.199,18
0,000,00
63.254.778,6176.439.496,85
-13.184.718,2463.254.778,61
0,00
C- Balance of Technical Section-Non Life (A-B)F- Balance of Technical Section-Non Life (D-E)I- Balance of Technical Section-Non Life (G-H)J- General Balance of Technical Section (C+F+I)K- Investment Income1- Financial Investment Income2- Sales Revenue of Financial Investments3- Evaluation of Financial Investments4- FX Revenues5- Income Via Subsidiaries / Participations6- Revenues Via Tied Subsidiaries or Mutually Man. Subs.7- Real Estate Revenues8- Derivative Revenues9- Other Investments10- Financial Revenue From Technical SectionL- Investment Expenses (-)1- Investment Man. Exp. Incl Interest (-)2- Impairment of Evaluations (-)3- Sales Losses of Investments (-)4- Investment Rev. Trns. to non Life Techn. Setion. (-)5- Loss Vis Derivatives (-)6- FX Losses (-)7- Depreciation Expenses (-)8- Other Ihvestment Expenses (-)M- Revenue and Profits / Expenses and Losses via Other Ordinary and Extraordinary Operations (+/-)1- Provisions (+/-)2- Discounts (+/-)3- Mand. Agr. and Eartquake Insurance Acc (+/-)4- Inf. Adjustment (+/-)5- Deff. Tax Asset (+/-)6- Deff. Tax. Liability (-)7- Other Revenue and Profits8- Other Expenses and Losses (-)9- Previous Years’ Revenues and Profits (-)10- Previous Years’ Expenses and Losses (-)N- Term Profit or Loss1- Term Profit or Loss (Before Tax)2- Corporate Tax (-)3- Term Profit or Loss (After Tax)4- Inf. Adjustment Account
I- TECHNICAL SECTION
AXA OYAK SIGORTA A.S.01.01.2006 - 31.12.2006 PERIOD CONSOLIDATED PROFIT / LOSS TABLE
AXA OYAK

AXA OYAK HAYAT SIGORTA
16
AXA OYAK
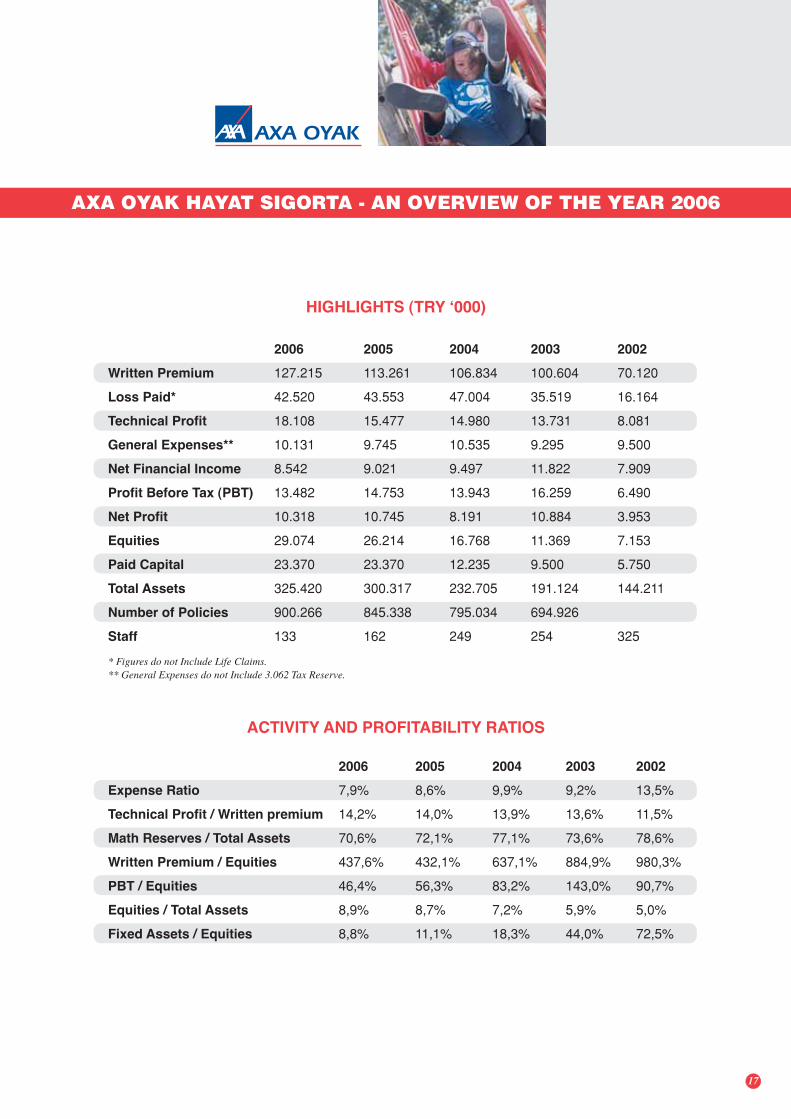
2006 2005 2004 2003 2002
Written Premium 127.215 113.261 106.834 100.604 70.120
Loss Paid* 42.520 43.553 47.004 35.519 16.164
Technical Profit 18.108 15.477 14.980 13.731 8.081
General Expenses** 10.131 9.745 10.535 9.295 9.500
Net Financial Income 8.542 9.021 9.497 11.822 7.909
Profit Before Tax (PBT) 13.482 14.753 13.943 16.259 6.490
Net Profit 10.318 10.745 8.191 10.884 3.953
Equities 29.074 26.214 16.768 11.369 7.153
Paid Capital 23.370 23.370 12.235 9.500 5.750
Total Assets 325.420 300.317 232.705 191.124 144.211
Number of Policies 900.266 845.338 795.034 694.926
Staff 133 162 249 254 325
HIGHLIGHTS (TRY ‘000)
ACTIVITY AND PROFITABILITY RATIOS
2006 2005 2004 2003 2002
Expense Ratio 7,9% 8,6% 9,9% 9,2% 13,5%
Technical Profit / Written premium 14,2% 14,0% 13,9% 13,6% 11,5%
Math Reserves / Total Assets 70,6% 72,1% 77,1% 73,6% 78,6%
Written Premium / Equities 437,6% 432,1% 637,1% 884,9% 980,3%
PBT / Equities 46,4% 56,3% 83,2% 143,0% 90,7%
Equities / Total Assets 8,9% 8,7% 7,2% 5,9% 5,0%
Fixed Assets / Equities 8,8% 11,1% 18,3% 44,0% 72,5%
AXA OYAK HAYAT SIGORTA - AN OVERVIEW OF THE YEAR 2006
* Figures do not Include Life Claims.** General Expenses do not Include 3.062 Tax Reserve.
17
AXA OYAK
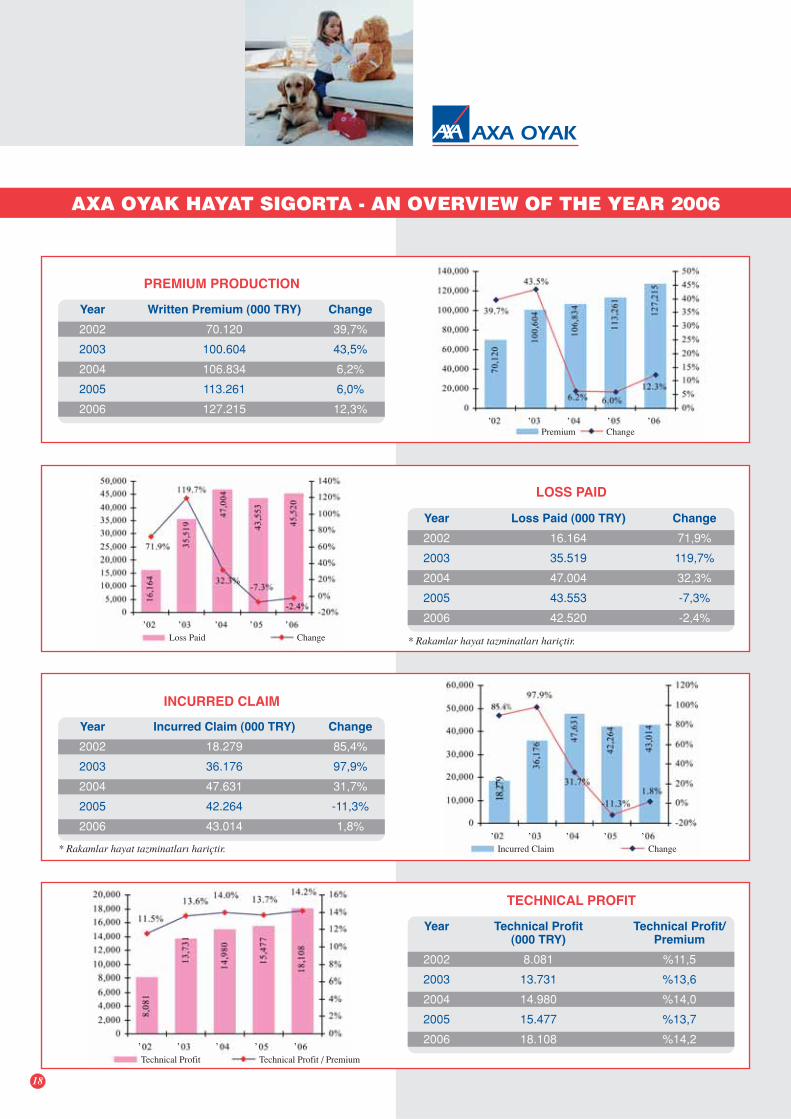
AXA OYAK HAYAT SIGORTA - AN OVERVIEW OF THE YEAR 2006
PREMIUM PRODUCTION
Year Written Premium (000 TRY) Change
2002 70.120 39,7%
2003 100.604 43,5%
2004 106.834 6,2%
2005 113.261 6,0%
2006 127.215 12,3%
LOSS PAID
Year Loss Paid (000 TRY) Change
2002 16.164 71,9%
2003 35.519 119,7%
2004 47.004 32,3%
2005 43.553 -7,3%
2006 42.520 -2,4%
* Rakamlar hayat tazminatlar› hariçtir.
INCURRED CLAIM
Year Incurred Claim (000 TRY) Change
2002 18.279 85,4%
2003 36.176 97,9%
2004 47.631 31,7%
2005 42.264 -11,3%
2006 43.014 1,8%
* Rakamlar hayat tazminatlar› hariçtir.
TECHNICAL PROFIT
Year Technical Profit Technical Profit/(000 TRY) Premium
2002 8.081 %11,5
2003 13.731 %13,6
2004 14.980 %14,0
2005 15.477 %13,7
2006 18.108 %14,2
18
‚ ‚ ‚ ‚ ‚
‚ ‚ ‚ ‚ ‚
‚ ‚ ‚ ‚ ‚
‚ ‚ ‚ ‚ ‚
Loss Paid Change
Incurred Claim Change
Technical Profit Technical Profit / Premium
Premium Change
AXA OYAK
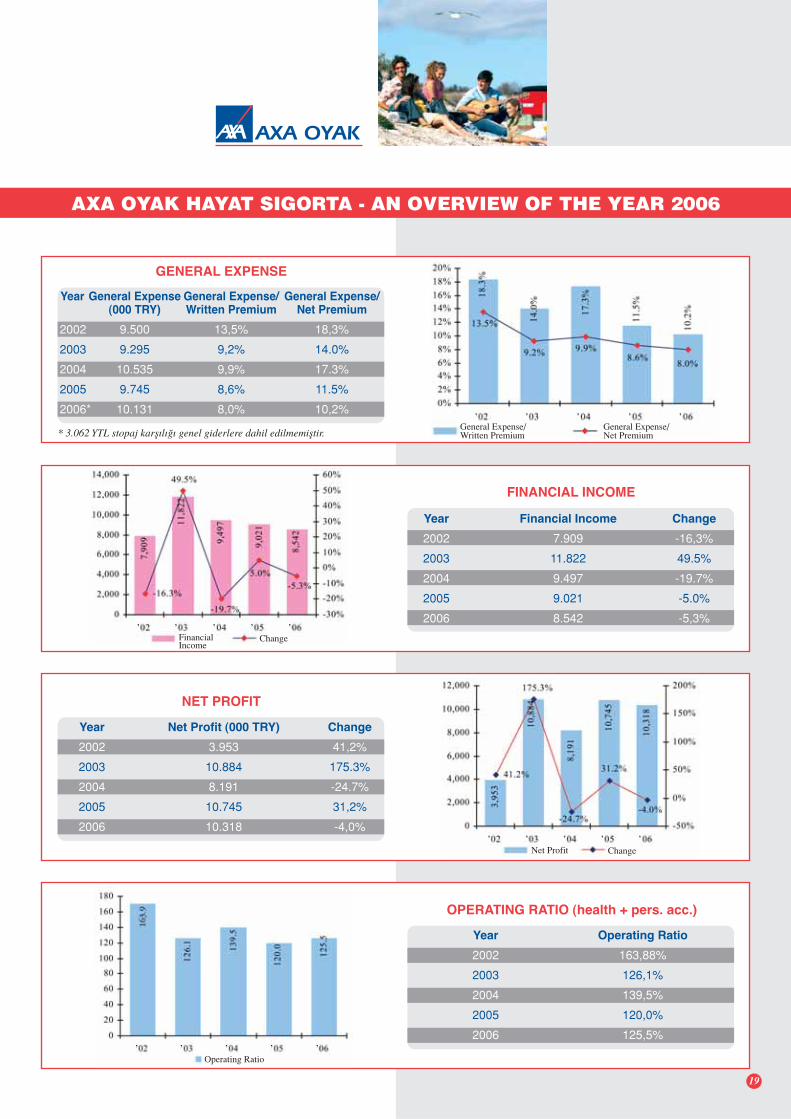
AXA OYAK HAYAT SIGORTA - AN OVERVIEW OF THE YEAR 2006
GENERAL EXPENSE
Year General Expense General Expense/ General Expense/(000 TRY) Written Premium Net Premium
2002 9.500 13,5% 18,3%
2003 9.295 9,2% 14.0%
2004 10.535 9,9% 17.3%
2005 9.745 8,6% 11.5%
2006* 10.131 8,0% 10,2%
* 3.062 YTL stopaj karfl›l›¤› genel giderlere dahil edilmemifltir.
FINANCIAL INCOME
Year Financial Income Change
2002 7.909 -16,3%
2003 11.822 49.5%
2004 9.497 -19.7%
2005 9.021 -5.0%
2006 8.542 -5,3%
NET PROFIT
Year Net Profit (000 TRY) Change
2002 3.953 41,2%
2003 10.884 175.3%
2004 8.191 -24.7%
2005 10.745 31,2%
2006 10.318 -4,0%
Year Operating Ratio
2002 163,88%
2003 126,1%
2004 139,5%
2005 120,0%
2006 125,5%
OPERATING RATIO (health + pers. acc.)
19
‚ ‚ ‚ ‚ ‚
‚ ‚ ‚ ‚ ‚
‚ ‚ ‚ ‚ ‚
‚ ‚ ‚ ‚ ‚
General Expense/Written Premium
General Expense/Net Premium
FinancialIncome
Change
Net Profit Change
Operating Ratio
AXA OYAK
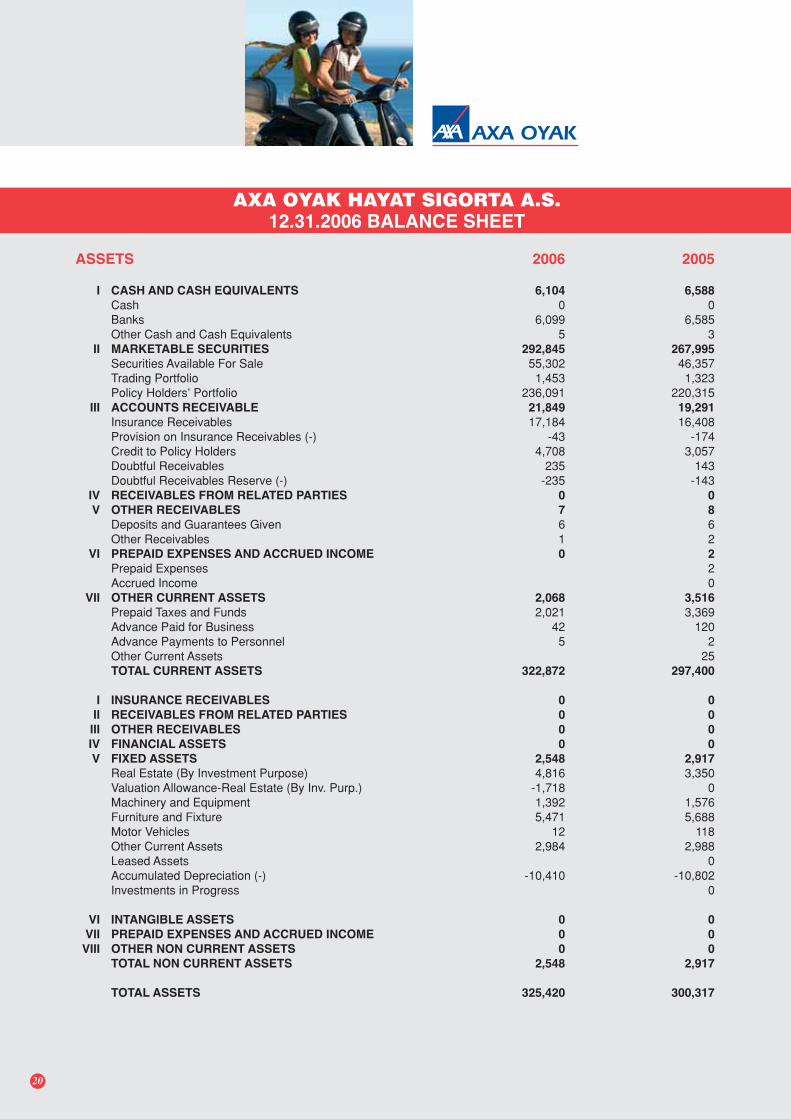
ASSETS 2006 2005
I CASH AND CASH EQUIVALENTS 6,104 6,588
Cash 0 0Banks 6,099 6,585Other Cash and Cash Equivalents 5 3
II MARKETABLE SECURITIES 292,845 267,995
Securities Available For Sale 55,302 46,357Trading Portfolio 1,453 1,323Policy Holders’ Portfolio 236,091 220,315
III ACCOUNTS RECEIVABLE 21,849 19,291
Insurance Receivables 17,184 16,408Provision on Insurance Receivables (-) -43 -174Credit to Policy Holders 4,708 3,057Doubtful Receivables 235 143Doubtful Receivables Reserve (-) -235 -143
IV RECEIVABLES FROM RELATED PARTIES 0 0
V OTHER RECEIVABLES 7 8
Deposits and Guarantees Given 6 6Other Receivables 1 2
VI PREPAID EXPENSES AND ACCRUED INCOME 0 2
Prepaid Expenses 2Accrued Income 0
VII OTHER CURRENT ASSETS 2,068 3,516
Prepaid Taxes and Funds 2,021 3,369Advance Paid for Business 42 120Advance Payments to Personnel 5 2Other Current Assets 25TOTAL CURRENT ASSETS 322,872 297,400
I INSURANCE RECEIVABLES 0 0
II RECEIVABLES FROM RELATED PARTIES 0 0
III OTHER RECEIVABLES 0 0
IV FINANCIAL ASSETS 0 0
V FIXED ASSETS 2,548 2,917
Real Estate (By Investment Purpose) 4,816 3,350Valuation Allowance-Real Estate (By Inv. Purp.) -1,718 0Machinery and Equipment 1,392 1,576Furniture and Fixture 5,471 5,688Motor Vehicles 12 118Other Current Assets 2,984 2,988Leased Assets 0Accumulated Depreciation (-) -10,410 -10,802Investments in Progress 0
VI INTANGIBLE ASSETS 0 0
VII PREPAID EXPENSES AND ACCRUED INCOME 0 0
VIII OTHER NON CURRENT ASSETS 0 0
TOTAL NON CURRENT ASSETS 2,548 2,917
TOTAL ASSETS 325,420 300,317
AXA OYAK HAYAT SIGORTA A.S.12.31.2006 BALANCE SHEET
20
AXA OYAK
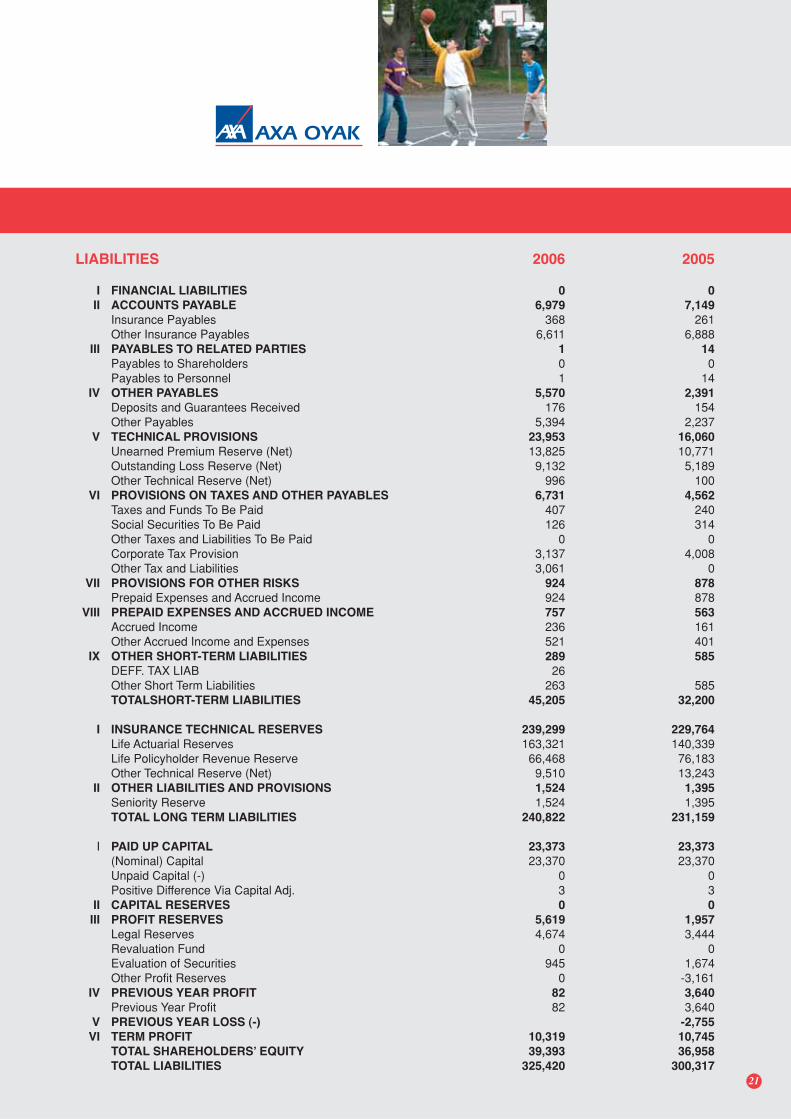
LIABILITIES 2006 2005
I FINANCIAL LIABILITIES 0 0
II ACCOUNTS PAYABLE 6,979 7,149
Insurance Payables 368 261Other Insurance Payables 6,611 6,888
III PAYABLES TO RELATED PARTIES 1 14
Payables to Shareholders 0 0Payables to Personnel 1 14
IV OTHER PAYABLES 5,570 2,391
Deposits and Guarantees Received 176 154Other Payables 5,394 2,237
V TECHNICAL PROVISIONS 23,953 16,060
Unearned Premium Reserve (Net) 13,825 10,771Outstanding Loss Reserve (Net) 9,132 5,189Other Technical Reserve (Net) 996 100
VI PROVISIONS ON TAXES AND OTHER PAYABLES 6,731 4,562
Taxes and Funds To Be Paid 407 240Social Securities To Be Paid 126 314Other Taxes and Liabilities To Be Paid 0 0Corporate Tax Provision 3,137 4,008Other Tax and Liabilities 3,061 0
VII PROVISIONS FOR OTHER RISKS 924 878
Prepaid Expenses and Accrued Income 924 878VIII PREPAID EXPENSES AND ACCRUED INCOME 757 563
Accrued Income 236 161Other Accrued Income and Expenses 521 401
IX OTHER SHORT-TERM LIABILITIES 289 585
DEFF. TAX LIAB 26Other Short Term Liabilities 263 585TOTALSHORT-TERM LIABILITIES 45,205 32,200
I INSURANCE TECHNICAL RESERVES 239,299 229,764
Life Actuarial Reserves 163,321 140,339Life Policyholder Revenue Reserve 66,468 76,183Other Technical Reserve (Net) 9,510 13,243
II OTHER LIABILITIES AND PROVISIONS 1,524 1,395
Seniority Reserve 1,524 1,395TOTAL LONG TERM LIABILITIES 240,822 231,159
I PAID UP CAPITAL 23,373 23,373
(Nominal) Capital 23,370 23,370Unpaid Capital (-) 0 0Positive Difference Via Capital Adj. 3 3
II CAPITAL RESERVES 0 0
III PROFIT RESERVES 5,619 1,957
Legal Reserves 4,674 3,444Revaluation Fund 0 0Evaluation of Securities 945 1,674Other Profit Reserves 0 -3,161
IV PREVIOUS YEAR PROFIT 82 3,640
Previous Year Profit 82 3,640V PREVIOUS YEAR LOSS (-) -2,755
VI TERM PROFIT 10,319 10,745
TOTAL SHAREHOLDERS’ EQUITY 39,393 36,958
TOTAL LIABILITIES 325,420 300,317
21
AXA OYAK
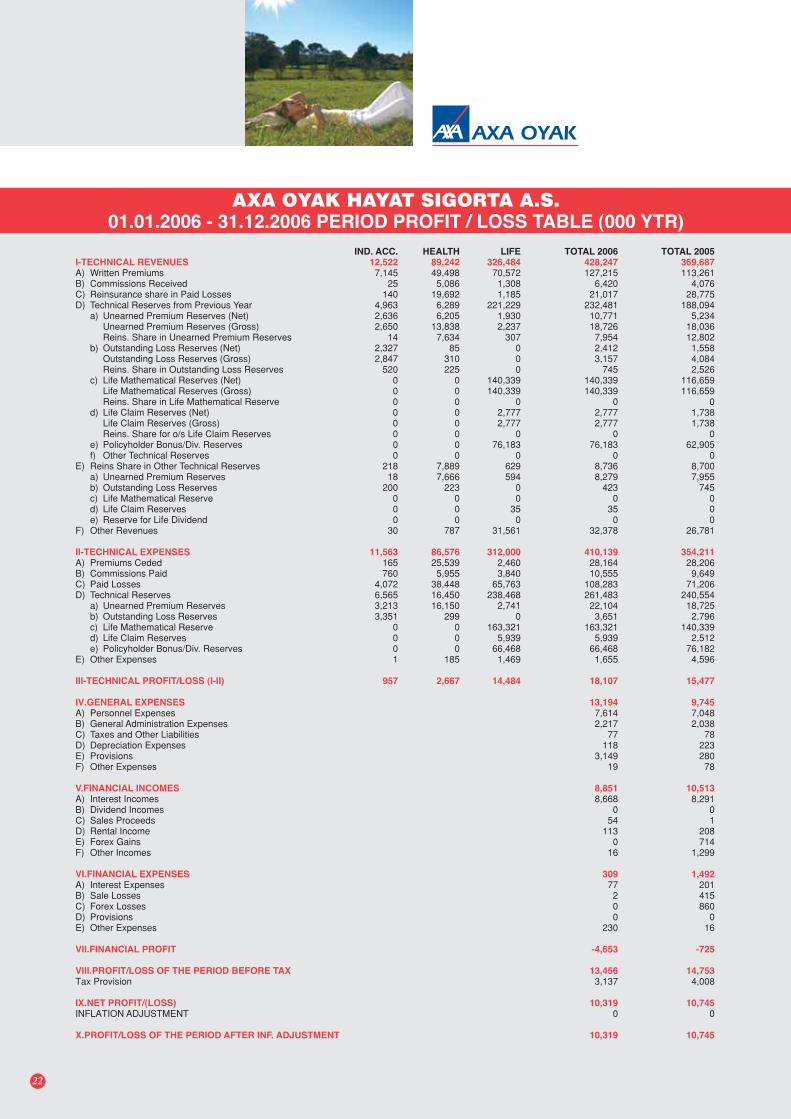
IND. ACC. HEALTH LIFE TOTAL 2006 TOTAL 2005I-TECHNICAL REVENUES 12,522 89,242 326,484 428,247 369,687A) Written Premiums 7,145 49,498 70,572 127,215 113,261B) Commissions Received 25 5,086 1,308 6,420 4,076C) Reinsurance share in Paid Losses 140 19,692 1,185 21,017 28,775D) Technical Reserves from Previous Year 4,963 6,289 221,229 232,481 188,094
a) Unearned Premium Reserves (Net) 2,636 6,205 1,930 10,771 5,234Unearned Premium Reserves (Gross) 2,650 13,838 2,237 18,726 18,036Reins. Share in Unearned Premium Reserves 14 7,634 307 7,954 12,802
b) Outstanding Loss Reserves (Net) 2,327 85 0 2,412 1,558Outstanding Loss Reserves (Gross) 2,847 310 0 3,157 4,084Reins. Share in Outstanding Loss Reserves 520 225 0 745 2,526
c) Life Mathematical Reserves (Net) 0 0 140,339 140,339 116,659Life Mathematical Reserves (Gross) 0 0 140,339 140,339 116,659Reins. Share in Life Mathematical Reserve 0 0 0 0 0
d) Life Claim Reserves (Net) 0 0 2,777 2,777 1,738Life Claim Reserves (Gross) 0 0 2,777 2,777 1,738Reins. Share for o/s Life Claim Reserves 0 0 0 0 0
e) Policyholder Bonus/Div. Reserves 0 0 76,183 76,183 62,905f) Other Technical Reserves 0 0 0 0 0
E) Reins Share in Other Technical Reserves 218 7,889 629 8,736 8,700a) Unearned Premium Reserves 18 7,666 594 8,279 7,955b) Outstanding Loss Reserves 200 223 0 423 745c) Life Mathematical Reserve 0 0 0 0 0d) Life Claim Reserves 0 0 35 35 0e) Reserve for Life Dividend 0 0 0 0 0
F) Other Revenues 30 787 31,561 32,378 26,781
II-TECHNICAL EXPENSES 11,563 86,576 312,000 410,139 354,211A) Premiums Ceded 165 25,539 2,460 28,164 28,206B) Commissions Paid 760 5,955 3,840 10,555 9,649C) Paid Losses 4,072 38,448 65,763 108,283 71,206D) Technical Reserves 6,565 16,450 238,468 261,483 240,554
a) Unearned Premium Reserves 3,213 16,150 2,741 22,104 18,725b) Outstanding Loss Reserves 3,351 299 0 3,651 2,796c) Life Mathematical Reserve 0 0 163,321 163,321 140,339d) Life Claim Reserves 0 0 5,939 5,939 2,512e) Policyholder Bonus/Div. Reserves 0 0 66,468 66,468 76,182
E) Other Expenses 1 185 1,469 1,655 4,596
III-TECHNICAL PROFIT/LOSS (I-II) 957 2,667 14,484 18,107 15,477
IV.GENERAL EXPENSES 13,194 9,745A) Personnel Expenses 7,614 7,048B) General Administration Expenses 2,217 2,038C) Taxes and Other Liabilities 77 78D) Depreciation Expenses 118 223E) Provisions 3,149 280F) Other Expenses 19 78
V.FINANCIAL INCOMES 8,851 10,513A) Interest Incomes 8,668 8,291B) Dividend Incomes 0 0C) Sales Proceeds 54 1D) Rental Income 113 208E) Forex Gains 0 714F) Other Incomes 16 1,299
VI.FINANCIAL EXPENSES 309 1,492A) Interest Expenses 77 201B) Sale Losses 2 415C) Forex Losses 0 860D) Provisions 0 0E) Other Expenses 230 16
VII.FINANCIAL PROFIT -4,653 -725
VIII.PROFIT/LOSS OF THE PERIOD BEFORE TAX 13,456 14,753Tax Provision 3,137 4,008
IX.NET PROFIT/(LOSS) 10,319 10,745INFLATION ADJUSTMENT 0 0
X.PROFIT/LOSS OF THE PERIOD AFTER INF. ADJUSTMENT 10,319 10,745
AXA OYAK HAYAT SIGORTA A.S.01.01.2006 - 31.12.2006 PERIOD PROFIT / LOSS TABLE (000 YTR)
22
AXA OYAK
23
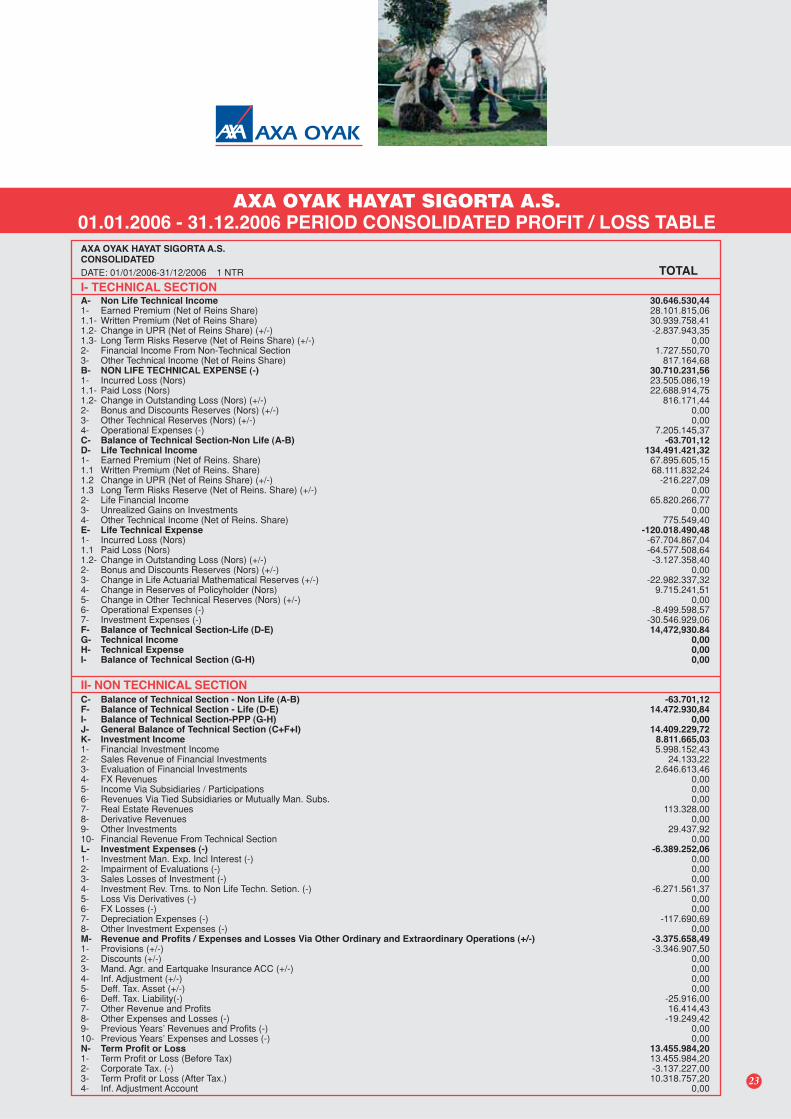
AXA OYAK HAYAT SIGORTA A.S.CONSOLIDATED
DATE: 01/01/2006-31/12/2006 1 NTR
A- Non Life Technical Income1- Earned Premium (Net of Reins Share)1.1- Written Premium (Net of Reins Share)1.2- Change in UPR (Net of Reins Share) (+/-)1.3- Long Term Risks Reserve (Net of Reins Share) (+/-)2- Financial Income From Non-Technical Section3- Other Technical Income (Net of Reins Share)B- NON LIFE TECHNICAL EXPENSE (-)1- Incurred Loss (Nors)1.1- Paid Loss (Nors)1.2- Change in Outstanding Loss (Nors) (+/-)2- Bonus and Discounts Reserves (Nors) (+/-)3- Other Technical Reserves (Nors) (+/-)4- Operational Expenses (-)C- Balance of Technical Section-Non Life (A-B)D- Life Technical Income1- Earned Premium (Net of Reins. Share)1.1 Written Premium (Net of Reins. Share)1.2 Change in UPR (Net of Reins Share) (+/-)1.3 Long Term Risks Reserve (Net of Reins. Share) (+/-)2- Life Financial Income3- Unrealized Gains on Investments4- Other Technical Income (Net of Reins. Share)E- Life Technical Expense1- Incurred Loss (Nors)1.1 Paid Loss (Nors)1.2- Change in Outstanding Loss (Nors) (+/-)2- Bonus and Discounts Reserves (Nors) (+/-)3- Change in Life Actuarial Mathematical Reserves (+/-)4- Change in Reserves of Policyholder (Nors)5- Change in Other Technical Reserves (Nors) (+/-)6- Operational Expenses (-)7- Investment Expenses (-)F- Balance of Technical Section-Life (D-E)G- Technical IncomeH- Technical ExpenseI- Balance of Technical Section (G-H)
30.646.530,4428.101.815,0630.939.758,41-2.837.943,35
0,001.727.550,70
817.164,6830.710.231,5623.505.086,1922.688.914,75
816.171,440,000,00
7.205.145,37-63.701,12
134.491.421,3267.895.605,1568.111.832,24
-216.227,090,00
65.820.266,770,00
775.549,40-120.018.490,48
-67.704.867,04-64.577.508,64-3.127.358,40
0,00-22.982.337,32
9.715.241,510,00
-8.499.598,57-30.546.929,0614,472,930.84
0,000,000,00
TOTAL
II- NON TECHNICAL SECTION-63.701,12
14.472.930,840,00
14.409.229,728.811.665,035.998.152,43
24.133,222.646.613,46
0,000,000,00
113.328,000,00
29.437,920,00
-6.389.252,060,000,000,00
-6.271.561,370,000,00
-117.690,690,00
-3.375.658,49-3.346.907,50
0,000,000,000,00
-25.916,0016.414,43
-19.249,420,000,00
13.455.984,2013.455.984,20-3.137.227,0010.318.757,20
0,00
C- Balance of Technical Section - Non Life (A-B)F- Balance of Technical Section - Life (D-E)I- Balance of Technical Section-PPP (G-H)J- General Balance of Technical Section (C+F+I)K- Investment Income1- Financial Investment Income2- Sales Revenue of Financial Investments3- Evaluation of Financial Investments4- FX Revenues5- Income Via Subsidiaries / Participations6- Revenues Via Tied Subsidiaries or Mutually Man. Subs.7- Real Estate Revenues8- Derivative Revenues9- Other Investments10- Financial Revenue From Technical SectionL- Investment Expenses (-)1- Investment Man. Exp. Incl Interest (-)2- Impairment of Evaluations (-)3- Sales Losses of Investment (-)4- Investment Rev. Trns. to Non Life Techn. Setion. (-)5- Loss Vis Derivatives (-)6- FX Losses (-)7- Depreciation Expenses (-)8- Other Investment Expenses (-)M- Revenue and Profits / Expenses and Losses Via Other Ordinary and Extraordinary Operations (+/-)1- Provisions (+/-)2- Discounts (+/-)3- Mand. Agr. and Eartquake Insurance ACC (+/-)4- Inf. Adjustment (+/-)5- Deff. Tax. Asset (+/-)6- Deff. Tax. Liability(-)7- Other Revenue and Profits8- Other Expenses and Losses (-)9- Previous Years’ Revenues and Profits (-)10- Previous Years’ Expenses and Losses (-)N- Term Profit or Loss1- Term Profit or Loss (Before Tax)2- Corporate Tax. (-)3- Term Profit or Loss (After Tax.)4- Inf. Adjustment Account
I- TECHNICAL SECTION
AXA OYAK HAYAT SIGORTA A.S.01.01.2006 - 31.12.2006 PERIOD CONSOLIDATED PROFIT / LOSS TABLE
AXA OYAK
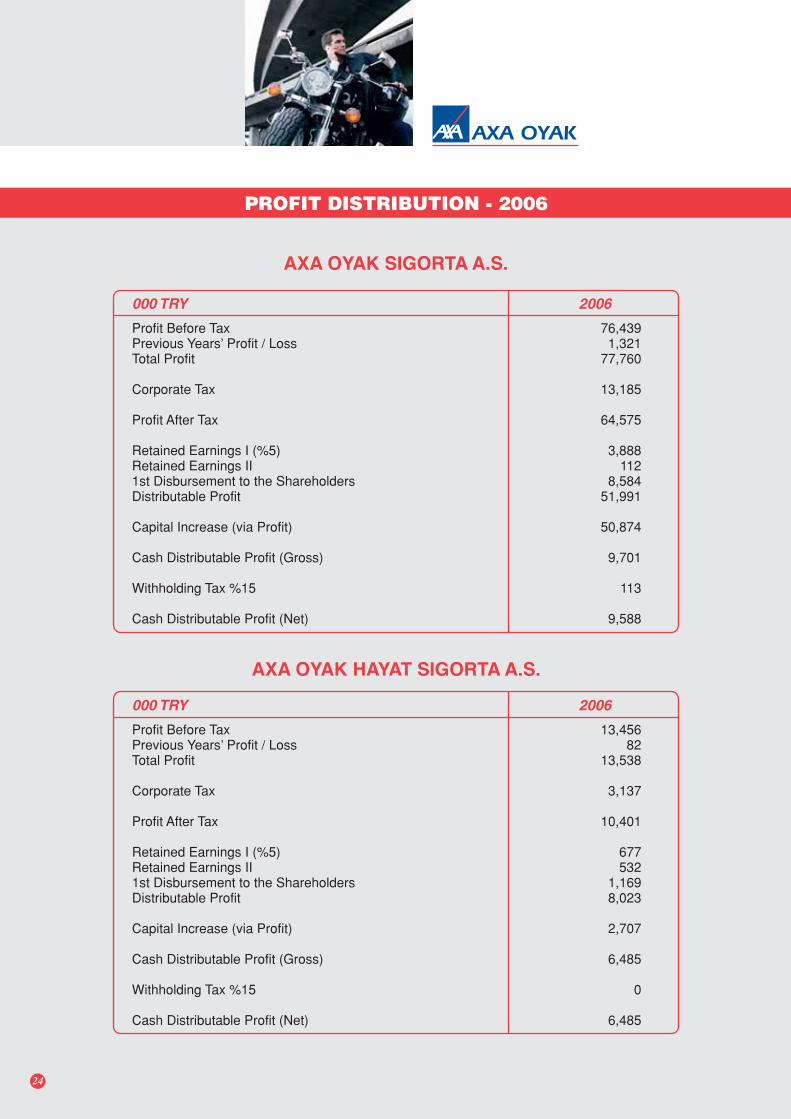
PROFIT DISTRIBUTION - 2006
Profit Before Tax 76,439Previous Years’ Profit / Loss 1,321Total Profit 77,760
Corporate Tax 13,185
Profit After Tax 64,575
Retained Earnings I (%5) 3,888Retained Earnings II 1121st Disbursement to the Shareholders 8,584Distributable Profit 51,991
Capital Increase (via Profit) 50,874
Cash Distributable Profit (Gross) 9,701
Withholding Tax %15 113
Cash Distributable Profit (Net) 9,588
000 TRY 2006
24
Profit Before Tax 13,456Previous Years’ Profit / Loss 82Total Profit 13,538
Corporate Tax 3,137
Profit After Tax 10,401
Retained Earnings I (%5) 677Retained Earnings II 5321st Disbursement to the Shareholders 1,169Distributable Profit 8,023
Capital Increase (via Profit) 2,707
Cash Distributable Profit (Gross) 6,485
Withholding Tax %15 0
Cash Distributable Profit (Net) 6,485
000 TRY 2006
AXA OYAK SIGORTA A.S.
AXA OYAK HAYAT SIGORTA A.S.
AXA OYAK
25
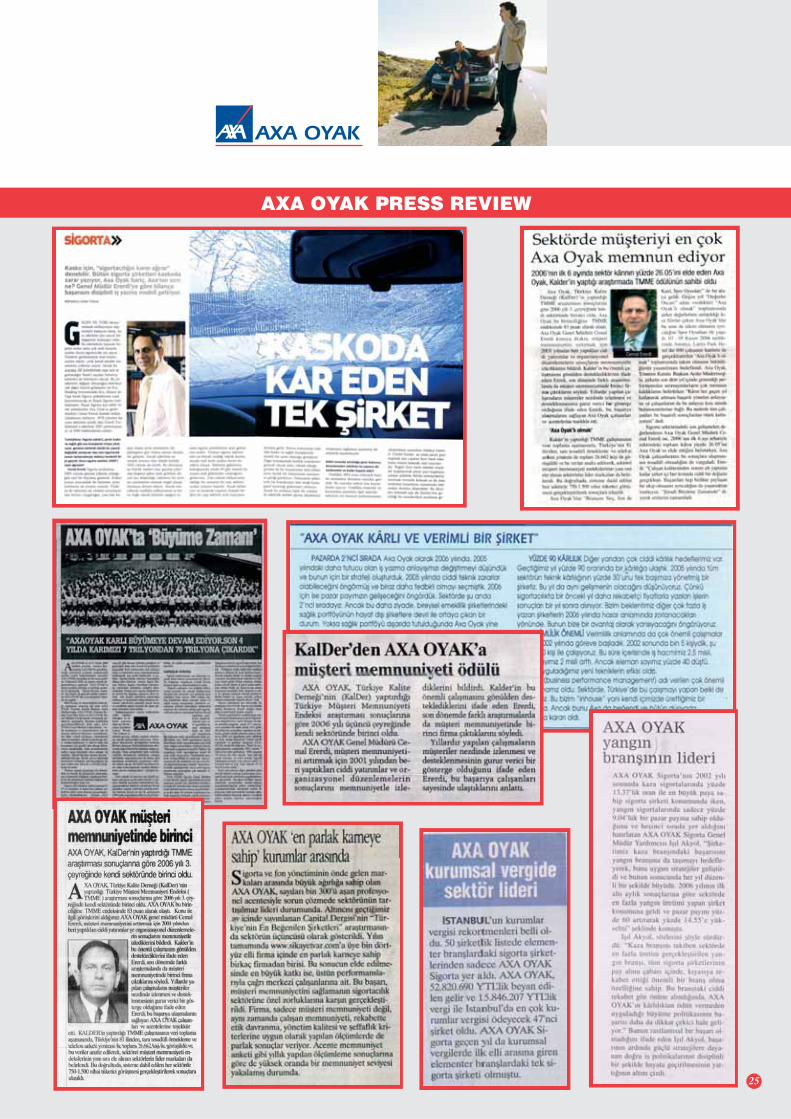
AXA OYAK PRESS REVIEW
AXA OYAK
26
Erdo¤an EmeksizHeadquarter
Group Manager
Hülya Gülenda¤Headquarter
Manager
Arif GülerHeadquarter
Manager
Emel DolgunAegean Regional Office
Manager
Ali ErlatHeadquarter
Assistant General Manager
Cemal ErerdiHeadquarter
General Manager
Gencay AtmacaHeadquarter
Manager
Mete AygüvenHeadquarter
Manager
Zafer AtilaBak›rköy Regional Office
Regional Manager
Arif AytekinHeadquarter
Group Manager
Cengiz BulurSouth Anatolia Regional Office
Regional Manager
Erhan AkdenizMarmara Regional Office
Manager
Selçuk AkkayaKaradeniz Regional Office
Manager
Selçuk Ad›güzelHeadquarter
Manager
Taylan AksoyBak›rköy Regional Office
Manager
Gülhan AkturanHeadquarter
Manager
Ifl›l AkyolHeadquarter
Assistant General Manager
Nihal ÖnerAegean Regional Office
Regional Manager
Yavuz ÖlkenHeadquarter
Assistant General Manager
Samet OralSouth Anatolia Regional Office
Manager
Burçin Nazl›elHeadquarter
Group Manager
Nilgül MunganIstanbul Regional Office
Manager
AXA OYAK MANAGERS
Hayriye SayderHeadquarter
Secretary General
Kaan Tavukçuo¤luHeadquarter
Manager
Birol fianl›Headquarter
Manager
Süleyman SözerHeadquarter
Manager
Nüket TüzünHeadquarter
Manager
Orkun Tuzlac›Kad›koy Regional Office
Manager

AXA OYAK
27
‹lknur ÖztürkIstanbul Regional Office
Regional Manager
Patrice PasquiersHeadquarter
Department Chair
Abdullah ÖzalpHeadquarter
Manager
Ege ÖrerHeadquarter
Manager
Güzin PalaHeadquarter
Manager
Hüseyin DikmenHeadquarter
Manager
Ali DemirelMediterrannean Regional Office
Manager
Recep DirekCentral Anatolia Regional Office
Regional Manager
Osman ÇevikolMediterrannean Regional Office
Regional Manager
‹dil DenizHeadquarter
Manager
Müjdat ‹lhanerBlacksea Regional Office
Regional Manager
Olgun KüntayHeadquarter
Assistant General Manager
Özlem GürsoyIstanbul Corporate Regional Manager
Regional Manager
Esra GüllerHeadquarter
Manager
Halil KorkmazHeadquarter
Assistant General Manager
Orhan KulilHeadquarter
Manager
Ifl›l ÜnalHeadquarter
Manager
Öznur UsIstanbul CorporateRegional Manager
Manager
R›fat U¤urcaCentral Anatolia
Regional ManagerManager
Can YeflilSouth Anatolia Regional Office
Manager
Yalç›n Y›ld›r›mMarmara Regional Office
Regional Manager
Murat UytunHeadquarter
Manager
AXA OYAK MANAGERS
fieyda AtanKad›koy Regional Office
Regional Manager
Ifl›l Ar›canHeadquarter
Manager
Duygu Altunda¤Headquarter
Manager
Volkan AltunCentral Anatolia Regional Office
Manager
Ayflegül AlgünHeadquarter
Department Chair
‹smail AlpertungaHeadquarter
Manager
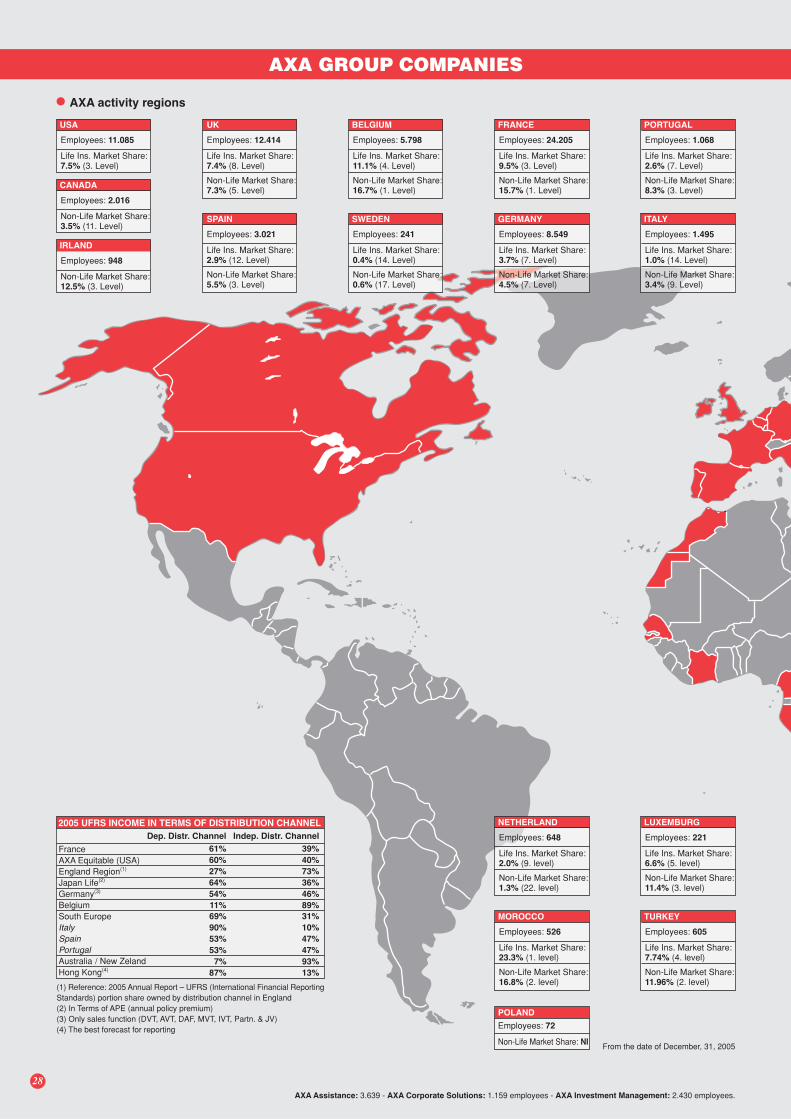
AXA activity regions
USA
Employees: 11.085
Life Ins. Market Share:7.5% (3. Level)
CANADA
Employees: 2.016
Non-Life Market Share:3.5% (11. Level)
SPAIN
Employees: 3.021
Life Ins. Market Share:2.9% (12. Level)
Non-Life Market Share:5.5% (3. Level)
UK
Employees: 12.414
Life Ins. Market Share:7.4% (8. Level)
Non-Life Market Share:7.3% (5. Level)
BELGIUM
Employees: 5.798
Life Ins. Market Share:11.1% (4. Level)
Non-Life Market Share:16.7% (1. Level)
FRANCE
Employees: 24.205
Life Ins. Market Share:9.5% (3. Level)
Non-Life Market Share:15.7% (1. Level)
PORTUGAL
Employees: 1.068
Life Ins. Market Share:2.6% (7. Level)
Non-Life Market Share:8.3% (3. Level)
IRLAND
Employees: 948
Non-Life Market Share:12.5% (3. Level)
GERMANY
Employees: 8.549
Life Ins. Market Share:3.7% (7. Level)
Non-Life Market Share:4.5% (7. Level)
ITALY
Life Ins. Market Share:1.0% (14. Level)
Non-Life Market Share:3.4% (9. Level)
Employees: 1.495
SWEDEN
Employees: 241
Life Ins. Market Share:0.4% (14. Level)
Non-Life Market Share:0.6% (17. Level)
2005 UFRS INCOME IN TERMS OF DISTRIBUTION CHANNEL
Dep. Distr. Channel
FranceAXA Equitable (USA)England Region(1)
Japan Life(2)
Germany(3)
BelgiumSouth EuropeItalySpainPortugalAustralia / New ZelandHong Kong(4)
Indep. Distr. Channel
61%
60%
27%
64%
54%
11%
69%
90%
53%
53%
7%
87%
39%
40%
73%
36%
46%
89%
31%
10%
47%
47%
93%
13%
(1) Reference: 2005 Annual Report – UFRS (International Financial ReportingStandards) portion share owned by distribution channel in England(2) In Terms of APE (annual policy premium)(3) Only sales function (DVT, AVT, DAF, MVT, IVT, Partn. & JV)(4) The best forecast for reporting
NETHERLAND
Employees: 648
Life Ins. Market Share:2.0% (9. level)
Non-Life Market Share:1.3% (22. level)
LUXEMBURG
Employees: 221
Life Ins. Market Share:6.6% (5. level)
Non-Life Market Share:11.4% (3. level)
MOROCCO
Employees: 526
Life Ins. Market Share:23.3% (1. level)
Non-Life Market Share:16.8% (2. level)
TURKEY
Life Ins. Market Share:7.74% (4. level)
Non-Life Market Share:11.96% (2. level)
Employees: 605
From the date of December, 31, 2005
AXA Assistance: 3.639 - AXA Corporate Solutions: 1.159 employees - AXA Investment Management: 2.430 employees.
POLAND
Employees: 72
Non-Life Market Share: NI
28
AXA GROUP COMPANIES
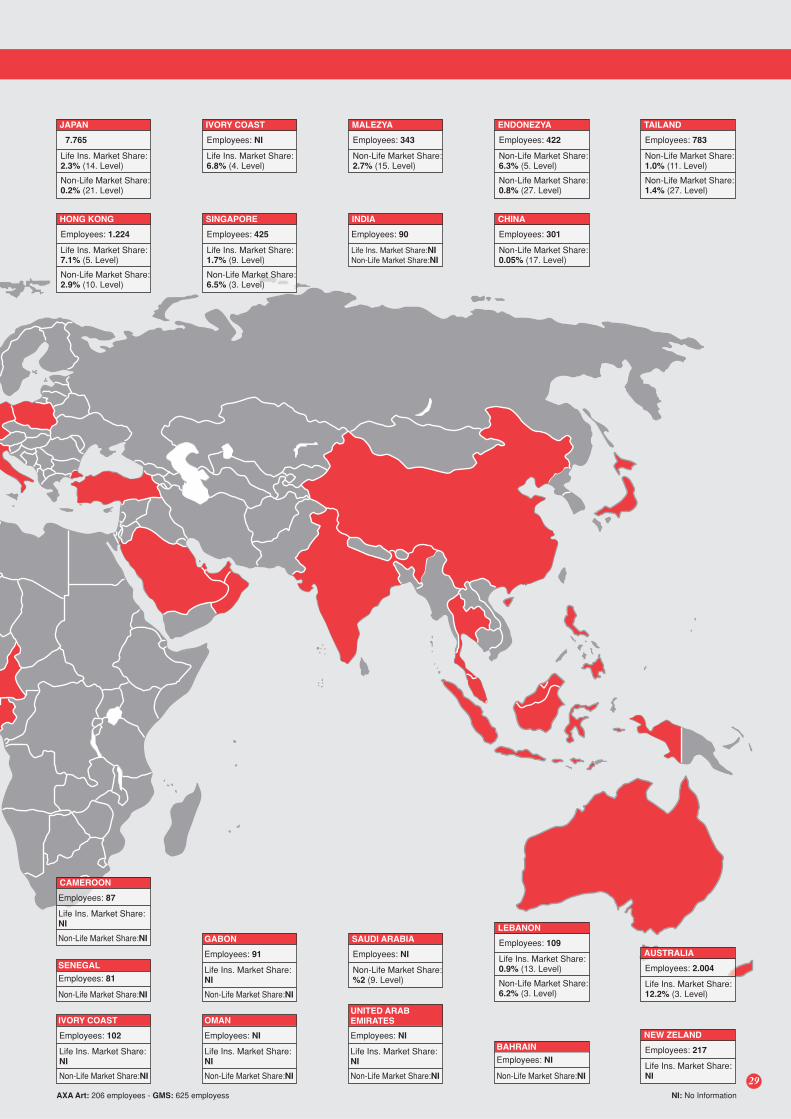
JAPAN
7.765
Life Ins. Market Share:2.3% (14. Level)
Non-Life Market Share:0.2% (21. Level)
IVORY COAST
Employees: NI
Life Ins. Market Share:6.8% (4. Level)
MALEZYA
Employees: 343
Non-Life Market Share:2.7% (15. Level)
TAILAND
Employees: 783
Non-Life Market Share:1.0% (11. Level)
Non-Life Market Share:1.4% (27. Level)
ENDONEZYA
Employees: 422
Non-Life Market Share:6.3% (5. Level)
Non-Life Market Share:0.8% (27. Level)
HONG KONG
Employees: 1.224
Life Ins. Market Share:7.1% (5. Level)
Non-Life Market Share:2.9% (10. Level)
SINGAPORE
Employees: 425
Life Ins. Market Share:1.7% (9. Level)
Non-Life Market Share:6.5% (3. Level)
INDIA
Employees: 90
Life Ins. Market Share:NINon-Life Market Share:NI
CHINA
Employees: 301
Non-Life Market Share:0.05% (17. Level)
IVORY COAST
Life Ins. Market Share:NI
Non-Life Market Share:NI
Employees: 102
OMAN
Life Ins. Market Share:NI
Non-Life Market Share:NI
Employees: NI
GABON
Life Ins. Market Share:NI
Non-Life Market Share:NI
Employees: 91
UNITED ARABEMIRATES
Life Ins. Market Share:NI
Non-Life Market Share:NI
Employees: NI
BAHRAIN
Employees: NI
Non-Life Market Share:NI
LEBANON
Life Ins. Market Share:0.9% (13. Level)
Non-Life Market Share:6.2% (3. Level)
Employees: 109SAUDI ARABIA
Non-Life Market Share:%2 (9. Level)
Employees: NI AUSTRALIA
Life Ins. Market Share:12.2% (3. Level)
Employees: 2.004
AXA Art: 206 employees - GMS: 625 employess
NEW ZELAND
Life Ins. Market Share:NI
Employees: 217
NI: No Information
SENEGAL
Employees: 81
Non-Life Market Share:NI
CAMEROON
Life Ins. Market Share:NI
Non-Life Market Share:NI
Employees: 87
29
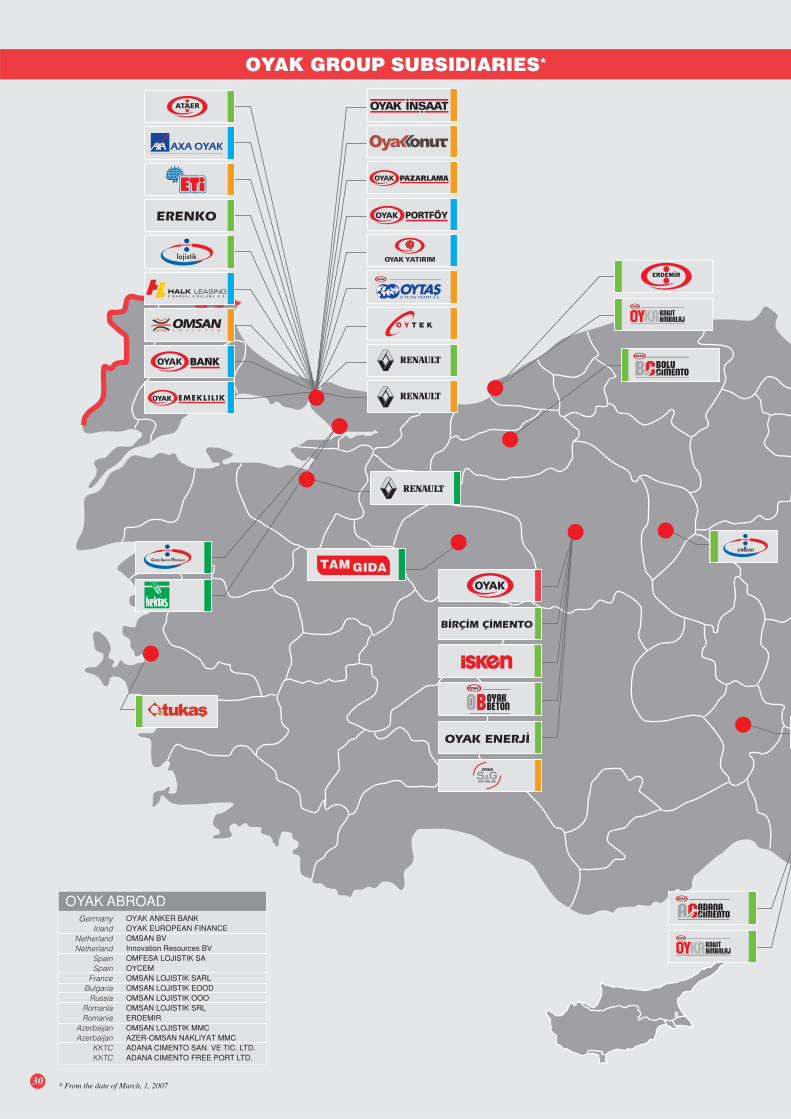
30 * From the date of March, 1, 2007
B‹RÇ‹M Ç‹MENTO
OYAK ENERJ‹
ERENKO
OYAK ANKER BANKOYAK EUROPEAN FINANCEOMSAN BVInnovation Resources BVOMFESA LOJISTIK SAOYCEMOMSAN LOJISTIK SARLOMSAN LOJISTIK EOODOMSAN LOJISTIK OOOOMSAN LOJISTIK SRLERDEMIROMSAN LOJISTIK MMCAZER-OMSAN NAKLIYAT MMCADANA CIMENTO SAN. VE TIC. LTD.ADANA CIMENTO FREE PORT LTD.
GermanyIrland
NetherlandNetherland
SpainSpain
FranceBulgaria
RussiaRomaniaRomania
AzerbaijanAzerbaijan
KKTCKKTC
OYAK ABROAD
OYAK GROUP SUBSIDIARIES*
31
OYAK BANKOYAK PORTFOY YONETIMI
AXA OYAK HOLDINGAXA OYAK SIGORTAAXA OYAK HAYAT SIGORTA
OYAK YATIRIM MENKUL DEGERLEROYAK EMEKLILIKHALK FINANSAL KIRALAMA
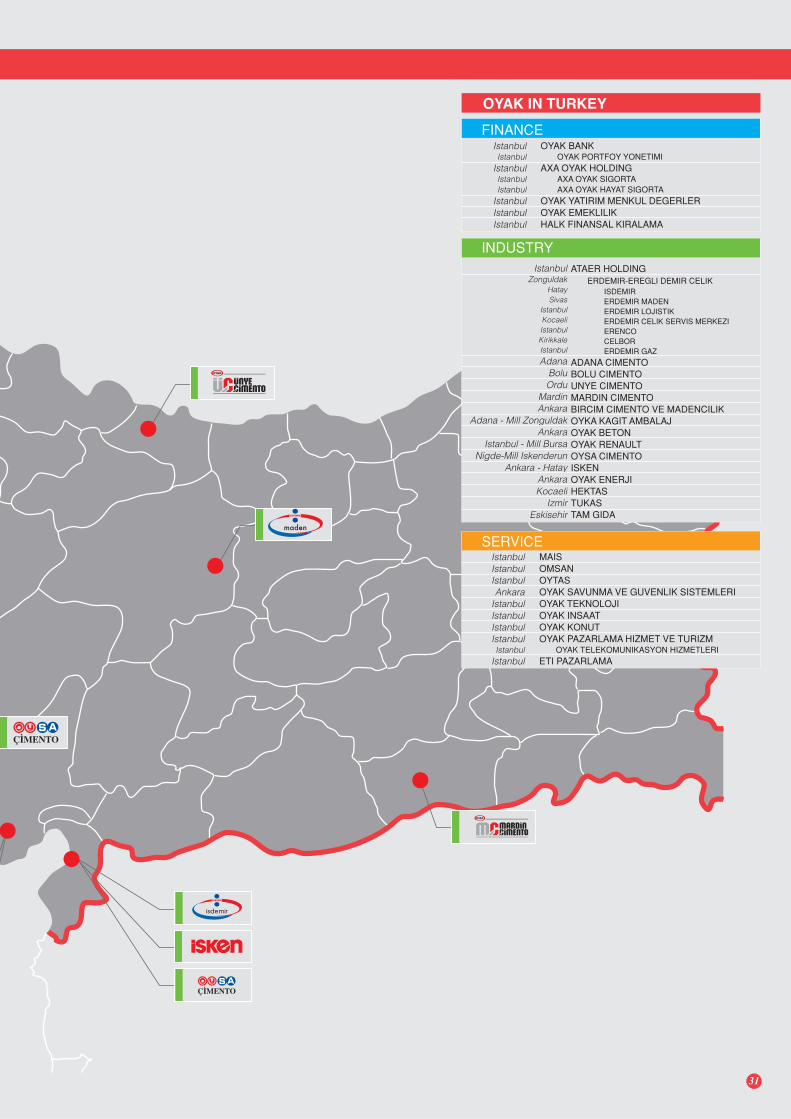
FINANCEIstanbulIstanbul
IstanbulIstanbulIstanbul
IstanbulIstanbulIstanbul
MAISOMSANOYTASOYAK SAVUNMA VE GUVENLIK SISTEMLERIOYAK TEKNOLOJIOYAK INSAATOYAK KONUTOYAK PAZARLAMA HIZMET VE TURIZM
OYAK TELEKOMUNIKASYON HIZMETLERIETI PAZARLAMA
SERVICEIstanbulIstanbulIstanbulAnkara
IstanbulIstanbulIstanbulIstanbulIstanbul
Istanbul
INDUSTRYIstanbul
ZonguldakHataySivas
IstanbulKocaeliIstanbulKirikkaleIstanbul
AdanaBoluOrdu
MardinAnkara
Adana - Mill ZonguldakAnkara
Istanbul - Mill BursaNigde-Mill Iskenderun
Ankara - HatayAnkaraKocaeli
IzmirEskisehir
OYAK IN TURKEY
ATAER HOLDINGERDEMIR-EREGLI DEMIR CELIK
ISDEMIR ERDEMIR MADEN ERDEMIR LOJISTIK ERDEMIR CELIK SERVIS MERKEZI ERENCO CELBOR
ERDEMIR GAZ
ADANA CIMENTOBOLU CIMENTOUNYE CIMENTOMARDIN CIMENTOBIRCIM CIMENTO VE MADENCILIKOYKA KAGIT AMBALAJOYAK BETONOYAK RENAULTOYSA CIMENTOISKENOYAK ENERJIHEKTASTUKASTAM GIDA
32
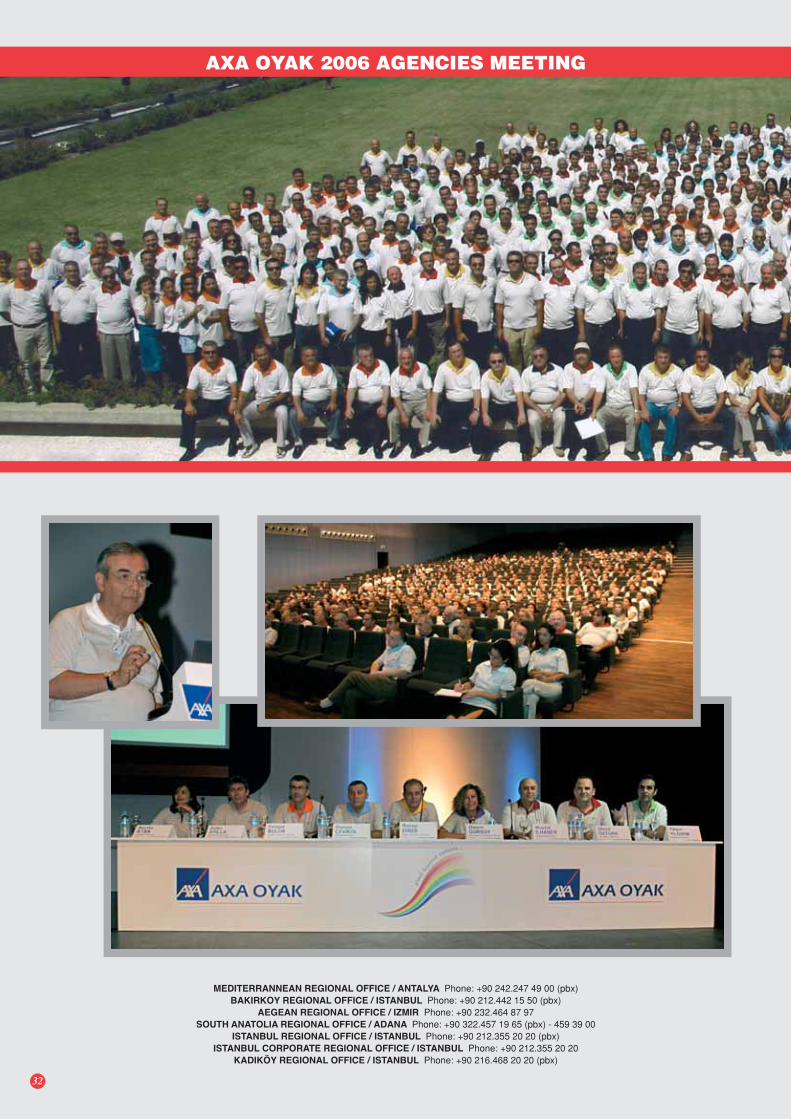
AXA OYAK 2006 AGENCIES MEETING
MEDITERRANNEAN REGIONAL OFFICE / ANTALYA Phone: +90 242.247 49 00 (pbx)BAKIRKOY REGIONAL OFFICE / ISTANBUL Phone: +90 212.442 15 50 (pbx)
AEGEAN REGIONAL OFFICE / IZMIR Phone: +90 232.464 87 97SOUTH ANATOLIA REGIONAL OFFICE / ADANA Phone: +90 322.457 19 65 (pbx) - 459 39 00
ISTANBUL REGIONAL OFFICE / ISTANBUL Phone: +90 212.355 20 20 (pbx)ISTANBUL CORPORATE REGIONAL OFFICE / ISTANBUL Phone: +90 212.355 20 20
KADIKÖY REGIONAL OFFICE / ISTANBUL Phone: +90 216.468 20 20 (pbx)

33
BLACKSEA REGIONAL OFFICE / SAMSUN Phone: +90 362.432 60 50 (pbx)MARMARA REGIONAL OFFICE / BURSA Phone: +90 224.222 02 22 (pbx)
CENTRAL ANATOLIA REGIONAL OFFICE / ANKARA Phone: +90 312.232 20 30 (pbx) - 231 28 88DEN‹ZL‹ REPRESENTATIVE OFFICE / DENIZLI Phone: +90 258.213 40 90 - 213 67 70
ERZURUM REPRESENTATIVE OFFICE / ERZURUM Phone: +90 442.233 11 37KKTC BRANCH OFFICE / LEFKOSA Phone: +90 392.228 73 85
AXA OYAK
HEAD QUARTER
Meclis-i Mebusan Cad. No.15 Salipazari 34427 Istanbul / TURKEYPhone: 0212 334 24 24 Fax: 0212 252 15 15
www.axaoyak.com.tr • [email protected]
Be Life Confident