Embed Size (px)
Citation preview
Sound Control
28 | November 2015 | audioxpress.com
ax
We seldom take note of the humble beginnings from which modern science was developed. Galileo based his theory of the behavior of pendulums on observations he made of a swinging chandelier,
while he was not paying attention during Mass. His timing instrument was his own heartbeat. When W. C. Sabine made the measurements upon which he based his landmark theory of architectural acoustics, he used mouth-blown organ pipes as signal generators, his ears as detectors, and a stopwatch for timing. Early acoustics investigators using electrical instruments obtained better repeatability by using calibrated test microphones such as the Western Electric 640AA.
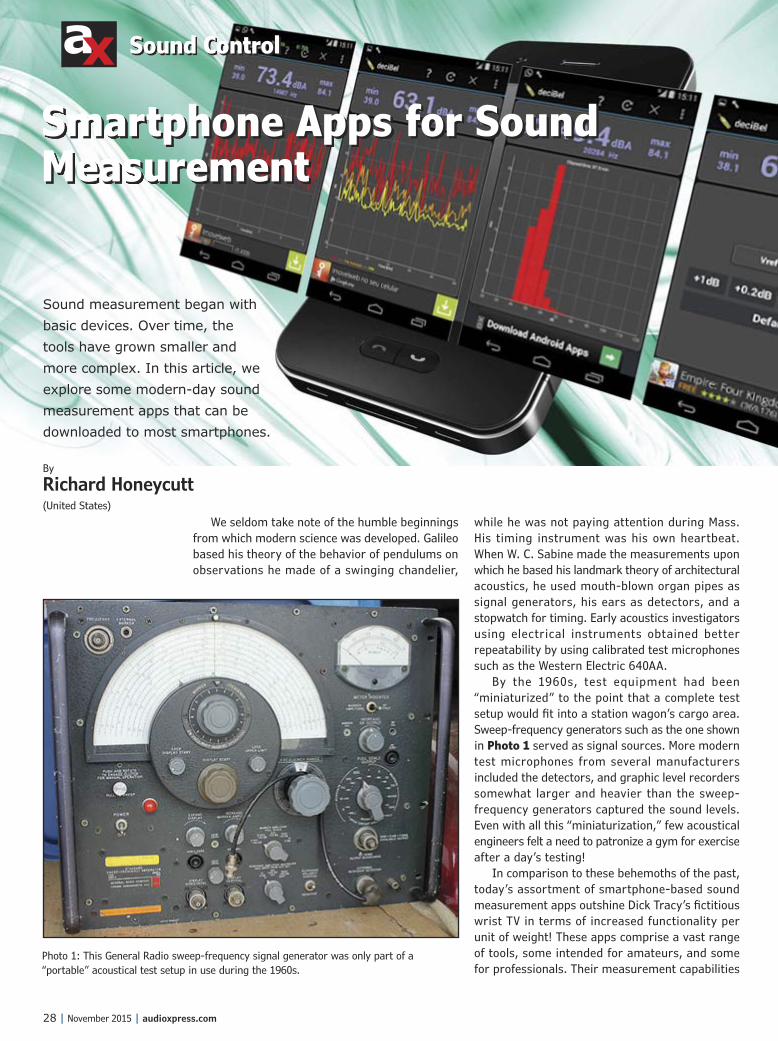
By the 1960s, test equipment had been “miniaturized” to the point that a complete test setup would fit into a station wagon’s cargo area. Sweep-frequency generators such as the one shown in Photo 1 served as signal sources. More modern test microphones from several manufacturers included the detectors, and graphic level recorders somewhat larger and heavier than the sweep-frequency generators captured the sound levels. Even with all this “miniaturization,” few acoustical engineers felt a need to patronize a gym for exercise after a day’s testing!
In comparison to these behemoths of the past, today’s assortment of smartphone-based sound measurement apps outshine Dick Tracy’s fictitious wrist TV in terms of increased functionality per unit of weight! These apps comprise a vast range of tools, some intended for amateurs, and some for professionals. Their measurement capabilities
ax
By
Richard Honeycutt(United States)
Smartphone Apps for Sound Measurement
Photo 1: This General Radio sweep-frequency signal generator was only part of a “portable” acoustical test setup in use during the 1960s.
Sound measurement began with basic devices. Over time, the tools have grown smaller and more complex. In this article, we explore some modern-day sound measurement apps that can be downloaded to most smartphones.

audioxpress.com | November 2015 | 29
extend from simple noise level measurements to comprehensive acoustical/electroacoustical test platforms.
Measurement Shortcomings in Smartphone Devices
Before we examine the apps themselves, a few words are in order about the devices on which they run. As you know, smartphones come in three basic varieties: Apple iOS, Android, and Windows. (Blackberry devices seem to support only sound playback.) None of these systems was created with audio/acoustical testing foremost in mind. As a result, they all share certain weaknesses for testing applications. One of these is the user’s presumed expectation that (s)he can just use the internal microphone. Since the microphone systems were primarily designed for speech, most do not have good response below about 300 Hz. This weakness can be addressed by the use of a calibrated external test microphone and preamplifier, if the mobile device can accept an input from these.
Another weakness is the sampling frequency. Some models sample at 8 kHz, leading to a Nyquist frequency (theoretically highest usable frequency) of 4 kHz. Some later models sample at frequencies up to 48 kHz, allowing for measurements slightly beyond the top of the human hearing range.
The third weakness is latency—the “waiting time” involved in internal digital processing. Latency imposes very real limits on the implementation of any measurement system using digital processing.
Apple devices use a core audio system that enables very low latency. Android has been improving its audio core in recent years, but the basic OS architecture prohibits Android from achieving the level of latency performance that Apple provides.
Worldwide, approximately 80% of smartphones
Photo 2: The “Too Loud?” app has a simple display that can be seen from some distance.
Table 1: In this listing of sound level meter apps, “SPL” indicates that no weighting, “fast,” or “slow” options are indicated in the website information. Not all links will be available in all app stores outside of the US.
App NameSPL
Modes Platform Website Information
Advanced decibel Meter SPL A iOS https://itunes.apple.com/us/app/advanced-decibel-meter/id595718101?mt=8
Advanced decibel Meter SPL A Android https://itunes.apple.com/us/app/advanced-decibel-meter/id595718101?mt=8
dB Volume meter SPL iOS https://itunes.apple.com/us/app/db-volume-meter/id592769907?mt=8
deciBel SPL Android https://play.google.com/store/apps/details?id=bz.bsb.decibel&hl=en
Decibel Meter SPL Android https://play.google.com/store/apps/details?id=cn.menue.decibelmeter&hl=en
Decibel Meter SPL Windows www.windowsphone.com/en-us/store/app/decibel-meter-free/6c7ae110-5a64-e011-81d2-78e7d1fa76f8
Decibel 10th SPL iOS https://itunes.apple.com/us/app/decibel-10th/id448155923?mt=8
Noise Meter SPL Windows www.windowsphone.com/en-us/store/app/noise-meter/c68f7156-9c86-480b-a44e-87ba6b5639f1
Sound Meter PRO SPL Android https://play.google.com/store/apps/details?id=com.soundmeter.app&hl=en
TooLoud? SPL iOS https://itunes.apple.com/us/app/tooloud-pro/id425137981?mt=8

Sound Control
30 | November 2015 | audioxpress.com
ax
and 60% of tablets use Android. Yet, because of the audio limitations, by far the greatest number of sound measurement apps are ported for iOS, with fewer for Android, and very few for Windows.
Sound Measurement AppsThe greatest number of sound-measurement-
related apps is sound level meters. Table 1 shows a representative listing. Since a comprehensive listing would be a moving target, with new apps being released all the time, this listing makes no claim of covering all available apps.
I should mention that the information in this table is the best that I could find on the Internet. Many apps do not have printed specifications, although some pages do link to videos. The videos may contain further specifications, but I do not consider a video to be a professional means of conveying specifications, so I did not examine them. Photos 2–6 show screenshots of a few of Photo 5: The “dB Volume Meter” shows an LED pictorial-style SPL indication.
Photo 3: The “Decibel Meter” screen has a speedometer-style sound pressure level (SPL) display.
Photo 4: The “Decibel 10th” screen uses a VU-meter-style display.

audioxpress.com | November 2015 | 31
these sound level meter apps. As you can see, the displays betray the developers’ concept of the target user, from cute and simple to professional and informative. The “Too Loud?” app shows sound levels with a color-coded display that turns redder as the sound gets louder (see Photo 2). The “Decibel Meter” shows the sound pressure level (SPL) in the upper part of the screen, and the noise waveform in the lower part (see Photo 3). The “Decibel 10th“ display shows the sound level on a VU-meter-style display (see Photo 4), where “0 VU” corresponds to 75 dB, which is about the maximum safe level for an 8-hour exposure. The noise waveform appears at the top. The “dB Volume Meter” shows the maximum, minimum, peak, and “peak-hold” values on an LED-style graphic. As illustrated in the right-hand section of Photo 5, this app supports the use
of external microphones and can be appropriately calibrated for microphone use. The “deciBel” screen shown in Photo 6 displays the sound level’s minimum, average, and maximum values, showing both numerical values and waveforms. A-weighting is available in this app.
App AssessmentsProbably because sound level meters are the
most commonly used sound measurement devices, several studies have been published in which some of these devices have been assessed. Chucri Kardous and Peter Shaw of the National Institute for Occupational Safety and Health (NIOSH) published a paper in the Journal of the Acoustical Society of America (JASA) Express Letters, April, 2014, in which they concluded that:
Photo 6: The “deciBel” screen can show the values and the waveforms corresponding to the minimum, average, and maximum values of the noise.
App NameSPL
ModesRTA
ModesFFT
ModesOther Modes
Included Signal
Generator Platform Website Information
Analyzer
SPL, LEQ, A, B, C, Z
wtg,response
times
RTA FFT 1k–64k
whitepinksine
iOS http://dspmobile.de/2012/10/analyzer-2-0
Audio Analyzer SPL 1/12–1
RTAFFT
256–64kSpectrogram
scope iOS https://itunes.apple.com/us/app/audio-analyzer/id681184981
Etani RTA & RTA Pro 1/6–1 RTA pink iOS http://www.etani.co.jp/eng/
en-product
Spectrum Analyzer SPL all, pk 1/3 RTA FFT
white pinksine
iOShttps://itunes.apple.com/us/app/
spectrum-analyzer-real-time/id490078884
Table 2: There are only a few real-time analyzer apps available for smartphones.

Sound Control
32 | November 2015 | audioxpress.com
ax
• “Certain measurement apps for Apple smartphones and tablets may be considered accurate and reliable to be used to assess occupational noise exposures.”
• “Android and Windows developers do not offer apps that meet the functionality needed for occupational noise assessments.”
• “Field measurement results may vary greatly due to the effect of temperature, humid i t y, l o ng - t e rm u s e , o b j e c t interference, and overall stability of the microphone and electronics in these devices.”
• The same app used on different generations of iOS devices yielded somewhat different results.
The accuracy of these measurements was determined in comparison to a newly-calibrated Larsen-Davis model 831, Type 1 sound level meter using a model 2559 random-incidence microphone. Deviations varied from 0.07 dB for unweighted measurements to well over 10 dB for the worst case. It would seem to be mandatory that the accuracy of any smartphone/app combination be measured before one relies on it for critical measurements.
D. R. Nast, W. S. Speer, and C.G. Le Prell of the University of Florida compared five iOS-based sound level measurement apps with a Brüel & Kjaer 2250 SLM. They found significant variability in the accuracy, frequency response, and linearity of the apps tested, with differences in unweighted measurements reaching 15 dB, and weighting errors up to 9 dB. These authors concluded, “Unless the accuracy of an app has been determined, consumers should be hesitant to trust noise level estimates based solely on the app-based measurements.”
I should point out that in both studies, certain apps performed very well, so that users who invest the time and effort to evaluate research studies that have been performed before deciding on an app may achieve excellent results, within the unknown limits of environmental stability of the smartphone microphone and circuitry.
Real-Time Analyzer AppsWhile many audio practitioners routinely use
real-time analyzers (RTAs), there are far fewer RTA apps than sound level meter apps. Table 2 shows some RTA apps.
Screenshots from two RTA apps are shown in Photo 7 and Photo 8. The Etani RTA app shown in Photo 7 has a built-in pink noise source and supports the use of an external microphone, for whose properties the app can be calibrated.
Photo 8: This photo shows both the real-time analyzer (RTA) and a partial Fast Fourier Transform (FFT) display from the Analyzer 2.5 app.
Photo 7: The Etani RTA and RTA Pro apps display decibels of sound pressure level (dBSPL) with resolutions from 1 to 1/6 octaves.

audioxpress.com | November 2015 | 33
There are two versions of this app: the free one is designated as the Etani RTA, and the paid one is the Etani RTA Pro. Differences between the two versions are described on the website (www.etani.co.jp).
The Analyzer app (see Photo 8) includes the RTA and the Fast Fourier Transform (FFT) modes, and provides RTA bandwidths from 1/2000 octave to a full octave, as well as “fast” and “slow” response times. It also supports the use of an external microphone, and calibration can be performed manually or automatically.
Apps Intended for Professional UseTable 3 lists some apps that are intended
more for professional use than the ones discussed thus far. All of these apps except for iSTI and Spectrogram Pro provide FFT analysis, and three also display response in RTA fashion. Most of them have built-in signal generators—either pink noise or a choice of pink, white, or sine signals.
Photo 9 shows a screenshot from ClapIR, a unique app that uses a handclap as a signal source. This approach was discussed in a paper presented by Prem Seetharaman and Stephen P. Tarzia at the 132nd Audio Engineering Society (AES) Convention.
Table 3: This is a list of Fast Fourier Transform (FFT) and special-purpose apps.
App Name
SPL Modes
RTA Modes
FFT Modes
Other Modes
Included Signal
Generator Platform Website Informaiton
AnalyzerSPL, LEQ, wtg, resp
timesRTA FFT
1k-64k white/pink/sine iOS http://dspmobile.de/2012/10/analyzer-2-0
Audio Analyzer SPL 1/12-1
RTAFFT
256-64kSpectrogram oscilloscope iOS https://itunes.apple.com/us/app/audio-analyzer/
id681184981
Etani RTA & RTA Pro 1/6-1 RTA pink iOS www.etani.co.jp/eng/en-product
Spectrum Analyzer
SPL all, pk 1/3 RTA FFT white/pink/
sine iOS https://itunes.apple.com/us/app/ spectrum-analyzer-real-time/id490078884
FFT Plot FFT 16k iOS https://itunes.apple.com/us/app/fft-plot-real-time-sound-frequency/id569468015
Octave RTA FFT 8k iOS https://itunes.apple.com/us/app/octave-rta-real-time-sound/id569156857
Audio Tools[Detailed in audioXpress,
December 2015]
iOS www.studiosixdigital.com/
ClapIR FFT RT iOS https://stevetarzia.com/clapir.php
RoomSCOPE RT white/pink/lin&log chirp iOS www.faberacoustical.com/ios_apps/
iSTI SPL A STIPA STIPA iOS www.embeddedacoustics.com/index.php/isti
SPLnFFTSPL A, B, C, ITU-R 468; LEQ
FFT iOS https://itunes.apple.com/us/app/splnfft-noise-meter/id355396114
Spectrogram Pro FFT iOS https://itunes.apple.com/us/app/
spectrogram-pro-super-smooth/id415301721
Photo 9: The ClapIR app uses a handclap as a signal source for RT and frequency response measurements in rooms.
Sound Control
34 | November 2015 | audioxpress.com
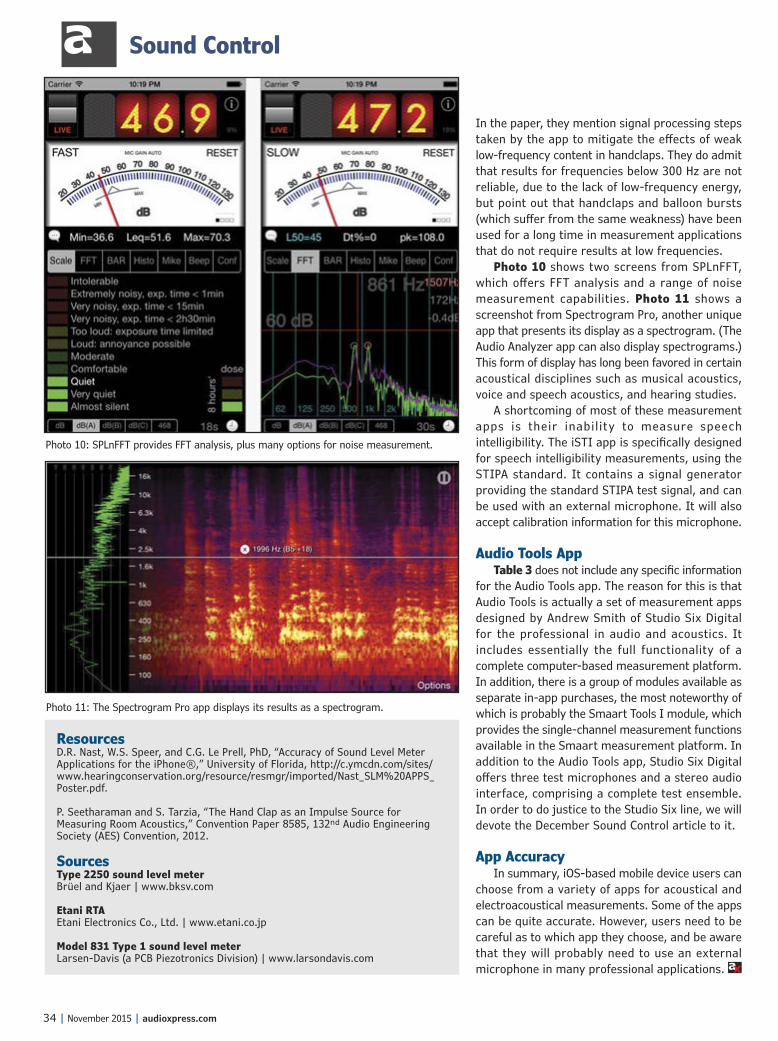
axIn the paper, they mention signal processing steps taken by the app to mitigate the effects of weak low-frequency content in handclaps. They do admit that results for frequencies below 300 Hz are not reliable, due to the lack of low-frequency energy, but point out that handclaps and balloon bursts (which suffer from the same weakness) have been used for a long time in measurement applications that do not require results at low frequencies.
Photo 10 shows two screens from SPLnFFT, which offers FFT analysis and a range of noise measurement capabilities. Photo 11 shows a screenshot from Spectrogram Pro, another unique app that presents its display as a spectrogram. (The Audio Analyzer app can also display spectrograms.) This form of display has long been favored in certain acoustical disciplines such as musical acoustics, voice and speech acoustics, and hearing studies.
A shortcoming of most of these measurement apps is their inabilit y to measure speech intelligibility. The iSTI app is specifically designed for speech intelligibility measurements, using the STIPA standard. It contains a signal generator providing the standard STIPA test signal, and can be used with an external microphone. It will also accept calibration information for this microphone.
Audio Tools AppTable 3 does not include any specific information
for the Audio Tools app. The reason for this is that Audio Tools is actually a set of measurement apps designed by Andrew Smith of Studio Six Digital for the professional in audio and acoustics. It includes essentially the full functionality of a complete computer-based measurement platform. In addition, there is a group of modules available as separate in-app purchases, the most noteworthy of which is probably the Smaart Tools I module, which provides the single-channel measurement functions available in the Smaart measurement platform. In addition to the Audio Tools app, Studio Six Digital offers three test microphones and a stereo audio interface, comprising a complete test ensemble. In order to do justice to the Studio Six line, we will devote the December Sound Control article to it.
App AccuracyIn summary, iOS-based mobile device users can
choose from a variety of apps for acoustical and electroacoustical measurements. Some of the apps can be quite accurate. However, users need to be careful as to which app they choose, and be aware that they will probably need to use an external microphone in many professional applications. ax
ResourcesD.R. Nast, W.S. Speer, and C.G. Le Prell, PhD, “Accuracy of Sound Level Meter Applications for the iPhone®,” University of Florida, http://c.ymcdn.com/sites/www.hearingconservation.org/resource/resmgr/imported/Nast_SLM%20APPS_Poster.pdf.
P. Seetharaman and S. Tarzia, “The Hand Clap as an Impulse Source for Measuring Room Acoustics,” Convention Paper 8585, 132nd Audio Engineering Society (AES) Convention, 2012.
SourcesType 2250 sound level meterBrüel and Kjaer | www.bksv.com
Etani RTA Etani Electronics Co., Ltd. | www.etani.co.jp
Model 831 Type 1 sound level meterLarsen-Davis (a PCB Piezotronics Division) | www.larsondavis.com
Photo 10: SPLnFFT provides FFT analysis, plus many options for noise measurement.
Photo 11: The Spectrogram Pro app displays its results as a spectrogram.