Embed Size (px)
Citation preview
AVIAN COMqUNITIES: APPROACHES TO DESCRIBING THEIR HABITAT ASSOCIATIONS
Gerald J. Niemi
Lee Pfannmuller_ /
Abstract.--Four approaches are presented which enable wildlife
managers to consider many avian species simultaneously inmanagement objectives. The northeastern Minnesota avifauna is
used to test each approach. Three approaches included theclassification of avian species into structural successional
stages, life forms, or their sociological associations. The
fourth approach, habitat niche, depicts species response toquantitative habitat variables. The background, methods, data
analysis, interpretation, and advantages/disadvantages of eachapproach are discussed.
INTRODUCTION Species Associations - a multivariate approachthat identifies species with similar distri-
Wildlife managers are faced with the dif- butions across a range of defined communities.ficult task of predicting the impacts of habi-
tat alterations on wildlife species. Histori- Habitat Niche Analysis - a multivariate
cally, their predictions have been based on approach that assumes species occupy a mathe-
empirical data or broadly defined "animal matically definable habit hyperspace.conmunities." During the last ten to fifteen
years, however, the ease of assimilating and Each approach was utilized in an attempt to
integrating large quantities of data by com- model songbird populations from northeasternputer has broadened the range of techniques Minnesota. The successional stage and life
available for modeling natural systems. Our form models were examined with data from pub-
objective is To define and describe four lished reports, our own unpnblished data, andmanagement approaches that are currently empirical data. The species association modelavailable to managers for modeling bird was modified from the work of Pfannmullerpopulations. We will briefly discuss the [19799, while the habitat niche model was
background, methods, data analysis, inter- modified from the work of Niemi (1977).pretation, and major advantages and disad-
vantages of each approach. Hopefully, thesediscussions will provide recommendations for Natural Setting
guiding the future dir_ctioE of non-game
bird management. The glacially-influenced landforms of
northeastern Minnesota (Wright and Watts 1969;The four approaches considered in the Ol¢ott and Siegal 1978) support a rich mosaic
following pages are: of upland and lowland forests (Ohmann and Ream1971; Grigal and Ohmann 1975; Dean 1971).
Successional Stages - a simplistic approach Throughout the region glacially depositedthat identifies the bird species associated features such as end moraines, drumlin fields
with forest types along successional era- and glacial lake beds dominate the terrain.
dients. This topographical diversity is reflected by
similar diversity among vegetation cover Types.Life Form Associations - a multi-level Located in aE ecotone between the northern
approach that identifies assemblages Of boreal forests and the eastern deciduous forests
species with similar reproductive and of North America, the transitional plant co_nu-feeding strategies, nities of northeastern Minnesota have been
described by several plant ecologists slnce
I_/ Niemi ls a biologist for the Department Cooper's (1913) original work on Isle Royale.of Biology and Lake Superior Basin Studies
Center at the University of Minnesota in The original vegetation of northeastern
Duluth and Pfannmuller is a biologist for Minnesota consisted of a complex mosaic of redthe Minerals Division of the Minnesota pine (Pinus resinosa), jack pine (Pinus bank-
Department of Natural Resources in St. Paul. siana), and white pine (Pinus strobus) forests,
154
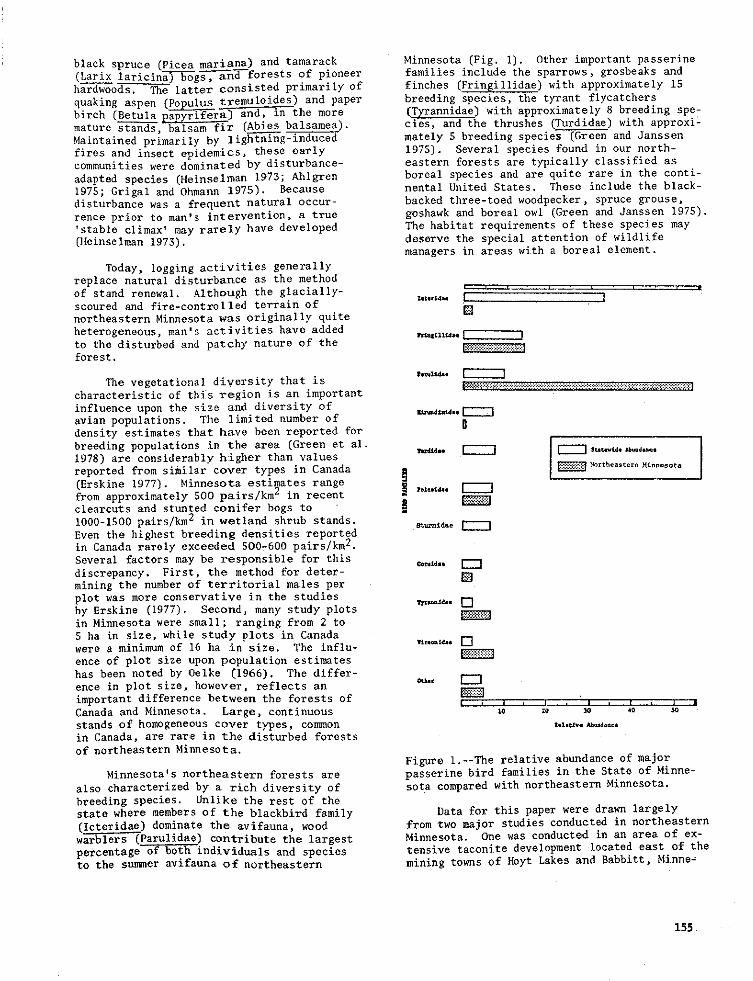
black spruce (Picea mariana) and tamarack Minnesota (Fig. 1). Other important passerine
(Larix lariclna--_-5-ogs,ah-d--forests of pioneer families include the sparrows, grosbeaks andhardwoods. The latter consisted primarily of finches (Frin_illidae) with approximately 15
quaking aspen (PODUlUS tremuloides) and paper breeding species, the tyrant flycatchers
blrch (Betula papyrifera) ana, in e more (T_rannidae) with approximately 8 breeding ape-mature stands, balsam fir (.Abies balaamea), eies, and the thrushes (Turdidae) with approxi 2Maintained primarily by lightning-induced mately 5 breeding species (Green and Janssen
fires and insect epidemics, these early 1975). Several species found in our north-communities were dominated by disturbance- eastern forests are typically classified as
adapt0d species (Heinselman 1973; Ahlgren boreal species and are quite rare in the conti-1975; Grigal and Ohmsnn 1975), Because nental United States. These include the black-
disturbance was a frequent natural occur- backed three-toed woodpecker, spruce grouse,fence prior to man's intervention, a true goshawk and boreal owl (Green and Janssen 1975).
'stable climax' may rarely have developed The habitat requirements of these species may(Heinselman 1973). deserve the special attention of wildlife
managers in areas with a boreal element.
Today, logging activities generallyreplace natural disturbance as the method
of stand renewal. Although the glacially- a . ,scoured and fire-controlled terrain of k,,,_,. ] I
northeastern Minnesota was originally quite []heterogeneous, man's activities have added
to the disturbed and patchy nature of the rr_s_n_*'l " --:fore st • ::: :::::::::::::::::::::::::::
The vegetational diversity that is h_. I I
characteristic of this region is an important _._%_;:_::_:%i_%_%_%_z_:_z:_`_¢:¢_.:.x_+_9:_+_x_:;:1
influence upon the size and diversity of L_X_L_U,*_ [avian populations. The limited number of
density estimates that have been reported for D
breeding populations in the area (Green et el.1978) are considerably higher than values ._u_ [ I [ ]s_,_._d_,,
reported from similar oover types in Canada m _:!e_:!:i;i_°rthea'tem_e'°ta
(Erskine 1977). Minnesota estimates rangefrom approximately 500 pairs/km z in recent ,o,_a_¢learcuts and stunted conifer bogs to _ _!:_:_i:i:|
1000-1500 pairs/km 2 in wetland shrub stands, m_l_e I IEven the highest breeding densities reportedin Canada rarely exceeded 500-600 pairs/km 2.
Several factors may be responsible for this _ l
discrepancy. First, the method for deter- _*"mining the number of territorial males perplot was more conservative in the studies
by Erskine (1977). Second, many study plots _,_u..in Minnesota were small; ranging from 2 to _::_:ii_:i:l
5 ha in size, while study plots in Canadawere a minimum of 16 ha in size. The influ- *_,.o_**_3
ence of plot size upon population estimates
has been noted by Oelke (1966). The differ-once in plot size, however, reflects an
important difference between the forests of __,tlll-,*li[ni|
Canada and Minnesota. Large, continuous *o zo _ _ostands of homogeneous cover types, co_mon _l.=***_=,,,in Canada, are rare in the disturbed forestsof northeastern Minnesota.
Figure 1,--The relative abundance of major
Minnesota's northeastern forests are passerine bird families in the State of Minne-
also characterized by a rich diversity of sota compared with northeastern Minnesota.breeding species. Unlike the rest of the
state where members of the blackbird family Data for this paper were drawn largely(Icteridae) dominate the avifauna, wood from two major studies conducted in northeastern
warblers (Parulidae) contribute the largest Minnesota. One was conducted in an area of ex-
percentage of both individuals and species tensive taconite development located east of theto the summer avifauna of northeastern mining towns of Hoyt Lakes and Babbitt, Minne_
sota (Pfannmuller 1979). The second study species should be given research priority in
was conducted in an area within and order to determine their habitat requirements
surrounding the 1971 Little Sioux burn, loca- and to determine if their population levelsted approximately 20 miles northwest of Ely, are stable or declining. Finally, managing
Minnesota and near the Island Lake Reservoir, species on the limits of their range may notapproximately 20 miles north of Duluth, benefit the species and their inclusion could
Minnesota (Niemi 1977). Other studies from negatively influence species indigenous to anwhich data were drawn include Todd and Doran area.
(1976), Green etal. (1978), gergstedt and
Neimi (1974), and Green (1971a). One of the primary reasons for defining a
species base was to focus attention on speciesthat were particularly dependent on vegetational
Bird Species and Data Base communities in northeastern Minnesota. Since
the data base was established after both the
Because more than 250 species of birds habitat niche and species association analysesare known to occur in northeastern Minnesota, were completed, some species that were excluded
we felt it was practical to limit the number from the data base, may be included in subse-of species considered in this paper. We quent tables and figures.defined our data base by including onlyterrestrial species that are summer resi-
dents. Terrestrial species were arbitrarily SUCCESSIONAL STAGE APPROACHdefined as species found in communities
ranging from the cattail-sedge marshes Background(where standing vegetation is present all
year) to the drier upland forests. Thus, we me general concept that birds selectexcluded species found in the emergent aqua- habitats based on the vegetation structure or
tic marshes (where vegetation is present habitat physiognomy has been expressed bythroughout much of the year) and open water several researchers (e.g., Lack 1933; Odum
areas. Species were further excluded if 1950; Svardson 1949; }linden 1965; James 197l).they could be classified into one of the Since succession has been described as an
following four categories: orderly process involving changes in the"structure" of habitats (Odum 1959), it seems
i. Man-adapted species found coF_only natural to classify bird species into communi-near settlements, towns, and cities; ties that are based on the structural cate-
gories found along successional gradients.
2 Species with specific habitat or In light of the relationship between bird
niche requirements; species and successiona] stages, it is surpri-sing to note that there are few systematic
3. Species in which we lack sufficient' inventories of the birds inhabiting various
data; and/or stages. £rskine (1977), after discussing thebirds of various forest t)_pes, coraments as
4. Species in northeastern Minnesota follows, "the need for systematic data o_ birdsthat are on the limit of their of successional and edge habitats could hardlybreeding range, be made more obvious." Nevertheless. some
pertinent data are a_ailable in Kendeigh (1945),The species data base and the classification Johnston and Odum (1956), Martin [1960),criteria are shown in table i. Haapanen (1965), Shugart and James (1973),
Holt [1974), and Erskine (1977).
_e concept of excluding specles may
seem contradictory to multiple speciesmanagement. However, limiting the number of Method
species in managemenz models is appropriate
if the limitations are based on sound ration- We defined a series of Ii forest typesale. For example, should species found in which are the predominant cover ty_ges found inassociation with man's settlements be northeastern Minnesota. They are described as
managed in forest ecosystems? Many of these fol{ows:
species are much more abundant today thanthey were in pre-settlement times (Graber Grassland-forbaceous - An open upland
and Graber 1963). Species with specific area that lacks trees and shrubs. _ehabitat requirements may require special flora is composed of grasses (Gramineae
management strategies, especially if those spp.) and a wide assortment of "weeds"requirements are limited in their availa- standing up to I m high. The cover type
bility, Species for which we are lacking is limited and occurs only in early clear-
data are particularly important These cuts, intensely burued areas, or settle-ments.
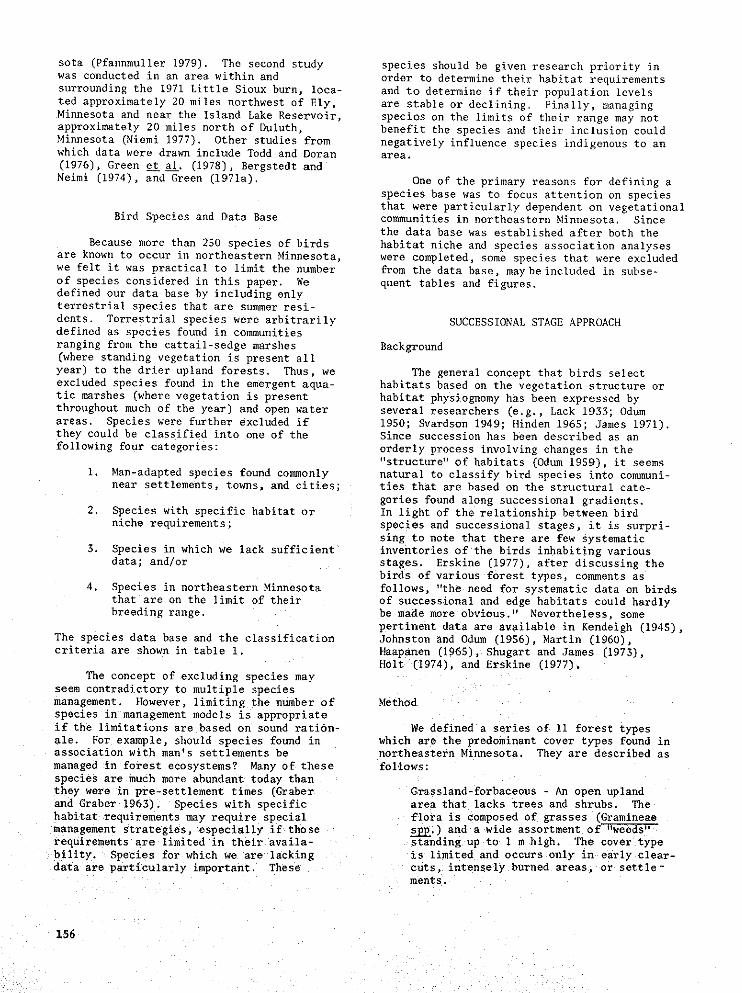
Tablel .--Bird species data base for northeastern Minnesota. Species list includes thoseconsidered to be summer residents excluding waterbirds such as loons, grebes, ducks, coot, gulls,
and terns as adapted from the annotated list in Green et al. (1978).
CLASSIFICATION,CRITERIA_/
SPECIES INCLUDED URBAN SPECIAL LACK RANGE
IN ADAPTED NEEDS OF DATA LIMITANALYSIS
Double-crested Cormorant XGreat Blue Heron XAmerican Bittern X
Turkey Vulture XGoshawk X
Cooper's Hawk X X
Sharp-shinned Hawk XRed-tailed Hawk X
Broad-winged Hawk XBald Eagle X_rsh Hawk X
Osprey XMerlin XAmerican Kestrel X
Spruce Grouse XRuffed Grouse XSandhill Crane X
Virginia Rail XSora XKilldeer X
American Woodcock X
Common Snipe X
Upland Plover XSpotted Sandpiper X
Mourning Dove X EBlack-billed Cuckoo E
Great Horned 0wl XBarred Owl X
Long-eared 0wl XXShort-eared Owl
Oonunon Nighthawk X
Chimney Swift X
Ruby-throated Hummingbird XBelted Kingfisher XCommon Flicker X
Pileated Woodpecker X
Red-headed Woodpecker XYellow-bellied Sapsucker X
Hairy Woodpecker XSaw-whet Owl X
Whip-poor-will X
Downy Woodpecker XBlack-backed 3-toed Wood X
Eastern Kingbird XGreat-crested Flycatcher XEastern Phoebe X
Yellow-bellied Flyeatcher X
Alder Flycatcher XLeast Flycatcher X
Eastern Wood Pewee XOlive-sided Flycatcher X
ree Swallow XBank Swallow X
Rough-winged Swallow X
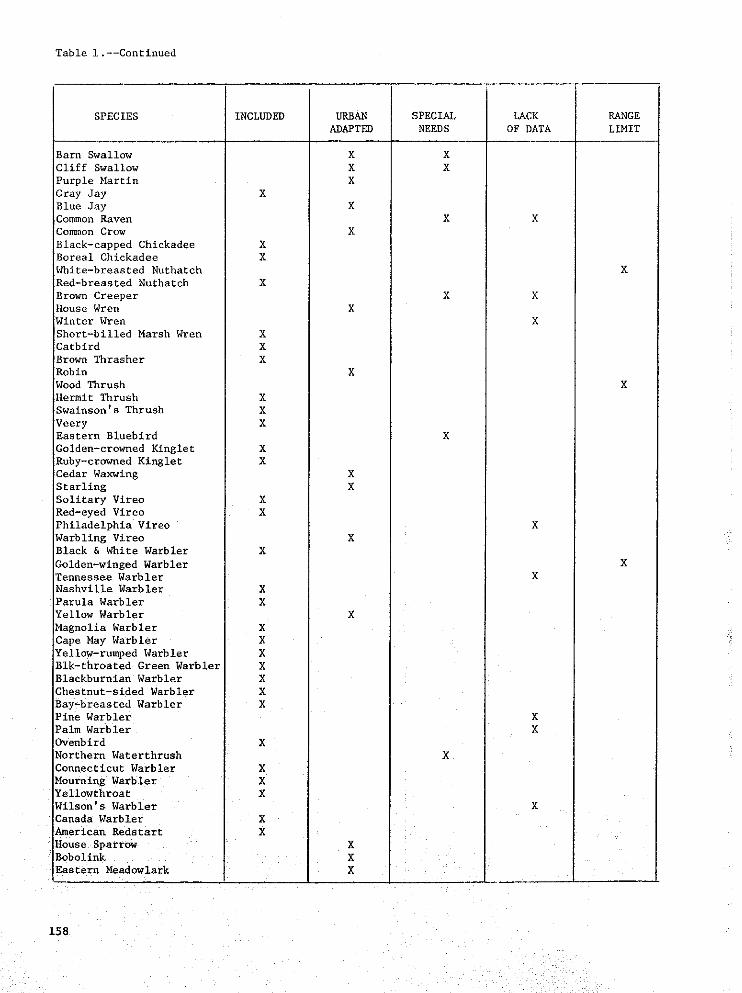
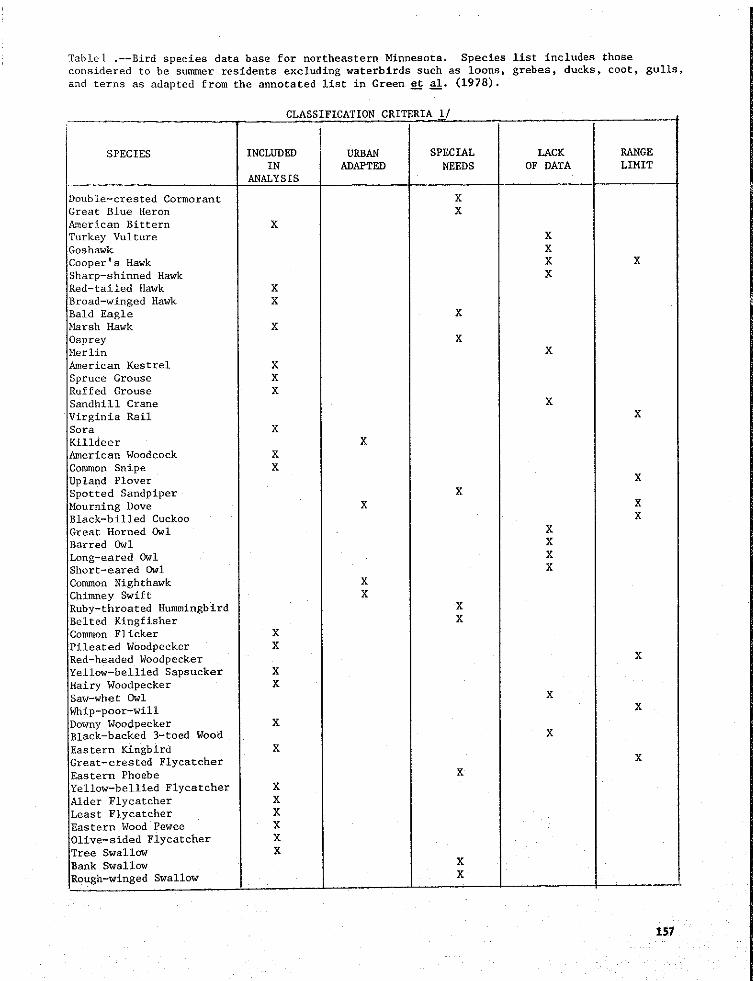
Table l.--Continued
SPECIES INCLUDED UEDAN SPECIAL LACK RANGEADAPTED NEEDS OF DATA LIMIT
Barn Swallow X XCliff Swallow X X
Purple Martin XGray Jay X
Blue Jay XCommon Raven X XCommon Crow X
Black-capped Chickadee XBoreal Chickadee X
White-breasted Nuthatch XRed-breasted Nuthatch X
Brown Creeper X XHouse Wren X
Winter Wren XShort-billed Marsh Wren X
Catbird XBrown Thrasher X
Robin X
Wood Thrush XHermit Thrush X
Swainson's Thrush X
Veery XEastern Bluebird X
Golden-crowned Kinglet X
Ruby-crowned Kinglet XCedar Waxwing X
Starling XSolitary Vireo X
Red-eyed Vireo XPhiladelphia Vireo X
Warbling Vireo XBlack & White Warbler X
Golden-winged Warbler XTennessee Warbler XNashville Warbler X
Parula Warbler XYellow Warbler N
M_gnolia Warbler XCape May Warbler X
Yellow-rumped Warbler XBlk-throated Green Warbler X
Blackhurnian Warbler XChestnut-sided Warbler X
Bay-breasted Warbler XPine Warbler X
Palm Warbler X
Ovenbird XNorthern Waterthrush X
Connecticut Warbler X
Mourning Warbler XYellowthroat X
Wllson's Warbler XCanada Warbler X
American Redstart X
House Sparrow XBobolink X
Eastern Meadowlark X
158
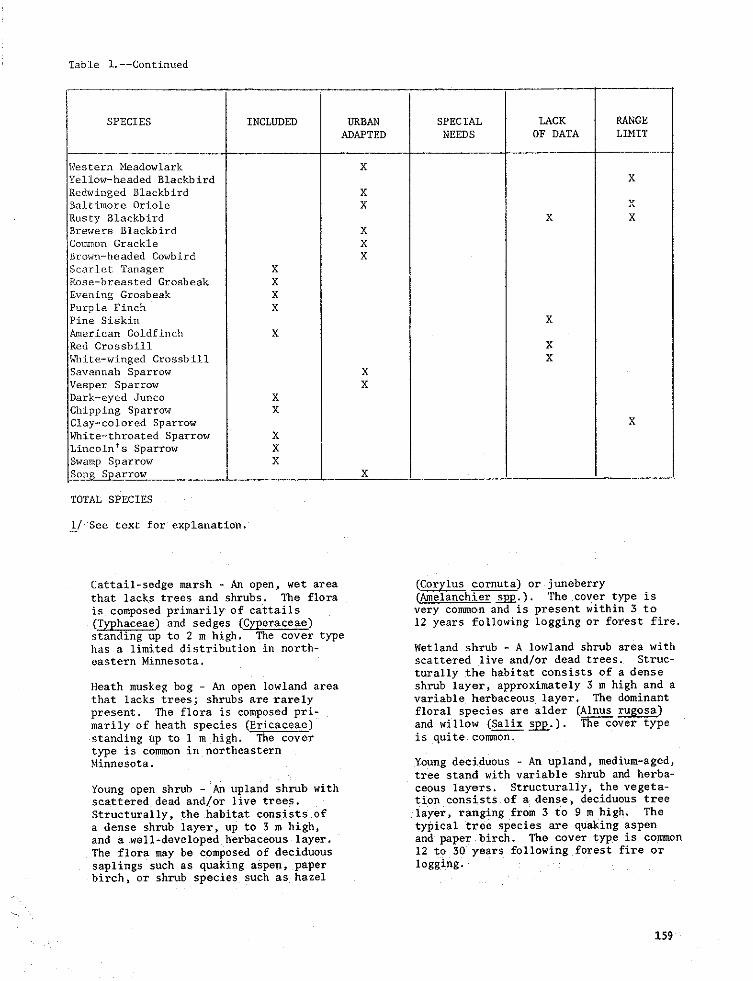
Table l.--Continued
SPECIES INCLUDED URBAN SPECIAL LACK RANGE
ADAPTED NEEDS OF DATA LIMIT
Western Meadowlark X
Yellow-headed Blackbird X
gedwinged Blackbird XBaltimore Oriole X X
Rusty Blackbird X XBrewers Blackbird X
Common Grackle XBrown-headed Cowbird X
Scarlet Tanager XBose-breasted Grosbeak X
Evening Grosbeak XPurple Finch XPine Siskin XAmerican Goldfinch X
Red Crossbill X
_lite-winged Crossbill X
Savannah Sparrow XVesper Sparrow X
Dark-eyed Junco X
Chipping Sparrow XClay-colored Sparrow X
White-throated Sparrow XLincoln's Sparrow X
Swamp Sparrow X
So_r ow X
TOTAL SPECIES
[/ See cexc for explanation.
Cattail-sedge marsh - An open, wet area (Corylus cornuta) or juneberrythat lacks trees and shrubs. The flora (Amelanchier s_p_.). The cover type is
is composed primarilyof cattails very common and is present within 3 to(Typhaceae) and sedges (Cyperaceae) 12 years following logging or forest fire.standing up to 2 m high. The cover typehas a limited distribution in north- Wetland shrub - A lowland shrub area witheastern Minnesota. scattered live and/or dead trees. Struc-
turally the habitat consists of a dense
Heath muskeg bog - An open lowland area shrub layer, approximately 3 m high and athat lacks crees; shrubs are rarely variable herbaceous layer. The dominant
present, the flora is composed pri- floral species are alder (Alnus rugosa)
marily of heath specles (Ericaceae) and willow (Salix spp.). The cover type
standing up to 1 m high. The cover is quite common.type is common in northeasternMinnesota. Young deciduous - An upland, medium-aged,
tree stand with variable shrub and herba-
Young open shrub - An upland shrub with ceous layers. Structurally, the vegeta-scattered dead and/or live trees, tion consists of a dense, deciduous tree
Structurally, the habitat consists of layer, ranging from 3 to 9 m high. Thea dense shrub layer, up to 3 m high, typical tree species are quaking aspen
and a well-developed herbaceous layer and paper birch. The cover t_e is cow,nonThe flora may be composed of deciduous 12 to 30 years following forest fire or
saplings such as quaking aspen, paper logging.birch, or shrub species such as hazel
159
Young coniferous - An upland, _edium- and Niemi (1974}, Green (1971a), field experi-aged, tree stand with sparse shrub and ence, or consultation with local experts.herbaceous layers. Structurally the
vegetation consists of a dense coni-
ferous tree layer, ranging fro_ 3 to Data Analysis and Interpretation9 m high. The typical tree species
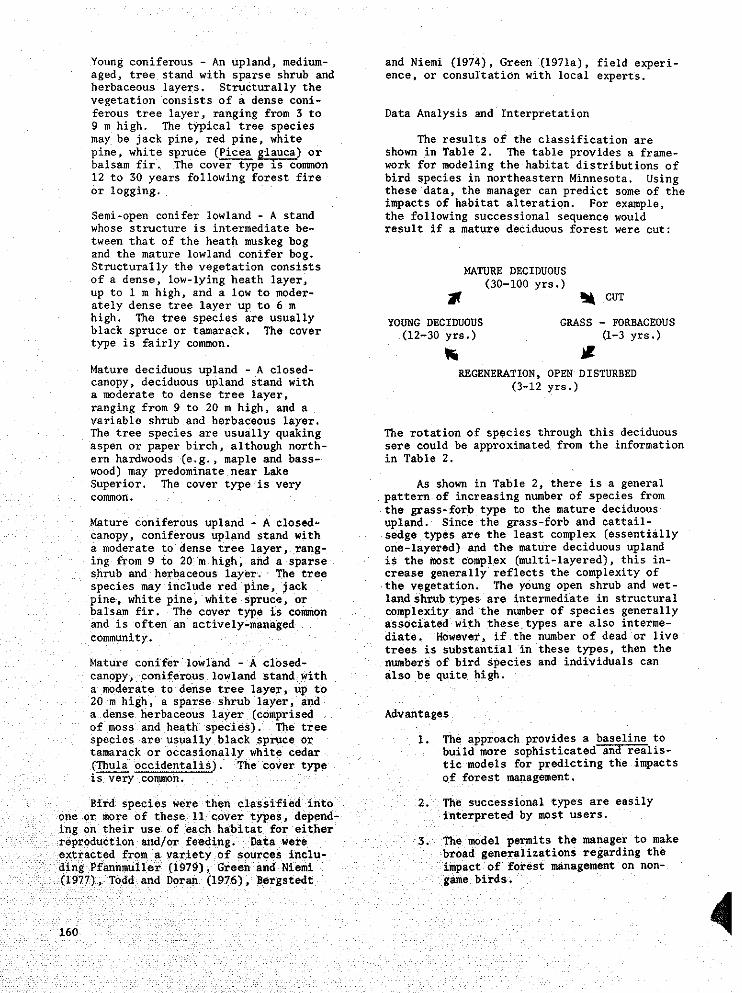
may be jack pine, red pine, white The results of the classification are
plne, white spruce (Picea _lauca) or shown in Table 2. The table provides a frame-balsam fir. The cover type is co_mon work for modeling the habitat distributions of
12 to SO years following forest fire bird speoles in northeastern Minnesota. Usingor logging, these data, the manager can predict some of the
Impacts of habitat alteration. For example,Semi-open conifer lowland - A stand the following successional sequence wouldwhose structure lS intermediate be- result if a mature deciduous forest were cut:
tween that of the heath muskeg bogand the mature lowland conifer bog.
Structurally the vegetation consists MATURE DECIDUOUS
of a dense, low-lying heath layer, (30-100 yrs.)
up to I m high, and a low to moder- _ _ CUTately dense tree layer up to 6 m
high. The tree species are usually YOUNG DECIDUOUS GRASS - FORBACEOUS
black spruce or tamarack. The cover (12-30 yrs.) _-3 yrs.)type is fairly common.
Mature deciduous upland - A closed- BEGENERATION, OPEN DISTURBED
canopy, deciduous upland stand with (3-12 yrs.)a moderate to dense tree layer,
ranging from 9 to 20 m high, and avariable shrub and herbaceous layer.
The tree species are usually quaking The rotation of species through this deciduousaspen or paper birch, although north- sere could be approximated from the information
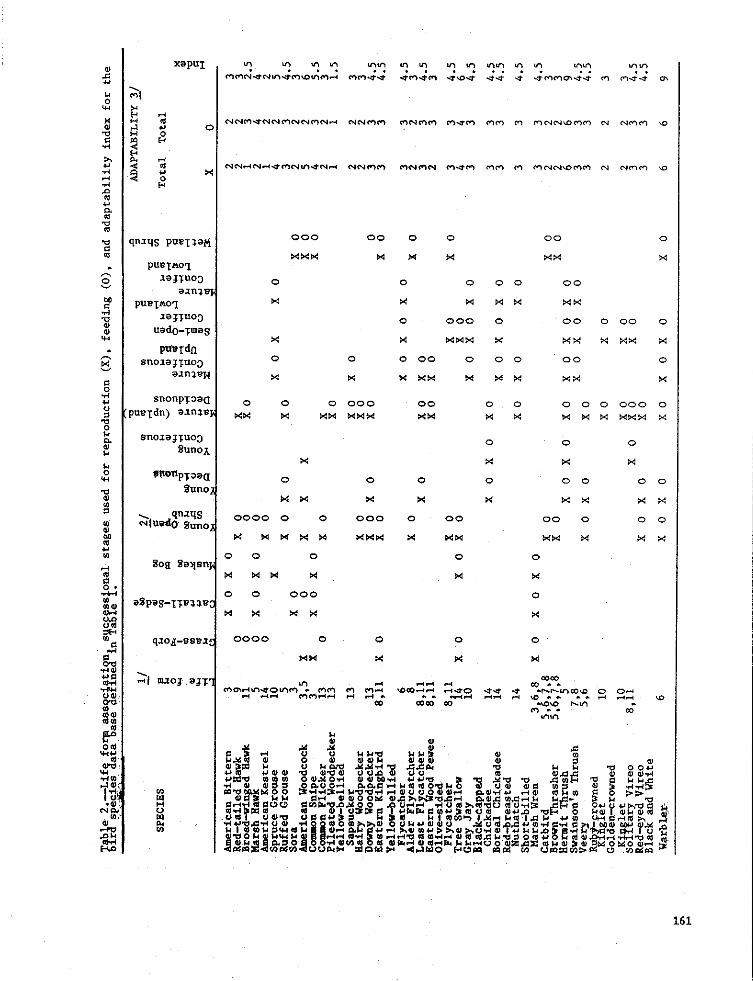
ern hardwoods (e.g., maple and bass- in Table 2.wood) may predominate near LakeSuperior. The cover type is very As shown in Table 2, there is a general
common, pattern of increasing number of specles from
the _'ass-forb type to the mature deciduousMature coniferous upland - A closed- upland. Since the grass-forb and cattail-
canopy, coniferous upland stand with sedge types are the least complex (essentiallya moderate to dense tree layer, rang- one-layered) and the mature deciduous upland
ing from 9 to 20 m high, and a sparse is the most complex (multi-layered), this in-shrub and herbaceous layer. The tree crease generally reflects the complexity of
species may include red pine, jack the vegetation. The young open shrub and wet-
pine, white pine, white spruce, or land shrub types are intermediate in structuralbalsa_ fir. The cover type is common complexity and the number of species generally
and is often an actively-managed associated with these types are also interme-community, diate. However, if the number of dead or live
trees is snbstantial in these types, then the
Mature conifer lowland - A closed- numbers of bird species and individuals can
canopy, coniferous lowland stand with also be quite high.
a moderate to dense tree layer, up to
20 m high, a sparse shrub layer, anda dense herbaceous layer (comprised Advantages
of moss and heath species). The treespecies are usually black spruce or i. The approach provides a baseline totamarack or occasionally white cedar build more sophisticated and realis-
(Thula occidentalis). The cover type tic models for predicting the impactsis very common, of forest management.
Bird species were then classified into 2. The successional types are easilyone or more of these II cover types, depend- interpreted by most users.
ing on their use of each habitat for eitherreproduction and/or feeding. Data were 5. The model permits the manager to make
extracted from a variety of sources inclu- broad generalizations regarding theding Pfannmuller (1979), Green and Niemi impact of forest management on non-
(1977), Todd and Doran [1976), Bergstedt game birds.
160 4
161
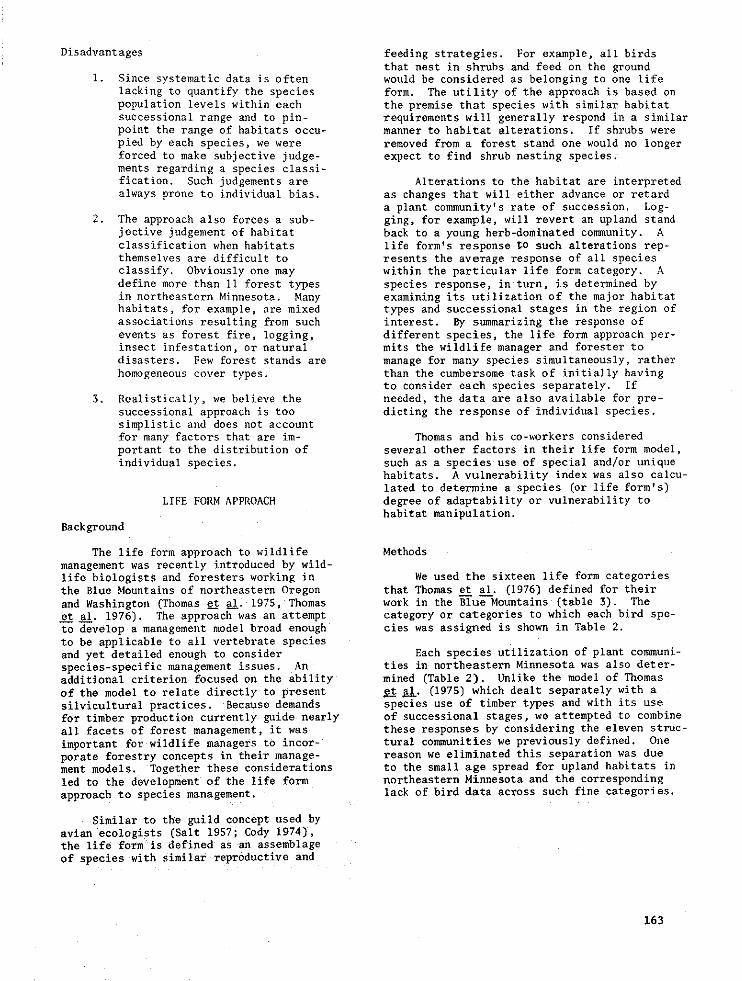
Disadvantages feeding strategies. For example, all birds
that nest in shrubs and feed on the ground1. Since systematic data is often would be considered as belonging to one life
lacking to quantify the species form. The utility of the approach is based on
population levels within each the premise that species with similar habitatsuccessional range and to pin- requirements will generally respond in a similarpoint the range of habitats occu- manner to habitat alterations. If shrubs were
pied by each species, we were removed from a forest stand one would no longer
forced to make subjective judge- expect to find shrub nesting species.manta regarding a species classi-
fication. Such judgements are Alterations to the habitat are interpreted
always prone to individual bias. as changes that will either advance or retarda plant community's rate of succession. Log-
2. The approach also forces a sub- ging, for example, will revert an upland stand
jective judgement of habitat hack to a young herb-dominated cor_nunity. Aclassification when habitats life form's response _o such alterations rap-
themselves are difficult to resents the average response of all speciesclassify. Obviously one may within the particular life form category. A
define more than ii forest types species response, in turn, is determined by
in northeastern Minnesota. Many examining its utilization of the major habitathabitats, for example, are mixed types and successional stages in the region ofassociations resulting from such interest. By summarizing the response of
events as forest fire, logging, different species, the life form approach per-insect infestation, or natural mits the wildlife manager and forester todisasters. Few forest stands are manage for many species simultaneously, rather
homogeneous cover types, than the cumbersome task of initially having
to consider each species separately. If3. Realistically, we believe the needed, the data are also available for pre-
successional approach is too dieting the response of individual species.
simplistic and does not accountfor many factors that are im- Thomas and his co-workers considered
portant to the distribution of several other factors in their life form model,
individual species, such as a species use of special and/or uniquehabitats, A vulnerability index was also calcu-
lated to determine a species (or life form's)
LIFE FORM APPROACH degree of adaptability or vulnerability tohabitat manipulation.
Background
The life form approach to wildlife Methodsmanagement was recently introduced by wild-
life biologists and foresters working in We used the sixteen life form categoriesthe Blue Mountains of northeastern Oregon that Thomas et al. (1976) defined for their
and Washington (Thomas et al. 1975, Thomas work in the Blue Mountains (table 3). Theet al. 1976). The approach was an attempt category or categories to which each bird spe-to develop a management model broad enough oies was assigned is shown in Table 2.
to be applicable to all vertebrate speciesand yet detailed enough to consider Each species utilization of plant communi-
species-specific management issues. An ties in northeastern Minnesota was also deter-additional criterion focused on the ability mined (Table 2). Unlike the model of _omas
of the model to relate directly to present et al. (1975) which dealt separately with a
silvicultural practices. Because demands species use of timber types and with its usefor timber production currently guide nearly of successional stages, we attempted to combineall facets of forest management, it was these responses by considering the eleven struc-
important for wildlife managers to incor- rural communities we previously defined. One
porate forestry concepts in their manage- reason we eliminated this separation was duement models Together these considerations to the small age spread for upland habitats in
led to the development of the life form northeastern Minnesota and the corresponding
approach to species management, lack of bird data across such fine categories.
Similar to the guild concept used by
avlan ecologists (Salt 1957; Cody 1974),the life form is defined as an assemblage
of species with similar reproductive and
163
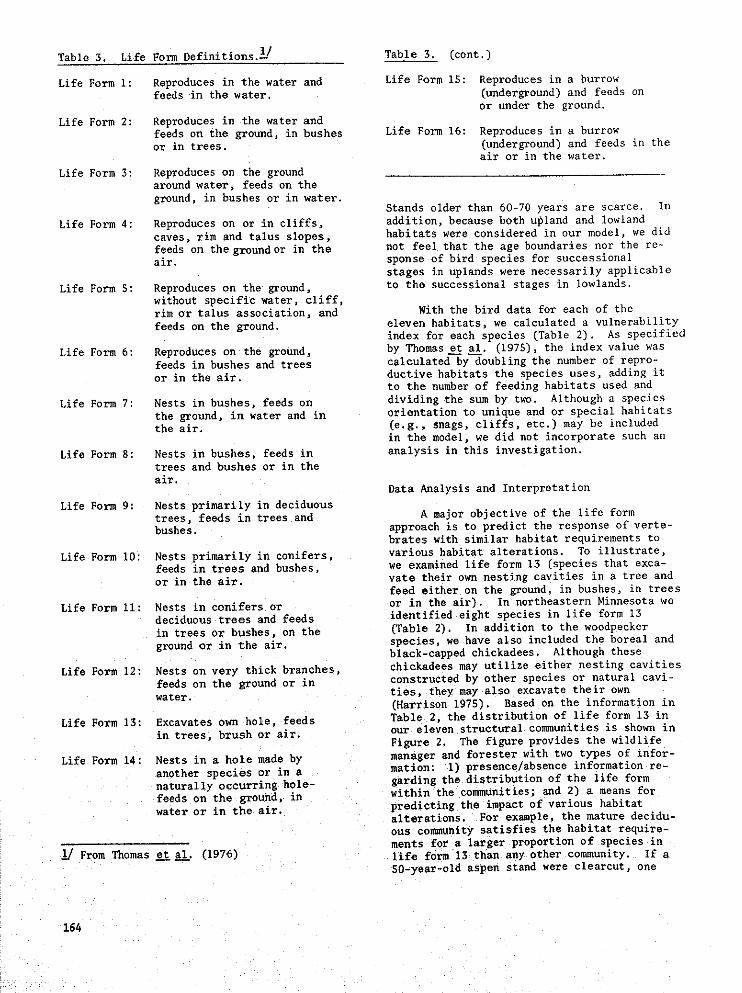
t t/ Table 5. (cont.)Table 5 Life Form Defini ions.-
Life Form i: Reproduces in the water and Life Form 15: Reproduces in a burrowfeeds in the water, (underground) and feeds on
or under the ground.
Life Form 2: Reproduces in the water andfeeds on the ground, in bushes Life Form 16: Reproduces in a burrowor in trees. (underground) and feeds in the
air or in the water.
Life Form 3: Reproduces on the groundaround water, feeds on the
ground, in bushes or in water.Stands older than 60-?0 years are scarce. In
Life Form 4: Reproduces on or in cliffs, addition, because both upland and lowland
caves, rim and talus slopes, habitats were considered in our model, we did
feeds on the g_ound or in the not feel that the age boundarles nor the re-air. sponse of bird species for successional
stages in uplands were necessarily applicable
Life Form 5: Reproduces on the ground, to the successional stages in lowlandswithout specific water, cliff,rim or talus association, and With the bird data for each of the
feeds on the ground, elevea habitats, we calculated a vulnerabilityindex for each species (Table 2). As specified
Life Form 6: Reproduces on the ground, by Thomas __at__al'(1975), the index value wasfeeds in bushes and trees calculated by doubling the number of repro-
or in the air. ductive habitats the species uses, adding itto the number of feeding habitats used and
Life Form 7: Nests in bushes, feeds on dividing the sum by two. Although a species
the ground, in water and in orientation to unique and or special habitatsthe alr, (e.g., snags, cliffs, etc.) may be included
in the model, we did not incorporate such an
Life Form 8: Nests in bushes, feeds in analysis in this investigation.
trees and bushes or in theair.
Data Analysis and Interpretation
Life Form 9: Nests primarily in deciduoustrees, feeds in trees and A major objective of the life formbushes, approach is to predict the response of verte-
brates with similar habitat requirements to
Life Form 10: Nests primarily in conifers, varzous habitat alterations, re illustrate,feeds in trees and bushes, we examined life form 15 (species that exca-or in the air. rate their own nesting cavities in a tree and
feed either o_ the ground, in bushes, in trees
Life Form ii: Nests in conifers or or in the air). In northeastern Minnesota wedeciduous trees and feeds identified eight species in life form 13
in trees or bushes, on the (Table 2). I_ addition to the woodpecker
ground or in the air. species, we have also included the boreal andblack-capped chickadees. Although these
Life Form 12: Nests on very thick branches, chickadees may utilize either nesting cavities
feeds on the ground or in constructed by other species or natural cavi-water, ties, they may also excavate their own
(Harrison 1975). Based on the information in
Life Form 13: Excavates own hole, feeds Table 2, the distribution of life form 13 in
in trees, brush or air. our eleven structural con_umities is shown inFigure 2. The figure provides the wildlife
Life Form 14: Nests in a hole made by manager and forester with two types of infer-
another species or in a marion: I) presence/absence information re-naturally occurring hole- garding the distribution of the life formfeeds on the ground, in within the communities; and 2) a means forwater or In the air. predicting the impact of various habitat
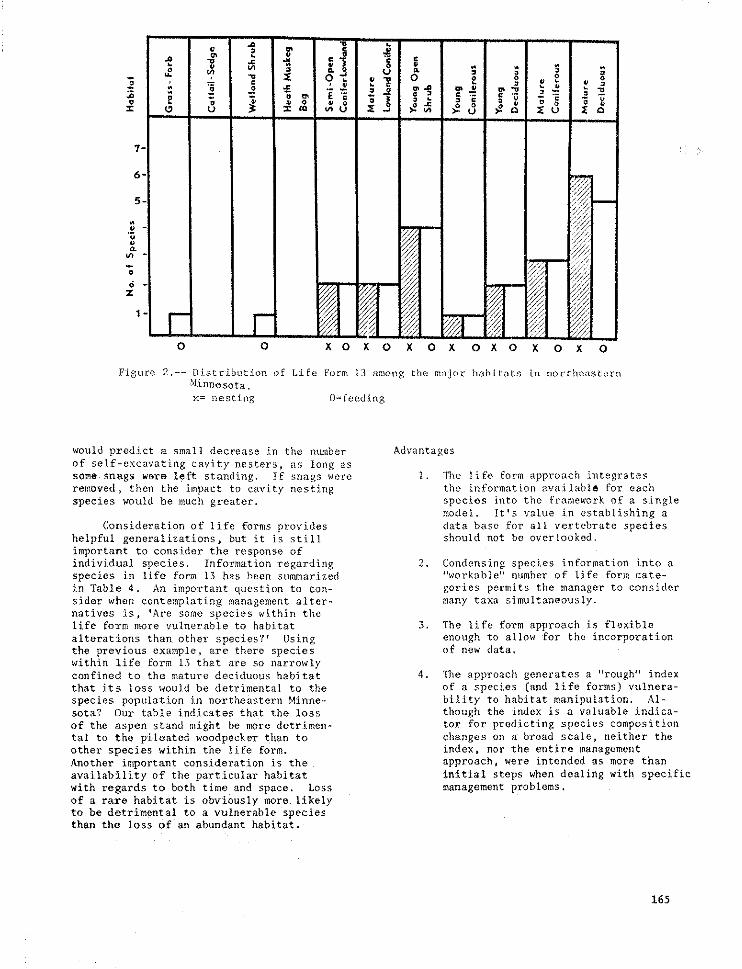
alterations. For example, the mature decidu-
ous co,unity satisfies the habitat require-
ments for a larger proportion of species ini_/ From Thomas et al. (1976) life form 13 than any other community. If a
SO-year-old aspen stand were clearcut, one
164
= _ % _ o_ o o _
7- >
6-
5-
0 0 X 0 X 0 X 0 X 0 X 0 X 0 X 0
Figure 2.-- D_stributlon of Ll_e Form 13 among the major habitats in northeastern!'linnesota,
x= nesting O= feeding
would p_edict a small decrease in the number Advantages
of self-excavating cavity nesters, as long assomm snRgs werm left standing. If snags were I. The life form approach bxtegrates
removed, then the impact to cavity nesting the information available for eachspecies would be much greater, species _nto the framework of a single
model. It's value in establishing a
Consideration of life forms provides data base fo_'all vertebrate specieshelpful generalizations, but it is still should not be overlooked.
important to consider the response ofindividual species. Information regarding 2. Condensing species information into aspecies in life form 13 has been stlmmarized "workable" number of life fori_ cate-
in Table 4. An important question to con- gories permits the manager to considersider when contemplating management alter- many taxa simultaneously.natives is, 'Are some species within thelife form more vulnerable to habitat 3. The llfe form approach is flexible
alterations than other species?' Using enough to allow for the incorporationthe previous example, are there species of new data.within life form 13 that are so narrowlyconfined to the mature deciduous habitat 4. The approach generates a "rough" index
that its loss would be detrimental to the of a species (and life forms) vulnera-
species population in northeastern Minne- bility to habitat manipulation. Ai-sota? Our table indicates that the loss though the index is a valuable indica-
of the aspen stand might be more detrimen- tor for predicting species compositiontal to the pileated woodpecker than to changes on a broad scale, neither theother species within the life form. index, nor the entire management
Another important consideration is the approach, were intended as more thanavailability of the particular habitat Initial steps wben dealing with specificwith regards to both time and space. Loss management problems.
of a rare habitat is obviously more likelyto be detrimental to a vulnerable speciesthan the loss of an abundant habitat.
165
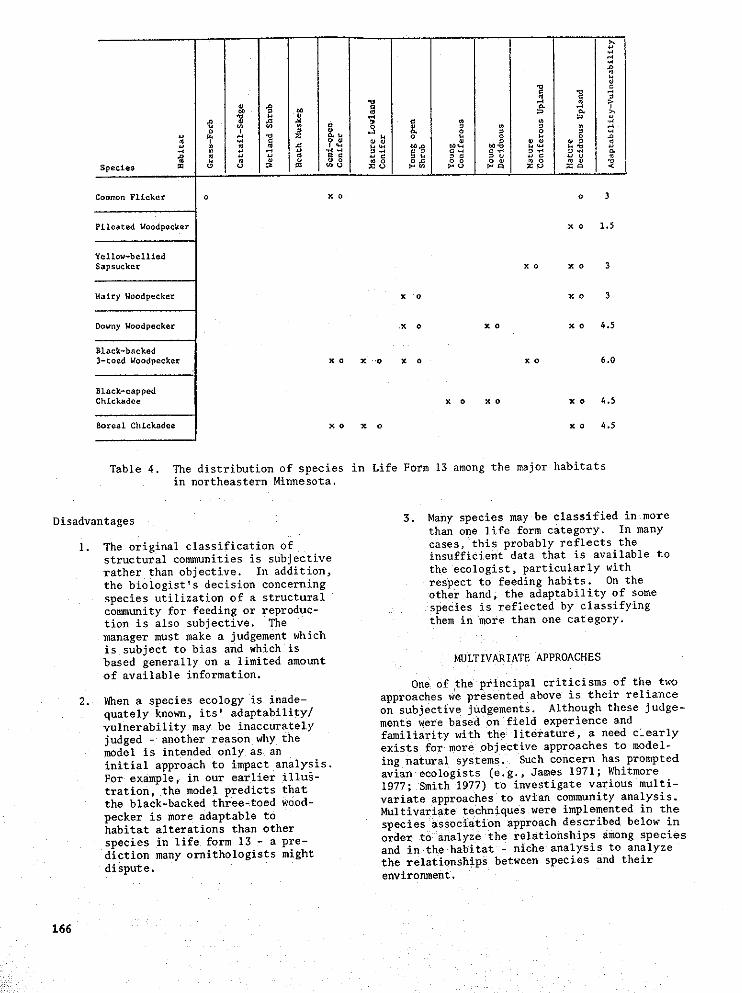
m
1 iCo_n Flicker o x o o 3
Pileated Woodpecker x o 1,5
Yellow-bell£ed
Sapsucker x o x o 3
Hairy Woodpecke_ x o x o 3
Downy Woodpecker x o X 0 x 0 4.5
Black-backed
3-toed Woodpecker x o X 'o x o K 0 5.0
Black-cappedChickadee x o x o x o 4.5
Boreal ChLckadee x o x o x o 4.5
Table 4. The distribution of species in Life Form 13 among the major habitatsin northeastern Minnesota
Disadvantages 3. Many specles may be classified in morethan one llfe form category. In many
I. The original classification of cases, this probably reflects thestructural communities is subjective insufficient data that is available torather than objective. In addition, the ecologist, particularly withthe biologist's decision concerning respect to feeding habits. On thespecies utilization of a structural other hand, the adaptability of somecommunity for feeding or reproduc- specles is reflected by classifyingtion is also subjective. The them in more than one category.manager must make a judgement whichis subject re bias and which isbased generally on a limited amount MULTIVARIATE APPROACHESof available information.
One of the principal criticisms of the two
2. When a species ecology is inade- approaches we presented above is their reliancequately known, its' adaptability/ on subjective judgements Although these judge-vulnerability may be inaccurately meats were based on field experience andjudged - another reason why the familiarity with the literature, a need ckearlymodel is intended only as an exists for more objective approaches to model-
initial approach to impact analysis ing natural systems. Such concern has promptedFor example, in our earlier illus- avian ecologists (e.g., James 1971; Whitmoretration, the model predicts that 1977; Smith 1977) to investigate various multi-the black-backed three-toed wood- variate approaches to avian community analysis.
pecker is more adaptable to Multivariate techniques were implemented in thehabitat alterations than other species association approach described below in
species in life form 13 - a pre- order to analyze the relationships among speciesdiction many ornithologists might and i_ the habitat - niche analysis to analyze
the relationships between species and theirdispute, environment.
166
SPECIES ASSOCIATIONS PJqD clustering process may be graphically represen-AVI&N CO,UNITIES ted by a dendogram which illustrates the
hierarchial arrangement of the data sets or
entities (e.g., see Cody 1974).
BackgroundCluster analysis operates under the assump-
The following approach to community tion that the sample units naturally fall intoanalysis implements multivariate techniques discrete and recognizable conmmnities. ]'heto classify avian communities and to validity of this assumption however, has beendelineate species associations within challenged by ecologists who allege that dis-those communities. As we stated earlier, crete discontinuities between co_uni£ies are
the classification of avian communities not realistic (e.g., Gleason 1926; Curtis 1959).
has, historically, been rather subjective Those ecologists who maintain that species are
(e.g., Kendeigh 1945; Martin 1960). Most geographically distributed independently of one
avian ecologists have assumed that the another favor the use of ordination techniques"boundaries" of avian communities directly that graphically portray the relationships
reflect the "boundaries" of plant communi- among sample stands. Ordination arranges the
ties. _ough the plant community frame- stands within a uni-dimensional coordinate
work is satisfactory for a preliminary frame so that the relative continuity or dis-assessment, the wildlife manager should continuity in their distribution is illustrated.not assume that the same boundaries ]he ordination technique commonly used for this
always apply to avian communities. Our purpose is discriminant analysis. Discriminantintent was to derive a classification analysis operates by defining linear combina-
scheme for bird communities with the use tions of the components of each stand (e.g.,
of parameters that quantified the bird species) so that, within a coordinate frame,
species composition rather than the plant the distances between communities are maxi-species composition. Compared with the mized. In avian ecology, discriminant analysis
numerous studies using rigorous mathema- has recently been used by several authors to
tical approaches to plant community class- graphically illustrate the distribution of in-ification (e.g., Grigal and Ohmann 1975; dividual species (James 1971; Whitmore 1977;Nobles et al. 1977), few studies have Smith 1977; Thomas et al. 1977). We have
dealt with such an approach to avian implemented discriminant analysis to portraycommunity classification, the degree of similarity/dissimilarity among
the species composition of the different study
The second objective of the associa- plots.
tion approach was to delineate speciesassociations; a species association being
a group of species that are distributed in Methods
a similar manner among avian communities.Few species, either plant or animal, are The procedures for implementing clusterrestricted in their occurrence to one analysis were applied to avian census data
colmaunity: Several species may often occur collected in 43 forest stands. The sample
together in different communities because stands were selected to represent the portionsthey require a similar environmental of all major cover types in northeastern Minne-feature. Our objective was to characterize sota. Territory mapping (Williams 1936) was
the bird species associations in north- selected for collecting census data from each
eastern Minnesota and to illustrate their plot during the 1977 summer season. Althoughoccurrence and abundance within the we will briefly review our analysis proceduresdifferent avian communities, in the following paragraphs, Pfannmuller (1979)
should be consulted for further details.
We chose cluster analysis (Boesch 1977;
Pielou 1977) as the mathematical technique In order to define both the avian communi-for defining avian communities and associa- ties and species associations that characterize
tions. The technique operates by combining northeastern Minnesota, we needed to implementsets of data, or entities, on the basis of the technique of cluster analysis in two difZ
their overall similarity. In this example ferent ways. The first, referred to as normalthe 'setsof'data' corresponded to the set analysis, (Boesch 1977) was used to classify
of avian population censuses for all study communities. Normal analysis grouped together
plots, while the 'entities' corresponded the 43 sample stands on the basis of their
to each of the individual bird species, overall similarity in bird species composition.The degree of similarity among plot een- For example, we would predict that the birdsuses, or among the distribution of indivi- censuses from two mature jack pine stands
dual species, was mathematically interpreted would be recognized as representing one avian
as the distance between sample points. The community. Discriminant analysis was also
167
lll,i,i,l,r,
I.applied t( graphically portray the 'distance' mu_']or similarity in the avlan composition of thesample stands. The second type of cluster ::D-u-analysis, referred to as inverse analysis _-----J _-(Boesch [977), was used to define species "_ !associations, inverse analysis grouped ,_-_ .
toRether bird species that showed similar :---_distribution among the 43 sample stands. _'_'3--_
For example, we might predict that the Lred-eyed vireo and ovenbird, species that
are both commonly observed in mature uFland I:_-----_
forest stands, would be members of one _Z__.__)species association.
designed to conduct i_Computer programscluster analysis were written by E.J. Cush-
ing of the University of Minnesota and byG Burnett, of the State of Minnesota
(State Planning, Regional Copper-NickelStudy). The input variables for the pro-
gram and the distance equations for com- I
puting similarity, were systematicallyaltered by the authors. Further details
can be found in Pfannmuller (1979).
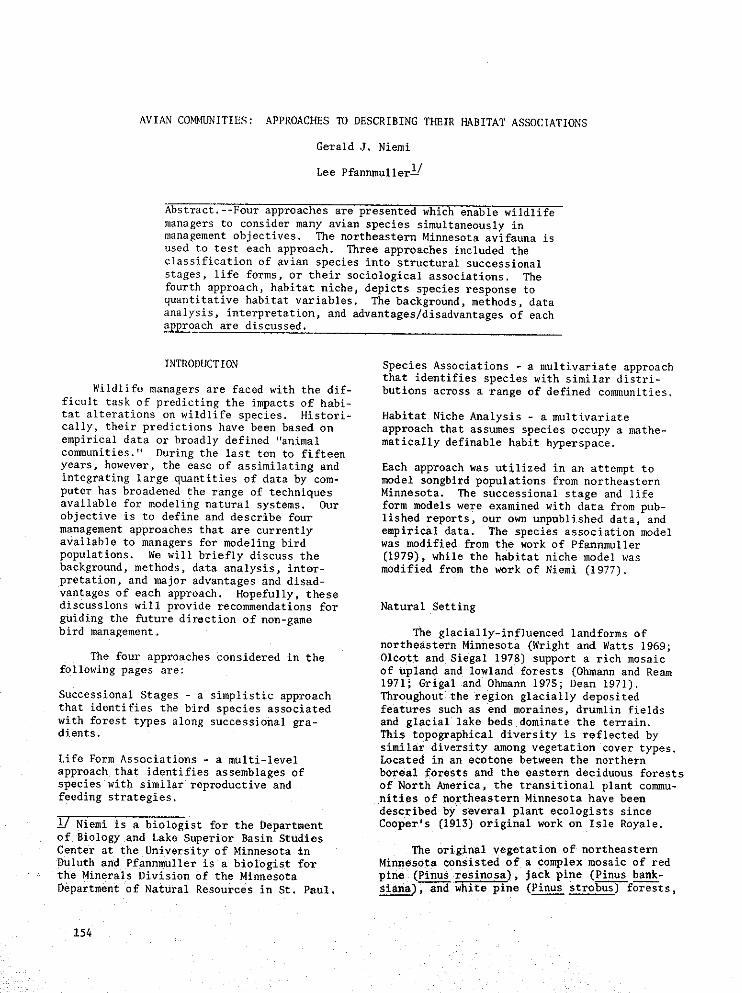
Data Analysis and Interpretation Io 2_ 3_ _o 5_ "6o _o 'a_ ' _o ' l_A_rs|_ _t_ 8r_p d_8_sl_ _ _Fa_t Of total
By varylng both the naeure of the inputvariables and the distance equations, several
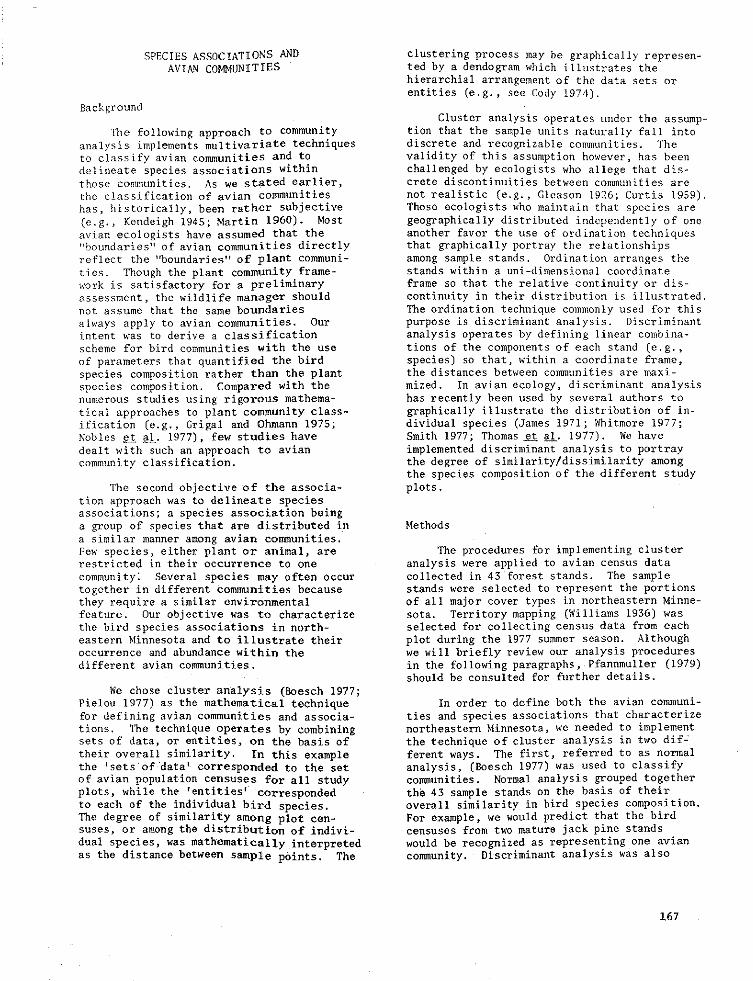
dendrograms were generated with normalcluster analysis; one such example is shown _ _,wjo,_$¢t_,i_,_ t_ _c_p_:
in Figure 3. The figure clearly suggests an • y_m_pl_=ti_
approprlate scheme for classification. For hce_ccl_r_utexample the bird species composition in . _t_.,l_*_d
eight of the eleven deciduous upland plots 0 kcSd_sp_
was recognized as similar and they were _ n_:u,b_ ,h_distinct from the species composition on
• _£fet upleadthe remaining thirty-five sample plots.
It is appropriate at this point to advance * _,.i_._.t_a warning - the ecologist should not inter- • _.*
pret the classification suggested by anyone dendrogram as definitive. Rather, all Figure 3.--Dendrogram showing the hierarchial
dendrograms generated from normal analysis relationships among bird communitiesshould be analyzed before proposing s of a3 stands based on the densityreasonable classification (which may not of 56 breeding bird species.
directly reflect any one particular den-
drogram). Based on the 1977 breeding birddata, nine avian co,unities were delineated important to birds in northeastern Minnesota.for northeastern Minnesota (see Fig. 5). A For example, the avian composition of mature
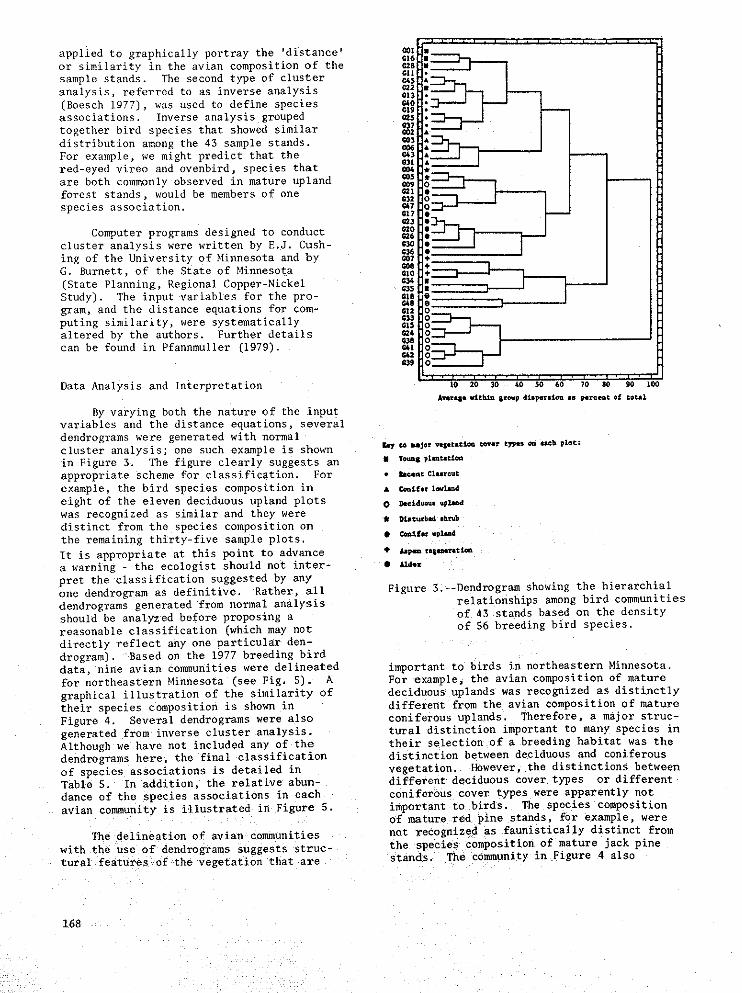
graphical illustration of the similarity of deciduous uplands was recognized as distinctlytheir species composition is shown In different from the avian compositio_ of mature
Figure 4. Several dendrograms were also coniferous uplands. Therefore, a major struc-
generated from inverse cluster analysis, rural distinction important to many species inAlthough we have not included any of the their selection of a breeding habitat was the
dendrograms here the final classification distinction between deciduous and coniferous
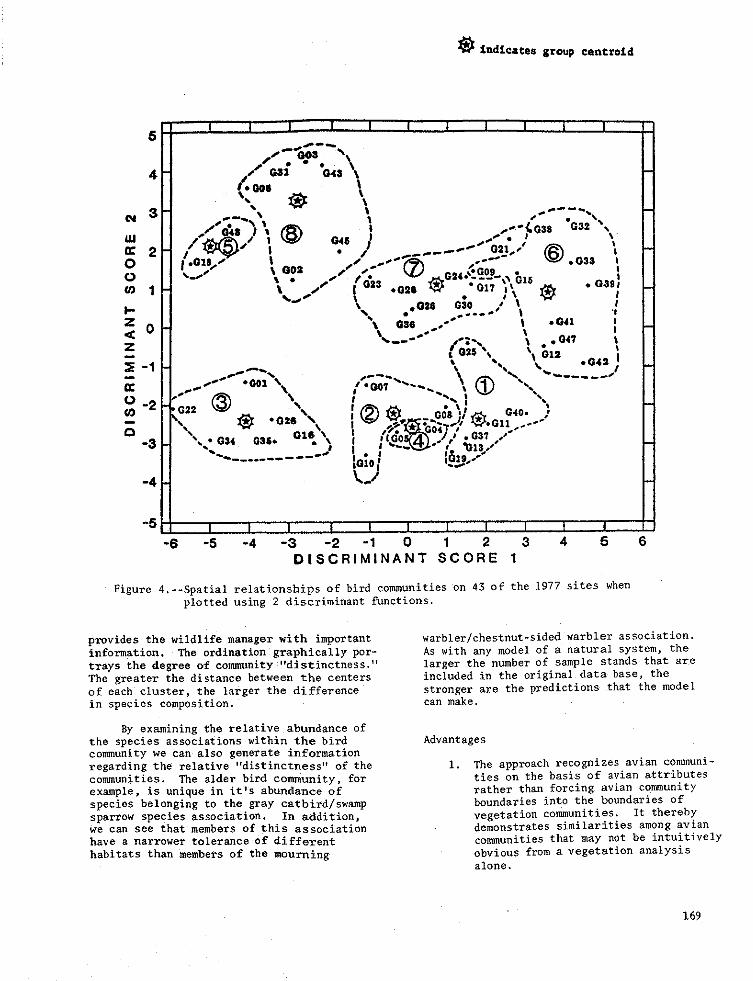
of species associations Is detailed in vegetation. However. the distinctions betweenTable 5 In addition, the relative abun- different deciduous cover types or different
dance of the species associations in each coniferous cover types were apparently not
avian community is illustrated in Figure g. important to birds. The species compositionof [nature red pine stands, for example, were
The delineatio_ of avian communities not recognized as faunlstically distinct from
with the use of dendrograms suggests strut- the species composit ion of mature jack p_netural features of the vegetation that are stands. Thm community in Figure 4 also
168
_I £ndlcaces Stoup centzo£d
-S
-6 -5 -4 -8 -2 -1 0 1 2 3 4 5 6DISCRIMINANT SCORE 1
Figure 4.--Spatial relationships of bird communities on 43 of the 1977 sites when
plotted using 2 discriminant functions.
provides the wildlife manager with important warbler/chestnut-sided warbler association.
information. The ordinationgraphlcally por- As with any model of a natural system, the
trays the degree Of community"distinctness." larger the number of sample stands that are
The greater the distance between the centers included in the original data base, the
of each cluster, the larger Zhe difference stronger are the predictions that the model
in species composition, can make.
By examining the relative abundance of
the species associations within the bird Advantages
community we can also generate information
regarding the relative "distinctness" of the i. The approach recognizes avian communi-
communities. The alder bird community, for ties on the basis of avian attributes
example, is unique in it's abundance of rather than forcing avian community
species belonging to the gray catbird/swamp boundaries into the boundaries of
sparrow species mssociation. _m addition, vegetation communities. It therebywe can see that members of this association demonstrates similarities amon_ avian
have a narrower toleranmeof different communities that may not be intuitively
habitats than members of the mourning obvious from a vegetation analysisalone.
169
Table 5. -- Species composition of the 9 major bird specles associations in northeasternMinnesota.
I. Mourning Warbler/Chestnut- II. Red-eyed Vireo/ III. Co_on Flicker_Bro_nl-headedsided Warbler Ovenbird Cowbird
Blue Jay Robin Yellow-bellled Sap- Co_mon Flicker
Cedar Waxwing sucker Great Crested Flycatchez
Black-and-white Warbler Least Flycatcher Alder FlycatcherNashville Warbler Red-eyed Vireo Tree Swallow
Magnolia Warbler Ovenbird Colden-winged WarblerChestnut-sided Warbler Canada Warbler Brown-headed Cowbird
Mourning Warbleq Rose-breasted Grosbeak
IV. Black-capped Chickadee/ V. Gray Catbird/Swamp VI Yellow-bellied Flycatcher/
Golden-crowned Kinglet Sparrow Connecticut Warbler
Spruce Killdeer
Black-capped Chickadee Ruby-throated ffunming- Gray JayBrown Creeper bird Yellow-bellied FlycatcherGolden-crowned Kinglet Gray Catbird Winter Wren
Red-winged Blackbird Ruby-crowned Kinglet
Swamp Sparrow Cape May WarblerConnecticut Warbler
VII. Sparrow Hawk/Brown VIII Hermit Thrush/ IX. Eastern Wood Pewee/
Thrasher Blackburian Warbler Scarleu Tanager
Sparrow Hawk Hermit Thrush Eastern Wood Pewee
Brown Trasher Solitary Vireo Red-breasted Nuthatch
Brewer's Blackbird Yellow-rumped Warbler Slack-throated Green Warbler
Lincoln's Sparrow Blackburnian Warbler Scarlet TanagerEvening Grosbeak American Goldfinch
Dark-eyed JuncoChipping Sparrow
i_/ The strength of the relationships among the species in each association is dependent upon:
I) the amount of information available for each specles and 2) the range of habitat
tolerance for each species The weaker associations in the above table include associationsIV, VII and IX; all represent species that were relatively unco_on.
2. Because the boundaries of vegetation Disadvantagesand avian con_nunities are often simi-
Lar, one can predict the relative I. Although broad vegetational require-importance of various structural manta of a species are defined, infer-
features of the vegetation upon the marion regarding specific niche
composition of avian communities, dimensions are lacking. Data of thisform are necessary prerequisites to
3. The species composition of bird species-oriented habitat management.communities are characterized by the
relative importance of different 2. The technique has not been widely
species associations. Each species applied.
association is composed of specieswith similar habitat distributions, 3. Some subjective judgements are still
involved in the classification of
4. Discriminant analysis allows the communities and associations.
wildlife manager to graphicallyperceive the degree of faunal 4. As was indicated in Table S, the
distinctness among the bird strength of the classification, forcommunities, species associations or communities,
depends on the amount of data available.For example, the strength of a speciesassociation that includes several un-
common or rare species may be less
170
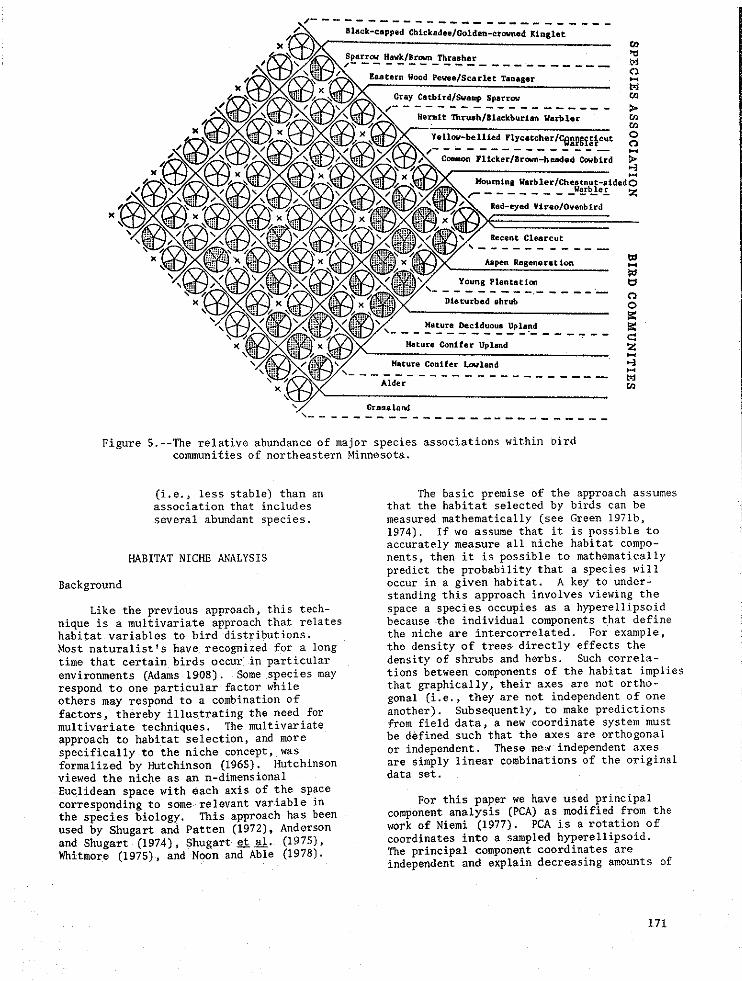
Figure 5.--The relative abundance of major species associations within oirdcommunities of northeastern Minnesota.
(i.e., less stable) than an The basic premise of the approach assumesassociation that includes that the habitat selected by birds can beseveral abundant species, measured mathematically (see Green 1971b,
1974). If we assume that it is possible toaccurately measure all niche habitat compo-
HABITAT NICHE ANALYSIS nents, then it is possible to mathematicallypredict the probability that a species will
Background occur in a given habitat, A key to under-standing this approach involves viewing the
Like the previous approach, this tech- space a species occupies as a hyperellipsoidnique is a multivariate approach that relates because .the individual components that definehabitat variables to bird distributions, the niche are intercorrelated. For example,Most naturalist's have recognized for a long the density of trees directly effects thetime that certain birds occur in particular density of shrubs and herbs. Such correla-environments (Adams 1908). Some species may tions between components of the habitat impliesrespond to one particular factor while that graphically, their axes are not ortho-others may respond to a combination of gonal (i.e., they are not independent of onefactors, thereby illustrating the need for another). Subsequently, to make predictionsmultivariate techniques. The multivariate from field data, a new coordinate system mustapproach to habitat selection, and more be defined such that the axes are orthognnalspecifically to the niche concept, was or independent. These ne.v independent axesformalized by Hutchinson (196S). Hutchinson are simply linear combinations of the originalviewed the niche as an n-dimensional data set.
Euclidean space with each axis of the spacecorresponding to some relevant variable in For this paper we have used principalthe species biology. This approach has been component analysis (PCA) as modified from theused by Shugar_ and Patten (1972), Anderson work of Niemi (1977). PCA is a rotation ofand Shugart (1974), Shugart e__tal. (197S), coordinates into a sampled hyperellipsoid.Whitmore (197B), and Noon and Able (1978]. The principal component coordinates are
independent and explain decreasing amounts of
171
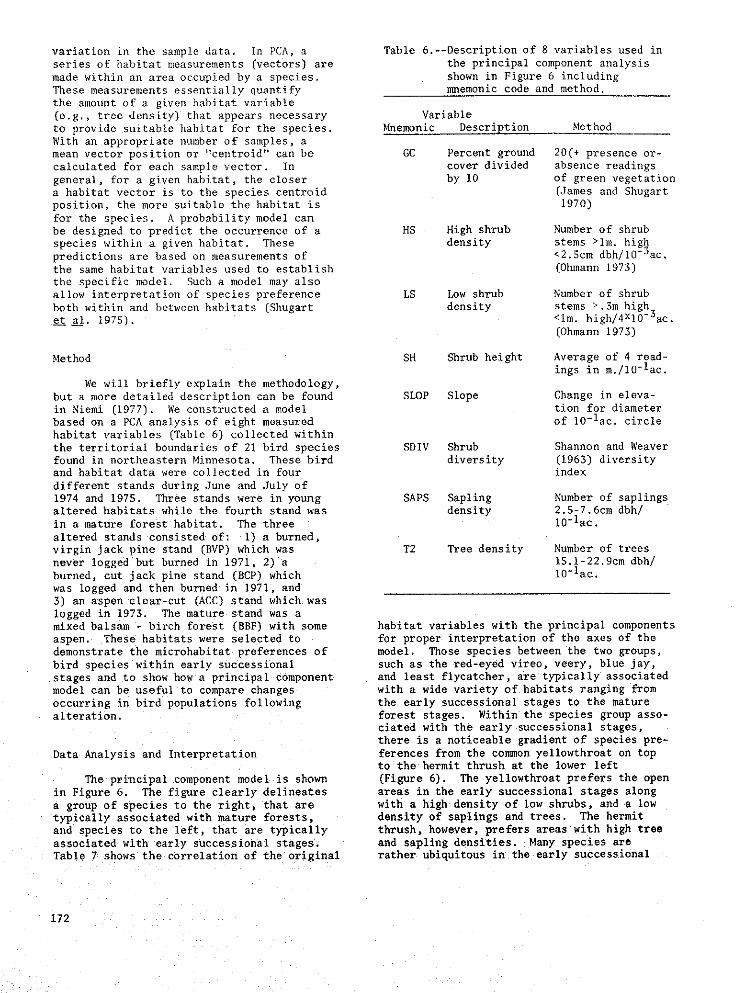
variation in the sample data, In PCA, a Table 6.--Description of 8 variables used inseries of habitat measurements (vectors) are the principal component analysis
made within an area occupied by a species, shown in Figure 6 including
These measurements essentially quantify mnemonic code and method.
the amount of a given habitat variable
(e.g., tree density) that appears necessary Variable
i to provide suitable habitat for the species. Mnemonic Description MethodWith an appropriate number of samples, a
mean vector position or "centroid" can be GC Percent ground 20(+ presence or-
' calculated for each sample vector. In cover divided absence readings
general, for a given habitat, the closer by 1O of green vegetation
a habitat vector is to the species centroid (James and Shugartposition, the more suitable the habitat is 1970)
for the species. A probability model can
be designed to predict the occurrence of a HS High shrub Number of shrubspecies within a given habitat. These density stems >Im. high
predictions are based on measurements of <2.5cm dbh/10-3ac.the same habitat variables used to establish (Ohmann 1973)
the specific model. Such a model may also
allow interpretation of species preference LS Low shrub Number of shrub
both within and between habitats (Shugart density stems >.3m highet a l. 1975). <Im. high/4Xl0-3ac.
(Ohmann 1973)
Method SH Shrub height Average of 4 read-
ings in m./10-1ac.
We will briefly explain the methodology,
: but a more detailed description can be found SLOP Slope Change in eleva-! in Niemi (1977). We constructed a model tion for diameter
based on a PCA analysis of eight measured of 10-1at. circle: habitat variables (Table 6) collected within
the territorial boundaries of 21 bird species SDIV Shrub Shannon and Weaverfound [n northeastern Minnesota. These bird diversity (1963) diversityand habitat data were collected in four index
different stands during June and July of
1974 and 1975 Three stands were in young SAPS Sapling Number of saplingsaltered habitats while the fourth stand was density 2.5-7.6cm dhh/in a mature forest habitat. The three 10-1ac.
altered stands consisted of: l) a burned,
virgln jack pine stand (BVP) which was T2 Tree density Number of trees
never logged but burned in 1971 2) a ig.l-22.9cm dbh/
burned, cut jack pine stand (BCP) which i0-lac.was logged and then burned in 1971, and
3) an aspen clear-cut (ACC) stand which was
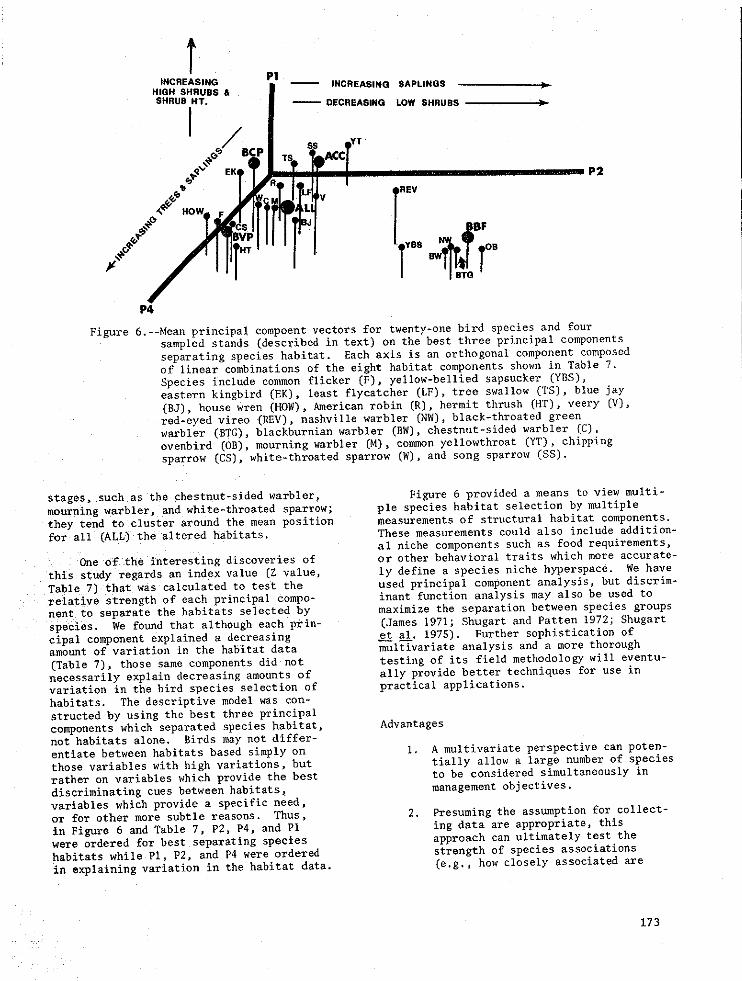
logged in 1973. The mature stand was amixed balsam - birch forest (BBF) with some habitat variables with the principal components
aspen. These habitats were selected to for proper interpretation of the axes of thedemonstrate the microhabitat preferences of model. Those specles between the two groups,
bird species within early successional such as the red-eyed vireo, veery, blue jay,
stages and to show how a principal component and least flycatcher, are typically associatedmodel can be useful to compare changes with a wide variety of habitats ranging from
occurring in bird populations following the early successional stages to the maturealteration, forest stages. Within the species group asso-
ciated with the early successional stages,there is a noticeable gradient of species pre-
Data Analysis and Interpretation ferences from the common yellowthroat on topto the hermit thrush at the lower left
The principal component model is sho_rn (Figure 6). The yellowthroat prefers the open
in figure 6. The figure clearly delineates areas in the early successional stages along
a group of species to the right) that are with s high density of low shrubs, and a lowzypieally associated with mature forests, density Of saplings and trees, The hermit
and species to the left, that are typically thrush, however, prefers areas with high treeassociated with early successional stages, and sapling densities. Many species areTable 7 shows the correlation of the original rather ubiquitous in the early successional
172
INCREASING PI INCREASING SAPLINGS pHIGH SHRUBS &
SHRUB HT ..... OECREASING LOW SHRUBS )
_ E_ I II P2
c= REV
/ /l f! II To_ I YBS BBF R
P4
Figure 6.--Mean principal compoent vectors for twenty-one bird species and foursampled stands (described in text) on the best three principal components
separating species habitat. Each axis is an orthogonal component composed
of linear combinations of the eight habitat components shown in Table 7.Species include common flicker (P), yellow-bellied sapsucker (YBS),eastern kingbird (EK), least flycatcher (LF), tree swallow (TS), blue jay
(BJ), house wren (HOW), American robin (R), hermit thrush (HT), veery (V),red-eyed vireo (REV), nashville warbler (NW), black-throated green
warbler (BTG), blackburnian warbler (BW), chestnut-sided warbler (C),
ovenbird (OB), mourning warbler (M], common yellowthroat (YT), chippingsparrow (CS), white-throated sparrow (W), and song sparrow (SS).
stages, such as the chestnut-sided warbler, Figure 6 provided a means to view multi-
mourning warbler, and white-threated sparrow; ple species habitat selection by multiplethey tend to cluster around the mean position measurements of structural habitat components.
for all(ALL) the altered habitats. These measurements could also include addition-al niche components such as food requirements,
One Of the interesting discoveries of or other behavioral traits which more accurate-
this study regards an index value (Z value, ly define a species niche hyperspace. We have
Table 7) that was calculated to test the used principal component analysis, but discrim-relative strength of each principal tempo- inant function analysis may also be used tonent to separate the habitats selected by maximize the separation between species groups
species. We found that although each prin- (James 1971; Shugart and Patten 1972; Shugartcipal component explained a decreasing e t all. 1975). Further sophistication ofamount of variation in the habitat data multivariate analysis and a more thorough
(Table 7), those same components did not testing of its field methodology will eventu-
_ecessarily expladn decreasing amounts o_ ally provide better techniques for use invariation in the bird species selection of practical applications.habitats. The descriptive model was con-
structed by using the best three principal
components which separated species habitat, Advantagesnot habitats alone. Birds may not differ-
entiate between habitats based simply on l, A multivariate perspective can pOrCh-
those variables with high variations, but tially allow a large number of speciesrather on variables which provide the best to he considered simultaneously in
discriminating cues between habitats_ management objectives.variables which provide a specific need,or for other more subtle reasons. Thus, 2. Presuming the assumption for collect-
in Figure 6 and Table 7, P2, P4, and P1 ing data are appropriate, thiswere ordered for best separating species approach can ultimately test the
habitats while Pl, P2, and P4 were ordered strength of species associations
in explaining variation in the habitat data. (e.g., how closely associated are
173
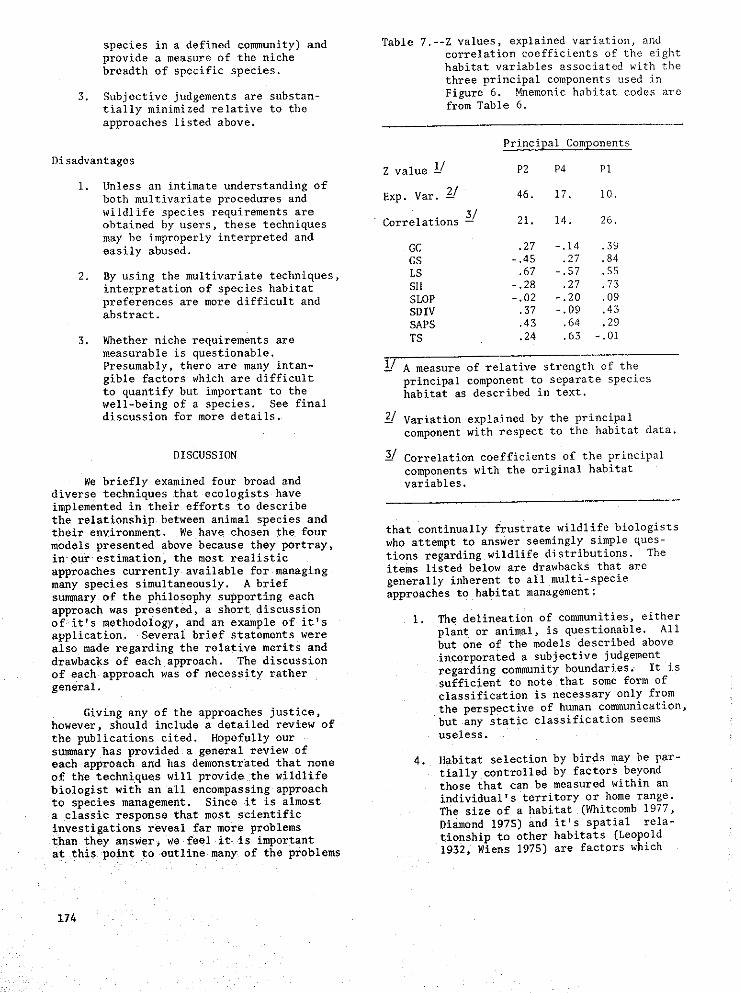
species in a defined community) and Table 7.--Z values, explained variation, and
provide a measure of the niche correlation coefficients of the eight
breadth of specific species, habitat variables associated with thethree principal components used in
3, Subjective judgements are substan- Figure 6. Mnemonic habitat coaes aretially minimized relative to the from Table 6.
approaches listed above.
Principal Components
DisadvantagesZ value I_/ P2 P4 P1
i. Unless an intimate understanding of
both multivariate procedures and Exp. Var. 2/ 46. 17. I0.
wildlife species requirements areobtained by users, these techniques Correlations 3/ 21. 14. 26.
may be improperly interpreted and
easily abused. GC .27 -.14 .39GS -.45 .27 .84
2. By using the multivariate techniques, LS .67 -.57 .55
interpretation of species habitat SH -.28 .27 .73preferences are more difficult and SLOP -.02 -.20 .09abstract. SDIV .37 -.09 .43
SAPS .43 .64 .29
3. Whether niche requirements are TS .24 .63 -.01
measurable is questionable.
Presumably, there are many intan- i/ A measure of relative strength of the
gible factors which are difficult principal component to separate speciesto quantify but important to the habitat as described in text.well-being of a species. See final
discussion for mere details. 2_/Variation explained by the principal
component with respect to the habitat data.
DISCUSSION 5J Correlation coefficients of the principal
eon_oonents with the original habitatWe briefly examined four broad and variables
diverse techniques that ecologists have
implemented in their efforts no describethe relationship between animal species andtheir envlronment. We have chosen the four that continually frustrate wildlife biologls_s
models presented above because they portray, who attempt to answer seemingly simple ques-in our estimation, the most realistic tions regarding wildlife distributions. The
approaches currently available for managing items listed below are drawbacks that aremany species simultaneously. A brief generally inherent to all multi-specie
surmnary of the philosophy supporting each approaches to habitat management:
approach was presented, a short discusslonof it's methodology, and an example of it's i. The delineation of communities, either
apr[ication. Several brief statements were plant or animal, is questionable Allalso made regarding the relative merits and but one of the models described above
drawbacks of each approach. The discussion incorporated a subjective judgement
of each approach was of necessity rather regarding community boundaries. It issufficient to note that some form of
general.classification is necessary only from
Giving any of the approaches _ustice, the perspective of human communication,however, should include a detailed review of but any static classification seems
the publications cited. Hopefully our useless.
summary has provided a general review ofeach approach and has demonstrated that none 4. Habitat selection by birds may be par-
of the techniques will provide the wildlife tially controlled by factors beyond
biologist with an all encompassing approach those that can be measured within an
to specles management. Since it is almost individual's territory or home range.a classic response that most scientific The size of a habitat (Whitcomb 1977,
investigations reveal far more problems Diamond 19753 and it's spatial rela-than they answer, we feel it is important tionship to other habitats (Leopold
at this point to eutline many of the problems 1932, Wiens 1975) are factors which
have received little attention from history of the species, from it's
avian ecologists. Such factors, how- breeding grounds, to migration resting
ever, may be important components in areas, and finally to winteringthe habitat selection process. For grounds, have been neglected,example, what size should clearcuts
be to maintain natural populations 6. A realistic approach to wildlife man-
and how should they be juxtaposi- agement must establish a means to
tioned with other habitats to bene- limit the species under consideration
fit wildlife or a particular species? in order to be workable. Although wehave attempted such a procedure here,
S. Generalized approaches to wildlife an important question remains - how
management, such as those presented can a wildlife manager objectivelyabove, often do not take into account (not subjectively, as we have) decide
special habitat requirements of some which species to include in his man-
species. Such democratic techniques, agement plan? The federal endangeredwhich manage for the "majority," may species list, state threatened orbe extremely detrimental to species endangered species lists, and the
with specific requirements. Snags, American Birds Blue List provide some
the unmeasured variable described by direction for identifying species ofBalda (1975), is an example of a concern. Nevertheless, these lists
neglected yet important habitat re- are also subject to individual bias
quirement for many birds. DeGraaf and are rarely substantiated by syste-(1978) recently estimated that among matic field investigations. The entire
the 800 bird species found in the concept of "uniqueness" has escaped a
United States approximately 8g are much needed quantitative definition.cavity nesters. For many species Uniqueness criteria are difficult tosuch as these, the absence of a define and an evaluation does not
single feature in the habitat could exist. Should species uniqueness becritically reduce population levels, determined by niche breadth, distribu-
It is crucial that potential tion, public opinion, importance to'limiting factors' be identified, man, importance to the ecosystem, or
some other criterion? Environmental
4. Wiens (1977) has recently summarized evaluations using birds and habitats,
a concept called "ecological crunch" such as that presented by Graber and
whereby species experience population Graber (1976), have been progressivefluctuations in response to changing in this regard and deserve furtherenvironmental conditions. During attention.times of resource limitation or
stress (e.g., during drought), ape- 7. Many ecological concepts have not beencies may become restricted to their included in the models discussed above.
optimum habitats-habitats where their Included among these concepts are
behavioral and morphological adapta- predator-prey relationships, competi-tions are best suited for securing tion, and diversity. Until their
resources. In response to these importance is fully understood, any
limitations, population levels may approach to wildlife management will,be greatly reduced. During resource of necessity, be "simplistic" in
abundance, however, species diffuse nature.into submarginal habitats and, con-
sequently, their population levels In listing these drawbacks we do not wish
increase. This emphasizes the impor- to frighten wildlife biologists who endeavortance of long term studies of species to implement management approaches such as the
populations - studies which, to date, ones we have presented here. By their veryhave been seriously lacking, nature, all models are beset with limitations.
Their objectives are to simplify natural sys-
g. The factors that limit population tems, to identify the major components of thelevels are poorly understood, s_stem, and to determine the species ultimateAlthough most birdpopulation dependence upon one another, Nevertheless, we
studies have been conducted during are better prepared to employ the practical
the breeding season, there is a applications of such models when we understandgrowing concern that events on the their inherent limitations.
wintering grounds may be the most
important factors influencing bird The four approaches to non-game birdpopulations (Lack 1971), Pretwell management that we have presented will serve
1973). Once again long term investi- as a framework to be expanded as our data basegations that cover the entire life grows. At present we need to continue
175
research efforts that are designed to iden- their data for practical use or a concerted
tify species habitat requirements. Never= effort be made to integrate theoreticaltheless, we have reached a starting point findings into practical management approaches.
for wildlife impact analysis. Although weare still far from the point where the
impacts of all habitat management problems LITERATURE CITED
can be accurately predicted, non-game bird
managers can predict 8ross population Adams, C. C.changes based on the data we have presented. 1908. The ecological succession of birds.
Auk 25: 109-155.
All four management models have also Ahlgren, C. E.been effective methods of data reduction. 1974. Effects of fires on temperate
Beginning with an extensive list of varia- forests: north central United States. In
hies that quantify the environment, princi- fire and ecosystems. Kozlowski, T. T. and
pal component analysis has, after linearly C.E. Ahlgren (eds.) Academic Press, Newcombining the variables, identified those York.that are best able to define the response Anderson, S, H., and H. H. Shugart, Jr.
of different species in the community to 1974. Habitat selection of breeding birdsenvironmental parameters. Features of the in an east Tenne{see deciduous forest.habitat are thereby reduced to a few Ecol. 55:828-57.
'components' that are important in the Balda, R. P.
species distributions. The successional 1975a Vegetation structure and breedingstage, life form, and specles association bird diversity. Proceedings of the sym-models have, by different techniques, poslum on management of forest and range
identified varlous assemblages Of specles, habitats for nongame birds. U.S. Dept.
The assemblages include species which by Agric. For. Serv., Gen. Tech. Rap. W0-1,various methods, are recognized as respond- 543 p.
ing to the envlronment in a similar manner. Bergstedt, B. V. and G J. Niemi.As a result, the biologist can deal with 1974. A comparison of two breeding bird
groups of specles rather than individua] censuses following the Little Siouxspecies. Work at effective methods of data forest fire. Loon 46:28-33.reduction must continue if non-game biolo- Boesch, D. F.
gi_ts are to effectively communicate perti- 1977. Application of numerical classifica-nent information to foresters which will tion in ecological investigations of
aid them in understanding the implications water pollution. Environmental Protectionof various habitat management alternatives. Agency. Ecological Research Series.
EPA-600/3-77-033.
Cody, M. L.CONCLUDING RE_RKS 1974. Competition and the structure of
bird communities. Monographs in Popula-
There are many approaches to wildlife tion Biology. 7:1-518.
management. The four we have examined are Cooper, W. S.attempts to construct models that will simul- 1915. The climax forest of Isle Royale,taneously examlne many species. Although Lake Superior, and its development.
the successional stage and life form Botanical Gaxette 15:1-44, 115-140,
approaches establish an important data base 189-233.for each species, when the habitat require- Curtis, J. T.ments of hundreds of vertebrate specles is 1959. The Vegetation of Wisconsin. An
considered, the problems are nearly incompre- ordination of plant communi£1es. Univer-hensive. Thus, if managers realistically sity Wisconsin Press, Madison. 657 p,want to consider all vertebrates in the plan- Dean, J. L.
ning process, the necessity for using some 1971. Wetland forest communities of theform of multivariate analysis is essential, eastern Boundary Waters Canoe Area. M.S.Such analyses are useless, however, unless Thesis, University of Minnesota. i01 p.
they can be comprehended by the ecologist DeGraaf, R. M.
and wildlife manager alike. Bridging the 1978. New life from dead trees. Birding
gap between theoretical and applied ecology News Survey 1:9-11.is not an easy task and may prove to be one Diamond, J. M.
of our most challenging tasks. The manager 1977. Assembly of species communities. In
who attempts to put ecologist's models to Ec61ogy and Evolution of Communities, ed.practical use must be able to perceive how M. l Cody and J. M, Diamond, pp. 342-444.
generalizations derived from the model relate Harvard Univ. Press.:o the real system he manages, In time. it Erskine, A.would be beneficial for either theoretical 1977. Birds in boreal Canada. Canadian
ecologists to attempt interpretations of Wildlife Service. Report Series No, 41.73 p.
176
Fretwell, S.D. James, F. C.
1972. Populations in a seasonal environ- 1971. Ordinations of habitat relationshipsmerit. Princeton Univ. Press. among breeding birds. Wilson Bulletin
Gleason, H.A. 83:215-235.
1926. The individualistic concept of the Keindeigh, S. C.
plant association. Bull. Torrey Botch. 1945, Con_nunity selection by birds on the
Club 53:7-26. Helderberg Plateau of New York. AukGraber, R. R. and J. W. Graber. 62:418-436.
1963. A comparative study of bird popu- Kendeigh, S. C.
lations in Illinois, 1906-1909 and 1948. Bird populations and biotic communi-
1956-1958. Ill. Nat. Hist. Surv, Bull. ties in northern lower Michigan. Ecology28:383-528. 29:101-114.
Graber, J. W. and R. R. Graber. Lack, D.
1976. Environmental evaluations using 1933. Habitat selection in birds, J. Anim.birds and their habitats. Ill. Nat. Ecol. 2:239-262.
Hist. Surv. Biol. Notes 97:1-39. Lack, D.
Green, J.C. 1971. Population studies of birds.
1971a. Summer birds of the Superior Clarendon Press, Oxford. 341 p.National Forest, Minnesota. Loon Leopold, A.
43:103-107. 1933. Game management. Charles Scribner's
Green, J. C. and R. B. Janssen. Sons. New York - London 1953. 481 p.1975. Minnesota Birds: ?{here, When and Martin, N. D.
How Many. Minneapolis, University of 1960. An analysis of bird populations in
Minnesota Press. 217 p. relation to forest succession in AlgonquinGreen, J. W,, G. J. Niemi, and K. Siderits. Provincial Park, Ontario. Ecology 41:
1978, Birds of the Superior National 126-140.
Forest. Spec. SNF Wildl. Publ. 82 p. Niemi, G. J.
Green, R.H. 1977. Habitat alteration: its effect on
1971b. A multivariate statistical avian composition and habitat selection.
approach to the [_tchinson niche: M.S. Thesis. U. of Minnesota, Duluth.
Bivalve mollusks of Canada. Ecology 110 p.
52:543-556. Nobles, M. L., L. DeBoer, K. Johnson, B. Coffin,Green, R, H. L. Fellows, and N. Christensen.
1974. Multivariate niche analysis with 1977. Quantitative relationships among sometemporally varying environmental Pinus banksiana -Picea mariana forests
factors. Ecology 55:75-83. subjected to wildlife and postloggingGrlgal, D. F., and L. F. Ohmann. treatments, Canadian Journal of Forest
1975. Classification, description, and Research 7:368-377.
dynamics of upland plant communities Noon, B. R. and K. P. Able.
within a Minnesota wilderness area. 1978. A comparison of avian communityEcol. Monogr. 45:389-407. stl_cture in the northern and southern
Haapanen, A. Appalachian Mountains. In proceedings of1965. Bird fauna of the Finnish forests the Workshop Management of Southern
in relation to forest succession. Forests for nongame birds. USDA. Gen.
I. Ann. Zool. Fenn. 2:153-196. Tech. Rpt. SE-14.Harrison, H.H. 0dum, E. P.
1975. A Field Guide to Birds' Nests. 1950. Bird populations of the lllghlandsHoughton Mifflin Company. Boston. (North Carolina) Plateau in relation to
257 p. plant succession and avian invasion.Heinselman, M. Ecology 31:587-605.
1973. Fire in the virgin forests of the Odum, E. P.
Boundary Waters Canoe Area, Minnesota. 1959. Fundamentals of ecology. W. B.
J. Quaternary Res. 3:329-382. Saunders Co., Philadelphia and London.Holt, J. 546 p.
1974. Bird populations in the hemlock Oelke, H.
sere on the Highlands plateau. N. Caro- 1966. 35 years of breeding - bird censuslina, 1946 to 1972. Wilson Bulletin work in Europe. Aud. Field Notes86:397-406. 20:635-642.
Hutchinson. E V. Ohmann, L. F., and R. R. Ream,
1965. The ecological theatre and the 1971, Wilderness ecology: virgin plantevolutionary play, Yale Univ. Press, communities of the Boundary Waters Canoe
New Haven Area. U. S. Forest Service Research PaperJames, D. and H. H Shugart, Jr. NC-63. 55 p.
1970. Quantitative method of habitat
description. Am. Birds 24:727-36.
177
Ohmann, Lewis F. Thomas, J. W., R. M. DeGraaf and J. C. Mawson.
1973. Vegetation data collection in 1977. Determination of habitat requirements
temperate forest research natural areas, for birds in suburban areas. NortheastNorth Cent. For. Exp. Stn., St. Paul, For. Exp. Sta., Upper Darby, PA. 18 p.
Minn. 35 p., illus, (USDA For. Serv. Todd, J. W. and P. D. Doran.
Res. Paper NC-92). 1976. A preliminary study of summerOloott, P. G., and D. I. Siegal. Parulids near Babbitt, Minnesota. Loon
1978. Physiography and surficial geology 48:6-10.
of the copper-nickel study region, Whitcomb, g.northeastern Minnesota. Water - 1977. Island biogeography and "habitatResources Investigations 78-51. Open- islands" of eastern forest. Am. Birds
File report. 41 p. 31:I-5.Pfannmuller, L.A. Whitmore, R. C.
1979. Bird communities in northeastern 1978. Habitat ordination of passerineMinnesota. M.S. Thesis. University birds of the Virgin River Valley, south-of Minnesota, Minneapolis. 75 p. western Utah. Wilson Bulletin 87:65-74.
Pielou, E.C. Nhitmore, R. C.
1977. Mathematical Ecolosy. John Wiley 1977. Habitat partitioning in a community& Sons, Inc. New York. 384 p. of passerine birds. Wilson Bulletin
Salt, G.W. 89:283-265.
1957. An analysis of avifaunas in the Wiens, J. A.Teton Mountains and Jackson Hole, 1975. Avian communities, energetics, and
Wyoming. Condor 59:373-393. functions in coniferous forest habitats.
Shannon, C. E. and W. Weaver. In the symposium on management of forest1963. The mathematical theory of communi- and range habitats for nongame birds.
cation. U. of Illinois Press, Urbane. USDA Forest Ser., Gen. Tech. Rep. WO-I.
Shugart, M. H. and B. C. Patten. 343 p.1972. Niche quantification and the concept Wiens, J. A.
of niche pattern. In B. C. Fatten (ed.) 1977. On competition and variable environ-Systems analysis and simulation in ments. Am. Sci. 65:590-97.
ecology If. Acad. Press, N.Y,
pp. 283-327.
Shugart, H. H., Jr. and D. James.1973. Ecological succession of breeding
bird populations in northwesternArkansas. Auk 90:62-77.
Shugart, H. H., S. H. Anderson, and R. H.Strand,
1975. Dominant patterns in bird popula-tions of the eastern deciduous forest
biome. In proceedings of the sumposiumon management of forest and range
habitats for nongame birds. USDA. Gen.Tech. Rpt. W0-1.
Smith. K. C.
1977. Distribution of summer birds alonga forest moisture gradient in an Ozark
watershed. Ecology 58:810-819.Svardson G.
1949. Competition 8 habitat selection inbirds. Oikos 1:157-174.
Thomas, J. W., G. L. Crouch, R. S. Bumstead,
and L. D. BryanT.
1975. Silvicultural Options and HabitatValues in Coniferous Forests Pro-
ceedings of the symposlum on management
of forest and range habitats fornongame birds. USDA For. Serv.,
General Teeh. Rep. WO-I. p. 59-86.
_omas, J. W., R. J. Miller, H. Black,J. E. Rodiek, and C. Maser.
1976. Guidelines for maintaining and
enhancing wildlife habitat in forestmanagement in the Blue Mountains of
Oregon and Washington. North Am. Wildl._at. Resour. Conf. 41:452-476.
178