Embed Size (px)
Citation preview
Sean MillerZackary HallerAndrew Brown
Broadcom
Outline•Description of Company
• Investment Thesis
• SWOT Analysis
• Porters Five Forces
• Industry Demand
• Products/Product Demand
• Competitive Advantages
•Historical Financial Analysis/Company Comparison
• Competitive Analysis
• Forecasting Assumptions
• Relative Valuation
• Conclusion
Broadcom Lmtd.• Broadcom Limited designs, develops, and supplies a range of analog and digital
semiconductor connectivity solutions. Its product portfolio comprises broadband access and modems, enterprise and network processors, wireless infrastructure, wireless connectivity, Ethernet communication and switching, and set‐top box and media processors.
• The company’s products are used in various applications, including data center networking, home connectivity, broadband access, telecommunications equipment, smartphones and base stations, data center servers and storage, factory automation, power generation and alternative energy systems, and displays.
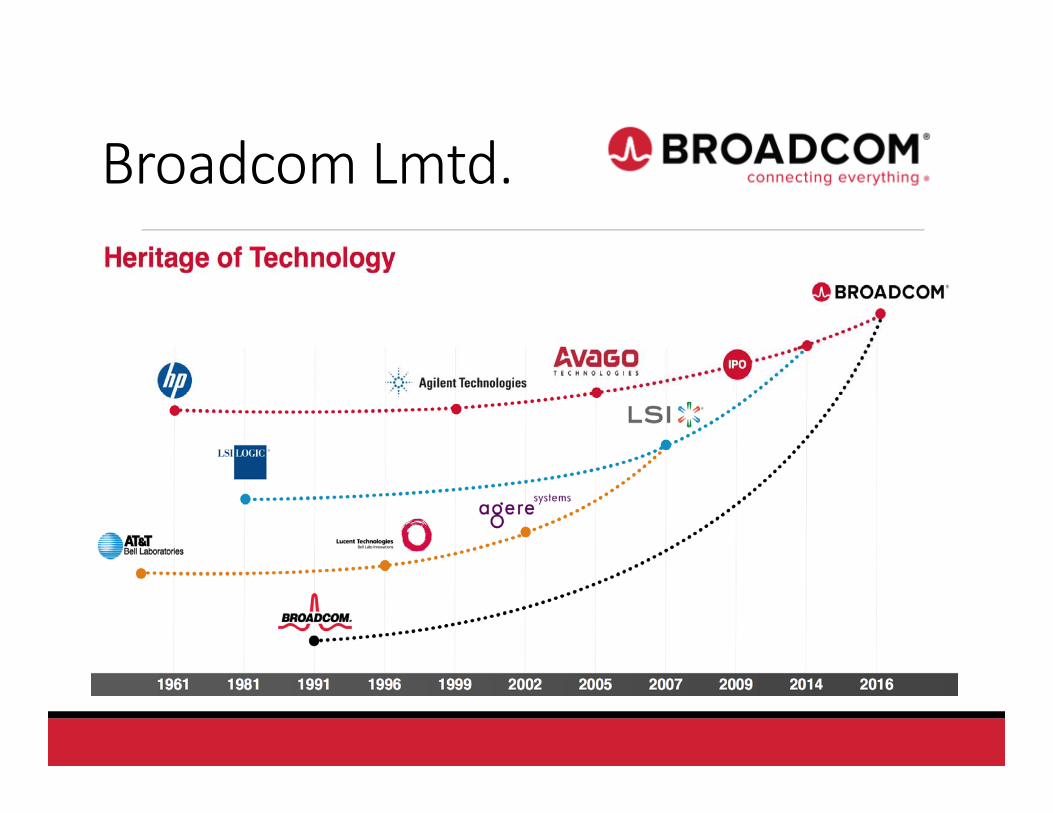
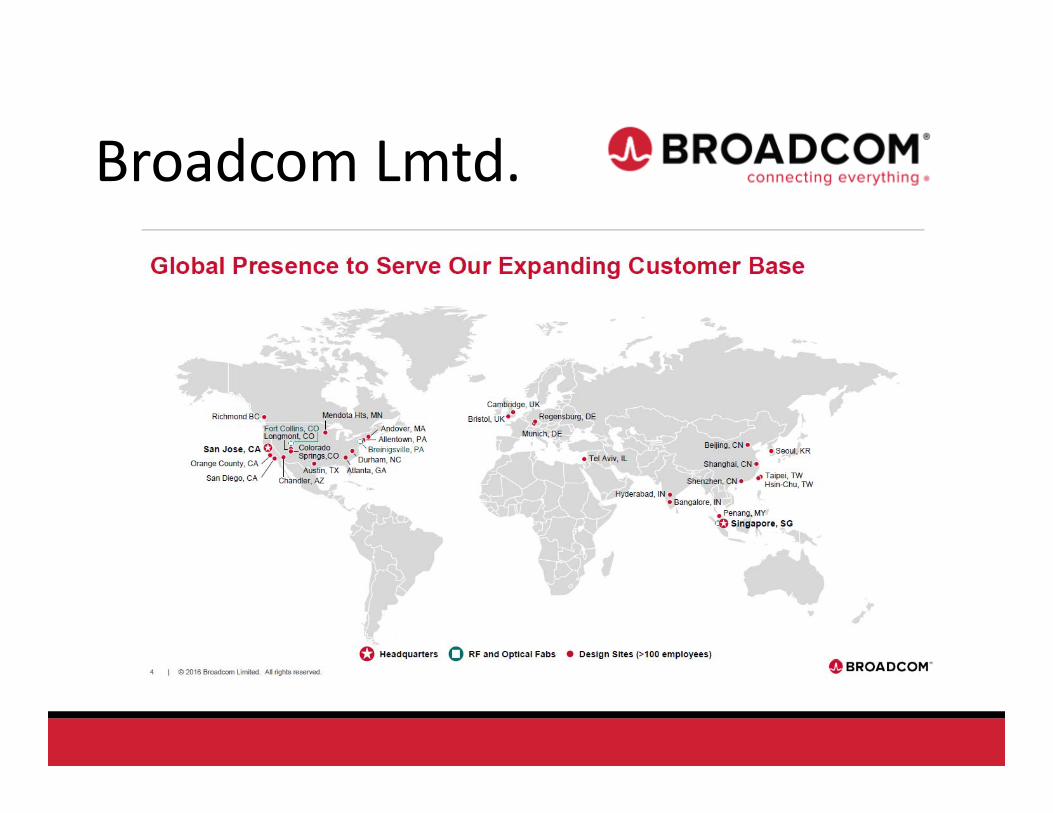
• The company was formerly known as Avago Technologies Limited and changed its name to Broadcom Limited in February 2016. The company was founded in 2005 and is headquartered in Singapore.
Investment Thesis • Broadcom Limited is a major technology innovator and global leader in semiconductors for wired and wireless communications. Broadcom products enable the delivery of voice, video, data, and multimedia to and throughout the home, the office, and the mobile environment.
• Broadcom Limited’s economic moat continues to grow with continued acquisitions, leading us to believe that they will be able to create profit in multiple industries.
• Broadcom’s Annualized 3‐year CAGR shows significant growth across all of its metrics. Total Revenue has grown 42.4%, EBIT 47.2%, and NOPAT 46.5%. It is important to point out that Broadcom has increased their Economic Value‐Added by 51.4% and their Market Value‐Added by 67.9%
• Broadcom, one of the world's largest fabless communications semiconductor companies, with more than 4,050 U.S. and 1,650 foreign patents, and has more than 7,900 additional pending patent applications, and one of the broadest intellectual property portfolios addressing both wired and wireless transmission of voice, video, data, and multimedia.
Broadcom Lmtd.
Broadcom Lmtd.
SWOT Analysis
Strengths
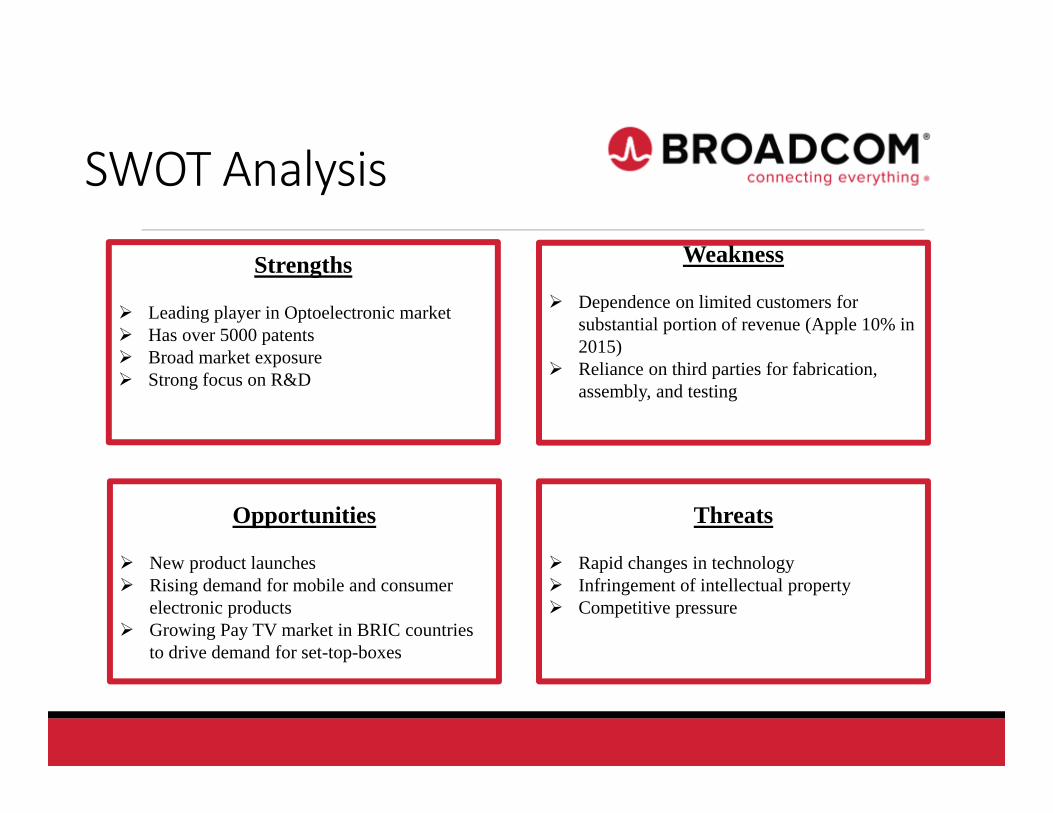
Leading player in Optoelectronic market Has over 5000 patents Broad market exposure Strong focus on R&D
Weakness
Dependence on limited customers for substantial portion of revenue (Apple 10% in 2015)
Reliance on third parties for fabrication, assembly, and testing
Opportunities
New product launches Rising demand for mobile and consumer
electronic products Growing Pay TV market in BRIC countries
to drive demand for set-top-boxes
Threats
Rapid changes in technology Infringement of intellectual property Competitive pressure
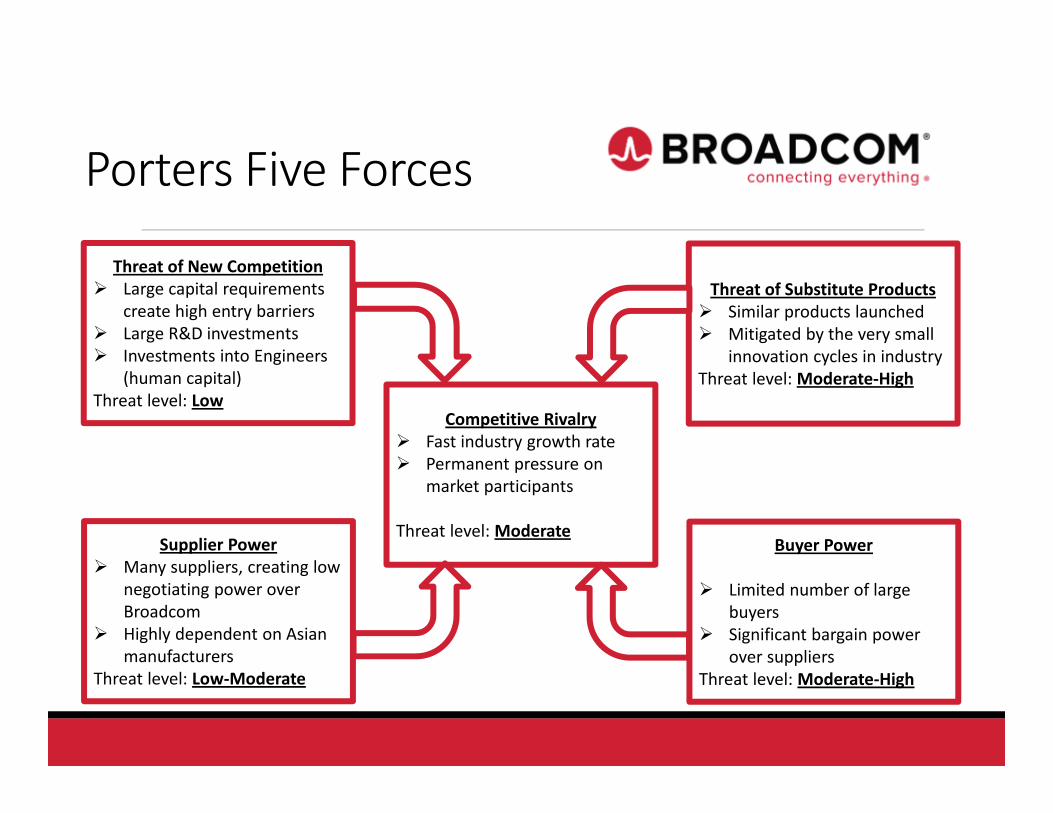
Porters Five Forces
Threat of New Competition Large capital requirements
create high entry barriers Large R&D investments Investments into Engineers
(human capital)Threat level: Low
Threat of Substitute Products Similar products launched Mitigated by the very small
innovation cycles in industryThreat level: Moderate‐High
Supplier Power Many suppliers, creating low
negotiating power over Broadcom
Highly dependent on Asian manufacturers
Threat level: Low‐Moderate
Buyer Power
Limited number of large buyers
Significant bargain power over suppliers
Threat level: Moderate‐High
Competitive Rivalry Fast industry growth rate Permanent pressure on
market participants
Threat level: Moderate

Industry Demand Long term, growth in semiconductors is highly correlated to global GDP S&P Capital IQ has a positive fundamental outlook for the semiconductors sub‐industry for the next 12 months. S&P Capital IQ predicts modestly higher sales for 2016 and 2017, albeit at a low single digit percentage growth pace. S&P Capital IQ believes the communications and consumer end markets will remain healthy despite periods of lumpiness, as carrier comments in China suggest to them an improved spending outlook, and continued growth in smartphones. S&P Capital IQ thinks industrials will improve given the high exposure to this end market, analog semiconductors are particularly exposed to this trend.
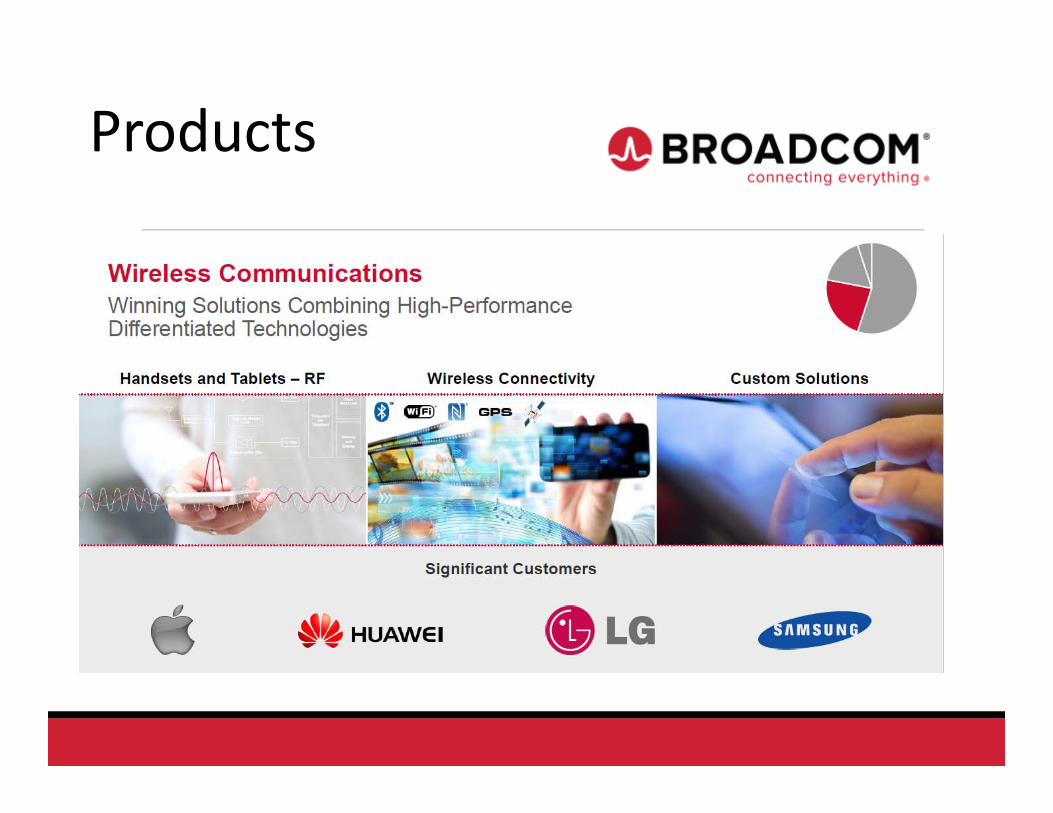
Products
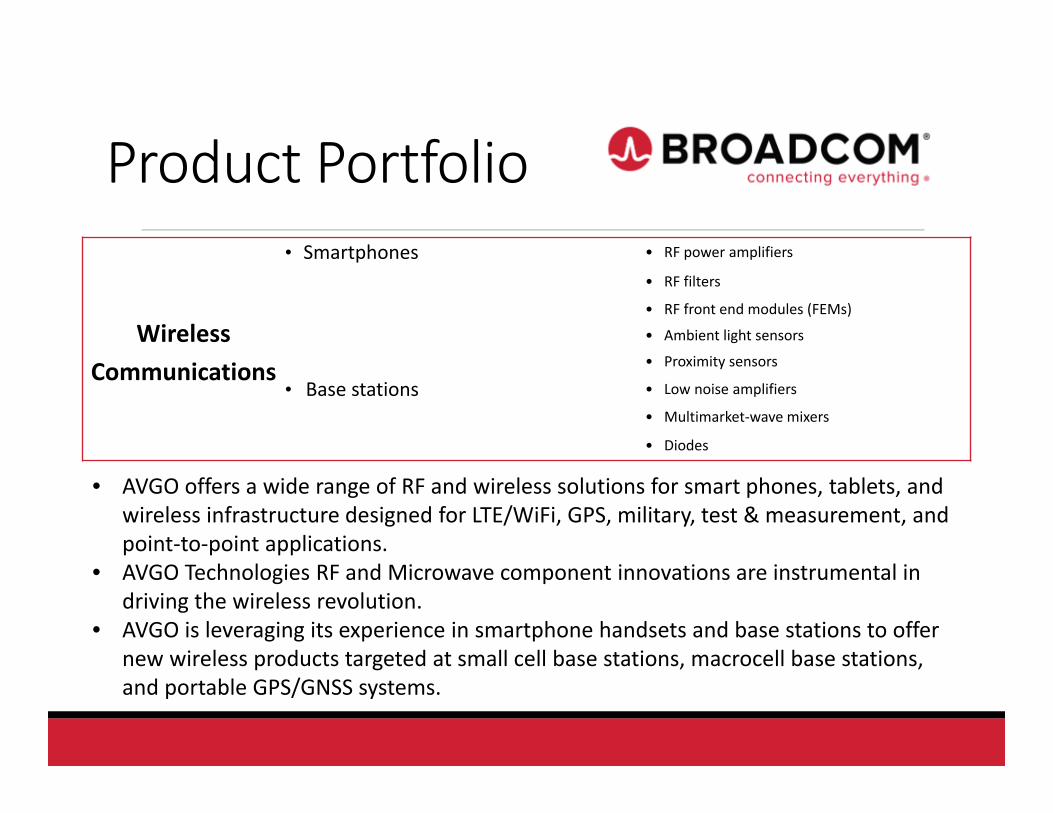
Product Portfolio
Wireless Communications
• Smartphones • RF power amplifiers
• RF filters
• RF front end modules (FEMs)
• Ambient light sensors
• Proximity sensors
• Base stations • Low noise amplifiers
• Multimarket‐wave mixers
• Diodes
• AVGO offers a wide range of RF and wireless solutions for smart phones, tablets, and wireless infrastructure designed for LTE/WiFi, GPS, military, test & measurement, and point‐to‐point applications.
• AVGO Technologies RF and Microwave component innovations are instrumental in driving the wireless revolution.
• AVGO is leveraging its experience in smartphone handsets and base stations to offer new wireless products targeted at small cell base stations, macrocell base stations, and portable GPS/GNSS systems.

Products
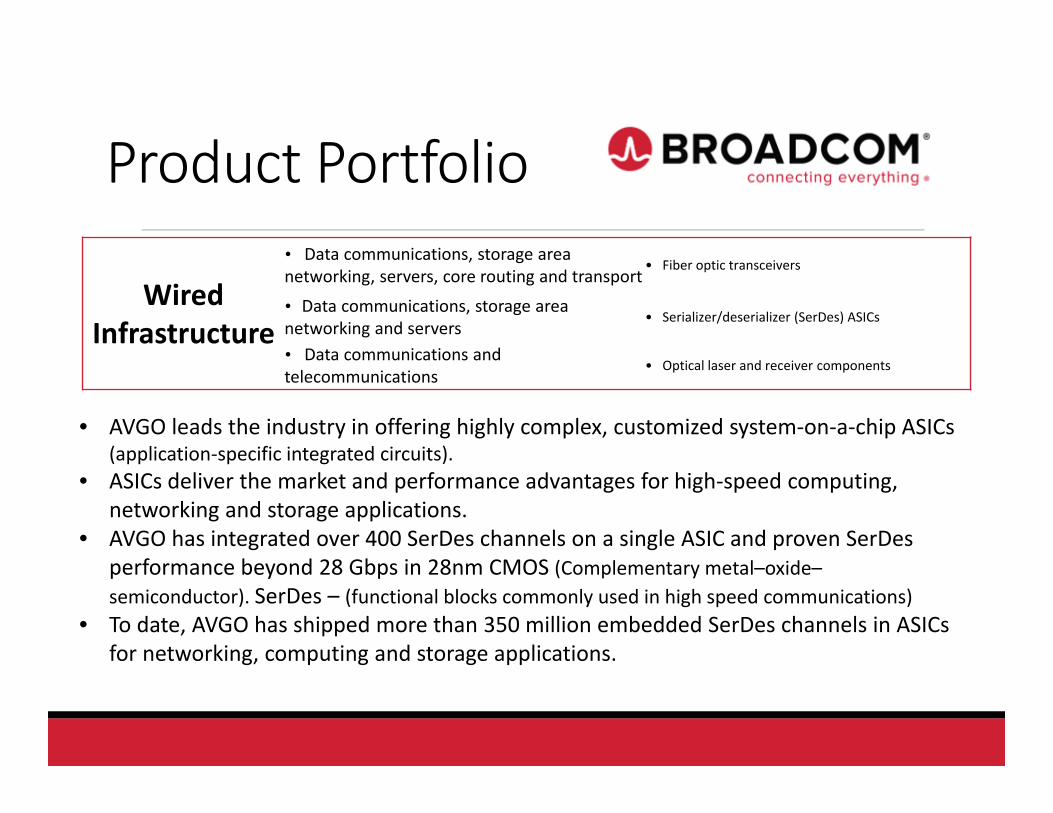
Product Portfolio
Wired Infrastructure
• Data communications, storage area networking, servers, core routing and transport
• Fiber optic transceivers
• Data communications, storage area networking and servers
• Serializer/deserializer (SerDes) ASICs
• Data communications and telecommunications
• Optical laser and receiver components
• AVGO leads the industry in offering highly complex, customized system‐on‐a‐chip ASICs (application‐specific integrated circuits).
• ASICs deliver the market and performance advantages for high‐speed computing, networking and storage applications.
• AVGO has integrated over 400 SerDes channels on a single ASIC and proven SerDesperformance beyond 28 Gbps in 28nm CMOS (Complementary metal–oxide–semiconductor). SerDes – (functional blocks commonly used in high speed communications)
• To date, AVGO has shipped more than 350 million embedded SerDes channels in ASICs for networking, computing and storage applications.
Products
Product Portfolio
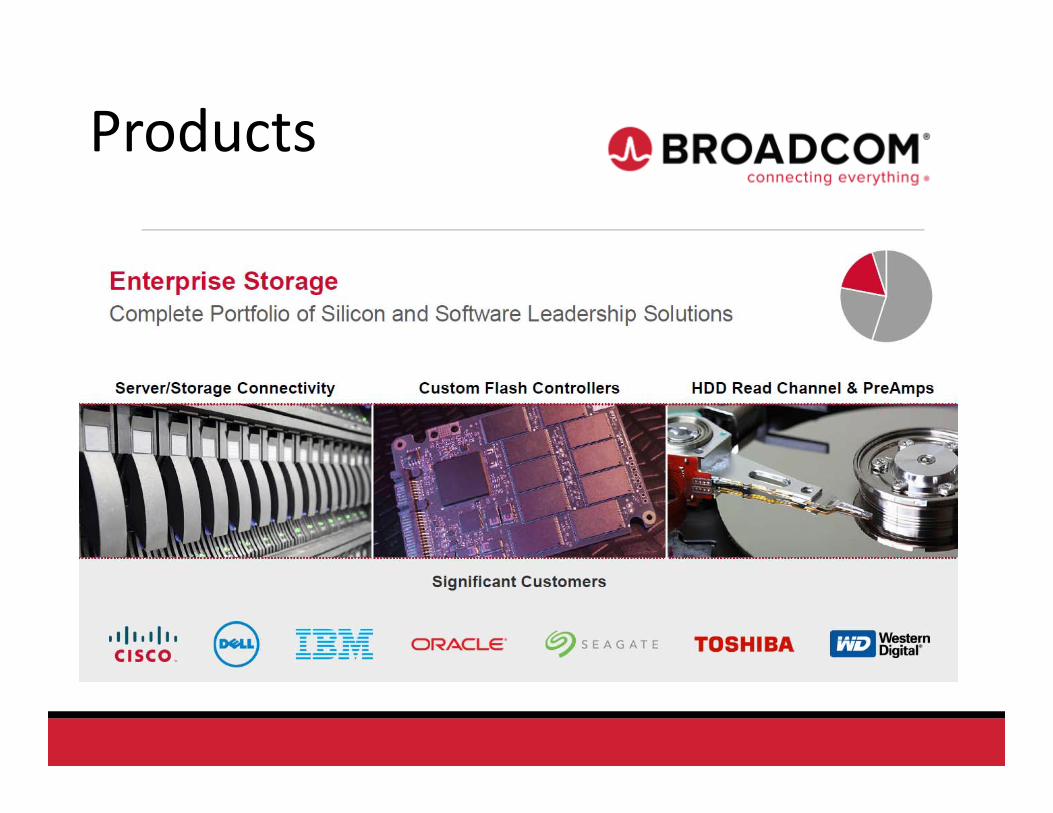
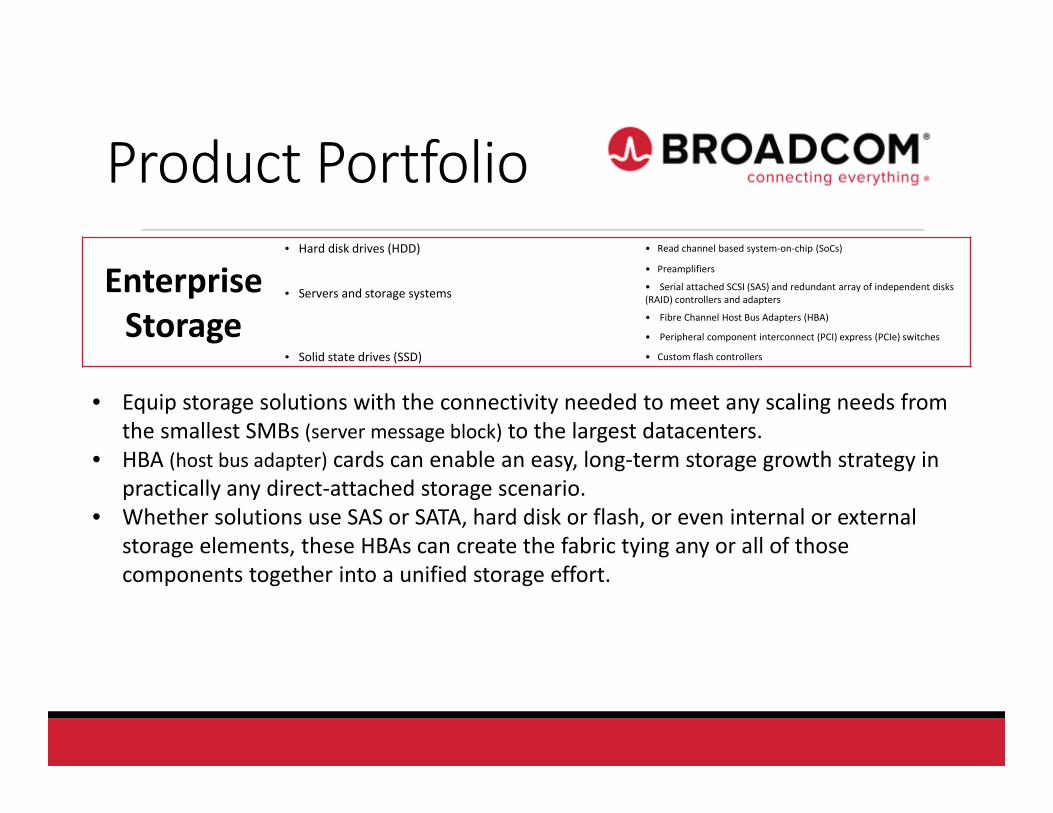
Enterprise Storage
• Hard disk drives (HDD) • Read channel based system‐on‐chip (SoCs)
• Preamplifiers
• Servers and storage systems • Serial attached SCSI (SAS) and redundant array of independent disks (RAID) controllers and adapters
• Fibre Channel Host Bus Adapters (HBA)
• Peripheral component interconnect (PCI) express (PCIe) switches
• Solid state drives (SSD) • Custom flash controllers
• Equip storage solutions with the connectivity needed to meet any scaling needs from the smallest SMBs (server message block) to the largest datacenters.
• HBA (host bus adapter) cards can enable an easy, long‐term storage growth strategy in practically any direct‐attached storage scenario.
• Whether solutions use SAS or SATA, hard disk or flash, or even internal or external storage elements, these HBAs can create the fabric tying any or all of those components together into a unified storage effort.
Products
Product Portfolio
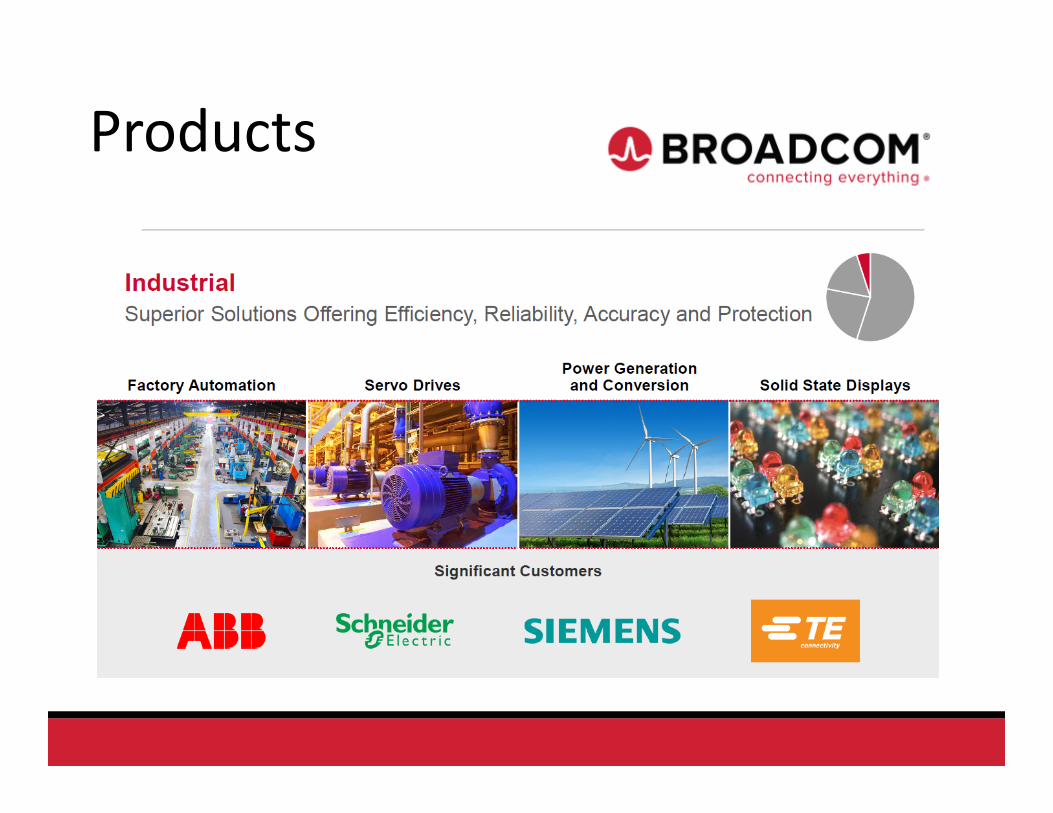
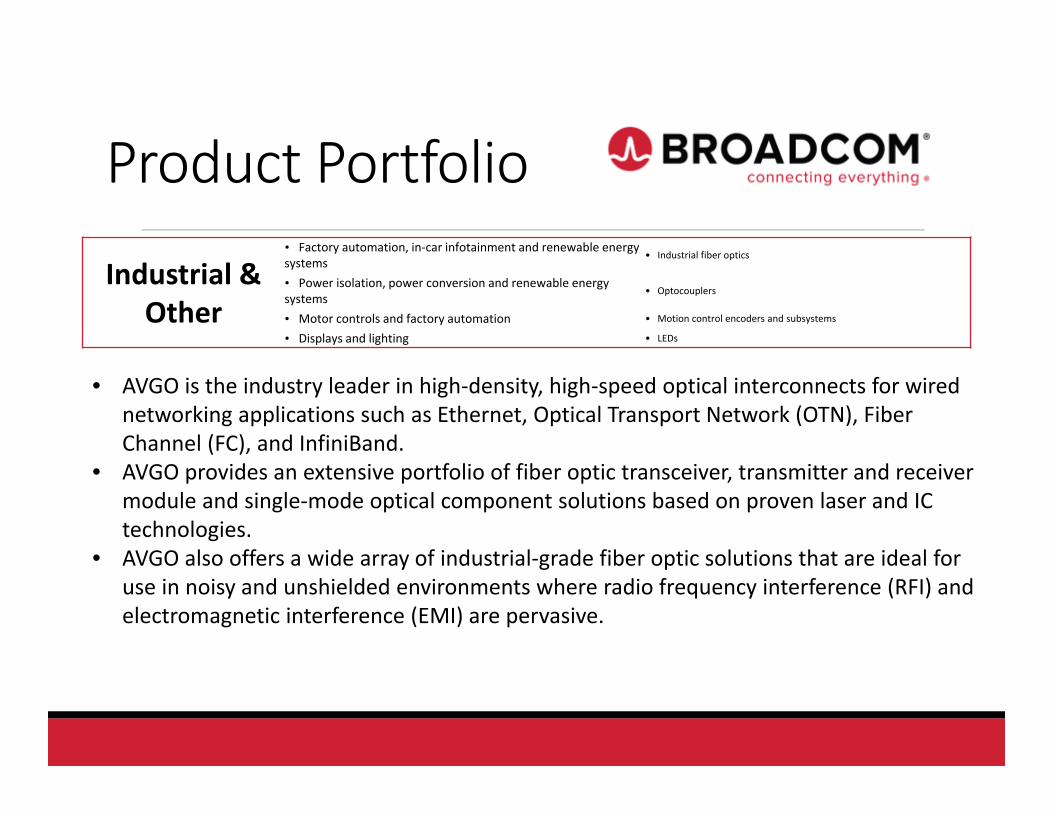
Industrial & Other
• Factory automation, in‐car infotainment and renewable energy systems
• Industrial fiber optics
• Power isolation, power conversion and renewable energy systems
• Optocouplers
• Motor controls and factory automation • Motion control encoders and subsystems
• Displays and lighting • LEDs
• AVGO is the industry leader in high‐density, high‐speed optical interconnects for wired networking applications such as Ethernet, Optical Transport Network (OTN), Fiber Channel (FC), and InfiniBand.
• AVGO provides an extensive portfolio of fiber optic transceiver, transmitter and receiver module and single‐mode optical component solutions based on proven laser and IC technologies.
• AVGO also offers a wide array of industrial‐grade fiber optic solutions that are ideal for use in noisy and unshielded environments where radio frequency interference (RFI) and electromagnetic interference (EMI) are pervasive.
Product DemandA variety of costumers with selective needsApple, Cisco, HP, Intel, Lenovo, Oracle, Samsung, US Census Bureau
• 3‐year contract with Apple gives Broadcom rights to design and supply new chips as Apple continues to advance iPhone technology
• Broadcom’s DOCSIS 3.1 certified chip set increases consumers connectivity with multi‐gigabit speeds via cable modems in homes. Reduces the cost for broadband service providers to provide gigabit speeds
• Transparency Market Research has published a new report on the global solid state drive market. As per the report, the global solid state drive market stood at US$15.1 bn in 2014 and is predicted to reach US$229.5 bn by 2022. A solid‐state storage device that uses integrated circuit assemblies as memory
to store data persistently
Competitive Advantage
•Holds Apple Inc. as one of its key clients.
• AVGO now has a hand in everything from set‐top boxes to mobile telecom to cloud storage to data center networking.
• AVGO is a key supplier for AAPL’s iPhones and other wireless devices, although it is a major strategic partnership, it is not the only peg AVGO hangs its hat on.
• AVGO will continue to grow its client list.

Competitive Advantage
•The advantage AVGO has over QCOM and INTC is it doesn’t have the legacy challenge those companies have. Legacy Challenge: Recoding older programs into new uses of technology
•AVGO is built to compete in today’s market, rather than dragging an old model into a new age.AVGO has a more diversified portfolio when compared to Qualcomm and IntelAVGO’s portfolio is unique, its composed of what once was two companies who specialized quite
successfully in separate markets in the semi‐conductor industry.
AVGO is investing more into the “Internet of Things”, “Connected Cars – Auto Industry”, & “Big Data” They expect to be a major player in each industry's by 2020
Historical Analysis
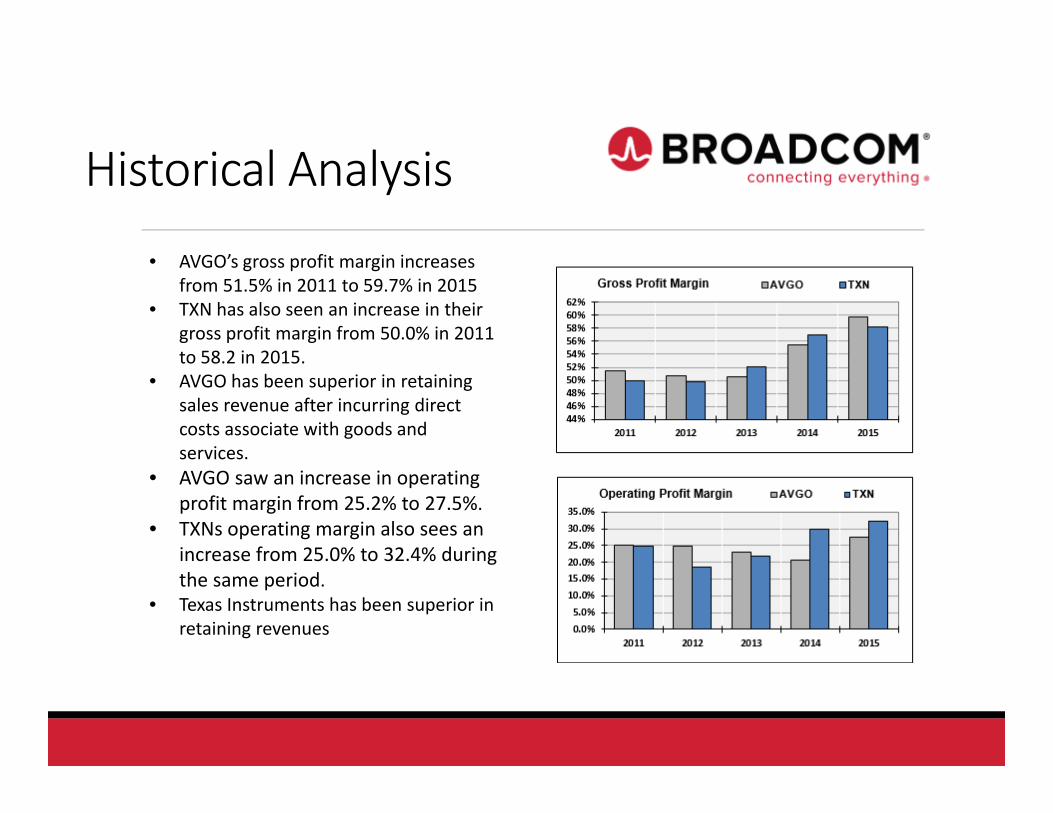
• AVGO’s gross profit margin increases from 51.5% in 2011 to 59.7% in 2015
• TXN has also seen an increase in their gross profit margin from 50.0% in 2011 to 58.2 in 2015.
• AVGO has been superior in retaining sales revenue after incurring direct costs associate with goods and services.
• AVGO saw an increase in operating profit margin from 25.2% to 27.5%.
• TXNs operating margin also sees an increase from 25.0% to 32.4% during the same period.
• Texas Instruments has been superior in retaining revenues
Historical Analysis
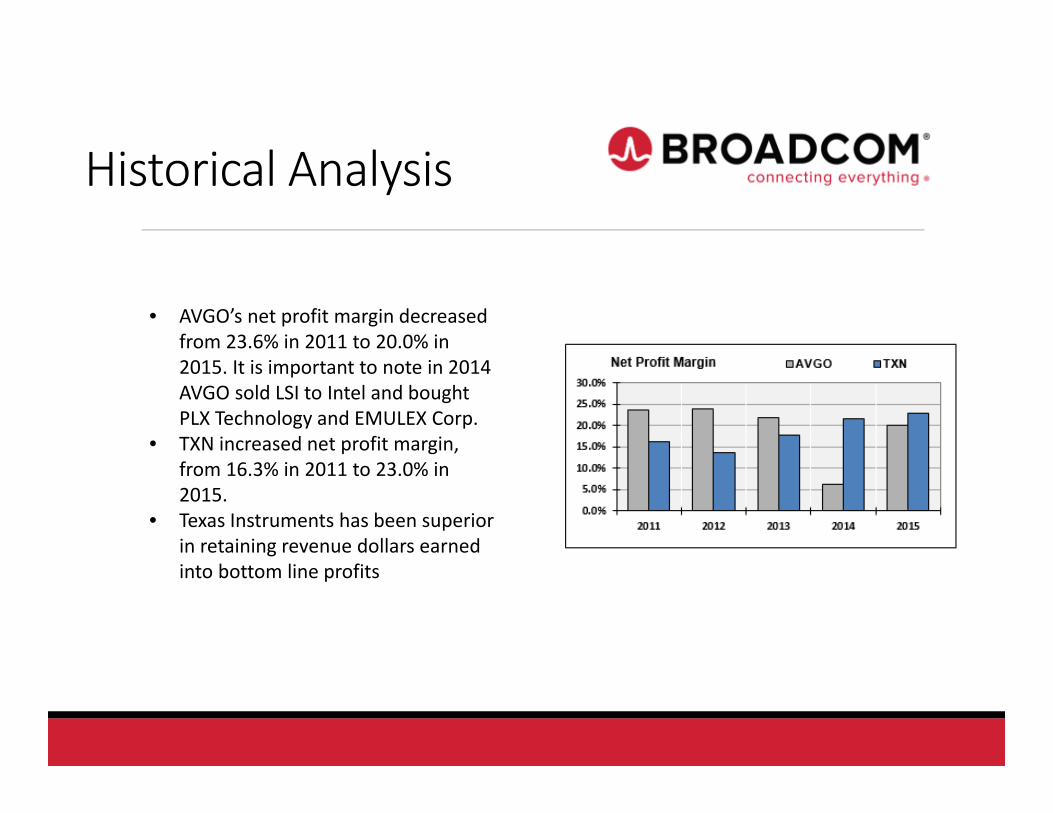
• AVGO’s net profit margin decreased from 23.6% in 2011 to 20.0% in 2015. It is important to note in 2014 AVGO sold LSI to Intel and bought PLX Technology and EMULEX Corp.
• TXN increased net profit margin, from 16.3% in 2011 to 23.0% in 2015.
• Texas Instruments has been superior in retaining revenue dollars earned into bottom line profits
Historical Analysis
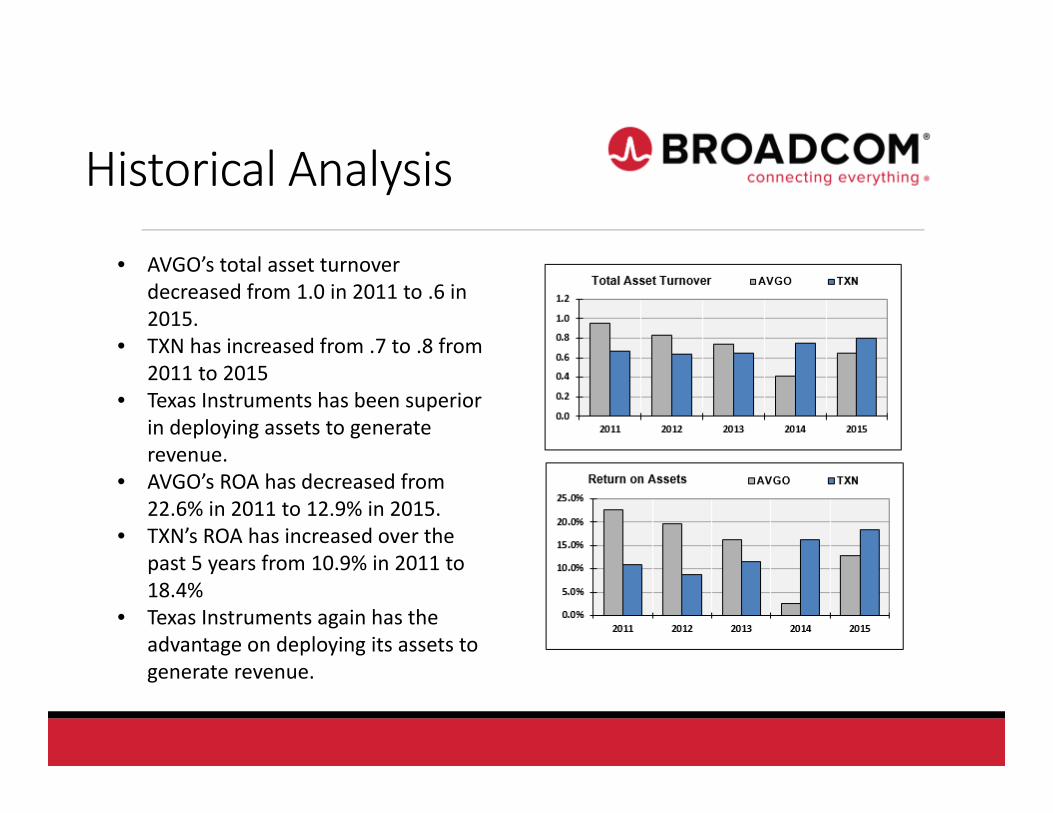
• AVGO’s total asset turnover decreased from 1.0 in 2011 to .6 in 2015.
• TXN has increased from .7 to .8 from 2011 to 2015
• Texas Instruments has been superior in deploying assets to generate revenue.
• AVGO’s ROA has decreased from 22.6% in 2011 to 12.9% in 2015.
• TXN’s ROA has increased over the past 5 years from 10.9% in 2011 to 18.4%
• Texas Instruments again has the advantage on deploying its assets to generate revenue.
Historical Analysis
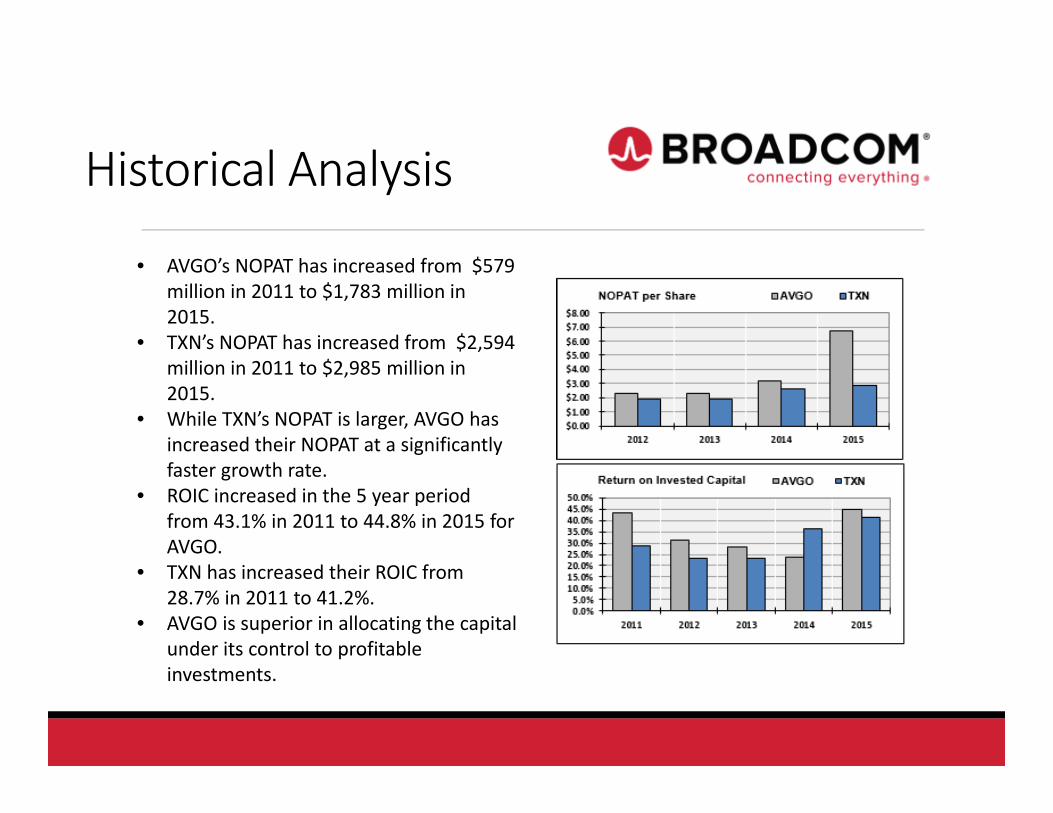
• AVGO’s NOPAT has increased from $579 million in 2011 to $1,783 million in 2015.
• TXN’s NOPAT has increased from $2,594 million in 2011 to $2,985 million in 2015.
• While TXN’s NOPAT is larger, AVGO has increased their NOPAT at a significantly faster growth rate.
• ROIC increased in the 5 year period from 43.1% in 2011 to 44.8% in 2015 for AVGO.
• TXN has increased their ROIC from 28.7% in 2011 to 41.2%.
• AVGO is superior in allocating the capital under its control to profitable investments.
Historical Analysis
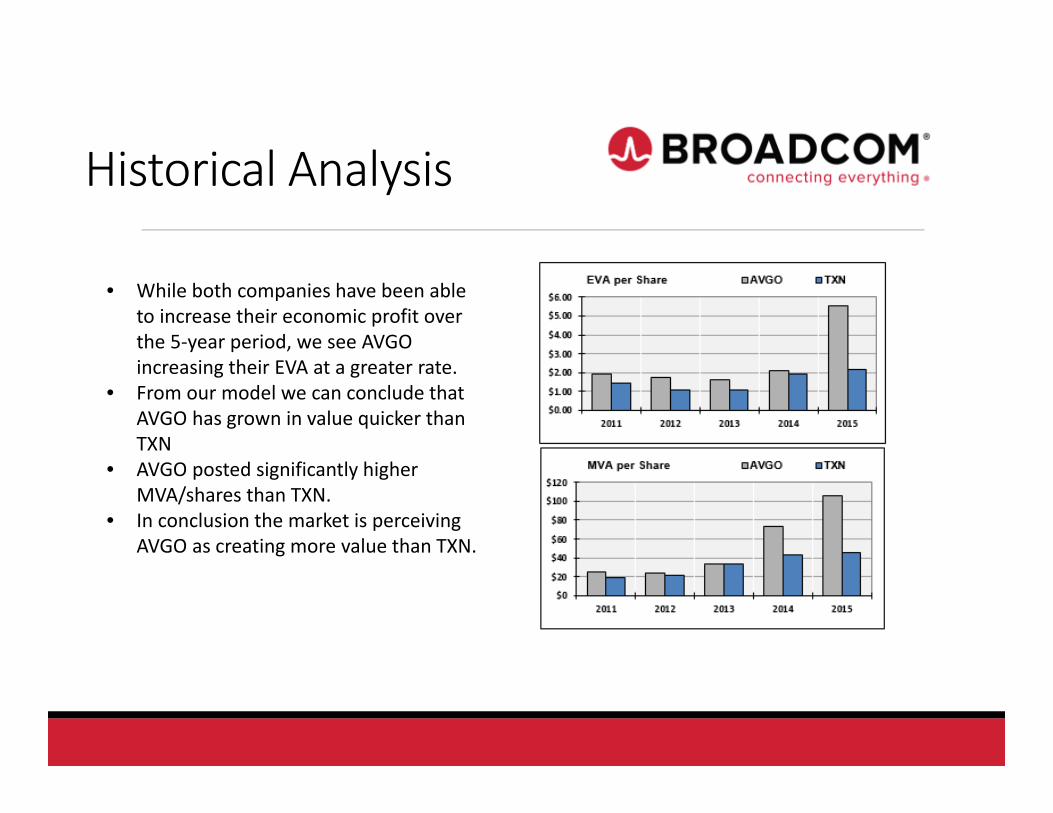
• While both companies have been able to increase their economic profit over the 5‐year period, we see AVGO increasing their EVA at a greater rate.
• From our model we can conclude that AVGO has grown in value quicker than TXN
• AVGO posted significantly higher MVA/shares than TXN.
• In conclusion the market is perceiving AVGO as creating more value than TXN.
Competitive Analysis
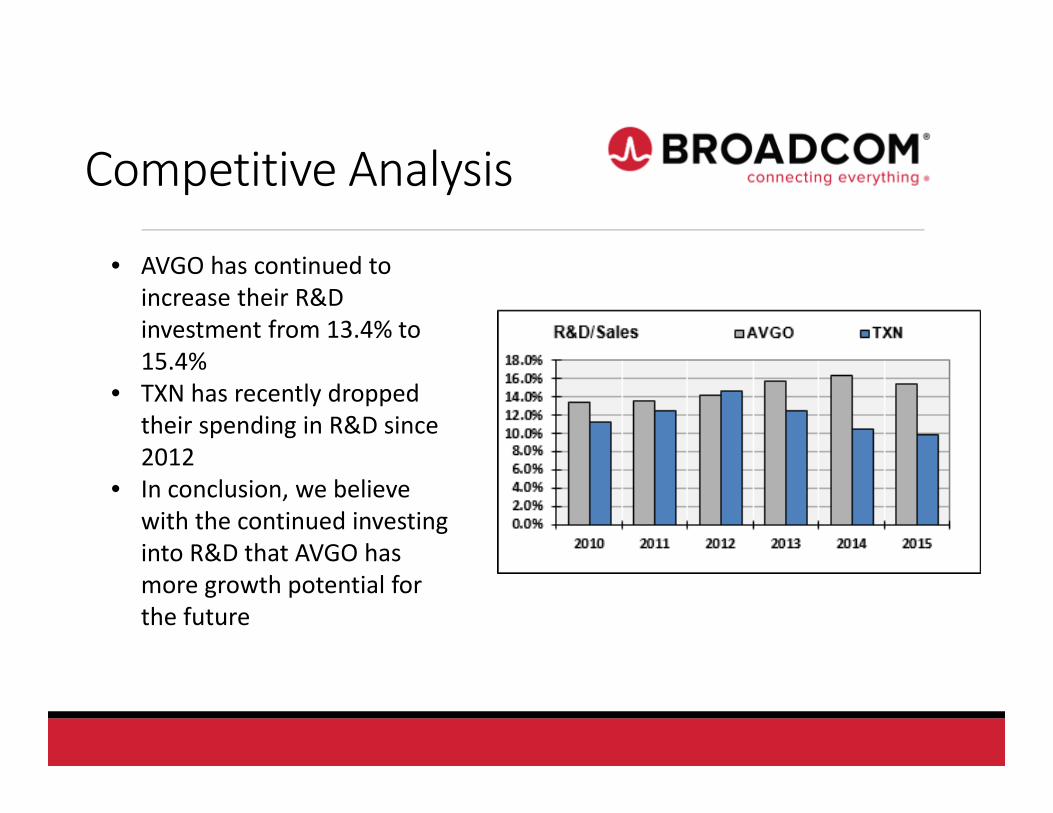
• AVGO has continued to increase their R&D investment from 13.4% to 15.4%
• TXN has recently dropped their spending in R&D since 2012
• In conclusion, we believe with the continued investing into R&D that AVGO has more growth potential for the future
Competitive Analysis
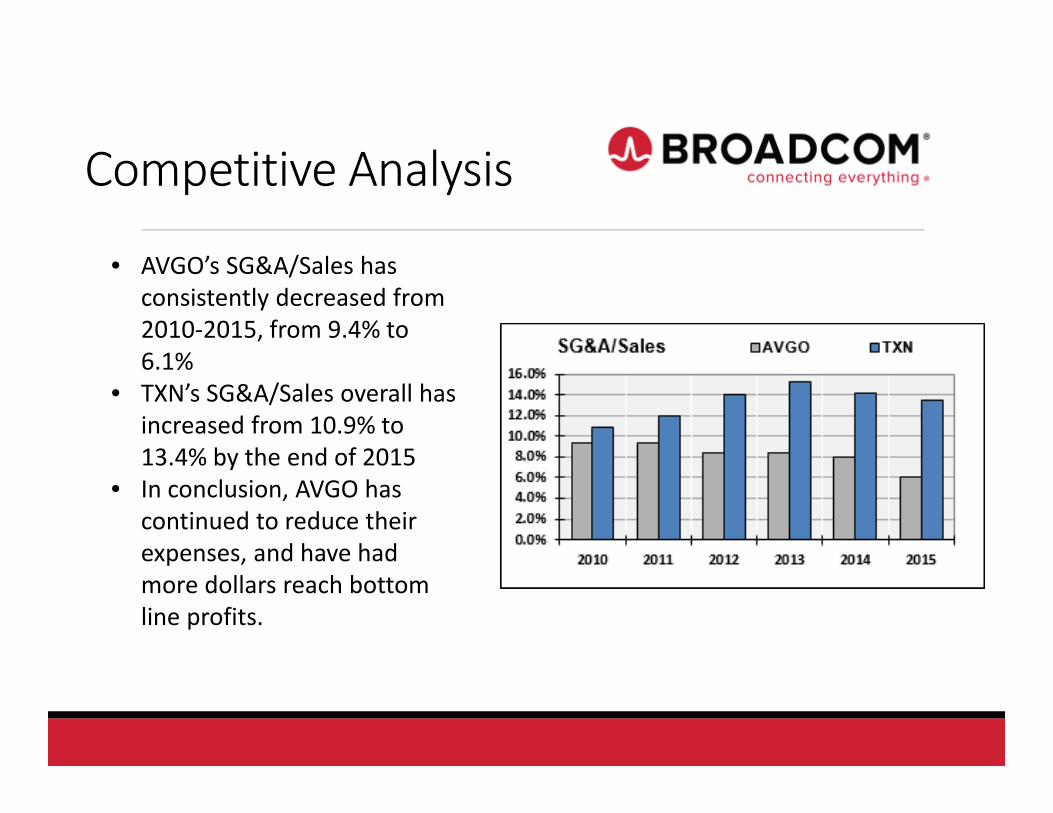
• AVGO’s SG&A/Sales has consistently decreased from 2010‐2015, from 9.4% to 6.1%
• TXN’s SG&A/Sales overall has increased from 10.9% to 13.4% by the end of 2015
• In conclusion, AVGO has continued to reduce their expenses, and have had more dollars reach bottom line profits.
Competitive Analysis
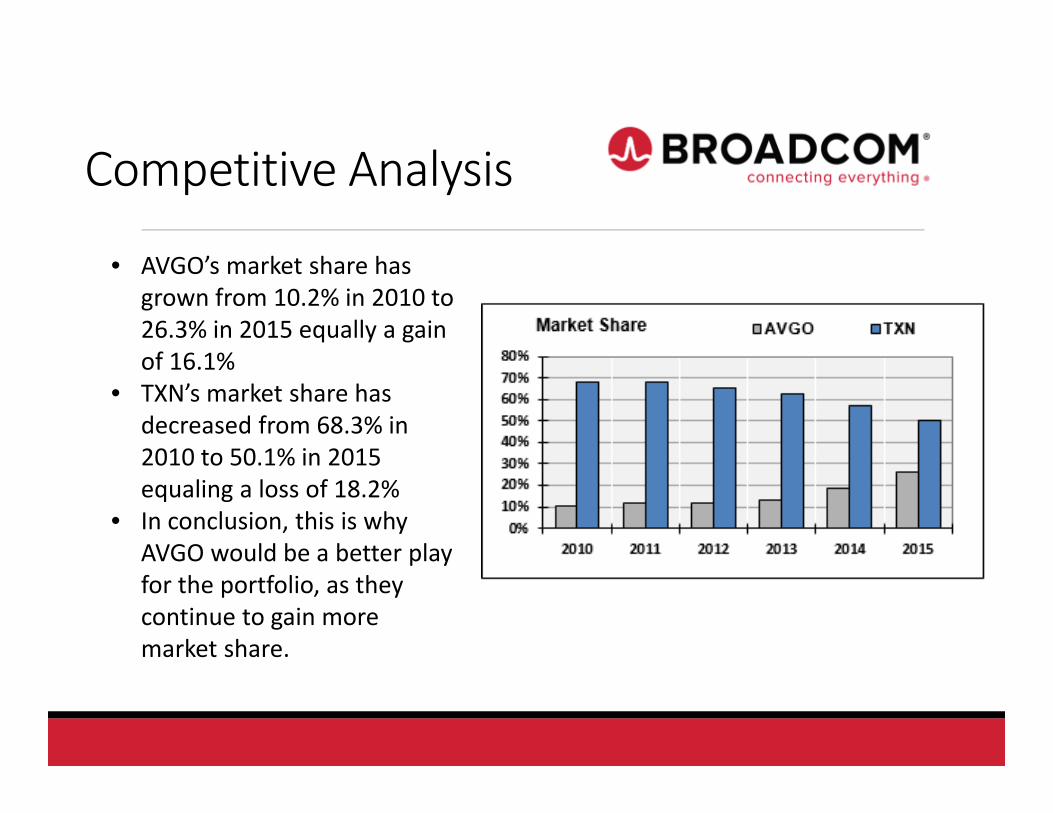
• AVGO’s market share has grown from 10.2% in 2010 to 26.3% in 2015 equally a gain of 16.1%
• TXN’s market share has decreased from 68.3% in 2010 to 50.1% in 2015 equaling a loss of 18.2%
• In conclusion, this is why AVGO would be a better play for the portfolio, as they continue to gain more market share.
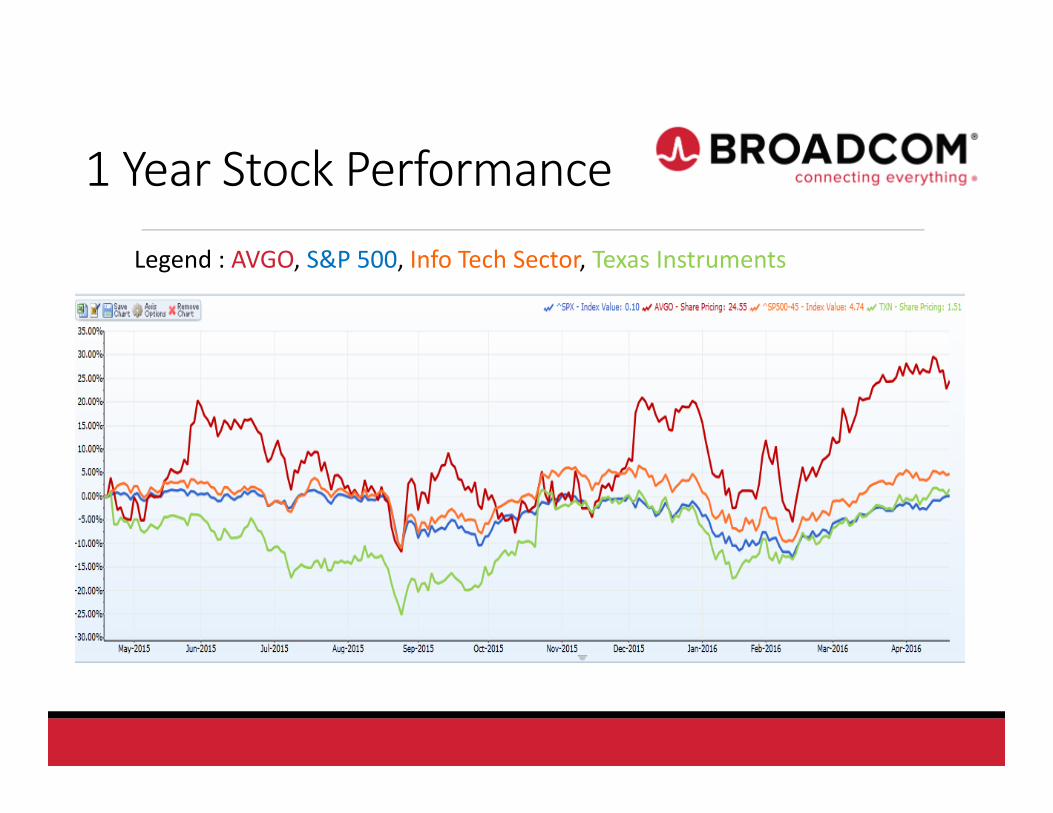
1 Year Stock Performance
Legend : AVGO, S&P 500, Info Tech Sector, Texas Instruments
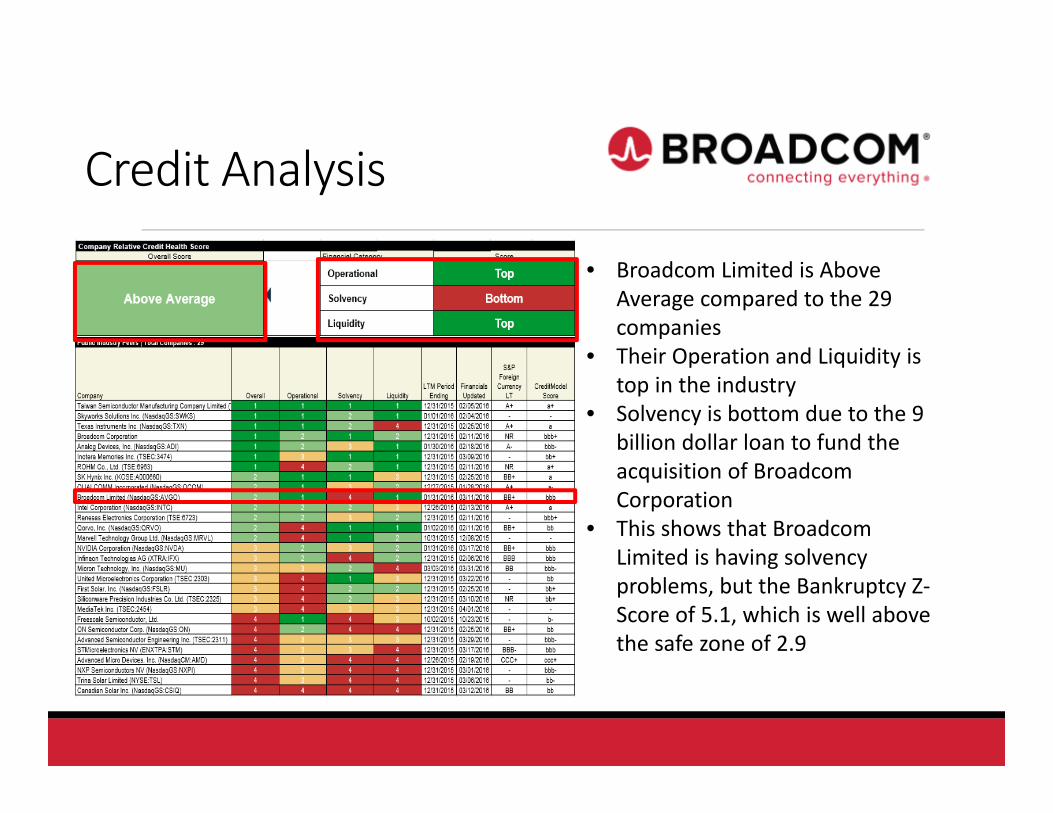
Credit Analysis
• Broadcom Limited is Above Average compared to the 29 companies
• Their Operation and Liquidity is top in the industry
• Solvency is bottom due to the 9 billion dollar loan to fund the acquisition of Broadcom Corporation
• This shows that Broadcom Limited is having solvency problems, but the Bankruptcy Z‐Score of 5.1, which is well above the safe zone of 2.9
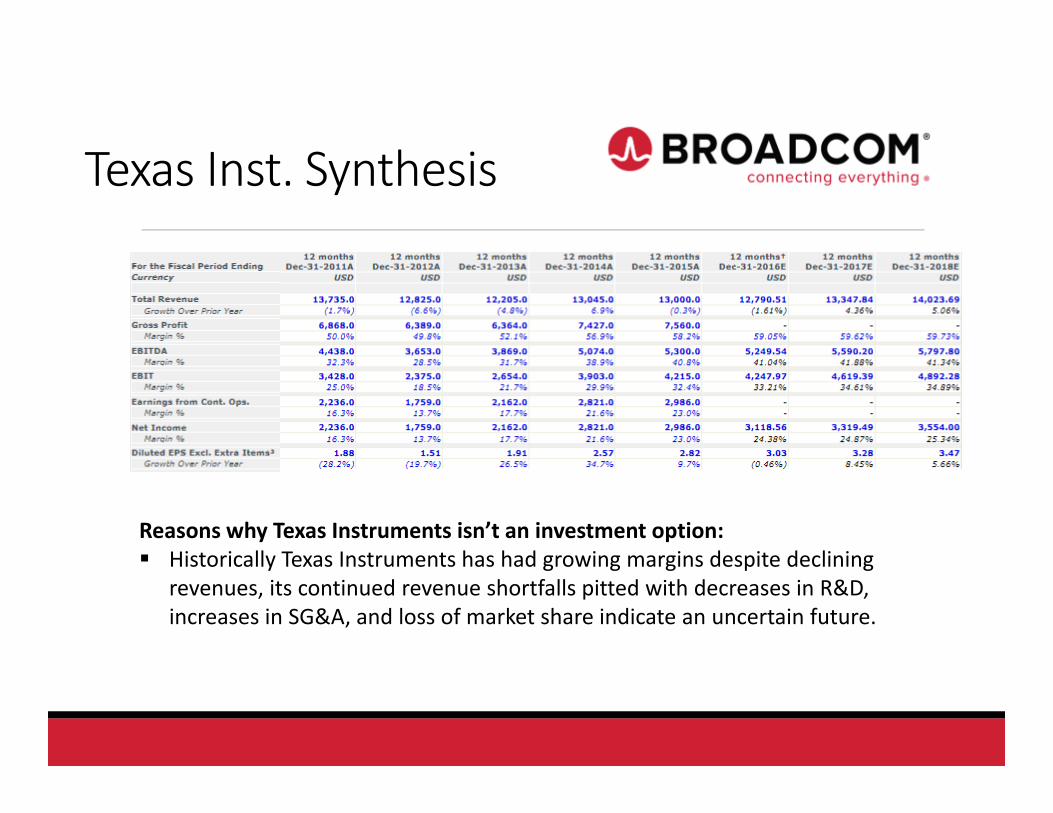
Texas Inst. Synthesis
Reasons why Texas Instruments isn’t an investment option: Historically Texas Instruments has had growing margins despite declining
revenues, its continued revenue shortfalls pitted with decreases in R&D, increases in SG&A, and loss of market share indicate an uncertain future.
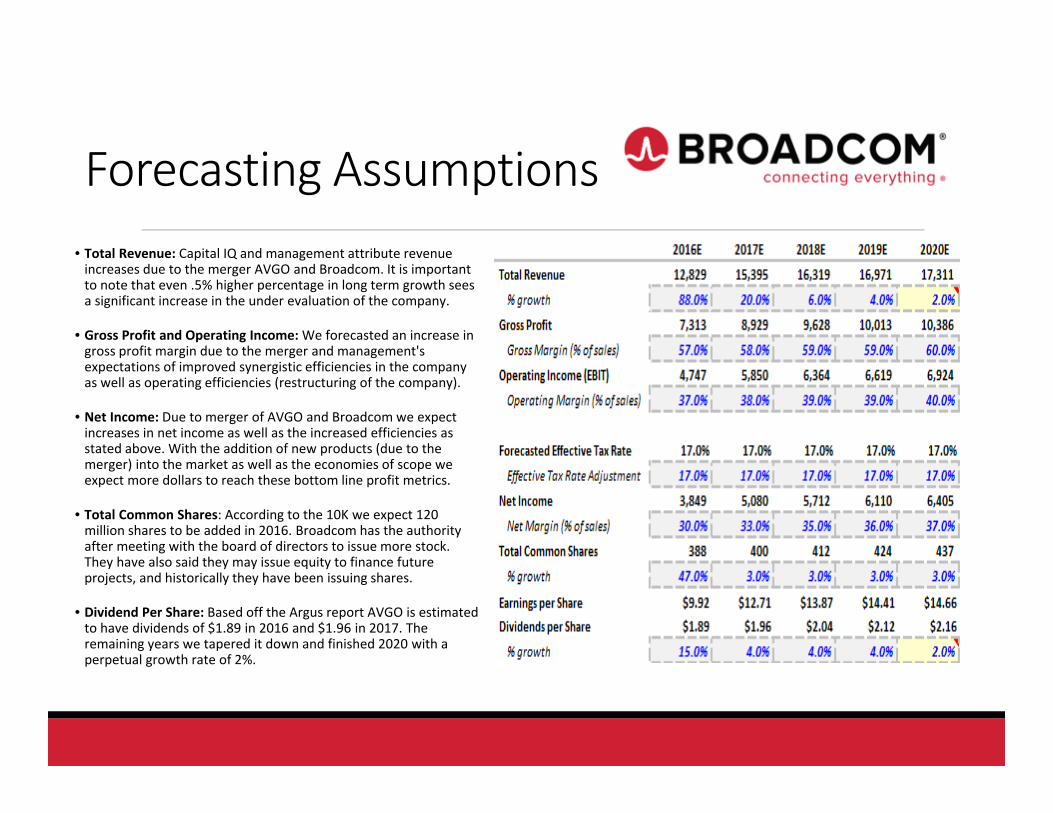
Forecasting Assumptions• Total Revenue: Capital IQ and management attribute revenue increases due to the merger AVGO and Broadcom. It is important to note that even .5% higher percentage in long term growth sees a significant increase in the under evaluation of the company.
• Gross Profit and Operating Income: We forecasted an increase in gross profit margin due to the merger and management's expectations of improved synergistic efficiencies in the company as well as operating efficiencies (restructuring of the company).
• Net Income: Due to merger of AVGO and Broadcom we expect increases in net income as well as the increased efficiencies as stated above. With the addition of new products (due to the merger) into the market as well as the economies of scope we expect more dollars to reach these bottom line profit metrics.
• Total Common Shares: According to the 10K we expect 120 million shares to be added in 2016. Broadcom has the authority after meeting with the board of directors to issue more stock. They have also said they may issue equity to finance future projects, and historically they have been issuing shares.
• Dividend Per Share: Based off the Argus report AVGO is estimated to have dividends of $1.89 in 2016 and $1.96 in 2017. The remaining years we tapered it down and finished 2020 with a perpetual growth rate of 2%.
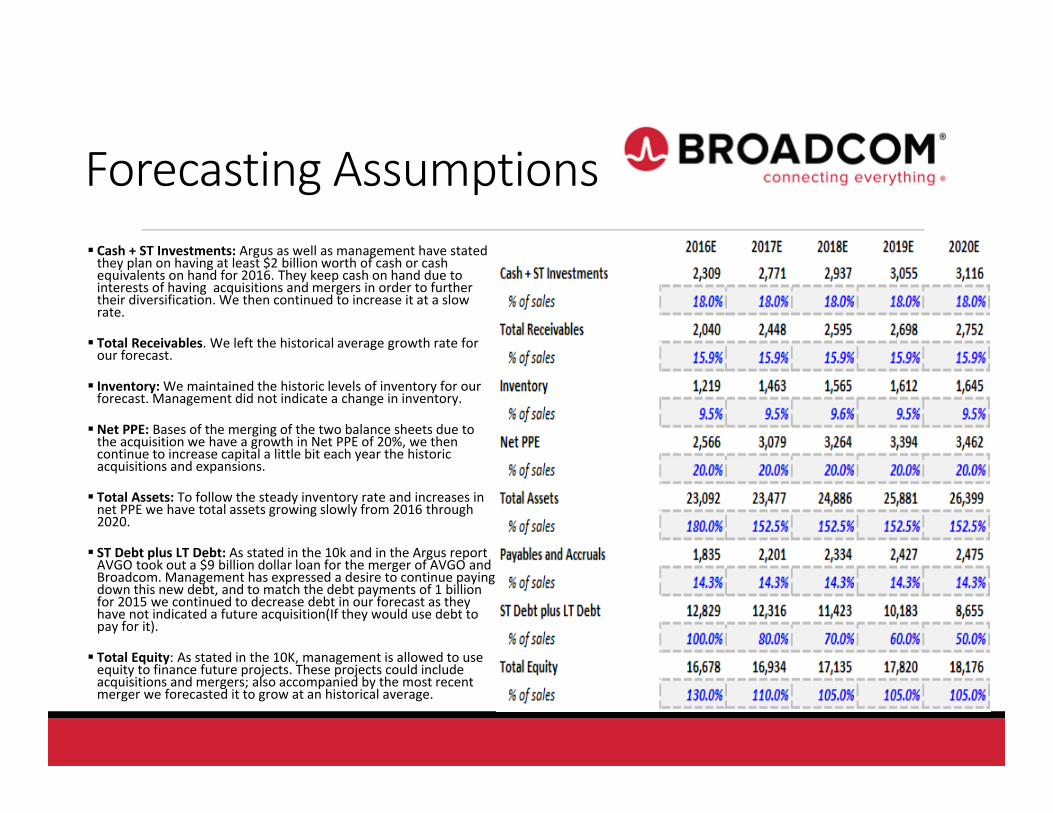
Forecasting Assumptions Cash + ST Investments: Argus as well as management have stated they plan on having at least $2 billion worth of cash or cash equivalents on hand for 2016. They keep cash on hand due to interests of having acquisitions and mergers in order to further their diversification. We then continued to increase it at a slow rate.
Total Receivables. We left the historical average growth rate for our forecast.
Inventory:We maintained the historic levels of inventory for our forecast. Management did not indicate a change in inventory.
Net PPE: Bases of the merging of the two balance sheets due to the acquisition we have a growth in Net PPE of 20%, we then continue to increase capital a little bit each year the historic acquisitions and expansions.
Total Assets: To follow the steady inventory rate and increases in net PPE we have total assets growing slowly from 2016 through 2020.
ST Debt plus LT Debt: As stated in the 10k and in the Argus report AVGO took out a $9 billion dollar loan for the merger of AVGO and Broadcom. Management has expressed a desire to continue paying down this new debt, and to match the debt payments of 1 billion for 2015 we continued to decrease debt in our forecast as they have not indicated a future acquisition(If they would use debt to pay for it).
Total Equity: As stated in the 10K, management is allowed to use equity to finance future projects. These projects could include acquisitions and mergers; also accompanied by the most recent merger we forecasted it to grow at an historical average.
Forecasting Assumptions
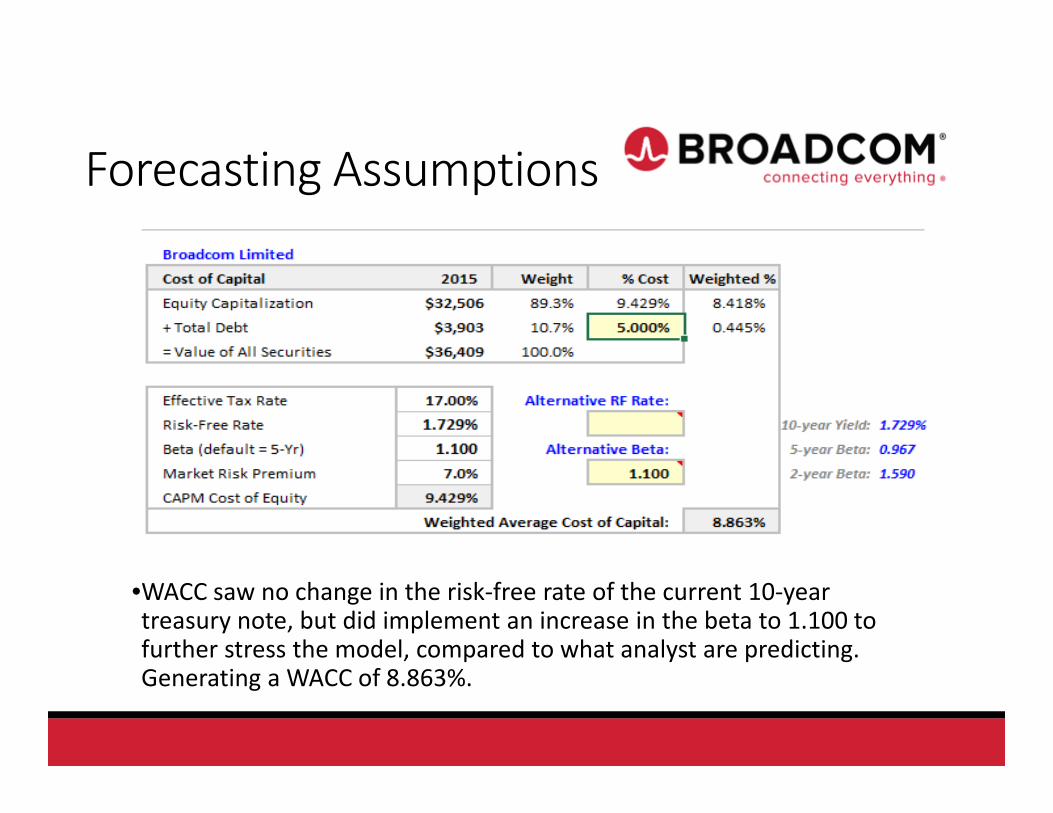
•WACC saw no change in the risk‐free rate of the current 10‐year treasury note, but did implement an increase in the beta to 1.100 to further stress the model, compared to what analyst are predicting. Generating a WACC of 8.863%.
Forecasting Assumptions
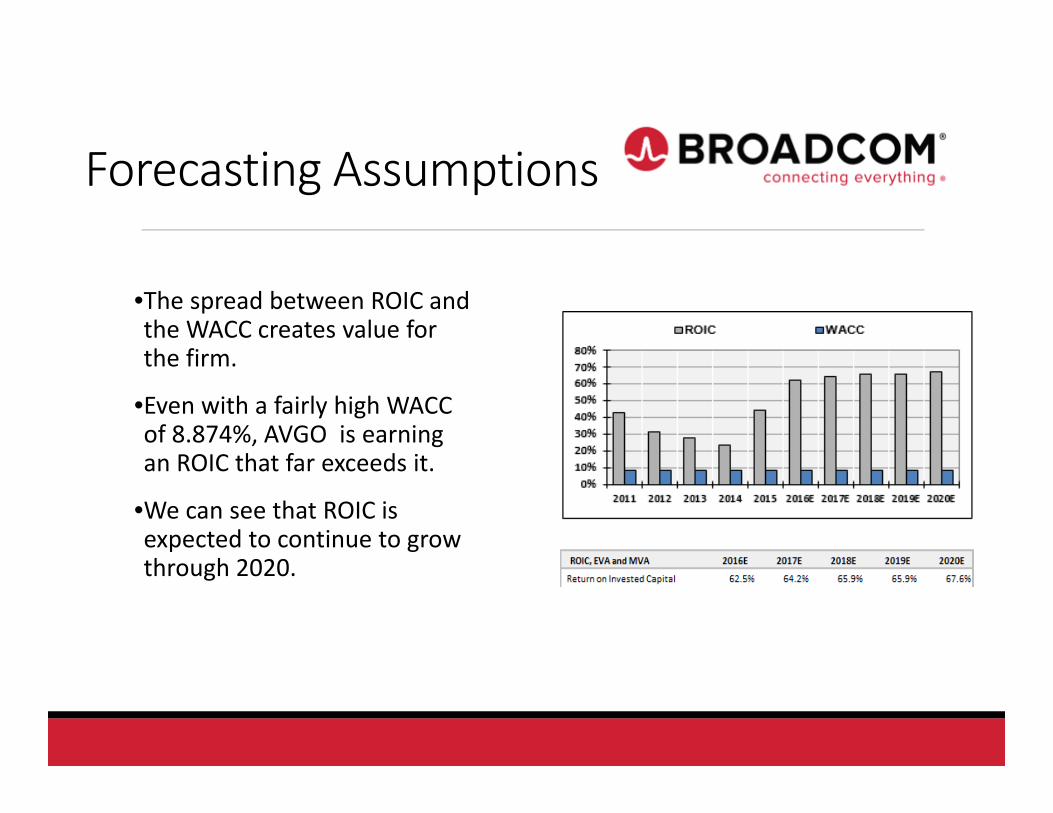
•The spread between ROIC and the WACC creates value for the firm.
•Even with a fairly high WACC of 8.874%, AVGO is earning an ROIC that far exceeds it.
•We can see that ROIC is expected to continue to grow through 2020.
Forecasting Assumptions
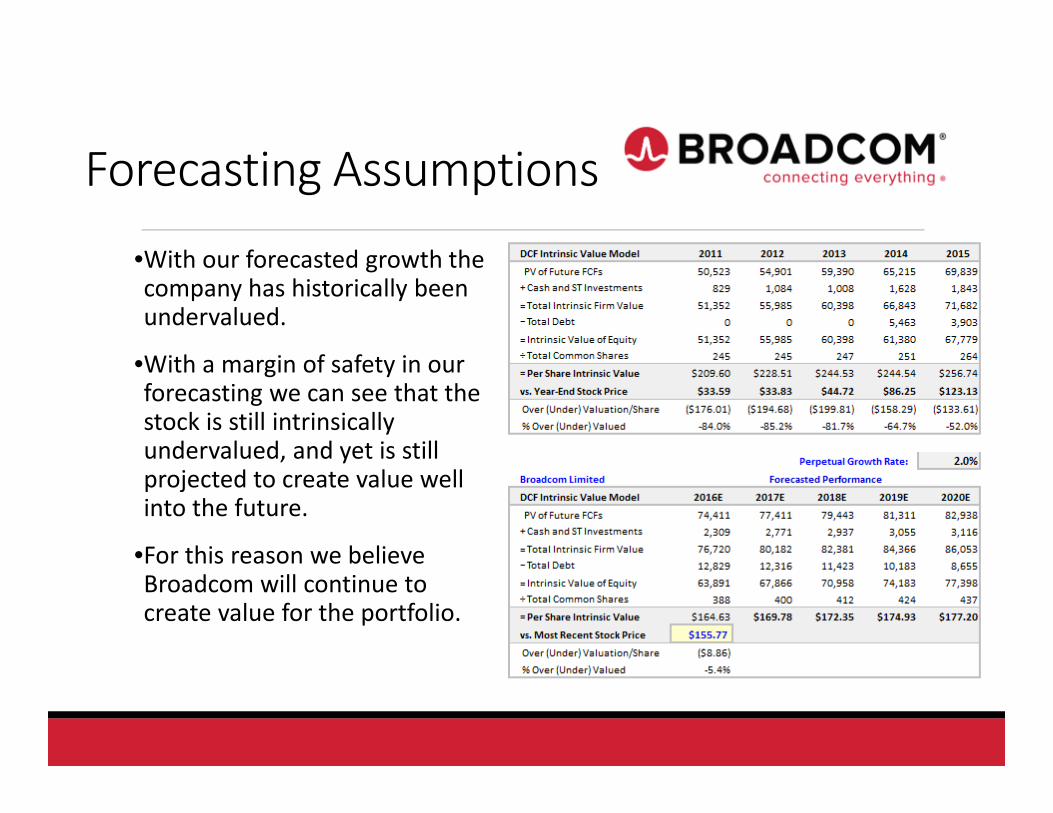
•With our forecasted growth the company has historically been undervalued.
•With a margin of safety in our forecasting we can see that the stock is still intrinsically undervalued, and yet is still projected to create value well into the future.
•For this reason we believe Broadcom will continue to create value for the portfolio.
Relative Valuation
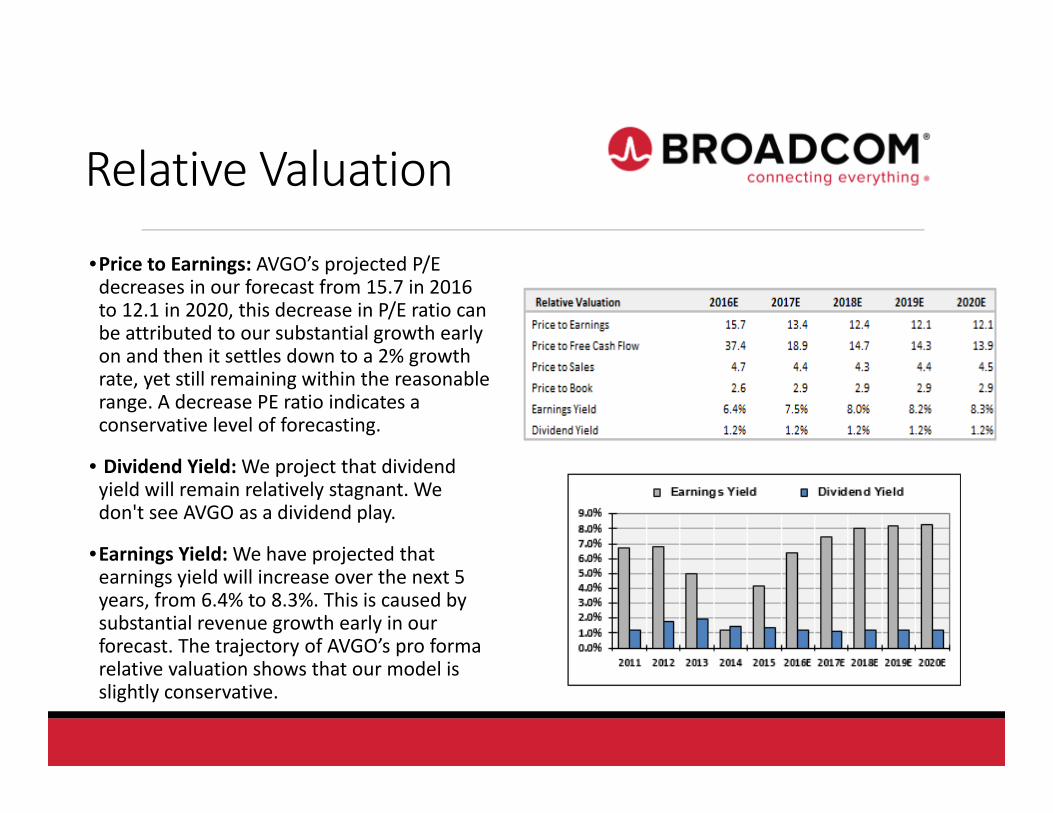
•Price to Earnings: AVGO’s projected P/E decreases in our forecast from 15.7 in 2016 to 12.1 in 2020, this decrease in P/E ratio can be attributed to our substantial growth early on and then it settles down to a 2% growth rate, yet still remaining within the reasonable range. A decrease PE ratio indicates a conservative level of forecasting.
• Dividend Yield:We project that dividend yield will remain relatively stagnant. We don't see AVGO as a dividend play.
•Earnings Yield:We have projected that earnings yield will increase over the next 5 years, from 6.4% to 8.3%. This is caused by substantial revenue growth early in our forecast. The trajectory of AVGO’s pro forma relative valuation shows that our model is slightly conservative.
Conclusion
• Positioned for growth through strategic acquisitions and leading technological advances
• Diversified product portfolio reduces risk during economic uncertainties
• Management continuously shows ability to grow profit margins
• Relative undervaluation – Continuously growing intrinsic value
• Recommendation: Buy