Embed Size (px)
Citation preview

Confidential & Proprietary Confidential & Proprietary
AVAYA INC. LENDER PRESENTATION
November 1, 2017
Confidential & Proprietary 2
Disclaimer
The purpose of this presentation is to provide a description of the business and operations of Avaya Inc. and its subsidiaries (collectively, “Avaya”) in order to assist each recipient (“Recipient”) for the sole purpose of undertaking an evaluation of Avaya. The material and information herein is considered confidential and proprietary information of Avaya and is not to be shared with any other parties. The presentation may not be photocopied, reproduced, distributed, referred to or passed to others at any time without the prior written consent of Avaya. By accepting this document, the Recipient expressly agrees to maintain the confidentiality of the material and information herein and to use any such material and information in accordance with the terms set forth herein, its compliance policies and applicable law, including federal and state securities laws. The presentation is not all inclusive and may not contain all of the information that the Recipient requires in order to evaluate Avaya. The Recipient shall rely on its own independent analysis to assess the accuracy and completeness of all material and information contained herein. Except as set forth in the definitive documentation, no representation, warranty or undertaking, expressed or implied, is or will be made and no responsibility or liability is or will be accepted by Avaya or any of its affiliates or their associates, directors, officers, employees, agents, shareholders or advisors as to, or in relation to, the use, accuracy or completeness of the material and information contained in this presentation, or any other information, errors therein or omissions therefrom. Neither Avaya, any of its affiliates, nor any of their respective associates, directors, officers, employees, agents, shareholders or advisors undertakes to add to, update or otherwise revise or correct any information or inaccuracies which become apparent in this presentation. This presentation speaks as of the date hereof and shall not be deemed to be an indication of the state of affairs of, or the absence of any change or development in, the business of Avaya at any other point in time. This presentation may contain certain forward-looking statements within the meaning of the Private Securities Litigation Reform Act of 1995 with respect to the financial condition, results of operations and businesses of Avaya. Some of these statements can be identified by terms and phrases such as “anticipate,” “believe,” “intend,” “estimate,” “expect,” “continue,” “could,” “should,” “may,” “plan,” “project,” “predict” and similar expressions. Avaya cautions that such “forward looking statements,” including without limitation, its future business prospects, revenue, working capital, liquidity, capital needs, interest costs and income, wherever they occur in this presentation or in other statements attributable to Avaya are necessarily estimates reflecting the judgment of its senior management and involve a number of risks and uncertainties that could cause actual results to differ materially from those suggested by the “forward looking statements.” Factors that could cause our actual results to differ materially from those expressed or implied in such “forward-looking statements,” include but are not limited to those factors detailed from time to time in Avaya’s filings with the Securities and Exchange Commission. The forward looking statements speak only as of the date hereof and the date they are made. Avaya disclaims any intent or obligation to update “forward looking statements” made in this presentation to reflect changed assumptions, the occurrence of unanticipated events, or changes to future operating results over time.
Confidential & Proprietary 3
Explanatory Note on Financial Measures Use of non-GAAP (Adjusted) Financial Measures
The information furnished in this presentation includes non-GAAP financial measures that differ from measures calculated in accordance with generally accepted accounting principles in the United States of America (“GAAP”), including EBITDA.
We believe that including supplementary information concerning EBITDA is appropriate because it serves as a basis for determining management and employee compensation. In addition, we believe EBITDA provides more comparability between our historical results and results that reflect purchase accounting and our current capital structure. Accordingly, EBITDA measures our financial performance based on operational factors that management can impact in the short-term, such as our pricing strategies, volume, costs and expenses of the organization and it presents our financial performance in a way that can be more easily compared to prior quarters or fiscal years.
EBITDA measures have limitations as analytical tools. EBITDA measures do not represent net income (loss) or cash flow from operations as those terms are defined by GAAP and do not necessarily indicate whether cash flows will be sufficient to fund cash needs. While EBITDA measures are frequently used as measures of operations and the ability to meet debt service requirements, these terms are not necessarily comparable to other similarly titled captions of other companies due to the potential inconsistencies in the method of calculation. EBITDA excludes the impact of earnings or charges resulting from matters that we consider not to be indicative of our ongoing operations. Our formulation of EBITDA allows adjustment for certain amounts that are included in calculating net income (loss) including, but not limited to reorganization, restructuring and impairment charges, certain fees payable to our private equity sponsors and other advisors, resolution of certain legal matters and our pension costs and post-employment benefits costs. However, these are expenses that may recur, may vary and are difficult to predict.
These non-GAAP measures are not based on any comprehensive set of accounting rules or principles and have limitations as analytical tools in that they do not reflect all of the amounts associated with the Company’s results of operations as determined in accordance with GAAP. As such, these measures should only be used to evaluate the Company's results of operations in conjunction with the corresponding GAAP measures.
FY2017 and EBITDA
Unless otherwise stated, Q4 FY2017 and full year FY2017 financials are preliminary and subject to the completion of financial closing and review procedures. There can be no assurance that the Company’s final results will not differ from these preliminary estimates as a result of quarter-end closing, review procedures, or review adjustments, and any such changes could be material. Where relevant, the Q4 FY2017 and full year FY2017 financials included in this presentation reflect the midpoint of the range disclosed in the October 30, 2017 press release.
“EBITDA” in this presentation reflects Adjusted EBITDA (as defined in Company filings and earnings releases) further adjusted to exclude OCI addback and Pension/OPEB/LTD/FAS 112 expense; this adjustment is utilized to exclude the non-operational / non-cash impact of pension-related items. Based on the aforementioned definition, “EBITDA” in this presentation is analogous to the “Adjusted EBITDAP” metric as presented in the Amended Plan Disclosure Statement (Exhibit F) and Avaya’s prior 8-K filings.
The Plan
Refers to the Avaya Business Plan (“ABP”) as per Exhibit F attached to the Disclosure Statement filed with the Bankruptcy Court of the Southern District of NY on April 13, 2017, as amended from time to time.
With respect to the financials, any references to “Plan” refer to this ABP, with Q4 adjusted to exclude any contribution from Networking (given the sale completed July 2017).
Confidential & Proprietary 4
Agenda
II. Introduction to Avaya – Jim Chirico, President & CEO
III. Solutions & Technology Overview – Laurent Philonenko, SVP, Solutions & Technology
IV. Key Credit Highlights – Pat O’Malley, SVP & CFO
IV. Financial Overview – Pat O’Malley
I. Transaction Overview – Goldman Sachs
VI. Syndication Overview – Goldman Sachs
Confidential & Proprietary
Transaction Overview
Confidential & Proprietary 6
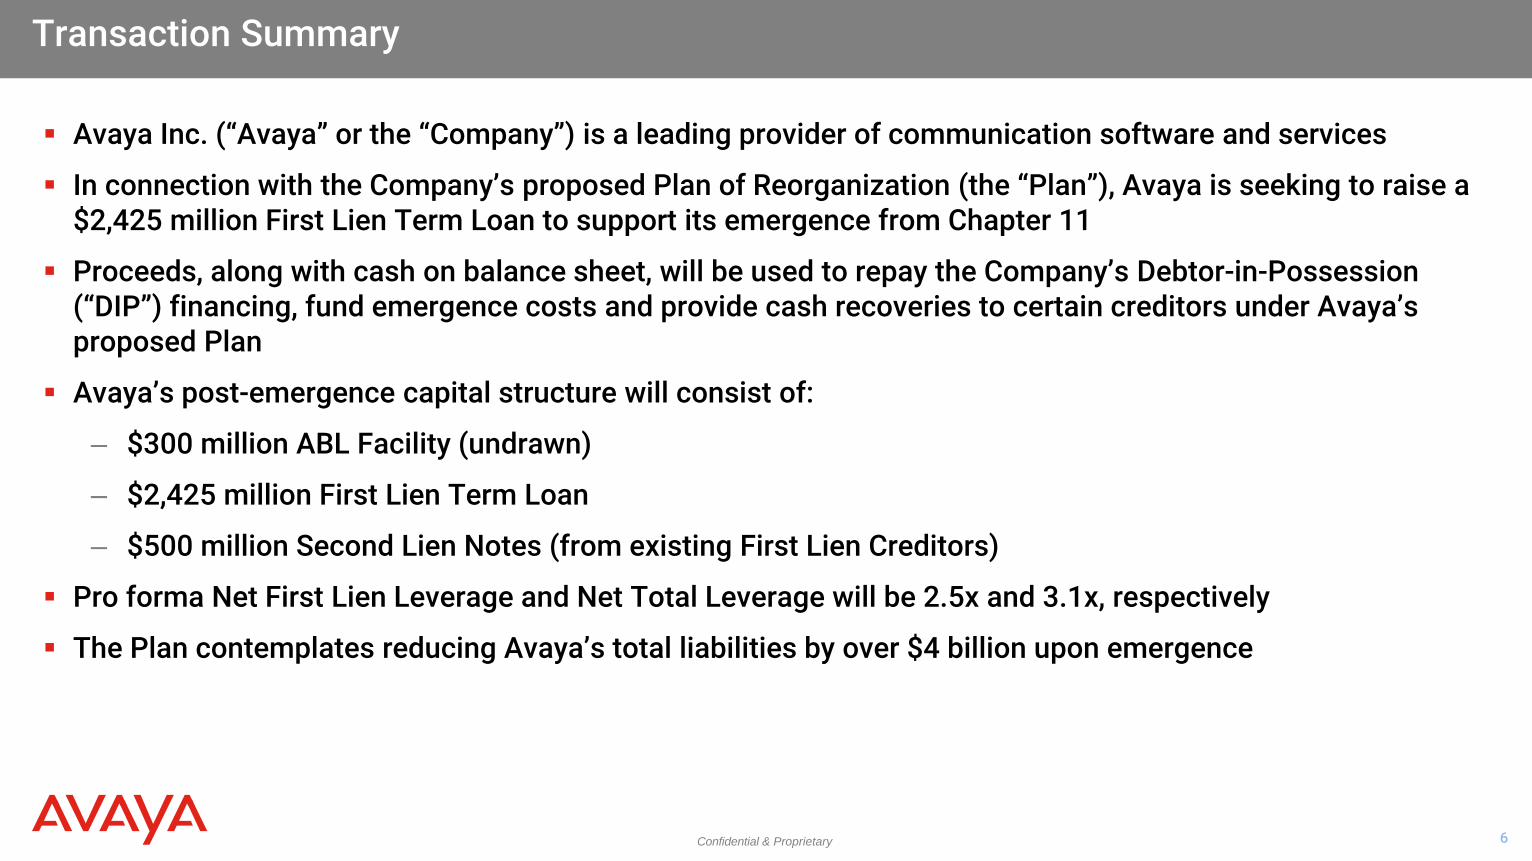
Transaction Summary
Avaya Inc. (“Avaya” or the “Company”) is a leading provider of communication software and services
In connection with the Company’s proposed Plan of Reorganization (the “Plan”), Avaya is seeking to raise a $2,425 million First Lien Term Loan to support its emergence from Chapter 11
Proceeds, along with cash on balance sheet, will be used to repay the Company’s Debtor-in-Possession (“DIP”) financing, fund emergence costs and provide cash recoveries to certain creditors under Avaya’s proposed Plan
Avaya’s post-emergence capital structure will consist of:
‒ $300 million ABL Facility (undrawn)
‒ $2,425 million First Lien Term Loan
‒ $500 million Second Lien Notes (from existing First Lien Creditors)
Pro forma Net First Lien Leverage and Net Total Leverage will be 2.5x and 3.1x, respectively
The Plan contemplates reducing Avaya’s total liabilities by over $4 billion upon emergence

Confidential & Proprietary 7
Transaction Overview
Sources: Avaya Disclosure Statement, Avaya Disclosure Statement Supplement, Avaya Plan of Reorganization Note: Pro forma capitalization subject to confirmation by the Bankruptcy Court. 1 Cash balance includes $76 million restricted cash balance that will be released upon emergence.
Sources of Funds ($mm) Uses of Funds ($mm)New $300mm ABL Facility $ - DIP Facility Cash Repayment $ 725New First Lien Term Loan 2,425 First Lien Claims Cash Settlement 2,066New Second Lien Notes 500 PBGC Cash Settlement 340Cash on Balance Sheet1 952 General Unsecured Claims Cash Settlement 58
Administrative, Tax & Professional Claims 243Estimated Financing Fees & OID 97Cash to Balance Sheet 350
Total Sources $ 3,877 Total Uses $ 3,877
Pre- x Prelim Post- x PrelimPro Forma Capitalization Emergence FY 2017 EBITDA Adj. Emergence FY 2017 EBITDA Maturity PricingCash & Cash Equivalents1 $ 952 $(602) $ 350
DIP Facility $ 725 0.9 x $(725) $ - Jan-18 L + 750First Lien Term Loans 3,235 4.8 (3,235) - Varies Varies7.000% First Lien Notes 1,009 6.0 (1,009) - Apr-19 7.000 %9.000% First Lien Notes 290 6.4 (290) - Apr-19 9.000 %New $300mm ABL Facility - - - 5 years [●]New First Lien Term Loan - 2,425 2,425 7 years [●]Net First Lien Debt $ 4,307 5.2 x $(2,232) $ 2,075 2.5 x10.500% Second Lien Notes 1,384 (1,384) - Mar-21 10.500 %New Second Lien Notes - 500 500 7.5 years [●]Net Debt $ 5,691 6.9 x $(3,116) $ 2,575 3.1 x
Plan Enterprise Value $ 5,721 7.0 x
Preliminary FY 2017 EBITDA $ 822

Confidential & Proprietary
Introduction to Avaya
Confidential & Proprietary 9
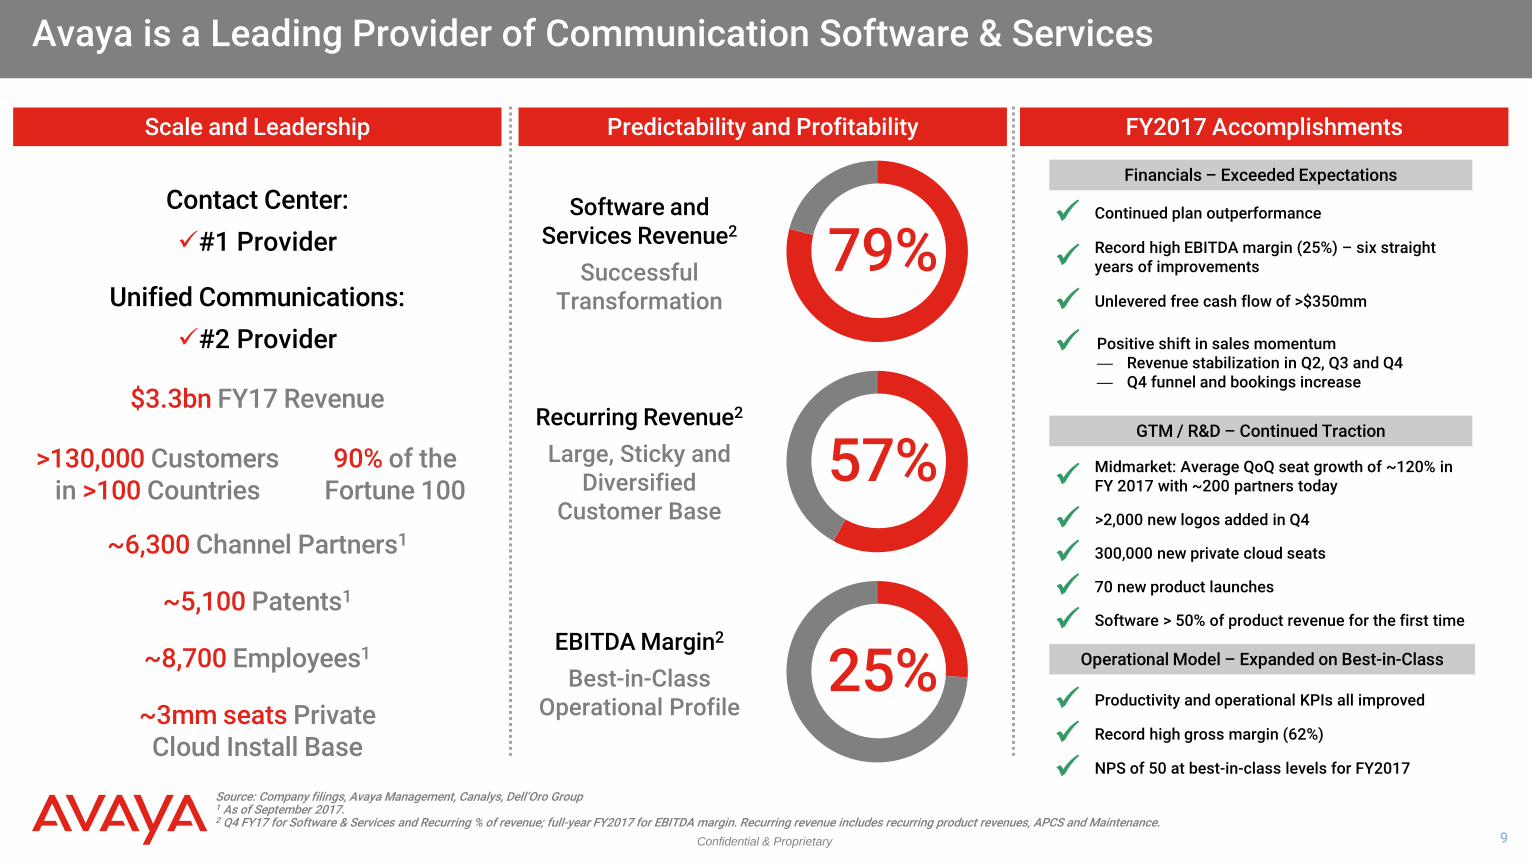
Avaya is a Leading Provider of Communication Software & Services
Source: Company filings, Avaya Management, Canalys, Dell’Oro Group 1 As of September 2017. 2 Q4 FY17 for Software & Services and Recurring % of revenue; full-year FY2017 for EBITDA margin. Recurring revenue includes recurring product revenues, APCS and Maintenance.
Contact Center: #1 Provider
Unified Communications: #2 Provider
79%
57%
25%
Software and Services Revenue2
Successful Transformation
EBITDA Margin2
Best-in-Class Operational Profile
~6,300 Channel Partners1
>130,000 Customers in >100 Countries
$3.3bn FY17 Revenue
~8,700 Employees1
~5,100 Patents1
Scale and Leadership Predictability and Profitability
Recurring Revenue2
Large, Sticky and Diversified
Customer Base
FY2017 Accomplishments
Productivity and operational KPIs all improved
Record high gross margin (62%)
Operational Model – Expanded on Best-in-Class
NPS of 50 at best-in-class levels for FY2017
Midmarket: Average QoQ seat growth of ~120% in FY 2017 with ~200 partners today
GTM / R&D – Continued Traction
300,000 new private cloud seats
70 new product launches Software > 50% of product revenue for the first time
>2,000 new logos added in Q4
Unlevered free cash flow of >$350mm
Continued plan outperformance
Record high EBITDA margin (25%) – six straight years of improvements
Financials – Exceeded Expectations
Positive shift in sales momentum — Revenue stabilization in Q2, Q3 and Q4 — Q4 funnel and bookings increase
~3mm seats Private Cloud Install Base
90% of the Fortune 100
Confidential & Proprietary 10
$ 466 $ 451 $ 447 $ 538 $ 487 $ 495 $ 499
Q1 FY17 Q2 FY17 Q3 FY17 Q4 FY17
$ 781 $ 750 $ 723 $ 875 $ 804 $ 803 $ 789
Q1 FY17 Q2 FY17 Q3 FY17 Q4 FY17
$ 158 $ 157 $ 191 $ 226 $ 187 $ 192 $ 216
Q1 FY17 Q2 FY17 Q3 FY17 Q4 FY17Plan Actual
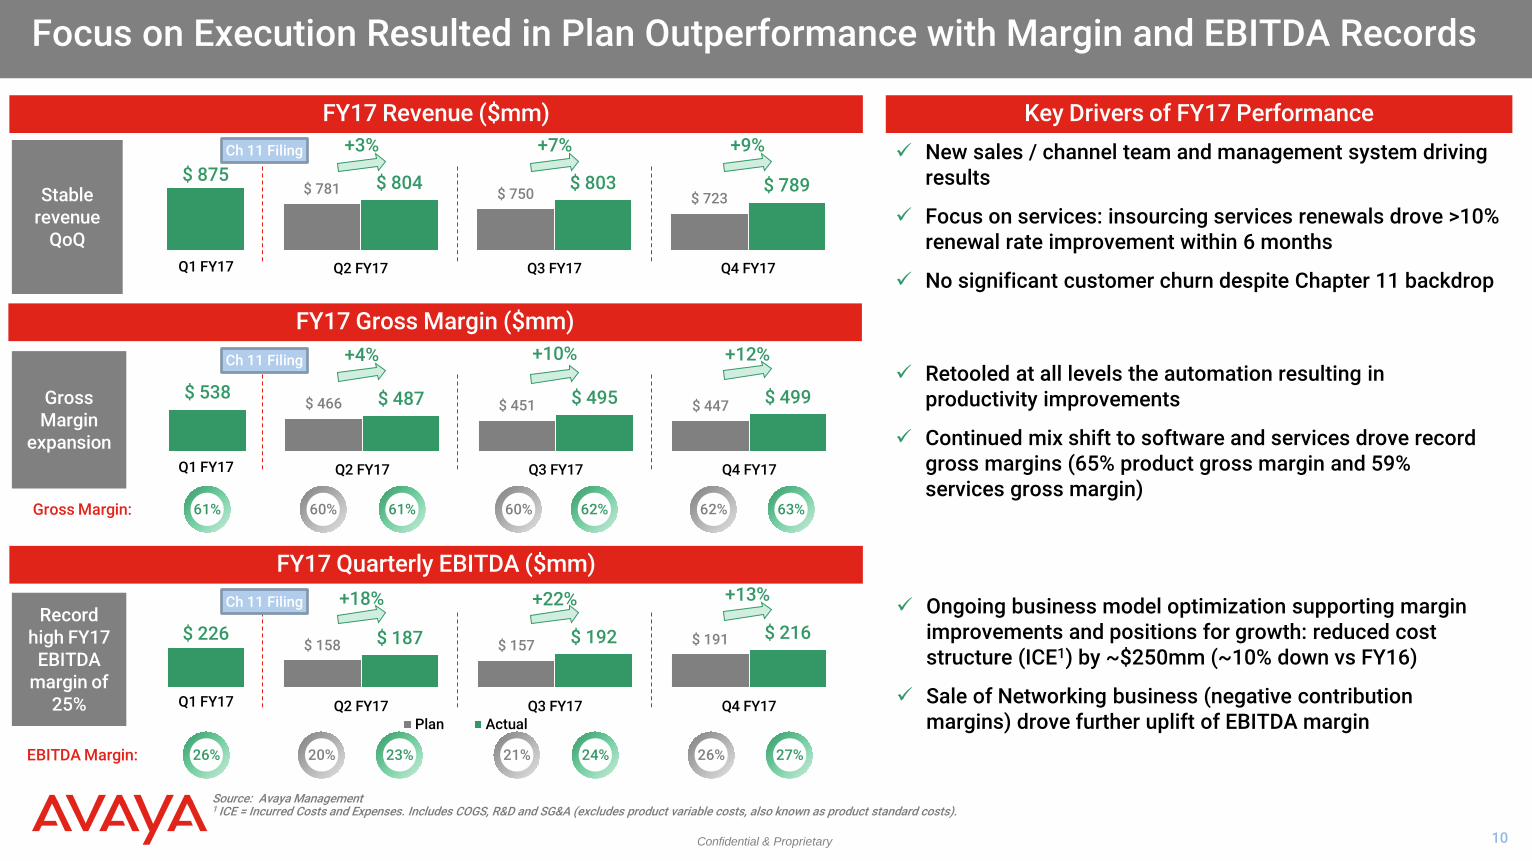
Focus on Execution Resulted in Plan Outperformance with Margin and EBITDA Records
Source: Avaya Management 1 ICE = Incurred Costs and Expenses. Includes COGS, R&D and SG&A (excludes product variable costs, also known as product standard costs).
FY17 Revenue ($mm)
FY17 Quarterly EBITDA ($mm)
+3% +7%
Stable revenue
QoQ
Record high FY17
EBITDA margin of
25%
+9%
+18% +22% +13%
EBITDA Margin: 20% 23% 24% 21% 26%
Key Drivers of FY17 Performance
Q1 FY17
FY17 Gross Margin ($mm)
Gross Margin
expansion
Q1 FY17
Q1 FY17
+10% +13%
+4% +12%
61% Gross Margin: 60% 61% 62% 60% 63% 62%
New sales / channel team and management system driving results
Focus on services: insourcing services renewals drove >10% renewal rate improvement within 6 months
No significant customer churn despite Chapter 11 backdrop
Ch 11 Filing
Ch 11 Filing
Ch 11 Filing
Retooled at all levels the automation resulting in productivity improvements
Continued mix shift to software and services drove record gross margins (65% product gross margin and 59% services gross margin)
Ongoing business model optimization supporting margin improvements and positions for growth: reduced cost structure (ICE1) by ~$250mm (~10% down vs FY16)
Sale of Networking business (negative contribution margins) drove further uplift of EBITDA margin
27% 26%

Confidential & Proprietary 11
56 %
FY11 FY17
65%
Source: Company filings, Avaya Management 1 OCOGS= Other Cost of Goods Sold and primarily reflects supply chain costs.
Services Automation Real Estate Sq. Feet (‘000) Revenue / Employee ($k) EBITDA / Employee ($k)
Since 2011, Year-on-Year, Proven Ability to Expand Best-in-Class Operational Model
OCOGS1 ($mm) NPS
28
50
FY11 FY17
300
375
FY11 FY17
$52
$94
FY11 FY17
Cost Structure (ICE, $bn) EBITDA Margin Services Gross Margin Product Gross Margin
48 %
FY11 FY17
59% $3.9
$2.2
FY11 FY17
19 %
FY11 FY17
25% +9% +11% $(1.7)bn +6%
Systems and Operational Excellence
Margin Expansion
11 %
FY11 FY17
96%
FY11 FY17
~6,000
~2,500
Increased Productivity and Quality Process Redesigns
Increased Efficiency
Automation Capabilities (Quoting, Pricing, Renewals) Increased Discipline
355
120
FY11 FY17
~$
$
$
$
Confidential & Proprietary 12
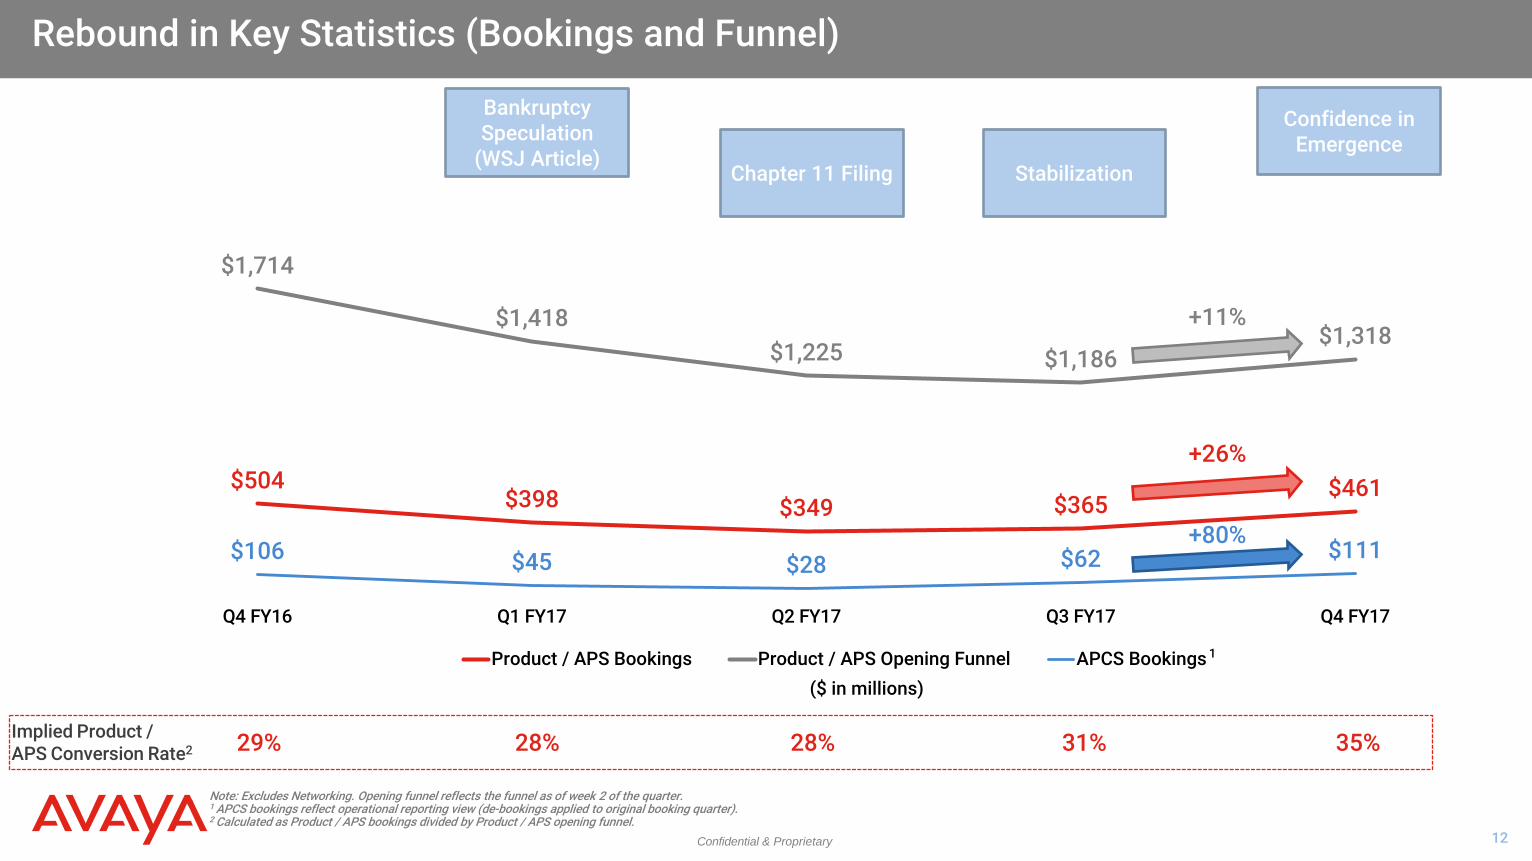
Rebound in Key Statistics (Bookings and Funnel)
Note: Excludes Networking. Opening funnel reflects the funnel as of week 2 of the quarter. 1 APCS bookings reflect operational reporting view (de-bookings applied to original booking quarter). 2 Calculated as Product / APS bookings divided by Product / APS opening funnel.
$504 $398 $349 $365
$461
$1,714
$1,418 $1,225 $1,186
$1,318
$106 $45 $28 $62 $111
Q4 FY16 Q1 FY17 Q2 FY17 Q3 FY17 Q4 FY17
Product / APS Bookings Product / APS Opening Funnel APCS Bookings
Bankruptcy Speculation
(WSJ Article) Chapter 11 Filing Stabilization
Confidence in Emergence
+26%
+11%
($ in millions)
+80%
1
29% 28% Implied Product / APS Conversion Rate2 28% 31% 35%
Confidential & Proprietary 13
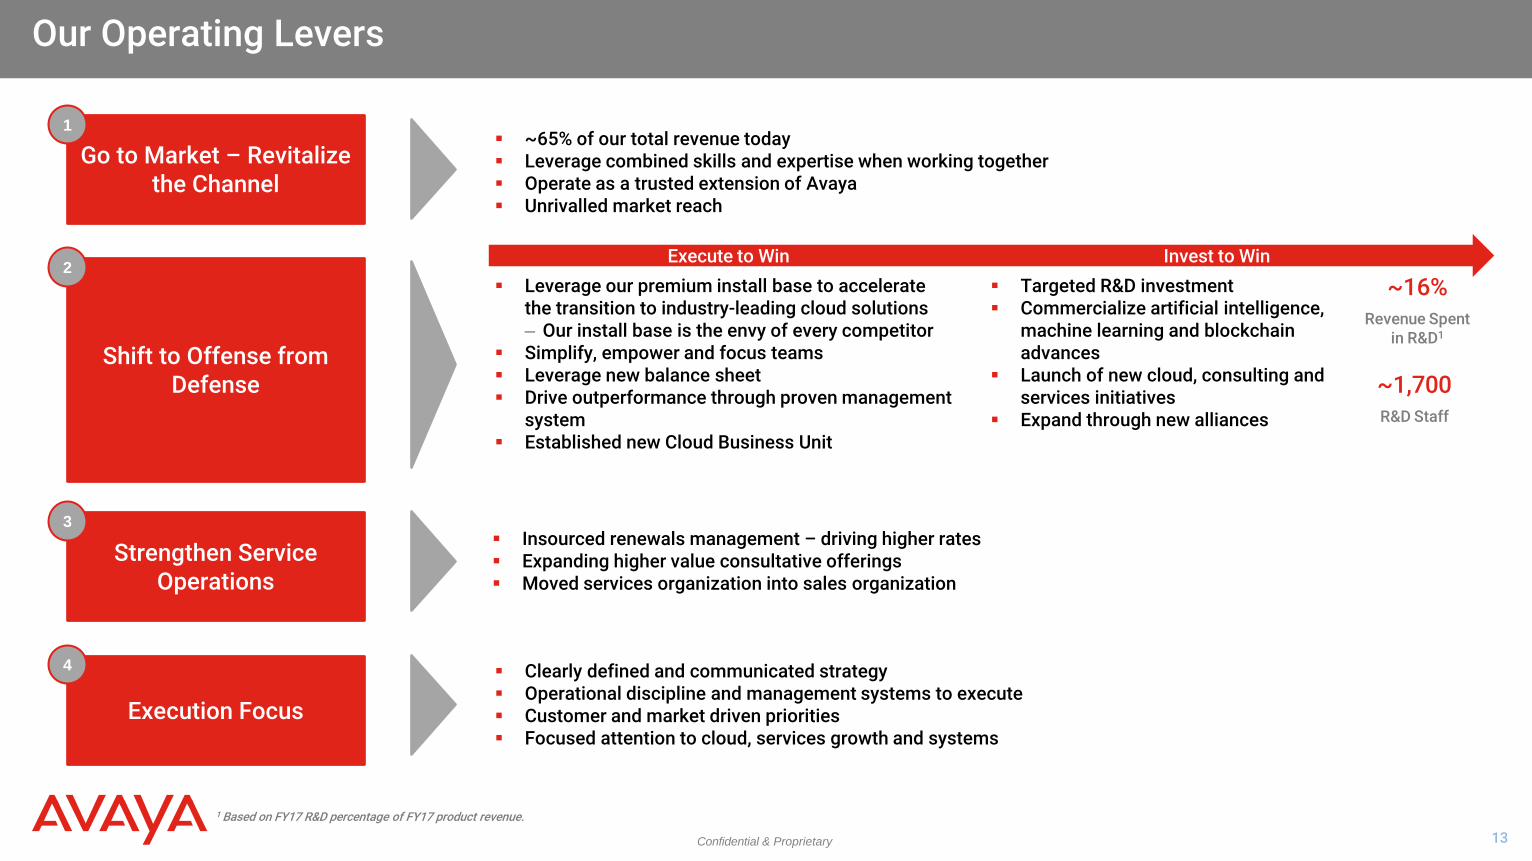
Our Operating Levers
1 Based on FY17 R&D percentage of FY17 product revenue.
Go to Market – Revitalize the Channel
1
Shift to Offense from Defense
2
Strengthen Service Operations
3
Execution Focus
4
~65% of our total revenue today Leverage combined skills and expertise when working together Operate as a trusted extension of Avaya Unrivalled market reach
Insourced renewals management – driving higher rates Expanding higher value consultative offerings Moved services organization into sales organization
Clearly defined and communicated strategy Operational discipline and management systems to execute Customer and market driven priorities Focused attention to cloud, services growth and systems
Execute to Win Invest to Win
~1,700 R&D Staff
~16% Revenue Spent
in R&D1
Leverage our premium install base to accelerate the transition to industry-leading cloud solutions ‒ Our install base is the envy of every competitor
Simplify, empower and focus teams Leverage new balance sheet Drive outperformance through proven management
system Established new Cloud Business Unit
Targeted R&D investment Commercialize artificial intelligence,
machine learning and blockchain advances
Launch of new cloud, consulting and services initiatives
Expand through new alliances

Confidential & Proprietary 14
Proven Management Team
Key Management Team Revitalized Management Organization
13 7 members Alignment and accountability
Across all products and services
Dedicated business unit with P&L responsibility for cloud
Continued productivity and operational efficiencies
Track record driving results
RENEWED FOCUS ON GROWTH
MERGE CORE FUNCTIONS
ALIGN INVESTMENTS WITH OPPORTUNITY
ADOPT PORTFOLIO MENTALITY JIM
CHIRICO President and CEO
PAT O’MALLEY
Senior Vice President and CFO
JERRY GLEMBOCKI
Senior Vice President, Operations
NIKOS NIKOLOPOULOS
Senior Vice President, Strategy and Corporate
Development
ELIZABETH MCCARTHY
Vice President, Legal
SENIOR VICE PRESIDENT, CLOUD
(12/1 start date)
Simplified Executive Committee
Fully Integrated Sales Organization
Executive Management Team
Streamlined Corporate Functions
Cloud Business Unit
LAURENT PHILONENKO
Senior Vice President, Solutions and Technology

Confidential & Proprietary
Solutions and Technology Overview
Confidential & Proprietary 16
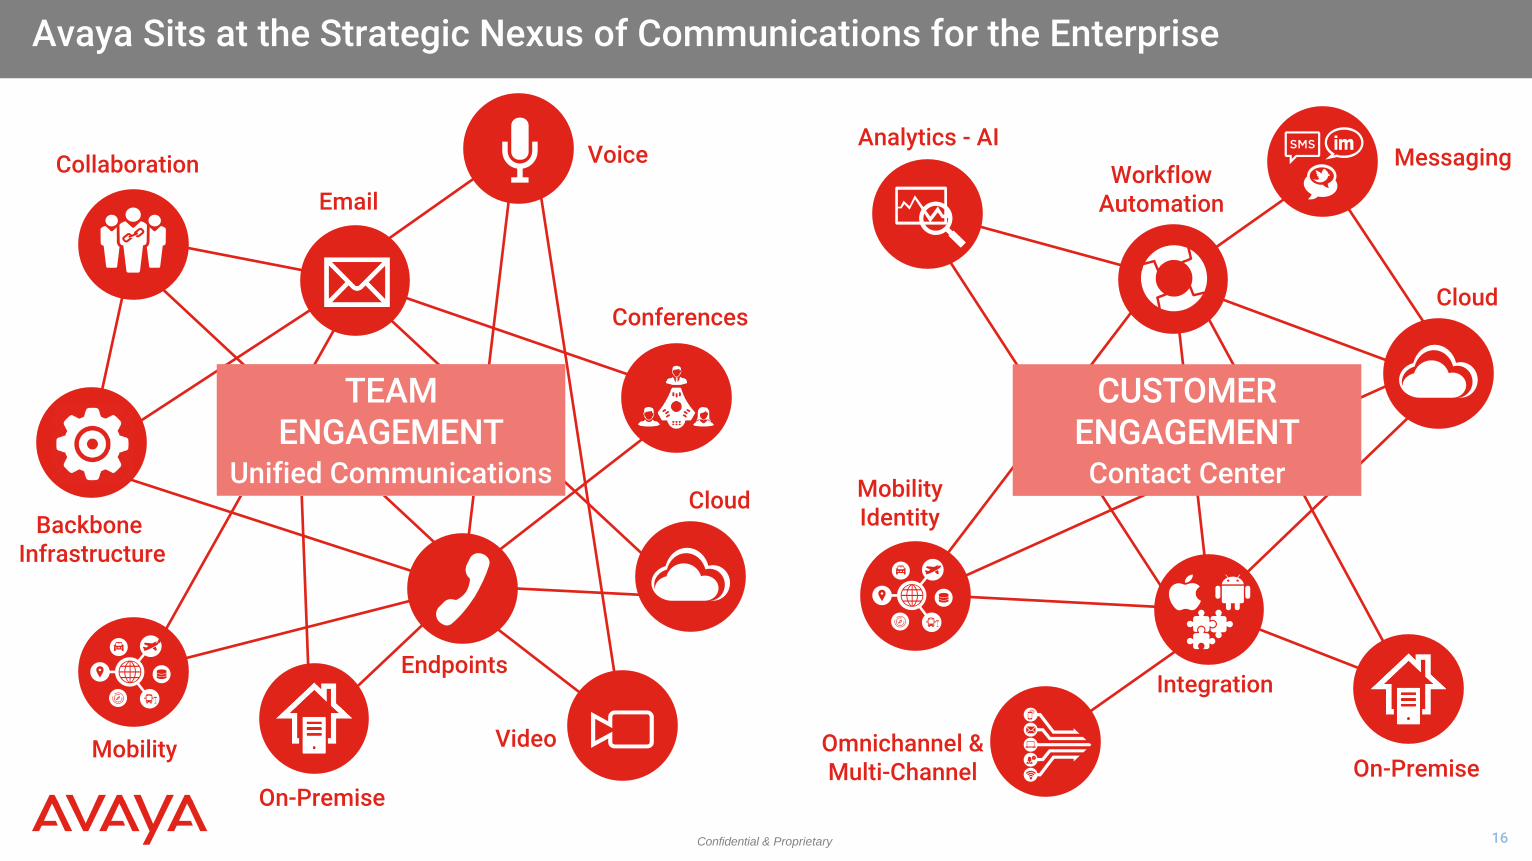
Avaya Sits at the Strategic Nexus of Communications for the Enterprise
Collaboration
Conferences
Video
Endpoints
Backbone Infrastructure
Mobility
Voice
Analytics - AI Workflow
Automation
Messaging
Integration
On-Premise Omnichannel & Multi-Channel
Mobility Identity
Cloud
TEAM ENGAGEMENT
Unified Communications
CUSTOMER ENGAGEMENT Contact Center
On-Premise
Cloud
Confidential & Proprietary 17
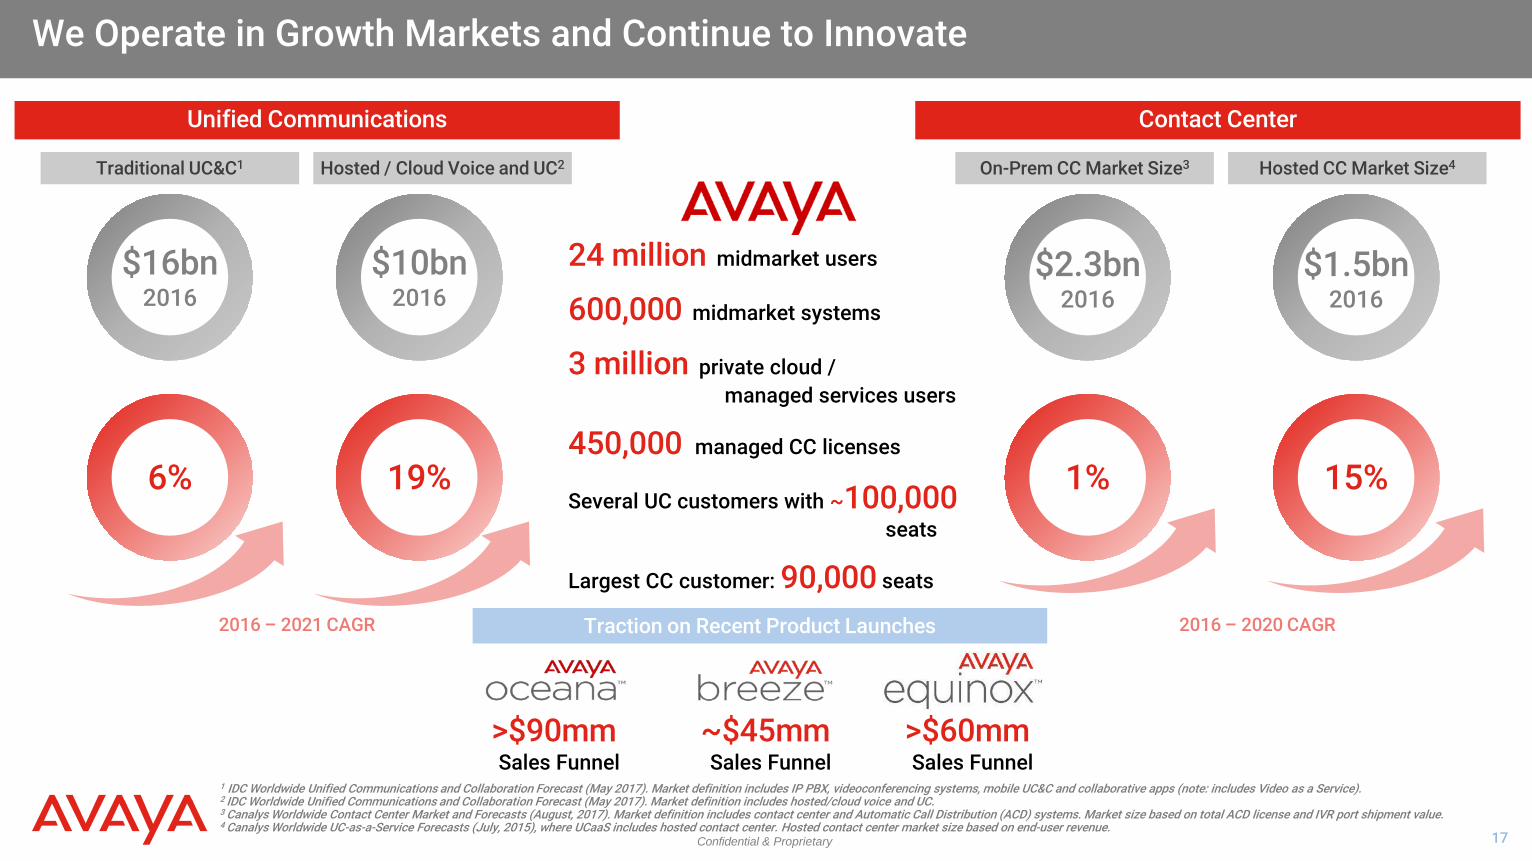
We Operate in Growth Markets and Continue to Innovate
1 IDC Worldwide Unified Communications and Collaboration Forecast (May 2017). Market definition includes IP PBX, videoconferencing systems, mobile UC&C and collaborative apps (note: includes Video as a Service). 2 IDC Worldwide Unified Communications and Collaboration Forecast (May 2017). Market definition includes hosted/cloud voice and UC. 3 Canalys Worldwide Contact Center Market and Forecasts (August, 2017). Market definition includes contact center and Automatic Call Distribution (ACD) systems. Market size based on total ACD license and IVR port shipment value. 4 Canalys Worldwide UC-as-a-Service Forecasts (July, 2015), where UCaaS includes hosted contact center. Hosted contact center market size based on end-user revenue.
Contact Center Unified Communications
On-Prem CC Market Size3
$2.3bn 2016
2016 – 2020 CAGR
1%
$16bn 2016
2016 – 2021 CAGR
6%
24 million midmarket users
600,000 midmarket systems
3 million private cloud / managed services users
450,000 managed CC licenses
Several UC customers with ~100,000 seats
Largest CC customer: 90,000 seats
Traction on Recent Product Launches
>$90mm Sales Funnel
~$45mm Sales Funnel
>$60mm Sales Funnel
$1.5bn 2016
15%
Hosted CC Market Size4 Traditional UC&C1 Hosted / Cloud Voice and UC2
$10bn 2016
19%
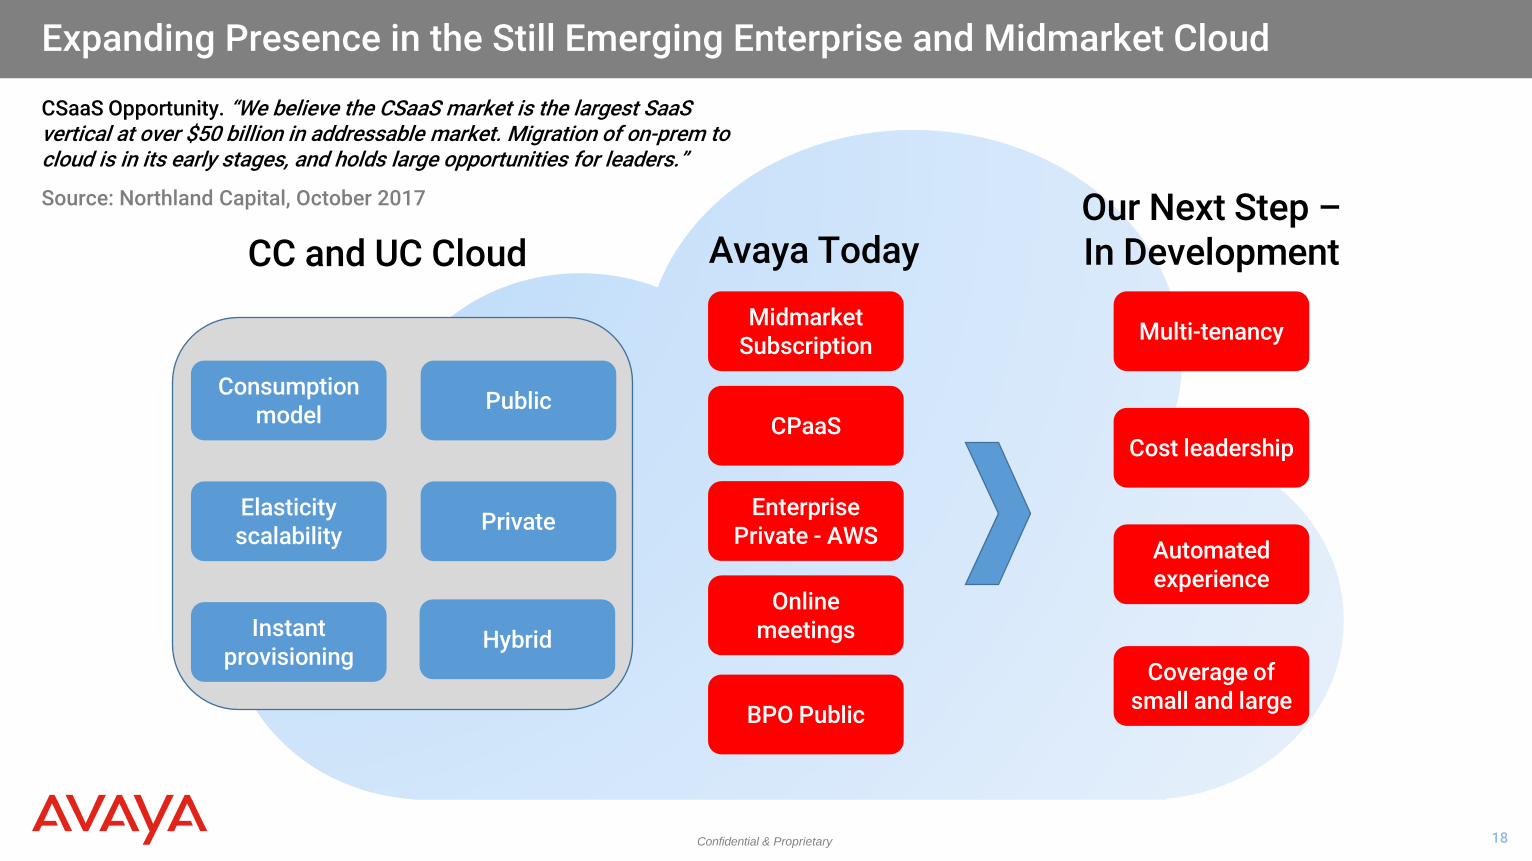
Confidential & Proprietary 18
Public
Private
Consumption model
Elasticity scalability
Instant provisioning
Midmarket Subscription
Enterprise Private - AWS
BPO Public
CPaaS
Multi-tenancy
Cost leadership
Automated experience
Coverage of small and large
Avaya Today Our Next Step – In Development CC and UC Cloud
Hybrid
Expanding Presence in the Still Emerging Enterprise and Midmarket Cloud
Online meetings
CSaaS Opportunity. “We believe the CSaaS market is the largest SaaS vertical at over $50 billion in addressable market. Migration of on-prem to cloud is in its early stages, and holds large opportunities for leaders.”
Source: Northland Capital, October 2017
Confidential & Proprietary 19
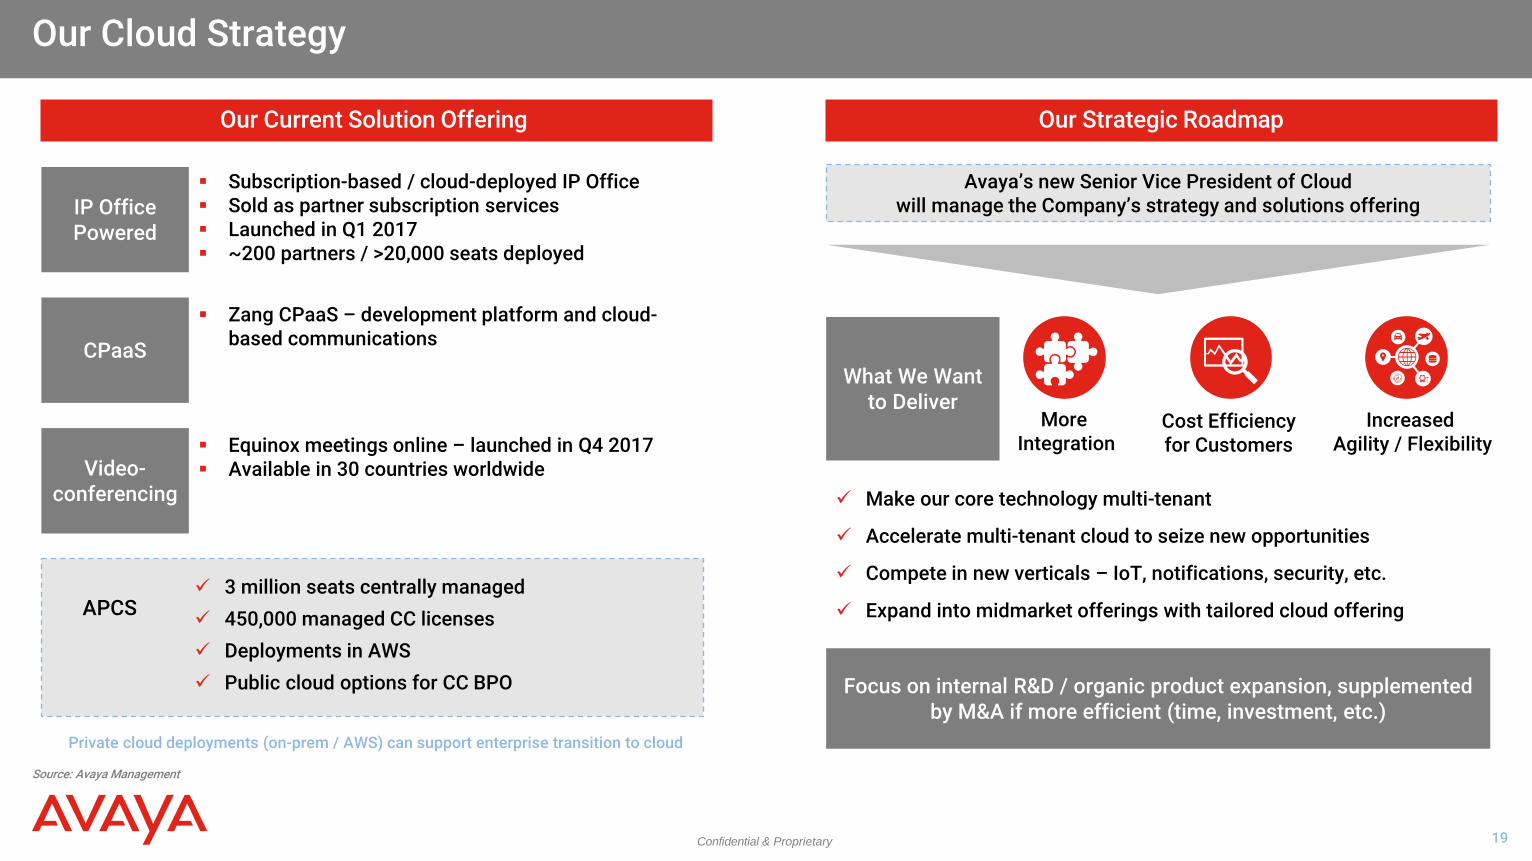
Our Cloud Strategy
Source: Avaya Management
Our Current Solution Offering
3 million seats centrally managed 450,000 managed CC licenses Deployments in AWS Public cloud options for CC BPO
IP Office Powered
CPaaS
Video- conferencing
Subscription-based / cloud-deployed IP Office Sold as partner subscription services Launched in Q1 2017 ~200 partners / >20,000 seats deployed
Zang CPaaS – development platform and cloud-based communications
Equinox meetings online – launched in Q4 2017 Available in 30 countries worldwide
APCS
Private cloud deployments (on-prem / AWS) can support enterprise transition to cloud
Our Strategic Roadmap
Make our core technology multi-tenant
Accelerate multi-tenant cloud to seize new opportunities
Compete in new verticals – IoT, notifications, security, etc.
Expand into midmarket offerings with tailored cloud offering
Focus on internal R&D / organic product expansion, supplemented by M&A if more efficient (time, investment, etc.)
What We Want to Deliver
More Integration
Cost Efficiency for Customers
Increased Agility / Flexibility
Avaya’s new Senior Vice President of Cloud will manage the Company’s strategy and solutions offering
Confidential & Proprietary 20
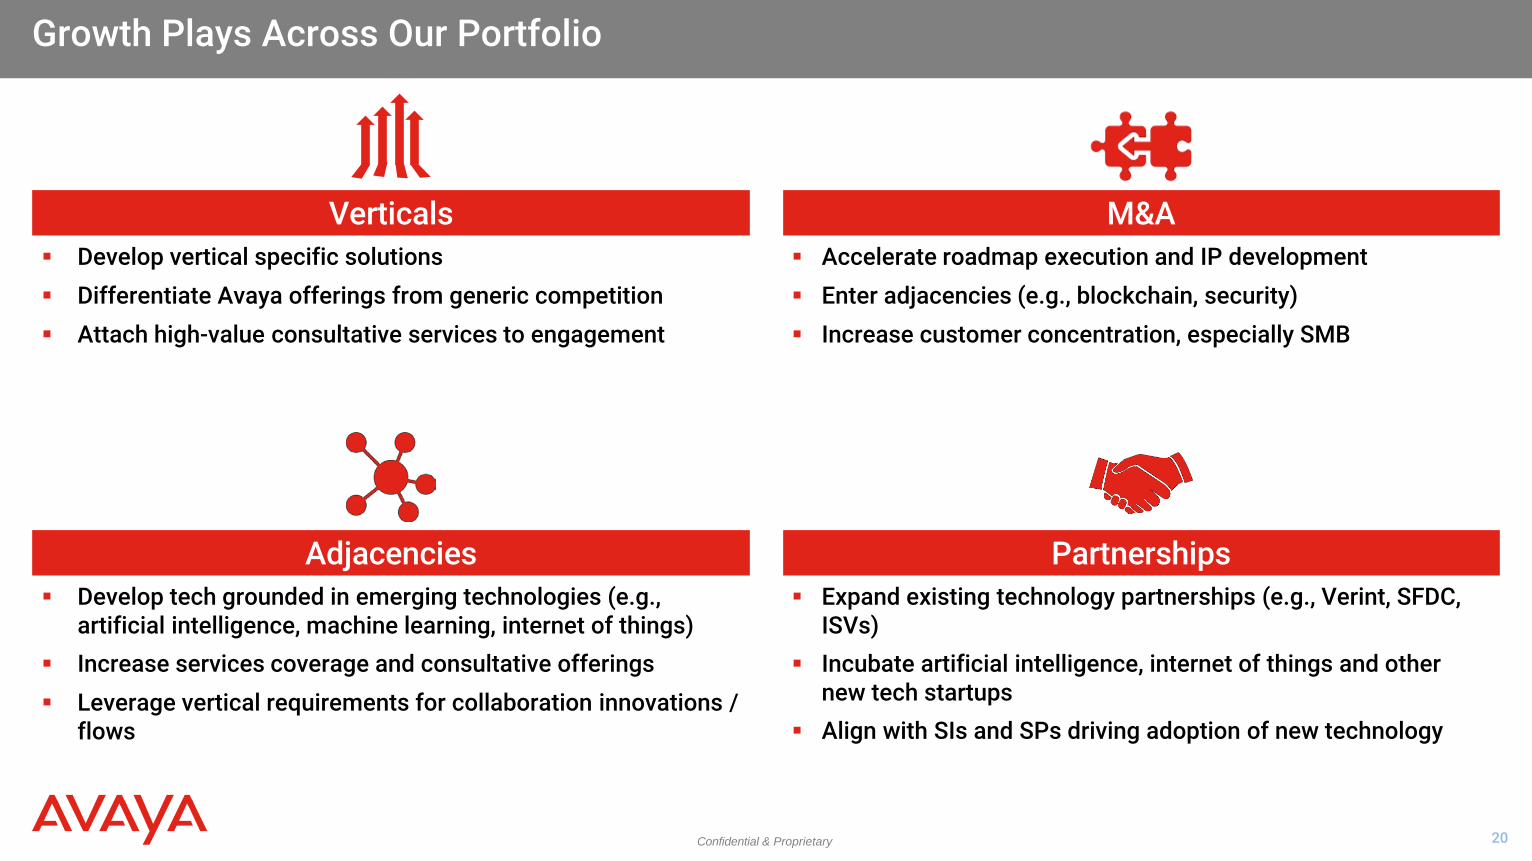
Verticals Develop vertical specific solutions Differentiate Avaya offerings from generic competition Attach high-value consultative services to engagement
M&A Accelerate roadmap execution and IP development Enter adjacencies (e.g., blockchain, security) Increase customer concentration, especially SMB
Adjacencies Develop tech grounded in emerging technologies (e.g.,
artificial intelligence, machine learning, internet of things) Increase services coverage and consultative offerings Leverage vertical requirements for collaboration innovations /
flows
Partnerships Expand existing technology partnerships (e.g., Verint, SFDC,
ISVs) Incubate artificial intelligence, internet of things and other
new tech startups Align with SIs and SPs driving adoption of new technology
Growth Plays Across Our Portfolio

Confidential & Proprietary
Key Credit Highlights
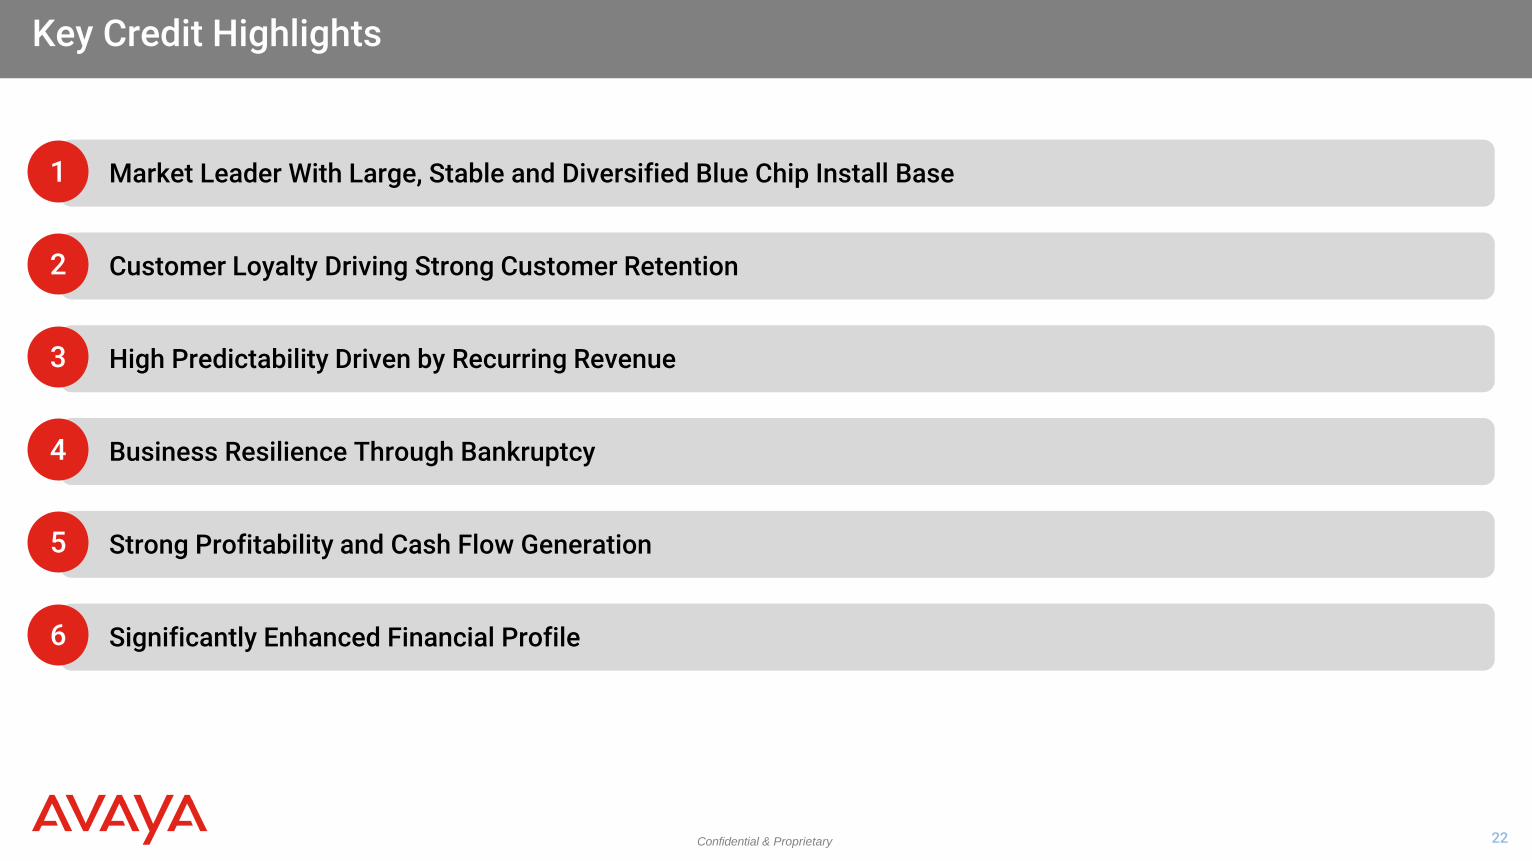
Confidential & Proprietary 22
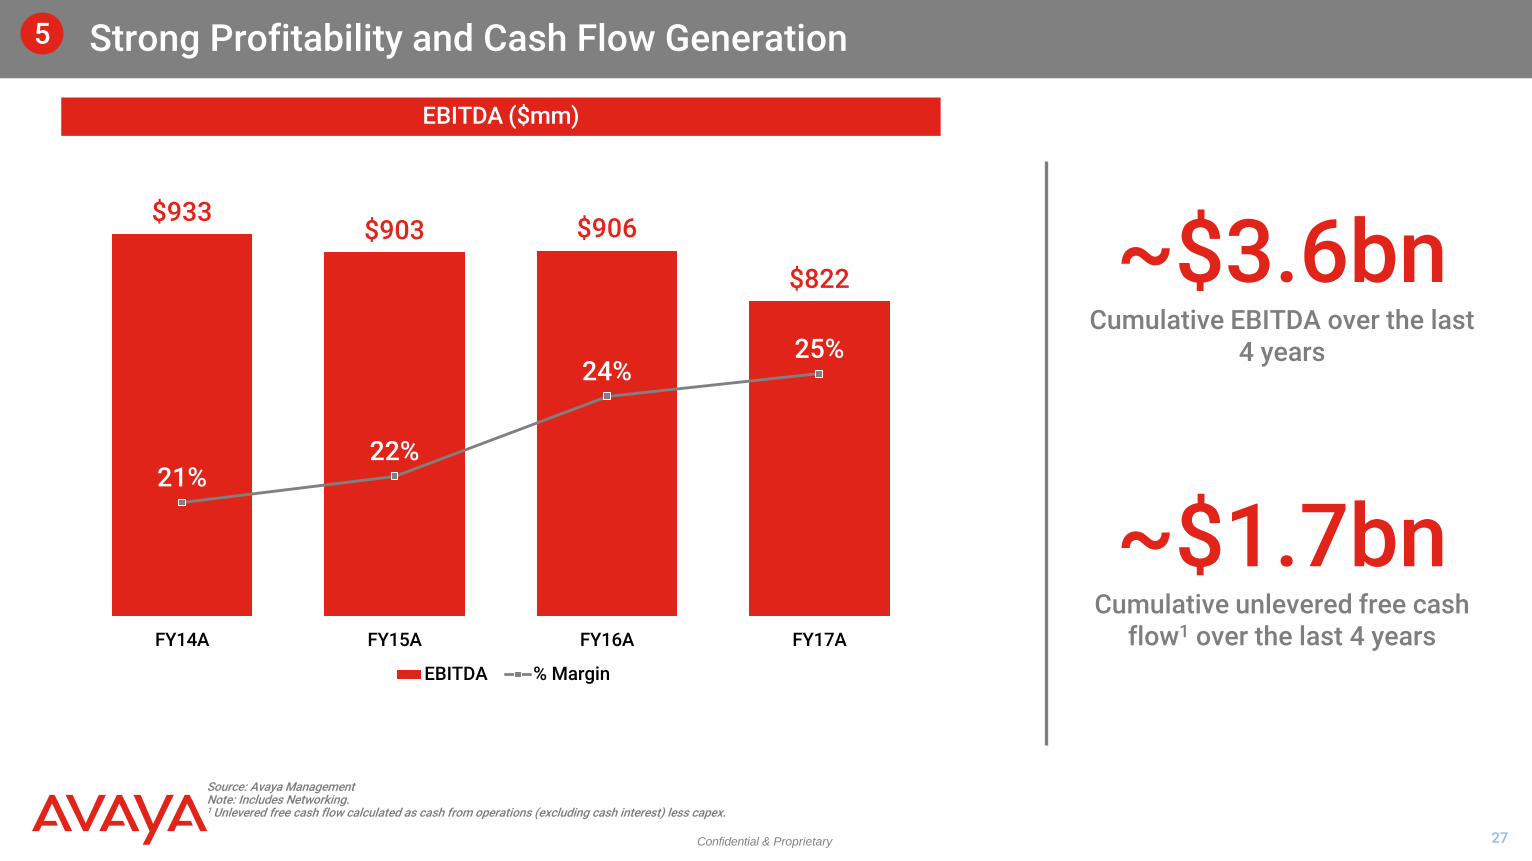
Strong Profitability and Cash Flow Generation
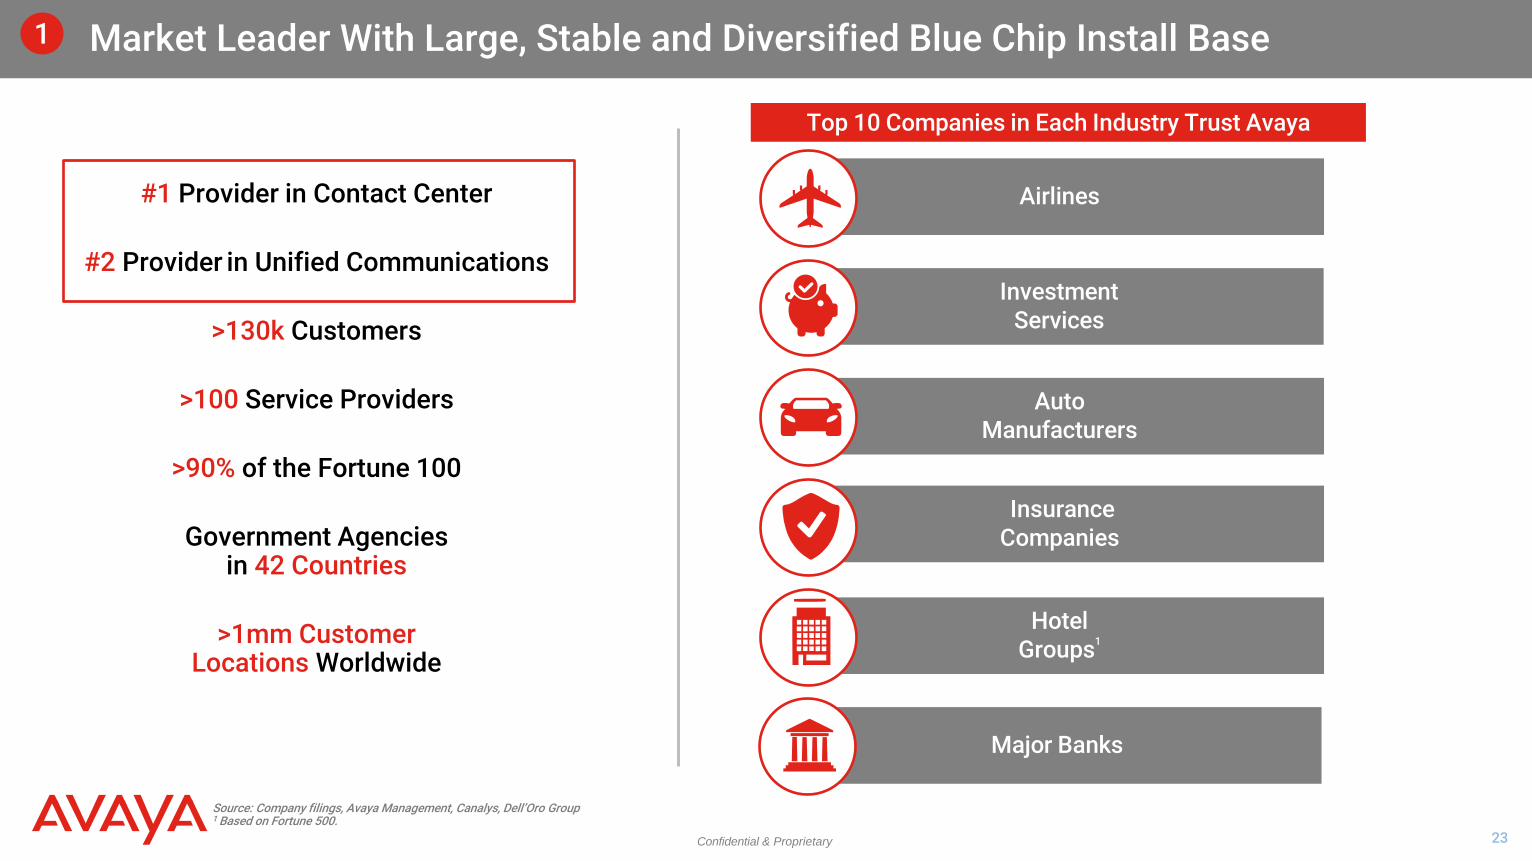
Market Leader With Large, Stable and Diversified Blue Chip Install Base
Customer Loyalty Driving Strong Customer Retention
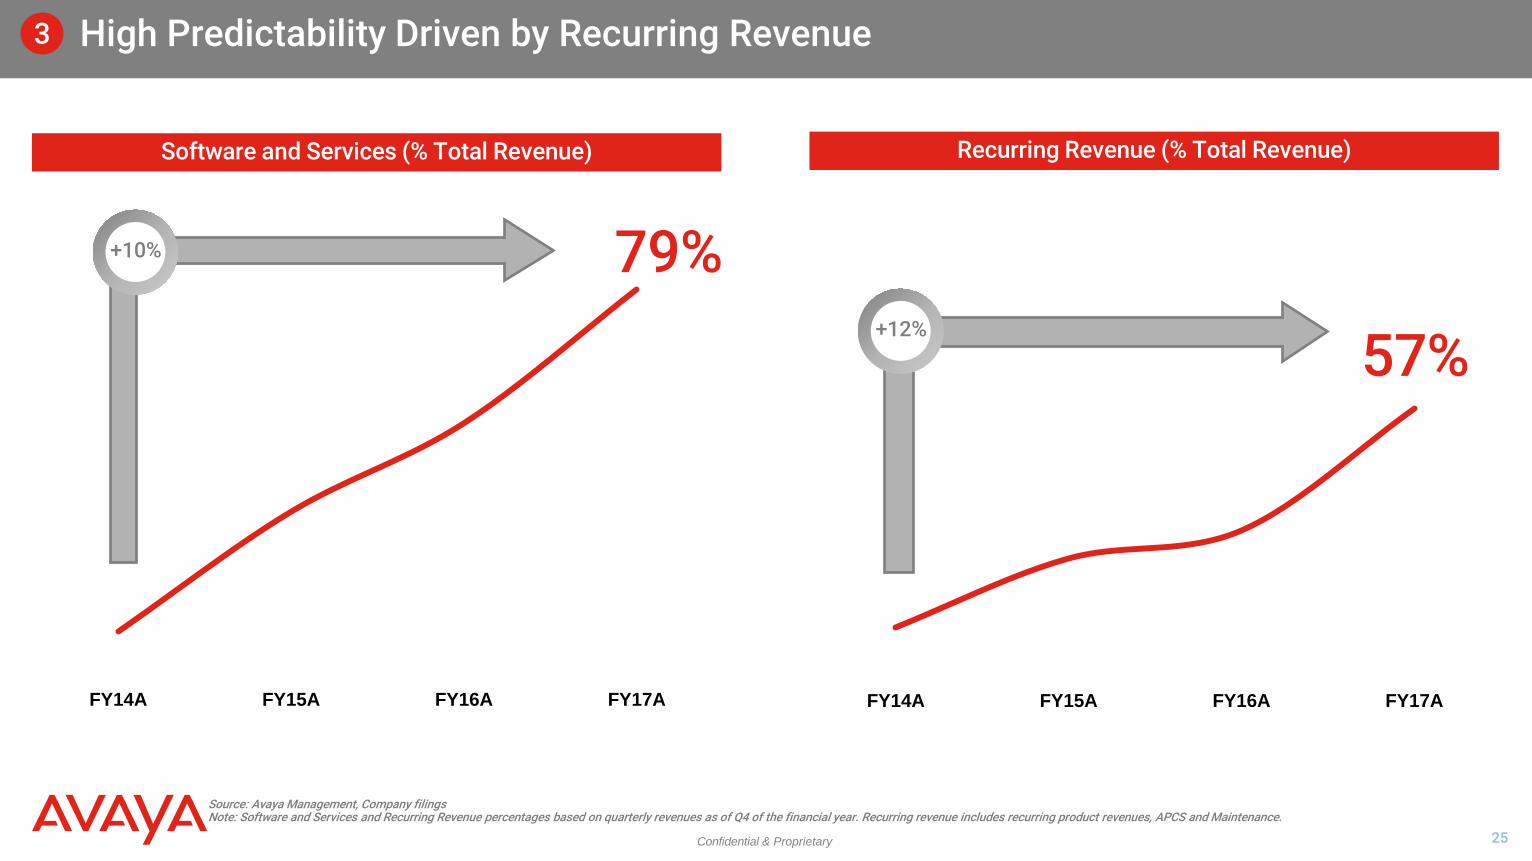
High Predictability Driven by Recurring Revenue
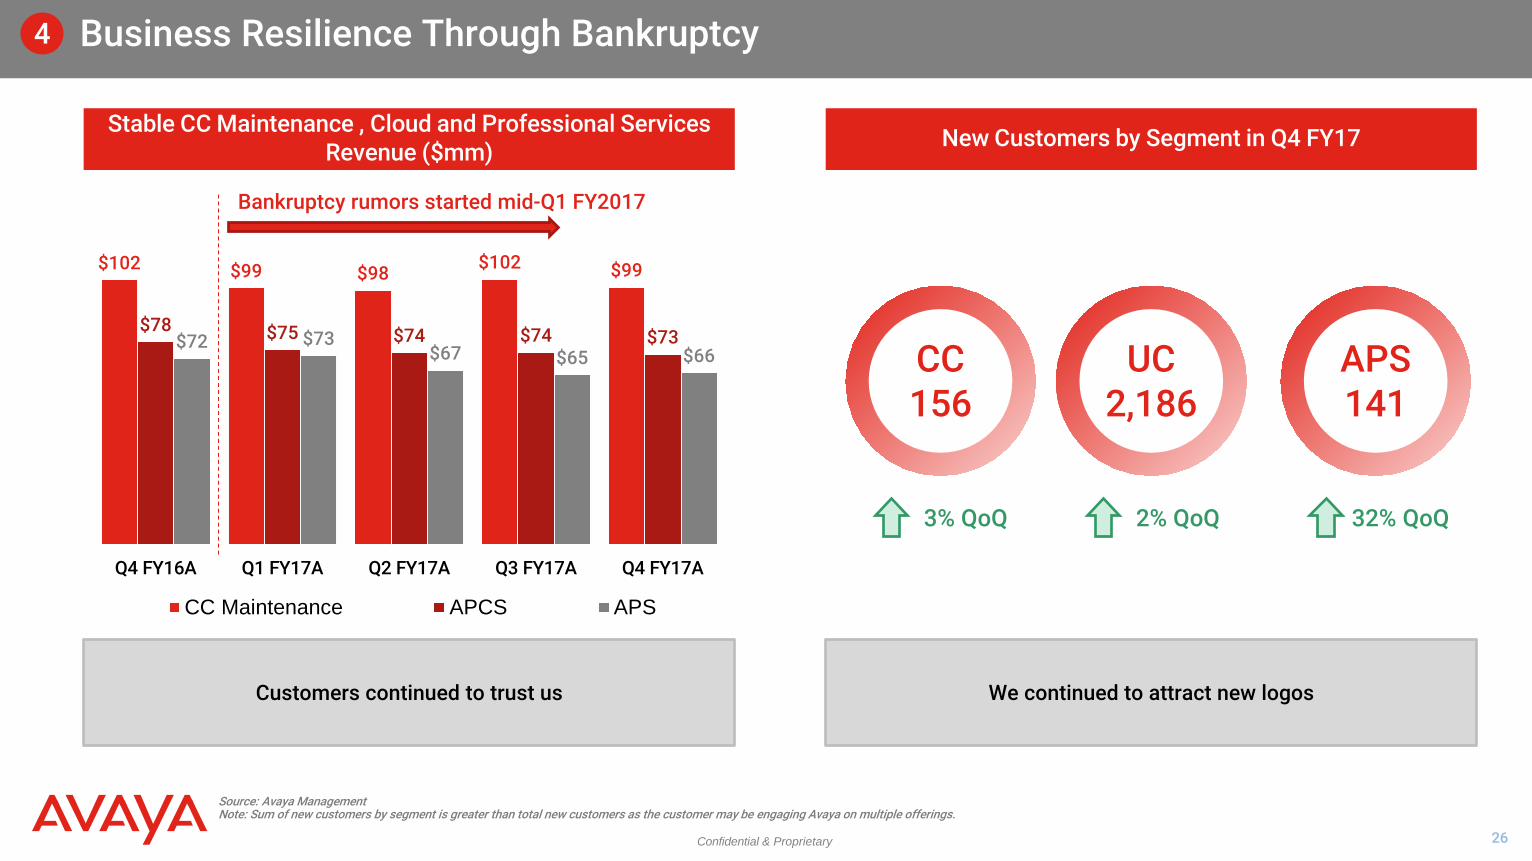
Business Resilience Through Bankruptcy
Significantly Enhanced Financial Profile
Key Credit Highlights
1
2
3
4
5
6
Confidential & Proprietary 23
Major Banks
Airlines
Investment Services
Auto Manufacturers
Hotel Groups1
Insurance Companies
Market Leader With Large, Stable and Diversified Blue Chip Install Base
#1 Provider in Contact Center
#2 Provider in Unified Communications
>130k Customers
>100 Service Providers
>90% of the Fortune 100
Government Agencies in 42 Countries
>1mm Customer Locations Worldwide
Source: Company filings, Avaya Management, Canalys, Dell’Oro Group 1 Based on Fortune 500.
1
Top 10 Companies in Each Industry Trust Avaya

Confidential & Proprietary 24
Customer Loyalty Driving Strong Customer Retention
Source: Company filings, Avaya Management Note: Indicative competitor NPS positioning based on channel checks and surveys.
Strong Services Retention and Renewal Rates
2
Best-in-Class Net Promoter Score (NPS)
>90% CC Annualized Maintenance
Retention Rate
>85% UC Annualized Maintenance
Retention Rate
Sticky, mission critical services and highly satisfied customer base
28
32
41
45
56 58
FY11 FY12 FY13 FY14 FY15 FY16
Good (Top Quartile)
Best-in-Class (Top 10%)
World Class (Top 1%)
Avaya managed to achieve best-in-class NPS of 50 for FY2017 despite Chapter 11
backdrop
>85% APCS Renewal Rate
Confidential & Proprietary 25
FY14A FY15A FY16A FY17AFY14A FY15A FY16A FY17A
High Predictability Driven by Recurring Revenue
Source: Avaya Management, Company filings Note: Software and Services and Recurring Revenue percentages based on quarterly revenues as of Q4 of the financial year. Recurring revenue includes recurring product revenues, APCS and Maintenance.
Software and Services (% Total Revenue) Recurring Revenue (% Total Revenue)
57%
3
79% +10%
+12%
Confidential & Proprietary 26
$102 $99 $98 $102 $99
$78 $75 $74 $74 $73 $72 $73 $67 $65 $66
Q4 FY16A Q1 FY17A Q2 FY17A Q3 FY17A Q4 FY17A
CC Maintenance APCS APS
Business Resilience Through Bankruptcy
Source: Avaya Management Note: Sum of new customers by segment is greater than total new customers as the customer may be engaging Avaya on multiple offerings.
4
Customers continued to trust us
Bankruptcy rumors started mid-Q1 FY2017
Stable CC Maintenance , Cloud and Professional Services Revenue ($mm) New Customers by Segment in Q4 FY17
We continued to attract new logos
CC 156
UC 2,186
APS 141
3% QoQ 2% QoQ 32% QoQ
Confidential & Proprietary 27
Strong Profitability and Cash Flow Generation
Source: Avaya Management Note: Includes Networking. 1 Unlevered free cash flow calculated as cash from operations (excluding cash interest) less capex.
5
EBITDA ($mm)
~$3.6bn Cumulative EBITDA over the last
4 years
~$1.7bn Cumulative unlevered free cash
flow1 over the last 4 years
$933 $903 $906
$822
21% 22%
24% 25%
FY14A FY15A FY16A FY17A
EBITDA % Margin
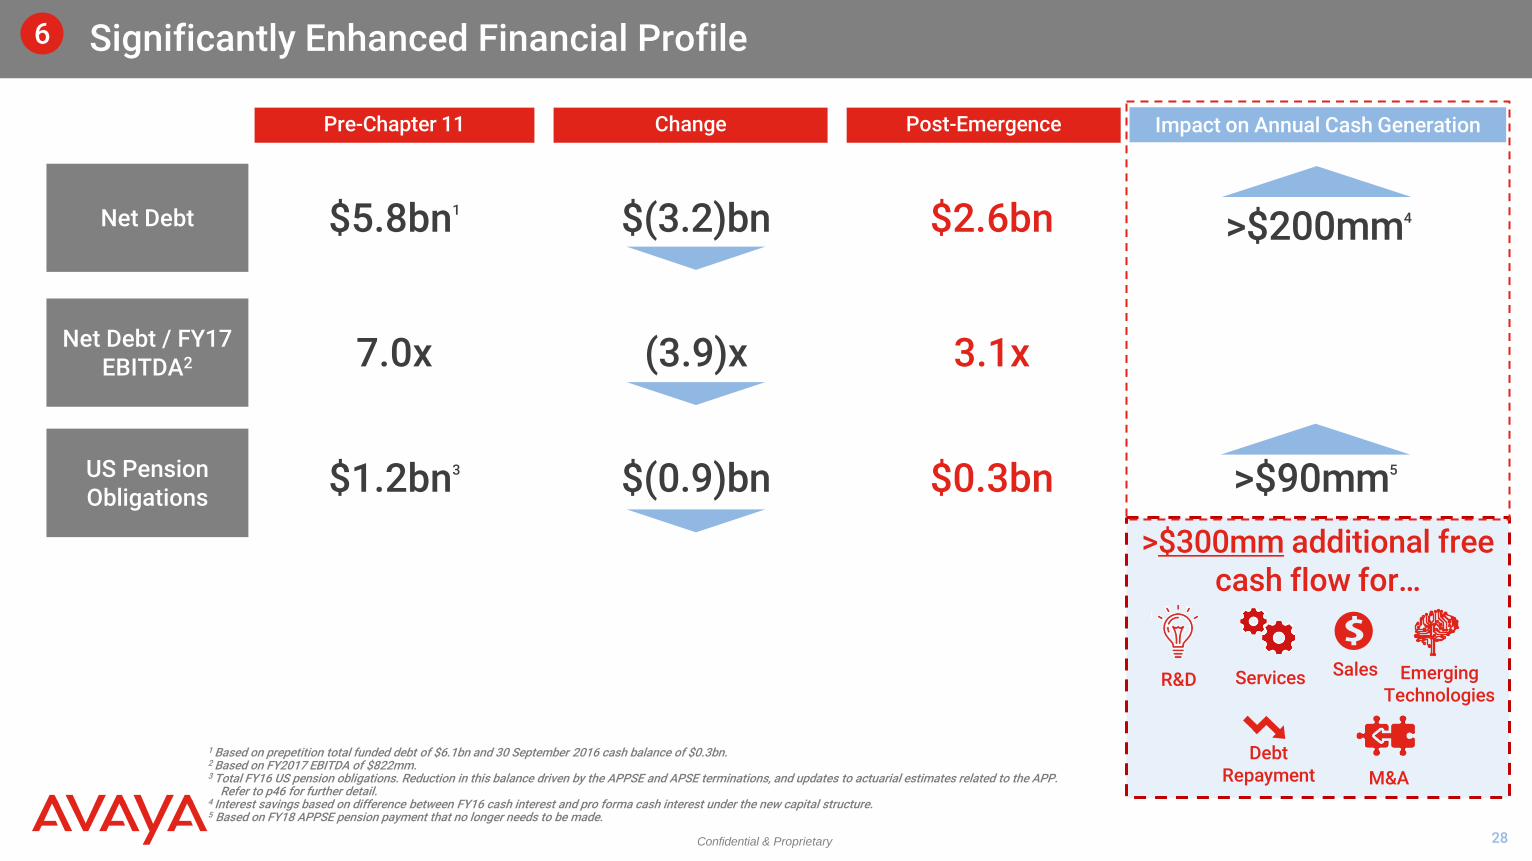
Confidential & Proprietary 28
>$300mm additional free cash flow for…
M&A
1 Based on prepetition total funded debt of $6.1bn and 30 September 2016 cash balance of $0.3bn. 2 Based on FY2017 EBITDA of $822mm. 3 Total FY16 US pension obligations. Reduction in this balance driven by the APPSE and APSE terminations, and updates to actuarial estimates related to the APP.
Refer to p46 for further detail. 4 Interest savings based on difference between FY16 cash interest and pro forma cash interest under the new capital structure. 5 Based on FY18 APPSE pension payment that no longer needs to be made.
Net Debt
Net Debt / FY17 EBITDA2
US Pension Obligations
Pre-Chapter 11 Change Post-Emergence Impact on Annual Cash Generation
$1.2bn3 $0.3bn $(0.9)bn >$90mm5
R&D Emerging Technologies
Sales Services
$5.8bn1 $2.6bn $(3.2)bn
7.0x 3.1x (3.9)x
>$200mm4
Debt Repayment
Significantly Enhanced Financial Profile 6

Confidential & Proprietary
Financial Overview
Confidential & Proprietary 30
$391 $396 $418 $356
$287 $302 $309 $296 $185 $163 $141 $146
$380 $392 $397 $398
$1,244 $1,252 $1,265 $1,197
FY14A FY15A FY16A FY17ASoftware APCS APS Maintenance
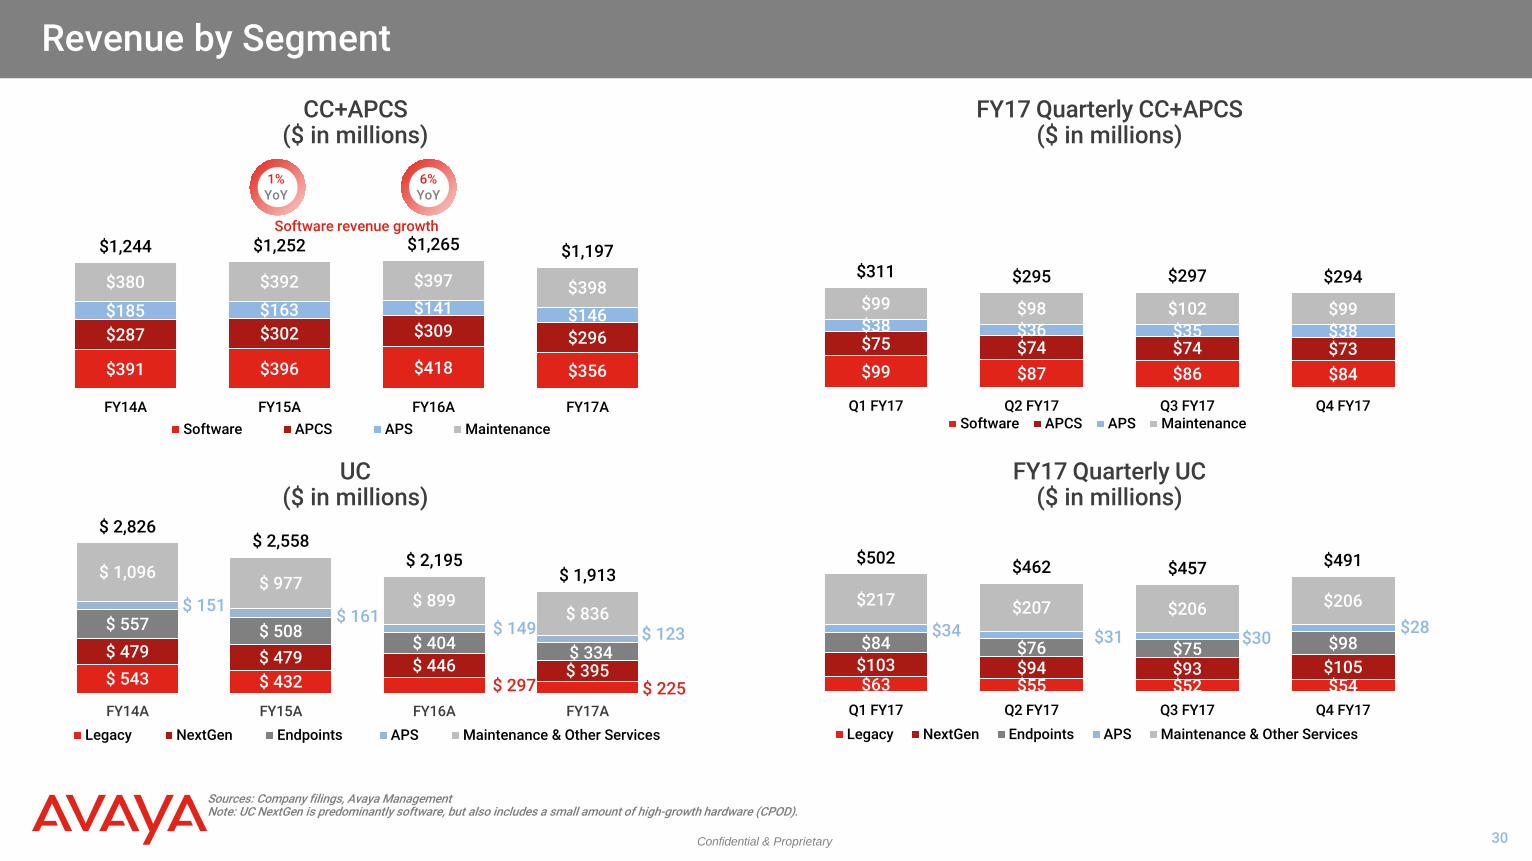
Revenue by Segment
UC ($ in millions)
$ 543 $ 432 $ 297 $ 225
$ 479 $ 479 $ 446 $ 395
$ 557 $ 508 $ 404 $ 334
$ 151 $ 161 $ 149 $ 123
$ 1,096 $ 977 $ 899
$ 836
$ 2,826 $ 2,558
$ 2,195 $ 1,913
FY14A FY15A FY16A FY17ALegacy NextGen Endpoints APS Maintenance & Other Services
CC+APCS ($ in millions)
Sources: Company filings, Avaya Management Note: UC NextGen is predominantly software, but also includes a small amount of high-growth hardware (CPOD).
1% YoY
6% YoY
Software revenue growth
FY17 Quarterly UC ($ in millions)
FY17 Quarterly CC+APCS ($ in millions)
$99 $87 $86 $84
$75 $74 $74 $73 $38 $36 $35 $38 $99 $98 $102 $99
$311 $295 $297 $294
Q1 FY17 Q2 FY17 Q3 FY17 Q4 FY17Software APCS APS Maintenance
$63 $55 $52 $54 $103 $94 $93 $105 $84 $76 $75 $98
$34 $31 $30 $28 $217 $207 $206 $206
$502 $462 $457 $491
Q1 FY17 Q2 FY17 Q3 FY17 Q4 FY17Legacy NextGen Endpoints APS Maintenance & Other Services
Confidential & Proprietary 31
Overview of Summary Financials
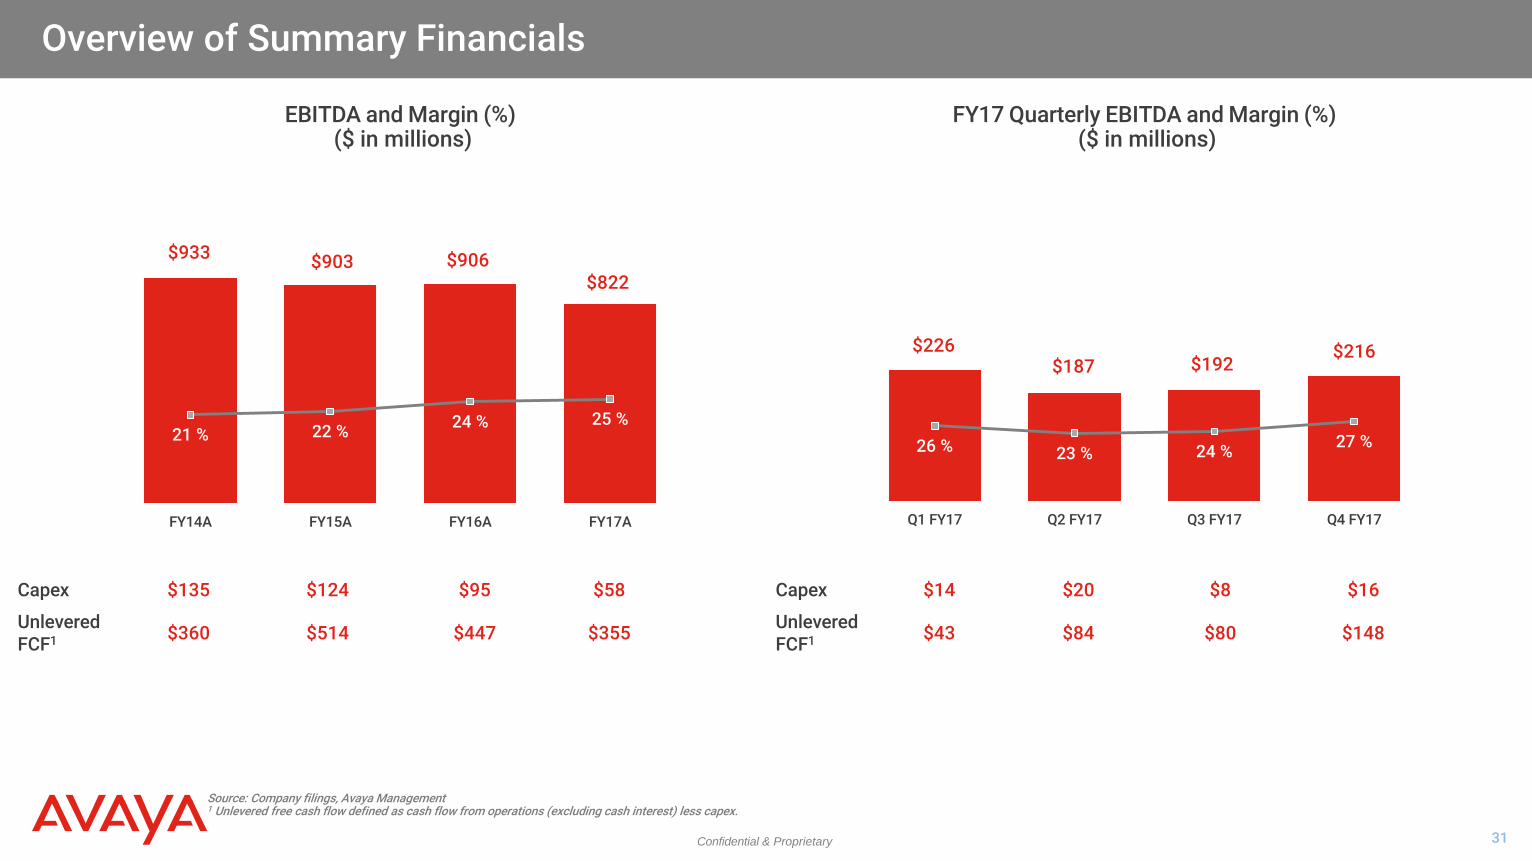
Source: Company filings, Avaya Management 1 Unlevered free cash flow defined as cash flow from operations (excluding cash interest) less capex.
EBITDA and Margin (%) ($ in millions)
FY17 Quarterly EBITDA and Margin (%) ($ in millions)
$933 $903 $906 $822
21 % 22 % 24 % 25 %
FY14A FY15A FY16A FY17A
$226 $187 $192
$216
26 % 23 % 24 % 27 %
Q1 FY17 Q2 FY17 Q3 FY17 Q4 FY17
Capex $135 $124 $95 $58 Capex $14 $20 $8 $16
Unlevered FCF1 $360 $514 $447 $355 Unlevered
FCF1 $43 $84 $80 $148

Confidential & Proprietary 32
Financial Policy
1 Based on expected cash balance plus revolver availability.
Our key priorities include maintaining:
‒ Strong balance sheet
‒ Financial flexibility
‒ Strong access to liquidity
‒ Strong coverage ratios
We are emerging from bankruptcy conservatively capitalized:
‒ Total Net Leverage of 3.1x
‒ ~$500 million liquidity1
‒ Strong cash flow profile which will support further strengthening of the balance sheet

Confidential & Proprietary
Conclusion – Avaya is Poised for Success

Confidential & Proprietary 34
Summary - Strategic Growth Drivers
Environment Execute to Win Invest to Win
Culture of accountability, simplicity, trust, teamwork and empowerment
Customer led vs. Functionally led
Org. Structure Alignment
‒ Reducing 13 Executive Committee members to 7
‒ One GTM org. for sales
‒ One Product org. for innovation
‒ One Cloud org. for platform growth
‒ Integrated services organization
Re-energized channel
Strong customer retention despite bankruptcy
Extending proven operational mgmt. system
‒ Sales first revenue stable last 3 Q’s
‒ Expanding to R&D, Cloud, rest of business
Strengthening channel
‒ Added >2,000 new logos (Q4)
Midmarket, doubled # of seats QoQ
‒ Traction with Cloud offerings
Leveraging install base
‒ Insourced renewals
‒ Productize consulting offerings
‒ Slow UC decline and path to Cloud
‒ Extending disruptive technologies into CC
Strengthened balance sheet
‒ New markets / vertical plays
‒ Disruptive technologies (AI, IoT, blockchain, NLP and machine learning)
Reinvest in salesforce
‒ Increase coverage model
‒ Consultative sales capability
Build out best in-class Cloud portfolio
‒ Place bets that give us 12-24 month leadership
New product intros that are customer led
‒ Time to cash focus
Leverage strategic partnerships (both tech and SI’s / SP’s)

Confidential & Proprietary
Syndication Overview
Confidential & Proprietary 36
Summary Terms – First Lien Term Loan
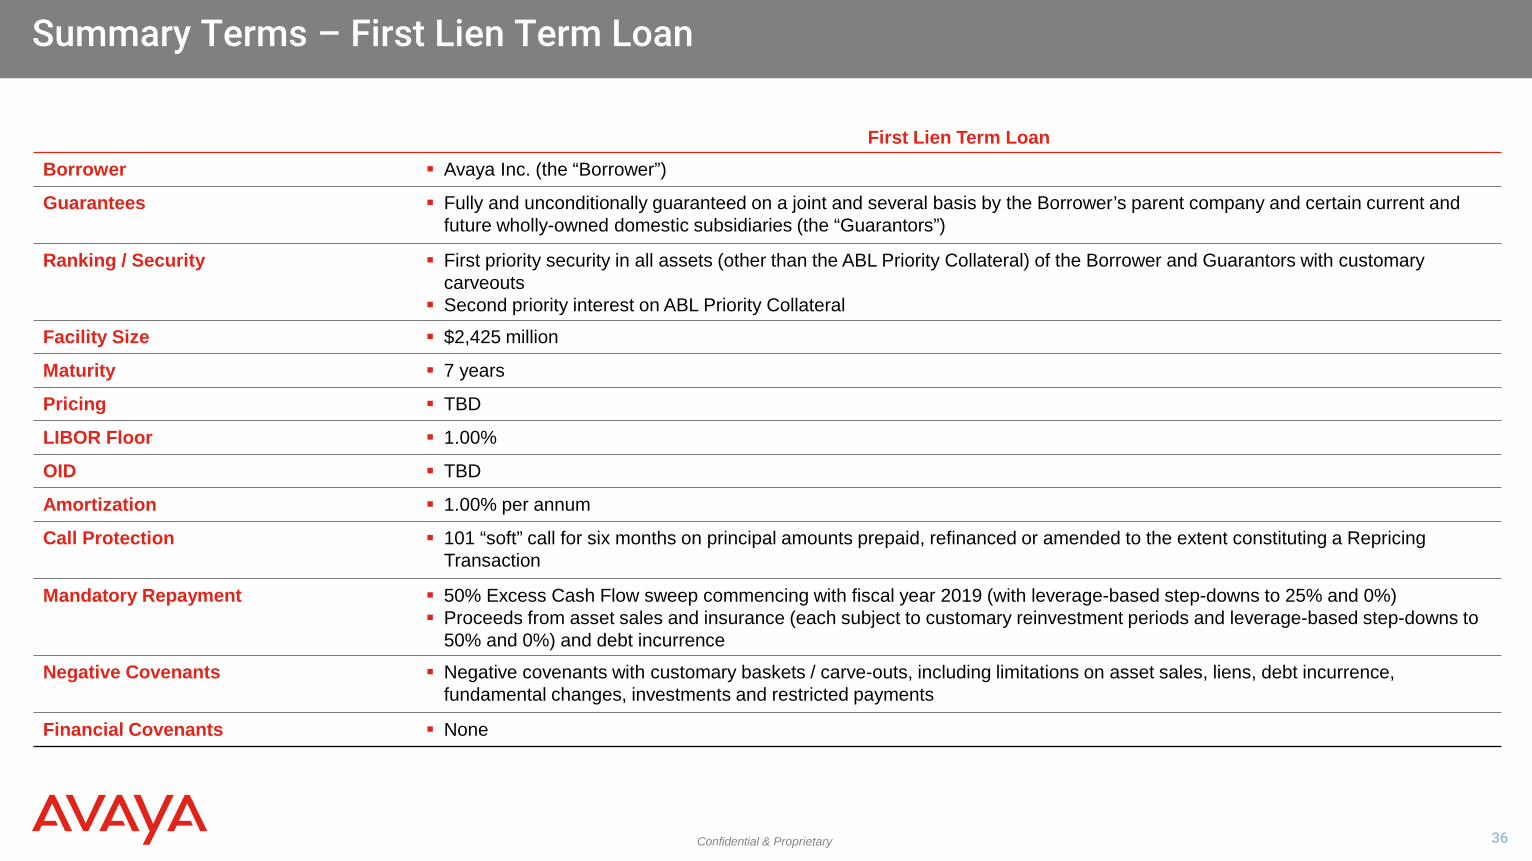
First Lien Term Loan Borrower Avaya Inc. (the “Borrower”)
Guarantees Fully and unconditionally guaranteed on a joint and several basis by the Borrower’s parent company and certain current and future wholly-owned domestic subsidiaries (the “Guarantors”)
Ranking / Security First priority security in all assets (other than the ABL Priority Collateral) of the Borrower and Guarantors with customary carveouts
Second priority interest on ABL Priority Collateral
Facility Size $2,425 million
Maturity 7 years
Pricing TBD
LIBOR Floor 1.00%
OID TBD
Amortization 1.00% per annum
Call Protection 101 “soft” call for six months on principal amounts prepaid, refinanced or amended to the extent constituting a Repricing Transaction
Mandatory Repayment 50% Excess Cash Flow sweep commencing with fiscal year 2019 (with leverage-based step-downs to 25% and 0%) Proceeds from asset sales and insurance (each subject to customary reinvestment periods and leverage-based step-downs to
50% and 0%) and debt incurrence
Negative Covenants Negative covenants with customary baskets / carve-outs, including limitations on asset sales, liens, debt incurrence, fundamental changes, investments and restricted payments
Financial Covenants None

Confidential & Proprietary 37
Transaction Timeline
October 2017 S M T W T F S 1 2 3 4 5 6 7 8 9 10 11 12 13 14
15 16 17 18 19 20 21 22 23 24 25 26 27 28 29 30 31
November 2017 S M T W T F S 1 2 3 4 5 6 7 8 9 10 11
12 13 14 15 16 17 18 19 20 21 22 23 24 25 26 27 28 29 30
December 2017 S M T W T F S 1 2 3 4 5 6 7 8 9
10 11 12 13 14 15 16 17 18 19 20 21 22 23 24 25 26 27 28 29 30 31
November 1 Bank Meeting
November 8 Lender Commitments Due on First Lien Term Loan
November 9 Pricing & Allocation of First Lien Term Loan
December Closing & Funding of First Lien Term Loan Expected Emergence from Chapter 11
Key Date U.S. Holiday

Confidential & Proprietary
Appendix : Supplemental Materials

Confidential & Proprietary 39
Contact Center (CC) Overview
Source: Avaya Management 1 Revenues include Product, Maintenance, and APS revenues.
Business Overview Contact Center Revenue Detail
~100% Software and Services; allowing flexible deployment model
Broad portfolio ranging from SMBs to large enterprises
‒ 90% of Fortune 100 companies
‒ Sticky customer base
Interoperable and open architecture embedded in largest corporations worldwide
‒ Workflow automation platform / customer journey
‒ Integration for easy creation of innovative use cases and 3rd party integration via snap-ins
‒ Processes built around Avaya technology
Enabler of unique use cases, on-premise and cloud
‒ Integration at a fraction of the cost and at a multiple of speed vs competitors
Total FY17 CC revenue1 of $0.9 billion
~40% software, 60% maintenance & services
FY17 CC Software Revenue: $356 million
Elite 38%
CMS 21%
WFO 13%
Experience Portal 13%
Aura CC 4%
Others 11%
Confidential & Proprietary 40
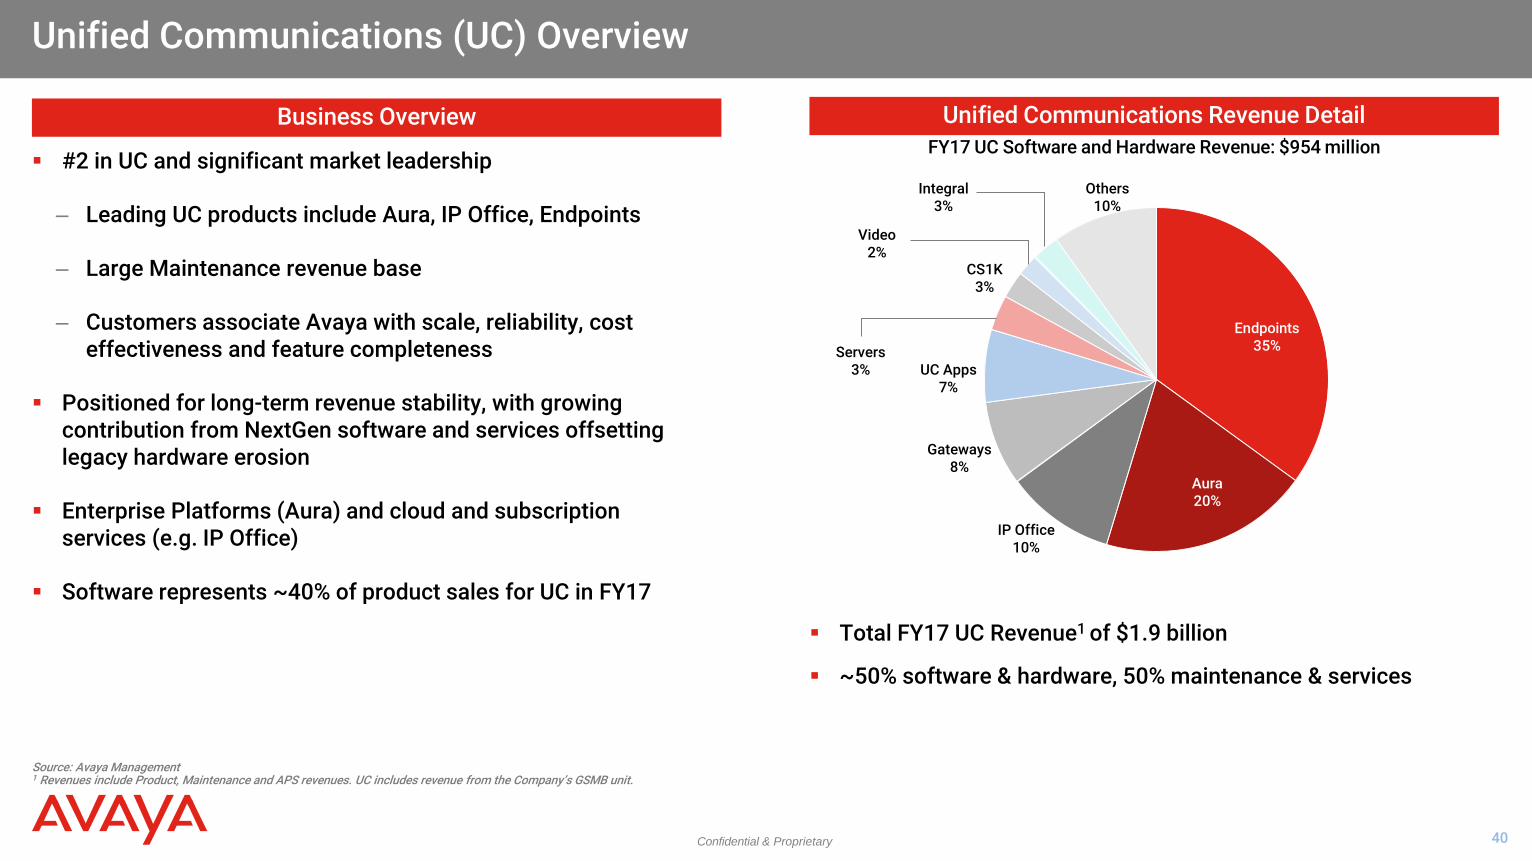
Endpoints 35%
Aura 20%
IP Office 10%
Gateways 8%
UC Apps 7%
Servers 3%
CS1K 3%
Video 2%
Integral 3%
Others 10%
Unified Communications (UC) Overview
Source: Avaya Management 1 Revenues include Product, Maintenance and APS revenues. UC includes revenue from the Company’s GSMB unit.
Business Overview Unified Communications Revenue Detail
#2 in UC and significant market leadership
‒ Leading UC products include Aura, IP Office, Endpoints
‒ Large Maintenance revenue base
‒ Customers associate Avaya with scale, reliability, cost effectiveness and feature completeness
Positioned for long-term revenue stability, with growing contribution from NextGen software and services offsetting legacy hardware erosion
Enterprise Platforms (Aura) and cloud and subscription services (e.g. IP Office)
Software represents ~40% of product sales for UC in FY17
Total FY17 UC Revenue1 of $1.9 billion
~50% software & hardware, 50% maintenance & services
FY17 UC Software and Hardware Revenue: $954 million
Confidential & Proprietary 41
$287 $302 $309 $296
14 % 14 %
20 %
18 %
FY14A FY15A FY16A FY17ARevenue EBITDA Margin
Business Overview Key Financial Metrics ($mm)
Source: Avaya Management 1 EBITDA margins per April 2017 filed 8-K – represent a fully allocated view and do not include standalone / carve-out assumptions and methodologies. 2 TCV reflects operational reporting view.
Managed services business that supports Avaya Unified Communications and Contact Center solutions in clients’ private clouds
Multi-year contracts offer substantial visibility into the business ‒ >85% renewal rates
Global scale: ‒ ~245 dedicated employees ‒ 11 global service centers plus resources in 37 countries
Avaya’s APCS solutions support: ‒ >3mm telephony / UC users ‒ 450,000 CC agents ‒ 1.2mm Ethernet Ports ‒ >1,000 video rooms and endpoints
Industry-leading performance: ‒ SLA Performance at 99.7%
Revenue and EBITDA Margin %
Total Contract Value (TCV)2
1
Avaya Private Cloud Services (APCS) Overview
$626 $648 $726
$654
FY14A FY15A FY16A FY17A
Confidential & Proprietary 42
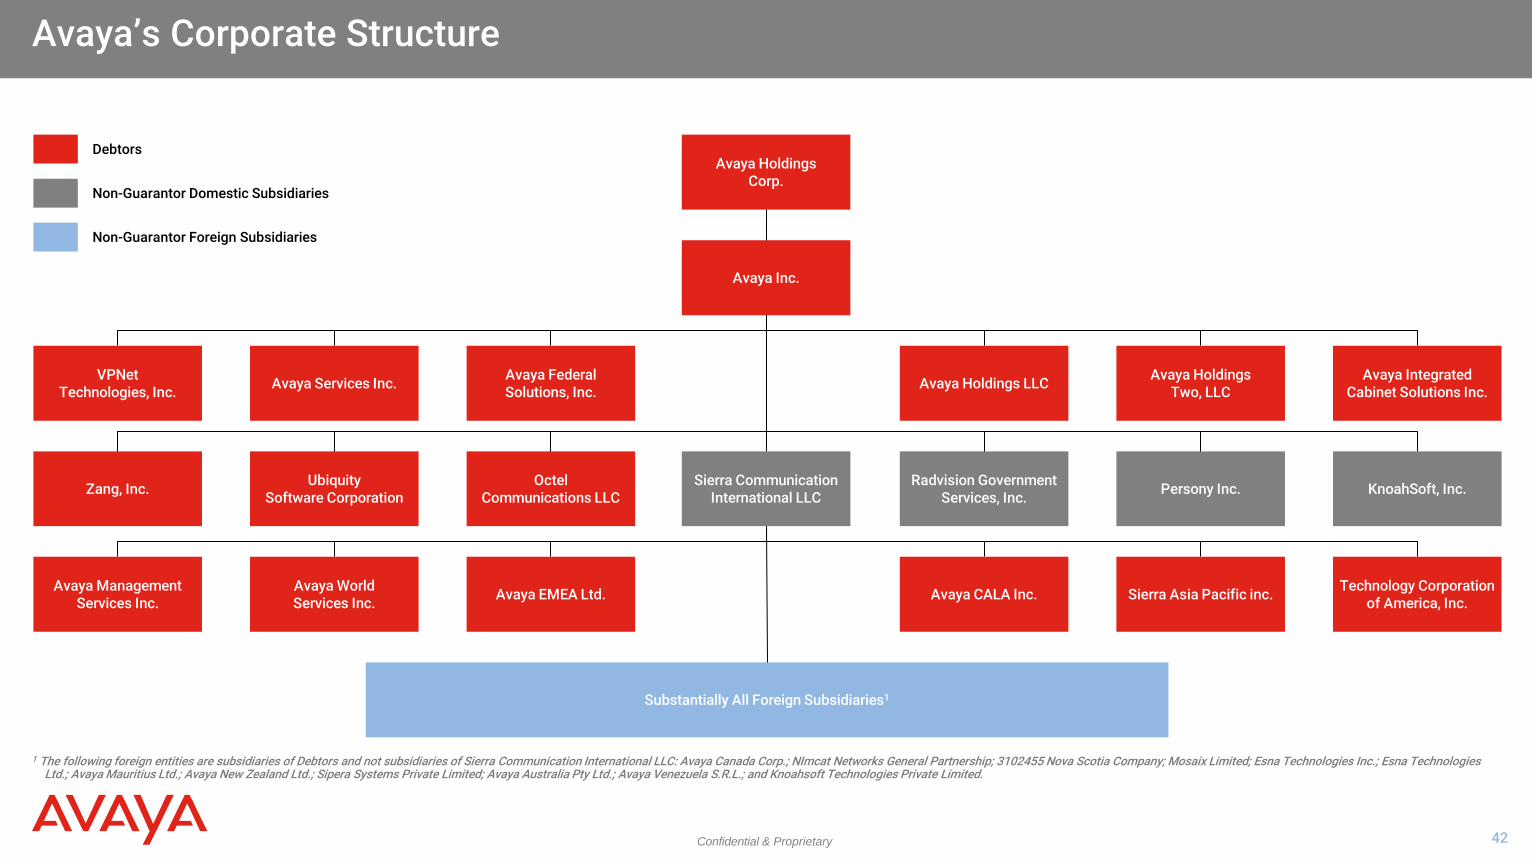
Avaya’s Corporate Structure
1 The following foreign entities are subsidiaries of Debtors and not subsidiaries of Sierra Communication International LLC: Avaya Canada Corp.; NImcat Networks General Partnership; 3102455 Nova Scotia Company; Mosaix Limited; Esna Technologies Inc.; Esna Technologies Ltd.; Avaya Mauritius Ltd.; Avaya New Zealand Ltd.; Sipera Systems Private Limited; Avaya Australia Pty Ltd.; Avaya Venezuela S.R.L.; and Knoahsoft Technologies Private Limited.
Avaya Holdings Corp.
Avaya Inc.
Avaya Federal Solutions, Inc. Avaya Services Inc. Avaya Integrated
Cabinet Solutions Inc. Avaya Holdings
Two, LLC Avaya Holdings LLC
Octel Communications LLC
Ubiquity Software Corporation Zang, Inc. KnoahSoft, Inc. Persony Inc. Radvision Government
Services, Inc.
Avaya EMEA Ltd. Avaya World Services Inc.
Avaya Management Services Inc.
Technology Corporation of America, Inc. Sierra Asia Pacific inc. Avaya CALA Inc.
Substantially All Foreign Subsidiaries1
Debtors
Non-Guarantor Domestic Subsidiaries
Non-Guarantor Foreign Subsidiaries
Sierra Communication International LLC
VPNet Technologies, Inc.

Confidential & Proprietary 43
EBITDA Reconciliation
Sources: Company filings, Avaya Management
Fiscal Year Ended September 30,2014 2015 2016
Net Income (Loss) $(293) $(144) $(750)(+) Interest Expense 459 452 470(-) Interest Income (2) (1) (1)(+) Loss (Benefit) from Provision for Income Taxes 51 70 13(+) Depreciation & Amortization 434 371 374(+) Restructuring Charges, net 165 62 105(+) Sponsors' and Other Advisory Fees 7 7 43(+) Acquisition & Integration-Related Costs 9 4 2(+) Third Party Sales Transformation Costs - - 5(+) Reorganization Items, net - - -(+) Loss on Extinguishment of Debt 5 6 -(+) Third Party Fees Expensed in Connection with Debt Modification 2 8 -(+) Share-Based Compensation & Other 25 19 19(+) Loss (Gain) on Disposal of Long-Lived Assets, net (14) (1) 1(+) Change in Tax Idemnifications 4 (9) -(+) Impairment of Indefinite-Lived Intangible Assets - - 100(+) Goodwill Impairment - - 442(+) Impairment of Investment - - 11(+) Resolution of Legal Matters 8 - 53(-) Gain on Foreign Currency Translations (18) (14) (10)(+) Pension / OPEB / OCI 86 72 29(+) Other 5 1 -EBITDA $ 933 $ 903 $ 906
Confidential & Proprietary 44
Summary Terms – ABL Facility
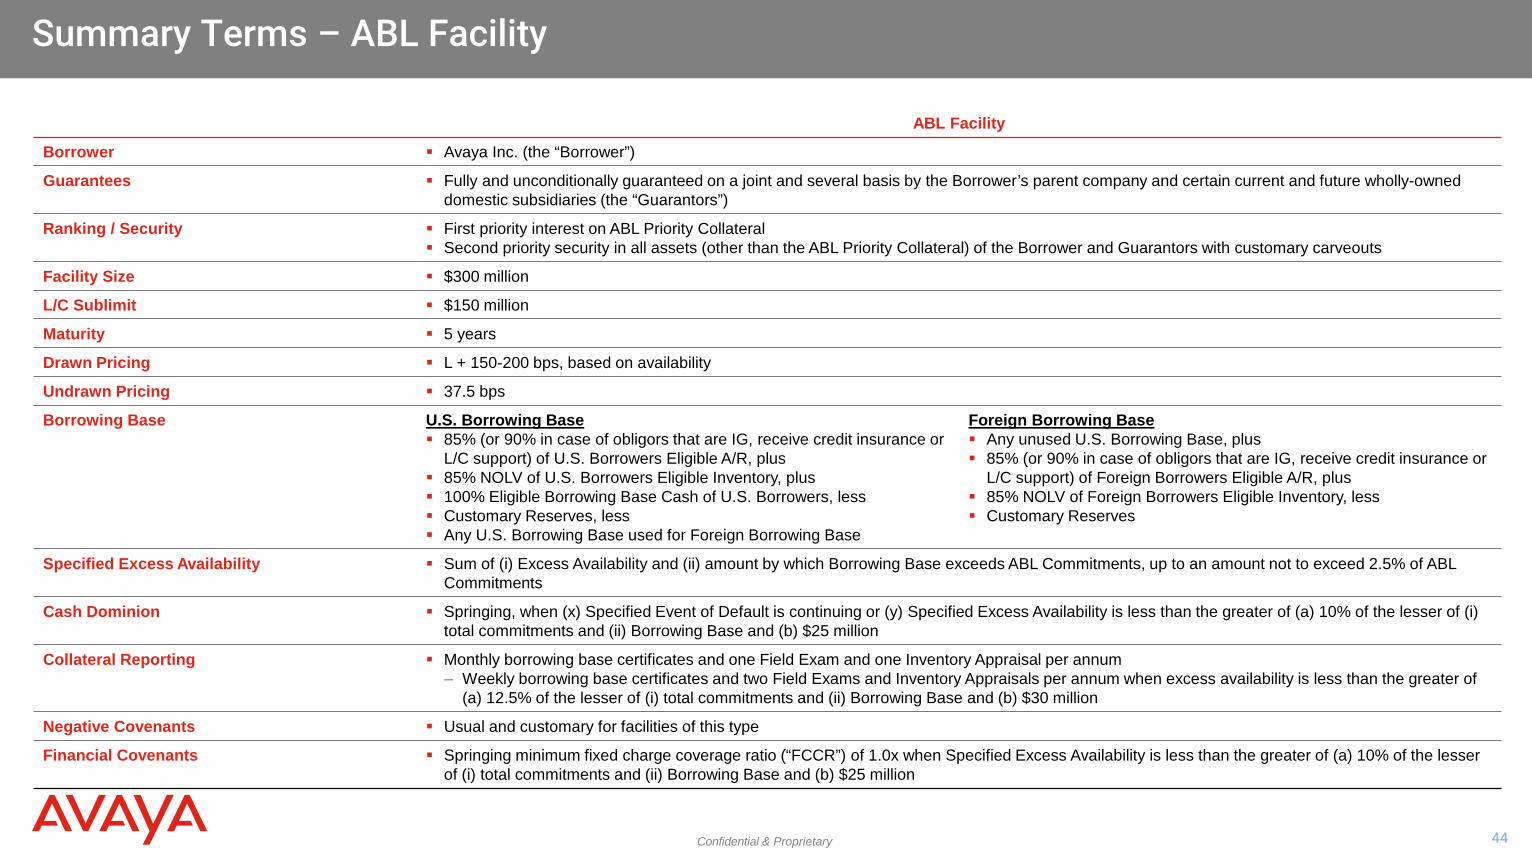
ABL Facility
Borrower Avaya Inc. (the “Borrower”)
Guarantees Fully and unconditionally guaranteed on a joint and several basis by the Borrower’s parent company and certain current and future wholly-owned domestic subsidiaries (the “Guarantors”)
Ranking / Security First priority interest on ABL Priority Collateral Second priority security in all assets (other than the ABL Priority Collateral) of the Borrower and Guarantors with customary carveouts
Facility Size $300 million
L/C Sublimit $150 million
Maturity 5 years
Drawn Pricing L + 150-200 bps, based on availability
Undrawn Pricing 37.5 bps
Borrowing Base U.S. Borrowing Base 85% (or 90% in case of obligors that are IG, receive credit insurance or
L/C support) of U.S. Borrowers Eligible A/R, plus 85% NOLV of U.S. Borrowers Eligible Inventory, plus 100% Eligible Borrowing Base Cash of U.S. Borrowers, less Customary Reserves, less Any U.S. Borrowing Base used for Foreign Borrowing Base
Foreign Borrowing Base Any unused U.S. Borrowing Base, plus 85% (or 90% in case of obligors that are IG, receive credit insurance or
L/C support) of Foreign Borrowers Eligible A/R, plus 85% NOLV of Foreign Borrowers Eligible Inventory, less Customary Reserves
Specified Excess Availability Sum of (i) Excess Availability and (ii) amount by which Borrowing Base exceeds ABL Commitments, up to an amount not to exceed 2.5% of ABL Commitments
Cash Dominion Springing, when (x) Specified Event of Default is continuing or (y) Specified Excess Availability is less than the greater of (a) 10% of the lesser of (i) total commitments and (ii) Borrowing Base and (b) $25 million
Collateral Reporting Monthly borrowing base certificates and one Field Exam and one Inventory Appraisal per annum ‒ Weekly borrowing base certificates and two Field Exams and Inventory Appraisals per annum when excess availability is less than the greater of
(a) 12.5% of the lesser of (i) total commitments and (ii) Borrowing Base and (b) $30 million
Negative Covenants Usual and customary for facilities of this type
Financial Covenants Springing minimum fixed charge coverage ratio (“FCCR”) of 1.0x when Specified Excess Availability is less than the greater of (a) 10% of the lesser of (i) total commitments and (ii) Borrowing Base and (b) $25 million
Confidential & Proprietary 45
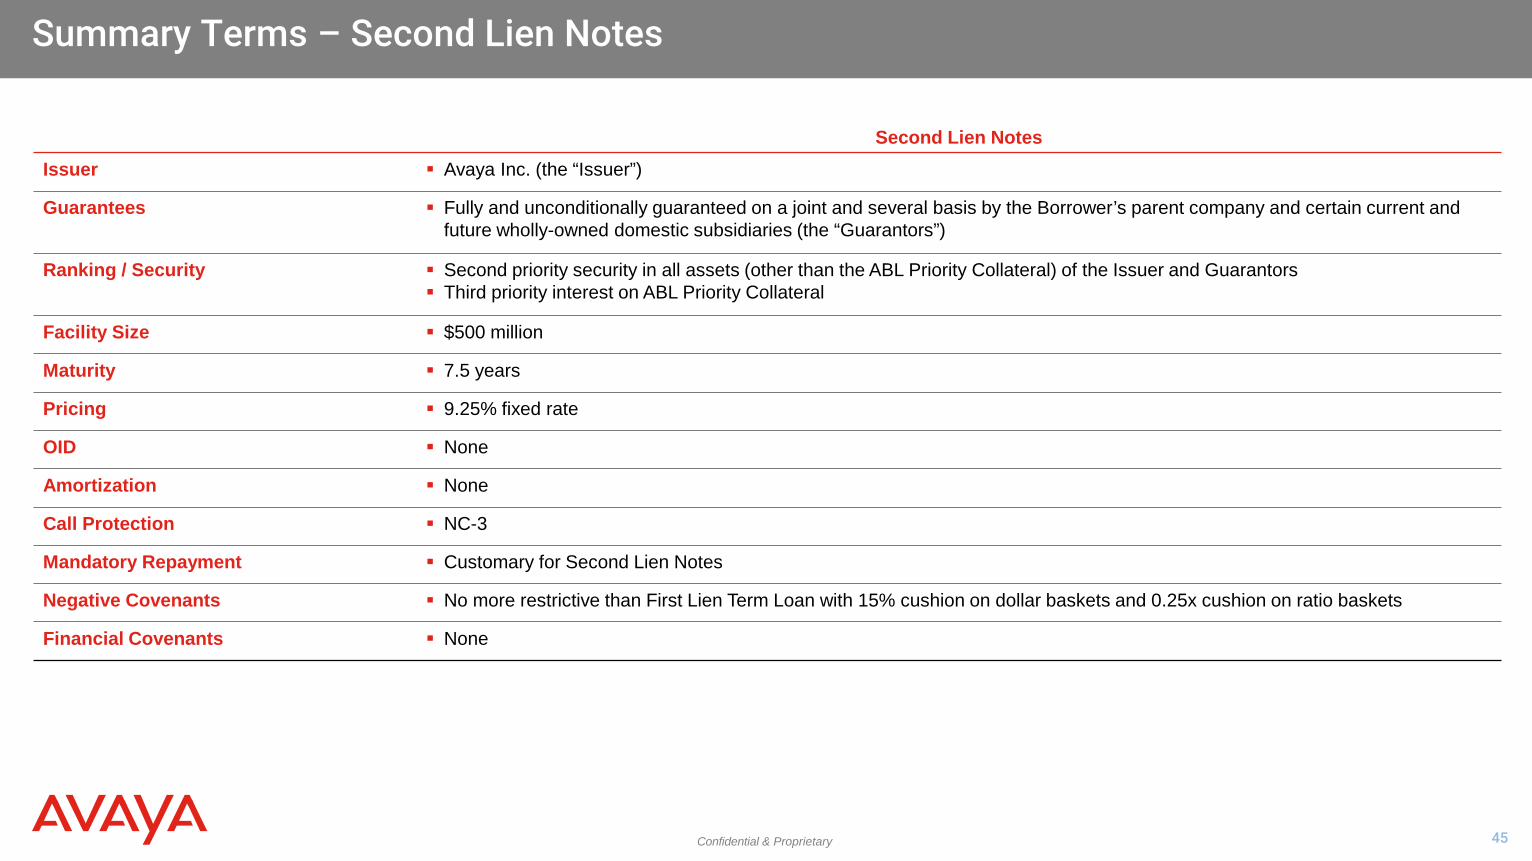
Summary Terms – Second Lien Notes
Second Lien Notes Issuer Avaya Inc. (the “Issuer”)
Guarantees Fully and unconditionally guaranteed on a joint and several basis by the Borrower’s parent company and certain current and future wholly-owned domestic subsidiaries (the “Guarantors”)
Ranking / Security Second priority security in all assets (other than the ABL Priority Collateral) of the Issuer and Guarantors Third priority interest on ABL Priority Collateral
Facility Size $500 million
Maturity 7.5 years
Pricing 9.25% fixed rate
OID None
Amortization None
Call Protection NC-3
Mandatory Repayment Customary for Second Lien Notes
Negative Covenants No more restrictive than First Lien Term Loan with 15% cushion on dollar baskets and 0.25x cushion on ratio baskets
Financial Covenants None

Confidential & Proprietary 46
Pension Settlement Overview
Source: Amended Plan and Disclosure Statement (filed 24-Aug-2017), Avaya Management 1 Projected as of FY17E (30 September 2017).
As part of Avaya’s restructuring, the Company and PBGC have agreed to a consensual termination of the APPSE
‒ Reduces ~$535 million of balance sheet liability1 (more than $1.2 billion of termination liability eliminated)
‒ Enhances cash flow by an average of ~$60 million per annum through FY 2021 as a result of the elimination of minimum funding contributions associated with the APPSE and over $480 million of APPSE contributions during the entire actuarial forecast
In exchange for the consensual restructuring of the APPSE and assumption of APPSE assets and liabilities by PBGC, PBGC is to receive $340 million in cash and 5.5% of the equity of the reorganized Avaya Holdings Corp, in addition to certain guarantees as it relates to the hourly pension plan
Avaya’s other qualified pension plans (domestic and foreign) and OPEB liabilities will be unimpaired and will remain obligations of Avaya post-emergence
Pursuant to the settlement, Avaya has agreed to provide additional protections in favor of Avaya’s remaining U.S. pension plan, the Avaya Pension (“APP”), in the event of a defined set of “Material Transactions,” including:
‒ Disposition of the Contact Center business
‒ Leveraged dividend
‒ Dispositions or sale of stock with respect to assets / operations accounting for more than 28%, but less than 66%, of EBITDA (on a consolidated basis) (or enterprise value if the Company has subsequently listed on the NYSE or NASDAQ)
Upon consummation of such a Material Transaction, the reorganized Avaya will be required to pay the lesser of (i) $150 million and (ii) the projected minimum funding contributions due to the APP for the four plan years immediately following such transaction
In exchange for such contribution, PBGC will waive, among other things:
‒ Any and all rights to initiate termination of the APP under ERISA § 4042 on grounds that are not legally supportable absent a Material Transaction
‒ Any and all other rights to object to, prevent or delay the Material Transaction
‒ Any and all claims against all counterparties of the Material Transaction and their affiliates
‒ Any rights to any proceeds from a Material Transaction
Confidential & Proprietary 47
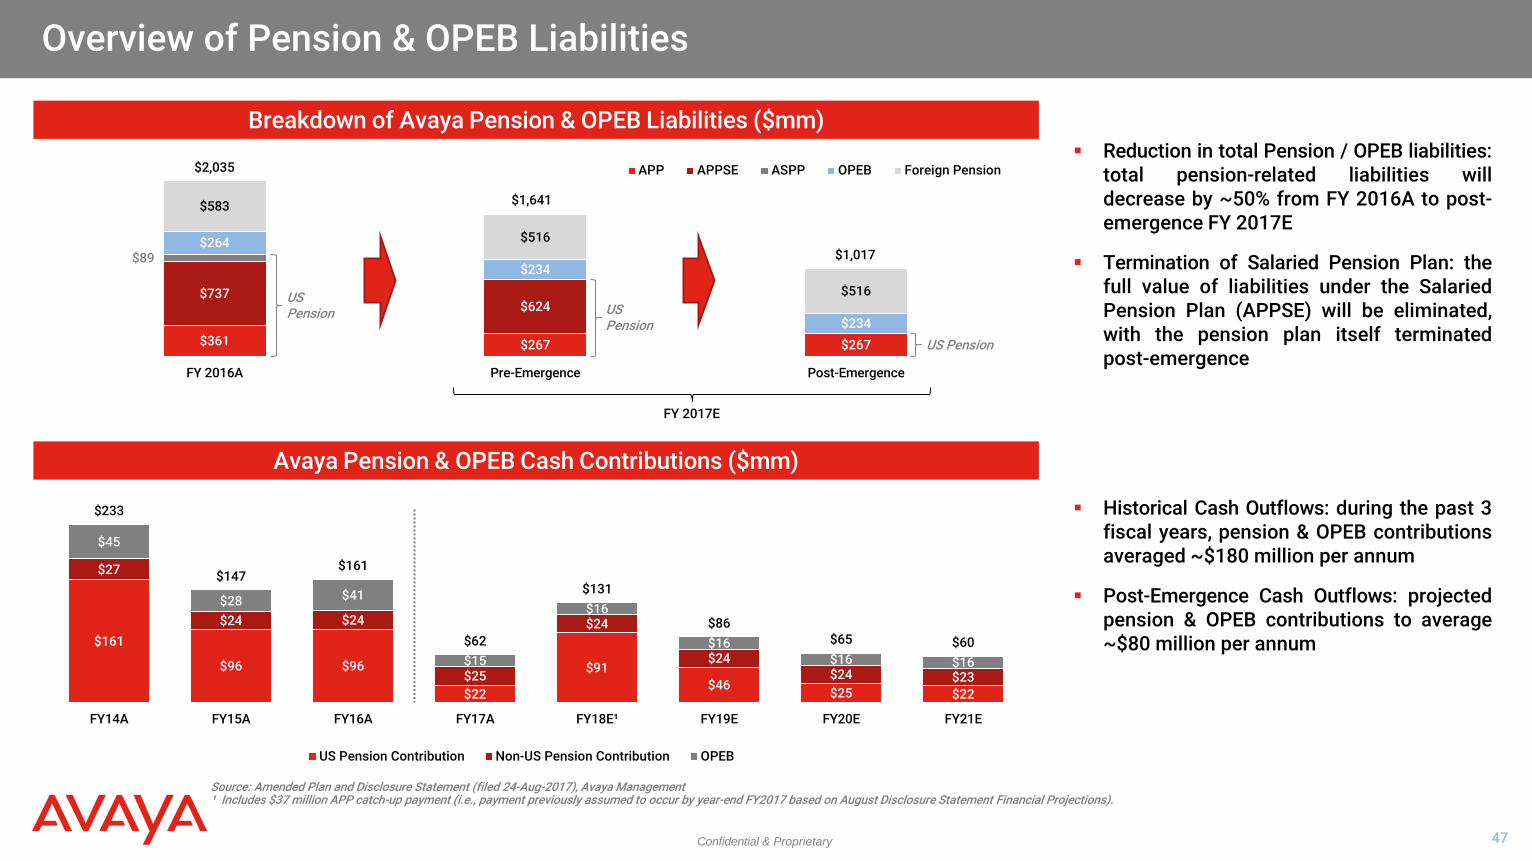
Overview of Pension & OPEB Liabilities
Source: Amended Plan and Disclosure Statement (filed 24-Aug-2017), Avaya Management ¹ Includes $37 million APP catch-up payment (i.e., payment previously assumed to occur by year-end FY2017 based on August Disclosure Statement Financial Projections).
Avaya Pension & OPEB Cash Contributions ($mm)
$161
$96 $96
$22
$91 $46 $25 $22
$27
$24 $24
$25
$24
$24 $24 $23
$45
$28 $41
$15
$16
$16 $16 $16
$233
$147 $161
$62
$131
$86 $65 $60
FY14A FY15A FY16A FY17A FY18E¹ FY19E FY20E FY21E
US Pension Contribution Non-US Pension Contribution OPEB
Historical Cash Outflows: during the past 3 fiscal years, pension & OPEB contributions averaged ~$180 million per annum
Post-Emergence Cash Outflows: projected pension & OPEB contributions to average ~$80 million per annum
Reduction in total Pension / OPEB liabilities: total pension-related liabilities will decrease by ~50% from FY 2016A to post-emergence FY 2017E
Termination of Salaried Pension Plan: the full value of liabilities under the Salaried Pension Plan (APPSE) will be eliminated, with the pension plan itself terminated post-emergence
Breakdown of Avaya Pension & OPEB Liabilities ($mm)
$361 $267 $267
$737 $624
$89 $264
$234
$234
$583
$516
$516
FY 2016A Pre-Emergence Post-Emergence
APP APPSE ASPP OPEB Foreign Pension
FY 2017E
$2,035
$1,641
$1,017
US Pension US
Pension US Pension
Confidential & Proprietary Confidential & Proprietary