Embed Size (px)
Citation preview

Automotive Laboratory Development: Small Engine Dynamometer System Design
Preliminary Design Report
Team 04006 Benjamin Duprey Matthew Lazzaro
Timothy Trapp David Wuchter Aron Youngs
2/20/04
Department of Mechanical Engineering Kate Gleason College of Engineering
Rochester Institute of Technology 76 Lomb Memorial Drive
Rochester, NY 14623-5604

2
1. Executive Summary
This preliminary design report summarizes the progress achieved by the Automotive Laboratory Development Senior Design Team. Currently the Department of Mechanical Engineering at Rochester Institute of Technology utilizes a DYNO-mite dynamometer made by Land and Sea, Inc. The goal of the team is to design, manufacture, and test a replacement dynamometer system. With an impending expansion of the Kate Gleason College of Engineering a need arises for multiple dynamometer systems to be used in a yet-to-be-built automotive laboratory. It is not cost effective to procure the numerous dynamometer systems for both financial and educational reasons. The team must design a pilot production system that specifically fulfills all requirements of students and staff at RIT. This engine test fixture will ultimately be reproduced and modeled from the pilot production model and according to the plans and specifications of the design team.
The Engineering Design PlannerTM methodology was used to shape the design process of the dynamometer system. At the completion of the RIT 20032 Winter term the first five facets of this design process have been completed. The first step of the project was to recognize and quantify the need. This goal will push the project in the correct direction and set the scope, goals, and motivations of the design. The second step provides an overview of the concept development stemming from the needs assessment. This document discusses the various dynamometer devices and subsystems generated by the team. The third step provides a feasibility study of the proposed concepts. A formal process was used to quantify between the concepts and determine the best possible design system. The next step lay out the specific intentions of the design team final concept. All goals, design practices, and safety requirements are determined and recorded. The fifth step is the analysis of the chosen design. This section quantifies and qualifies the reasoning for design decisions and specifications, while also providing justifiable calculations and information. The final section of this document recognizes the status of the project after the design phase. A future plan and schedule is created to keep the team on target for a successful pilot production dynamometer design. The current drawing package, budget, and bill of materials of the project are included in a technical data package.
Utilizing the Engineering Design PlannerTM the dynamometer system advanced. The final design became an open loop water brake absorber system. The water brake acts as a very inefficient pump absorbing the energy produced by an engine. A casing houses the impeller type water brake. The impeller is directly connected to the driveshaft of the test engine. As engine speed increases the water brake rotates. Load is applied by controlling the amount of fluid allowing into the casing surround the water brake. The impeller design absorbs the kinetic energy and creates an output flow from the casing. The dynamometer system uses an array of sensors to accurately measure the characteristics of the test engine. A data acquisition system records and analyzes the sensor outputs. When fabricated, the system will be capable of absorbing the full 5 horsepower produced by the specified Kohler test engine.
Experimentation will be conducted prior to the completion of the pilot production system to validate the dynamometer meets design objectives and specifications.

3
1. Table of Contents 1. Executive Summary.................................................................................................2 1. Table of Contents ....................................................................................................3 2. Needs Assessment ...................................................................................................5
2.1. Project Mission Statement................................................................................5 2.2. Product Description .........................................................................................5 2.3. Scope Limitations ............................................................................................8 2.4. Stake Holders...................................................................................................9 2.5. Key Business Goals .........................................................................................9 2.6. Top Level Critical Financial Parameters.........................................................10 2.7. Financial Analysis..........................................................................................10 2.8. Primary Market ..............................................................................................11 2.9. Secondary Market ..........................................................................................11 2.10. Order Qualifiers .........................................................................................11 2.11. Order Winners............................................................................................12 2.12. Innovation Opportunities............................................................................12 2.13. Background................................................................................................13
3. Concept Development............................................................................................16 3.1. Water Braking System Concept......................................................................17 3.2. Resistance Load Generator System Concept...................................................18 3.3. Mechanical Brake System Concept ................................................................19 3.4. Sensor Package ..............................................................................................19 3.5. Data Acquisition Package ..............................................................................21
4. Feasibility Assessment...........................................................................................23 4.1. Water Brake System Feasibility .....................................................................24
4.1.1. Closed Loop...........................................................................................24 4.1.2. Open Loop .............................................................................................25
4.2. Resistance Load Electric Generator System Feasibility ..................................25 4.3. Mechanical Brake System Feasibility.............................................................27 4.4. Feasibility Conclusion....................................................................................28
5. Performance Objectives and Specifications............................................................29 5.1. Design Objectives ..........................................................................................29 5.2. Performance Objectives .................................................................................30 5.3. Design Practices Used by the Team................................................................31 5.4. Safety Objectives ...........................................................................................32
6. Analysis of the Problem and Synthesis of Design ..................................................33 6.1. Water Brake Impeller Design.........................................................................34
6.1.1. Water Brake Impeller Radius .................................................................35 6.1.2. Water Brake Inertia Optimization...........................................................38 6.1.3. Profile of Impeller Blades.......................................................................40 6.1.4. Water Brake Impeller Design Conclusion...............................................45
6.2. Water Brake Casing Design ...............................................................................45 6.3. Torque Arm Design ...........................................................................................49 6.4. Motor Mounting Design and Setup ....................................................................50 6.5. Sensor Placement and Mounting ........................................................................53

4
6.6. Data Acquisition Design and Setup....................................................................55 6.7. Controls and User-Interface Design ...................................................................57 6.8. Structure and Assembly .....................................................................................58 7. Budget ...................................................................................................................60 8. Future Plans...........................................................................................................61 8.1. Schedule ............................................................................................................63 9. Conclusion ............................................................................................................63 10. References .........................................................................................................65 11. Appendix ...........................................................................................................66

5
2. Needs Assessment
2.1. Project Mission Statement
The Automotive Lab Development Senior Design Team is to design and fabricate
a working pilot production system. The final design will provide a flexible bench top,
educational engine test fixture. The design must incorporate hands on experience to
further enhance theory from coursework. The solution must be safe, robust, flexible to
change, and intuitive to operate.
2.2. Product Description
Figure 2.2.1 � Kohler Engine

6
Currently at Rochester Institute of Technology, a single small engine dynamometer is
utilized in labs and coursework. With the impending expansion of the Kate Gleason
College of Engineering building, there are plans to build a new automotive test cell
facility. This state of the art laboratory will be a dramatic improvement over the current
situation. Students have only had one small engine dynamometer available for use. Even
with small laboratory groups the learning experience from using the dynamometer was
minimized. RIT has proposed to incorporate six new small engine dynamometers into
the new automotive laboratory. This equipment will be the main components of the lab.
The current dynamometer was procured from Land and Sea, Inc. The Land and
Sea DYNO-mite is not being used to its full potential. This system is not properly
matched to its end use at RIT, learning. The DNYO-mite is capable of conducting its
own dyno runs with minimal operator interface. The system includes servo-motion
control of throttle and load, along with a stand alone data acquisition system and
computer; it is a �black box� system.
To simply purchase more units from Land and Sea is not the best direction for
RIT to pursue. The cost of each unit is on the order of $30,000, while the value to the
institution and students is far less. The DYNO-mite unit has many advanced features that
are irrelevant to learning and unused. The unique data acquisition system does not allow
standardization. Maintenance and repair must be done by Land and Sea technicians.
Replacement parts are not common and therefore must be routed from Land and Sea as
well.

7
In order to fully meet the needs of the College of Engineering and the future
Automotive Laboratory, the only viable solution is to design and build an original
dynamometer. The new system will be tailor-fitted to meet the specific needs of students
and professors at RIT.
The new dynamometer will designed around a stockpile of small single cylinder
engines currently owned by RIT. The College of Engineering has a large quantity of
Kohler Command engines. This five horsepower, single cylinder, air cooled, four stroke
power plant is robust and reliable.
The purpose of a dynamometer is to place a load on an engine and measure its
performance. The application of the mechanical load creates energy. The fundamental
goal of a dynamometer is conversion or translation of energy. The Kohler engine creates
five horsepower therefore the design must be able to dissipate at a minimum of five
horsepower in order to completely stall the engine. There are a variety of designs and
systems for dynamometers. The final design will best fit the needs of students and
professors.
The goal of the design group is to produce a single unit. The ultimate intention of
the College of Engineering is to reproduce this pilot production model. Depending on
budget and space requirements six to ten dynamometer units will be reproduced. The
Kate Gleason College of Engineering expansion building plans for the automotive
laboratory will take into consideration the new dynamometer design.

8
2.3. Scope Limitations
The pilot production Automotive Laboratory Small Engine Dynamometer shall be
fully designed by the end of RIT�s winter quarter and be fabricated and fully assembled
at the completion of spring quarter.
At the end of Winter Quarter 20032, the senior design team will hold a Preliminary
Design Review. At this time the group will be responsible for:
• Needs Assessment
• Concept Development
• Feasibility Assessment
• Drawing Package
• Analysis and justification of final design
• Bill of Materials
• Budget
At the end of Spring Quarter 20033, the senior design team will present the working pilot
production system. The end responsibilities will include:
• Functioning pilot production dynamometer system
• Operating and Training Manual
• Final Report and Binder
The senior design team will not be responsible for the following:

9
• Performance modifications to the Kohler engine
• Design of laboratory building and structure
• Generating laboratory experiments
2.4. Stake Holders
The key stake holders are the students and professors using the future Automotive
Laboratory. Other stake holders include the students of the senior design team and their
future employers.
2.5. Key Business Goals
The senior design team will be successful when it has designed and fabricated a
pilot production small engine dynamometer that meets the academic and research needs
of the RIT College of Engineering students and staff. If this has been done then:
• The members of the team will have learned how to work on an engineering team
in a professional manner.
• RIT will have a pilot production model of a new small engine dynamometer
specifically suited to the needs of the College of Engineering.
• The design package will be able to be replicated and reproduced depending on the
requirements and demands of students and the institute.

10
2.6. Top Level Critical Financial Parameters
• The dynamometer must be cheaper than the current Land and Sea DNYO-mite
dynamometer.
• The dynamometer system must be easily reproduced. Common parts, simple
machining, and RIT standards will be used to minimize cost of cloning the design.
• Human interface of dynamometer design must provide an intuitive educational
experience.
• Data and analysis must be accurately conveyed.
2.7. Financial Analysis
A $5000 budget has been proposed for the RIT Automotive Lab Development
Senior Design team. This budget shall include:
• Mechanical components of dynamometer
• Coupling for connecting Kohler engine to dynamometer
• Data acquisition equipment and software
• Sensor package
• Mounting platform or cart
• Raw materials for machining mounts and mechanical control system
• Computer system to run DAQ software and provide user interface

11
2.8. Primary Market
The primary market of the new small engine dynamometer system is the College
of Engineering. This consists of both students and professors primarily in the Mechanical
Engineering department.
2.9. Secondary Market
The secondary market includes the commercialization of the use of the new
automotive laboratory. Potentially RIT could create a program in which it sells dyno
time to businesses and individuals wishing to test small engines. Also RIT could sell or
distribute the design specifications to other colleges and institutions as a learning tool.
2.10. Order Qualifiers
The Automotive Laboratory Development team will create a pilot production
small engine test fixture. The design will meet the needs of the College of Engineering.
The design will also incorporate future reproduction plans of the system. Upon
completion a user-guide and training manual will document operation of the system for
future users and maintenance issues.

12
2.11. Order Winners
• The new design will be cheaper than the existing dynamometer currently in use.
• Comply with OSHA safety standards.
• Ease of operation for students with minimal assistance from instructor.
• A compact portable design to efficiently utilize laboratory space.
• System will verify experimental data collected conforms to theoretical
calculations.
• Maintenance issues will be minimized with widespread use of common parts.
• System will be designed with ease of reproducibility in mind.
2.12. Innovation Opportunities
The new design of the small engine test fixture has the potential to be marketed
by RIT to other colleges, learning institutions, and private industries. The dynamometer
and incumbent system will be focused on learning rather than just collecting raw data.

13
2.13. Background
Figure 2.13.1 � DynoMite Dynamometer
A dynamometer can be defined as any device for measuring power output of a source.
More specifically it is a device for measuring the tangential forces incident to a rotating
mass. In terms of engine and automotive interests a dynamometer is a way of accurately
measuring the specific output of an engine. Dynamometers typically apply some form of
measurable resistance on the engine. The resistance is called the load, and serves as a
benchmark, something to measure the engine�s power against. There are a variety of
ways to measure this output, and these are dictated by the basic mechanism of the
dynamometer design.
The most common form of dynamometers today, use oil or water circulating with
a pump to provide the load requirement. This system works on a simple concept: the
harder the pump and fluid work the harder the engine must work. Increasing the flow of
the fluid to the point the engine cannot output enough power, will cause the engine to

14
slow down. Likewise, reducing the flow of the fluid will cause the engine to speed up
until equilibrium is reached. Utilizing a valve to regulate inlet fluid flow allows control
of the applied load. There are two variations of this design.
The first design calls for a pump to be driven by the output of the measured
engine. Using a positive displacement pump mechanically forces the fluid out of the
pump outlet. This mechanism allows load to be applied to the engine by regulating, with
a valve, the inlet amount of fluid to the pump. Measuring the power of the engine is then
directly related to the fluid flow exiting the pump. The pump converts the test engines
power into a fluid flow.
Water brakes are another form of hydraulic pump absorbers. These designs
consist of one or more vaned rotors spinning in between pocketed stator housings. Load
is controlled by adjusting the level of fluid in the brake with adjustable inlet orifice.
Raising the fluid level increases the rotational drag of the rotor, applying more resistance
to the engine turning it. The water brake is easily compared to a very inefficient pump; it
efficiently uses up engine power by converting it to fluid flow and heat.
The simplest and earliest form of dynamometer brakes were mechanical brakes.
A rotating drum with a friction brake was used to apply drag at the engine�s output shaft.
This crude form of absorber proved difficult to accurately apply a consistent load for
prolonged periods of time. Mechanical brakes convert kinetic energy into thermal energy
by using pressure to apply varying levels of friction. The heat lost to surrounds is
difficult to measure further enhancing characteristic drawbacks of these simple systems.
Electric dynamometers convert mechanical power to electric power. The engine
drives a generator. The more electricity generated, the harder the engine has to work.

15
The voltage created by a generator is more or less constant. Therefore, by varying the
amount of electrical current load on the generator, the mechanical load on the engine is
varied. Varying the load can be accomplished by adding resistance to the electric output
of the generator.
Generator style dynamometers are great for steady state conditions, but have
significant drawbacks for transient testing. Generators have a high polar moment of
inertia. High inertia means a lot of power is required to accelerate the armature.
Likewise, a lot of stored horsepower will be returned when dropping down in engine
speed. This effect skews the test data whenever engine speed is changing.
Eddy current brake dynamometers are similar in operational characteristics to
electric generator absorbers. The main difference is that eddy current brakes do not
generate electricity. Rather, they use an electrical power supply to charge
electromagnetic coils. The dynamometer�s input shaft spins a metallic rotor inside the
resulting magnetic field. When the current to the magnetic field is increased, the rotor
shaft becomes harder for the test engine to turn.
Regardless of the dynamometer device in use, a method to gathering information
must be in place. The most basic piece of information from a dynamometer is torque.
Knowing the torque of the driveshaft and measuring the engine speed, output power can
then be determined. Besides the output of the engine other vital measurements include
pressure in the combustion chamber, intake temperature, and exhaust temperature. With
these basic measurements the thermodynamic cycles of the internal combustion engine
can be compared against theory. The key element of any dynamometer system is
accurately measuring the type of loads and conditions you are trying to simulate.

16
3. Concept Development
The Automotive Laboratory Development Senior Design Group developed a large
list of possible solutions to satisfy the need of producing an inexpensive dynamometer as
a teaching tool. The list was generated from numerous brainstorming sessions and based
on initial feasibility assessments focused on three schools of thought. The concepts
developed for the dynamometer design stemmed from a fluid braking system, a
mechanical braking system and an electrical braking system. These 3 basic designs were
then expanded upon and more closely evaluated.
Group and individual drawings were initially generated to develop more formal
plans. The group drawings generated five concepts and individually, each member was
assigned to generate three concept drawings. There was a great deal of overlap and from
23 concepts there ended up being nine individual proposals. These nine concepts were: an
inertial dynamometer system, an open system water brake, a resistance load electrical
generator brake, a mechanical brake, an eddy current brake, a competing engine brake, a
load cell electric generator brake, and a closed system water brake. A second feasibility
assessment was conducted to eliminate the competing engine brake, the load cell electric
generator brake and the eddy current brake. After this elimination a great deal of debate
occurred over the feasibility of each of the three semi-final designs. Each of these
concepts is presented in detail below.

17
3.1. Water Braking System Concept
The water braking system concept is largely based upon centrifugal pumping
laws. A centrifugal pump works on the concept of displacing fluid radially from its inlet
to its outlet, about the impeller of the pump. The load a centrifugal pump encounters is
related to the input power and the input flow. The less the input power and the larger the
flow the easier it is to stall, or brake, the pump.
The same theory applies for a water brake dynamometer system. A water brake
dynamometer is directly connected to the engine output shaft. The pump impeller and
the power of the engine produce dictate the pumping ability and thus output of the
system. Varying the inlet water flow through a valve can control the amount of load
placed on the engine.
A closed system water brake incorporates a pump and reservoir to drive the fluid
into the absorber. This creates a large packaging sized dynamometer. By using the closed
system approach, more heat is generated due to the use of a common water supply and a
pump. Due to this generation of heat, a cooling system would need to be implemented to
allow the system parameters to remain constant and efficient. However, because the
system is closed, measuring the pumping losses due to heat generation is straightforward.
Despite the varying temperature a closed system water brake is more environmentally
friendly in its handling of water and potentially various working fluids could be used.
An open system water brake dynamometer uses tap water as the inlet flow and has
no re-circulation; allowing for a small unit packaging size. By using an open system
approach, heat is generation in negligible; a cooling system is unnecessary. However,
since the system relies on tap water, the flow may not to be constant. This effect is

18
directly related to the plumbing facilities and configurations the system is connected to.
The lack of a reservoir and pump will allow measuring heat loss slightly harder than that
of a closed system.
3.2. Resistance Load Generator System Concept
The resistance load generator system concept is based on constant voltage laws
that dictate that a system will absorb a designated current based on its level of resistance.
The system design calls for an AC electric generator to be attached to the output shaft of
the engine and a bank of switch-selected resistors to be wired in series to the generator
power output line. By selecting specific resistors, which correspond to a certain level of
current absorption, the load can be varied on the basis that power is the product of
voltage and current.
Another resistance loaded dynamometer concept can utilize switch-selected light
bulbs, LEDs or heating coils. This would provide a visual representation of the
impending load to the user.
Despite the simplicity of an electric generator style dynamometer there exists a
great deal of inefficiencies in converting mechanical power into electrical power.
Similarly, because the resistance loads required have to absorb high levels of power, thus
generating heat, the inherent electrical inefficiencies of the resistors skyrocket unless
cooling systems are integrated.
19
3.3. Mechanical Brake System Concept
The mechanical brake system concept is based upon transferring mechanical
energy into thermal energy or heat. This is accomplished through the torque generated
from friction about a designated rotating radius. Exactly like an automotive disc brake,
the system turns input hydraulic pressure into a normal force that is applied to a friction
pad, and is then applied to a surface that radiates heat. Applying a disc brake system to an
engine�s output shaft gets the same response. By varying the hydraulic pressure, many
different loads can be achieved.
Despite the simplicity of a mechanical dynamometer system there exists a great
deal of data acquisition problems associated with the heat transfer through the brake
system. To measure this thermal energy loss, very sophisticated sensors would be
necessary to determine the heat transferred to the surrounding environment.
3.4. Sensor Package
The main objective of building the dynamometer system is to place a load on the
engine. The above mentioned concepts all deal with the placement of the load, whether
mechanical or electrical, on the engine itself. The most important and integral part of the
dynamometer is the sensor package.
The sensor design is independent, or generic, to the dynamometer concept used.
The sensor package is to be designed according to the needs assessment. The educational

20
purpose of the dynamometer system is to relate experimentally, how the internal
combustion Kohler engine operates, and compare those attributes to theory learned in the
classroom.
This goal can be achieved by measuring a fundamental set of data points. Intake
temperature and exhaust temperature will be used with cylinder pressure to model the
thermodynamic cycle in the engine cylinder. A thermocouple placed in the intake
manifold, before the combustion chamber will record an average intake temperature. A
thermocouple place in the exhaust flow will determine the average temperature of the
gasses exiting the after the combustion cycle. A pressure transducer mounted in the
cylinder head of the engine will record the dynamic pressure throughout the
thermodynamic process. A second pressure transducer will be used to measure intake
pressure.
A mass air flow sensor used in conjunction with an oxygen sensor will be used to
calculate the amount of fuel flowing into the engine. A wide-band oxygen sensor uses a
chemical reaction to output a voltage that is related to the air and fuel mixture in the
exhaust. The output voltages of the sensor can be measured and can be related to
corresponding air-fuel ratios. The mass air flow sensor measures the amount of flow into
the engine. Using the flow rate and the air-fuel ratio the amount of fuel is equal to:
Flow Rate of Air / Air-Fuel Ratio = Flow Rate of Fuel
To relate emissions to the laboratory a hydrocarbon measuring device will be
placed in the exhaust flow. This device measures the average concentration of
hydrocarbons. This reading can be used to relate emissions to engine speed and load.

21
The sensor needs to be mounted somewhere in the exhaust flow path and outputs a
voltage that corresponds to specific hydrocarbon concentrations.
Engine speed will be measured using a Hall-Effect sensor. This sensor is used in
conjunction with one or more small magnets. As the magnets pass by the sensor a
voltage is output. The magnets can be mounted on the driveshaft, as the driveshaft turns
the sensor will measure the engine speed. Using the data acquisition system to read the
amount of voltages output from the sensor over a given period of time the engine
revolutions per minute can be recorded and displayed.
The load applied from the dynamometer is dependant on the style of system used
in the final design. A mechanical of fluid style dynamometer will use a torque arm to
measure the rotational force, torque. A strain gauge mounted on the torque arm converts
the mechanical load into a measurable voltage.
An electric generator style dynamometer will measure the load on the engine in
terms of power. An ammeter style device can measure the current produced by the
generator. Power is equal to the product of current and voltage, and therefore can be
calculated and recorded.
3.5. Data Acquisition Package The data acquisition, DAQ, subsystem is independent of concept choice. The
DAQ equipment will interpret the readings taken from the sensors and relate them to data
and measurements understandable by the users. The output of each sensor is either a

22
current or voltage. The DAQ is programmed for each sensor to read the electrical output
and display or record various measurements.
According to the Kate Gleason College of Engineering National Instruments
equipment and LabVIEW Software will be used. This software is the industry standard
for data collection.
The constraining requirement of the DAQ is the sampling rate for the in-cylinder
pressure transducer. Due to the nature of the Kohler engine, and engine speed, the DAQ
system and pressure sensor must accurately record in-cylinder pressure at speeds up to
6000rpm. This requires a sampling rate of 100 samples per second.
Intake and exhaust temperatures do not require a high sampling rate. These
properties change gradually over time depending on atmospheric and loading conditions.
The engine speed will be read by the DAQ as an input voltage. Within the
software a scale factor will be programmed with a timer to display and record engine
revolutions per minute.
The load placed on the engine by the dynamometer will be output through the
strain gauge. LabVIEW will be programmed to interpret this voltage or current and
display and record a value for torque. Using the formula:
dEngineSpeeTorquePower *=
LabVIEW can be programmed to calculate the power produced by the Kohler engine as
well.

23
4. Feasibility Assessment
The three basic concepts presented in the previous section are the results of team and
personal brainstorming involving initial investigation and evaluation. Once each potential
concept had been clearly defined and understood by all members of the team a feasibility
assessment was generated using the steps provided in the Design Planner package. This
assessment looked at technical, performance, schedule, economic, and resource factors
affecting the completion of the project. Each question was compared with the project
baseline, which is the current dynamometer described in the section 1, Needs
Assessment. These questions were graded on a scale of 0 to 3, with a score of 2
representing the same as the base line, 0 being not feasible, 1 being less feasible and 3
being more feasible. The team used these factors to rank the concepts and decide which
direction the team and the design project should move in. The feasibility of each concept
is described below.

24
4.1. Water Brake System Feasibility
4.1.1. Closed Loop
The closed loop water brake dynamometer was compared to a baseline of the
current dynamometer, an open loop water brake. The 13 questions were broken into
subgroups and discussed as shown.
First, an assessment was done regarding resource feasibility. The team has
sufficient skills, sufficient equipment and enough people to satisfy the goal of the project.
The resource feasibility assessment received a score equal to that of the baseline.
Second, an assessment was done regarding economic feasibility. The team�s
budget would be enough to support this concept. However, if it were to fail, due to the
necessity of purchasing pumping equipment the left over budget may not be enough to
�start over�. The economic assessment received a score slightly below the baseline.
Third, an assessment was done with regard to schedule feasibility. The chances
of meeting intermediate mileposts, PDR and CDR requirements are very close to that of
the baseline. By adding the necessary parts to produce a closed loop system some level of
intricacy is added to the design. Due to these intricacies, the schedule assessment
received a score slightly less than the baseline.
Fourth, a feasibility assessment related to the technical aspect of the closed loop
was conducted. The senior design team has the basic skills necessary to implement a
closed loop system. However, the team may require assistance in designing an
appropriate cooling system for the water. Similarly, the data acquisition and tuning

25
associated with the heat transfer issues could potentially require assistance. The technical
assessment received a score slightly below the baseline.
Lastly, an assessment was done regarding performance aspects. Having a closed
loop system certainly satisfies the needs assessment. It achieves the same result as the
baseline in producing a useful teaching tool. However, it is less wasteful with water and
easier to establish efficiently losses due to thermal energy losses. The performance
assessment received a score slightly higher than the baseline.
4.1.2. Open Loop
The open loop water brake has the same characteristics as the baseline. Therefore
it has the same score in the feasibility assessment.
4.2. Resistance Load Electric Generator System Feasibility
The resistance load electric generator dynamometer was compared to a baseline
of the current dynamometer, an open loop water brake. The 12 questions were broken
into subgroups and discussed as shown.
First, an assessment was done regarding resource feasibility. The team has
sufficient skills, sufficient equipment and enough people to satisfy the goal of the project.
However, the team has no electrical engineers; therefore consulting RIT�s staff could be

26
necessary. The resource feasibility assessment received a score slightly less than that of
the baseline.
Second, an assessment was done regarding economic feasibility. The team�s
budget would be enough to support this concept. However, if it were to fail, due to the
necessity of purchasing an electric generator, numerous resistors and switches the left
over budget may not be enough to �start over�. The economic assessment received a
score slightly below the baseline.
Third, an assessment was done with regard to schedule feasibility. The chances of
meeting intermediate mileposts, PDR and CDR requirements are not so close to that of
the baseline. The intricacies inherent in having many switch selected high power resistors
and the potential need for a cooling system could generate trouble for post production
testing. Due to these intricacies, the schedule assessment received a score less than the
baseline.
Fourth, a feasibility assessment related to the technical aspect of the electrical
dynamometer was conducted. The senior design team has the basic skills necessary to
implement an electrical dynamometer system. However, the team may require assistance
in designing an appropriate cooling system for the resistors. Similarly, the data
acquisition and tuning associated with the heat transfer issues could potentially require
assistance. The technical assessment received a score slightly below the baseline.
Lastly, an assessment was done regarding performance aspects. Having an
electrical dynamometer system certainly satisfies the needs assessment. It achieves the
same result as the baseline in producing a useful teaching tool. However, it is less

27
efficient due to converting mechanical energy to electrical energy. The performance
assessment received a score slightly lower than the baseline.
4.3. Mechanical Brake System Feasibility
The mechanical brake dynamometer was compared to a baseline of the current
dynamometer, an open loop water brake. The 12 questions were broken into subgroups
and discussed as shown.
First, an assessment was done regarding resource feasibility. The team has
sufficient skills, sufficient equipment and enough people to satisfy the goal of the project.
The resource feasibility assessment received a score equal to that of the baseline.
Second, an assessment was done regarding economic feasibility. The team�s
budget would be enough to support this concept. However, even if it were to fail, despite
the necessary purchasing of sophisticated sensors the left over budget would likely be
enough to �start over�. The economic assessment received a score equal to the baseline.
Third, an assessment was done with regard to schedule feasibility. The chances
of meeting intermediate mileposts, PDR and CDR requirements are very close to that of
the baseline. By adding the necessary sensors to produce a mechanical system and
subtracting the water pumping and sensing system it is likely to be similar to the baseline.
Therefore the schedule assessment received a score equal to the baseline.
Fourth, a feasibility assessment related to the technical aspect of the mechanical
brake was conducted. The senior design team has the basic skills necessary to implement
a mechanical system. However, the team may require assistance in the data acquisition

28
and tuning associated with the heat transfer issues. The technical assessment received a
score slightly below the baseline.
Lastly, an assessment was done regarding performance aspects. Having a
mechanical system certainly satisfies the needs assessment. It achieves the same result as
the baseline in producing a useful teaching tool. However, it isn�t wasteful but is likely
harder to establish thermal energy losses. The performance assessment received a score
equal to the baseline.
4.4. Feasibility Conclusion
Based on the analysis presented above, the team was able to examine each
concept and decide which concept should be further developed. The scores of each
concept and a radar chart can be seen in Appendix B. The team decided to select the
baseline, the open loop water brake dynamometer as it had the highest feasibility grade.
However, depending upon a more formal economic and technical assessment we may
integrate a closed loop system into the design.
R1 R2 E1 E2 S1 S2 S3 T1 T2 P1 P2Base Line: Water Brake Open Loop 2 2 2 2 2 2 2 2 2 2 2Water Brake Closed Loop 2 2 2 1 1 2 2 1 2 2 3Electro Generator 1 2 2 1 1 2 2 1 1 1 1Mechanical Brake 2 2 3 2 2 2 2 2 1 2 1
Feasibility Assessment
0
1
2
3R1
R2
E1
E2
S1
S2S3
T1
T2
P1
P2
P3
Base Line: Water BrakeOpen LoopWater Brake Closed Loop
Electro Generator
Mechanical Brake

29
Figure 4.4.1
5. Performance Objectives and Specifications
The team acknowledges that certain objectives and specifications have to be
determined so that it can measure the performance of the engine dynamometer system.
These objectives and specifications are discussed in this section.
5.1. Design Objectives There are a number of design objectives that required the attention of the team.
These objectives need to be specified in order for the team to have a set list of goals to
achieve. These objectives are listed below.
1) The most important goal that the team has to achieve is the production of a
functional engine dynamometer. This goal lies at the core of the project and the
design elements must include this objective at every phase.
2) Another objective is to design the engine dynamometer as a functional teaching
tool. This goal is central to the objectives illustrated in the needs assessment.
3) Another objective that has been incorporated into the design of the engine
dynamometer is accuracy. The acquisition of data must provide a high level of
accuracy for the engine dynamometer to be a functional lab tool.

30
4) The team will also ensure that the engine dynamometer is safe, reliable and
robust. This objective is essential to the uptime of the engine laboratory and
therefore essential for the dynamometer as a teaching tool.
5.2. Performance Objectives
The team has decided that a number of performance specifications need to be met
in order for the project to be successful. These specifications are based on the minimal
requirements of the engine dynamometer to be designed by the team. Therefore the final
product needs to be able to meet these minimal requirements so that the basic objectives
of the project are fulfilled. These specifications have been kept in mind when designing
the engine dynamometer and are listed below.
1) The engine dynamometer shall be able to absorb at least 3.7 kilowatts of power.
An important objective that has been incorporated into the design of the engine
dynamometer is for the dynamometer to be able to stall the engine. This is
essential for the performance of a lab and thus is critical to having the
dynamometer as a teaching tool.
2) The sensor package must be accurate and robust. The sensors must be able to
handle a large range of operating parameters. For example, the in cylinder
pressure transducer must be able to withstand 10,061 kilopascals. The exhaust
thermocouple must be able to withstand 1,500 degrees Celsius. The mass airflow
sensor must be able to withstand 11.44 cubic feet per minute. The sensors also
must be able to come close to continuous sampling i.e. have/handle high
frequencies and high resolutions.

31
3) The team will also ensure that the engine vibration does not interfere with the data
acquisition and that the torque arm be optimally designed so as to handle 8.4 ft-
lbs of torque.
4) The engine dynamometer will have minimal inertia. We are not designing an
inertial dynamometer; therefore any non-liquid additional inertia is not necessary
and would be intrusive upon our overall accuracy.
5.3. Design Practices Used by the Team
The team discussed a number of design practices to be considered when designing the
engine dynamometer. These practices are provided below.
1) Design for Manufacturability � The team has designed the engine dynamometer
such that the parts are designed custom for this application, however they can be
easily reproduced.
2) Design for Assembly � The team designed the engine dynamometer such that a
few assemblies and sub-assemblies exist in order to make the entire assembly
process easier.
3) Design for Minimal Cost � The team designed the engine dynamometer such that
the cost of making the dynamometer is kept to a minimum. Unnecessary parts and
materials were kept to a minimum and the materials were selected after assessing
benefits versus costs.

32
4) Design for Reliability � The team has selected materials and parts that will make
the engine dynamometer as reliable as possible.
5.4. Safety Objectives
The team found set safety standards for this project�s handling of combustible
fluids and exhaust. Also, the nature of an engine and an engine dynamometer require
guidelines related to fast moving parts.
• The most important safety issue of an indoor engine dynamometer is related to the
handling of combustible fluids. An engine requires fuel to run, and in our case
that fuel is gasoline. ASME requires gasoline to be contained in a certain fashion.
The engine we are using for the engine dynamometer has an ASME certified gas
tank.
• The second most important safety issue of an indoor engine dynamometer is
related to the handling of exhaust emissions. OSHA requires exhaust emissions to
be ventilated from all indoor rooms to the outside. A vacuum ventilation system is
going to be central to the operation of the engine dynamometer indoors. The
engine lab cell is going to have this type of system when the building is
completed.
• Thirdly, the nature of mechanical systems with fast moving parts requires all
exposed moving parts to be guarded for operator safety.

33
6. Analysis of the Problem and Synthesis of Design
The analysis of the open loop water brake dynamometer system focused on
several different aspects of the overall design. The system design was split up into the
component sections: water brake impeller, water brake casing, torque arm, motor
mounting, sensor placement, data acquisition, controls and user-interface, and structure
and assembly.
The water brake was designed to provide sufficient load to stall the Kohler engine
as well as be flexible for use with other small engines that may be used in the future. The
impeller blade angle and surface area were modeled and optimized to provide the most
favorable results best suited for the team�s design requirements. Machine-ability and
remanufacture-ability were also major criteria when specifying the water brake impeller
geometry.
The water brake casing was designed around the impeller. The casing was
designed to withstand worst-case scenario operating conditions. A Finite Element
Analysis, FEA, was conducted on the casing for proof of concept data.
The torque arm was designed and optimized to translate the most accurate toque
reading to the DAQ system. Strength of materials calculations were used to determine
size and shape of the arm. Placement of the strain gauge was also chosen to best suit the
needs of the system and equipment.
The motor mounting hardware was designed and specified to effectively isolate
the inherent vibration cause by the engine. Without this feature an undesirable amount of

34
electrical noise would be created. This effect would interfere with sensor and DAQ
equipment, rendering the system inaccurate if not useless.
The data acquisition equipment was specified to meet the requirements of the
needs assessment. The equipment did not need to be designed, rather procured. The
DAQ software, LabVIEW, will be programmed next quarter, as part of the build-phase.
The controls and user-interface were designed to be intuitive and straightforward.
An engine speed control and variable load control must be incorporated into the final
system. They must be able to handle the use and abuse associated with student operated
laboratory equipment. The user-interface design includes both the LabVIEW display on
the system computer monitor as well as a visual tachometer and flow-meter.
A pre-fabricated industrial cart will be used as the backbone of the structure. The
system will be packaged to fit entirely on the cart.
6.1. Water Brake Impeller Design
The impeller is made of two separate pieces: the actual impeller, which is
machined out of 6061 aluminum, and the collar the impeller and the case rests on, which
is made out of steel. The design has two focus points: the radius of the impeller, and the
profile of the impeller blades. The radius of the design constrains the maximum power
the impeller can dissipate. The profile design determines the efficiency of the impeller.

35
6.1.1. Water Brake Impeller Radius
The design team needed to determine the optimized radius for the water brake
according to the needs assessment requirements. Using the following equation (Equation
6.1.1) the water brake can be designed to fit desired parameters.
QRTshaft ρω 22= Equation 6.1.1
In this equation, T shaft is the torque on the motor shaft; ω is the angular velocity of
the impeller; R2 is the radius of the impeller; ρ is the density of the fluid; and Q is the
mass flow rate of the fluid. By varying R2, different values for T shaft could be calculated
and used Equation 6.1.2:
shaftm TW ϖ=.
Equation 6.1.2
T shaft is the torque on the motor shaft; ω is the angular velocity of the impeller;
and Wm is the work done by the motor on the impeller. Optimizing the size of the
impeller, R2, was done for the given power rating of the Kohler engine, five horsepower.
The minimum radius requirement of the impeller design calls for a 2.75� radius in order
to completely absorb the engine output.
One requirement of the needs assessment addresses a flexible system. The water
brake impeller design justifies that size and character of the engine being loaded.
Increasing the impeller radius allows for seamless integration with the Kohler engine as
well as higher output power plants. Figure 6.1.1 shows the maximum power various size
impellers can absorb at 3600rpm. The Kohler Command engine produces maximum
output at 3600rpm.

36
Power vs. Impeller Diameter: Engine Speed 3600rpm
0
10
20
30
40
50
60
70
0 1 2 3 4 5 6 7 8
R2 (inches)
Wm
(HP)
Figure 6.1.1
The team decided on an impeller design with a radius of 6�. This size will allow a
maximum of 45HP at 3600rpm. These characteristics will allow the system to remain
flexible without having any negative effects on lower output engines such as the Kohler
Command.
The water brake impeller is directly connected to the output shaft of the engine.
As engine speed increases the water brake can effectively absorb an increasing amount of
energy. Figure 6.1.2 displays that a 6� radius impeller design is capable of absorbing
126HP at an engine speed of 6000rpm.

37
Power vs. Impeller Diameter: Engine Speed 6000rpm
0
20
40
60
80
100
120
140
160
180
200
0 1 2 3 4 5 6 7 8
R2 (inches)
Wm
(HP)
Figure 6.1.2
Figure 6.1.3 � Final Impeller Model

38
6.1.2. Water Brake Inertia Optimization
Ideally, since the dynamometer is to be used with the low output Kohler engine
inertia should be minimized. Since this engine only produces an approximate maximum
power of 5 horsepower the percent error caused by a massive water brake would render
the system inaccurate.
The inertia of the water brake impeller was calculated using a straight-edged
blade design. Later in this document the justification of the blade design will be
explained. Using this assumption the inertia of the impeller can be determined by
breaking up the impeller design in two geometric matrixes, a disc and a series of
rectangles. The disk is used to model the back of the impeller, while the blades are
assumed to be rectangles.
The volume of the disc can be found by:
hRRVdisc *)(* 12 −Π= (Equation 6.1.3)
Where R2 is the outer radius of the impeller, R1 is the inner radius of the impeller, and h
is the thickness.
The volume of the blades can be calculated using:
( ) NRRTWVblade *** 212 −= (Equation 6.1.4)
Where W is the blade width, T is the blade thickness, and N corresponds to the number of
blades.
Using the volumes of the disc and blades the mass of the impeller was
determined. The using the 6061 Aluminum density property of 0.102 lb/in^3 the mass is
equal to the quotient of the density and the total volume.

39
Once the mass was know the inertia of the impeller was calculated using Equation
6.5:
( )212**
21 RRmassI −= (Equation 6.1.5)
Figure 6.1.3 shows the relationship between impeller size and its inertia.
Impeller Radius vs. Inertia
0.0020.0040.0060.0080.00
100.00120.00140.00160.00
3 4 5 6 7 8 9 10Outer Radius (in)
Iner
tia (l
b*in
^2)
Figure 6.1.3
Using an impeller design size of 6 inches has a moment of inertia of 9.06 lb*in^2.
Compared to a 10 inch impeller with a moment of inertia of 135.88 lb*in^2, the 6 inch
design minimizes inertia while retaining a versatile power absorbing range.
These assumptions and calculations in the inertia analysis of the water brake were
simply used to steer the team in the correct direction of the design. The actual inertia of
the water break was found using a ProEngineer tool box to be 4.677lb*in^2. The
assumption to model the blades as rectangles is the reason for the error between actual
and calculated. This error does not affect the choice of impeller size since the error is
linear for all designs.

40
6.1.3. Profile of Impeller Blades
Before looking at the equations it is helpful to see the velocity diagram in Figure
6.1.4:
In the figure Vrb2 is the velocity relative to the blade, V is the absolute resolved
velocity, and U is the runner speed which can be found by using the Equation 6.1.6:
ϖrU = Equation 6.1.6
In this equation r is the radius of the impeller, and ω is the angular velocity. This
velocity diagram shows two unknowns; therefore an initial guess must be made at one of
the variables and then re-substituted iteratively into the equation. Translating the Vrb2
vector along the U vector, geometric laws can be used to simulate results. By using an
initial guess of Vrb2, and the law of cosines the absolute velocity can be modeled.
U2 = r2ω Vrb2
β2
V2Figure 6.1.4

41
The profile of the impeller blades will effectively determine the efficiency the
impeller operates as a pump, displacing fluid of a given rate at a design characteristic
velocity. The velocity relative to the blades will be known as Vrb2. The size of the
passages will be called b. The blade profile will determine the average velocity of the
fluid at both the inlet and outlet of the water brake. By varying the angle and profile of
the impeller blade, β, the velocity relative to the blade varies as shown in Figure 6.1.5:
Blade angle vs Vrb2: at 3600rpm
0
20
40
60
80
100
120
140
160
30 30.5 31 31.5 32 32.5 33 33.5 34Vrb2 (ft/s)
β (ο )
Figure 6.1.5
Analyzing the graph in figure 6.1.5, the relation between blade angle and relative velocity
can be seen. An obtuse angle relative to the spinning impeller direction produces a far

42
slower velocity than an acute blade angle. This graph demonstrates the flow
characteristics that the team used as a basis for the design calculations and assumptions.
Figure 6.1.6 graphically represents the specific speed values associated with
various impeller blade designs.
(Figure 6.1.6)
The profile of the impeller blade affects the specific speed of the absorber. Due to
machining ability and reproduction concerns the simplest profile was chosen; a blade
angle of 90 degrees with a straight vane. The design team made this assumption knowing
that measures must be taken in order to compensate for not using the most efficient
design.
The specific speed is used in Equation 6.1.7:
34
21
111
=
scuNQH ω Equation 6.1.7
In this equation H represents head, ω is the angular velocity, Q is the mass flow
rate of the fluid, and Nscu is the specific speed of the impeller. By using 500 as the
specific speed a head value of 4.76 ft was determined.

43
Next the power of the fluid needed to be calculated. This energy was found using
Equation 6.1.8:
waterfluid gQHP ρ= Equation 6.1.8
In this equation Pfluid is the power of the fluid, g is the constant of gravity, Q is the
mass flow rate of the fluid, H is the head, and ρwater is the density of the fluid, which in
this case is water. The power of the fluid was calculated to be 0.00135 in units of
horsepower for the given specific speed. Figure 6.7 compares various specific speeds
associated with different impeller designs.
The efficiency of the impeller can be determined. This was calculated by using
Equation 6.1.9:
00100×=
mech
fluid
PP
η Equation 6.1.9
In this equation η is the efficiency, Pfluid is the power of the fluid, and Pmech is the power
of the engine supplied by the shaft.

44
Figure 6.1.7 compares various specific speeds associated with different impeller designs.
Impeller Efficiency at 3600rpm
0
0.005
0.01
0.015
0.02
0.025
0.03
0 500 1000 1500 2000 2500
Nscu
ηFigure 6.1.7
The graph clearly shows that the specific speed associated with a straight impeller blade
is the worst choice when compared to the 2000 specific speed associated with a Francis
vane style impeller. Continuing with the assumption previously mentioned, although the
blade geometry is not optimized, the size geometry is. If the team were to use a curved
profile the same results of power absorption could be achieved in a smaller package.
The water brake characteristic design is to become a very inefficient pump. The
purpose of the device is to absorb energy. This is the reason for such low efficiency. In a
dynamometer, the lower the efficiency of the water brake, the better the design.

45
6.1.4. Water Brake Impeller Design Conclusion
The final impeller design the team has a 6 inch outer diameter. The twelve vanes
on each side of the impeller are of a straight design. A single vane extends 0.515 inches
and measure 0.19 inches thick. After the calculations and data gathered from the analysis
the team is confident this design will exceed all expectations of performance. Figure 6.8
is a drawing of the final impeller design.
6.2. Water Brake Casing Design
The casing of the water brake must be manufactured out of a readily available,
inexpensive and easily machinable metal. From these criteria, 6061 aluminum was
chosen. The casing is easily manufactured using an engine lathe. Its purpose is to contain
the water and impeller during dynamometer operation. The bearings that the impeller run
on are installed into the casing as well are the shaft seals. In order to get water into and
out of the case, there are two fittings. One for the inlet which will accommodate a
common garden hose and the other for the outlet. A small vent hole is also added to help
the water brake drain after a power run. The radial bolt circle will seal the outer edge.
The casing of the water brake must remain stationary because it is how the torque is
transmitted from the impeller to the torque arm. In order to accommodate this, an adaptor
shaft was designed to allow the impeller to turn and the casing to remain stationary. The
shaft will be press fit into the impeller and bored to fit the output shaft on the engine.
Two countersunk holes will also be added to one end to accommodate magnets for the

46
Hall-effect sensor (for RPM measurement). Because it is a bearing race and a shaft seal
race, it will be made out of mild steel and will be ground.
The bearings chosen are standard deep-groove ball bearings. They offer good
reliability, are readily available and are inexpensive. The shaft seals are single lip design
with an integral garter spring to make them self adjusting to wear.
The inlet and outlet passages were analyzed using centrifugal pump equations
obtained in the Introduction to Fluid Mechanics textbook. The inlet passage delivered the
fluid normal to the blades of the impeller, and the outlet passage allowed fluid to leave
the impeller tangentially. The diameters of both passages were found by using the
following equation (equation 6.2.1) was used:
22
2 2 rbVRQb
π= Equation 6.2.1
In this equation b2 is the diameter of the passage; Q is the mass flow rate of the fluid, R2 is
the radius of the impeller at the passage point, and Vrb2 is the velocity relative to the blade.
For the inlet passage Vrb2 was found graphically by using an iterative method and using
30 (ft/s) as an initial guess the results can be found in (fig. 6.2.1). These values for Vrb2
were then substituted into equation 6.2.1 to find the corresponding values of b. During
this analysis though b seemed to result in vary small values as can be seen in table in the
appendix. This makes sense however for such large Vrb2 values minimizing the outlet
hole would be preferable. Due to machining purposes b was decided to be increase, also
maximizing Vrb2 is not an important design point so figure 6.2.2 was created to analyze
the effect of varying b on Vrb2. This makes sense; as you limit the area fluid has to
escape the passage would act like a nozzle. The value of 1� was decided upon for
pragmatic reasons. This was done for both passages inlet and outlet.

47
Vrb (ft/s) vs. b (for β= 90o)
0.000338
0.00034
0.000342
0.000344
0.000346
0.000348
0.00035
0.000352
0.000354
0.000356
0.000358
30.6 30.8 31 31.2 31.4 31.6 31.8 32 32.2 32.4
Vrb
bFigure 6.2.1

48
Vrb (ft/s) vs. b (for β= 90o)
0.000338
0.00034
0.000342
0.000344
0.000346
0.000348
0.00035
0.000352
0.000354
0.000356
0.000358
30.6 30.8 31 31.2 31.4 31.6 31.8 32 32.2 32.4
Vrb
b
Figure 6.2.1
Figure 6.2.2 � Water Brake Model Exploded View

49
6.3. Torque Arm Design
The purpose of a torque arm is to, as its name implies, measure torque. This is done
by mounting a strain gage to the surface of the torque arm near the impeller housing. As
the impeller turns, it churns the water inside the casing. The more water inside the casing
and/or the faster the engine turns, the greater the braking force exerted on the engine.
Viscous friction inside the housing will cause it to rotate, and by having an arm mounted
to the housing that in turn presses against a hard stop at its free end, an internal moment
in the arm is produced. A strain gage is mounted to the surface of the arm at a location
closest to the housing (where the internal moment will be the greatest) and by measuring
this strain, the user can back-calculate the torque being exerted by the engine.
The calculations involved taking the maximum output torque of the engine and
determining the corresponding distance/force combinations of the arm. Once this was
done, several cross-sectional dimension combinations were chosen to analyze and the
respective moments of inertia were calculated. Aluminum was chosen for the material of
the arm for its low weight, relatively low cost (for the sizes required), and good metal
working properties. Max Compressive and Tensile Bending Stresses were calculated
next, at which point the Maximum Deflection and Maximum Slope of each arm were
found. While the slope calculation was performed more of as an exercise, the deflection
calculation was the important one since it was critical to know if the deflection of the
chosen cross-sections would be too large or too small. The ½� x ½� x 16.4� bar was
chosen since it is small enough to allow for visible deflections but not so much so that the

50
bending stresses would be too high. In addition, it was desirable to have the arm not
exceed the width of the cart on which everything is mounted.
The last necessary computation was determining strain, and Equation 6.3.1 was
used was for the case of uniaxial strain:
σ = Eε (Equation 6.3.1)
Where σ = bending stress, E = elastic modulus, and ε = strain. This is the value that will
be read directly from the strain gage on the completed dynamometer. Since the elastic
modulus for the material of the arm is known, one can then calculate the resulting
bending stress. From here, the bending stress formula, Equation 6.3.1
σ = Mc/I (Equation 6.3.2)
is used in the form M = σI/c. The moment of inertia, I, and distance from neutral axis to
surface, c, can be calculated and measured, respectively, at which point the moment may
be calculated. All calculations can be found in the appendix of this document.
6.4. Motor Mounting Design and Setup
The Kohler motor to be used with the engine dynamometer test cell vibrates when
running. This means that when the motor is attached to the cart we plan to use the
vibrations will be transmitted throughout the cart and into other components. These
vibrations have to be considered because the amplitudes of the transmitted forces can
easily cause damage and may lead to failure of DAQ equipment, sensor, computer or any
other device attached the cart.

51
The problem was analyzed as a single degree of freedom, and the motor was
modeled as a mass with a harmonic force = Fcos(ωt). The cart was modeled as a mass
that was supported by a spring with very high stiffness and a deflection of zero.
Essentially the cart is a fixed mounting surface for the motor with the very high spring
rate.
This in mind, the motor needs to be isolated so there is very little to no vibration
forces transmitted to the cart. Ideally, the engine needs to sit on a cushion of air, which
would transmit no vibrations. The design calls for a spring/damper mount that is very
soft and can absorb large shocks.
After an effort to solve the problem it was seen that an analytical solution may be
very difficult to find. The team did not have enough information on the engine to
calculate the eccentric mass. This eccentric mass causes an imbalance in the rotating
assembly of the engine. This imbalance is the harmonic force that is transmitted. Also,
measuring the transmitted force of the engine could have been done with equipment in
the Vibrations Lab but due lack of time and experience with lab equipment this was not
an option.
The problem was then discussed with Dr. Kochersberger, a vibrations professor at
RIT. His expertise suggested avoiding analyzing the vibrations problem due to its
complexity. With the nature of use of a dynamometer, the engine will be constantly run
at different speeds with varying loads. This creates an infinite range of calculations and
measuring. These constantly changing conditions make it extremely difficult to find an
ideal spring/damper motor mount. Dr. Kochersberger recommended searching machine
components suppliers to see what is available and most effective.

52
McMaster (www.McMaster.com) has a wide range of spring/damper mounts for
motors. After searching the site, a mount was found under the �Vibration Damping
Mounts� sections in their online catalogue (pp.1218). The �Vibration Damping Mounts�
are described to isolate vibration, shock, and noise transmitted from machinery. On
pp.1223 of their online catalogue, �Steel Spring-Action Mounts� appear to be the best
solution to isolate engine vibrations. They are designed for high deflections and are
claimed to provide the best vibration, shock, and noise isolation. The mount chosen for
this project can handle a 60lb load with a deflection of 1.3in. This mount has a spring
rate of 46.2lb/in and there will be four of them to support the engine.
Figure 6.4.1 shows the specifications of the mount design to be used.
Compression
Flange
Deflection Flange Hole Hole
Thread @ Max. Load (A) (B) (D) (E)� Ctr. to Ctr. Dia.*
3/8"-16 1.3" 3 3/8" 5 7/8" 2 3/8" 3" 5" 7/16" 6219K83 $30.17
3/8"-16 1.3" 3 3/8" 5 7/8" 2 3/8" 3" 5" 7/16" 6219K84 30.17
3/8"-16 1.2" 3 3/8" 5 7/8" 2 3/8" 3" 5" 7/16" 6219K85 30.17
3/8"-16 1.0" 3 3/8" 5 7/8" 2 3/8" 3" 5" 7/16" 6219K86 30.17
3/8"-16 0.8" 3 3/8" 5 7/8" 2 3/8" 3" 5" 7/16" 6219K87 30.17
3/8"-16 0.5" 3 3/8" 5 7/8" 2 3/8" 3" 5" 7/16" 6219K88 32.98
3/8"-16 0.5" 3 3/8" 5 7/8" 2 3/8" 3" 5" 7/16" 6219K89 35.44
1/2"-13 1.02" 5 1/4" 7 3/4" 3" 3 1/2" 6 1/2" 5/8" 6219K91 43.60
1/2"-13 0.83" 5 1/4" 7 3/4" 3" 3 1/2" 6 1/2" 5/8" 6219K92 48.09
1/2"-13 0.74" 5 1/4" 7 3/4" 3" 3 1/2" 6 1/2" 5/8" 6219K93 48.09
1/2"-13 0.70" 5 1/4" 7 3/4" 3" 3 1/2" 6 1/2" 5/8" 6219K94 50.33
1300
1500�Bolt length. * Flange hole is slotted.
Steel Spring-Action Mounts High-deflection mounts provide the best vibration, shock, and noise isolation for slow-operating machines (machinery operating at speeds as low as 500 rpm). The upper and lower cast iron housings keep the steel spring contained and help prevent horizontal movement of the mount. Neoprene between the housings prevents metal-to-metal contact, while a neoprene pad bonded to the base plate provides additional resistance to movement. These mounts also provide leveling capabilities (for best results, adjust leveling bolt so that upper housing is 1/4"- 1/2" above the top of the lower housing). Mounts are furnished with a mounting bolt and nut. Temperature range is -40° to +160° F.
450
700
900
1100
100
165
260
370
lbs. Each
60
Max.
Load,
(Figure 6.4.1) Source: www.mcmaster.com, page 1223 online catalogue
In the design facet of this project an experiment will be conducted to ensure these
specified mounts effectively isolate the vibration of the engine. This experiment will
place the engine and mounts on a surface similar to the final mounting platform and

53
measure for any transmitted vibrations. If a problem exists a vibrations analysis will be
required to determine the corrective actions the team needs to make.
6.5. Sensor Placement and Mounting Pressure sensors will be mounted and placed in the engine to measure intake
pressure and combustion pressure. Measuring intake pressure will be done by locating a
pressure transducer in the intake runner. A hole will be drilled and tapped for the size of
the transducer to screw it in just after the carburetor. The location of the hole is easy to
access along with plenty of material to work with. The pressure transducer for measuring
combustion pressure will be located in the cylinder head next to the spark plug. Again, a
hole will be drilled and tapped to the size of the transducer where there is plenty of
material to mount the transducer while leaving easy access. The combustion pressure
transducer will not interfere with valves, spark plug, piston, and cooling fins. Figure
6.5.1 depicts the approximate position of the in-cylinder pressure transducer.

54
(Figure 6.5.1)
Type-K thermocouples will be mounted in the engine to measure temperatures of
oil, intake and exhaust. The oil temperature sensor will be placed in a drain plug in the
bottom of the crank case that is not used for anything. A hole will be drilled and the
thermocouple will be mounted in the plug with a high-temperature epoxy. Both intake
and exhaust thermocouples will be mounted in the intake runner and exhaust pipe by
drilling hole and sealing them with an epoxy.
The engine�s air flow will be measured with an air flow meter and Mass-Air-Flow
(MAF) sensor. This will be done by modifying the air flow meter pipe and the engine�s
air cleaner so they can be attached or detached if needed. Within the air cleaner the MAF
sensor will be mounted with a small bracket so as to not disturb air flow into the engine.
An Oxygen (O2) sensor and Hydro-Carbon sensor will be mounted in the exhaust
pipe to tell what air-fuel ratio the engine is running at and the amount of Hydro-Carbons
going out the tale pipe. To do this, the exhaust pipe will have a hole drilled and a
threaded bung will be welded in place. With the bung welded in place the O2 sensor can
easily be screwed in and tightened down. The Hydro-Carbon sensor will be mounted
inside the exhaust pipe or muffler.
Measuring engine speed (RPM) will be done using a Hall-Effect sensor. The
Hall-Effect sensor consists of small magnets and a pick-up sensor. The collar on the
water brake will have four equally spaced counter-bores drilled. The magnets will be
pressed into the counter bores. The pick-up sensor for the Hall-Effect will be mounted to
the case of the water brake near the rotating collar where the magnets are.

55
To measure torque from the engine a torque arm will be used with a strain gauge.
The torque arm is attached near the center of the water brake housing and the other end
rests on a stop. The strain gage will be attached to the end of the torque arm that is
secured to the water brake housing.
6.6. Data Acquisition Design and Setup
The DAQ for the pilot production dynamometer system is to be provided by the
Kate Gleason College of Engineering. Currently RIT owns a number of DAQ carts for
coursework and research. These carts meet and exceed all requirements of the needs
assessment and data collection. The equipment is all National Instruments brand. Figure
6.6.1 shows the equipment included on the cart, to be used by the team.
DAQ Multifunction DAQ PCI Card
Rack Mounted Terminal Accys
Rack Mounted Terminal Accys
Rack Mounted Terminal Accys
Chassis Strain Gauge Input Module Isolation Amplifier Signal Conditioning Module Feedthrough Panel Multiplexer Input Module Thermocouple Input Module
(Figure 6.6.1)
The team will use the thermocouple input module to record the intake, exhaust, and
engine temperatures. The strain gauge input module will record torque output of the
engine. The pressure transducers, Hall-Effect sensor, oxygen sensor, mass air flow

56
sensor, and emissions equipment will all be directed into the DAQ system through the
rack mounted terminals.
Also included in the cart setup is a desktop computer running National
Instrument�s LabVIEW software. The focus of the DAQ portion of the senior design
team will be to construct a program within LabVIEW to interpret all the readings from
the system sensors. Preliminary goals of the design process, consulting with RIT and
National Instruments staff, have ensured that the DAQ system is capable of these
requirements. During the next phase of the design process all programming will be
implemented.
The main goals of the DAQ software interface include:
• Obtaining all required measurements as addressed in the needs assessment
and project specifications.
• Creating an output file of data that can easily be analyzed and interpreted
by the user. This will most likely be a Microsoft Excel spreadsheet.
• Build a graphical-user-interface.
Design work is straight forward. The sensors plug into the DAQ equipment, and
then need to be calibrated according to manufacturer requirements. The calibration can
be done using the LabVIEW software or a basic voltmeter and ammeter. The sensors
output either a voltage or current reading. The DAQ equipment measures these outputs
and the LabVIEW software program interprets these readings into measurements.

57
6.7. Controls and User-Interface Design The needs assessment requires the dynamometer system to be easily operated and
intuitive to its users. The main user-interface will be the DAQ computer and the
LabVIEW graphical user interface, GUI. The GUI will display on screen virtual gauges.
These gauges will show current characteristics of the engine and dynamometer including;
engine speed, engine torque and power, intake and exhaust temperature, engine oil
temperature, air-fuel ratio, and emissions hydrocarbon concentration.
Starting up the entire dynamometer system will include powering up all electronic
equipment, turning on the flow into the water brake at the tap, and starting the engine.
The electronic equipment will be started by plugging the DAQ cart into a
conventional 120VAC outlet and turning on the computer and DAQ equipment. A valve
will start and stop the water flow into the system. A globe valve, downstream the main
valve and before the water brake inlet, will be used to control load placed on the engine
by the dynamometer. The engine will be pull started by the user.
Operating the dynamometer system will involve varying engine speed, water
brake load, and recording data.
The engine speed will be controlled by a push-pull cable and lever assembly.
This system will be connected to the Kohler engine throttle. The Kohler engine throttle is
outfitted with a torsion return spring; this design automatically closed the throttle when
there is no external force applied. As the lever is pulled and pushed the throttle will open
and close changing engine speed.
The dynamometer load is controlled by regulating the amount of fluid allowed
into the water brake. A globe valve allows more fine tuning control than a convention

58
gate valve. Closing the globe valve will reduce the amount of load; a fully open valve
will produce maximum loading conditions.
The throttle push-pull assembly and globe valve will be mounted next to one
another to allow safety and ease of operation.
Data logging will be triggered using the LabVIEW GUI and computer. Using the
computer mouse to click an on-screen button will begin data collection.
A Visual Flow-meter will provide a visible arbitrary gauge. This will be mounted
to show the air flow into the Kohler engine. As the engine speed and dynamometer
change the flow meter will visually illustrate the dynamics processes. The gauge is
simply a cylinder encasing a floating sphere. As the flow increases the sphere rises in the
cylinder.
6.8. Structure and Assembly The entire dynamometer system is to be mounted on to a procured cart. The
engine, water brake, computer system, and DAQ will be place on the mobile cart.
The Kohler engine will be mounted to the cart using the vibration damping
mounts. The mounts will be secured directly to the cart surface.
The engine drive shaft will be drilled and tapped in order to provide a mounting
point for the water brake assembly. The dynamometer will utilize a hollow collar
cylinder to mount to the engine drive shaft. The impeller will be press-fit onto the collar.
The collar will then pass through the casing bearings and oil seals allowing the impeller

59
to freely spin within the casing. The collar and water brake assembly will be bolted to
the drilled and tapped engine drive shaft.
The collar will protrude from the water brake and allow a mounting point for the
magnets to be used be the Hall-Effect sensor. The actual sensor will be mounted fixed on
the casing and measure the engine speed off the spinning collar.
The torque arm will be bolted to the outside of the water brake casing. The arm
will rest on a stop to prevent the dynamometer from rotating under load.
For the pilot production, the RIT provided DAQ system will remain on its original
cart, even though the dynamometer system has space available. Since the DAQ system
may have other future uses it will remain separate for flexibility.
The throttle will be mounted to the top surface of the cart. The load controlling
globe valve will mount in a hole next to the throttle.
Figure 6.8.1 � Assembly Model

60
7. Budget Part Name Part Number Material Quantity Vendor Vendor Part Number Price Line PriceImpeller Dyn-001 Aluminum 0.2 Yard $120.00 $24.00Collar Dyn-002 Mild Steel 1 Yard $2.00 $2.00Ball Bearing Dyn-004 Steel 2 McMaster 60355K82 $10.77 $21.54Oil Seal Dyn-005 Steel 2 Chicago Rawhide 12577 CRW1 $7.00 $14.00Cart Dyn-006 Steel 1 McMaster 2892T54 $380.00 $380.00Casing Dyn-007 Aluminum 0.25 Yard $120.00 $30.00Back Plate Dyn-008 Aluminum 0.05 Yard $120.00 $6.00Torque Arm Stop Dyn-009 Steel 1 Yard $1.00 $1.00Engine Mount Dyn-010 Rubber & Cast Iron 4 McMaster 6219k83 $30.17 $120.68Torque Arm Dyn-011 Aluminum 1 Yard $12.00 $12.00Tachometer Sensor Bracket Dyn-012 Aluminum 1 Yard $1.00 $1.00Thermocouple (J) Dyn-201 1 (5 Pack) Superlogics TC-61XJBEX36A $60.20 $60.20Thermocouple (K) Dyn-202 1 (5 Pack) Superlogics TC-61XKBEX72A $44.00 $44.00In Cylinder Pressure Transducer Dyn-203 1 Optrand PSI Plug 3ksi $645.00 $645.00Pressure Transducer Dyn-204 1 Superlogics Press-ICP-101A02 $475.00 $475.00MAF Sensor Dyn-205 1 TSI Flowmeters 4226-01-02 $245.00 $245.00MAF Cable Dyn-206 1 TSI Flowmeters 4225/4226/4235-x-x $19.00 $19.00Strain Gauge Dyn-207 1 Superlogics Strain-ICP-740B02 $195.00 $195.00Hall Effect Sensor Dyn-208 1 Radio Shack 276-1646 $2.00 $2.00Rare Earth Magnets Dyn-209 2 Radio Shack 64-1895 $2.00 $4.00Wideband Oxygen Sensor Dyn-210 1 OxygenSensor.net 36531-P07-003 $195.00 $195.00Hydrocarbon Sensor Dyn-211 1 Thermo-Electro FX-IR-67-0022-01 $1,380.00 $1,380.00Multifunction DAQ PCI Card Dyn-301 1 National Instruments NI-PCI-6052E $1,595.00 $1,595.00Rack Mounted Terminal Accys Dyn-302 1 National Instruments NI-TC-2095 $395.00 $395.00Rack Mounted Terminal Accys Dyn-303 1 National Instruments NI-BNC-2095 $395.00 $395.00Rack Mounted Terminal Accys Dyn-304 1 National Instruments NI-BNC-2090 $395.00 $395.00Chassis Dyn-305 1 National Instruments NI-SCXI-1001 $1,595.00 $1,595.00Strain Gauge Input Module Dyn-306 1 National Instruments NI-SCXI-1520 $2,295.00 $2,295.00Isolation Amplifier Dyn-307 1 National Instruments NI-SCXI-1125 $1,395.00 $1,395.00Signal Conditioning Module Dyn-308 1 National Instruments NI-SCXI-1531 $2,295.00 $2,295.00Feedthrough Panel Dyn-309 1 National Instruments NI-SCXI-1180 $95.00 $95.00Multiplexer Input Module Dyn-310 1 National Instruments NI-SCXI-1104 $1,295.00 $1,295.00Thermocouple Input Module Dyn-311 1 National Instruments NI-SCXI-1102 $1,295.00 $1,295.00Muffler Casing Dyn-901 1 Supertrapp 317-0875 $33.55 $33.55Muffler Core Dyn-902 1 Supertrapp 310-0400 $50.35 $50.35Push-Pull Cable Dyn-903 1 McMaster 3125K44 $25.55 $25.55Push-Pull Cable Lever Dyn-904 1 McMaster 1373K13 $33.25 $33.25Globe Valve Dyn-905 1 McMaster 4600K14 $28.00 $28.00Hose Dyn-906 1 McMaster 5683K97 $32.09 $32.09Fittings Dyn-907 1 Home Depot $10.00 $10.00Fasteners Dyn-908 1 Home Depot $10.00 $10.00Gas Tank Dyn-909 1 Kohler Command 5 Fuel Tank $44.95 $44.95
Total $17,189.16Total minus RIT Freebies $4,144.16

61
8. Future Plans At this point the senior design team has completed the first six facets of the
automotive laboratory development project. The team is now ready to begin building,
assembling, and experimentation of the open-loop water brake dynamometer system.
All machining and assembly will be conducted in-house using the RIT machine
shop facilities. All work will be conducted by team members eliminating cost of hired
machinists and labor. As soon as the raw material is in stock and accounted for, all
required machining can begin immediately.
Preliminary testing must be done concerning the vibration mounting of the
engine. This experiment will verify proof-of-concept for the design specified motor
mounts. The Kohler engine will be mounted on a scrap piece of material similar to the
cart mounting surface using the intended engine mounts. In order to pass this test the
mounts must effectively isolate the motor vibrations from the mounting surface. Upon
graduation from this experiment, the engine and motor mounts can be assembled onto to
the cart. This is a key step since the rest of the dynamometer assembly depends on the
engine being mounted.
Software programming of LabVIEW can begin immediately. The first task of the
DAQ team is to setup the system to record the outputs from the system sensors. Upon
completion the sensors will be calibrated prior to mounting. After calibration the GUI
will be constructed.
Before sensor mounting, all necessary machining required for mounting can be
completed. The cylinder head will be drilled and tapped for the pressure transducer
mount. The intake and exhaust will be modified to accept respective thermocouples. The

62
mass air flow sensor will need be mounted prior to the intake. The exhaust will be fitted
with a sound deadening muffler, oxygen sensor, and emissions equipment. During this
work the engine driveshaft can be drilled and tapped for mounting of the water brake.
After calibration of the sensors, mounting will begin. Once placed, an experiment
will connect the sensors to the DAQ to check function of both systems.
Final assembly will entail mounting of all hardware and controls. This is the last
step in the build process.
A final experiment will be run with the entire assembly. The dynamometer
system will be used to conduct the experiment carried out in the Thermal Fluids
Laboratory class offered by the department of mechanical engineering. Accurately
completing this experiment along with addressing all product specifications in this report
will declare the design successful.
An operational and maintenance manual will be created. This document will be
used to address questions by future users.
The design package, experimentation results, and manual will provide adequate
knowledge for replication and future use of the dynamometer system.

63
8.1. Schedule A schedule has been developed for the RIT spring quarter, 20033. This timeline
will keep the team on target to complete all project goals.
March April MayTasks 8 15 22 29 5 12 19 26 3 10Procure Raw MaterialsCollect sensors and FittingsLabVIEW programmingPriliminary Engine Vibrations ExperimentSensor CalibrationWater Brake MachiningSensor MountingFinal AssemblyFinal Experiment and TestingCreate maintenance and operation manualCDRTechnical Documentation
9. Conclusion
The team has completed the first five processes of design this quarter. These
processes included needs assessment, project objectives and specifications, concept
development, feasibility assessment, analysis and synthesis of the design, and the
preliminary design.
The proposed design will be cost effective, more sensitive to the needs of the
instructors conducting the labs, and more sensitive to the students trying to participate in
the labs. The goal is to produce a working dynamometer that is both visual and practical.
It also needs to be safe, user friendly, and robust, however it still needs to be accurate and
give a good representation of the motor characteristics.

64
By developing four concepts and assessing their feasibility the concept that would
best support these features was found. These concepts included; an open � loop water
brake dynamometer, a closed � loop water brake dynamometer, a resistive load electric
generator dynamometer, and a mechanical brake dynamometer. Even though each
concept proved not to be completely unfeasible the open � loop water brake design was
decided to be the best given the mechanical nature of the design, the budget provided,
and the outcome of the feasibility assessment.
Many parameters were analyzed for the water brake. An FEA analysis was
completed on the casing of the water brake, along with calculations on the diameter of the
outlet passageway. The diameter of the impeller was taken into consideration, along with
the profile and thickness of the impeller blade. A stress analysis was completed on the
torque arm. This was done to ensure that the design would meet the set requirements.
By the end of spring quarter the team hopes to have fabricated and assembled a
functioning dynamometer, located and placed all needed sensors on the engine, and
properly programmed every output from the sensors into LabVIEW. The team will test
to make sure that the dynamometer properly loads the engine while all the sensors are
taking accurate readings. The team will also design some sample laboratory experiments
to show the abilities and the limitations of the dynamometer.

65
10. References Fox, Robert W., McDonald, Alan T. Introduction to Fluid Mechanics, 5th Edition. New York: John Wiley & Sons, Inc. Hensel, Edward. Personal Interview. 21 Jan. 2004. Juvinall, Robert C., Marshek, Kurt M. Fundamentals of Machine Component Design, 3rd Edition. New York: John Wiley & Sons, Inc. Kempski, Mark. Personal Interview. 19 Jan. 2004. Kochersberger, Kevin. Personal Interview. 16 Feb. 2004. Mc Nally, William. �All about specific speed 7-3�, http://www.mcnallyinstitute.com//07-html/7-03.html Moran, Michael J., Shapiro, Howard N. (2000). Fundamental of Engineering Thermodynamics, 4th Edition. New York: John Wiley & Sons, Inc. Pulkrabek, Willard W. Engineering Fundamentals of the Internal Combustion Engine, 1st Edition. New York: Prentice Hall. Sciremammano, Frank. Personal Interview. 29 Jan. 2004. Steinke, Mark. Personal Interview. 17 Dec. 2003. Wellin, John. Personal Interview. 21 Jan. 2004.

66
11. Appendix
A. Feasibility Assessment Scores and Radar Chart B. Impeller Calculations and Graphs C. Torque Arm Calculations D. Impeller and Casing FEA results E. Bearing Fatigue Life F. Drawing Package

67
A. Feasibility Assessment Scores and Radar Chart
R1 R2 E1 E2 S1 S2 S3 T1 T2 P1 P2Base Line: Water Brake Open Loop 2 2 2 2 2 2 2 2 2 2 2Water Brake Closed Loop 2 2 2 1 1 2 2 1 2 2 3Electro Generator 1 2 2 1 1 2 2 1 1 1 1Mechanical Brake 2 2 3 2 2 2 2 2 1 2 1
Feasibility Assessment
0
1
2
3R1
R2
E1
E2
S1
S2S3
T1
T2
P1
P2
P3
Base Line: Water BrakeOpen LoopWater Brake Closed Loop
Electro Generator
Mechanical Brake

68
B. Impeller Calculations and Graphs Constants
ω = 3600 RPMρ = 1.46 slug/ft3
Q = 1.5 GPMU = 35 ft/s

69
Impeller DiameterR2 (in) Tshaft (ft*lbf) Wm (hp)
1 1.8395957 1.260931.25 2.8743683 1.9702021.5 4.1390903 2.837091
1.75 5.6337618 3.8615972 7.3583828 5.043718
2.25 9.3129532 6.3834562.5 11.497473 7.88081
2.75 13.911942 9.535783 16.556361 11.34837
3.25 19.43073 13.318573.5 22.535047 15.44639
3.75 25.869315 17.731824 29.433531 20.17487
4.25 33.227697 22.775544.5 37.251813 25.53382
4.75 41.505878 28.449725 45.989892 31.52324
5.25 50.703856 34.754375.5 55.64777 38.14312
5.75 60.821633 41.689486 66.225445 45.39346
6.25 71.859207 49.255066.5 77.722918 53.27427
6.75 83.816579 57.45117 90.140189 61.78555
ResultsR2 (in) 7 61.78555
Blade angle vs. DiameterVrb (ft/s) 33.564933 initial guess
β (ο) V2 (ft/s)2 Vrb (ft/s)30 82.118232 33.5649335 110.80354 33.5711640 143.75434 33.5276145 180.9079 33.4505850 222.19352 33.3555 267.53258 33.2322760 316.8388 33.1017265 370.01831 32.9613670 426.96988 32.8133975 487.58511 32.6594480 551.7486 32.5007785 619.33822 32.3383790 690.22531 32.1730295 764.27492 32.00538
100 841.34611 31.83596105 921.29217 31.66524110 1003.9609 31.49361115 1089.195 31.32142120 1176.8321 31.14896125 1266.7054 30.97652130 1358.644 30.80435135 1452.4727 30.63268140 1548.0129 30.46173145 1645.0828 30.2917
Resultsβ (ο) 90 Max
Vrb (ft/s) 32.173024 33.57116
Vrb (ft/s) vs. b (for β= 90o)Initial guess @ 90o
Vrb (ft/s) Vrb (ft/s) b (in)30 30.768902 0.000356
31.098384 31.263147 0.0003531.791743 31.544353 0.00034732.239901 31.714612 0.00034532.542257 31.824792 0.00034432.753464 31.899663 0.00034332.909578 31.953956 0.00034233.02943 31.995057 0.000342
33.121101 32.026167 0.00034233.191032 32.049713 0.000341
33.2485 32.068944 0.00034133.298189 32.085488 0.00034133.341121 32.099721 0.00034133.378194 32.111966 0.00034133.410193 32.122502 0.00034133.437799 32.131566 0.00034133.461609 32.139366 0.0003433.482137 32.146078 0.0003433.499833 32.151854 0.0003433.515084 32.156824 0.0003433.528224 32.161101 0.0003433.539546 32.164783 0.0003433.549298 32.167951 0.0003433.557698 32.170677 0.0003433.564933 32.173024 0.00034
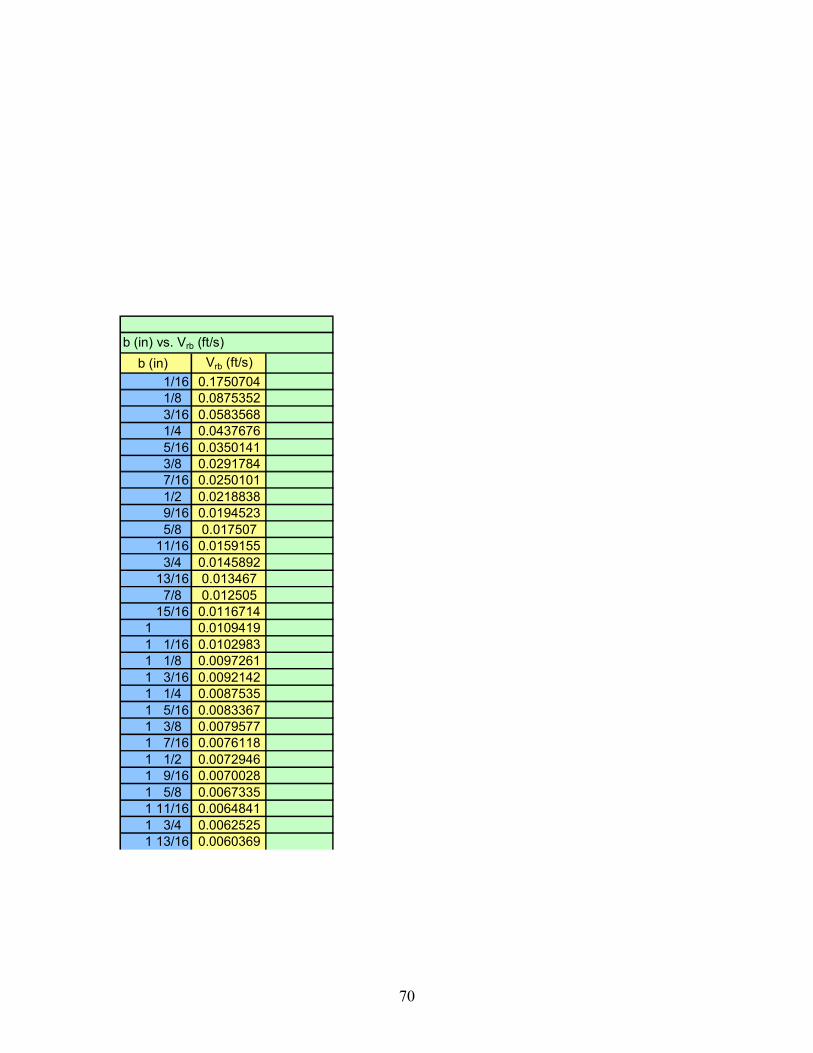
70
b (in) vs. Vrb (ft/s)b (in) Vrb (ft/s)
1/16 0.17507041/8 0.08753523/16 0.05835681/4 0.04376765/16 0.03501413/8 0.02917847/16 0.02501011/2 0.02188389/16 0.01945235/8 0.017507
11/16 0.01591553/4 0.0145892
13/16 0.0134677/8 0.012505
15/16 0.01167141 0.01094191 1/16 0.01029831 1/8 0.00972611 3/16 0.00921421 1/4 0.00875351 5/16 0.00833671 3/8 0.00795771 7/16 0.00761181 1/2 0.00729461 9/16 0.00700281 5/8 0.00673351 11/16 0.00648411 3/4 0.00625251 13/16 0.0060369

71
Power vs. Impeller Diameter: Engine Speed 3600rpm
0
10
20
30
40
50
60
70
0 1 2 3 4 5 6 7 8R2 (inches)
Wm
(HP)
Blade angle vs Vrb2: at 3600rpm
0
20
40
60
80
100
120
140
160
30 30.5 31 31.5 32 32.5 33 33.5 34Vrb2 (ft/s)
β (ο )

72
Vrb (ft/s) vs. b (for β= 90o)
0.000338
0.00034
0.000342
0.000344
0.000346
0.000348
0.00035
0.000352
0.000354
0.000356
0.000358
30.6 30.8 31 31.2 31.4 31.6 31.8 32 32.2 32.4Vrb
b
b (in) vs. Vrb (ft/s)
0
0.02
0.04
0.06
0.08
0.1
0.12
0.14
0.16
0.18
0.2
0 1/5 2/5 3/5 4/5 1 1 1/5 1 2/5 1 3/5 1 4/5 2
b
Vrb

73
Impeller Efficiency at 3600rpm
0
0.005
0.01
0.015
0.02
0.025
0.03
0 500 1000 1500 2000 2500
Nscu
η

74
C. Torque Arm Calculations
Force
ft-lbf in-lbf in ft 3.35 lbf b h in4
8.4 100.8 6 0.5 2.7 16.8 0.5 0.5 0.005212 1.0 8.7 8.4 1 1 0.083318 1.5 14.7 5.624 2.0 20.7 4.230 2.5 26.7 3.436 3.0 32.7 2.842 3.5 38.7 2.448 4.0 44.7 2.1
Output Torque
Possible combinations of Torque Arm parameters to counteract this
torque
Note: This is the length measured from center of output shaft to location of
applied force.
Arm Dimensions, inchesLength
Note: See Drawing.
Distance from center of first hole to end of arm, inches
Moment of Inertia, Ix = 1/12*b*h3
Note: Neutral Axis is in the center of the bar because the bar is a symmetrical shape.
E = 10000 ksi
ctop cbottomMax Tensile
(top)Max Compressive
(bottom)inches inches psi psi rad degrees rad degrees0.25 -0.25 4838.4 -4838.4 0.0011 0.065 0.00007 0.00410.5 -0.5 604.8 -604.8 0.0060 0.346 0.00038 0.0216
0.0115 0.661 0.00072 0.04130.0172 0.985 0.00107 0.06160.0229 1.313 0.00143 0.08200.0287 1.642 0.00179 0.10260.0344 1.972 0.00215 0.12320.0402 2.303 0.00251 0.1439
For 6061-T6,
Maximum Slope
0.5 x 0.5 1 x 1
Bending Stress, σx = Mc/I
c = perpendicular distance from the neutral axis to a point farthest away from the neutral
axis, where σmax acts.
0.5 x 0.5 1 x 1 0.5 x 0.5 1 x 1
inches inches Max εgage = 1.0E-04-0.0020 -0.0001 4.84E-04 6.05E-05-0.0348 -0.0022 Fail Pass-0.1127 -0.0070-0.2367 -0.0148-0.4070 -0.0254-0.6237 -0.0390-0.8868 -0.0554-1.1964 -0.0748
Normal Strain, upper surface, ε = σ/EMaximum Displacement

75
Torque Arm
y = 8.4x-1
0.0
5.0
10.0
15.0
20.0
0.0 0.5 1.0 1.5 2.0 2.5 3.0 3.5 4.0 4.5
Length, ft
Req
uir
ed
Fo
rce,
lbf
Displacement vs. Length
-1.400-1.200-1.000-0.800-0.600-0.400-0.2000.0000.200
0 10 20 30 40 50
Length, inches
Max
imum
Dis
plac
emen
t, in
ches
0.5 x 0.5 1 x 1

76
Displacement vs. Reaction Force
-1.400-1.200-1.000-0.800-0.600-0.400-0.2000.0000.200
0.0 5.0 10.0 15.0 20.0
Reaction Force, lbf
Dis
plac
emen
t, in
ches
0.5 x 0.5 1 x 1

77
D. Torque Arm and Casing FEA

78
E. Bearing Fatigue Life
Engine Torque = 8.4 ft*lbTorque Arm Length = 1.25 ftReaction Force = 6.72 lb
Bearing Inner Diameter = 1.25 inBearing Inner Diameter = 0.104167 ftTangential Force On Bearing Inner Race = 80.64 lb
Bearing Dynamic Load Rating = 2517 lbFactor Of Safety = 31
Static Loading = 15 lb
Fequiv. dynamic = Fradial static + Fdynamic
Fequiv. Dynamic = P = 95.64 lb
L10 = 18227.66 millions of revolutions
RPM = 3600Life = 84387 hours of continuous operation
*Calculations Assume Perfect Operating Conditions With No Contaminants*
F. Drawing Package