Embed Size (px)
Citation preview

We accept the challenge!www.andritz.com
Automation instrumentsTo measure, control, and improve operations
02
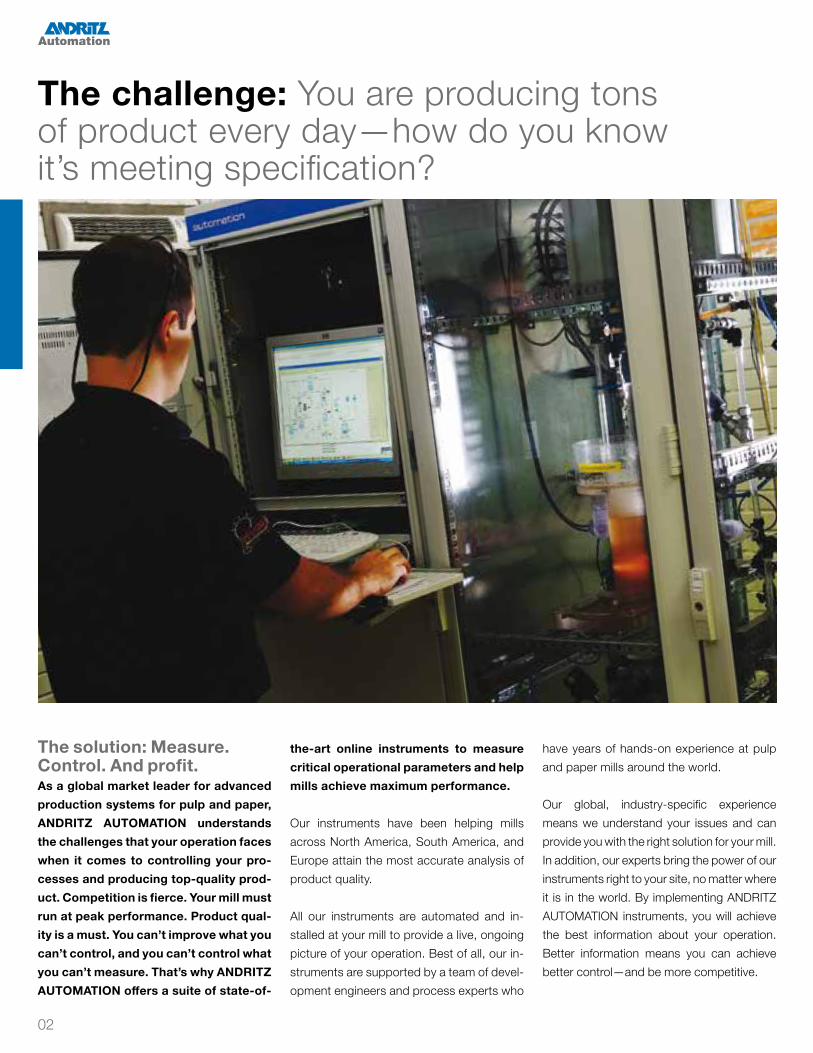
The solution: Measure. Control. And profit. As a global market leader for advanced production systems for pulp and paper, ANDRITZ AUTOMATION understands the challenges that your operation faces when it comes to controlling your pro-cesses and producing top-quality prod-uct. Competition is fierce. Your mill must run at peak performance. Product qual-ity is a must. You can’t improve what you can’t control, and you can’t control what you can’t measure. That’s why ANDRITZ AUTOMATION offers a suite of state-of-
the-art online instruments to measure critical operational parameters and help mills achieve maximum performance.
Our instruments have been helping mills across North America, South America, and Europe attain the most accurate analysis of product quality.
All our instruments are automated and in-stalled at your mill to provide a live, ongoing picture of your operation. Best of all, our in-struments are supported by a team of devel-opment engineers and process experts who
have years of hands-on experience at pulp and paper mills around the world.
Our global, industry-specific experience means we understand your issues and can provide you with the right solution for your mill. In addition, our experts bring the power of our instruments right to your site, no matter where it is in the world. By implementing ANDRITZ AUTOMATION instruments, you will achieve the best information about your operation. Better information means you can achieve better control—and be more competitive.
The challenge: You are producing tons of product every day—how do you know it’s meeting specification?
03
Find out more:FiberVision pulp quality sensor ............... 04
PulpVision dirt counter ........................... 08
GapScan measuring system ................. 10
Advanced condition diagnostics ............. 12
Kiln advanced condition diagnostics ....... 14
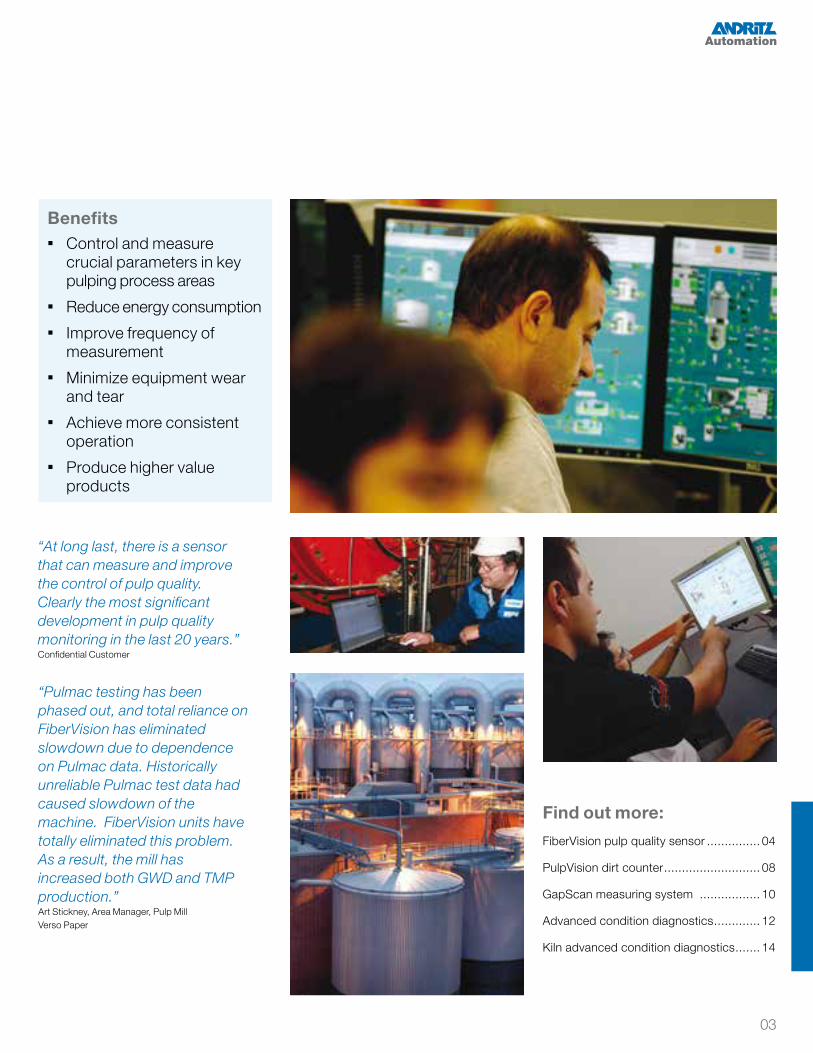
“At long last, there is a sensor that can measure and improve the control of pulp quality. Clearly the most significant development in pulp quality monitoring in the last 20 years.” Confidential Customer
“Pulmac testing has been phased out, and total reliance on FiberVision has eliminated slowdown due to dependence on Pulmac data. Historically unreliable Pulmac test data had caused slowdown of the machine. FiberVision units have totally eliminated this problem. As a result, the mill has increased both GWD and TMP production.” Art Stickney, Area Manager, Pulp Mill Verso Paper
Benefits � Control and measure
crucial parameters in key pulping process areas
� Reduce energy consumption � Improve frequency of
measurement � Minimize equipment wear
and tear � Achieve more consistent
operation � Produce higher value
products

04
The solution: FiberVision pulp quality sensorFiberVision is a state-of-the-art on-line sensor that helps pulp operations reduce specific energy consumption, achieve higher value product, improve frequency of measurement and de-crease downtime.
FiberVision is the first sensor to measure specific surface areaCanadian Standard Freeness (CSF) and Schopper-Riegler (SR) have long been the traditional drainage measurements in the pulp and paper industry. These often-con-tested and sometimes ambiguous results are only relative indicators.
Because freeness is a global and empirical parameter, it cannot be used to determine the key parameters in the development of fiber characteristics such as fiber bonding potential, surface area, fibrillation, fines con-tent, compressibility or specific volume.
The challenge: To measure and control pulp drainage accurately and consistently
FiberVision: Seven analyzers in one
� Freeness analyzer � Surface area analyzer � Fiber length analyzer � Shive analyzer � Vacuum response analyzer � Pulp brightness � Pulp properties predictor
FiberVision’s proprietary filtration column is the key to improved accuracy and innovative measurements. Operators can now use specific surface area, fiber length and many other pulp properties automatically provided by FiberVision to control their processes.
FiberVision is different. It’s a tool that directly measures these fundamental parameters—and the effectiveness of your process.
Specific surface area monitors fiber development effectivenessFiberVision provides simple measurement of fibrillation, fines generation, and fiber de-velopment. In fact, FiberVision is the only
sensor that directly measures the specific surface area of fibers. If the specific surface area of fibers goes up, then fibers are better fibrillated and have more bonding potential, reduced fiber coarseness, and more chemi-cal absorption capabilities. The direct out-come is a more consolidated, stronger, and smoother sheet.
FiberVision fractionates the pulp to measure fiber and fines surface independentlyFiberVision is equipped with a unique frac-tionation system. Fines are separated from fibers in the drainage column in order to dif-ferentiate between the specific surface area of fibers (fibrillation) and that of fines (fines generation).
Specific volume tracks fiber swelling and water retentionFiberVision is the only sensor that directly measures the specific volume of fibers, a vol-umetric measure of the cellulose and bound water in the fiber structure. Specific volume is a direct measurement of fiber swelling, internal fibrillation, and water retention. It is also a key parameter in the prediction of bulk and sheet consolidation.

05
Benefits � Save energy by fine-tuning
power and settings of refiners and grinders
� Decrease steam requirements in dryer by reducing fine contents and water retention on machine table
� Reduce use of strength additives by increasing fibrillation and paper strength properties
� Optimize water retention, allowing for higher machine speed in dryer-limited applications
� Improve runnability and reduce machine breaks by increasing fibrillation and compressibility
� Improve density, porosity, and optical and mechanical properties
� Reduce variability through around-the-clock measurement of pulp properties, combined with advanced process control
Proprietary “shive enrichment” technologyShives are separated from the pulp by a screening system in order to accurately mea-sure their length, width and area. Other sen-sors measure shives in a high-consistency fiber suspension, resulting in statistical er-rors on shive size and quantity.
Vacuum response curve, compressibility and porosity FiberVision derives several other key characteristics of the fibrous mat from the proprietary “vacuum response curve.” Compressibility measures the resistance of the fibrous mat and predicts its ability to form dense sheets. Mat porosity quantifies pore size distribution. Mat flocculation provides a measure of the ability of fibers to form either a finely structured or a flocculated sheet.
Brightness sensorBuilt on a proprietary principle, the bright-ness sensor is fully integrated into the FiberVision platform. This additional mea-surement complements the fiber length and surface area data provided by FiberVision. Together, these properties give the user a full picture of pulp quality.
High-resolution fiber morphology measurementsFiberVision provides a wide range of mor-phological measurements, including fiber length, fiber width, fiber curl, and coarse-ness. Accuracy is ensured by the high reso-lution of the imaging process and the very large number of fibers processed.
Multiple sampling streamsUp to eight pulp streams can be automati-cally sampled with FiberVision. Thanks to the innovative sampling technology, sampling points can be located at large distances from the sensor, without the risk of plug-ging or wasting pulp. In addition, FiberVision can be fitted with a twelve-cup automated batch sampler in order to measure manual samples.
DCS and mill-wide connectivityFiberVision can easily be connected to your DCS and mill-wide system. Data transfer can be accomplished via current loops, network connections, or PI system data exchange. Remote connection can also be initiated for data and video monitoring, or for long-dis-tance troubleshooting.
06
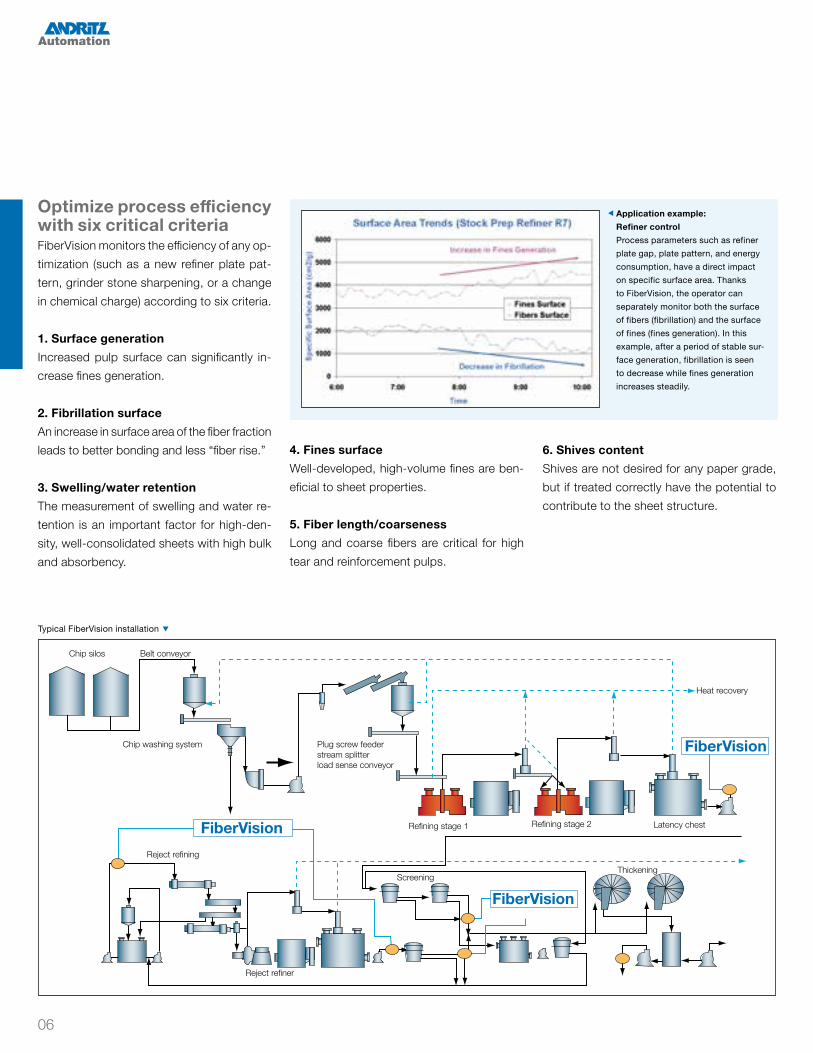
Optimize process efficiency with six critical criteriaFiberVision monitors the efficiency of any op-timization (such as a new refiner plate pat-tern, grinder stone sharpening, or a change in chemical charge) according to six criteria.
1. Surface generationIncreased pulp surface can significantly in-crease fines generation.
2. Fibrillation surfaceAn increase in surface area of the fiber fraction leads to better bonding and less “fiber rise.”
3. Swelling/water retentionThe measurement of swelling and water re-tention is an important factor for high-den-sity, well-consolidated sheets with high bulk and absorbency.
Chip silos Belt conveyor
Reject refining
Reject refiner
Screening
Plug screw feederstream splitterload sense conveyor
Thickening
Refining stage 1 Refining stage 2 Latency chest
Heat recovery
Chip washing system
4. Fines surfaceWell-developed, high-volume fines are ben-eficial to sheet properties. 5. Fiber length/coarsenessLong and coarse fibers are critical for high tear and reinforcement pulps.
Application example: Refiner control Process parameters such as refiner plate gap, plate pattern, and energy consumption, have a direct impact on specific surface area. Thanks to FiberVision, the operator can separately monitor both the surface of fibers (fibrillation) and the surface of fines (fines generation). In this example, after a period of stable sur-face generation, fibrillation is seen to decrease while fines generation increases steadily.
6. Shives contentShives are not desired for any paper grade, but if treated correctly have the potential to contribute to the sheet structure.
Typical FiberVision installation
07
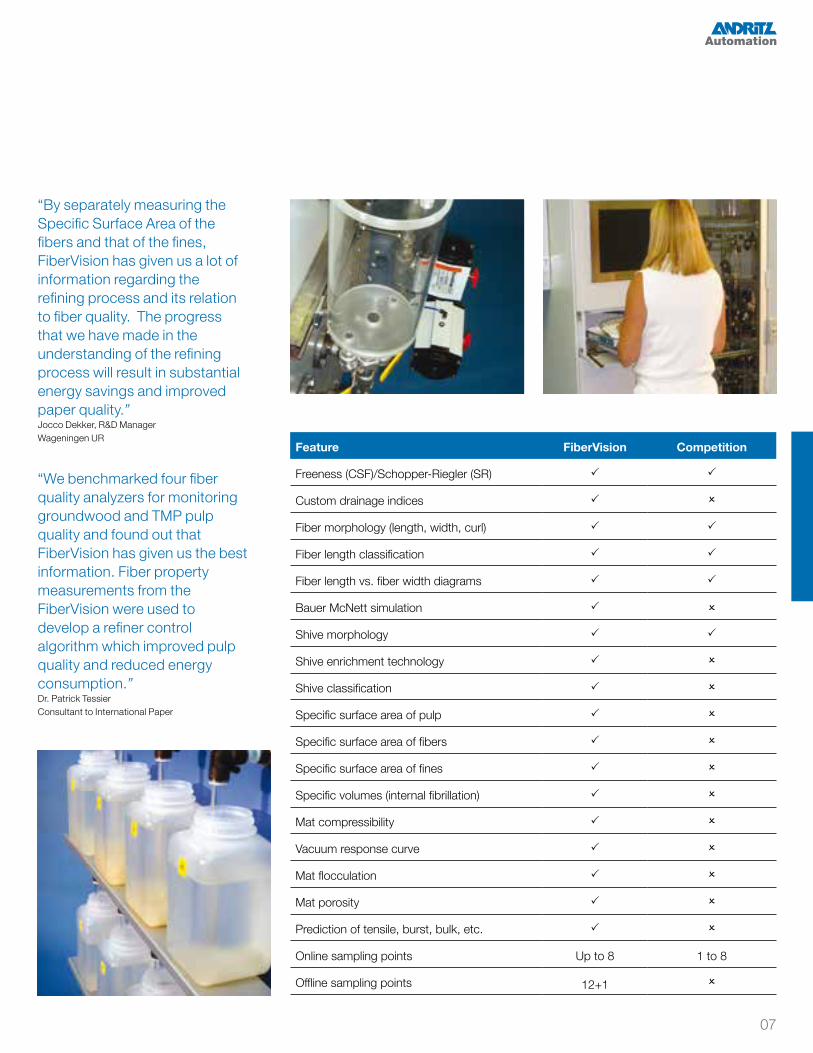
“By separately measuring the Specific Surface Area of the fibers and that of the fines, FiberVision has given us a lot of information regarding the refining process and its relation to fiber quality. The progress that we have made in the understanding of the refining process will result in substantial energy savings and improved paper quality.” Jocco Dekker, R&D Manager Wageningen UR
“We benchmarked four fiber quality analyzers for monitoring groundwood and TMP pulp quality and found out that FiberVision has given us the best information. Fiber property measurements from the FiberVision were used to develop a refiner control algorithm which improved pulp quality and reduced energy consumption.” Dr. Patrick TessierConsultant to International Paper
Feature FiberVision Competition
Freeness (CSF)/Schopper-Riegler (SR) P P
Custom drainage indices P O
Fiber morphology (length, width, curl) P P
Fiber length classification P P
Fiber length vs. fiber width diagrams P P
Bauer McNett simulation P O
Shive morphology P P
Shive enrichment technology P O
Shive classification P O
Specific surface area of pulp P O
Specific surface area of fibers P O
Specific surface area of fines P O
Specific volumes (internal fibrillation) P O
Mat compressibility P O
Vacuum response curve P O
Mat flocculation P O
Mat porosity P O
Prediction of tensile, burst, bulk, etc. P O
Online sampling points Up to 8 1 to 8
Offline sampling points 12+1 O
08
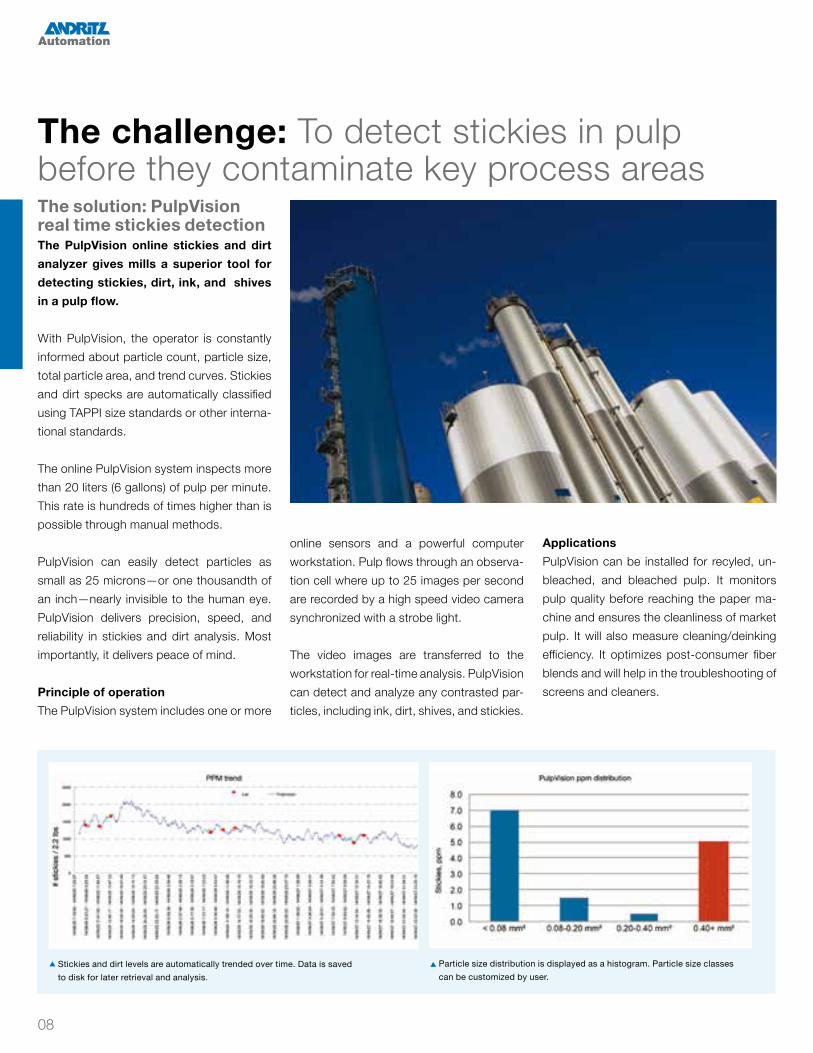
The solution: PulpVision real time stickies detectionThe PulpVision online stickies and dirt analyzer gives mills a superior tool for detecting stickies, dirt, ink, and shives in a pulp flow.
With PulpVision, the operator is constantly informed about particle count, particle size, total particle area, and trend curves. Stickies and dirt specks are automatically classified using TAPPI size standards or other interna-tional standards.
The online PulpVision system inspects more than 20 liters (6 gallons) of pulp per minute. This rate is hundreds of times higher than is possible through manual methods.
PulpVision can easily detect particles as small as 25 microns—or one thousandth of an inch—nearly invisible to the human eye. PulpVision delivers precision, speed, and reliability in stickies and dirt analysis. Most importantly, it delivers peace of mind.
Principle of operationThe PulpVision system includes one or more
The challenge: To detect stickies in pulp before they contaminate key process areas
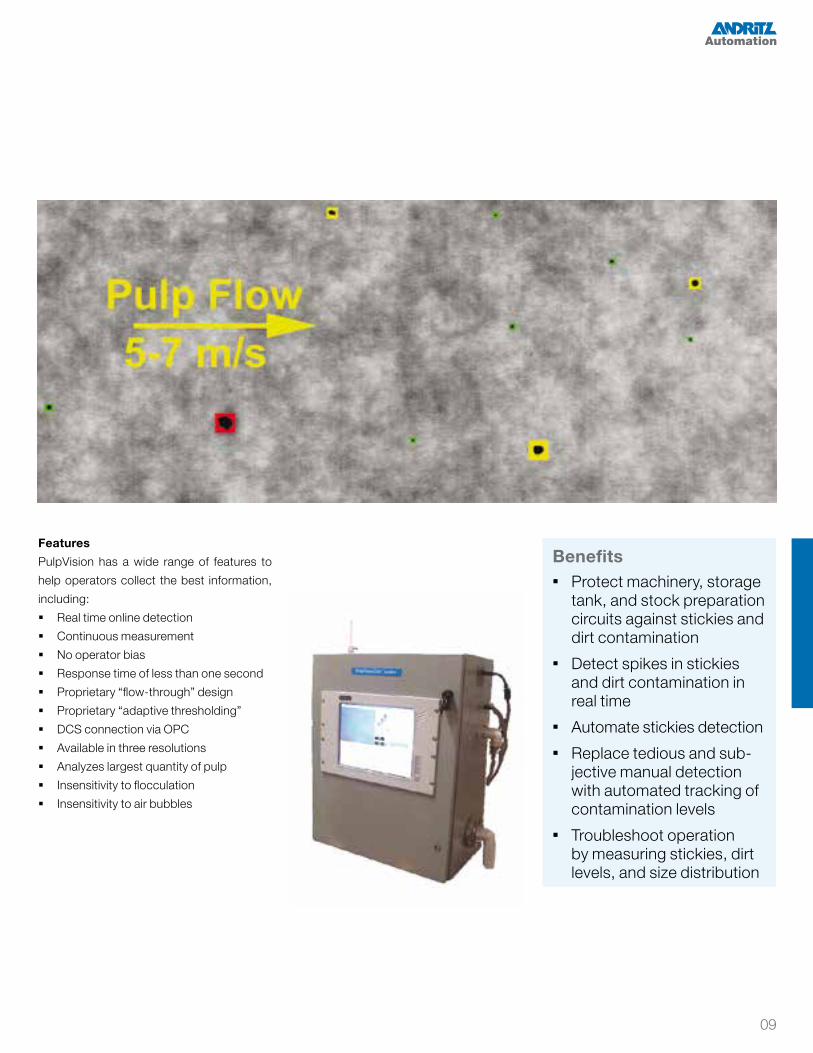
online sensors and a powerful computer workstation. Pulp flows through an observa-tion cell where up to 25 images per second are recorded by a high speed video camera synchronized with a strobe light.
The video images are transferred to the workstation for real-time analysis. PulpVision can detect and analyze any contrasted par-ticles, including ink, dirt, shives, and stickies.
Stickies and dirt levels are automatically trended over time. Data is saved to disk for later retrieval and analysis.
Particle size distribution is displayed as a histogram. Particle size classes can be customized by user.
ApplicationsPulpVision can be installed for recyled, un-bleached, and bleached pulp. It monitors pulp quality before reaching the paper ma-chine and ensures the cleanliness of market pulp. It will also measure cleaning/deinking efficiency. It optimizes post-consumer fiber blends and will help in the troubleshooting of screens and cleaners.
09
Benefits � Protect machinery, storage
tank, and stock preparation circuits against stickies and dirt contamination
� Detect spikes in stickies and dirt contamination in real time
� Automate stickies detection � Replace tedious and sub-
jective manual detection with automated tracking of contamination levels
� Troubleshoot operation by measuring stickies, dirt levels, and size distribution
FeaturesPulpVision has a wide range of features to help operators collect the best information, including: § Real time online detection § Continuous measurement § No operator bias § Response time of less than one second § Proprietary “flow-through” design § Proprietary “adaptive thresholding” § DCS connection via OPC § Available in three resolutions § Analyzes largest quantity of pulp § Insensitivity to flocculation § Insensitivity to air bubbles
10
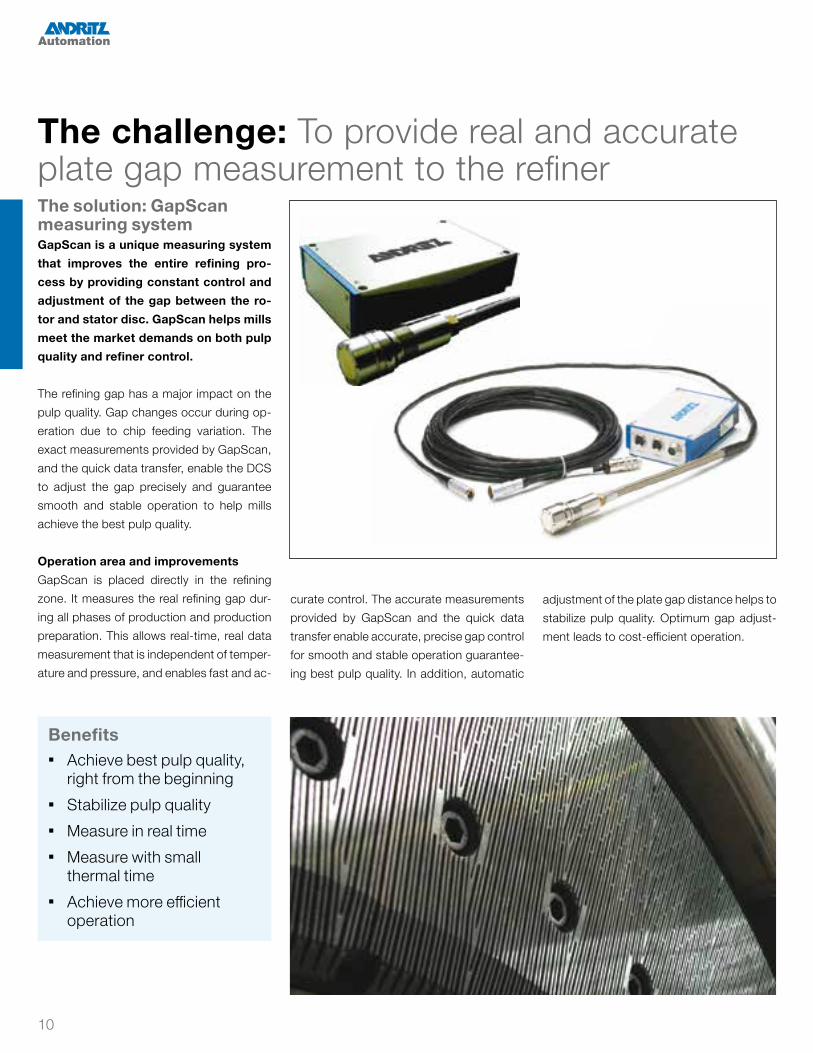
The solution: GapScan measuring systemGapScan is a unique measuring system that improves the entire refining pro-cess by providing constant control and adjustment of the gap between the ro-tor and stator disc. GapScan helps mills meet the market demands on both pulp quality and refiner control.
The refining gap has a major impact on the pulp quality. Gap changes occur during op-eration due to chip feeding variation. The exact measurements provided by GapScan, and the quick data transfer, enable the DCS to adjust the gap precisely and guarantee smooth and stable operation to help mills achieve the best pulp quality.
Operation area and improvementsGapScan is placed directly in the refining zone. It measures the real refining gap dur-ing all phases of production and production preparation. This allows real-time, real data measurement that is independent of temper-ature and pressure, and enables fast and ac-
The challenge: To provide real and accurate plate gap measurement to the refiner
curate control. The accurate measurements provided by GapScan and the quick data transfer enable accurate, precise gap control for smooth and stable operation guarantee-ing best pulp quality. In addition, automatic
adjustment of the plate gap distance helps to stabilize pulp quality. Optimum gap adjust-ment leads to cost-efficient operation.
Benefits � Achieve best pulp quality,
right from the beginning � Stabilize pulp quality � Measure in real time � Measure with small
thermal time � Achieve more efficient
operation
11
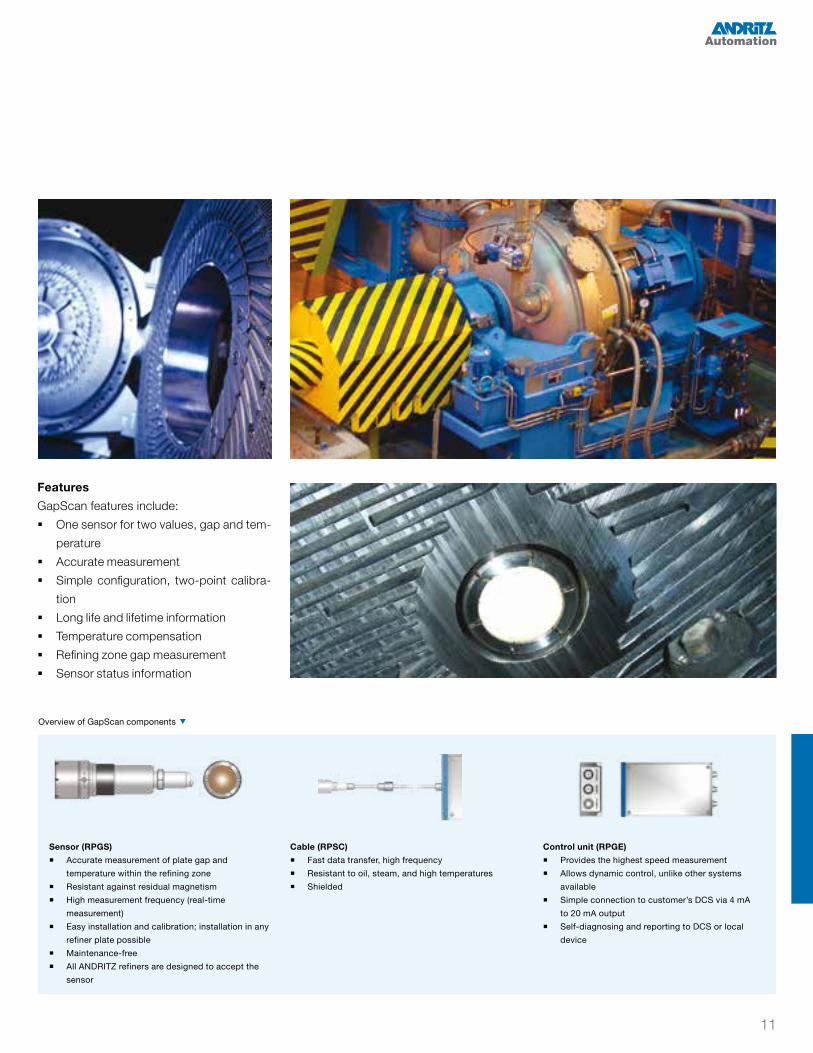
Sensor (RPGS) � Accurate measurement of plate gap and
temperature within the refining zone � Resistant against residual magnetism � High measurement frequency (real-time
measurement) � Easy installation and calibration; installation in any
refiner plate possible � Maintenance-free � All ANDRITZ refiners are designed to accept the
sensor
Cable (RPSC) � Fast data transfer, high frequency � Resistant to oil, steam, and high temperatures � Shielded
Control unit (RPGE) � Provides the highest speed measurement � Allows dynamic control, unlike other systems
available � Simple connection to customer’s DCS via 4 mA
to 20 mA output � Self-diagnosing and reporting to DCS or local
device
Overview of GapScan components
FeaturesGapScan features include: § One sensor for two values, gap and tem-
perature § Accurate measurement § Simple configuration, two-point calibra-
tion § Long life and lifetime information § Temperature compensation § Refining zone gap measurement § Sensor status information
12
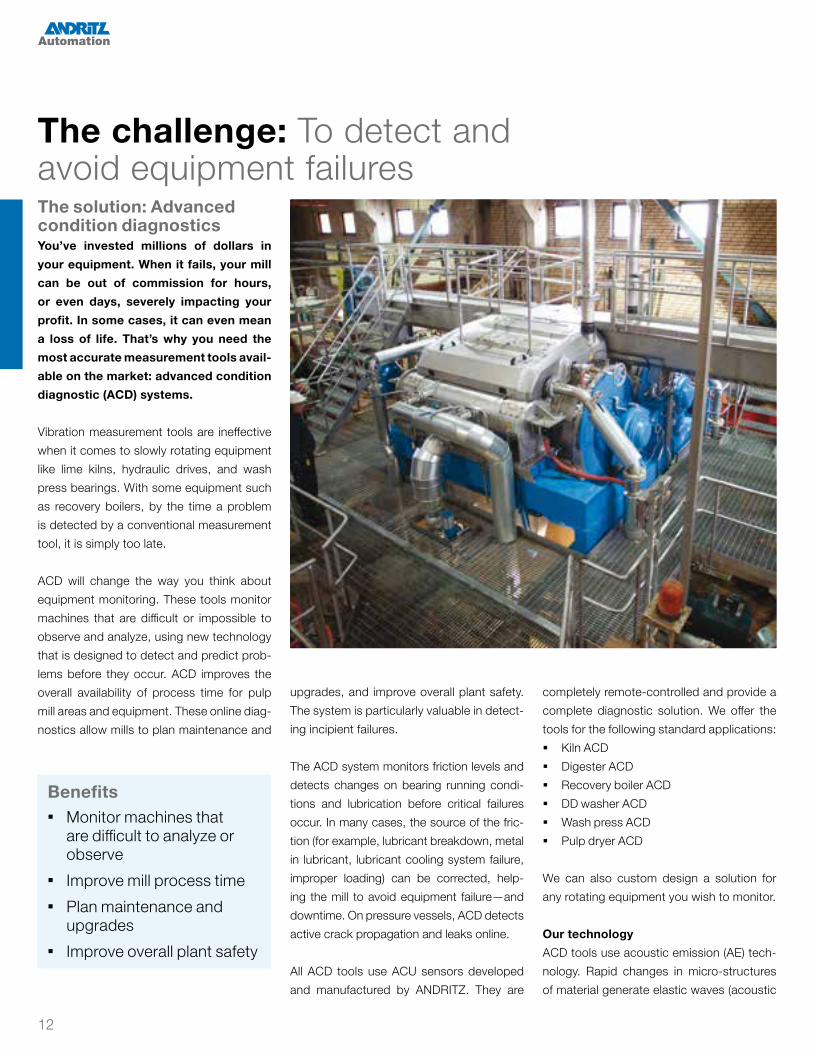
The solution: Advanced condition diagnosticsYou’ve invested millions of dollars in your equipment. When it fails, your mill can be out of commission for hours, or even days, severely impacting your profit. In some cases, it can even mean a loss of life. That’s why you need the most accurate measurement tools avail-able on the market: advanced condition diagnostic (ACD) systems.
Vibration measurement tools are ineffective when it comes to slowly rotating equipment like lime kilns, hydraulic drives, and wash press bearings. With some equipment such as recovery boilers, by the time a problem is detected by a conventional measurement tool, it is simply too late.
ACD will change the way you think about equipment monitoring. These tools monitor machines that are difficult or impossible to observe and analyze, using new technology that is designed to detect and predict prob-lems before they occur. ACD improves the overall availability of process time for pulp mill areas and equipment. These online diag-nostics allow mills to plan maintenance and
upgrades, and improve overall plant safety. The system is particularly valuable in detect-ing incipient failures.
The ACD system monitors friction levels and detects changes on bearing running condi-tions and lubrication before critical failures occur. In many cases, the source of the fric-tion (for example, lubricant breakdown, metal in lubricant, lubricant cooling system failure, improper loading) can be corrected, help-ing the mill to avoid equipment failure—and downtime. On pressure vessels, ACD detects active crack propagation and leaks online.
All ACD tools use ACU sensors developed and manufactured by ANDRITZ. They are
completely remote-controlled and provide a complete diagnostic solution. We offer the tools for the following standard applications: § Kiln ACD § Digester ACD § Recovery boiler ACD § DD washer ACD § Wash press ACD § Pulp dryer ACD
We can also custom design a solution for any rotating equipment you wish to monitor.
Our technologyACD tools use acoustic emission (AE) tech-nology. Rapid changes in micro-structures of material generate elastic waves (acoustic
The challenge: To detect and avoid equipment failures
Benefits � Monitor machines that
are difficult to analyze or observe
� Improve mill process time � Plan maintenance and
upgrades � Improve overall plant safety
13
emission). Ultra-sensitive piezo sensors then detect and continuously record the amount of energy generated. Acoustic emission tech-nology is very adept at detecting overload, lubrication problems, crack propagation, and incipient machine faults. Low-frequency background noise and audible noise have no effect on measurement.
ACU sensors are typically located at bearing housings, and on gearboxes and pressure vessels. Data produced by ACU sensors is sent to our ACD-server, which offers a web-based human-machine interface (HMI). Sensor indicators on the HMI are marked with colors corresponding to the level of acoustic emission. For example, green
indicates normal running conditions, yellow indicates an alert that requires attention and correction, and red indicates an alarm with critical running conditions.
Browser-based HMI data is available for all users in the plant’s network. ANDRITZ ex-perts can help you interpret the data to iden-tify the problem being detected. Remote user and diagnostics support is also available.
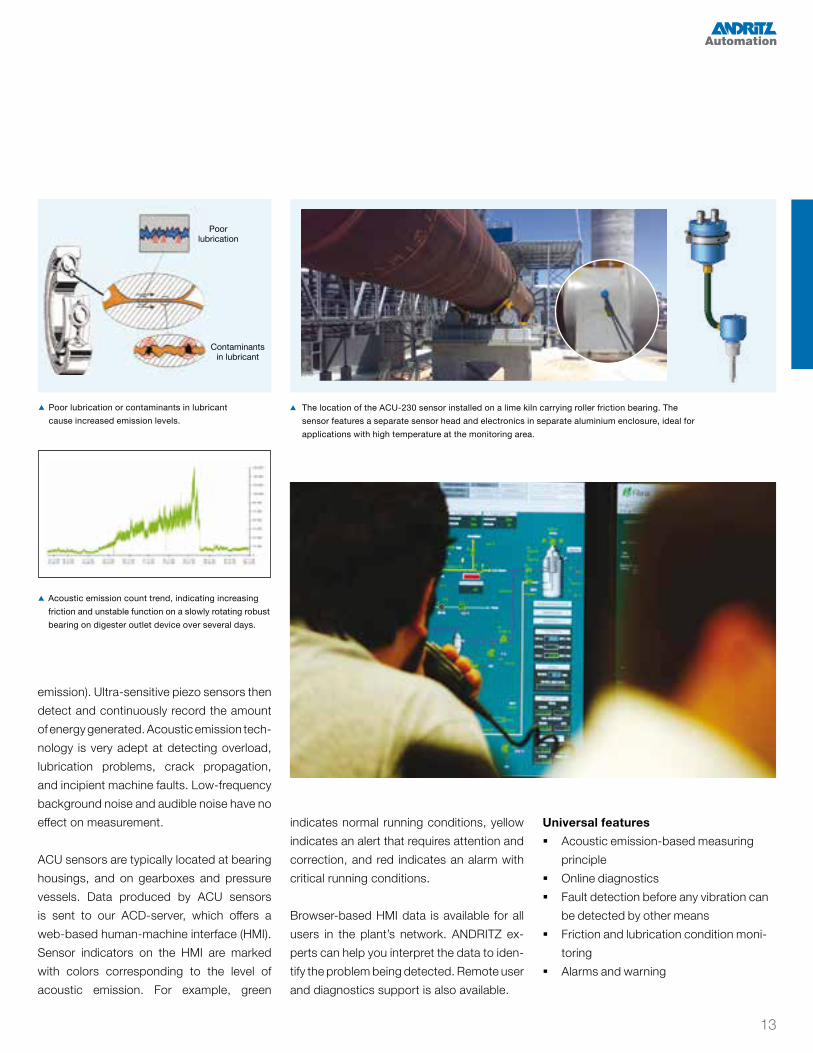
Poor lubrication or contaminants in lubricant cause increased emission levels.
Acoustic emission count trend, indicating increasing friction and unstable function on a slowly rotating robust bearing on digester outlet device over several days.
The location of the ACU-230 sensor installed on a lime kiln carrying roller friction bearing. The sensor features a separate sensor head and electronics in separate aluminium enclosure, ideal for applications with high temperature at the monitoring area.
Poor lubrication
Contaminants in lubricant
Universal features § Acoustic emission-based measuring
principle § Online diagnostics § Fault detection before any vibration can
be detected by other means § Friction and lubrication condition moni-
toring § Alarms and warning
14
The solution: Kiln advanced condition diagnosticsKiln ACD is an effective tool for monitor-ing the operation of calciners and kilns, and for providing predictive mainte-nance diagnostics.
In particular, kiln ACD can be used to diag-nose product ring plugging, carrying roller alignment, and thrust roller and gearbox load. It is also an ideal tool for condition monitoring.
It helps reduce the risk of costly shutdowns by detecting damge in drive operations. It can help with maintenance procedures by putting a damaged gearbox and bearings into the maintenance cycle in a proactive, controlled manner.
Condition diagnostics are conducted during regular operation.
The challenge: To achieve an accurate picture of your kiln’s condition
FeaturesKiln ACD has a number of features to monitor kilns, including: § Acoustic emission-based measuring
principle § Online diagnostics § Fault detection before any detectable vi-
bration
§ Detecting ring formation § Providing kiln alignment information § Bearing diagnostics § Thrust roller load condition monitoring § Friction and lubrication condition moni-
toring
Benefits � Detect potential damage in
drive operations—reduce risk of costly disruptions to operations
� Avoid disruptions by putting damaged gearbox/bearings into maintenance cycle in a controlled manner
� Conduct condition diag-nostics during regular operation
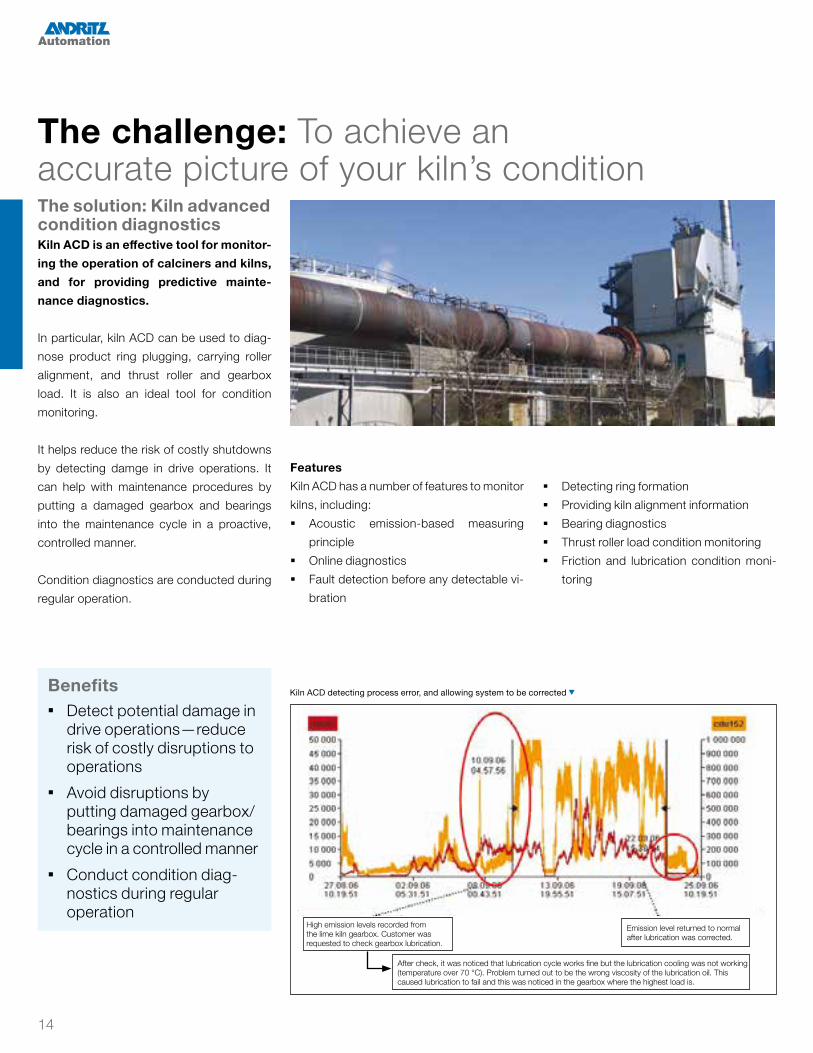
High emission levels recorded from the lime kiln gearbox. Customer was requested to check gearbox lubrication.
Emission level returned to normal after lubrication was corrected.
After check, it was noticed that lubrication cycle works fine but the lubrication cooling was not working (temperature over 70 °C). Problem turned out to be the wrong viscosity of the lubrication oil. This caused lubrication to fail and this was noticed in the gearbox where the highest load is.
Kiln ACD detecting process error, and allowing system to be corrected
15
Kiln condition monitoring – application scenariosScenario 1: Product ring pluggingProduct ring plugging can be detected as acoustic emission levels increase in spe-cific carrying roller bearings. An example of product ring plugging is shown in the figure below.
Formation of the ring was detected several days before the kiln was stopped for mainte-nance. This gave mill personnel valuable time to organize maintenance activities.
As a result of alarms given by kiln ACD, the kiln was stopped early enough to avoid irrep-arable damage to the kiln and bearings. After the kiln shutdown and completion of main-tenance, acoustic emission levels returned to normal. Inspection of the kiln’s condition revealed that no damage occurred.
Scenario 2: Kiln alignmentSensors on carrying roller bearing housings indicate load on the bearings. Changes in loading conditions are detected online as they occur. This makes alignment of the car-rying rollers faster and more accurate com-pared to traditional alignment methods.
In cases where kiln rotation speed is changed but no further adjustments are made, conse-quent kiln behavior will change.
In one case, a heavy load on the upper thrust roller occurred over four months. Due to sensitive detection, the excessive load was found and corrected before any damage could occur. The lime kiln was resting on the lower thrust roller at certain intervals, as can be seen in the figure below.
Before new roller alignment, the load on the lower thrust roller was much lower than on the upper thrust roller. Since the adjust-ments, the kiln has been running well and
A typical kiln ACD system configuration
ACU-230, 8 pcs.For gearboxes, thrust rollers and
carrying roller bearing houses
Field connection terminal
ACD site server
Process data for diagnostics
in-line. Continuous lime kiln diagnostics re-veal whether additional alignment is needed over time.
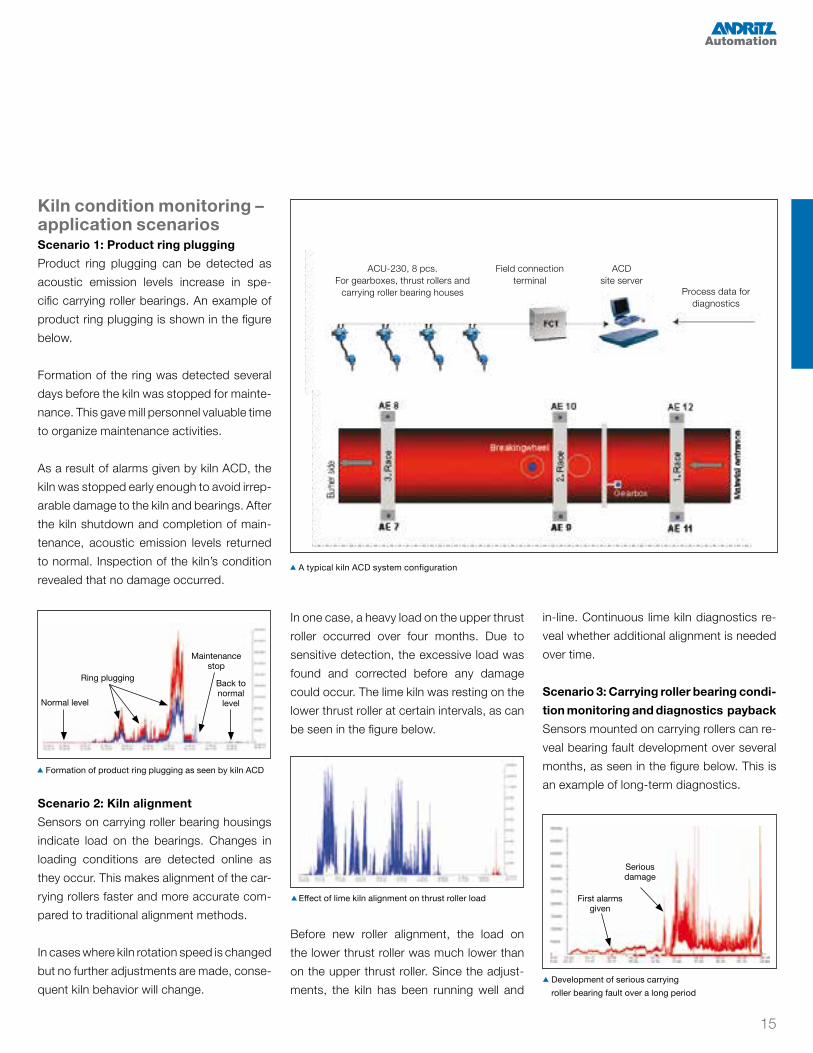
Scenario 3: Carrying roller bearing condi-tion monitoring and diagnostics paybackSensors mounted on carrying rollers can re-veal bearing fault development over several months, as seen in the figure below. This is an example of long-term diagnostics.
Effect of lime kiln alignment on thrust roller load
Development of serious carrying roller bearing fault over a long period
Serious damage
First alarms given
Formation of product ring plugging as seen by kiln ACD
Normal level
Ring plugging
Maintenance stop
Back to normal level
All data, information, statements, photographs, and graphic illustrations in this leaflet are without any obligation and raise no liabilities to or form part of any sales contracts of ANDRITZ AG or any affiliates for equipment and/or systems referred to herein. © ANDRITZ AG 2015. All rights reserved. No part of this copyrighted work may be reproduced, modified or distributed in any form or by any means, or stored in any database or retrieval system, without the prior written permission of ANDRITZ AG or its affiliates. Any such unauthorized use for any purpose is a violation of the relevant copyright laws. ANDRITZ AG, Stattegger Strasse 18, 8045 Graz, Austria. AT.INS.11.en.08.15
ANDRITZ Inc.Atlanta, GA, USA Phone: +1 (404) 370 1350
Automation solutionsRelease your full potential
Australia: Melbourne | Austria: Vienna | Brazil: Belo Horizonte, Curitiba | Canada: Nanaimo, Prince George, Richmond, Terrace | Chile: Santiago | Finland: Kotka, Tampere, Varkaus | India: Bangalore | USA: Bellingham, Montoursville