Embed Size (px)
Citation preview
STAG: Smart Tools & Apps for Graphics (2014)Andrea Giachetti (Editor)
Automatic Generation of Synthetic Retinal Fundus Images
S. Fiorini1,2, M. De Biasi1,2, L. Ballerini2, E. Trucco2, and A. Ruggeri1
1Department of Information Engineering, University of Padova, Padova, ITALY2VAMPIRE project, CVIP group, School of Computing, University of Dundee, Dundee, UK
AbstractThis study aims to generate synthetic and realistic retinal fundus colour images, similar in characteristics to agiven dataset, as well as the values of all morphological parameters. A representative task could be, for example,the synthesis of a retinal image with the corresponding vessel tree and optic nerve head binary map, measure-ment of vessel width in any position, fovea localisation and so on. The presented paper describes the techniquesdeveloped for the generation of both vascular and non-vascular regions (i.e. retinal background, fovea and op-tic disc). To synthesise convincing retinal backgrounds and foveae, a patch-based algorithm has been developed;model-based texture synthesis techniques have also been implemented for the generation of realistic optic discsand vessel networks. The validity of our synthetic retinal images has been demonstrated by visual inspection andquantitative experiments.
1. Introduction
Retinal fundus imaging is a very helpful tool for the diagno-sis of many diseases such as diabetes, glaucoma and cardio-vascular conditions [AGS10]. This is reflected by the largenumber of algorithms for optic disc (OD) detection, vesselsegmentation and width measurements [PAM∗06]. In orderto evaluate performance, limitations and clinical applicabil-ity of a medical image analysis algorithm, a validation step ismandatory. Validation can be defined as the process of show-ing that an algorithm performs correctly by comparing itsoutput with a reference standard [TRK∗13]. Algorithm vali-dation on manually annotated ground truth (GT) images is awell documented and necessary practice. However, it is alsowell known that obtaining large quantities of annotated med-ical GT images is an expensive and laborious task. The mainpurpose of this work is the generation of synthetic high reso-lution retinal fundus images (Figure 3) in a controlled man-ner along with a synthetic GT free from inter-observer vari-ability. In the synthesised retinal phantoms, textural anatom-ical features can be modified to simulate a wide range of pa-rameters and different populations. Our synthetic data wouldallow extensive validation of algorithms for segmentationand analysis of anatomical structures. The final goal is thepublic release of a new database containing synthetic retinalimages including OD and macula centre coordinates, vesselbinary maps and width at any position and artery/vein clas-sification. All these measurements are of crucial importance
during the validation of retinal image analysis algorithms.Medical phantom images are extensively used in many med-ical imaging environment, but, to our best knowledge, noprevious work on the automatic generation of retinal phan-toms has ever been proposed. This project has been based onthe publicly available High-Resolution Fundus (HRF) ImageDatabase [OKB∗13], which has 45 high-quality images atthe resolution of 3504× 2336 pixels. The generated retinalphantoms have the same size, but images of every resolutioncan be synthesised by the presented method, given an ap-propriate dataset. This paper is organised as follows, in Sec-tion 2 we describe the proposed method providing details forthe patch-based (Subsection 2.2) and the model-based (Sub-section 2.3) texture synthesis algorithm we propose for thegeneration of background, fovea and OD; while in Subsec-tion 2.4 the technique developed for the generation of struc-ture and texture of the vessel tree is outlined. Section 3 de-scribes the conducted experiments and the achieved results.Finally in Section 4 we present our conclusions and somehints for future works.
2. Method
2.1. Overview
In order to generate convincing retinal fundus image phan-toms, we started from the observation of real images. At afirst glance, retinal images are showing three obvious ele-ments surrounded by an orange-red background: Optic Disc,
c© The Eurographics Association 2014.
Short papers
DOI: 10.2312/stag.20141238
S. Fiorini, M. De Biasi, L. Ballerini, E. Trucco & A. Ruggeri / Synthetic Retinal Images Generation
Vessel Network and Fovea. The background presents a va-riety of textures. Brightness is also non-uniform across theimage, usually brighter in vascular regions and darker inthe fovea and in the image periphery. Intuitively the aver-age colour distribution in retinal images could remind us ofa horseshoe (see Figure 1). Choroidal vessels are also some-times visible in transparency, this effect creates a real tex-ture, very different from a mere smooth colour fill. In or-der to synthesise a new background preserving both non-uniform colour distribution and texture characteristics, wedeveloped a patch-based tiling algorithm inspired by Efrosand Freeman’s Image Quilting technique [EF01], wherenovel images are synthesised by stitching together small ex-amples of existing images. On the other hand, for the gen-eration of synthetic ODs a novel model-based approach hasbeen followed. This method relies on the idea of learningthe distributions of key morphometric quantities from realimages and realistically reproduce them. A model-based ap-proach is used for the vascular network [ORE12, Ada11].Many features of the vessel tree like major temporal arcade,bifurcations, vessel width, length and tortuosity are includedin the model.
2.2. Background and Fovea generation
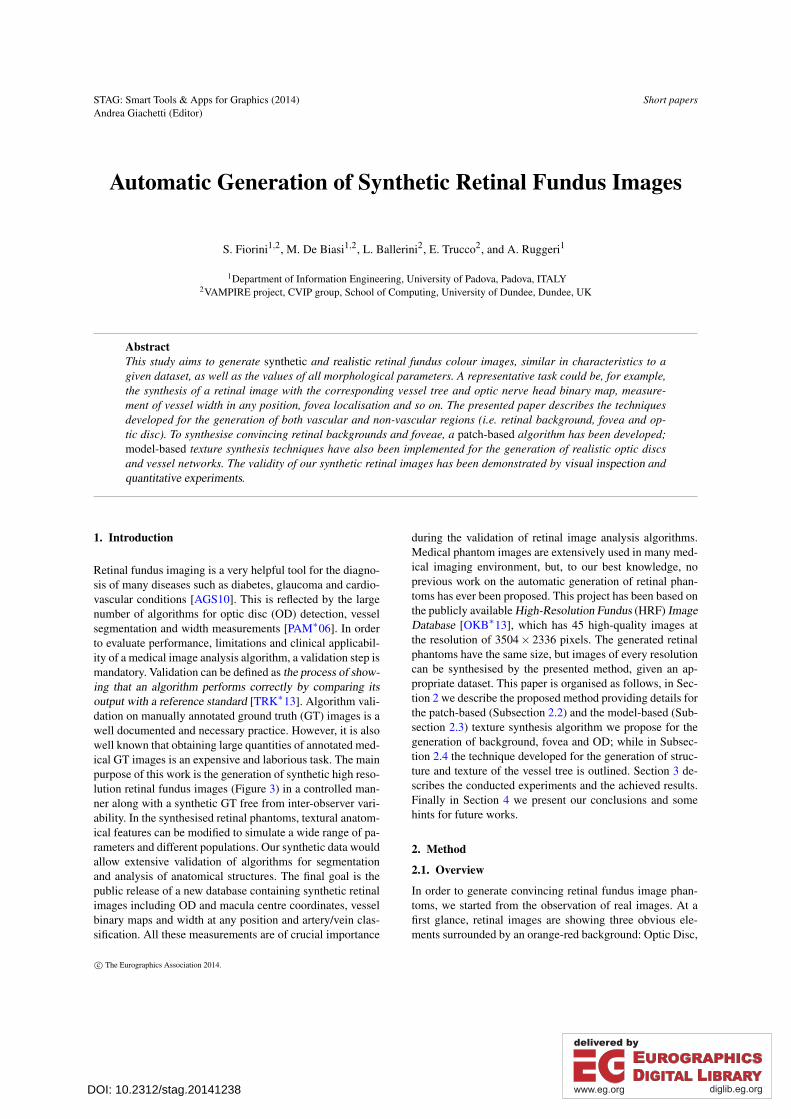
In this section we will discuss about the generation of back-ground and fovea achieved by the previously mentionedpatch-based algorithm. The developed tiling algorithm needsthree inputs: a) a Correspondence Map (CM); b) a consistentcluster-CM (c-CM) and c) a suitable Tiles Dictionary (TD).For our purposes, a CM is a spatial map of the correspondingcolour intensity distribution over the real and the syntheticimages. The CM allows our tiling algorithm to recreate a re-alistic background texture. Different CMs have been createdby weighted averaging of 15 real preprocessed images (thehealthy HRF subset). The preprocessing consisted in a naiveco-registration step followed by a more sophisticated fore-ground (OD and vessel tree) inpainting. The co-registrationstep consists in a rigid rotation and a translation of all theimages in order to make them share a common polar co-ordinate system centred on the OD. For the foreground in-painting step we took advantage of the technique proposedby Criminisi et al. in [CPT04]. An example of CM is shownin Figure 1. The tiling algorithm can generate realistic back-grounds and foveae stitching together blocks collected fromreal images. For the generation of our retinal phantoms wecollected more than 300,000 vessel-free tiles 7 × 7 pixelsand we organised them in a TD. To facilitate the research ofmatching blocks performed by the proposed tiling algorithm,all the collected vessel-free tiles have been grouped intoclusters using a pixel-wise K-means algorithm. The numberof clusters (4) has been optimised using the Akaike Informa-tion Criterion [MRS08] and the feature selected for the clus-tering were the red and green intensity value of each pixel.Each tile has then been assigned to a unique cluster by meansof majority vote. To link this idea with the CM, a consistent
(a) (b)
(c) (d)Figure 1: An example of colour intensity distribution map(CM) in red (a), green (b) and blue (c) channels and thecorrespondent clustering map (c-CM) (d).
c-CM, which shows the distribution of clusters in the CM,has been evaluated as well. For the description of the pro-posed tiling algorithm a syntax consistent with [EF01] hasbeen chosen. To assess the colour similarity among the tiles,the original error surface e has been replaced with a new er-ror surface ε defined in Equation 1 (where the symbol ◦ in-dicates the element-wise matrix product and the two indexesn<C1,C2> and γ<C1,C2> are, respectively, the grey level andthe chroma similarity indexes described in [GFJ11]).
ε<C1,C2> = 1−n<C1,C2> ◦ γ<C1,C2> (1)
The tiling algorithm workflow can be described as follows.Let Φ be the desired output image and τk(i) the i-th elementof the TD assigned to the cluster ωk. The final result can beachieved going trough Φ in raster scan order in steps of thesize of the tiles minus an overlap (3 pixels) and iterating thefollowing steps:
1. Randomly pick up successive τk(i) from ωk (where kis defined by the c-CM) until the best match, defined asthe tile that locally satisfies the two constraints below, isfound:
• local consistence with the CM: the Euclidean distancebetween the picked-up tile and the correspondent tilein the CM is less than a threshold T1;
• local consistence among the neighbouring blocks inthe overlap areas: more than the 90% of the pixels val-ues of the evaluated error surface ε must be less than athreshold T2.
2. Compute the Cumulative Minimum Error between theoverlapping areas defined as:
Ei, j = εi, j +min(Ei−1, j−1,Ei−1, j,Ei−1, j+1)
where i = 2, . . . ,N j = 2, . . . ,M and ε is N ×M.3. Finally, place the new tile cutting out its edges as delin-
c© The Eurographics Association 2014.
42
S. Fiorini, M. De Biasi, L. Ballerini, E. Trucco & A. Ruggeri / Synthetic Retinal Images Generation
eated by a Best Boundary Cut (i.e. the minimum value ineach row/column of E) and repeat.
The two thresholds (T1 and T2) have been heuristicallydetermined (10 and 0.05 respectively), as well as the defaulttiles and overlap dimension.
2.3. Optic Disc generation
The OD appears usually as a slightly irregular ellipse witha small inner depression, called cup. The edge of the ODis more evident in the red channel, while the inner cup isusually best highlighted in the green and blue ones. There-fore, to reproduce the same visual effect, we developed twoparametric intensity models, one for the red (Equation 2)and one for both the green and the blue channels (Equa-tion 3, where the meaning of the two parameter vectorsp̄ = [x0,y0,z0,a,σ1,A,ω] and q̄ = [p̄,x0,y0,σ2,k] will beclarified below):
fR(x,y, p̄) = z0−1
a+ exp[−(
x−x0+A cos(ωt)σ1
)2
−(
y−y0+A cos(ωt)σ1
)2](2)
fGB(x,y, q̄) = fR(x,y, p̄)+ k exp[−(
x− x0
σ2
)2
−(
y− y0
σ2
)2](3)
(a) (b)
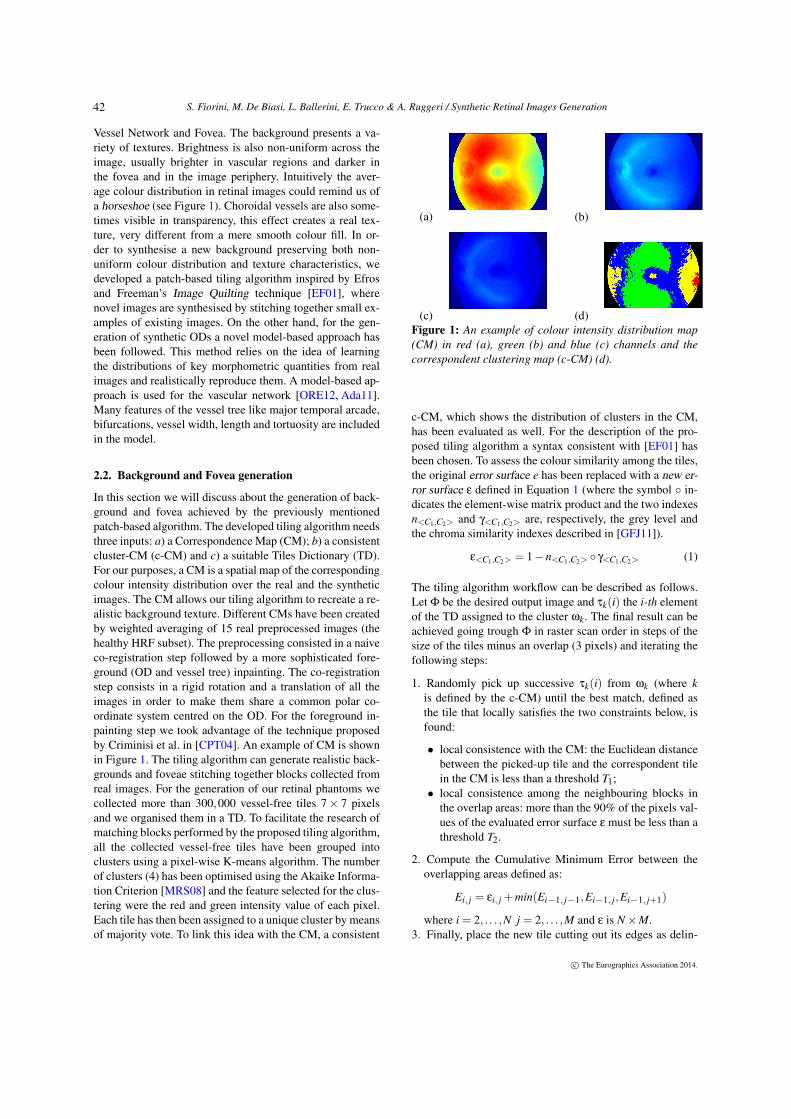
(c) (d)Figure 2: OD intensity models on the red (a), the green andthe blue (b) channels. Real OD data on the red (c) and green(d) channels.
The two models refer to a three-dimensional space, wherethe horizontal plane (x,y) is the image plane and the verticalaxis z is the colour intensity expressed in the (r,g,b) colourspace. The parameters of the models have been estimatedover 30 HRF images (15 healthy and 15 diabetic retinopathy)using a weighted nonlinear least squares criterion. Lookingat Figure 2 an explanation of the meaning of the parameterscould be provided as follows. While (x0,y0,z0) simply con-trol the translation of the surface along the axes, σ1 controlsthe spread of the surface in the horizontal plane (similarlyto the standard deviation in the Gaussian component, σ2).Tuning a we can also modulate the amplitude of the surface.
Figure 2a has a low frequency oscillating sinusoidal termthat models the irregularity on the OD edges (the cosine inEquation 2 is evaluated in [0, · · · ,2π]). Equation 3 presents asymmetrical Gaussian surface that models the inner cup pal-lor. A suitable probability distribution has been evaluated foreach parameter. Convincing ODs can be then synthesised byrandom sampling a set of parameters from the relative esti-mated distribution and then evaluating with them Equation 2and 3.
2.4. Vessel tree generation
In this section we will outline the vessel tree generation algo-rithm. An accurate description will be presented elsewhere.We face the problem of creating a realistic synthetic vascu-lature by dividing the algorithm in two main steps. The firststep is the creation of the vessel tree, that outlines all of thegeometric characteristics, like vessel calibers, angles, tortu-osity and lengths. For this step we use a model-based ap-proach to model the most important features. In the secondstep, the texture of the vessels is added on the tree, using apatch based algorithm. To reproduce the vasculature geome-try, we create two separate vessel trees: one for arteries andone for veins. The two different trees are created with thesame methodology and models, but the parameters used, insome cases, are different, in accordance to the reproducedvessel type. To reproduce the two distinct trees it was neces-sary to use a parabolic model of the Major Temporal Arcade(MTA) [ORE12] and a bifurcation model [Ada11]). The bi-furcation model is necessary to define the branching anglesand the vessels calibers referring to each bifurcation. For thecaliber of the first vessel of the tree we used a parametricmodel fitted from the real images. To add the vessel cen-terline tortuosity we used cubic splines. The control pointsof the spline are chosen using two different Gaussian distri-butions, one for the distance from the midline and one forthe interpoint distance. Varying the distribution parameterswe can control the tortuosity level of the vessels. Texture isadded on the synthetic vessels using a patch-based learningtechnique. We apply a quilting technique [EF01] to build alinear vessel of length equal to the branch centerline length.Then we warp the linear vessel to follow the centerline ofthe branch. Finally the branch with the texture is hooked onthe synthetic background.
3. Results
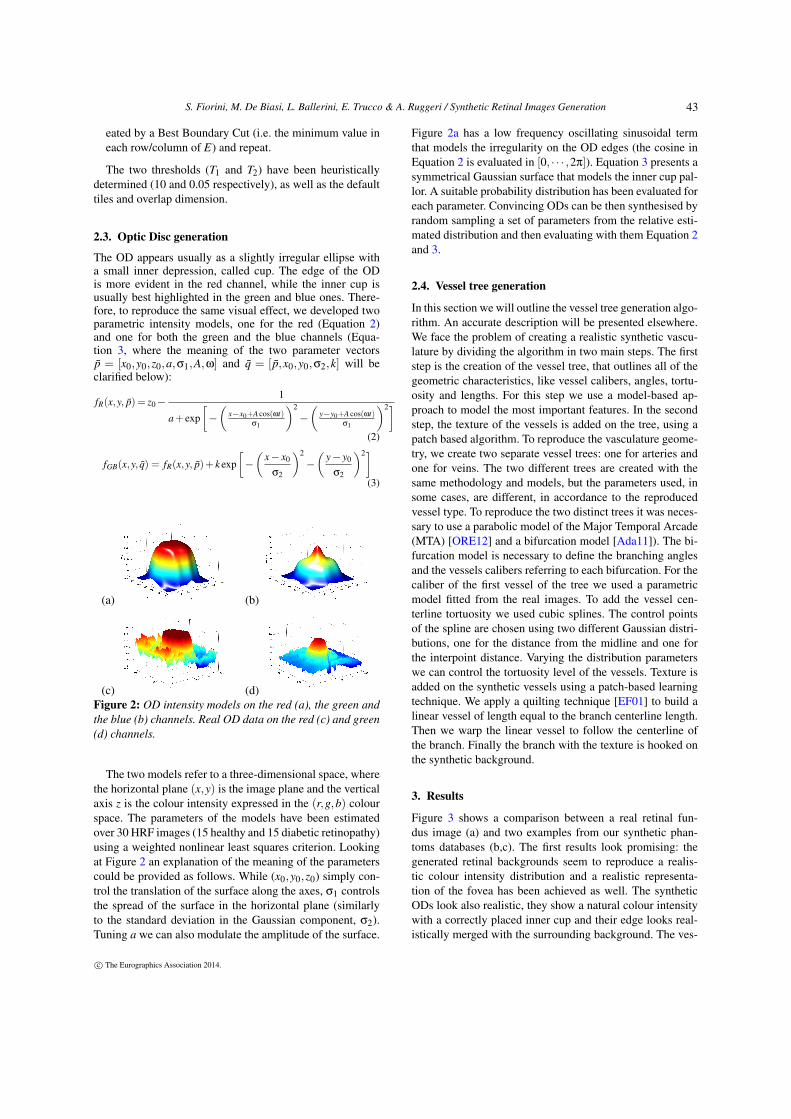
Figure 3 shows a comparison between a real retinal fun-dus image (a) and two examples from our synthetic phan-toms databases (b,c). The first results look promising: thegenerated retinal backgrounds seem to reproduce a realis-tic colour intensity distribution and a realistic representa-tion of the fovea has been achieved as well. The syntheticODs look also realistic, they show a natural colour intensitywith a correctly placed inner cup and their edge looks real-istically merged with the surrounding background. The ves-
c© The Eurographics Association 2014.
43
S. Fiorini, M. De Biasi, L. Ballerini, E. Trucco & A. Ruggeri / Synthetic Retinal Images Generation
(a) (b) (c)
Figure 3: A comparison between a real retinal fundus image from the HRF dataset (a) and two synthetic phantoms generatedwith our method (b) and (c).
sel trees look realistic, branches have tortuosity and shapesimilar to real ones and even the artifact of central reflexis reproduced. The main intended purpose of our syntheticimage generator is to provide a dataset along with GT im-ages (all parameters known) to validate retinal image anal-ysis algorithms. Assuming that the images are affected byadditive Gaussian noise, we compared the estimation of thenoise variance σ
2 (evaluated as suggested in [Gar10]) be-tween 15 real HRF and 15 synthetic images. The obtainedvalues are σ
2real = 0.020 and σ
2synth = 0.022. Then, we val-
idated our results proving that our synthetic vessel trees arerealistic and in the non-vascular regions no vessel-like pat-terns are created by our method. No intensity adjustment hasbeen provided for the vessel network, so the considered testonly concerns the false positive values. We used the VAM-PIRE software suite [TBR∗13] to detect vasculature maps on15 retinal phantoms and on 15 healthy HRF images providedwith manual GT; then we compared the two obtained falsepositive rate (FPR = FP
FP+T N ). The average FPR is 0.0214and 0.0138 on real and on synthetic images, respectively.
4. Conclusions
In this paper a novel technique for the automatic genera-tion of synthetic retinal fundus images has been presented.A realistic representation of the non-vascular regions (back-ground, fovea and OD) as well as the structure and textureof synthetic vessel trees has been achieved and we are cur-rently working on the generation of retinal abnormalities. Toour best knowledge, no similar method has been reportedin literature. The validity of our retinal phantoms has beensupported by visual inspection and quantitative experiments.We are aware of the preliminary nature of the conducted testand we plan a more complete analysis with automatic es-timates of further parameters and subjective evaluations byclinicians. However, the presented results let us sense thatwe are correctly moving towards the generation of a syn-thetic dataset for the validation of retinal image analysis al-gorithms.
Acknoledgements: Research partially supported by Lever-hulme trust grant RPG-419. We thank Roberto Annunziata
and Enrico Pellegrini for valuable comments and inspiringideas.
References[Ada11] ADAM J. A.: Blood vessel branching: beyond the stan-
dard calculus problem. Mathematics Magazine 84, 3 (2011),196–207. 2, 3
[AGS10] ABRÀMOFF M. D., GARVIN M. K., SONKA M.: Reti-nal imaging and image analysis. IEEE T-MI 3 (2010), 169–208.1
[CPT04] CRIMINISI A., PÉREZ P., TOYAMA K.: Region fillingand object removal by exemplar-based image inpainting. IEEETrans. on Image Processing 13, 9 (2004), 1200–1212. 2
[EF01] EFROS A. A., FREEMAN W. T.: Image quilting for tex-ture synthesis and transfer. In Proc. of SIGGRAPH’01 (2001),ACM, pp. 341–346. 2, 3
[Gar10] GARCIA D.: Robust smoothing of gridded data in oneand higher dimensions with missing values. ComputationalStatistics & Data Analysis 54, 4 (2010), 1167–1178. 4
[GFJ11] GUOBING P., FANG X., JIAOLIAO C.: A novel algo-rithm for color similarity measurement and the application forbleeding detection in WCE. IJIGSP 3, 5 (2011), 1. 2
[MRS08] MANNING C. D., RAGHAVAN P., SCHÜTZE H.: In-troduction to information retrieval, vol. 1. Cambridge universitypress Cambridge, 2008. 2
[OKB∗13] ODSTRCILIK J., KOLAR R., BUDAI A., ET AL.: Reti-nal vessel segmentation by improved matched filtering: evalua-tion on a new high-resolution fundus image database. IET ImageProcessing 7, 4 (2013), 373–383. 1
[ORE12] OLOUMI F., RANGAYYAN R., ELLS A.: Parabolicmodeling of the major temporal arcade in retinal fundus images.IEEE Trans. on Instrumentation and Measurement 61, 7 (2012),1825–1838. 2, 3
[PAM∗06] PATTON N., ASLAM T. M., MACGILLIVRAY T.,ET AL.: Retinal image analysis: concepts, applications and po-tential. Progress in retinal and eye research 25, 1 (2006), 99–127.1
[TBR∗13] TRUCCO E., BALLERINI L., RELAN D., ET AL.:Novel VAMPIRE algorithms for quantitative analysis of the reti-nal vasculature. In Proc. IEEE ISSNIP/BRC (2013), pp. 1–4. 4
[TRK∗13] TRUCCO E., RUGGERI A., KARNOWSKI T., ET AL.:Validating retinal fundus image analysis algorithms: Issues anda proposal. Investigative Ophthalmology & Visual Science 54, 5(2013), 3546–3559. 1
c© The Eurographics Association 2014.
44


![STAG DIESEL (Pompowtryskiwacze)[2017.10.19] PL EN RU ES PT ITfile.autogasmarket.ua/stag/docs/STAG-DIESEL-Unit... · 2020. 1. 21. · I info@ac.com.pl STAG DIESEL 3 Wiring diagram](https://img.pdfslide.us/doc/110x75/6089b495f716d74a545a5355/stag-diesel-pompowtryskiwacze20171019-pl-en-ru-es-pt-2020-1-21-i-infoaccompl.jpg)