Embed Size (px)
Citation preview

Building Assets, Building Credit: A Symposium on Improving Financial Services in Low-Income CommunitiesNovember 18-19, 2003
DRAFTCopyright 2003Please do not cite or distribute without permission from the author(s).
4.3: Automated Underwriting: Friend or Foe to Low-Mod Households and Neighborhoods?
By Susan Wharton Gates, Cindy Waldron, and Peter Zorn Freddie Mac
Panel 4: Improving Credit Information and Its Use in Mortgage Underwriting

Automated Underwriting: Friend or Foe to Low-Mod Households and Neighborhoods? Susan Wharton Gates, Cindy Waldron, and Peter Zorn Freddie Mac November 2003 DRAFT The authors greatly appreciate the assistance and suggestions of Glenn Canner, Marsha Courchane, Doug McManus, Melissa Post, Suzy Ptaszynski, Meera Srinivasan, Brian Surette and Don Bradley. Any errors are the authors’ alone. The views and opinions expressed in this paper are those of the authors, and do not necessarily reflect those of Freddie Mac or is Board of Directors. Abstract
Automated underwriting (AU) systems have become a tool of choice in mortgage lending
decisions. While AU provides significant benefits to mortgage originators and investors, some question AU’s impact on the access to credit for underserved populations.
In this paper, we use information from Freddie Mac’s Loan Prospector® (LP) automated underwriting system to assess the impact of AU on low- and moderate-income households and neighborhoods. Our evidence supports the view that AU improves access for these populations in the homeownership process. In particular, we find evidence that higher usage of AU/LP is associated with higher mortgage application accept rates for low- and moderate-income households and neighborhoods. For AU to reach its full potential in underserved markets, however, implementation challenges need to be addressed. These include issues related to non-traditional credit and the prevalence of unbanked consumers in low- and moderate-income communities.
Introduction
Homeownership historically has been a key vehicle for wealth generation for low- and
moderate-income households and neighborhoods (LM HH&N). Access to mortgage credit,
therefore, especially is critical for these groups, and automated underwriting (AU) increasingly
plays a central role in the allocation of, and access to, this credit. Our paper considers AU’s
impact on access to mortgage credit for low- and moderate-income households. Our evidence is
consistent with the view that AU enhances access to credit and improves LM HH&N
homeownership opportunities.
4.3: Automated Underwriting: Friend or Foe to Low-Mod Households and Neighborhoods?
2
Background
After nearly a decade of use, automated underwriting (AU) systems have become a
permanent fixture in mortgage lending. If usage of Freddie Mac’s Loan Prospector® (LP)
automated underwriting system is any indication, AU usage has become widely entrenched in
mortgage underwriting. For example, in 1995, when first introduced, LP processed 40,000
loans. Presently, LP is processing 40,000 loan applications a day, and is on record to hit the 10
million mark by the end of 2003.
All this follows from rather unremarkable beginnings. A key impetus behind the
development of AU was the mortgage processing bottleneck that characterized the 1992-93
refinance boom, the first substantial refinance wave in many years. Getting a lender on the
phone was challenging, and the mortgage loans that did get approved took, on average, two
months to close. Automation of the process was expected to serve many more borrowers, and
more loans (and money) could be made.
Concerns about mortgage lending discrimination also fueled the rise of automated
underwriting in the early 1990s. The Boston Fed’s seminal paper about racial discrimination
(1996) raised policymaker awareness about the potential disparate treatment of minority
applicants, highlighting, among other factors, the “thin files” of marginal borrowers. That
research spawned other discrimination studies and led to calls for greater objectivity in mortgage
underwriting.
When the Government Sponsored Enterprises (GSE) first brought their respective AU
systems to market in the mid 1990s, the new systems were met with strong skepticism. Would
the new technology work? Was it accurate? Would it increase costs? Would it find market
acceptance? Would it disadvantage low- and moderate-income borrowers and others on the edge
of the credit spectrum? So widespread was the concern about the new technology that then-
Senator Carol Moseley Braun (D-IL) requested written assurances from both Freddie Mac and
Fannie Mae that AU would be good for borrowers.
Freddie Mac’s response (1996) amounted to a set of promises. Statistical models based
on the experience of millions of mortgages could indeed be trusted; the simultaneous assessment
of multiple risk factors would prove more accurate than traditional human underwriting;
4.3: Automated Underwriting: Friend or Foe to Low-Mod Households and Neighborhoods?
3
machine-assisted underwriting could minimize subjective and possibly discriminatory aspects of
manual evaluations; and origination costs would decline due to increased speed and efficiency.
Evidence to date suggests that, on many of these issues, AU systems have lived up to
their promise. There has been a significant reduction in the time needed to process a loan
application – from days or weeks to a matter of minutes. This increased speed and efficiency has
lowered origination costs by as much as $1,500 a loan, according to Fannie Mae (Williams
2003), with much of these savings passed along to consumers.
Further, there are strong profit motives for lenders to use AU in considering all loan
applications – not just the easy approvals. According to an executive at Bank of America, failure
to use automated underwriting with as many borrowers as possible – even higher risk borrowers,
such as new immigrants – results in “many manual processes eating around profitability.”
(American Banker 2003). Over time, greater integration of AU with a lender’s manual and
automated processing systems, such as settlement and funding, will result in further cost
reductions. (Origination News 2003). AU also is paving the way for the eMortgage and the
controversial Guaranteed Mortgage Package, the centerpiece of HUD’s most recent proposal to
reform the Real Estate Procedures and Settlement Act. (Origination News 2002)
Another sign that AU has lived up to its promises is its handy weathering of a near-
perpetual refinance boom. In today’s low interest-rate environment, borrowers can readily reach
a mortgage lender, or shop around using a mortgage broker, who has access to multiple sources
of low-cost mortgage credit. This expanded access to mortgage money has allowed borrowers to
move in and out of increasingly lower-rate mortgages and tap billions in home equity – the chief
mainstay of U.S. economic health over the past few years. In a March 2003 speech, Federal
Reserve Chairman Alan Greenspan credited the evolution in mortgage lending, and particularly
the “ready source” of home equity for helping borrowers deal with financial vicissitudes. AU,
arguably, deserves much credit for this success.
The increased speed and reduced costs made possible by AU are in little dispute.
However, some skepticism continues regarding AU’s overall impact on borrowers. On the one
hand, the flexibility of AU has facilitated a growing diversity of mortgage products – those
featuring low- or no-down payment requirements, higher debt-to-income ratios, reduced cash
reserve requirements, flexible employment standards, and reduced mortgage insurance. Using
LP, for example, lenders can originate a 100 percent loan-to-value ratio (LTV) mortgage with a

4.3: Automated Underwriting: Friend or Foe to Low-Mod Households and Neighborhoods?
4
maximum 41 percent debt payment-to-income ratio, minimum of two months’ reserves and
reduced mortgage insurance to borrowers with strong credit.1 According to Harvard’s Joint
Center, the development of loan products such as these have enabled “more income-constrained
and cash-strapped borrowers at the margin to qualify for mortgage loans.” (Joint Center for
Housing Studies 1998).
Notwithstanding these benefits, concerns about racial discrimination and access to credit
in mortgage lending persist in some quarters. Whereas a decade ago, the dominant fair lending
concern was overt discrimination resulting from a subjective manual underwriting process,
recent concern focuses on potential unintended disparate impact resulting from automated
underwriting. Critics contend that because the statistical engine behind every AU system is
based on historical data, AU systems simply codify social inequities. Others express the view
that underserved populations will be systematically underrepresented in the data sets used to
develop and validate the statistical models, or that disparate impact may be more likely because
AU systems rely on standardized measures of credit history, income and financial reserves,
which are not randomly distributed throughout the population.
Other fair lending concerns center on “sins of omission,” that is, the possible failure of
AU systems to capture compensating factors that are more common for underserved populations.
Collins, Harvey and Nigro (2002) found that strict application of a “custom scoring model”
limited to variables such as finance company inquires and income in isolation (variables thought
to disadvantage minorities and low-income borrowers) resulted in higher denial rates among
low- and moderate-income households. Transparency is another key issue. Although the GSEs
and Fair Isaac have released information describing the key variables and weights underlying the
statistical models in AU, the exact details of AU scoring models are considered proprietary and
are not available for public scrutiny (neither are the precise guidelines and practices used in
manual underwriting). These concerns persist despite improved lender feedback and consumer
education about key risk factors.
Finally, some critics continue to believe that because AU is empirically based it is
somehow a “tougher” system than manual underwriting, resulting in reduced access to mortgage
credit among underserved borrowers. With regard to this concern, Gates, Perry, Zorn (2001)
1 See http://www.freddiemac.com/sell/factsheets/fm100.htm

4.3: Automated Underwriting: Friend or Foe to Low-Mod Households and Neighborhoods?
5
find evidence to suggest that AU has had quite the opposite effect. Using application data from
LP, they find that AU is more accurate than manual underwriting in predicting default for both
minority and non-minority families. In addition, they find that with each successive
improvement in LP’s predictive capability, LP “accept” rates have risen, particularly for minority
families. These findings support a sanguine view of AU – that it has resulted in more mortgage
money flowing to minority families, not less.
Extending Gates, Perry and Zorn (2001), we consider AU’s impact on low- and
moderate-income households. Specifically, we ask whether AU has increased access to
mortgage credit for LM HH&N, or whether it has left them behind in the effort to standardize
and automate the mortgage origination process.
Data and Analytical Approach
Evidence demonstrates that AU/LP can work well for LM HH&N
Data Approach
We use Freddie Mac proprietary data to demonstrate that LP accurately predicts default
for LM HH&N, just as it does for the population as a whole. We begin by segmenting the
population into groups of LM and non-LM households and LM and non-LM neighborhoods. We
then order these groups by LP score and separately break them into deciles. To assess the
accuracy of LP, we evaluate each decile group’s 90-day delinquency rate to determine whether
the loans assessed to be higher risk have a higher delinquency rate than those assessed to be
lower-risk.
We also examine the impact of each new version of LP by determining whether it
increases or decreases the accept rate for different borrower groups.
To identify LM HH&N, we use 2000 census tract income. Underserved loans in MSAs
are defined as loans where tract median income divided by MSA median income is less than or
equal to 1. Underserved loans in non-MSA areas are loans where tract median income divided
by all non-MSA loans in either state or county median income, whichever is greater, is less than
or equal to 1.

4.3: Automated Underwriting: Friend or Foe to Low-Mod Households and Neighborhoods?
6
Our analysis is based on two different data sources. To achieve loan level accuracy, we
use Freddie Mac purchases of 1996 and 1997 originations of conventional, conforming
mortgages. Because these loans are part of Freddie Mac’s securitized portfolio, we are able to
obtain performance data for these loans through December 2002. We also use a second set of
data to compare manual to AU. As described in Gates, Perry, Zorn (2001), we evaluate the
performance of nearly 1,000 loans originated in 1993 and 1994 and purchased by Freddie Mac in
1995 as part of an affordable housing initiative with a major lender. The loans were originally
manually underwritten; for the purpose of our earlier study, the loans were reassessed using
emulated versions of LP. We then attach delinquency performance data for these loans through
second quarter 2001.
Finally, we use a third data set to show that LP “accept” rates have risen with each new
release of LP. To demonstrate this, we use all conventional, conforming mortgage applications
scored through LP in 2002. For the purpose of this study, we reassess these loans using
emulated versions of LP’s 1995, 2000, and 2002 LP models.2
Statistical findings
LP can be described as accurate for LM HH&N if the loans originated to these
households that were predicted to be low risk actually perform as expected. LP clearly meets
2 Since we do not collect rent information, we set these investor applicants to “ineligible” (i.e., excluded them from the numerator), thereby understating our LM HH.
Exhibit 1. LP Accurately Predicts Default for Low/Mod Households and NeighborhoodsRelative 90-Day Delinquency Rates for 1996 and 1997 Originations
0
2
4
6
8
10
12
14
16
18
20
HighRisk
LowRisk
Loan Prospector 2002 Score
Perc
ent
Rel
ativ
e D
elin
quen
cy R
ates
Low-mod Households Non-Low-mod Households
0
2
4
6
8
10
12
14
16
18
20
HighRisk
LowRisk
Loan Prospector 2002 Score
Perc
ent
Rel
ativ
e D
elin
quen
cy R
ates
Low-mod Neighborhoods Non-Low-mod Neighborhoods

4.3: Automated Underwriting: Friend or Foe to Low-Mod Households and Neighborhoods?
7
this criterion, as illustrated in Exhibit 1. Loans originated in LM N that were assessed as higher
risk experienced default at a rate 168.5 times greater than those rated as the lowest risk. The
highest risk decile AU score for low-mod neighborhoods had a 16.1 percent delinquency rate,
compared to 0.095 percent for the lowest risk decile AU score. This criterion also held true for
non-LM N: delinquency rates for high-risk loans were 16.5 percent, compared to just 0.060
percent for lowest-risk loans.3
LP also meets this criterion for LM HH. Using Freddie Mac purchases of loans
originated in 1996 and 1997, the decile of LM HH with rated as high risk also experienced the
highest default with a 17.9 percent delinquency rate, compared to 15.1 percent for non-LM HH.
In contrast, the lowest risk LM HH had only a 0.16 percent delinquency rate, while the lowest
risk non-LM HH had a delinquency rate of 0.03 percent. This evidence shows that LP accurately
predicts default, especially for both low-mod neighborhoods and households.
Critics, however, often assert that AU provides less access or somehow is less predictive
than traditional manual underwriting. As described earlier, we address this question using the
sub-sample of roughly 1,000 loans purchased by Freddie Mac as part of an affordable housing
initiative. Exhibit 2 compares the actual performance of the affordable loans as assessed by
manual underwriting alone and assessed by LP. Panel A illustrates the comparison between
loans rated by manual underwriting alone and those rated by the 1995 version of LP. Panel B
shows the same comparison for the 2000 version of LP.
3 One interesting result is that LM N, at times, experience a lower delinquency rate than non-LM N.

4.3: Automated Underwriting: Friend or Foe to Low-Mod Households and Neighborhoods?
8
As can be seen, some loans were rated accept by LP but received a “caution” designation
by manual underwriters (“swap-ins”), while others were rated caution by LP but accept by
manual underwriters (“swap-outs”). These two groups of loans – the swap-ins and swap-outs –
are of most interest. Panel A shows that the 1995 version of LP does a better job distinguishing
between high- and low-risk loans than do manual underwriters. In particular, swap-ins have 90-
day delinquency rates one-fifth the average, and perform identically to loans rated accept by both
LP and manual underwriters. Similarly, swap-outs have 90-day delinquency rates 1.75 times the
average, and perform similarly to loans rated caution by both LP and manual underwriters. LP,
therefore, provides more accurate predictions in these data than do manual underwriters without
the benefit of AU.4
Subsequent refinements to LP have only enhanced the predictive power of the AU
system. Panel B compares the 2000 version of LP with traditional manual underwriting. Again,
4 The statistical validity of this claim is supported by the results of a Logit estimation explaining 90-day delinquency as a function of the four alternative risk classifications shown in panel A (LP accept/caution interacted with manual underwriting accept/caution). Each estimated coefficient in the model is statistically significant from zero. More importantly, the coefficient on swap-ins is statistically different from the coefficients on both swap-outs and loans assessed caution by both systems, but insignificantly different from loans rated accept by both systems. Similarly, the coefficient on swap-outs is statistically different from the coefficients on swap-ins and loans assessed accept by both systems, but insignificantly different from loans rated caution by both systems. Clearly LP is the more accurate system—it identifies swap-ins that perform like accepts, and swap-outs that perform like cautions.
Note: From Gates, Perry, Zorn: "Automated Underwriting in Mortgage Lending: Good News For the Underserved?"
Normalized 90-day Delinquency Rates for Loans Underwritten Manually and by Loan Prospector
Exhibit 2. LP Predicts Default Better for Low/Mod then Manual Underwriting
A . 1 9 9 5 V ers io n o f L P
0. 21 0.21
1. 521.75
0
2
4
LP risk class accept accept caution cautionManual risk class accept caution caution accept% of loans 24.02 20.76 27.72 27.5
B . 2000 Ve rsion of LP
LP Risk Class accept accept caution cautionManual Risk Class accept caution caution accept% of loans 44.67 42.72 5.76 6.85
0.66 0.75
2.55
3.52
0
2
4

4.3: Automated Underwriting: Friend or Foe to Low-Mod Households and Neighborhoods?
9
the performance of swap-ins and swap-outs is most relevant, and again swap-ins perform
similarly to loans rated accept by both “systems” while swap-outs perform similarly to loans
rated caution by both systems.5 Where the underwriting systems disagree, both versions of LP
clearly better predict the actual outcomes in these lower-income borrower data than do these
manual underwriters.
LP can be shown to be expanding its reach to LM HH&N if accept rates for the same
population of applicants increases with each new version. The data in Exhibit 3 support this
claim. Comparing the 1995, 2000 and 2002 versions of LP (as applied to the 2002 population of
LP applications) shows that accept rates increased from 1995 to 2000, and again from 2000 to
2002 for LM, non-LM and all neighborhoods and households. Accept rates for LM HH rose
from 51.8 percent using the 1995 version to 83.4 percent in 2002. Similarly, accept rates for LM
N neighborhoods rose from 55.5 percent with the 1995 version to 83.3 percent in 2002.
In summary, LP is highly accurate in predicting risk for LM HH&N, just as it is for the
population as a whole. LP also has been shown to be more accurate than traditional manual
underwriting for our sample of affordable loans. With each improvement in its risk assessment
capability, LP has expanded the universe of “accepts” to include more underserved borrowers.
5 The Logit estimation associated with panel B similarly shows that swap-ins identified by LP perform like accepts, and swap-outs identified by LP perform like cautions. In this estimation, however, the coefficient on swap-outs is insignificantly different from zero, where a zero coefficient implies that relative 90-day delinquency rates for swap-outs are predicted to be roughly 4.8 times the average.
Exhibit 3. LP Accept Rates Have Improved Over time
55.5%
67.6%
78.0% 83.3%
70.7%
90.1%
0%10%20%30%40%50%60%70%80%90%
100%
1995 Version 2000 Version 2002 Version
Acc
ept R
ate
in P
erce
ntag
e
Low-mod Neighborhood Non-Low-mod Neighborhood
51.7%
72.1%
83.4%
70.3%77.4%
90.3%
0%10%20%30%40%50%60%70%80%90%
100%
1995 Version 2000 Version 2002 Version
Acc
ept R
ate
in P
erce
ntag
e
Low-mod Household Non-Low-mod Household

4.3: Automated Underwriting: Friend or Foe to Low-Mod Households and Neighborhoods?
10
Evidence supports the view that increased use of AU/LP is associated with increased access to credit for low-mod households and neighborhoods
Data Approach
We use Freddie Mac proprietary data, data collected under the Home Mortgage
Disclosure Act (HMDA) and Census data to demonstrate that an increased use of AU/LP is
associated with increased access to credit for LM HH&N (defined as higher market accept rates).
To examine the usage and accept rate correlation, we group LP, HMDA and Census data by
tract, and merge the dataset for aggregate tract information. The datasets include conventional,
conforming mortgage applications scored through LP in 2002, all conventional, conforming
mortgage applications in the 2002 HMDA, and the 2000 census.
We geocode all LP applications and sum them by census tract. From the LP applications
we include application counts by feedback message category (accept, caution, unscorable) and
mean FICO score. We also sum the HMDA data by census tract. From the HMDA data we
include information on the application “outcome” (originated, approved but not accepted, denied,
withdrawn and closed), as well as the mean loan amount, the distribution of applications by
lender type (thrift, credit union, mortgage bank and commercial bank), the number of separate
lenders taking applications in the tract, loans purchased by the GSEs, and the number of
purchase and refinance applications.
From the 2000 census we obtain tract-level information on the number of owner- and
rental-occupied units, median house value, median gross rent, population by race and ethnicity
(African-American, Hispanic, other minority, white non-Hispanic), whether or not the tract is
low-mod (median income less than or equal to area median income), and the MSA of the tract.
Access to credit in a tract is measured as the percent of HMDA applications “accepted.”
The numerator of the accept rate is defined as originated and approved but not accepted
applications. The denominator of the accept rate was defined in two ways: (1) originated,
approved but not accepted, and denied, (our preferred) and (2) all applications originated,
approved but not accepted, denied, withdrawn and closed. We also compute the accept rate for

4.3: Automated Underwriting: Friend or Foe to Low-Mod Households and Neighborhoods?
11
two separate populations: (1) all conventional conforming applications (our preferred), and (2)
all conventional conforming applications excluding subprime.6
Statistical findings
One strategy for assessing the potential benefit that AU can bring to LM HH&N is to
compare the LP accept rate to the average accept rate of market participants. To the extent that
LP accept rates exceed those in the market, it is likely that increased use of LP will have a
beneficial impact on credit flows.
In this section, we compare accept rates for LP to HMDA accept rates for low-mod and
non-low-mod households and tracts. This comparison necessarily is crude for several reasons.
First, LP and HMDA are used for somewhat different populations of applications. HMDA, for
example, does not cover applications from independent mortgage brokers, but mortgage brokers
are large users of LP. Another example of the differences is that LPprimarily is used by Freddie
Mac customers in the prime market, while HMDA covers a broader range of mortgage
originators. Second, it is hard to match perfectly the “decisions” of LP and the results reported
under HMDA. Categories in HMDA include originated, approved but not accepted, denied,
withdrawn, closed and purchased from another institution. Obviously it is appropriate to drop
loans purchased from another institution in calculating the accept rate (either they are included
elsewhere in HMDA for another institution, or they are seasoned loans which should be included
in another year). It is hard, however, to know how best to treat withdrawn and closed
applications. If withdrawals are a random sample of accepts and denials, excluding them from
the calculation will introduce no bias in our calculation of the HMDA accept rate. However: (1)
there is no reason to think withdrawals are randomly distributed, and (2) LP has no equivalent
category (once submitted, applications are processed within two minutes, leaving no time for a
withdrawal). Closed applications too may not be drawn randomly from the population of accepts
and denials, so it also is difficult to know how best to deal with them. Within LP “unscorable”
may be the rough equivalent to closed, if closed loans in HMDA arise because of incomplete
files or information. Another difference is that HMDA includes subprime applications, and LP is
designed as a tool for prime lenders.
6 We use the HUD criteria for excluding subprime applications.

4.3: Automated Underwriting: Friend or Foe to Low-Mod Households and Neighborhoods?
12
To address these concerns, we provide four sets of accept rates for HMDA, and two sets
for LP. For HMDA, we include or exclude withdrawn and closed applications from the
denominator, and calculate across two populations (all conventional conforming and
conventional conforming excluding subprime). For LP we calculate accept rates including or
excluding unscorable applications.7 Our preferred comparison is a HMDA accept rate that
includes all conventional conforming (i.e., below the conforming loan limit, but including
subprime) applications, but excludes withdrawn and closed from the denominator, and an LP
accept rate that excludes unscorable from the denominator.
The higher accept rates for LP suggest (subject to the caveats above) that increasing LP
usage would increase market accept rates, and so increase access to credit (disproportionately) to
low-mod communities. This, however, does not provide an indication of whether or not
increased usage of LP actually is associated with greater access to credit for low-mod households
and neighborhoods. To address this issue we now turn our attention to the empirical relationship
between LP usage and HMDA accept rates.
We start by noting three factors that make assessing this relationship difficult. First, the
LP usage rate in a tract likely is endogenous. Each application sent through LP requires a
payment from the lender, and cost-conscious lenders may make efforts to reduce the number of
caution applications sent through LP. As a result, LP usage rates may be lower in tracts with
disproportionately greater numbers of high-risk applicants. To address this problem we
separately estimate LP usage by tract, and use the predicted rather than actual LP usage rate in
estimations explaining HMDA accept rates. (The qualitative results are relatively robust to
whether actual or predicted LP usage rates are used in the estimation.)
7 We count as an accept for LP all applications receiving an accept, with or without required delivery fees (i.e., we include A-minus accepts).
Low-Mod Household
Non-Low-Mod Household
Low-Mod Neighborhood
Non-Low-Mod Neighborhood
83.36% 90.27% 83.24% 90.17%80.11% 85.97% 79.29% 86.44%
Restricted 80.70% 88.85% 83.14% 89.98%Unrestricted 73.51% 82.09% 75.46% 82.83%Restricted 71.48% 84.27% 73.64% 84.85%
Unrestricted 60.62% 73.80% 61.92% 74.22%
Unrestricted
Includes Subprime
PrimeHMDA
Exhibit 4. Loan Propector 2002 Accept Rates Versus the Market (HMDA)
LPRestricted

4.3: Automated Underwriting: Friend or Foe to Low-Mod Households and Neighborhoods?
13
Second, we have data only on LP, but want to draw inference about the role of AU as
used by the GSEs (i.e., the effect of both LP and Fannie Mae’s Desktop Underwriter (DU)). If
LP and DU usage are highly positively correlated by tract then the use of LP alone may be a
good proxy for AU combined. This correlation unlikely is perfect, however, suggesting that
empirical estimates likely underestimate (bias toward zero) any actual relationship between LP
usage and HMDA accept rates.
Third is the issue of causality. We cannot determine if LP usage rates determine HMDA
accept rates, or instead, the causality goes in the opposite direction. That is, “knowing” that
applications in a tract will have a high accept rate, do Freddie Mac customers/lenders choose to
send a greater percentage of their applications through LP in order better to provide the
opportunity to securitize the mortgages in the secondary market?
We are unable to fully resolve this with the data used in our study. The ideal data for
assessing causality would be som an event study with controls – observations on HMDA accept
rates over time, separately in tracts where LP is introduced or not. Instead we rely on explaining
cross-sectional variation in HMDA accept rates in a market largely dominated by AU. The lack
of a true “event” or “treatment” in our data makes it difficult to determine whether the causality
flows from LP usage rates to HMDA accept rates, or vice versa. Moreover, the current
widespread nature of AU usage may bias towards zero the estimate of any positive relationship
that does exist between the introduction and usage of AU/LP and HMDA accept rates. For
example, the market acceptance of AU systems and the ready availability of such systems may
provide the greatest increase in access to credit. Because AU/LP usage already is widespread,
cross-sectional variability in LP usage rates may not reveal its full beneficial impact on market
accept rates.
Our first approach is to look at the simple relationship between LP usage rates and
HMDA accept rates. To get a sense of the underlying functional relationship, we rank-order
tracts by their LP usage rate (lowest to highest), divide the distribution into deciles, and then
separately compare HMDA accept rates for low-mod and non-low-mod tracts in each decile.

4.3: Automated Underwriting: Friend or Foe to Low-Mod Households and Neighborhoods?
14
The results of this simple analysis show a reasonably strong relationship between
increasing LP usage rates and increasing HMDA accept rates. For both low-mod and non-low-
mod tracts, increasing LP usage rates are associated with almost perfectly consistent increases in
HMDA accept rates. This especially is true for low-mod tracts. For example, moving from the
3rd to the 8th deciles (an increase in LP usage rates from 20 percent to 44 percent, roughly the
inner-quartile range) increases HMDA accept rates in low-mod tracts by 8 percentage points. To
put this in perspective, an 8 percentage point increase in accept rates across all low-mod tracts
would eliminate roughly 75 percent of the average difference in accept rates between low-mod
and non-low-mod tracts. The same increase in non-low-mod tracts, however, is associated with
a lower 2.6 percentage point increase in HMDA accept rates.
Holding aside the issue of causality, the observed relationship with HMDA accept rates
may be attributed, at least partially, to factors other than LP usage. To address this concern we
estimate HMDA accept rates as a function of other explanatory variables, and assess the
remaining (marginal) impact of LP usage.8 Variables included as explanatory controls fall into
several broad categories.9 The first are variables designed to capture basic underwriting criteria,
which include: (1) the distribution of applications across FICO score buckets – 0 to 680, 681 to 8 We obtain qualitatively similar results to those presented here when the dependent variable in the analysis is the logarithm of accept rate rather than accept rate. 9 Not reported are the results of estimations that also include the race/ethnicity distribution of the population in the census tract (African-American, Hispanic, other minority, White). Inclusion of these variables does not change our qualitative results.
Low-mod tractsNon-Low-mod
tracts1 7.32% 70.00% 83.54%2 14.98% 68.92% 83.57%3 20.28% 70.37% 83.59%4 24.96% 72.73% 83.06%5 29.17% 74.53% 83.05%6 33.42% 75.54% 83.74%7 37.97% 77.22% 84.84%8 43.55% 78.40% 86.19%9 51.49% 79.30% 87.77%
10 72.92% 79.29% 88.89%
Exhibit 5. HMDA Accept Rate by LP Application Rate Decile
LP Application Rate Decile
Mean LP Application
Rate
Mean HMDA Accept Rate
4.3: Automated Underwriting: Friend or Foe to Low-Mod Households and Neighborhoods?
15
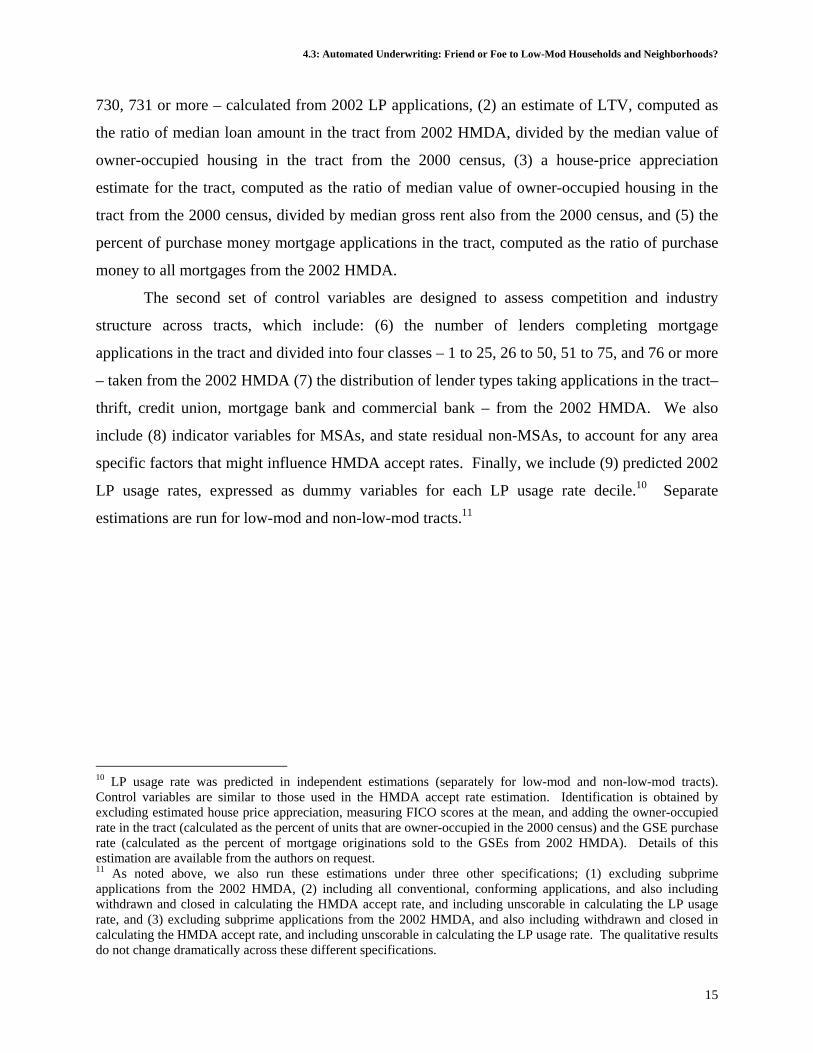
730, 731 or more – calculated from 2002 LP applications, (2) an estimate of LTV, computed as
the ratio of median loan amount in the tract from 2002 HMDA, divided by the median value of
owner-occupied housing in the tract from the 2000 census, (3) a house-price appreciation
estimate for the tract, computed as the ratio of median value of owner-occupied housing in the
tract from the 2000 census, divided by median gross rent also from the 2000 census, and (5) the
percent of purchase money mortgage applications in the tract, computed as the ratio of purchase
money to all mortgages from the 2002 HMDA.
The second set of control variables are designed to assess competition and industry
structure across tracts, which include: (6) the number of lenders completing mortgage
applications in the tract and divided into four classes – 1 to 25, 26 to 50, 51 to 75, and 76 or more
– taken from the 2002 HMDA (7) the distribution of lender types taking applications in the tract–
thrift, credit union, mortgage bank and commercial bank – from the 2002 HMDA. We also
include (8) indicator variables for MSAs, and state residual non-MSAs, to account for any area
specific factors that might influence HMDA accept rates. Finally, we include (9) predicted 2002
LP usage rates, expressed as dummy variables for each LP usage rate decile.10 Separate
estimations are run for low-mod and non-low-mod tracts.11
10 LP usage rate was predicted in independent estimations (separately for low-mod and non-low-mod tracts). Control variables are similar to those used in the HMDA accept rate estimation. Identification is obtained by excluding estimated house price appreciation, measuring FICO scores at the mean, and adding the owner-occupied rate in the tract (calculated as the percent of units that are owner-occupied in the 2000 census) and the GSE purchase rate (calculated as the percent of mortgage originations sold to the GSEs from 2002 HMDA). Details of this estimation are available from the authors on request. 11 As noted above, we also run these estimations under three other specifications; (1) excluding subprime applications from the 2002 HMDA, (2) including all conventional, conforming applications, and also including withdrawn and closed in calculating the HMDA accept rate, and including unscorable in calculating the LP usage rate, and (3) excluding subprime applications from the 2002 HMDA, and also including withdrawn and closed in calculating the HMDA accept rate, and including unscorable in calculating the LP usage rate. The qualitative results do not change dramatically across these different specifications.

4.3: Automated Underwriting: Friend or Foe to Low-Mod Households and Neighborhoods?
16
The results of the estimations are sensible, and the fits as measured by R-squares are
reasonably high (0.768 for low-mod tracts and 0.708 for non-low-mod tracts). The coefficients
on the underwriting variables generally have the expected sign. FICO scores, for example, are
positively correlated with accept rates. Interestingly, however, this relationship is stronger in
non-low-mod than in low-mod tracts. A low-mod tract having entirely applications with FICO
scores under 680 would have an 18-percentage point lower HMDA accept rate, all things equal,
than a tract having entirely applications with FICO scores above 730. In non-low-mod tracts,
however, an equivalent difference is associated with a 33 percentage point difference in HMDA
accept rates. Tracts with a higher percentage of purchase money applications are found to have
higher HMDA accept rates, as are tracts with higher estimated house price appreciation
estimates. Surprisingly, however, HMDA accept rates are found to increase, all things equal,
with an increase in our estimated LTV ratio. Accept rates also are found to be higher the greater
number of lenders active in the tract, with this effect being far more pronounced in low-mod than
non-low-mod tracts. Relative to tracts dominated by applications to commercial banks, tracts
with greater thrift or credit union activity are found to have higher HMDA accept rates, all things
equal, while tracts with higher mortgage bank activity are found to have lower accept rates.
Estimate Standard Error Estimate Standard ErrorPredicted LP App Rate 1 -0.1206 0.0018 -0.0009 0.0012Predicted LP App Rate 2 -0.1015 0.0016 -0.0056 0.0010Predicted LP App Rate 3 -0.0898 0.0015 -0.0042 0.0010Predicted LP App Rate 4 -0.0778 0.0014 -0.0072 0.0009Predicted LP App Rate 5 -0.0693 0.0013 -0.0047 0.0008Predicted LP App Rate 6 -0.0578 0.0012 -0.0075 0.0008Predicted LP App Rate 7 -0.0480 0.0012 -0.0040 0.0007Predicted LP App Rate 8 -0.0332 0.0011 -0.0026 0.0007Predicted LP App Rate 9 -0.0232 0.0010 -0.0038 0.0006Predicted LP App Rate 10 0.0000 0.0000 0.0000 0.0000Fico Score 0 to 680 -0.1817 0.0022 -0.3274 0.0019Fico Score 681 to 730 -0.0814 0.0028 -0.1146 0.0030Loan to Value Ratio 0.0692 0.0012 0.0164 0.0011House Price Appreciation Estimate 0.0161 0.0003 0.0037 0.0002Purchase Rate 0.1180 0.0021 0.0819 0.0021Lenders 1-25 -0.1250 0.0017 -0.0397 0.0024Lender 26-50 -0.0631 0.0007 -0.0205 0.0008Lenders 51-75 -0.0329 0.0004 -0.0086 0.0005Lenders 76 or more 0.0000 0.0000 0.0000 0.0000% apps from thrifts 0.0603 0.0035 0.0337 0.0031% apps from Credit Unions 0.3116 0.0076 0.0313 0.0064% apps from mortgage banks -0.3868 0.0028 -0.3663 0.0029Mean HMDA Accept RateR-Square
74.80% 85.75%0.70800.7680
Low-Mod Tracts Non-Low-Mod TractsVariable
Exhibit 6. Estimations Predicting HMDA Accept Rates by Tract

4.3: Automated Underwriting: Friend or Foe to Low-Mod Households and Neighborhoods?
17
Interestingly, credit union activity especially is found to have a positive impact on HMDA accept
rates in low-mod tracts.
Most relevant for our interests, however, is the estimated marginal impact of LP usage
rates. Our estimation confirms the strong relationship found between LP usage rates and HMDA
accept rates in low-mod tracts. In particular, moving from the 3rd to the 8th deciles in LP usage
is, on the margin, associated with a 5.7-percentage point increase in HMDA accept rates in low-
mod tracts. This roughly is 70 percent of the 8-percentage point difference observed in the
simple univariate analysis. In contrast, however, the equivalent movement from the 3rd to the 8th
deciles in non-low-mod tracts is associated with only a 16 basis point increase in HMDA accept
rates.
Clearly there is a strong relationship between LP usage and HMDA accept rates in low-
mod tracts. While our analysis does not definitively prove that increasing LP usage rates lead to
higher accept rates, and better access to credit in low-mod communities, our results are
consistent with this view.12 Moreover, the size of the estimated impact is significant. Average
HMDA accept rates in low-mod tracts are roughly 11 percentage points lower than in non-low-
mod tracts. Roughly 7 percentage points of this differential can be explained by the control
variables in our estimation, leaving an unexplained residual of about 4 percentage points.13 One-
quarter of this unexplained residual (roughly 1 percentage point) could be eliminated by
increasing the LP usage rate in low-mod tracts by 5 percentage points (equating the average LP
usage rate in low-mod and non-low-mod tracts). Alternatively, doubling the current average LP
usage rate of 28 percent in low-mod tracts would cut almost in half the 11 percentage point
differential in HMDA accept rates between low-mod and non-low-mod tracts.
12 In addition to the issues outlined above, the decision of whether or not to offer credit rests with the lender/originator irrespective of any AU assessment. An originator, for example, is neither compelled to offer credit in response to an “accept” nor precluded from doing so in response to a “caution.” 13 We calculate the unexplained residual difference in average accept rates between low-mod and non-low-mod tracts by: (1) using the parameter estimates from non-low-mod tracts to estimate the HMDA accept rate of low-mod tracts, (2) calculating the difference in this predicted value and the observed accept rates in low-mod tracts, and (3) calculating the average difference in predicted and observed accept rates across all low-mod tracts (weighted by the total number of applications in each tract).
4.3: Automated Underwriting: Friend or Foe to Low-Mod Households and Neighborhoods?
18
Discussion and Policy Implications
Taken together, these findings provide evidence that AU/LP is far more a friend than a
foe to low- and moderate-income households and neighborhoods. LP is shown to be highly
predictive of default for these borrowers, and accept rates have risen with successive
improvements in the LP scorecard. While not definitive, our regression results also support the
view that increased LP usage is positively correlated with higher market accept rates – and
greater mortgage credit flows to low- and moderate-income communities.
These results stimulate a number of policy questions, even as they do much to satisfy
concerns about disparate impact. First, having shown that AU is can lead to improved access to
credit for LM HH&N, what can be done to expand AU usage, thereby increasing the flow of
mortgage credit to this underserved population? Second, what can be done to expand AU
flexibility to handle “unscorable” loan applications, such as those from borrowers with non-
traditional credit and other risk factors? Third, to what extent are further improvements in accept
rates for low- and moderate-income families likely or possible?
How to Expand AU Usage in Underserved Communities?
To answer this question, we consider both supply and demand-side issues pertaining to
AU usage in LM N. On the supply side, we consider the extent to which there are significant
differences among financial institutions in their “taste” for AU, and whether different institutions
tend to serve lower-income areas. If there are disparities in usage across institution type, efforts
should be made to understand and remove impediments to usage by all lending types.
There are a number of reasons to believe this is not the case. Given the high level of
competition in mortgage lending, and the demonstrated process savings associated with using
AU, it is unlikely that a given institution would choose to forego automated processes in favor of
manual underwriting ceteris paribus. In addition to enhanced efficiency, AU systems such as LP
can greatly facilitate the sale of mortgages into the secondary market. Institutions that tend to
keep their mortgages in portfolio rather than sell them to the secondary market agencies also
have strong incentives to use AU. As a predictive tool, AU can greatly assist a lender in
maintaining the quality of its retained portfolio.

4.3: Automated Underwriting: Friend or Foe to Low-Mod Households and Neighborhoods?
19
Notwithstanding these competitive incentives to use AU, we did observe disparities in
usage across institution type. Our LP usage estimations show that, compared to commercial
banks, LP usage in low- and moderate-income tracts is significantly lower when business
(application volume) in those tracts is dominated by mortgage banks, and significantly higher
when business is dominated by credit unions, with thrifts performing roughly the same as
commercial banks. More research is needed to understand this phenomenon – starting with
comparing LP usage with the usage rates of other AU systems, such as Fannie Mae’s DU in
those same tracts.
Because of the marginal cost of using AU, individual lenders may be discriminate in their
use of these systems. Rather than run each and every loan through an automated system, they
may rely on blending elements of traditional manual underwriting and experience using a
particular AU system to make a determination whether it is “worth it” to pay a fee to run a
relatively weak loan application through AU. AU systems that permit multiple “tries” diminish
the incentive to put only the strongest loans through AU. In the case of Freddie Mac’s LP
system, lenders pay approximately $20 per loan application – but are able to resubmit it up to 15
times. This gives them enormous flexibility to adjust different variables, such as loan amount or
down payment amount. Not surprisingly, the majority of loan applications run through LP – 88
percent in 2002 – receive an “accept.”
Demand side issues are more likely to blame for relatively lower AU usage rates in LM
N. That is, even controlling for a host of demographic variables, low- and moderate-income
families are less likely to pursue homeownership. Increasingly, market participants are coming
to the realization that intangible barriers to homeownership, such as fear of discrimination, as
well as certain misconceptions about the homebuying process, are keeping people from applying
for mortgages in the first place.
In a recent national survey, 70 percent of African American respondents and 55 percent
of Latino respondents believe that lenders posed a major obstacle to getting a mortgage (Voter
Consumer Research 2003).14 With regard to misconceptions, 49 percent of African American
respondents and 51 percent of Latino respondents believe that it is necessary to have “almost
perfect” credit to obtain a mortgage. Down payments also are perceived to be a major hindrance,
14 The telephone survey was conducted for Freddie Mac in May 2003. The national survey included 600 African American and 600 Hispanic respondents.

4.3: Automated Underwriting: Friend or Foe to Low-Mod Households and Neighborhoods?
20
with 38 percent of African American respondents and 40 percent of Latino respondents believing
that a 20 percent down payment is necessary to purchase a home.
These findings indicate that consumers are getting dated – if not inaccurate – information
about mortgage lending. These misconceptions likely discourage many creditworthy lower-
income borrowers from pursuing homeownership. If lower-income and minority households do
choose to apply for a mortgage, they are more likely to turn to the higher-cost subprime market.
Canner and Passmore (1999) were among the first to recognize the increasingly aggressive role
played by subprime lenders in supplying mortgage credit to lower-income and minority
borrowers. More recently, Harvard’s Joint Center (2003) estimates that between 1993 and 2001,
the share of subprime home purchase loans originated in underserved communities rose from 2.4
percent to 13 percent, while the subprime share of refinances rose from 6.8 percent to 27.5
percent. Given these strong growth trends, it is not surprising that LP usage is lower in tracts
with a higher subprime presence.
These findings underscore the critical need for effective financial literacy programs. To
ensure that families that want mortgages are not misinformed about the homebuying process, and
to ensure that they get the lowest-priced mortgage for which they can qualify, targeted public
information campaigns and effective financial literacy programs are needed. Sensing a largely
untapped and profitable market, many financial institutions have developed multi-lingual
outreach programs designed to minimize fear of the homebuying process, provide accurate
information to prospective borrowers and build trust.
What about applications that are currently unscorable?
To achieve its potential in underserved communities, AU ultimately will need expanded
capability to process a more heterogeneous set of underwriting variables. Standardization is a
great strength of AU because it ensures efficient processing and consistent results. It also
presents a key challenge to its broader applicability. Today, mortgage applicants with non-
traditional credit, or no credit history (or no U.S. credit history) are likely relegated to manual
underwriters or denied access to mortgage credit altogether.
Efforts to address this shortcoming, such as through collection of rental or utility payment
history, are well intentioned but potentially problematic. There is a lack of consistency in

4.3: Automated Underwriting: Friend or Foe to Low-Mod Households and Neighborhoods?
21
alternative payment histories, and there currently are no central repositories of such information,
making the data difficult and expensive to collect. Even if alternative credit data could be
efficiently collected, it would take some time before enough performance data can be collected
so that mortgage investors are confident in the predictive power of these variables, and the
accuracy of the statistical models that utilize them. It was recently reported that Fair, Isaac, is
taking steps down this path. (Harney 2003).
Until such time that AU systems are able to flexibly handle non-traditional credit,
mortgage market participants can act proactively. For example, mortgage originators and
insurers could “experiment” with the use of non-traditional credit for affordable products by
giving “credit” for such factors as a history of timely rent payments when underwriting the
application. By limiting the program to affordable products, the risk to the insurer would be
limited, while providing the greatest opportunity to expand homeownership opportunities for LM
HH&N. Moreover, a history of such experiments would provide data from which predictive
power could be assessed.
“Unbanked” households present an extreme version of non-traditional credit. Without a
reasonably extensive formal history to refer to, it is difficult to accurately assess the credit
worthiness of unbanked households. Because unbanked households are more likely have “thin
files,” they especially raise concerns for AU given its reliance on computerized records.
By most estimates, between 10 percent and 15 percent of all households do not own a
checking account. In addition to not having enough income to warrant opening an account, or
little need to write checks, other reasons a consumer might choose not to engage in the
mainstream financial market include cost (account fees and charges for bounced checks), privacy
issues and lack of comfort or trust of financial institutions (Caskey 1997). Minority and
immigrant households, in particular, may avoid establishing formal ties with mainstream
financial institutions for fear of racial discrimination or the reporting of immigrant status, or a
general distrust of institutions arising from their experiences in their home countries.
Vermilyea and Wilcox (2002) found that minority households are more likely than white
households to be unbanked and that when they do enter the banking system, they are more likely
to open a savings account than a checking account. This is not to say that underserved
populations do not engage in financial transactions; rather, they are more likely to use check-
cashing operations, pawnshops or other entities that comprise the “poverty” or alternative

4.3: Automated Underwriting: Friend or Foe to Low-Mod Households and Neighborhoods?
22
financial services market. Like their subprime lending counterparts, these entities have increased
exponentially over the past two decades following banking deregulation in the 1980s.
Mainstream financial relationships not only are key to establishing a track record of
saving and credit usage, they are key to a consumer’s ability to accumulate assets. In testimony
before the Senate Banking Committee, Fran Grossman, Executive Vice President of Shorebank
Advisory Services stated:
Assets are a crucial ingredient in the recipe for financial stability and wealth accumulation. Assets link individuals to major financial institutions and capital markets. This, in turn, increases access to networks that connect people with jobs…Many low-income families are already savers, whether or not they have a bank account. But without the connection to a financial institution, these families will face more obstacles along the path to prosperity. (May 2, 2002)
The importance of banking relationships to asset accumulation is borne out in the recent
attitudinal survey conducted for Freddie Mac: 71 percent of African American respondents
stated that “being unfamiliar with how the banking system works and not having a bank account”
was a major obstacle in trying to buy a home, compared to 66 percent for Latino respondents.
In another, more limited Freddie Mac-sponsored survey (Tomas Rivera 2003) of
Mexican-heritage households in three metropolitan areas, 54 percent of the Mexican-heritage
renters reported having no banking relationship, and 64 percent reported having no credit cards.
Widespread unfamiliarity with the banking system, or lack of a banking account, could lead a
large proportion of these households to turn to subprime lenders for their mortgage credit needs.
Here again, broad based bi-lingual borrower credit education is needed to encourage
potential homeowners, and especially new immigrants, to develop the credit histories and
banking relationships that will ease their access to mortgage credit. For example, financial
services programs aimed at Mexican nationals who have not yet received U.S. identification can
accept an ID card called the “matricula consular” to help new immigrants get a “jump start” in
establishing banking and ATM accounts (Derus, 2003).
Given concerns about the high cost of checking accounts, Individual Development
Accounts (IDAs), whereby consumers make savings deposits that are matched by employers or
other third parties, are particularly promising. With little or no administrative fees, these

4.3: Automated Underwriting: Friend or Foe to Low-Mod Households and Neighborhoods?
23
accounts ensure that savings are used for asset accumulation – not consumption. Features such
as reduced interest rates for failure to make a timely deposit encourage households to meet their
savings goals. Recognition by AU systems that IDAs are equivalent to savings accounts could
substantially expend access to credit for these households.
What can be done to increase LM HH&N accept rates?
Increased understanding of mortgage credit risk has been the key driver behind each
improvement in Freddie Mac’s LP automated underwriting system. Our most recent
enhancement employed the notion of taking a second look at “close calls.” The reasoning was
that if additional credit details were used to assess risk, more applications would be assessed an
accept. Using this enhancement, we now re-run certain loan applications through an expanded
set of credit variables. This has resulted in higher accept rates for minority and low- and
moderate-income borrowers.
Also promising is better lender feedback about borrower credit deficiencies – and thanks
to instant messaging – even faster turnaround of information. Many credit problems can be
cleared up in short order; even if problems take longer to resolve, applicants are given reliable
information about how to resolve credit difficulties. As an alternative to postponing
homeownership, the GSEs have created mortgage products that allow weaker credit borrowers to
get an above-market mortgage that “steps down” in rate as borrowers make timely monthly
mortgage repayments. Other innovative mortgage products feature debt-repayment plans that,
once completed, allow formerly credit-impaired borrowers to obtain a low-cost prime market
mortgage.
A new idea on the drawing board is to redesign LP such that it can be “linked up” with
mortgage software systems currently being used by housing counselors. Underserved borrowers
increasingly are turning to these nonprofit entities to assist them in all aspects of the homebuying
process. For many families, housing counselors represent trusted intermediaries who speak the
language and are located in situ. The next generation of AU systems certainly will be attuned to
the growing diversity of mortgage market participants – and the institutions that serve them.
Underserved borrowers stand the most to gain.

4.3: Automated Underwriting: Friend or Foe to Low-Mod Households and Neighborhoods?
24
Resources
Beyond AU, Integration Lowers Origination Costs April 2003. Origination News, Vol. 12, No. 7, pg. 8.
Canner, Glenn and Passmore, Wayne 1999. The Role of Specialized Lenders in Extending
Mortgages to Lower-Income and Minority Borrowers. Federal Reserve Bulletin, November 1999, p. 709.
Collins, M. Cary, Harvey, Keith D. and Nigro, Peter J 2002. The Influence of Bureau Score,
Customized Scores and Judgmental Review on the Bank Underwriting Decision-Making Process. The Journal of Real Estate Research; Sep/Oct 2002; 24; 2, p. 129.
Derus, Michele, North Shore to Open Banking Doors for Mexican Nationals. The Milwaukee
Journal Sentinel, September 16, 2002. Minority Home Loans Coming Out of Silos, American Banker, January 31, 2003, Vol. 168, No.
21, p. 1. Testimony of Fran Grossman, Executive Vice President, Shorebank Advisory Services Before
the U.S. Senate Committee on Banking, Housing and Urban Affairs, May 2, 2003. The Joint Center for Housing Studies of Harvard University 1998. 1998 State of the Nation’s
Housing Report, Cambridge, MA. The Joint Center for Housing Studies of Harvard University 2003. 2003 State of the Nation’s
Housing Report, p. 19. Which Tech Platform Makes the Most Sense? December 30, 2002. Origination News. Vol. 12,
No. 4, p. 10. Williams April 2, 2003. Technology and Other Keys to the Boom in Refinancing, American
Banker, Vol. 168, No. 63, p. 8.