Embed Size (px)
Citation preview

Automated Risk Assessment: A Hierarchical Temporal Memory Approach
RICARDO J. RODRIGUEZ, JAMES A. CANNADY, Ph.D.
Graduate School of Computer and Information Sciences
Nova Southeastern University
Fort Lauderdale, Florida
UNITED STATES OF AMERICA
Abstract: — Risk assessment models attempt to predict the probability of threats on systems in order
to deploy countermeasures that will ensure system security and reliability. In recent years, risk models
have become dynamic in nature [3] [4] [5]
, which resulted in a significant improvement over their static
counterpart by taking into consideration that risk and its components vary over time. However, the
evident complexity of the models and the rigorous mathematical approaches suggest significant
domain constraints and lack of true human-like reasoning. This lack of higher cognitive skills in
automated risk assessments stems from the gap that exists between neuroscience and artificial
intelligence (AI) [1][2]
. This paper discusses the potential of using hierarchical temporal memory
models for improving human-like reasoning in automated risk assessments.
Key-Words: — Threats, HTM, Hierarchical Temporal Memory, Vulnerabilities, Risk Assessment
1 INTRODUCTTION
Novel approaches to automated risk assessments have
been proposed and studied in recent years. They leverage
research across multiple disciplines, including but not
limited to artificial intelligence, game theory, knowledge
management, and others. Existing risk assessment
models are limited to predetermined set of mathematical
models and functions, and, although some of them
attempt to leverage artificial intelligence (e.g. neural
networks), their capabilities are constrained to specific
domains and limited by the lack of temporal awareness.
In 1985, Jeff Hawkins stumbled on the gap that exists
between neuroscience and AI [1]. In 2004, he published a
book, titled “On Intelligence’ [2], where he describes in
detail his theory of higher level thought in the neocortex.
The concepts of his theory are not new, but the order and
sequence is. His approach has propelled additional
research to develop human-like cognitive capabilities in
systems. As noted by “Business Week” magazine, this
theory is based on the premise that intelligence is rooted
in the brain’s ability to access memories rather that in its
ability to process new data.
Hawkins founded NUMENTA, a research company
that created NuPIC (Numenta’s Platform for Intelligent
Computing), which supports the creation of hierarchical
temporal memory models. The company’s licensing
approach to its technology, including intellectual
property rights, and resources further incentivize
research in this area by both industry and academia.
2 RELATED WORK
2.1 Automated Risk Assessment
Ke He, Zhiyong Feng, and Xiaohong Li (2008)
proposed a novel approach to software security risk
assessment during the design stage [3]. The approach
relies on attacks and a model to depict system functions,
assets, actors, and threats. It also leverages the concept
of trust level and trust boundaries. The model is
decomposed into sub-nodes merged utilizing AND logic.
It aims to identify intentions and goals by dividing the
model into three high-level stages: creation and
validation of attack scenarios, software security testing
according to the attacks, and threat mitigation.
After describing each one of the stages, including a
complex attack generation algorithm, the researchers
evaluated the model in a simulated online banking
system. They concluded that attack scenarios can bridge
the gap between system functions design and software
security analysis via attack links and mitigation links,
which can ultimately contribute to security risk reduction
as well as cost reduction.
ADVANCES in DATA NETWORKS, COMMUNICATIONS, COMPUTERS
ISSN: 1792-6157 53 ISBN: 978-960-474-245-5

Wei He, Chunhe Xia, Haiquan Wang, and Cheng
Zhang, Yi Ji (2008) presented a model to quantify the
threat probability in network security risk assessments [4]. Most of the methods tend to consider the attacker and
defender separately. In their work, the attacker and
defender are considered game players. Utilizing game
theory, the behaviors of the attacker are predicted.
The researchers described the risk assessment
framework, which is comprised of network status
information collection, attack-defense knowledge
library, game theoretical model, risk computation model,
and system risk. This game theoretical attack-defense
model (GTADM) consists of a mathematical model, a
series of definitions, cost benefit analysis of attacker and
defender, and equilibrium.
The researchers illustrated the application of
GTADM in a demilitarized zone (DMZ) containing
multiple network devices providing different services.
The results of the simulation established the risk
probabilities for each network device as well as the
overall network as a unit. They finalized by stating that
the weights of the nodes as well as the incidence
relationship between the threats were not considered and
should be part of the next steps in their research.
These same researchers (He, Xia, Wang, and
Zhang;2008) also proposed a game theory based model
for performing risk assessments [5]. The model analyzes
the relationship between processes and entities,
including network, knowledge, asset, vulnerability,
threat, control, impact, probability, and risk.
The researchers described the risk assessment
concepts such as asset identification, control
identification, and vulnerability identification, among
others. They explained the role of game theory in
network security risk assessments, which is the
foundation for building the proposed framework. The
main high level components of this model include a data
collection layer, information refinement layer, and risk
computing layer. They evaluated the model, which
showed promising results by showing the calculated risk
using a simulation. However, they acknowledged the
need to further enhance the model and test it in a real
network.
Figure 1. High level representation of Risk Assessment Process
Figure 1 describes the overall goal of automated risk
assessments. By leveraging knowledge of both existing
risk data and the environment, an assessment is
performed. The result of the assessment, the assessed
risk, is then utilized to determine a next step or action.
2.2 Hierarchical Termporal Model (HTM)
An HTM network is a stack of layers, following a
tree approach, which are composed of nodes. It contains
more nodes at the lower layers (i.e. sensory nodes) and
fewer nodes at the higher layers. This also implies that at
the lower layers, more details, including space and time
data, can be found, while at the higher layers, more
general concepts are captured. In sensing mode, each
layer categorizes information coming in from a lower
layer into probabilities of the concepts it has in memory.
Several concepts are stored in each node.
During training, input patterns are stored into separate
groups. Each group of patterns represents a single
concept, so each node is aware of several possible
concepts. If sequences are closely related to the training
sequences, then the assigned probabilities will not vary
as often as patterns are obtained. In sensing mode, a
node reads an input pattern and determines how close it
is to all pre-existing patterns. In one implementation,
each group simply selects the highest closeness value
measured to its patterns as the probability that the input
pattern matches the group. Jeff Hawkins believes brains
evolved this type of hierarchy to match, predict, and
affect the external world's organization.
ADVANCES in DATA NETWORKS, COMMUNICATIONS, COMPUTERS
ISSN: 1792-6157 54 ISBN: 978-960-474-245-5

3 HTM BASED AUTOMATED RISK
ASSESMENT
3.1 Objective
The technical objective of this proposed method is to
enhance the current state of the art of automated risk
assessments by leveraging HTMs.
Figure 2. Hierarchical Temporal Memory Model for Automated Risk
Assessment in MS Windows Hosts
Figure 2 depicts the Windows environment sensory
hierarchy that was used as a starting point. As levels go
up, higher level thinking occurs. At the lower levels,
detailed data gathering and analysis is performed. By
using MS process monitor (see figure 3), files, registry,
and process activities are gathered (i.e. sensory data).
This data is then processed at the higher levels as well as
passed down to each sensor through feedback lines. For
example, data gathered by the registry monitor could be
passed all the way to level 3 and then back down to the
process monitor.
Figure 3. MS Windows Process Monitor
3.2 Representation of Known Software
Vulnerabilties
A series of small programs were coded, executed,
and tracked using process monitor. These programs
contained a series of vulnerabilities, including the
following:
• Heap overflow
• Stack overflow
Figure 4 shows a well known code snippet used
to show a stack overflow attack [13]
. A total of sixty-
four similar code snippets (e.g. changing sequence of
steps, changing strings, etc..) with the potential for
heap and stack overflows were used to capture
process monitor data. The data was then gathered and
analyzed to represent potential values of the HTM
nodes. Fifty-two code instances were used for
training and twelve for testing. Of course, as
additional runs were executed, more data was
gathered from the process monitor and added back to
the network for training.
Figure 4. Stack Overflow code snippet.
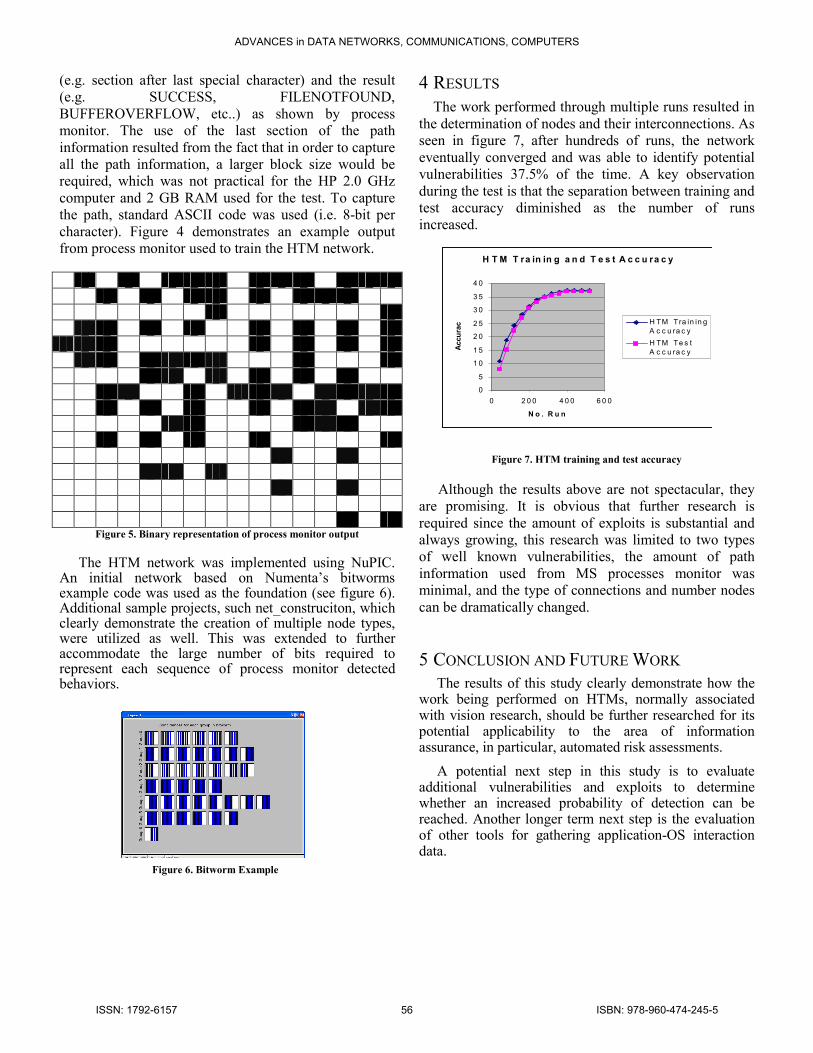
A simple data aggregation process and a binary
representation method were used to represent the
output from the process monitor. Table 1 shows the
binary bits associated with each operation detected by
process monitor.
Operation First Bit Second Bit Third Bit
Read File 0 0 1
Close File 0 1 0
Create File 0 1 1
Reg Open 1 0 0
Reg Read 1 0 1
Reg Query 1 1 0
Table 1. Binary representation of process monitor detected operations
After the first three bits, an additional 253 bits were
used to capture the last section of the path information
Process Monitor
File Monitor Registry Monitor Process Monitor
Windows OS
Level 1 Level 1 Level 1
Level 2 Level 2 Level 2
Level 3 Level 3
Level 4
#define BUFSIZE 16
int main(int argc, _char* argv[])
{
char *buffer1 = (char *)malloc(BUFSIZE);
if (buffer1 == NULL)
return 0
char *buffer2 = (char *)malloc(BUFSIZE);
if (buffer2 == NULL)
return 0
memset(buffer1, 'A', BUFSIZE-1);
buffer1[BUFSIZE-1] = '\0';
memset(buffer2, 'A', BUFSIZE-1);
buffer2[BUFSIZE-1] = '\0';
printf("buffer1 pointer = %p, buffer2 pointer = %p", buffer1, buffer2);
printf("\n\nValue in buffer1: %s", buffer1);
printf("\nValue in buffer2: %s", buffer2);
printf("\n\nEnter new value to be placed in buffer1 with gets(): ");
gets(buffer1);
printf("buffer1 pointer = %p, buffer2 pointer = %p", buffer1, buffer2);
printf("\n\nValue in buffer1: %s", buffer1);
printf("\nValue in buffer2: %s", buffer2);
printf("\n\nPress enter to (try) and free buffer1...");
getchar();
free(buffer1);
printf("\n\nPress enter to (try) and free buffer2...");
getchar();
free(buffer2);
return 0;
}
ADVANCES in DATA NETWORKS, COMMUNICATIONS, COMPUTERS
ISSN: 1792-6157 55 ISBN: 978-960-474-245-5
(e.g. section after last special character) and the result
(e.g. SUCCESS, FILENOTFOUND,
BUFFEROVERFLOW, etc..) as shown by process
monitor. The use of the last section of the path
information resulted from the fact that in order to capture
all the path information, a larger block size would be
required, which was not practical for the HP 2.0 GHz
computer and 2 GB RAM used for the test. To capture
the path, standard ASCII code was used (i.e. 8-bit per
character). Figure 4 demonstrates an example output
from process monitor used to train the HTM network.
Figure 5. Binary representation of process monitor output
The HTM network was implemented using NuPIC. An initial network based on Numenta’s bitworms example code was used as the foundation (see figure 6). Additional sample projects, such net_construciton, which clearly demonstrate the creation of multiple node types, were utilized as well. This was extended to further accommodate the large number of bits required to represent each sequence of process monitor detected behaviors.
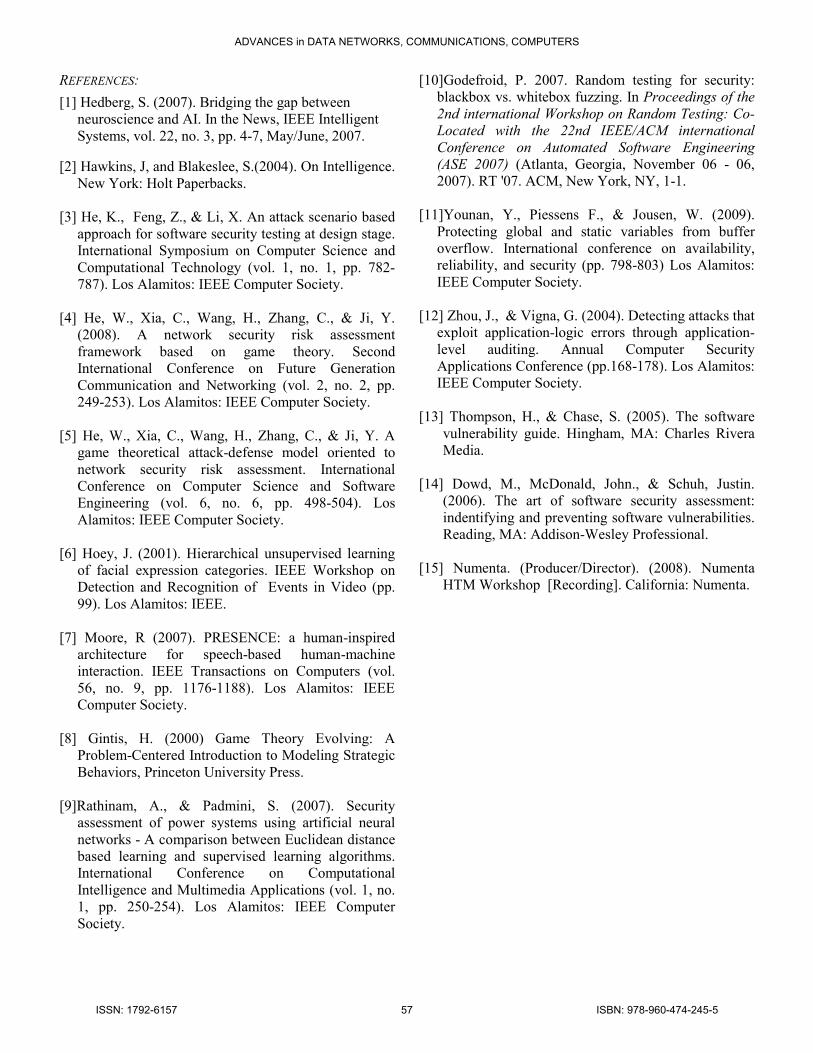
4 RESULTS
The work performed through multiple runs resulted in
the determination of nodes and their interconnections. As
seen in figure 7, after hundreds of runs, the network
eventually converged and was able to identify potential
vulnerabilities 37.5% of the time. A key observation
during the test is that the separation between training and
test accuracy diminished as the number of runs
increased.
Figure 7. HTM training and test accuracy
Although the results above are not spectacular, they
are promising. It is obvious that further research is
required since the amount of exploits is substantial and
always growing, this research was limited to two types
of well known vulnerabilities, the amount of path
information used from MS processes monitor was
minimal, and the type of connections and number nodes
can be dramatically changed.
5 CONCLUSION AND FUTURE WORK
The results of this study clearly demonstrate how the work being performed on HTMs, normally associated with vision research, should be further researched for its potential applicability to the area of information assurance, in particular, automated risk assessments.
A potential next step in this study is to evaluate additional vulnerabilities and exploits to determine whether an increased probability of detection can be reached. Another longer term next step is the evaluation of other tools for gathering application-OS interaction data.
Figure 6. Bitworm Example
H T M T ra in in g a n d T e s t A c c u ra c y
0
5
1 0
1 5
2 0
2 5
3 0
3 5
4 0
0 2 0 0 4 0 0 6 0 0
N o . R u n
Accuracy H TM Tra in in g
A c c u ra c y
H TM Te s t
A c c u ra c y
ADVANCES in DATA NETWORKS, COMMUNICATIONS, COMPUTERS
ISSN: 1792-6157 56 ISBN: 978-960-474-245-5
REFERENCES:
[1] Hedberg, S. (2007). Bridging the gap between
neuroscience and AI. In the News, IEEE Intelligent
Systems, vol. 22, no. 3, pp. 4-7, May/June, 2007.
[2] Hawkins, J, and Blakeslee, S.(2004). On Intelligence.
New York: Holt Paperbacks.
[3] He, K., Feng, Z., & Li, X. An attack scenario based
approach for software security testing at design stage.
International Symposium on Computer Science and
Computational Technology (vol. 1, no. 1, pp. 782-
787). Los Alamitos: IEEE Computer Society.
[4] He, W., Xia, C., Wang, H., Zhang, C., & Ji, Y.
(2008). A network security risk assessment
framework based on game theory. Second
International Conference on Future Generation
Communication and Networking (vol. 2, no. 2, pp.
249-253). Los Alamitos: IEEE Computer Society.
[5] He, W., Xia, C., Wang, H., Zhang, C., & Ji, Y. A
game theoretical attack-defense model oriented to
network security risk assessment. International
Conference on Computer Science and Software
Engineering (vol. 6, no. 6, pp. 498-504). Los
Alamitos: IEEE Computer Society.
[6] Hoey, J. (2001). Hierarchical unsupervised learning
of facial expression categories. IEEE Workshop on
Detection and Recognition of Events in Video (pp.
99). Los Alamitos: IEEE.
[7] Moore, R (2007). PRESENCE: a human-inspired
architecture for speech-based human-machine
interaction. IEEE Transactions on Computers (vol.
56, no. 9, pp. 1176-1188). Los Alamitos: IEEE
Computer Society.
[8] Gintis, H. (2000) Game Theory Evolving: A
Problem-Centered Introduction to Modeling Strategic
Behaviors, Princeton University Press.
[9]Rathinam, A., & Padmini, S. (2007). Security
assessment of power systems using artificial neural
networks - A comparison between Euclidean distance
based learning and supervised learning algorithms.
International Conference on Computational
Intelligence and Multimedia Applications (vol. 1, no.
1, pp. 250-254). Los Alamitos: IEEE Computer
Society.
[10]Godefroid, P. 2007. Random testing for security:
blackbox vs. whitebox fuzzing. In Proceedings of the
2nd international Workshop on Random Testing: Co-
Located with the 22nd IEEE/ACM international
Conference on Automated Software Engineering
(ASE 2007) (Atlanta, Georgia, November 06 - 06,
2007). RT '07. ACM, New York, NY, 1-1.
[11]Younan, Y., Piessens F., & Jousen, W. (2009).
Protecting global and static variables from buffer
overflow. International conference on availability,
reliability, and security (pp. 798-803) Los Alamitos:
IEEE Computer Society.
[12] Zhou, J., & Vigna, G. (2004). Detecting attacks that
exploit application-logic errors through application-
level auditing. Annual Computer Security
Applications Conference (pp.168-178). Los Alamitos:
IEEE Computer Society.
[13] Thompson, H., & Chase, S. (2005). The software
vulnerability guide. Hingham, MA: Charles Rivera
Media.
[14] Dowd, M., McDonald, John., & Schuh, Justin.
(2006). The art of software security assessment:
indentifying and preventing software vulnerabilities.
Reading, MA: Addison-Wesley Professional.
[15] Numenta. (Producer/Director). (2008). Numenta
HTM Workshop [Recording]. California: Numenta.
ADVANCES in DATA NETWORKS, COMMUNICATIONS, COMPUTERS
ISSN: 1792-6157 57 ISBN: 978-960-474-245-5


![Jessica Cannady[1]](https://img.pdfslide.us/doc/110x75/54c44a424a79598c398b45b4/jessica-cannady1.jpg)