Embed Size (px)
Citation preview
Automated interpretation and accessible
presentation of technical diagrams for
blind people
M. HORSTMANN*$, M. LORENZ$,A. WATKOWSKI$, G. IOANNIDIS$, O. HERZOG$,
A. KING%, D. G. EVANS%, C. HAGEN§,C. SCHLIEDER§, A.-M. BURN’, N. KING’,
H. PETRIE’, S. DIJKSTRAI and D. CROMBIEI
$Technologie-Zentrum Informatik, University of Bremen, Bremen Germany%School of Informatics, University of Manchester, Manchester UK
§Laboratory for Semantic Information Technology, Bamberg University, Bamberg Germany’Centre for Human Computer Interaction Design, City University, London UK
IFNB, Amsterdam, The Netherlands
The EU-supported TeDUB (Technical Drawings Understanding for the Blind) project is
developing a software system that aims to make technical diagrams accessible to blind
and visually impaired people. It consists of two separate modules: one that analyses
drawings either semi-automatically or automatically, and one that presents the results of
this analysis to blind people and allows them to interact with it. The system is capable of
analysing and presenting diagrams from a number of formally defined domains. A
diagram enters the system as one of two types: first, diagrams contained in bitmap
images, which do not explicitly contain the semantic structure of their content and thus
have to be interpreted by the system, and second, diagrams obtained in a semantically
enriched format that already yields this structure. The TeDUB system provides blind
users with an interface to navigate and annotate these diagrams using a number of input
and output devices. Extensive user evaluations have been carried out and an overall
positive response from the participants has shown the effectiveness of the approach.
1. Introduction
A number of mature techniques, such as screen readers with text-to-speech
synthesis and/or Braille displays, allow blind people to access text documents.
Optical character recognition (OCR) software offers this access even if the
*Corresponding author. Email: [email protected]
New Review of Hypermedia and Multimedia,
Vol. 10, No. 2, December 2004, 141�/163
New Review of Hypermedia and Multimedia
ISSN 1361-4568 (print)/ISSN 1740-7842 (online) # 2004 Taylor & Francis Ltd
http://www.tandf.co.uk/journals
DOI: 10.1080/13614560512331326017
documents originate from printed material. However, a considerable amount of
information available today is contained in documents that do not consist solely
of accessible, linear text. One such type of document is the technical diagram .
These are documents that use visual content to convey information, such as the
use of graphical symbols instead of text, layout and position to communicate
segregation and aggregation, and lines and patterns to identify components and
relationships. This visual content makes it difficult to present these diagrams to
people who cannot see them. Examples of technical diagrams include electronic
circuit diagrams, software engineering diagrams and architectural floor plans.
Many other documents have these features: what differentiates technical
diagrams is their common visual vocabulary and grammar. Each is created
according to a set of accepted rules or an explicit standard for the particular
knowledge domain of the diagram, such as electronics, and all diagrams within
that domain must comply with this accepted practice or be unintelligible to
anyone except the author. These rules therefore specify how the visual content
should be interpreted, describing the meaning of symbols and images and the role
of spatial information. This means that the visual content is explicitly defined and
therefore amenable to identification, exhaustive analysis and re-presentation to
blind users by some non-visual method in a way that less well-defined document
types (e.g. business diagrams) are not.
Technical diagrams can be used in a number of ways, most importantly to store
information for the purpose of reference and to easily communicate information
between people working on a common project. Existing techniques for the
accessible presentation of graphics are mostly limited to the former case, because
they necessitate a considerable amount of labour that is profitable only if the
same diagram is used often afterwards. In a professional working environment,
however, diagrams may be created ad hoc and they may also change rapidly.
The TeDUB (Technical Drawings Understanding for the Blind) system makes
graphical information accessible using semi-automatic and automatic analysis of
graphical content and through the importation of file formats that already
contain semantically enriched information. Throughout this article we use a
rather computer-scientific view on semantics. By ‘semantic’ we refer to a formally
verbalized encoding of information that is only implicitly contained in a
graphical representation. The system is intended to handle technical diagrams
from arbitrary domains and the current research demonstrates this for three
knowledge domains and their corresponding well-defined visual content:
analogue and digital electronic circuits, certain unified modelling language
(UML) diagrams and architectural floor plans.
After the analysis, the system presents the information to the blind user
through a specialized interface. Navigation via this interface is based upon two
models between which a blind user can choose during the exploration of a
diagram. A hierarchical presentation reveals atomic diagram components and
compositional items in a tree structure. A second view allows spatial navigation
142 M. Horstmann et al.
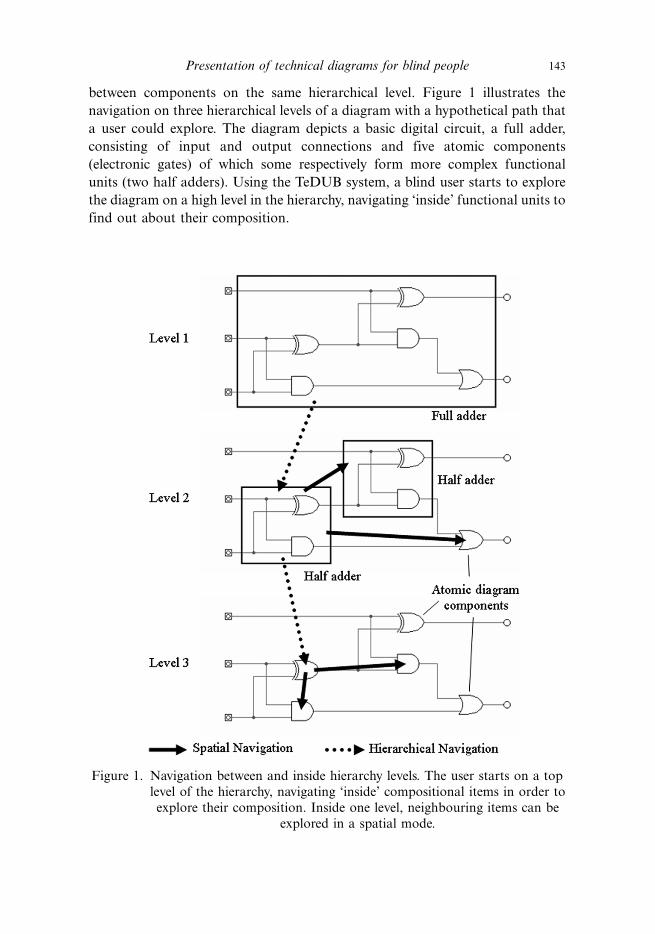
between components on the same hierarchical level. Figure 1 illustrates the
navigation on three hierarchical levels of a diagram with a hypothetical path that
a user could explore. The diagram depicts a basic digital circuit, a full adder,
consisting of input and output connections and five atomic components
(electronic gates) of which some respectively form more complex functional
units (two half adders). Using the TeDUB system, a blind user starts to explore
the diagram on a high level in the hierarchy, navigating ‘inside’ functional units to
find out about their composition.
Figure 1. Navigation between and inside hierarchy levels. The user starts on a top
level of the hierarchy, navigating ‘inside’ compositional items in order to
explore their composition. Inside one level, neighbouring items can be
explored in a spatial mode.
Presentation of technical diagrams for blind people 143
Since the first results were published by Petrie et al . (2002) and Fodisch et al .
(2002), a number of prototypes of the system have been developed and the user
interface has been evaluated to ensure its high usability. The system’s architecture
has received fundamental revisions. The user interface has matured considerably
based on the results of intensive user evaluations of each prototype.
In the following section we introduce other research that deals with the
presentation of diagrams. In section 3 we present our research in the area of non-
visual navigation and verbal description of diagrams. Section 4 gives a
description of the TeDUB system. Finally, section 5 outlines a possible future
approach for an integration of the TeDUB representation of diagrams into the
Semantic Web framework.
2. Current methods for accessing diagrams available to blind people
Access to diagrams is currently provided to blind people in the form of either
verbal descriptions or tactile diagrams. Verbal descriptions are discussed in more
detail in section 3. Tactile diagrams are made with a number of technologies that
provide raised and textured equivalents to the visual features of visual diagrams.
The most common mechanisms for producing tactile diagrams are microcapsule
paper and thermoforming (see Edman 1992, Hinton 1996, and Eriksson 1998).
Microcapsule paper has a coating of minute PVC microcapsules of an organic
solvent. When a black and white image is photocopied onto this paper and the
paper is heated, the black lines of the image absorb more heat than the white
areas and the microcapsules expand so that the black lines of the image swell up
(hence the colloquial name, ‘swell paper diagrams’). The nature of the process
means that only one height of raised line is generally possible and a fairly limited
number of patterns. This imposes severe constraints on the graphic representa-
tions that can be used and means that visual diagrams need simplification and
redesign before they are suitable for microcapsule processing. One complex visual
diagram may require a number of microcapsule diagrams to impart its full
meaning. The other severe limitation is the far lower resolution of tactile
sensitivity of the skin (even of the fingertips) in comparison to the visual
sensitivity of the eye. The other mechanism, thermoforming, was originally used
for the production of Braille text and then in the 1960s its potential for diagrams
was realized. First, a raised master is made; numerous materials can be used as
long as they are heat resistant. A thin sheet of polymer such as PVC is clamped
over the master and the polymer is heated to soften it. A vacuum is then applied
to mould the polymer to the form of the master. The process is more complex
than that of microcapsule paper but a range of heights and a greater variety of
patterns can be produced. However, the range is still limited compared to visual
representations, and similar constraints to the design and perception of the
information apply as were discussed for microcapsule diagrams.
144 M. Horstmann et al.
Because of the limitations of tactile diagrams, whatever process they are
produced by, a number of efforts have been undertaken to use technology to
provide more effective access to diagrams. These are reviewed here, although
none of them is in widespread use by blind people at the current time. The first
group of developments involves placing a tactile diagram on a touch-sensitive
computer pad and providing programming such that when a point or area on the
diagram/pad is pressed, verbal information (synthetic or recorded speech) is
produced, sometimes complemented by non-speech information such as tones.
Such systems are sometimes referred to as audio-tactile diagrams. Often, several
levels of detail in the information can be provided by double or triple clicking on
the diagram/pad. The first system of this type was the Nomad (Parkes 1998), later
similar systems include one developed by Kennel (1996) and the TACIS system
(Gallagher and Frasch 1998). The Kevin computer aided software engineering
(CASE) tool (Blenkhorn et al . 1996) developed an important variation of this
approach to make data flow diagrams (DFDs) accessible to blind people. Instead
of a specific tactile diagram, a generic tactile overlay is placed on the pad. The
overlay is divided into two areas, one to provide control of the CASE tool and the
other to ‘display’ the DFD to the blind user. The innovation of this approach is
that a new tactile overlay does not have to be produced for each diagram and the
user learns the methods for exploring any DFD with the generic overlay. A
problem with this approach is that the representation used by the blind person is
quite different from that used by sighted people, so if someone is studying or
working in a collaborative situation, discussing information and seeking help
with a diagram may be complex.
The second group of developments involve the use of the piezoelectric pins
currently used in refreshable Braille displays for access to computer text for blind
people (Petrie et al . 2002) or other movable pin systems that can be raised and
lowered to form tactile images. These can sometimes be augmented with speech
and sound information, as with the previous group of developments, The first
such system was the Stuttgart pin�/matrix�/device developed by Gunzenhauser
and Schweikhardt (1990); see also Schweikhardt 1996). Numerous other related
systems have been prototyped since then, for example by Fricke (1991),
Kobayashi and Watanabe (2002), Lotzsch (1994) and Maucher et al . (2000).
The final group of developments attempt to translate the visual image into an
understandable auditory image, for example using the pitch and timbre of
different musical instruments to indicate different aspects of the image. Such
ideas have been explored by Alty and Rigas (1998), Faik et al . (1994) and others.
Kurze (1995) proposed a scheme for the manual annotation of graphics for
blind people. A sighted user extracts the information (e.g. values and scales from
bar charts) from a diagram using an interactive tool.
Baillie et al . (2003) have provided a useful review of a number of the tactile and
audible techniques for providing access to diagrams in the context of providing
access to UML diagrams for blind computing students.
Presentation of technical diagrams for blind people 145
Much of the work discussed above focuses on how the information in diagrams
is conveyed to blind people. Little consideration has been given to the possible
sources of the information, electronic and paper-based, and how it is translated
into a form that is suitable for blind people. The TeDUB system is unique in that
it allows diagrams to be imported in their visual form (for example as bitmaps)
and their contents to be relayed to the blind user without intervention by a
sighted person.
3. Verbal descriptions of diagrams for visually impaired people
The development of the TeDUB system has drawn upon relevant literature,
including the non-visual navigation of information spaces and the verbal
descriptions of diagrams. Furthermore, the user-centred approach has meant
the ongoing consultation with stakeholders has provided valuable knowledge
from domain experts and from potential users of the system.
3.1 Guidelines for describing diagrams
Very little is understood about the way blind people develop and use mental
representations of verbally described diagrams. However, there are a number of
comprehensive guidelines for describing diagrams to visually impaired people,
one being the Confederation of Transcribed Information Services (COTIS)
guidelines (www.cotis.org.uk). These guidelines were reviewed for the TeDUB
project to inform the development of the interface to the TeDUB system, which
allows blind people to navigate diagrams verbally. The guidelines provide some
general points applicable to the presentation and navigation of diagrams in any
context:
. It is important to state why the diagram is there. The diagram is there because
it adds something to the text.
. Differentiate between different levels of the diagram if they exist. Explain
certain visual aspects of the diagram with familiar concepts or items, e.g.
‘shaped like a fist’, ‘vertical, perpendicular, diagonal’, and so on.
. Give a brief summary of the diagram as a whole. If there are two or more
diagrams, highlight the points for comparison.
. Include important details immediately apparent.
. Keep interpretation to a minimum
. Select an order for the description, providing starting points and direction if
necessary, particularly where the sequence of the diagram is essential to
understanding the diagram.
. For a diagram with several features to describe, make sure that they are all
included.
146 M. Horstmann et al.
. With electronic diagrams, it is necessary to identify any components and
clarify the labelling of them. Also identify important differences, e.g. live and
neutral input/output.
3.2 Describing diagrams from different domains
To date, the development of the TeDUB system has focused on presenting
diagram information from three specific domains: analogue and digital circuit
diagrams, UML diagrams and architectural floor plans. Apart from drawing
upon the COTIS and similar guidelines, it was important to establish whether the
TeDUB system should vary the presentation depending on the different domains.
Therefore, an exploratory study was conducted with experts from the three
domains to establish:
. how experts verbally describe diagrams within their domain
. whether there are logical starting points in their descriptions
. what the most important parts of a diagram to communicate
. what aspects of a diagram might be excluded from a verbal description.
Four experts in circuit diagrams (electronic engineers), four UML experts
(academics who teach UML at university level) and five experts in architectural
floor plans (architects and civil engineers) took part in the study. They were given
a series of diagrams from their domain and asked to describe them to another of
the experts from the same domain. The other expert attempted to draw the
diagram solely from the verbal description given. The experts then compared the
original diagram and the sketch and discussed with a researcher the specific
problems of this exercise as well as the general issues of describing diagrams in
their domain to blind people.
The study showed that the experts agreed on a number of consistent principles
for describing diagrams across all three domains, for example:
. Provide an overview of the diagram
. Clearly identify the orientation of the diagram.
They also agreed that diagrams have logical starting places for descriptions. Some
differences between the domains were also apparent. Experts discussed how the
diagram information should be structured so that the user could navigate the
verbal description in small and manageable chunks. The description of the UML
and circuit diagrams appeared suited to a hierarchical breakdown of the structure
of the diagram. The highest level of the hierarchy should give the overview of the
objects and perhaps be fixed. At the lower levels of the hierarchy, where more
details were required about the objects and their relationships, more user
exploration should be implemented. However, the important information to get
across in the floor plan description was the spatial aspect of the plan. Therefore, a
Presentation of technical diagrams for blind people 147
breakdown of the verbal description into a hierarchy would not necessarily
provide the most suitable description for the architectural floor plan domain.
3.3 Establishing a suitable data structure
The findings of the above study and the guidelines have provided a good basis for
the development of the TeDUB system. However, it was not known how well
visually impaired users could navigate around diagram information presented in
a hierarchical data structure. As the TeDUB prototype was at an early stage of
development, a ‘Wizard of Oz’ study was conducted to evaluate the potential of
presenting the descriptions of diagrams in a hierarchy. The study was conducted
with 29 visually impaired participants who navigated a map of Europe with
information about various countries. The hierarchy had four levels of navigation:
Continent level (Europe), Country level (Albania to Yugoslavia), City level (e.g.
Paris) and Festival level (e.g. Bastille Day). Although the information available in
the hierarchy may well have been known to participants (unlike information they
might encounter in circuit diagrams or UML diagrams), the emphasis in the
study was on the mechanisms for navigation, so the information was deliberately
familiar and straightforward. The participants undertaking the study attempted a
series of simple tasks describing how easy or difficult they found the system to
operate, and how they conceptualized the diagram.
The study demonstrated that visually impaired users could successfully
navigate a hierarchical information structure and build a mental representation
of the information. It also highlighted how visually impaired users prefer to
conceptualize hierarchies based upon their existing experience of navigating tree
structures in programs such as Windows Explorer. That is, instead of navigating a
hierarchy from the top down through the levels of the hierarchy, they preferred to
navigate the information as a tree structure from left to right. In addition,
navigating via the short clear headings provided clear ‘auditory signposting’
(Morley et al . 1998), thus reducing cognitive overload and preventing disorienta-
tion.
This research into verbal descriptions of diagrams for visually impaired people
discovered that visually impaired users can easily and effectively navigate
different levels in a hierarchy, thus building a mental representation of a
hierarchical information structure. Therefore, the design rationale of the current
TeDUB system incorporated the key aspects from the COTIS guidelines,
recommendations from domain experts, and the findings from the initial study
with visually impaired users.
4. The TeDUB system
The TeDUB system is intended to be an automated replacement for the process
of describing a diagram. It must therefore meet the two challenges of analysing
148 M. Horstmann et al.
the diagram to obtain the content and effectively presenting this content to blind
end users.
4.1 Architecture
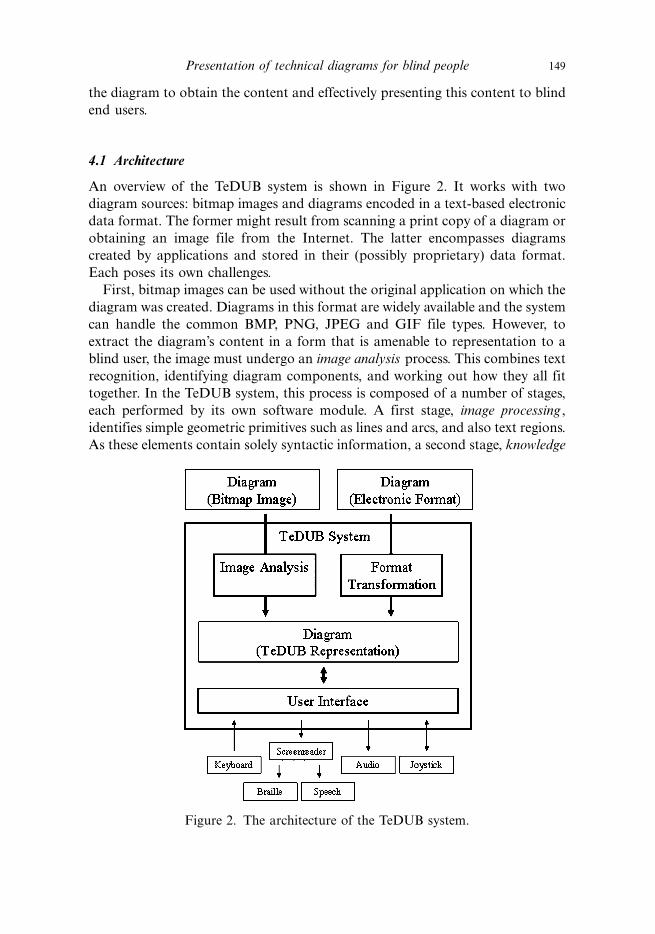
An overview of the TeDUB system is shown in Figure 2. It works with two
diagram sources: bitmap images and diagrams encoded in a text-based electronic
data format. The former might result from scanning a print copy of a diagram or
obtaining an image file from the Internet. The latter encompasses diagrams
created by applications and stored in their (possibly proprietary) data format.
Each poses its own challenges.
First, bitmap images can be used without the original application on which the
diagram was created. Diagrams in this format are widely available and the system
can handle the common BMP, PNG, JPEG and GIF file types. However, to
extract the diagram’s content in a form that is amenable to representation to a
blind user, the image must undergo an image analysis process. This combines text
recognition, identifying diagram components, and working out how they all fit
together. In the TeDUB system, this process is composed of a number of stages,
each performed by its own software module. A first stage, image processing ,
identifies simple geometric primitives such as lines and arcs, and also text regions.
As these elements contain solely syntactic information, a second stage, knowledge
Figure 2. The architecture of the TeDUB system.
Presentation of technical diagrams for blind people 149
processing , interprets the image by operating on a network of hypotheses and
thereby structuring the initial geometric information into a meaningful repre-
sentation of the diagram. The image analysis stage is prone to errors that can lead
to inaccurate interpretation and failure to identify important image components.
To approach these problems, the system allows a sighted user to supervise the
whole process and also to intervene using the Annotator module, an interactive
graphical editor that allows visualizing, adding or removing hypotheses.
Second, diagrams may be obtained in an electronic format. This format may be
some general or proprietary standard and is generally produced by the tool that
was used to create the diagram. These undergo a format transformation and
interpretation process, converting the original application-specific format into the
one used in the TeDUB system. For this to work, the application format must be
documented and accessible to transformation. Handling proprietary binary
formats would require the reverse engineering of the file types and any future
change to the format by the application would break the process. The electronic
formats that are amenable to this approach are therefore those that are published
standards, preferably using some variety of text. The TeDUB system works with
software engineering diagrams written in UML, which can be encoded in the
XML file type XML metadata interchange (XMI). XMI is a published standard,
and XML is a text-based industry data format with a wide range of available
tools supporting manipulation and transformation. Diagrams created in
applications that allow export in the XMI file type can therefore be transformed
and imported into the TeDUB system. The advantage of this approach is that the
information in the diagram is available to the TeDUB system without the
ambiguity or error that can result from the difficult image analysis process. All
the diagram content is perfectly available for representation to the end user.
It is not sufficient for a diagram to be encoded in a standard-compliant and
text-based format for the current importation process to be effective. In XMI files
semantic structures are directly represented in the file, so they can be
communicated to the end user at the same level of abstraction or meaning. By
contrast, a diagram might be exported as a scalable vector graphics (SVG) file,
which is standard compliant and text-based (in fact, another XML file type).
When rendered on the screen it would look identical to an XMI representation of
the diagram. The problem is that this SVG representation will simply define the
diagram graphically, in terms of lines and text, not semantically, as a collection of
diagram components. As a result, a proof-of-concept implementation of an SVG
importation is linked to the previous knowledge-processing stage of the image
analysis process, which handles the diagram as though it came from image
processing and constructs a meaningful diagram representation from it.##
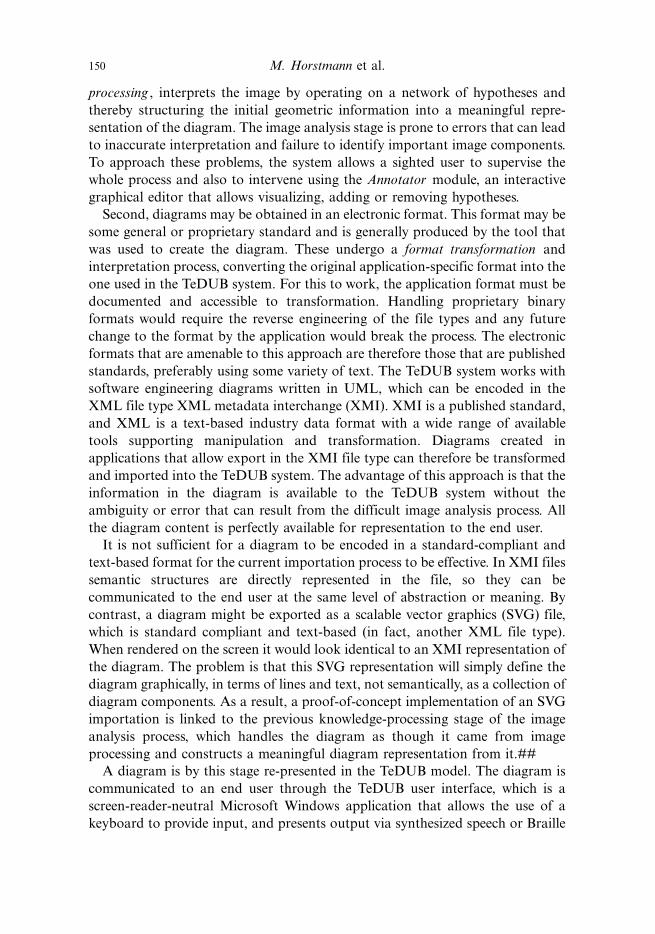
A diagram is by this stage re-presented in the TeDUB model. The diagram is
communicated to an end user through the TeDUB user interface, which is a
screen-reader-neutral Microsoft Windows application that allows the use of a
keyboard to provide input, and presents output via synthesized speech or Braille
150 M. Horstmann et al.
display (Figure 3). This is sufficient to entirely control the application. However,
in trying to re-present diagrammatical information to a blind user, the system
makes an attempt to communicate some of the spatial and positional information
in the original diagram. Functions supporting this are provided through the use
of 2D and 3D audio, utilizing a standard desktop sound card, and an inexpensive
force-feedback commercial games joystick.
4.2 Interpretation of technical diagrams
As noted in section 4.1, the TeDUB system is intended to also work with file
formats that do not explicitly represent the semantic structure of the depicted
diagram, like bitmap graphics or vector graphics (SVG). In order to transfer
Figure 3. The user interface of the TeDUB system.
Presentation of technical diagrams for blind people 151
these into the common TeDUB representation, their content has to be interpreted
first. This interpretation is done by the image analysis part of the system.
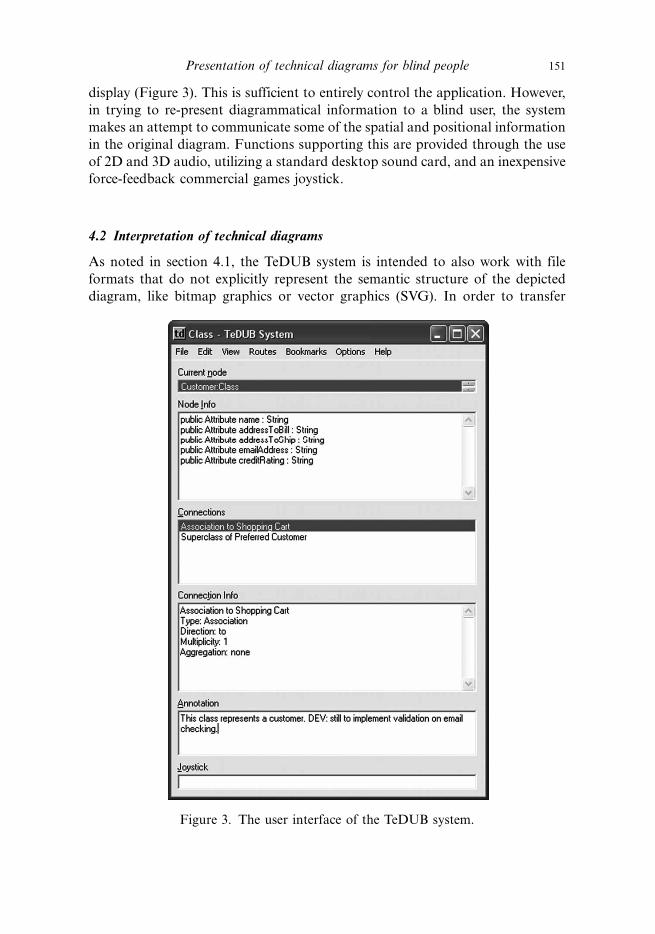
The basic strategy behind the interpretation is to process components of the
diagram in a partonomic hierarchy of different abstraction levels, from lowest
(geometric primitives like ‘straight line’, ‘curve’ or ‘rectangle’) to highest
(functional units like ‘room’ in the architectural domain, or ‘full adder’ in an
electronic circuit). In a partonomic hierarchy, two elements are related if one is a
part of the other. For example, in the architectural domain, several hypothesized
lines or arcs may be parts of a door or a window, while several windows, doors
and surrounding walls may be parts of a room. During the interpretation process,
combinations of existing parts yield new, more complex parts. This aggregation
process is performed according to a previously defined model for each domain.
An example for a simplified partonomic hierarchy from the floor plan domain is
shown in Figure 4.
Images in a bitmap or vector format may be of varying quality. This is
especially true for graphics from scanned documents where noise and other
distortions can lead to missing or ambiguous information. But information may
also be ambiguous in images of seemingly perfect quality, for example if a text
annotation is assigned to one of two nearby objects. The inference mechanism
deals with this uncertainty by treating elements from the diagram as hypotheses
about its parts. Each hypothesis is assigned a value that represents the confidence
in its correctness.
The TeDUB system aims to be domain independent. Therefore, all domain-
specific aspects are externalized as formalized knowledge (a partonomic domain
specification together with aggregation rules) and new types of diagrams are
made accessible to the system by providing the corresponding specification. The
core of the formal language consists of aggregation rules for the definition of
Figure 4. A (simplified) partonomy of diagram components as used in the image
analysis process.
152 M. Horstmann et al.
concepts. Obviously, concepts on lower levels of abstraction are the least domain
dependent and are suited to be modelled in a reusable way. Concepts on the
lowest level must also be predefined in order for the several modules of the image
analysis to communicate with each other.
In the case of bitmap graphics (the lowest level of input to the TeDUB system),
images are first analysed by the image processing module, which provides the
means for an extraction of image features. The module follows the usual image
processing pipeline of pre-processing , segmentation and feature extraction (see
Abmeyr 1994) with an emphasis on the extraction of lines. The goal is to obtain
an initial set of simple hypotheses describing geometric properties of the image
that serve as input to the knowledge processing unit.
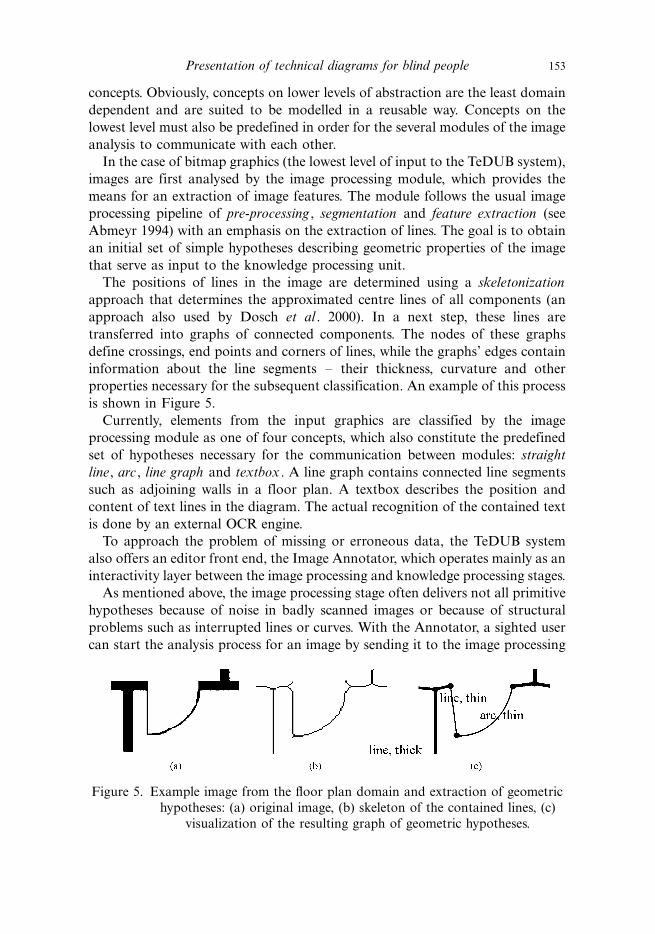
The positions of lines in the image are determined using a skeletonization
approach that determines the approximated centre lines of all components (an
approach also used by Dosch et al . 2000). In a next step, these lines are
transferred into graphs of connected components. The nodes of these graphs
define crossings, end points and corners of lines, while the graphs’ edges contain
information about the line segments �/ their thickness, curvature and other
properties necessary for the subsequent classification. An example of this process
is shown in Figure 5.
Currently, elements from the input graphics are classified by the image
processing module as one of four concepts, which also constitute the predefined
set of hypotheses necessary for the communication between modules: straight
line, arc , line graph and textbox . A line graph contains connected line segments
such as adjoining walls in a floor plan. A textbox describes the position and
content of text lines in the diagram. The actual recognition of the contained text
is done by an external OCR engine.
To approach the problem of missing or erroneous data, the TeDUB system
also offers an editor front end, the Image Annotator, which operates mainly as an
interactivity layer between the image processing and knowledge processing stages.
As mentioned above, the image processing stage often delivers not all primitive
hypotheses because of noise in badly scanned images or because of structural
problems such as interrupted lines or curves. With the Annotator, a sighted user
can start the analysis process for an image by sending it to the image processing
Figure 5. Example image from the floor plan domain and extraction of geometric
hypotheses: (a) original image, (b) skeleton of the contained lines, (c)
visualization of the resulting graph of geometric hypotheses.
Presentation of technical diagrams for blind people 153

module. The resulting set of hypotheses extracted is returned to the Annotator,
which visualizes the hypotheses by drawing on top of the image in the same editor
panel (Figure 6).
The user can then create new primitive hypotheses by simply drawing onto
the panel with the mouse. The user can also delete selected hypotheses if the
visualized hypotheses do not correspond to the image. After modifying the
primitive hypotheses, the new set of hypotheses is subjected to the knowledge
processing stage. The newly gained information (higher level hypotheses such as
room, door, wall, etc.) will also be visualized to the user by the Annotator. On
this level, the user can again modify, add or delete new hypotheses. Every
modification can be sent to the knowledge processing module to retrieve new
results. When the correct results are reached by this iterative process, the user can
decide to let the knowledge processing module create the final output document
in the TeDUB representation.
The success rate of the analysis is subject to the quality of the input image and
to the adherence of the input diagram to the set of components that have been
modelled for the domain. In the worst case, if no useful information can be
extracted from the diagram, the sighted user of the Annotator would have to
redraw all of the diagram’s geometric primitives. With suitable input images,
however, only single portions of the image have to be edited. Problems usually
occur where two or more features are close to each other and are thus recognized
as only one. Also, features and noise that do not belong to objects known to the
system add to the complexity of the interpretation (thereby lengthening the
process), and should be removed beforehand. The whole analysis process will be
evaluated in detail in the coming phase of the TeDUB project.
Figure 6. The Image Annotator.
154 M. Horstmann et al.
4.3 Presentation of technical diagrams
Technical diagrams can be differentiated from other visual information sources
by the fact that they are constructed from well-defined graphical elements with
defined connection rules. Within the knowledge domain of each technical
diagram type there exist a consistent visual grammar and syntax that must be
adhered to by every diagram. This means that although technical diagrams are
visual information sources they are amenable to re-presentation to blind people
because their content can be determined without ambiguity (image analysis
errors aside) and be re-presented to blind people. A perfectly information-
equivalent re-presentation of the original diagram is possible. This does not mean
that a non-visual re-presentation will have the same task profile or be as usable as
the print version for a sighted person, only that the task is amenable to
automated re-presentation.
The TeDUB system presents technical diagrams as a logical hierarchical tree
structure of nodes. Each node in this view corresponds to an atomic diagram
component, such as an electronic circuit component, or a higher-level composi-
tional item identified during knowledge processing or obtained from format
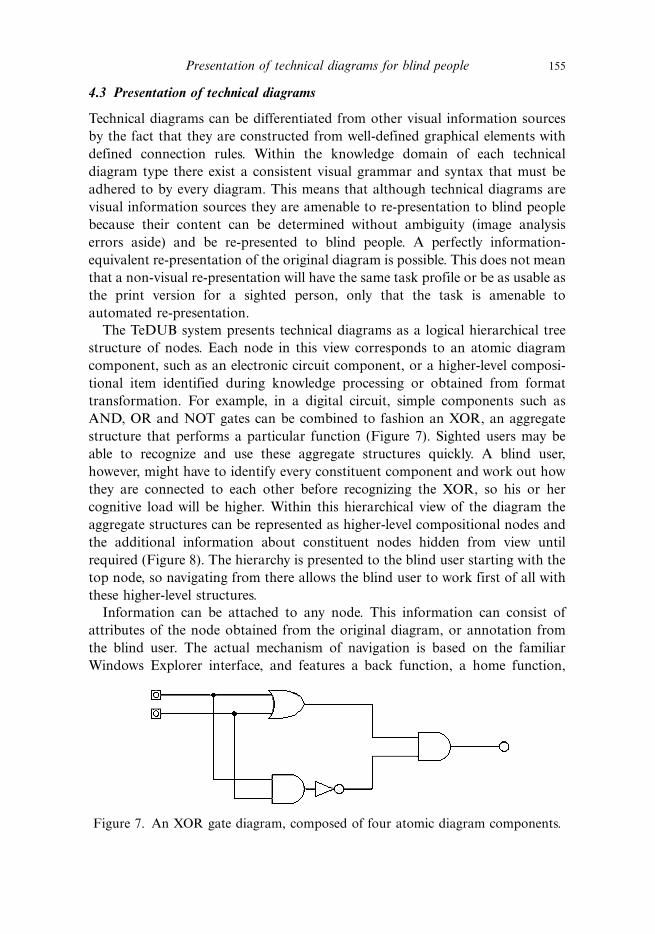
transformation. For example, in a digital circuit, simple components such as
AND, OR and NOT gates can be combined to fashion an XOR, an aggregate
structure that performs a particular function (Figure 7). Sighted users may be
able to recognize and use these aggregate structures quickly. A blind user,
however, might have to identify every constituent component and work out how
they are connected to each other before recognizing the XOR, so his or her
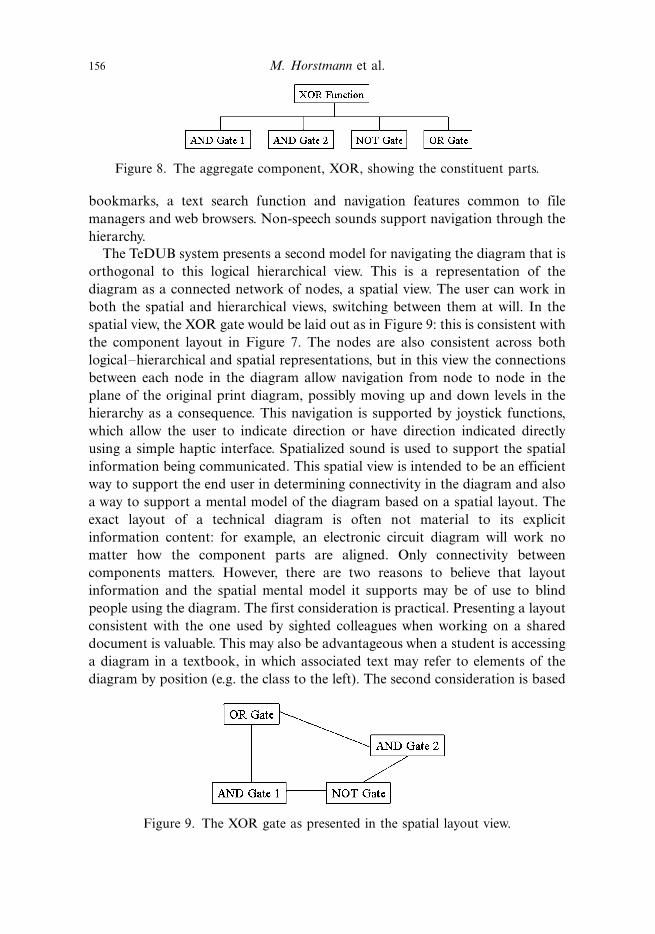
cognitive load will be higher. Within this hierarchical view of the diagram the
aggregate structures can be represented as higher-level compositional nodes and
the additional information about constituent nodes hidden from view until
required (Figure 8). The hierarchy is presented to the blind user starting with the
top node, so navigating from there allows the blind user to work first of all with
these higher-level structures.
Information can be attached to any node. This information can consist of
attributes of the node obtained from the original diagram, or annotation from
the blind user. The actual mechanism of navigation is based on the familiar
Windows Explorer interface, and features a back function, a home function,
Figure 7. An XOR gate diagram, composed of four atomic diagram components.
Presentation of technical diagrams for blind people 155
bookmarks, a text search function and navigation features common to file
managers and web browsers. Non-speech sounds support navigation through the
hierarchy.
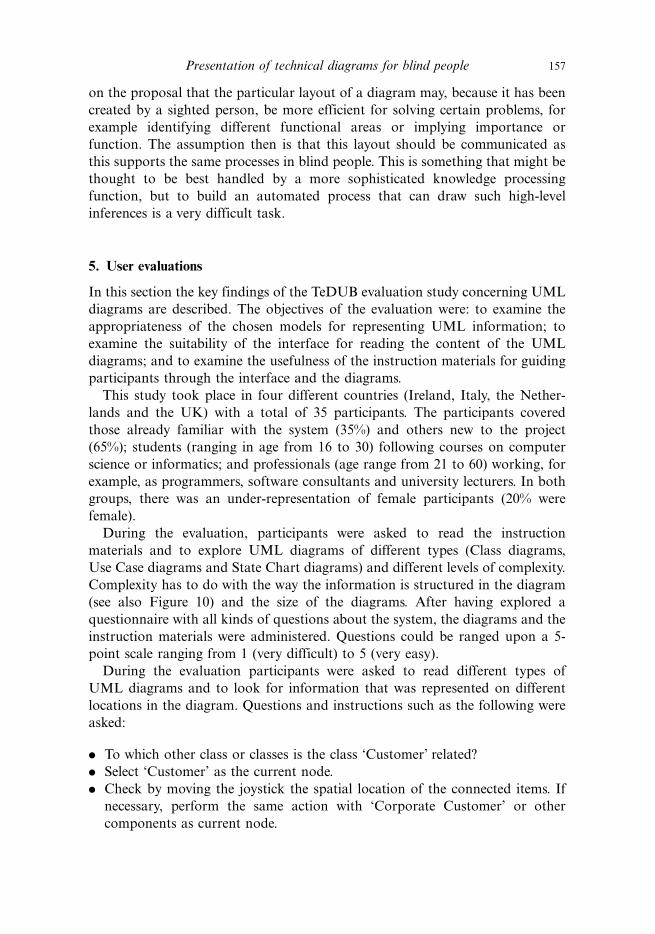
The TeDUB system presents a second model for navigating the diagram that is
orthogonal to this logical hierarchical view. This is a representation of the
diagram as a connected network of nodes, a spatial view. The user can work in
both the spatial and hierarchical views, switching between them at will. In the
spatial view, the XOR gate would be laid out as in Figure 9: this is consistent with
the component layout in Figure 7. The nodes are also consistent across both
logical�/hierarchical and spatial representations, but in this view the connections
between each node in the diagram allow navigation from node to node in the
plane of the original print diagram, possibly moving up and down levels in the
hierarchy as a consequence. This navigation is supported by joystick functions,
which allow the user to indicate direction or have direction indicated directly
using a simple haptic interface. Spatialized sound is used to support the spatial
information being communicated. This spatial view is intended to be an efficient
way to support the end user in determining connectivity in the diagram and also
a way to support a mental model of the diagram based on a spatial layout. The
exact layout of a technical diagram is often not material to its explicit
information content: for example, an electronic circuit diagram will work no
matter how the component parts are aligned. Only connectivity between
components matters. However, there are two reasons to believe that layout
information and the spatial mental model it supports may be of use to blind
people using the diagram. The first consideration is practical. Presenting a layout
consistent with the one used by sighted colleagues when working on a shared
document is valuable. This may also be advantageous when a student is accessing
a diagram in a textbook, in which associated text may refer to elements of the
diagram by position (e.g. the class to the left). The second consideration is based
Figure 8. The aggregate component, XOR, showing the constituent parts.
Figure 9. The XOR gate as presented in the spatial layout view.
156 M. Horstmann et al.
on the proposal that the particular layout of a diagram may, because it has been
created by a sighted person, be more efficient for solving certain problems, for
example identifying different functional areas or implying importance or
function. The assumption then is that this layout should be communicated as
this supports the same processes in blind people. This is something that might be
thought to be best handled by a more sophisticated knowledge processing
function, but to build an automated process that can draw such high-level
inferences is a very difficult task.
5. User evaluations
In this section the key findings of the TeDUB evaluation study concerning UML
diagrams are described. The objectives of the evaluation were: to examine the
appropriateness of the chosen models for representing UML information; to
examine the suitability of the interface for reading the content of the UML
diagrams; and to examine the usefulness of the instruction materials for guiding
participants through the interface and the diagrams.
This study took place in four different countries (Ireland, Italy, the Nether-
lands and the UK) with a total of 35 participants. The participants covered
those already familiar with the system (35%) and others new to the project
(65%); students (ranging in age from 16 to 30) following courses on computer
science or informatics; and professionals (age range from 21 to 60) working, for
example, as programmers, software consultants and university lecturers. In both
groups, there was an under-representation of female participants (20% were
female).
During the evaluation, participants were asked to read the instruction
materials and to explore UML diagrams of different types (Class diagrams,
Use Case diagrams and State Chart diagrams) and different levels of complexity.
Complexity has to do with the way the information is structured in the diagram
(see also Figure 10) and the size of the diagrams. After having explored a
questionnaire with all kinds of questions about the system, the diagrams and the
instruction materials were administered. Questions could be ranged upon a 5-
point scale ranging from 1 (very difficult) to 5 (very easy).
During the evaluation participants were asked to read different types of
UML diagrams and to look for information that was represented on different
locations in the diagram. Questions and instructions such as the following were
asked:
. To which other class or classes is the class ‘Customer’ related?
. Select ‘Customer’ as the current node.
. Check by moving the joystick the spatial location of the connected items. If
necessary, perform the same action with ‘Corporate Customer’ or other
components as current node.
Presentation of technical diagrams for blind people 157
. Give a description of the diagram.
. One of the components of the ‘state machine diagram’ has sub-states. Mention
the component and its sub-states.
. Is there any relationship between these sub-states?
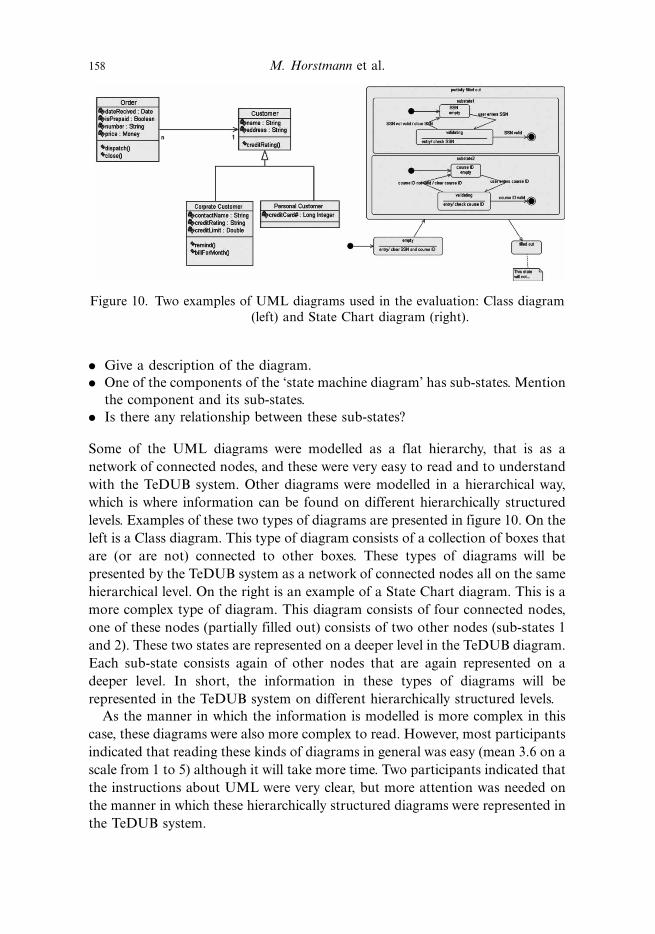
Some of the UML diagrams were modelled as a flat hierarchy, that is as a
network of connected nodes, and these were very easy to read and to understand
with the TeDUB system. Other diagrams were modelled in a hierarchical way,
which is where information can be found on different hierarchically structured
levels. Examples of these two types of diagrams are presented in figure 10. On the
left is a Class diagram. This type of diagram consists of a collection of boxes that
are (or are not) connected to other boxes. These types of diagrams will be
presented by the TeDUB system as a network of connected nodes all on the same
hierarchical level. On the right is an example of a State Chart diagram. This is a
more complex type of diagram. This diagram consists of four connected nodes,
one of these nodes (partially filled out) consists of two other nodes (sub-states 1
and 2). These two states are represented on a deeper level in the TeDUB diagram.
Each sub-state consists again of other nodes that are again represented on a
deeper level. In short, the information in these types of diagrams will be
represented in the TeDUB system on different hierarchically structured levels.
As the manner in which the information is modelled is more complex in this
case, these diagrams were also more complex to read. However, most participants
indicated that reading these kinds of diagrams in general was easy (mean 3.6 on a
scale from 1 to 5) although it will take more time. Two participants indicated that
the instructions about UML were very clear, but more attention was needed on
the manner in which these hierarchically structured diagrams were represented in
the TeDUB system.
Figure 10. Two examples of UML diagrams used in the evaluation: Class diagram
(left) and State Chart diagram (right).
158 M. Horstmann et al.
All the participants found that the information provided with the software gave
sufficient information to learn how to work with the system and to read the
different types of UML diagrams. No additional support was needed.
The most positive remarks were reserved for: the ease with which the system
can be learned (mean rate 4.1, range 3 to 5), the simple operation of the interface
when using the keyboard commands (ease of use rated with a mean of 4.4, range
4 to 5) and the combination of different interfaces to operate the system and to
get information from the system (for example, joystick operation rated with a
mean of 3.4 range from 2 to 5). In the TeDUB system, the keyboard and joystick
functions facilitate a spatial representation and together with additional
functionalities like the text view (a textual overview of the diagram and all its
components) the system was found to be sufficiently equipped to give full access
to these kinds of UML diagrams. The system enabled a real collaboration to
occur between visually impaired and sighted colleagues. This didactic component
will be further examined in future evaluations.
The fact that the same information can be examined in different ways was a
strong point. Users of the system had their own strategies and preferences for
navigating the information and interacting with the system. The varied use of
these different interface possibilities (allowing, for example, an overview of the
connections via the connection information field and via the joystick as well) was
a key component in the overall acceptability of the system and thus indicates that
multiple interfaces are appreciated, pointing towards future improvements (such
as using the numeric keypad for replacing the joystick movements).
However, there are some negative comments to mention, especially concerning
the hierarchical structured diagrams: the instruction materials could be more
explicit about how the information is represented in the TeDUB diagram. Other
comments mainly concern the ease and efficiency with which the information can
be accessed. For example, the hat switch on the joystick was found to be too
sensitive, users want to allocate functions to the joystick buttons themselves and
there were some complaints about the order of the information fields.
Most participants, however, expressed a very positive response to the system
and felt it would be of significant value in educational and vocational
environments. An interesting example was given by one participant, a software
engineer, who had been made redundant when her department switched to UML,
as she was unable to visualize the diagrams. A system like TeDUB would have
resolved that problem. This stresses the importance of a tool to provide access to
these kinds of diagrams. Taking the suggestions from this user study into
account, the current version of the TeDUB system has significant potential to
become an effective UML tool for visually impaired people. Another example
concerns a senior system designer who was initially very reluctant to participate
in the TeDUB project. During the preparation phase of the UML evaluation his
company sent him on a UML course, which succeeded in making him aware of
the importance of having a tool to have access to these kinds of diagrams.
Presentation of technical diagrams for blind people 159
6. Future directions: a semantic web enabled accessible presentation of graphical
data
Results presented in this article show that the form of presentation by a
partonomic hierarchy and an orthogonally navigable spatial view is of great value
to a blind user. To date those still require a human recipient to understand and
work with the information, which is extracted from the respective drawing, that is
the semantics extracted from the images are still represented only implicitly. No
means of automation supported retrieval �/ taking aside full text search �/ is so far
possible.
To overcome this limitation, methods could be investigated that would
formalize the annotations generated by the image analysis. The primary aim of
this effort is to enable semantic-based retrieval of technical drawings by blind
domain experts. As a side-effect, such semantic retrieval would also be valuable
to sighted colleagues.
6.1 Widening the scope
Setting the findings from the TeDUB evaluation in a web context stresses the
point that the representation that has been developed is suitable for a blind user’s
understanding of technical drawings, but still lacks the capability for integration
into a bigger scope such as retrieval in large repositories.
One such scope, and probably the largest currently conceivable one, is the
world wide web or its proposed next generation, the semantic web, the goal of
which is to achieve ‘a set of connected applications for data on the Web in such a
way as to form a consistnt(sic!) logical web of data (semantic web).’ (Berners-Lee
year).
Viewing TeDUB as a semantic web application, as in Tim Berners-Lee’s vision,
would enable a large group of visually impaired or blind computer users to
retrieve unannotated, thus up to now inaccessible, data. Furthermore, it would
enable automated retrieval of graphical data as a whole, rendering the painful
manual annotation virtually unnecessary.
6.2 Representing the ‘meaning’ of graphics
The core of the semantic web is centred on the idea of making human
understandable concepts (‘meanings’) reasonable by machines. Therefore, a
description formalism is needed that can assert ‘meanings’ to precise formal
vocabularies. Having this in mind, it becomes obvious to think of a transforma-
tion of the XML-based �/ thus purely syntactic �/ structure of the TeDUB
presentation format to a representation that implements a formal semantic
abstraction like the resource description framework (Klyne and Carroll year,
Hayes year).
160 M. Horstmann et al.
As outlined above, the presentation of analysed images for blind computer
users is centred around two orthogonal navigable structures, one spatial,
following connections that can also be seen in the drawing itself, and one
following a hierarchical structure that can be generated from the semantics of the
domain (cf. Figures 8 and 9).
For a blind user it is almost impossible to search for and successfully retrieve
graphics in a repository without the information being semantically annotated.
Furthermore, even in restricted domains such as architecture or digital circuit
design, manual annotation is bound to be ambiguous. We therefore plan to
introduce Resource Description Framework Schema (RDF(S)) to semantically
enrich the automatically extracted information. The structure that has already
been used in the previous, purely syntactic XML version can be translated to an
RDFS schema.
One next step therefore is the development of an automated transformation to
an RDF notation and enrichment of this representation by terminological
assertions. Thus we can enable basic semantic search without losing the
connection to the results so far achieved. Making the results of this step available
for retrieval by existing semantic web applications will show the usability of this
approach. The presentation application and its user interface for the blind
implicitly use assumptions about data semantics. To explicitly represent these is
the first target we aim in this approach. The structure defined in the schema is
therefore limited to the very needs of the application.
A usually underestimated aspect of knowledge processing software is the
amount of semantics that is implicit in the applications data structure. As a first
outcome we can show that quite a huge amount of reasoning power can be
gained by ‘simply’ making this semantics explicit by knowledge modelling
methods (e.g. ontologies).
Having defined the schema and a means to translate the analysis results to
RDF, we will have a powerful basis to implement semantic retrieval mechanisms
for image data.
7. Conclusion
This article provides an overview of the research and development efforts of the
TeDUB project and the evaluation of its current results. The user evaluations
regarding the UML domain show that the TeDUB system is well accepted by the
participants of the studies and has great potential to become a useful UML tool
for blind people. The results of the automatic interpretation of diagrams are
encouraging and, together with the possibility for a sighted user to interactively
support the interpretation, allow an accessible representation of a diagram to be
produced rapidly. The effectiveness of the analysis process will be subject to
future evaluation.
Presentation of technical diagrams for blind people 161
References
W. Abmeyr, Einfuhrung in die digitale Bildverarbeitung , Stuttgart: B.G. Teubner, 1994.
J.L. Alty and D.I. Rigas, ‘‘Communicating graphical information to blind users using music:
The role of context’’, in Proceedings of CHI 98 , New York: ACM Press, 1998, pp. 574�/
581.
C. Baillie, O.K. Burmeister and J.H. Hamlyn-Harris, ‘‘Web-based teaching: Communicating
technical diagrams with the vision impaired’’, in Proceedings of OZeWAI 2003,
Australian Web Accessibility Initiative Conference, December 2003.
T. Berners-Lee, 2004. Semantic Web Road Map. Available online at: www.w3.org/DesignIssues/
Semantic.html (accessed 24/11/04).
P. Blenkhorn, D.G. Evans, H. Petrie and J.K. Obee, ‘‘A system for access to computer aided
software engineering (CASE) diagrams for blind people’’, in International Conference on
Maps and Diagrams or Blind and Visually Impaired People: Needs Solution, Development ,
Ljubljana, Slovenia, October 1996.
Ph. Dosch, K. Tombre, C. Ah-Soon and G. Masini, ‘‘A complete system for the analysis of
architectural drawings’’, Int. J. Document Analysis Recogn. 3(2), pp. 102�/116, 2000.
P.K. Edman, Tactile Graphics, New York: American Foundation for the Blind, 1992.
Y. Eriksson, Tactile Pictures: Pictorial Representations for the Blind 1784�/1940 , Goteborg:
Acta Universitatis Gothoburgensis, 1998.
C. Faik, C. Capelle, C. Halet, C. Trullemans and C. Veraart, ‘‘Stereo sound board for real time
auditory coding of visual information’’, in W.L. Zagler, G. Busby and R.R. Wagner, Eds,
Computers for Handicapped Persons: 4 th International Conference, Berlin: Springer,
1994.
M. Fodisch, D. Crombie and G. Ioannidis, 1991, ‘‘TeDUB: Providing access to technical
drawings for print impaired people’’, in Proceedings of Conference and Workshop on
Assistive Technologies for Vision and Hearing Impairment: Accessibility, Mobility and
Social Integration , 2002.
J. Fricke, ‘‘A tactile graphic computer screen and input tablet for blind persons’’, in Proceedings
of the First World Congress on Technology for Disabled Persons, Washington DC, year.
B. Gallagher and W. Frasch, ‘‘Tactile acoustic computer interaction system (TACIS): A new
type of graphic access for the blind’’, in Technology for Inclusive Design and Equality
Improving the Quality of Life for the European Citizen, Proceedings of the 3rd TIDE
Congress, Helsinki, June 1998.
R. Gunzenhauser and W. Schweikhardt, ‘‘Tactile representation of scanned documents’’, in K.
Fellbaum, Ed., Access to Visual Computer Information by Blind Persons, State of the Art
and Proposals for Projects, Concerted Action of Technology and Blindness, pp. 87�/95.
Berlin, 1990.
P. Hayes, 2004. RDF Semantics. Available online at: www.w3.org/TR/rdf-mt/ (accessed
24/11/04).
R. Hinton, Tactile Graphics in Education , Edinburgh: Moray House Publications, 1996.
A.R. Kennel, ‘‘Audiograf: A diagram-reader for the blind’’, ACM ASSETS, Vancouver,
Canada, 1996.
G. Klyne and G.G. Carroll, 2004. Resource Description Framework (RDF): Concepts and
Abstract Syntax , Available online at: www.w3.org/TR/rdf-concepts/ (accessed 24/11/04).
M. Kobayashi and T. Watanabe, ‘‘A tactile display system equipped with a pointing device �/
MIMIZU’’, in K. Miesenberger, J. Klaus and W. Zagler, Eds, Computers Helping People
with Special Needs: 8 th International Conference. Berlin: Springer, 2002.
M. Kurze, ‘‘Giving blind people access to graphics (example: business graphics)’’, in
Proceedings Software-Ergonomie ’95 Workshop Nicht-visuelle graphische Benutzungso-
berflachen , Darmstadt, February 1995.
162 M. Horstmann et al.
J. Lotzsch, ‘‘Computer-aided access to tactile graphics for the blind’’, in W.L. Zagler, G. Busby
and R.R. Wagner, Eds, Computers for Handicapped Persons: 4th International
Conference, Berlin: Springer, 1994.
T. Maucher, J. Schemmel and K. Meier, ‘‘The Heidelberg tactile vision substitution system’’, in
Proceedings of the International Conference on Computers Helping People with Special
Needs ICCHP, Karlsruhe, 2000.
S. Morley, H. Petrie, A.-M. O’Neill and P. McNally, ‘‘Auditory navigation in hyperspace:
Design and evaluation of a non-visual hypermedia system for blind users’’, in
Proceedings of ASSETS ’98, the Third Annual ACM Conference on Assistive Technol-
ogies, Los Angeles, 1998.
D. Parkes, ‘‘Nomad: an audio-tactile tool for the acquisition, use and management of spatially
distributed information by partially sighted and blind people’’, in A.F. Tatham and A.G.
Dodds, Eds, Proceedings of the Second International Symposium on Maps and Graphics
for Visually Handicapped People, London: King’s College, 1998.
H. Petrie, CH. Schlieder, P. Blenkhorn, D.G. Evans, A. King, A.-M. O’Neill, G. Ioannidis, B.
Gallagher, D. Crombie, R. Mager and M. Alafaci, ‘‘TeDUB: A system for presenting
and exploring technical drawings for blind people’’, in Proceedings of 8th International
Conference on Computers Helping People with Special Needs, 2002, pp. 537�/539.
H. Petrie, A-M. O’Neill and C. Colwell, ‘‘Computer access by visually impaired people’’, in A.
Kent and J.G. Williams, Eds, Encyclopedia of Microcomputers, Vol. 28, New York:
Marcel Dekker, 2002, pp. 17�/33.
W. Schweikhardt, ‘‘Interactive exploring of printed documents by blind people’’, in J. Klaus, E.
Auff, W. Kremser and W.L. Zagler, Eds, Interdisciplinary Aspects on Computers Healing
People with Special Needs: 5 th International Conference, Wien: R. Oldenbourg, 1996.
Presentation of technical diagrams for blind people 163