Embed Size (px)
Citation preview
DEGREE PROJECT, IN , FIRST LEVELMECHATRONICS
STOCKHOLM, SWEDEN 2015
Automated Greenhouse
TEMPERATURE AND SOIL MOISTURECONTROL
DANIELA ATTALLA, JENNIFER TANNFELT WU
KTH ROYAL INSTITUTE OF TECHNOLOGY
INDUSTRIAL ENGINEERING AND MANAGEMENT


Automated Greenhouse
DANIELA ATTALLAJENNIFER TANNFELT WU
Bacherlor’s Thesis in Mechatronics
Supervisor: Baha Alhaj HasanExaminer: Martin Edin GrimhedenApproved: 2015-05-19
TRITA MMK 2015:22 MDAB075

AbstractIn this thesis an automated greenhouse was built with the purpose of investi-gating the watering system’s reliability and if a desired range of temperaturescan be maintained.
The microcontroller used to create the automated greenhouse was an Ar-duino UNO. This project utilizes two different sensors, a soil moisture sensorand a temperature sensor. The sensors are controlling the two actuators whichare a heating fan and a pump. The heating fan is used to change the temper-ature and the pump is used to water the plant.
The watering system and the temperature control system was tested bothseparately and together. The result showed that the temperature could bemaintained in the desired range. Results from the soil moisture sensor wereuneven and therefore interpret as unreliable.
iii


SammanfattningAutomatiserat Växthus
I denna tes byggdes ett automatiserat växthus med syftet att undersöka dessbevattningssystems pålitlighet samt om ett önskat temperaturspann kan bibe-hållas.
Microkontrollern för att bygga detta automatiserade växthus var en Ardu-ino UNO. Detta projekt använder sig av två olika sensorer, en jordfuktsensoroch en temperatursensor. Sensorerna kontrollerar en värmefläkt och en pump.Värmefläkten används för att ändra temperaturen och pumpen för att vattnaplantan.
Bevattningssystemet och temperaturstyrningen har testats både separatoch tillsammans. Resultatet visar att temperaturen kan bibehållas inom detönskade spannet. Resultaten från jordfuktsensorn var ojämna och därför tolkatssom opålitliga.
v


Preface
We have been working on this project during the spring of 2015, and we would nothave been able to finish it without the help and support from our supervisor BahaAlhaj Hasan, Staffan Qvarnström and the lab assistants Jimmy Karls, SebastianQuiroga and Tobias Gustafsson. Another thanks to Ylva Steffner for giving usfeedback on the report. Finally, we would like to add a special thank you to MartinEdin Grimheden for making this project a fun experience.
Daniela AttallaJennifer Tannfelt WuStockholm, May, 2015
vii


Contents
Abstract iii
Sammanfattning v
Preface vii
Contents ix
Nomenclature xi
1 Introduction 11.1 Background . . . . . . . . . . . . . . . . . . . . . . . . . . . . . . . . 11.2 Purpose . . . . . . . . . . . . . . . . . . . . . . . . . . . . . . . . . . 11.3 Scope . . . . . . . . . . . . . . . . . . . . . . . . . . . . . . . . . . . 21.4 Method . . . . . . . . . . . . . . . . . . . . . . . . . . . . . . . . . . 2
2 Theory 52.1 Automated Greenhouse Projects . . . . . . . . . . . . . . . . . . . . 52.2 Sensors . . . . . . . . . . . . . . . . . . . . . . . . . . . . . . . . . . 52.3 Heating Fan . . . . . . . . . . . . . . . . . . . . . . . . . . . . . . . . 72.4 Watering System . . . . . . . . . . . . . . . . . . . . . . . . . . . . . 8
3 Demonstrator 113.1 Problem Formulation . . . . . . . . . . . . . . . . . . . . . . . . . . . 113.2 Software . . . . . . . . . . . . . . . . . . . . . . . . . . . . . . . . . . 133.3 Electronics . . . . . . . . . . . . . . . . . . . . . . . . . . . . . . . . 133.4 Hardware . . . . . . . . . . . . . . . . . . . . . . . . . . . . . . . . . 163.5 Test Results . . . . . . . . . . . . . . . . . . . . . . . . . . . . . . . . 18
4 Discussion and conclusions 234.1 Discussion . . . . . . . . . . . . . . . . . . . . . . . . . . . . . . . . . 234.2 Conclusions . . . . . . . . . . . . . . . . . . . . . . . . . . . . . . . . 24
5 Recommendations and future work 255.1 Recommendations . . . . . . . . . . . . . . . . . . . . . . . . . . . . 25
ix

5.2 Future work . . . . . . . . . . . . . . . . . . . . . . . . . . . . . . . . 25
Bibliography 27
Appendices
A Draft of Nozzle 29
x
Nomenclature
SymbolsSymbols DescriptionR Resistance (Ω)ρ Resistivity (Ω·m)L Length of element (m)A Cross-section area (m2)V CC Positive voltage supply (V)Tp Preferred temperature (°C)U Voltage (V)t Time (s)d Duty cycle (%)T Period (s)p Pulse (s)I Current (A)P Power (W)
AbbreviationsAbbreviation DescriptionGND GroundPWM Pulse Width ModulationNTC Negative Temperature CoefficientDC Direct CurrentRPM Revolutions Per MinuteRTD Resistance Temperature DetectorPTC Positive Temperature CoefficientNO Normally OpenNC Normally ClosedSD Standard Deviation
xi

Chapter 1
Introduction
This chapter introduces the background, purpose, scope and method of the project.
1.1 BackgroundIn modern society, the consumption of fruits and vegetables has become the norm.A variety of fresh fruits and vegetables should be accessible at all times. However,the northern climate prevents the growth of certain fruits and vegetables, especiallyduring winter. This results in import from southern countries, which in turn hassome drawbacks.
Not only does the shipping of imported goods affect the environment negativelybut imported food or vegetables are also less flavourful [ISAAA, 2014] and sold to ahigher price. The crops must be harvested prematurely when importing food. Thisis to delay the ripening process so that it is possible for the fruits or vegetables toreach their destination before they are considered inedible. The ripening processis later resumed by spraying the food with ethylene gas, a gas that is deemedto promote ripening in certain fruits and vegetables. However, this postharvestripening can lead to poor taste.
In the past couple of years, an increased interest in organic and locally producedfood has become a growing trend [EkoWeb, 2014]. Locally grown foods are pickedat their peak of ripeness and are therefore full of flavor. Furthermore, growing foodat home assures truly organic food. On the other hand it takes a lot of time andeffort, and time is something that most people lack today.
1.2 PurposeThe purpose of this project was therefore to make it easier to grow food at home.This can be achieved with the use of an automated greenhouse. A greenhouse makesit possible to replicate a different climate and consequently grow food that would nottypically grow in the area. Additionally, making the greenhouse automated enablespeople to grow their own food or plants at home without having to constantly look
1
CHAPTER 1. INTRODUCTION
after them. It can be reassuring to know that the plants are taken care of while oneis on vacation or not around the house for a longer period of time.
The research question of this study was to analyze if it is possible to maintainthe greenhouse temperature in a desired range for optimal plant growth using atemperature control system. Another objective was to investigate if the wateringsystem is reliable, that is whether or not it can obtain a perfect soil moisture levelfor the chosen plant.
1.3 ScopeThe automated greenhouse in this project is meant for domestic use. This meansthat the greenhouse will be somewhat small, about 42cmx30cmx21cm. If it wasmade to be bigger, more components would be needed in the greenhouse in orderto obtain the desired climate.
This project focuses on one plant only, which is basil. This is because basil is acommon herb that some people have in their windowsill. The size of it is suitablefor a small greenhouse used at home. A specific plant is needed as a reference sothat the temperature control system can be built around its preferences. However,this reference can be changed into any other plant.
The greenhouse has to be able to create a microclimate suitable for basil. Somefactors have to be controlled in order to do that. In this project the temperatureand soil moisture were measured and a control loop including a heating fan and awatering system was actuated. This project does not cover all of the factors thatcan be taken into considerations to create as much of a favourable environment aspossible. Other factors could be light and carbon dioxide.
The room temperature is assumed to be at 21°C. Another assumption that hasbeen made is that the temperature outside of the greenhouse, the room temperature,will always be colder or equal to the temperature inside of the greenhouse. The plantthat will be put in the greenhouse will therefore have a preferred temperature atroom temperature or above.
The result of the research questions is based on time restricted experiments.This result could be different in the long run and it is therefore not valid in thatcase.
The values for when the soil is considered to be too wet or too dry is dependanton the type of soil used. These values cannot be used on other types of soils, whichhave to be individually set with the help of the tests.
1.4 MethodAn automated greenhouse, with a temperature control system and a watering sys-tem, was built in order to answer the research questions. The microcontroller usedto create the automated greenhouse was an Arduino UNO. The temperature controlsystem consists of a temperature sensor, a computer fan and a power resistor with
2
1.4. METHOD
a heat sink. The fan and heater were controlled separately to adjust the tempera-ture. The watering system consists of a soil moisture sensor, a water tank, a watercirculator pump and a hose. The watering was turned on or turn off based on thesoil moisture level read from the sensor.
Temperature Control SystemA temperature control loop, where the fan was running at different speeds at differ-ent temperatures, was implemented to keep the temperature in the accepted range.This temperature range was chosen with regard to the preferences of the basil plant.The greenhouse was put to test by changing the room temperature and the tem-perature of the greenhouse. The tests were conducted to observe if the temperatureinside the greenhouse would stabilize and stay in the accepted temperature range.
The temperature control system underwent three tests to investigate its abilityto maintain the temperature in the desired range. The first test was to cool downthe greenhouse. The greenhouse temperature was warmer than the accepted rangeat the beginning of the test. The second test was to warm up the greenhouse.The surrounding temperature, the room temperature, in this test was colder thanthe accepted range. The last test was to let the control system operate for a longperiod of time to control that it can stabilize in the accepted range. These testswere executed three times each to make sure that the results were reliable.
Watering SystemThe watering system underwent two tests to analyze the reliability of the system.The first test was to examine whether the circulator pump gives the same amountof water each time to determine the reliability of the pump. The second test wasabout measuring the soil moisture level at the same spot during a long period oftime. If the moisture level is stable around the same value the sensor could be seenas reliable.
The accepted range of soil moisture values was determined by sampling valueswhen the soil was estimated through hand contact with the soil to be too dry ortoo wet. A flower pot with soil was used to do the measurements. The plant waswatered until it got to the exact point where it was determined to be too wet. Thevalue from the sensor became the upper limit. The pot was then exposed to heatin order to speed up the evaporation. The soil was too dry at this point. It wastherefore watered until it got to the exact point were it was determined not to bedry anymore. This value became the lower limit.
The watering system was put through its tests until they showed similar resultsto minimize the possible error sources. If both of these tests were approved, thesystem was deemed reliable.
3

Chapter 2
Theory
This chapter introduces the theory behind the thesis project and presents similarprojects that have been done before.
2.1 Automated Greenhouse ProjectsPlenty of projects involving gardening and Arduinos have been done. An Arduinois a prototyping platform which is well suited for interactive projects since it cansense its surroundings with the help of sensors and subsequently affect the samesurroundings by controlling actuators [Arduino, 2015].
There is in fact a term for gardening Arduinos, “Garduinos“. Some previousprojects are simple and others are complex. What can count as Garduino is notdefined but most commonly they all have a watering system. Other features canbe carbon dioxide and light regulation. This project differs from other “Garduinos“since it focuses more on temperature control.
2.2 SensorsThis section presents the two sensors needed to build the automated greenhouseand to answer the research question.
Soil Moisture
The soil moisture sensor is a resistive sensor. That is, the soil moisture level isdetermined by measuring the electrical resistivity between two electrodes placed inthe soil. The final output from the sensor is the voltage over the electrodes. A lowelectrical resistivity means that electricity is easily conducted through the soil. Thisresistance is based on water resistivity and is calculated according to the followingformula [Johansson, 2013]
R = ρL
A(2.1)
5
CHAPTER 2. THEORY
Where R is the resistance, ρ is the materials resistivity, L the length of thematerial and A the cross section area. This equation indicates that a high resistivitywill lead to a high resistance and vice versa. According to [AEMC Instruments,2008], dry top soil has a resistivity greater than 109 Ω·cm, while top soil with a2.5% moisture content has a resistivity of 250,000 Ω·cm. Hence, the more water thesoil contains the easier it is for the soil to conduct electricity. To put it simply, drysoil conducts electricity poorly because of a high resistance while moist soil conductselectricity more easily because of a lower resistance. This is the basis of how thesoil moisture level is determined. A current is sent through one of the electrodesand the voltage between the electrodes is measured.
Temperature
Temperature sensing can be accomplished by two different methods, either withcontact or non-contact. Contact temperature sensors require physical contact withthe substance or object that is being sensed. This type of sensor can be usedon solids, liquids and gases. Non-contact type of temperature sensors detects theemitted infrared energy from an object or substance and can be used on solids andliquids [Watlow, 2015]. The focus will therefore be put on contact temperaturesensors seeing as non-contact temperature sensors cannot be used on gases. Themost common contact temperature sensors, such as thermocouples or thermistors,use either voltage signals or resistance values to determine the temperature.
A thermocouple uses voltage signals to measure the temperature. It consists oftwo junctions of dissimilar metal wires. The temperature is measured at the junc-tion where the wires are welded. A voltage signal is generated when the junctionexperiences a temperature change. The temperature can then be calculated usingthermocouple reference tables to interpret the voltage [REOTEMP Instruments,2011]. Thermocouples can determine temperatures ranging from below −200°C toabout 2000°C, making it the sensor with the widest range of temperatures [Elec-tronics Tutorials, 2014b].
A thermistor is a thermally sensitive resistor that uses resistance values to de-termine the temperature. It is made of a semiconductor and changes its physicalresistance when exposed to temperature changes [National Instruments, 2013]. Theprice of a thermistor is relatively low and the accuracy is high within its operatingrange [European Virtual Institute for Thermal Metrology, 2012]. Thermistors gen-erally have a NTC, a negative temperature coefficient, which means that it decreasesits resistance with an increased temperature. They can, however, also have a PTC,a positive temperature coefficient. A current has to be sent through the thermistorin order to get a measurable voltage, which makes the thermistor a passive resistivedevice [Electronics Tutorials, 2014b].
Due to the fact that thermocouples have a wide range of temperature, theyare well suited for both high and low temperatures as well as highly fluctuatingtemperatures. Thermistors have a much smaller range of temperatures than ther-mocouples. They are on the other hand highly sensitive, which gives a high accuracy
6
2.3. HEATING FAN
over a small temperature range. This project does not require a wide range of tem-peratures since the greenhouse is placed in an environment where the temperaturebarely fluctuates. Consequently, the chosen type of sensor is a thermistor. The factthat this kind of temperature sensor is both cheap and readily available has alsoadded to the reasoning behind the decision.
2.3 Heating FanThe building components of the heating fan are a computer fan, a heat sink anda power resistor. A Pulse Width Modulation, PWM, signal is used to control thespeed of the fan and a power resistor to generate the heat.
Computer Fan ControlSmall computer fans are powered by brushless DC motors. They typically have threeor four pins. The red and black are normally positive and negative power supply.The third pin is usually yellow and is a tachometer output that counts revolutions.The fourth pin is usually blue and enable PWM control [Giorgos Lazaridis, 2010].
With a four pin fan the PWM signal can be controlled. The PWM duty cyclematch the speed of the fan, 100% duty cycle is equal to full speed of the fan.Most fans has an area where the signal is undetermined and the RPM can not becontrolled, this is below 30% of maximum RPM [Intel Corporation, 2004].
To avoid the undetermined area and be able to set the duty cycle to 0% atransistor can be used to block the current, since they can act as switches.
The two most common types of transistors are bipolar junction transistors andfield effect transistors. They can control the current passing though the transistors.A bipolar junction transistor is controlled by an direct current while the field effecttransistors is controlled by a voltage. In this project a bipolar transistor is usedsince it can easily be controlled from the Arduino 5 V pin [Johansson, 2013].
A bipolar junction transistor has three leads for connection, called base, emitterand collector. The emitter is the negative lead, the collector is the positive lead andthe base activates the transistor [V. Ryan, 2002].
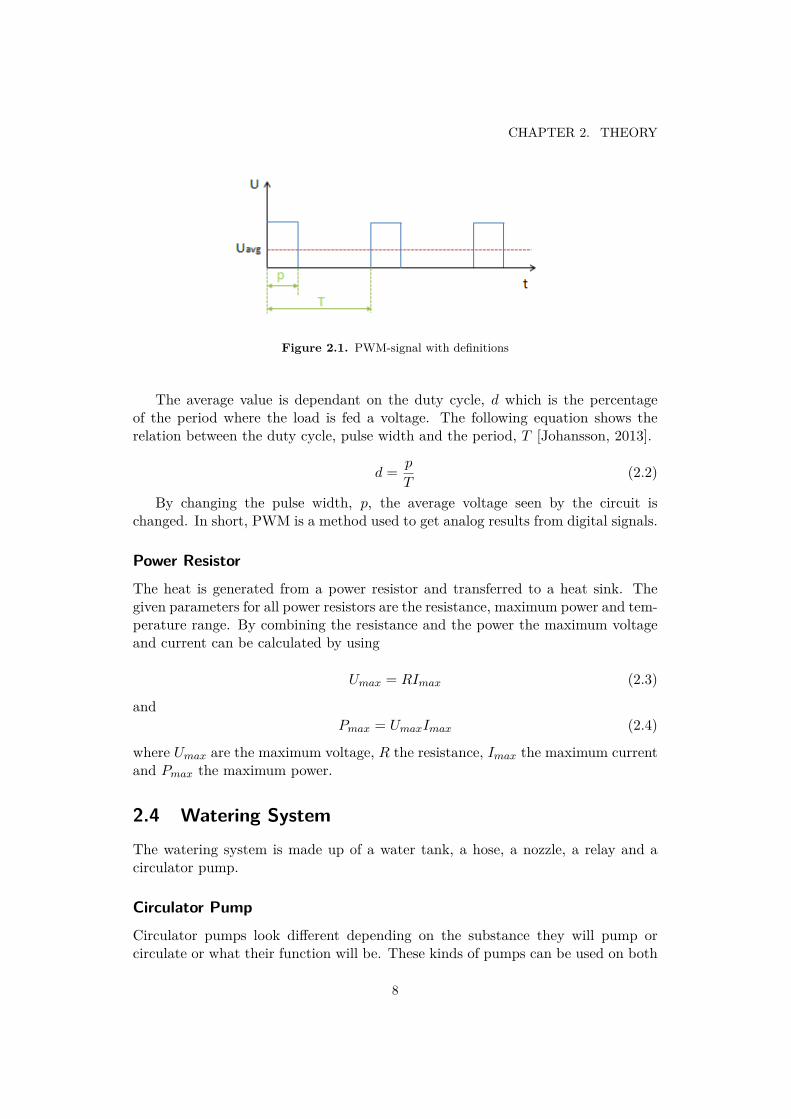
PWMPWM is a technique used to feed a load a pulsing voltage signal that will be per-ceived as a direct current, DC, voltage. By switching the voltage on and off, anaverage voltage is achieved. This method is illustrated in figure 2.1.
7
CHAPTER 2. THEORY
Figure 2.1. PWM-signal with definitions
The average value is dependant on the duty cycle, d which is the percentageof the period where the load is fed a voltage. The following equation shows therelation between the duty cycle, pulse width and the period, T [Johansson, 2013].
d = p
T(2.2)
By changing the pulse width, p, the average voltage seen by the circuit ischanged. In short, PWM is a method used to get analog results from digital signals.
Power ResistorThe heat is generated from a power resistor and transferred to a heat sink. Thegiven parameters for all power resistors are the resistance, maximum power and tem-perature range. By combining the resistance and the power the maximum voltageand current can be calculated by using
Umax = RImax (2.3)
andPmax = UmaxImax (2.4)
where Umax are the maximum voltage, R the resistance, Imax the maximum currentand Pmax the maximum power.
2.4 Watering SystemThe watering system is made up of a water tank, a hose, a nozzle, a relay and acirculator pump.
Circulator PumpCirculator pumps look different depending on the substance they will pump orcirculate or what their function will be. These kinds of pumps can be used on both
8
2.4. WATERING SYSTEM
liquids and gases. Some pumps are made for closed circuits and others are madefor open [Grundfos, 2009]. Common areas of use are in heating or cooling systems,but they can also be found in aquariums. This project requires a circulator pumpthat is made for liquids since the pump will supply water to the plants.
RelayA relay operates as an electromagnetic switch. It can control a high voltage cir-cuit by using only a low voltage control signal. The building components of anelectromechanical relay are basically a fixed coil, a movable armature, a spring andcontacts. The number of contacts varies from one pair to several. The coil generatesa magnetic field when a low voltage control signal has been sent. As a consequenceof this, the armature is attracted by the magnetic field so that it pushes the contactpair towards each other. This completes the high voltage circuit. The spring isattached between the coil and the armature. When the control signal is no longersent to the circuit the spring pulls the armature back to its original position.
Electromechanical relays are categorized into two types, Normally Open (NO)and Normally Closed (NC). The contacts on a NO relay are only closed when acurrent is sent through the relay. In a similar way, the contacts on a NC relay areonly open when a current is sent through the relay. A NO relay is preferred whenthe controlled circuit will be off most of the time and a NC is preferred when thecircuit will mostly be on [Electronics Tutorials, 2014a].
The number of pins depends on the required connections for the circuit. WhenAC is used, both of its leads have to be connected to the relay since the current canflow in either direction.
9


Chapter 3
Demonstrator
This chapter presents the construction of the greenhouse and how the theory wasimplemented.
3.1 Problem Formulation
To obtain and retain a perfect temperature in the greenhouse the fan and heaterwas used. The fan was running when the temperature was above the upper limitof an accepted range, as well as when the temperature fell below the lower limit.The heat was also turned on when the temperature was below the lower limit. Thisrange was divided into five states with two grey areas, and these are illustrated infigure 3.1. The accepted range was used to create smoother transitions between thestates. Depending on the detected temperature, different states of the actuatorswas entered.
Figure 3.1. Fan and heating control at different temperature
11
CHAPTER 3. DEMONSTRATOR
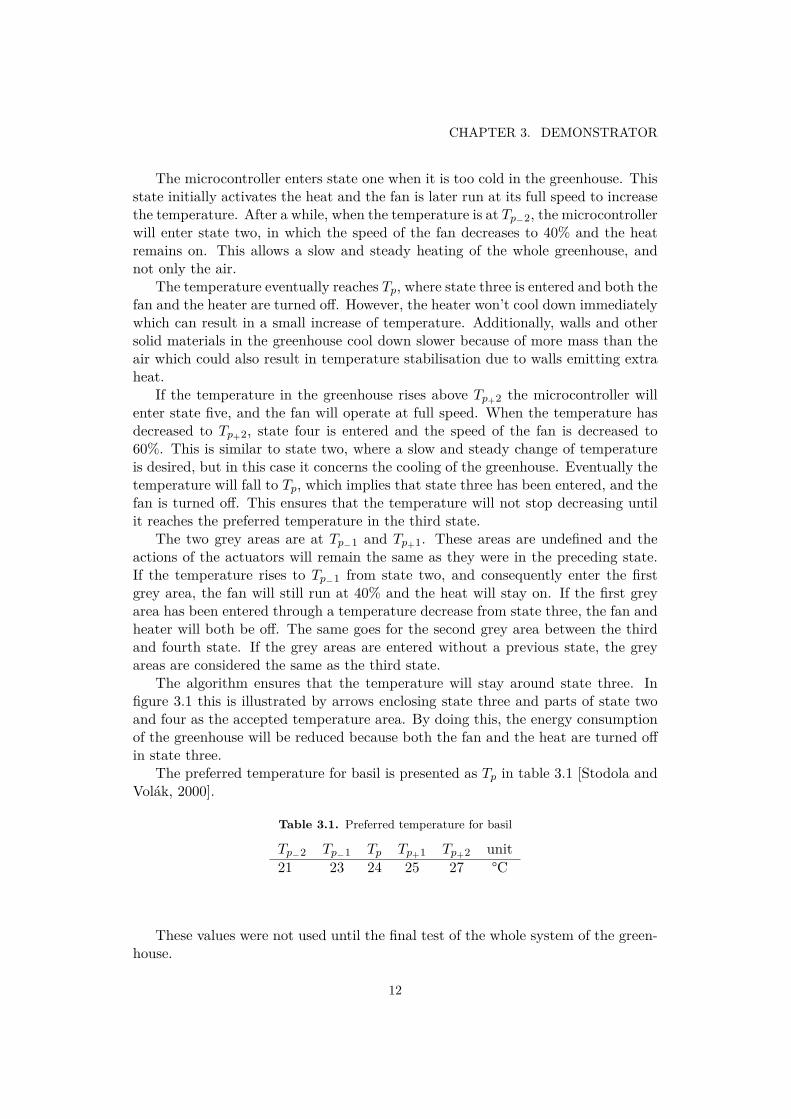
The microcontroller enters state one when it is too cold in the greenhouse. Thisstate initially activates the heat and the fan is later run at its full speed to increasethe temperature. After a while, when the temperature is at Tp−2, the microcontrollerwill enter state two, in which the speed of the fan decreases to 40% and the heatremains on. This allows a slow and steady heating of the whole greenhouse, andnot only the air.
The temperature eventually reaches Tp, where state three is entered and both thefan and the heater are turned off. However, the heater won’t cool down immediatelywhich can result in a small increase of temperature. Additionally, walls and othersolid materials in the greenhouse cool down slower because of more mass than theair which could also result in temperature stabilisation due to walls emitting extraheat.
If the temperature in the greenhouse rises above Tp+2 the microcontroller willenter state five, and the fan will operate at full speed. When the temperature hasdecreased to Tp+2, state four is entered and the speed of the fan is decreased to60%. This is similar to state two, where a slow and steady change of temperatureis desired, but in this case it concerns the cooling of the greenhouse. Eventually thetemperature will fall to Tp, which implies that state three has been entered, and thefan is turned off. This ensures that the temperature will not stop decreasing untilit reaches the preferred temperature in the third state.
The two grey areas are at Tp−1 and Tp+1. These areas are undefined and theactions of the actuators will remain the same as they were in the preceding state.If the temperature rises to Tp−1 from state two, and consequently enter the firstgrey area, the fan will still run at 40% and the heat will stay on. If the first greyarea has been entered through a temperature decrease from state three, the fan andheater will both be off. The same goes for the second grey area between the thirdand fourth state. If the grey areas are entered without a previous state, the greyareas are considered the same as the third state.
The algorithm ensures that the temperature will stay around state three. Infigure 3.1 this is illustrated by arrows enclosing state three and parts of state twoand four as the accepted temperature area. By doing this, the energy consumptionof the greenhouse will be reduced because both the fan and the heat are turned offin state three.
The preferred temperature for basil is presented as Tp in table 3.1 [Stodola andVolák, 2000].
Table 3.1. Preferred temperature for basil
Tp−2 Tp−1 Tp Tp+1 Tp+2 unit21 23 24 25 27 °C
These values were not used until the final test of the whole system of the green-house.
12

3.2. SOFTWARE
3.2 SoftwareThe control loop of the system is dependent of the five states earlier discussed andfollows the flow chart displayed in figure 3.2. The program starts without being ina state but after the first run a state has been entered.
Figure 3.2. Flow chart of the heating fan
At first the temperature is read and depending of its value a state is entered andan action of the fan and heater are actuated. The loop saves the previous state soif a grey area is entered the correct action can operate. In the end of the loop thesoil moisture value is read and if the value is below the measured limit the pumpwill be operated.
The first time state one or two is entered the loop is delayed for three and a halfminute to let the power resistor to heat up before the fan is tuned on for 15 seconds.If state two is entered from state one or two the delay is set to 45 seconds and ifstate one is entered the delay is set to one minute. State one has a longer delaythan state two because the fan is set to full speed which will further cool down thepower resistor. The temperature is read every 15 second and an action will operateduring those 15 seconds.
3.3 Electronics
Sensors
The air temperature was measured by using the sensor DHT11 [D-Robotics UK,2010], which is a combined temperature and humidity sensor. It can measure tem-
13
CHAPTER 3. DEMONSTRATOR
peratures between 0°C and 50°C and the relative humidity range in 25°C is 20-90%.This project only utilizes the temperature sensing part of the sensor.
The sensor is connected through single-wire serial interface with the microcon-troller. One transmission between the sensor and Arduino takes about 40 ms andcontains 40 bit of data. Every bit transmission starts with a low-voltage and de-pending on the length of the following high-voltage a “1“ or “0“ is determined.
Power ResistorFor heat generation, 20 watts of power was chosen but for safety margin a 25 wattspower resistor was used. An important factor for the resistor is the temperaturerange and a higher maximum temperature is preferred. The used one has a maxi-mum temperature of 200°C. The last chosen parameter was the resistance. A higherresistance gives less current which gives higher voltage according to equation (2.4)combined with equation (2.3). The used power resistor has the resistance of 12 Ω.This results in maximum voltage of 15.5 V and maximum current of 1.29 A. Theused aluminum housed resistor is a HS25 manufactured by Arcol [Arcol, 2012]. Atransistor was used to control the power supply to the power resistor so that it couldbe turned off and on at the specified temperatures.
TransistorA PWM signal will be sent to the base of the transistor and it will switch on andoff depending on the signal. A TIP152 transistor was determined to be appropriatefor this project with its maximum voltage of 12 V and maximum current of 1.2 A[SPC Multicomp, 2008].
RelayThis project used G2R-2A relay with flux protection [OMRON Corporation, 2012].Considering the fact that the relay will act as a switch for the pump, which will beturned off most of the time, a NO relay was chosen.
The relay was connected to the cord of the pump by first cutting the cord inhalf. It is also connected to a diode, a transistor and a resistor. This is illustratedin the electrical circuit in Figure 3.3.
14
3.3. ELECTRONICS
Figure 3.3. Electrical circuit of the relay, resistor, transistor and the diode
System SetupThe whole system is connected to one Arduino board with common ground. Thetemperature control system is connected to the Arduino in figure 3.4. The DHT11sensor is connected to a digital pin and the 5 V pin on Arduino. The fan is poweredby an external 5 V power source and is controlled by a signal from a digital outputthrough a transistor. The power resistor is, similarly to the fan, controlled by adigital signal through a transistor and powered by an external power source.
15

CHAPTER 3. DEMONSTRATOR
Figure 3.4. Schematic over temperature control
The electronic part of watering system consists of the soil moisture sensor andthe relay for the pump. Both of these components share the same power source asthe temperature sensor, the Arduino 5 V pin. The relay is connected to a digitalpin while the soil moist sensor is connected to an anolog pin.
3.4 HardwareThe greenhouse is constructed with a cut-out in one of its short sides where theheater is placed. The pump and fan are placed on the outside of the greenhouse.The basil was watered from the tank by a hose that enters the greenhouse throughthe same short side as where the heater is placed. The soil moisture sensor is placedin the basil pot and the temperature sensor is placed inside the greenhouse on theopposite side of the heater. This is illustrated in figure 3.5.
16
3.4. HARDWARE
Figure 3.5. 1) Temperature control system, 2) hose, 3) greenhouse, 4) soil moisturesensor, 5) temperature sensor and 6) basil pot.
The Arduino and the remaining electronic components are all placed on theoutside of the greenhouse.
Temperature Control
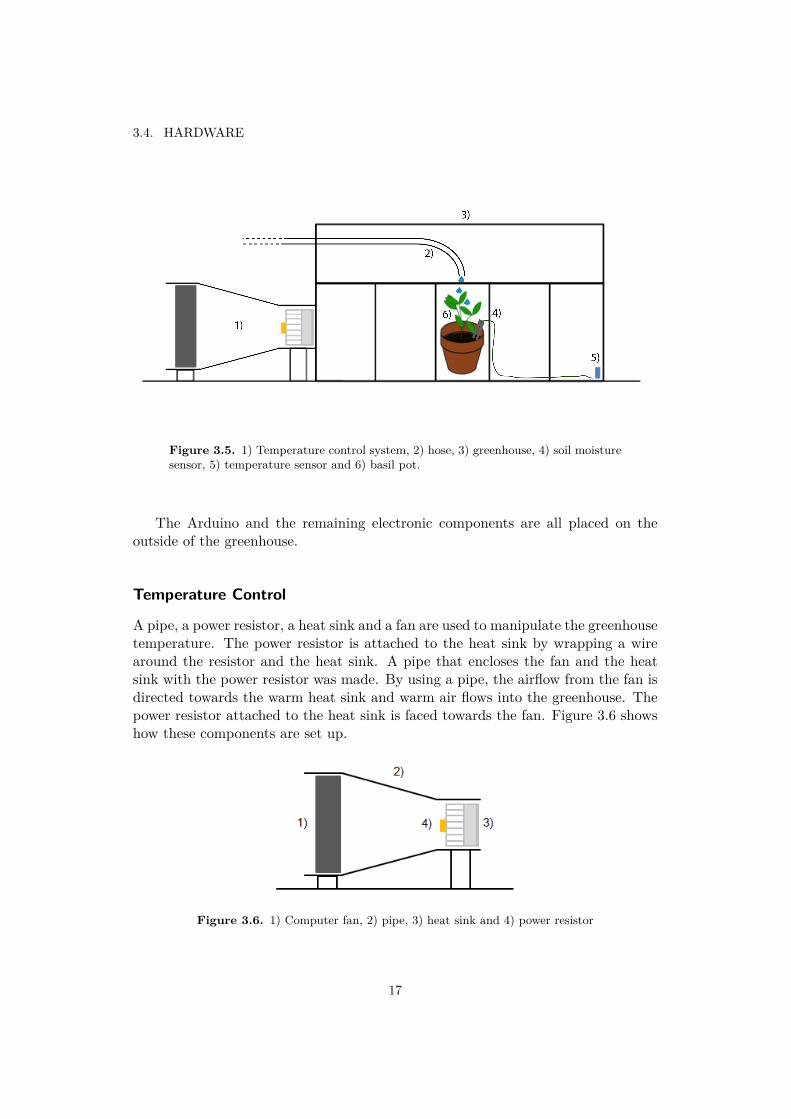
A pipe, a power resistor, a heat sink and a fan are used to manipulate the greenhousetemperature. The power resistor is attached to the heat sink by wrapping a wirearound the resistor and the heat sink. A pipe that encloses the fan and the heatsink with the power resistor was made. By using a pipe, the airflow from the fan isdirected towards the warm heat sink and warm air flows into the greenhouse. Thepower resistor attached to the heat sink is faced towards the fan. Figure 3.6 showshow these components are set up.
Figure 3.6. 1) Computer fan, 2) pipe, 3) heat sink and 4) power resistor
17

CHAPTER 3. DEMONSTRATOR
Watering System
The utilized circulator pump was an EHEIM compact 600 [EHEIM, 2015] and iscommonly used in aquariums. It can pump up to 600 litres of water per hour andraise the water up to 1.3 metres. The operating voltage of the pump is 230 V.
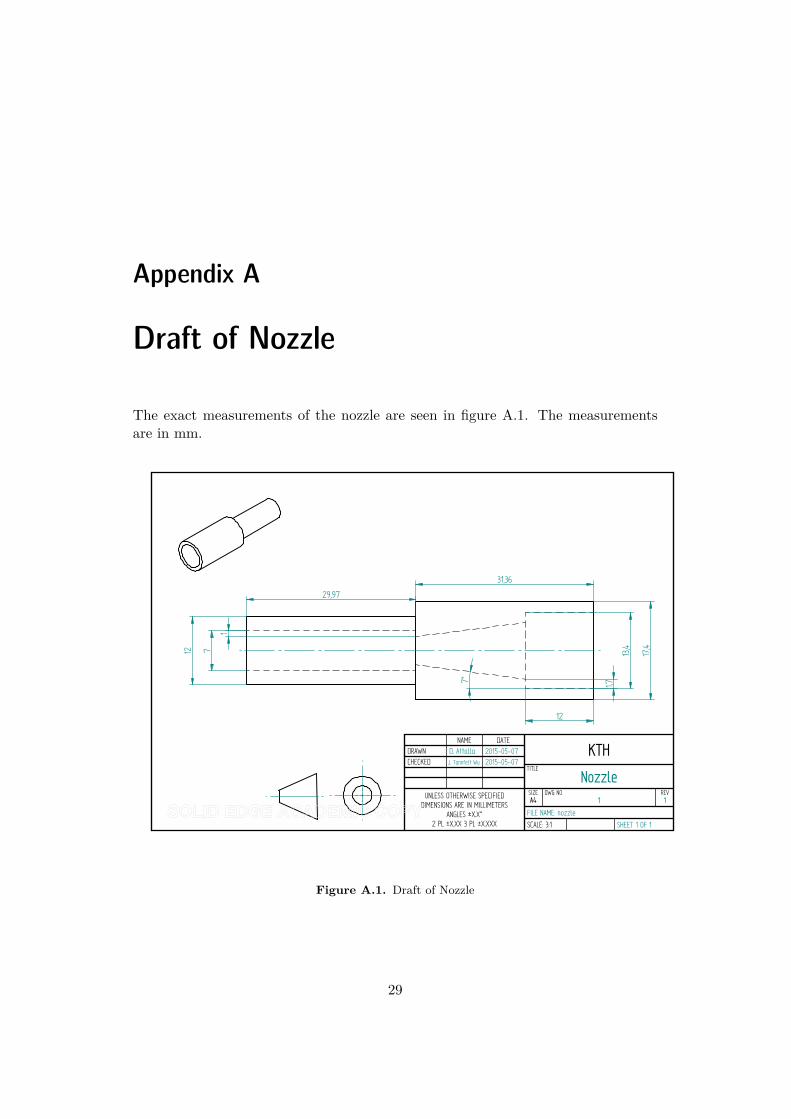
A hose was used in order to water the plant with the pump. The hose was madeof transparent PVC, and has an inner diameter of 5 mm and an outer diameter of7 mm. The diameter of the outflow of the pump is 13 mm. Consequently, a nozzlewas made so that the hose could be connected to the pump. The draft with exactmeasurements of the nozzle can be found in Appendix A. Figure 3.7 illustrates thesetup of the pumping system. The relay, however, is not included in the figure.
Figure 3.7. 1) Water tank, 2) circulator pump, 3) nozzle 4) hose
3.5 Test Results
The executed tests can be divided into the testing of the watering system, the tem-perature control system and the whole system. The tool used to collect data fromthe soil moister sensor is MATLAB with an Arduino support package [MathWorks,2014]. The sensor values was saved and plotted in a graph over time. CoolTermis another program used to save values and set a timestamp on the saved values[Roger Meier, 2015].
Soil Moisture Limits
This test resulted in the limit for dry soil and wet soil presented in table 3.2 as amean value with standard deviation.
The values were sampled 12 times from different spots in soil that was estimatedto be too dry or too wet through hand contact with the soil.
18

3.5. TEST RESULTS
Table 3.2. Limits of tested soil moisture values
Soil Mean Value [V] SD [V]Dry 1.75 0.195Wet 0.119 0.0445
Reliability of Soil Moisture SensorThe soil moisture sensor was tested by a simple test of letting the sensor stay inthe same soil at the same spot for a period of time. The soil in this particular testwas dry. Samples were taken every ten seconds and the moisture values over timeis plotted in figure 3.8.
Figure 3.8. Soil moisture level at a fixed point in dry soil
Reliability of the PumpThe pump was tested by setting it up at the right height and position in the green-house with the hose leading to the position of a flower pot. The length of the hosefrom the outflow to the point where the height was the same as the pump was 50cm. The pump was turned on for two seconds three times and a cup was filled. Thisresulted in an average volume of 100 ml with a standard deviation, SD, of 1.7 ml.This test was repeated three times to receive the data. With this data the waterflow in the hose was calculated to 21.6 ml/s on a minimum speed.
This test was also applied to test the amount of water suitable for the testedbasil plant. An appropriate amount of water to the basil plant was determined to
19
CHAPTER 3. DEMONSTRATOR
be 10 ml. The tested operating time for the pump was therefore set to 750 ms andthe cup was weighed after each pump. The scale had an accuracy of 1 gram. Thistest was repeated twelve times and the mean value was 9.58 ml with a SD of 0.90ml.
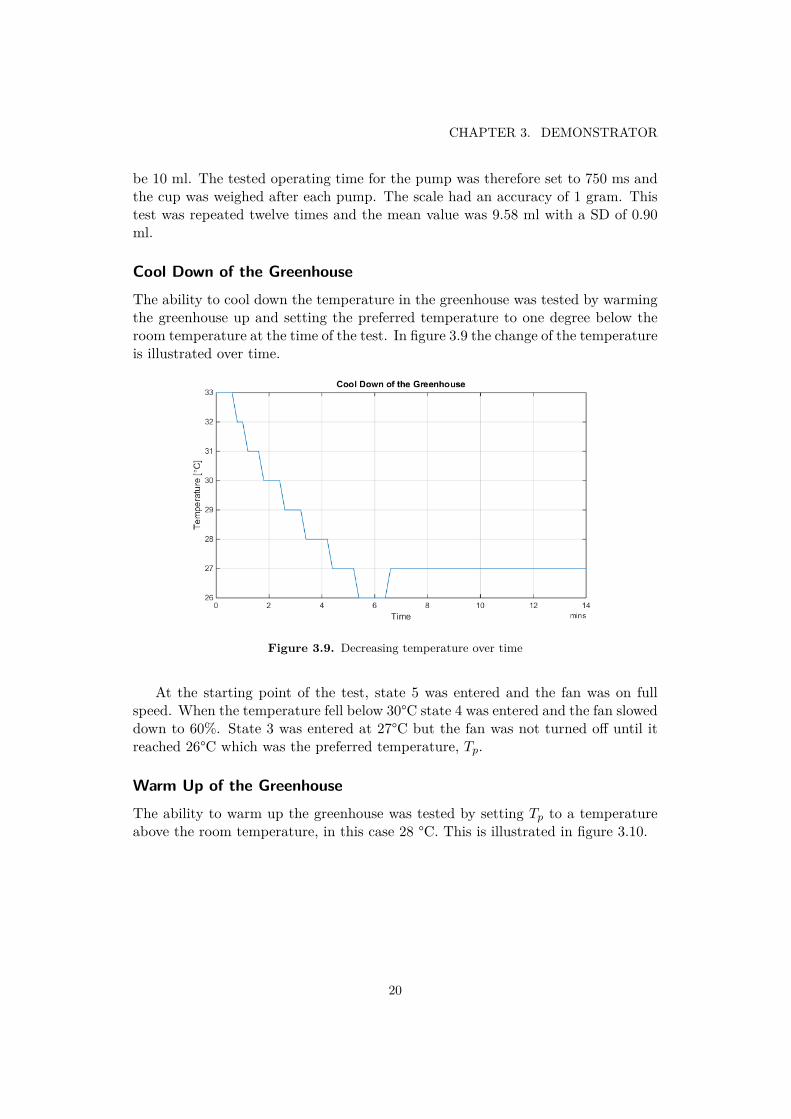
Cool Down of the GreenhouseThe ability to cool down the temperature in the greenhouse was tested by warmingthe greenhouse up and setting the preferred temperature to one degree below theroom temperature at the time of the test. In figure 3.9 the change of the temperatureis illustrated over time.
Figure 3.9. Decreasing temperature over time
At the starting point of the test, state 5 was entered and the fan was on fullspeed. When the temperature fell below 30°C state 4 was entered and the fan sloweddown to 60%. State 3 was entered at 27°C but the fan was not turned off until itreached 26°C which was the preferred temperature, Tp.
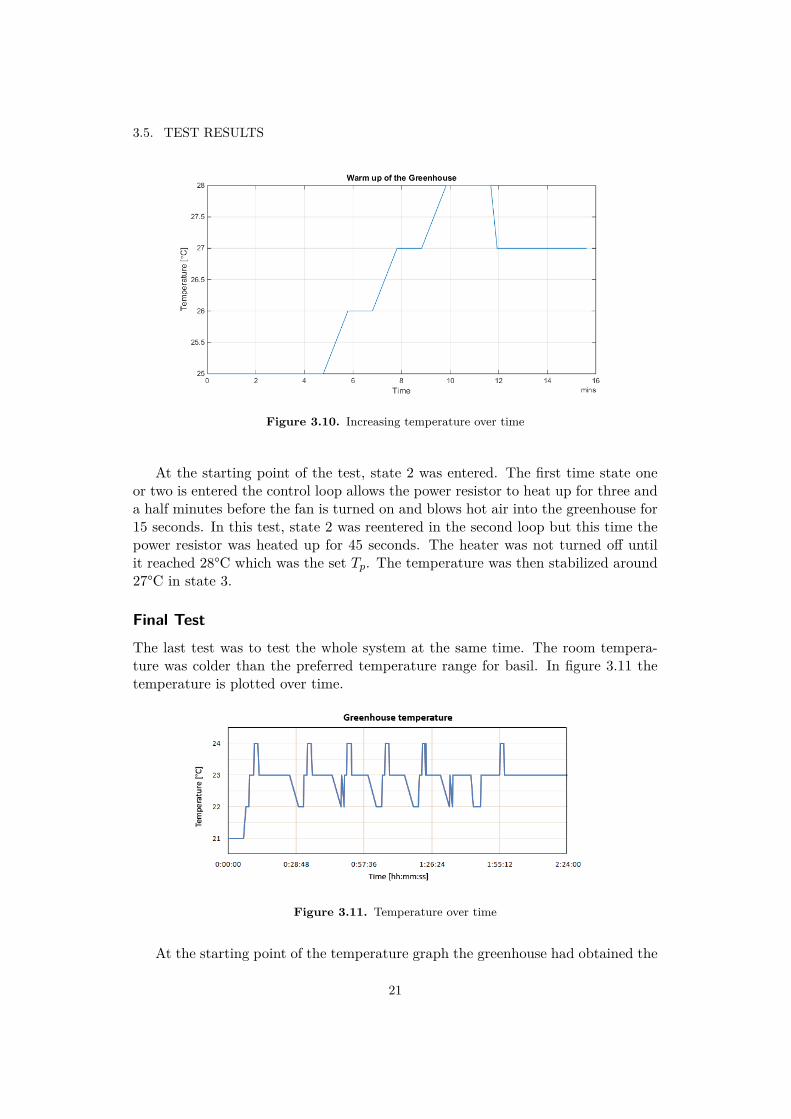
Warm Up of the GreenhouseThe ability to warm up the greenhouse was tested by setting Tp to a temperatureabove the room temperature, in this case 28 °C. This is illustrated in figure 3.10.
20
3.5. TEST RESULTS
Figure 3.10. Increasing temperature over time
At the starting point of the test, state 2 was entered. The first time state oneor two is entered the control loop allows the power resistor to heat up for three anda half minutes before the fan is turned on and blows hot air into the greenhouse for15 seconds. In this test, state 2 was reentered in the second loop but this time thepower resistor was heated up for 45 seconds. The heater was not turned off untilit reached 28°C which was the set Tp. The temperature was then stabilized around27°C in state 3.
Final TestThe last test was to test the whole system at the same time. The room tempera-ture was colder than the preferred temperature range for basil. In figure 3.11 thetemperature is plotted over time.
Figure 3.11. Temperature over time
At the starting point of the temperature graph the greenhouse had obtained the
21

CHAPTER 3. DEMONSTRATOR
room temperature at 21°C. The preferred temperature was 24°C. When the controlloop was operating the temperature varies from 22°C to 24°C.
The watering system was tested by placing a dry basil plant in the greenhouse.This test is similar to the reliability test of the soil moisture sensor but with wateringof a plant. In figure 3.11 the moist values are illustrated over time.
Figure 3.12. Soil moisture values over time
The plant was watered at the beginning of the control loop, which resulted ina decrease in the moisture value. After some time the water spread in the pot andthe basil absorbed some, this resulted in an increase of the value. The data fromthis test was sampled at the same time as the temperature in figure 3.11.
22
Chapter 4
Discussion and conclusions
The results of the tests are discussed in this chapter and conclusions are made aswell.
4.1 Discussion
The discussion is divided between the two different control systems.
Watering System
The assessment of the soil moisture limits have been dependant on the estimationof two people. This does not ensure an accurate estimation and another way offinding the limits should be used instead. Alternatively, using the estimation of ahandful of people to set the limits.
In the result of the soil moisture sensor reliability test, plot in Figure 3.8. Thevoltage has dropped about 0.6 V over the course of about one hour at a fixed pointin the soil. This result is strange since this means that the soil moisture levelincreased. The result makes the sensor seem unreliable. However, the plot seemsfine in Figure 3.12. The sensor gives more reliable values for wet soils than dry.Further tests should be executed in order to gain a proper opinion of the sensorreliability.
Different watering systems can be used and most of these systems will be de-pendant on a soil moisture sensor. However, the soil moisture sensor reads differentvalues depending on its position in the soil. This makes it difficult to find a positionwhere the moisture level represents the state of the entire flower pot. This problemcould possibly be solved by using several sensors instead or changing the way thewater is poured into the soil. In these tests, the water has been poured directlyfrom the opening of the hose. Another way could be to form the hose into a circleplaced on top of the soil. The hose could have holes in it so that the soil is wateredfrom several smaller holes in a circular pattern.
23

CHAPTER 4. DISCUSSION AND CONCLUSIONS
The reliability test of the pump shows good results since the standard deviationis less than 0.9 ml. Figure 3.12 shows that the soil moisture level never reaches avalue below the lower limit. This implies that the pump gives an accurate amountof water.
Temperature Control SystemThe two tests of the temperature control can be considered successful, the tempera-ture decreased when it was too hot at the beginning and increased when it was toocold at the beginning. The scope of this project was limited to room temperaturescolder than the preferred temperature but the test of cooling the greenhouse downcan be useful if the sun has warmed up the greenhouse. On the other hand the testof warming the greenhouse up will be of more importance according to the scope.
In the long run test presented in figure 3.11 it can be seen that the system isstable at 23°C but varies between 22°C and 24°C. This range is within the acceptedtemperature range of basil.
In the problem formulation it is mentioned that a small increase of temperaturecould be seen when the heater is turned off. This has not shown in any of the tests.The reasons to this is most likely that the increment is to small to be discovered bythe sensor since the accuracy is 1°C.
4.2 ConclusionsThe watering system is not fully developed. The pumping part can be seen asreliable since it will pump the same amount of water each time. The sensing of thesoil moisture has to undergo some development to be considered reliable.
The temperature control system is successful. The temperature can be stabilizedin the desired range for an optimal climate for basil.
24

Chapter 5
Recommendations and future work
This chapter presents some recommendations and a couple of examples on how thisproject could be further developed.
5.1 RecommendationsTesting different ways of distributing the water into the flower pot is recommendedto find the most accurate method. Instead of measuring the soil moisture limitswith the sensor another tool could be used to get more exact values. Doing thiscould improve the watering system.
A thermocamera would have been a good tool to have when optimizing thetemperature control system since that would allow an overview of the temperaturedissipation. This would enable a surveillance of the temperature around the powerresistor so that its operating time could be optimized before turning the fan on.
5.2 Future workLight, carbon dioxide and air humidity regulation would have been added to theproject if more time was given. This will make for a good climate control system.Furthermore, most plants have one temperature preference during the day and adifferent one at nighttime. The temperature control system could therefore be fur-ther developed by introducing a third sensor that can sense the amount of daylightthat is present in a room. This would make it possible to change the preferredtemperature range during the course of the day.
25

Bibliography
[AEMC Instruments, 2008] AEMC Instruments (2008). Why Mea-sure Soil Resistivity? Available from: http://www.pema.ie/PDFs/App-Ground-SoilResistivity.pdf [cited 2015-03-07].
[Arcol, 2012] Arcol (2012). HS Aluminium Housed Resistors. Avail-able from: http://www.arcolresistors.com/wp-content/uploads/2014/03/HS-Datasheet6.pdf [cited 2015-05-07].
[Arduino, 2015] Arduino (2015). Available from: http://www.arduino.cc/ [cited2015-03-08].
[D-Robotics UK, 2010] D-Robotics UK (2010). DHT11 Humidity and TemperatureSensor. Available from: http://www.micro4you.com/files/sensor/DHT11.pdf[cited 2015-03-08].
[EHEIM, 2015] EHEIM (2015). Small and powerful, quiet and adjustable. Avail-able from: https://www.eheim.com/en_GB/products/technology/pumps/compact-600#technology [cited 2015-05-06].
[EkoWeb, 2014] EkoWeb (2014). Half-year Report For The Organic Food Marketin Sweden. In Ekogalan, pages 1,4, Stockholm, Sweden.
[Electronics Tutorials, 2014a] Electronics Tutorials (2014a). Electrical Relay.Available from: http://www.electronics-tutorials.ws/io/io_5.html [cited2015-05-11].
[Electronics Tutorials, 2014b] Electronics Tutorials (2014b). Temperature Sensors.Available from: http://www.electronics-tutorials.ws/io/io_3.html [cited2015-05-10].
[European Virtual Institute for Thermal Metrology, 2012] European Virtual Insti-tute for Thermal Metrology (2012). Thermistor. Available from: http://www.evitherm.org/default.asp?lan=1&ID=1000&Menu1=1000 [cited 2015-05-11].
[Giorgos Lazaridis, 2010] Giorgos Lazaridis (2010). How PC Fans Work. Availablefrom: http://pcbheaven.com/wikipages/How_PC_Fans_Work/ [cited 2015-05-06].
27

BIBLIOGRAPHY
[Grundfos, 2009] Grundfos (2009). Cirkulationspump. Available from: http://www.veab.se/docs/Doc218.pdf [cited 2015-05-12].
[Intel Corporation, 2004] Intel Corporation (2004). 4-Wire Pulse Width Modula-tion (PWM) Controlled Fans . Available from: http://www.formfactors.org/developer%5Cspecs%5Crev1_2_public.pdf [cited 2015-05-06].
[ISAAA, 2014] ISAAA (2014). Delayed Ripening Technology. Pocket K, (12):1.
[Johansson, 2013] Johansson, H. (2013). Elektroteknik. Institutionen forMaskinkonstruktion Mekatronik, KTH, 2013 edition.
[MathWorks, 2014] MathWorks (2014). Arduino Support from MATLAB. Avail-able from: http://se.mathworks.com/hardware-support/arduino-matlab.html [cited 2015-05-07].
[National Instruments, 2013] National Instruments (2013). Understanding andChoosing Thermistors. Available from: http://www.ni.com/white-paper/4925/en/ [cited 2015-05-10].
[OMRON Corporation, 2012] OMRON Corporation (2012). Cirkulationspump.Available from: http://www.farnell.com/datasheets/1702858.pdf [cited2015-05-13].
[REOTEMP Instruments, 2011] REOTEMP Instruments (2011). What Is a Ther-mocouple? Available from: http://www.thermocoupleinfo.com/ [cited 2015-05-10].
[Roger Meier, 2015] Roger Meier (2015). Roger Meier’s Freeware. Available from:http://freeware.the-meiers.org [cited 2015-05-13].
[SPC Multicomp, 2008] SPC Multicomp (2008). TIP152. Available from: http://www.farnell.com/datasheets/48233.pdf [cited 2015-05-06].
[Stodola and Volák, 2000] Stodola, J. and Volák, J. (2000). Tidens stora bok omLäkeväxter. Prisma, 2000 edition.
[V. Ryan, 2002] V. Ryan (2002). Transistors. Available from: http://www.technologystudent.com/elec1/transis1.htm [cited 2015-05-06].
[Watlow, 2015] Watlow (2015). Sensor Selection Guides. Available from: http://watlow.com/products/guides/sensor/ [cited 2015-05-10].
28
Appendix A
Draft of Nozzle
The exact measurements of the nozzle are seen in figure A.1. The measurementsare in mm.
DRAWN
CHECKED
UNLESS OTHERWISE SPECIFIEDDIMENSIONS ARE IN MILLIMETERS
ANGLES ±X.X°2 PL ±X.XX 3 PL ±X.XXX
NAME
D. Attalla
DATE
2015-05-07 KTHTITLE
NozzleSIZEA4
DWG NO1
REV1
FILE NAME: nozzle
SCALE: 3:1 SHEET 1 OF 1
J. Tannfelt Wu 2015-05-07
31,36
7°
13,4
17,4
1,7
1
712
29,97
12
Figure A.1. Draft of Nozzle
29

TRITA MMK 2015:22 MDAB075
www.kth.se


![Monitor and Control of Greenhouse Environment [Automated Green House] Final Documentation](https://img.pdfslide.us/doc/110x75/55720e84497959fc0b8c7a5b/monitor-and-control-of-greenhouse-environment-automated-green-house-final-documentation.jpg)