Embed Size (px)
Citation preview
J Med SystDOI 10.1007/s10916-011-9802-2
ORIGINAL PAPER
Automated Detection of Dark and Bright Lesionsin Retinal Images for Early Detection of DiabeticRetinopathy
Usman M. Akram · Shoab A. Khan
Received: 1 August 2011 / Accepted: 25 October 2011© Springer Science+Business Media, LLC 2011
Abstract There is an ever-increasing interest in thedevelopment of automatic medical diagnosis systemsdue to the advancement in computing technology andalso to improve the service by medical community.The knowledge about health and disease is requiredfor reliable and accurate medical diagnosis. DiabeticRetinopathy (DR) is one of the most common causesof blindness and it can be prevented if detected andtreated early. DR has different signs and the mostdistinctive are microaneurysm and haemorrhage whichare dark lesions and hard exudates and cotton woolspots which are bright lesions. Location and structureof blood vessels and optic disk play important role inaccurate detection and classification of dark and brightlesions for early detection of DR. In this article, we pro-pose a computer aided system for the early detection ofDR. The article presents algorithms for retinal imagepreprocessing, blood vessel enhancement and segmen-tation and optic disk localization and detection whicheventually lead to detection of different DR lesionsusing proposed hybrid fuzzy classifier. The developedmethods are tested on four different publicly availabledatabases. The presented methods are compared withrecently published methods and the results show thatpresented methods outperform all others.
U. M. Akram (B) · S. A. KhanDepartment of Computer Engineering,College of Electrical & Mechanical Engineering,National University of Sciences and Technology,Rawalpindi, Pakistane-mail: [email protected]
S. A. Khane-mail: [email protected]
Keywords Diabetic retinopathy · Preprocessing ·Blood vessels · Optic disk · Dark lesions ·Bright lesions
Introduction
Diabetes is a disease that occurs when the pancreasdoes not secrete enough insulin or the body is unableto process it properly [1]. Insulin is the hormone thatregulates the level of sugar (glucose) in the blood.Diabetes can affect children and adults. Patients withdiabetes are more likely to develop eye problems suchas cataracts and glaucoma, but the disease’s affect onthe retina is the main threat to vision [2]. Most patientsdevelop diabetic changes in the retina after approxi-mately 20 years. The effect of diabetes on the eye iscalled DR [1].
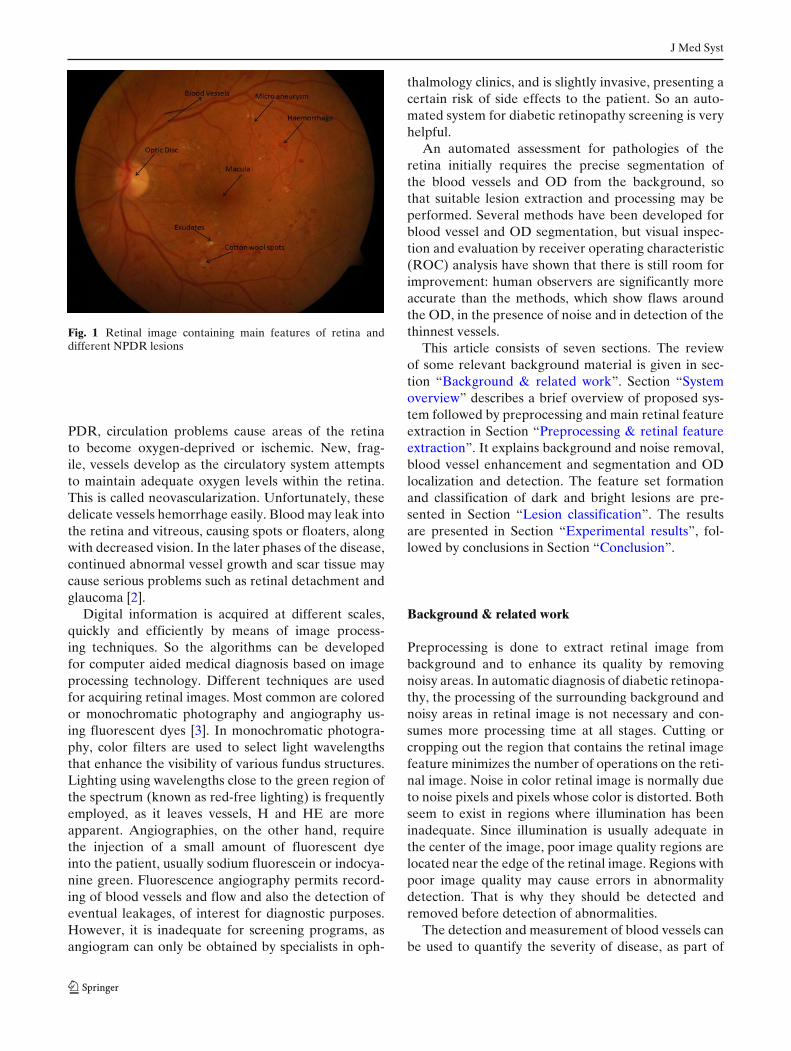
Main features of retina are blood vessels, OpticDisc (OD) and macula (Fig. 1). Diabetes affects theblood vessels of the retina as time pases. Two mainclasses of DR are Non Proliferative Diabetic Retinopa-thy (NPDR) and Proliferative Diabetic Retinopathy(PDR) [1]. NPDR is the earliest phase of DR andalso known as background diabetic retinopathy. In thisphase, the blood vessels in the retina become weakenedand leak, forming small, dot-like microaneurysm (MA)and hemorrhages (H) (Fig. 1). These leaking vesselsoften lead to swelling or edema in the retina and de-creased vision. If the leakage contains fats and proteinsalong with water they cause yellow spots known as hardexudates (HE). In addition to this, small and thin bloodvessel may close off causing some patches of retina de-prived of blood supply. These small fluffy white patchesin retina are called cotton wool spots (CWS) [1]. In
J Med Syst
Fig. 1 Retinal image containing main features of retina anddifferent NPDR lesions
PDR, circulation problems cause areas of the retinato become oxygen-deprived or ischemic. New, frag-ile, vessels develop as the circulatory system attemptsto maintain adequate oxygen levels within the retina.This is called neovascularization. Unfortunately, thesedelicate vessels hemorrhage easily. Blood may leak intothe retina and vitreous, causing spots or floaters, alongwith decreased vision. In the later phases of the disease,continued abnormal vessel growth and scar tissue maycause serious problems such as retinal detachment andglaucoma [2].
Digital information is acquired at different scales,quickly and efficiently by means of image process-ing techniques. So the algorithms can be developedfor computer aided medical diagnosis based on imageprocessing technology. Different techniques are usedfor acquiring retinal images. Most common are coloredor monochromatic photography and angiography us-ing fluorescent dyes [3]. In monochromatic photogra-phy, color filters are used to select light wavelengthsthat enhance the visibility of various fundus structures.Lighting using wavelengths close to the green region ofthe spectrum (known as red-free lighting) is frequentlyemployed, as it leaves vessels, H and HE are moreapparent. Angiographies, on the other hand, requirethe injection of a small amount of fluorescent dyeinto the patient, usually sodium fluorescein or indocya-nine green. Fluorescence angiography permits record-ing of blood vessels and flow and also the detection ofeventual leakages, of interest for diagnostic purposes.However, it is inadequate for screening programs, asangiogram can only be obtained by specialists in oph-
thalmology clinics, and is slightly invasive, presenting acertain risk of side effects to the patient. So an auto-mated system for diabetic retinopathy screening is veryhelpful.
An automated assessment for pathologies of theretina initially requires the precise segmentation ofthe blood vessels and OD from the background, sothat suitable lesion extraction and processing may beperformed. Several methods have been developed forblood vessel and OD segmentation, but visual inspec-tion and evaluation by receiver operating characteristic(ROC) analysis have shown that there is still room forimprovement: human observers are significantly moreaccurate than the methods, which show flaws aroundthe OD, in the presence of noise and in detection of thethinnest vessels.
This article consists of seven sections. The reviewof some relevant background material is given in sec-tion “Background & related work”. Section “Systemoverview” describes a brief overview of proposed sys-tem followed by preprocessing and main retinal featureextraction in Section “Preprocessing & retinal featureextraction”. It explains background and noise removal,blood vessel enhancement and segmentation and ODlocalization and detection. The feature set formationand classification of dark and bright lesions are pre-sented in Section “Lesion classification”. The resultsare presented in Section “Experimental results”, fol-lowed by conclusions in Section “Conclusion”.
Background & related work
Preprocessing is done to extract retinal image frombackground and to enhance its quality by removingnoisy areas. In automatic diagnosis of diabetic retinopa-thy, the processing of the surrounding background andnoisy areas in retinal image is not necessary and con-sumes more processing time at all stages. Cutting orcropping out the region that contains the retinal imagefeature minimizes the number of operations on the reti-nal image. Noise in color retinal image is normally dueto noise pixels and pixels whose color is distorted. Bothseem to exist in regions where illumination has beeninadequate. Since illumination is usually adequate inthe center of the image, poor image quality regions arelocated near the edge of the retinal image. Regions withpoor image quality may cause errors in abnormalitydetection. That is why they should be detected andremoved before detection of abnormalities.
The detection and measurement of blood vessels canbe used to quantify the severity of disease, as part of
J Med Syst
the process of automated diagnosis of disease or in theassessment of the progression of therapy [18]. Retinalblood vessels have been shown to have measurablechanges in diameter, branching angles, length or tortu-osity, as a result of a disease. Thus a reliable methodof vessel segmentation would be valuable for the earlydetection and characterization of changes due to suchdiseases [18]. Retinal vascular pattern facilitates thephysicians for the purpose of diagnosing eye diseases,patient screening, and clinical study [12]. Inspectionof blood vessels provides the information regardingpathological changes caused by ocular diseases includ-ing diabetes, hypertension, stroke and arteriosclerosis[16]. The hand mapping of retinal vasculature is atime consuming pro- cess that entails training and skill.Automated segmentation provides consistency and re-duces the time required by a physician or a skilledtechnician for manual labeling [11]. Retinal vascularpattern is used for automatic generation of retinal mapsfor the treatment of age-related macular degeneration[9], extraction of characteristic points of the retinalvasculature for temporal or multimodal image registra-tion [19], retinal image mosaic synthesis, identificationof the optic disc position [20], and localization of thefovea [21]. The challenges faced in automated vesseldetection include wide range of vessel widths, lowcontrast with respect with background and appearanceof variety of structures in the image including the op-tic disc, the retinal boundary and other pathologies[22].
Various systems for automated classification of DRhave been reported and most of them have givenimportance to preprocessing, blood vessel and ODsegmentation. Standard contrast stretching techniqueshave been applied by [4] for preprocessing and noisereduction. The images are enhanced by the computersystem using color intensity histograms. In [5–7] lo-cal and adaptive contrast enhancement methods areused for equalizing uneven illumination in the intensitychannel of retinal images as a preprocessing step. Bloodvessels are important for detection of different lesionsuch as microaneurysm, haemorrhage and neovascular-ization. Zhou et al. [8] proposed an algorithm whichrelied on a matched filtering approach coupled witha priori knowledge about retinal vessel properties toautomatically detect the vessel boundaries, track themidline of the vessel, and extract useful parametersof clinical interest. A supervised classification basedblood vessel segmentation technique was presentedby Soares et al. [9]. A simple morphological openingand OTSU’s thresholding based method was used byNayak et al. [10]. In [11] ridge detection was used toform line elements and partition the image into patches
belonging to each line element. Pixel features were thengenerated based on this representation to detect bloodvessels. Chuadhuri et al. [12] proposed a techniqueusing matched filters to emphasize blood vessels. Anoperator for feature extraction based on the opticaland spatial properties of objects to be recognized wasintroduced. The optic disk generally appears as a brightcircular or elliptic region on fundus image and it helpsin detection of bright lesions. Any change in the shape,color, or depth of the optic disk is an indicator ofvarious ophthalmic pathologies. Ahmed et al. [13] pro-posed a marker controlled watershed transform basedtechnique for OD segmentation. In [14], an approxi-mate location of the OD is estimated where the locationof the OD is hypothesized by searching for regionsof high intensity, diversity of gradient directions, andconvergence of blood vessels. Sinthanayothin [15] lo-cated the position of the OD by finding the region withthe highest local variation in the intensity. Hoover [16]utilized the geometric relationship between the OD andmain blood vessels to identify the disc location. Hedescribed a method based on a fuzzy voting mechanismto find the OD location.
In this article, we propose a computer aided systemfor detection of DR. Main focus is on reliable seg-mentation of blood vessels and OD which will help inaccurate classification of dark and bright lesions. Algo-rithms are tested and compared with already publishedtechniques using four publicly available retinal imagedatabases.
System overview
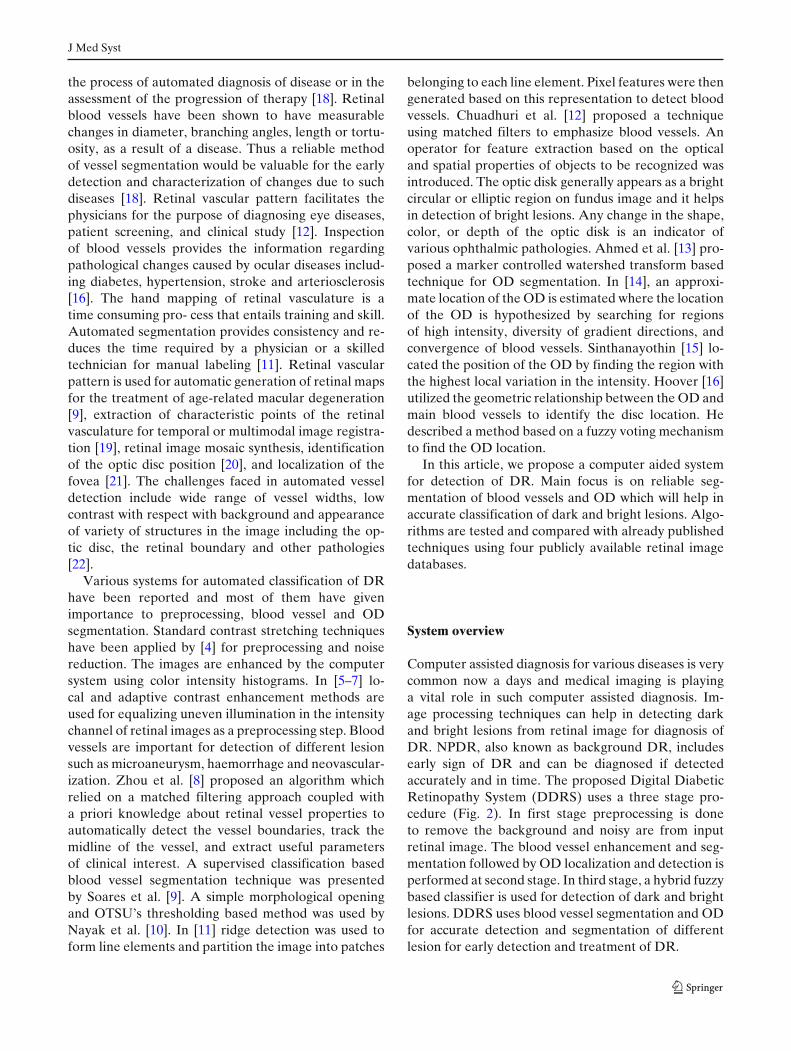
Computer assisted diagnosis for various diseases is verycommon now a days and medical imaging is playinga vital role in such computer assisted diagnosis. Im-age processing techniques can help in detecting darkand bright lesions from retinal image for diagnosis ofDR. NPDR, also known as background DR, includesearly sign of DR and can be diagnosed if detectedaccurately and in time. The proposed Digital DiabeticRetinopathy System (DDRS) uses a three stage pro-cedure (Fig. 2). In first stage preprocessing is doneto remove the background and noisy are from inputretinal image. The blood vessel enhancement and seg-mentation followed by OD localization and detection isperformed at second stage. In third stage, a hybrid fuzzybased classifier is used for detection of dark and brightlesions. DDRS uses blood vessel segmentation and ODfor accurate detection and segmentation of differentlesion for early detection and treatment of DR.
J Med Syst
Fig. 2 Complete flow graph for proposed DDRS
Preprocessing & retinal feature extraction
Preprocessing
In preprocessing, We create binary masks for back-ground and noisy areas. A mask is actually a combina-tion of 1’s and 0’s, 1 is for true retinal image pixels and0 is for background or noisy pixels. Background maskseparates the original retinal image area from darkbackground and noise mask removes the noisy areafrom retinal image. Both masks are then combined andmorphological operations are done on that combinedmask to create the final mask. A color retinal imageconsists of a (semi) circular region of interest on a darkbackground. This dark background is initially neverreally black. It is important to distinguish betweenbackground and foreground, because feature extrac-tion and abnormality detection algorithms only needto consider the foreground pixels. So it is necessaryto remove the foreground from background. We haveused local gradient mean and variance based methodfor background preprocessing [17]. It creates a binarybackground segmentation mask. In our technique, wecreate a binary noise mask which includes the noisyarea and it is applied on retinal image to ensure notto process the noisy area in upcoming steps i.e. featureextraction and abnormality detection. In this technique,we convert RGB (Red, Green, and Blue) retinal image
into HSI (Hue, Saturation, and Intensity) color spacebecause firstly it is closer to the way a human experi-ences colors and secondly noise can be easily removedin HSI color space [24].
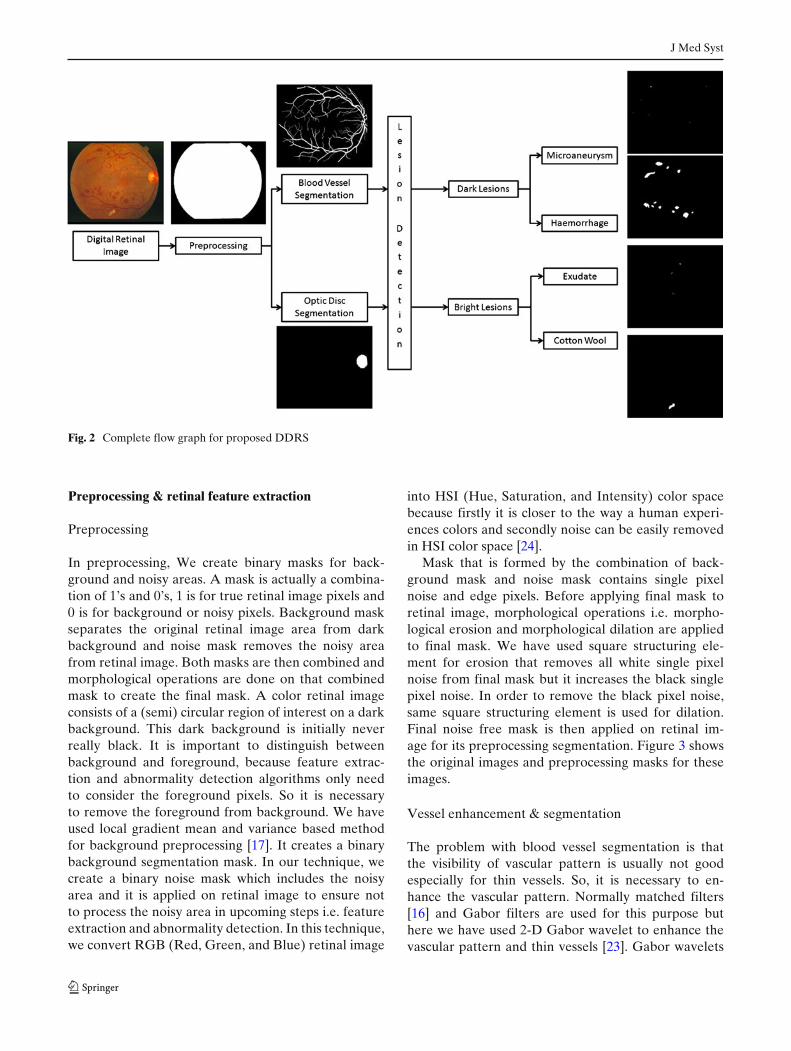
Mask that is formed by the combination of back-ground mask and noise mask contains single pixelnoise and edge pixels. Before applying final mask toretinal image, morphological operations i.e. morpho-logical erosion and morphological dilation are appliedto final mask. We have used square structuring ele-ment for erosion that removes all white single pixelnoise from final mask but it increases the black singlepixel noise. In order to remove the black pixel noise,same square structuring element is used for dilation.Final noise free mask is then applied on retinal im-age for its preprocessing segmentation. Figure 3 showsthe original images and preprocessing masks for theseimages.
Vessel enhancement & segmentation
The problem with blood vessel segmentation is thatthe visibility of vascular pattern is usually not goodespecially for thin vessels. So, it is necessary to en-hance the vascular pattern. Normally matched filters[16] and Gabor filters are used for this purpose buthere we have used 2-D Gabor wavelet to enhance thevascular pattern and thin vessels [23]. Gabor wavelets
J Med Syst
Fig. 3 Preprocessing:row 1 original retinal images,row 2 preprocessing mask toremove background andnoise from original image
have directional selectiveness capability. They act aslow level oriented edge discriminators and also filterout the background noise of the image. Since vesselshave directional pattern so 2-D Gabor wavelet is bestoption due to its directional selectiveness capability ofdetecting oriented features and fine tuning to specificfrequencies [23]. The 2-D Gabor wavelet which wehave used is defined as
ψG(x) = exp( jk0x) exp(
−12|Ax|2
)(1)
ψ̂G(x) = (detB)1/2 exp(
−12(B(k − k0)
2)
)(2)
where k0 ∈ R2 is a vector that defines the frequency of
the complex exponential, B = A−1 and A =[
ε−1/2 00 1
]
with elongation ε ≥ 1 is a 2 × 2 positive definite diag-onal matrix which defines the wavelet anisotropy andelongation of filter in any desired direction. For eachpixel position and considered scale value, the Gaborwavelet transform Mψ(b, a) is computed for θ spanningfrom 0◦ up to 165◦ at steps of 15◦ and the maximum istaken.
Wavelet based enhanced image has larger valueswhere vessels are wide and prominent whereas lowin case of thin vessels and edge pixels. So it is verydifficult to find one optimal threshold value for accu-rate blood vessel segmentation without any supervisedalgorithm. In our multilayered thresholding technique,we apply different thresholds values iteratively andkeep track of vessels in successive layers. At the startof segmentation, initial threshold value T is selected
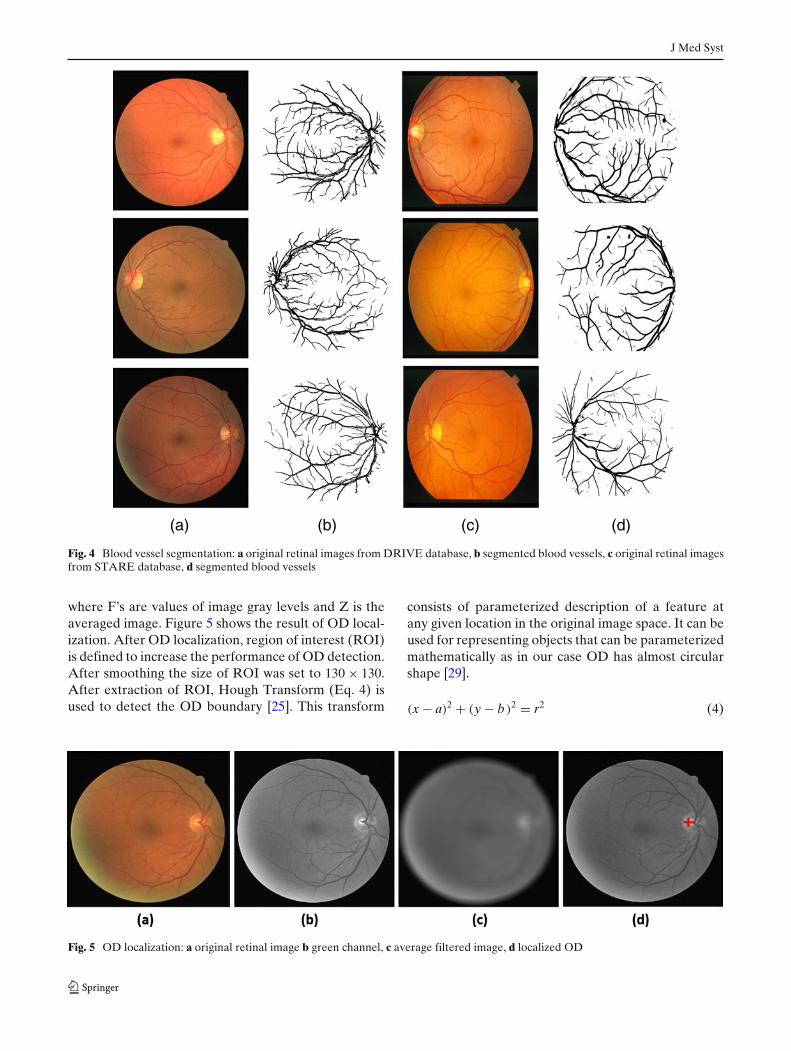
using histogram of wavelet image such that it onlykeeps those pixels in initial segmented image for whichwavelet response is higher than T. The segmented im-age is then skeletonized using thinning morphologicaloperator given in [24] as a result of which all vesselsare now only one pixel wide. Vessels edges are thencomputed and filtered to eliminate all false edges. Thenwe lower the threshold iteratively and in each itera-tion keep all those vessels which are connected to thevessels segmented in previous iteration and stop theprocedure when there is not any significant changein vessels during two consecutive iterations. Figure 4shows the segmented blood vessels for different imagesfrom DRIVE and STARE databases.
Optic disc (OD) localization & detection
The OD generally appears as a bright circular or ellipticregion on fundus image. The OD acts as a landmarkand reference for extraction of other features, such asfovea. Its location helps to locate the fovea and itsexclusion is essential in achieving robust bright lesiondetection. We present a method for OD localizationand segmentation. In OD localization, first originalretinal image is preprocessed by averaging mask of size31 × 31 (Eq. 3) in order to remove the background andlesions artifacts which can cause false localization andthen maximum gray values from image histogram isdetected because the gray values of OD are higher thanthe background values.
Z = 1961
961∑i=1
Fi (3)
J Med Syst
(a) (b) (c) (d)
Fig. 4 Blood vessel segmentation: a original retinal images from DRIVE database, b segmented blood vessels, c original retinal imagesfrom STARE database, d segmented blood vessels
where F’s are values of image gray levels and Z is theaveraged image. Figure 5 shows the result of OD local-ization. After OD localization, region of interest (ROI)is defined to increase the performance of OD detection.After smoothing the size of ROI was set to 130 × 130.After extraction of ROI, Hough Transform (Eq. 4) isused to detect the OD boundary [25]. This transform
consists of parameterized description of a feature atany given location in the original image space. It can beused for representing objects that can be parameterizedmathematically as in our case OD has almost circularshape [29].
(x − a)2 + (y − b)2 = r2 (4)
Fig. 5 OD localization: a original retinal image b green channel, c average filtered image, d localized OD
J Med Syst
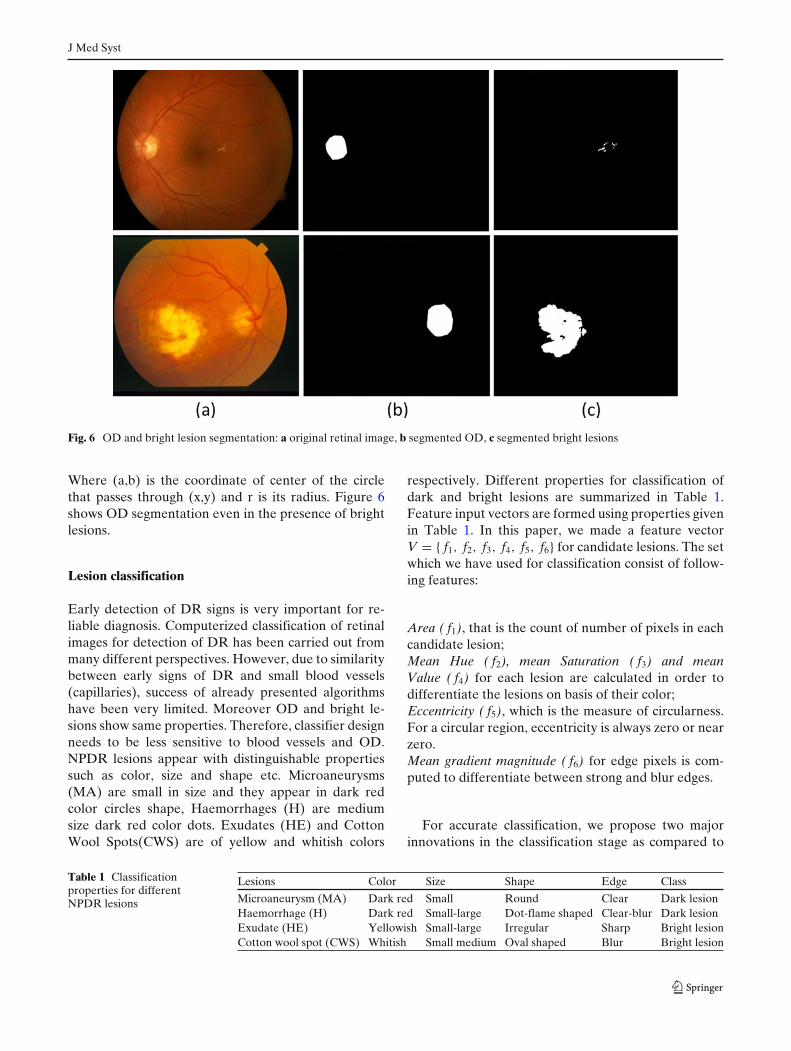
Fig. 6 OD and bright lesion segmentation: a original retinal image, b segmented OD, c segmented bright lesions
Where (a,b) is the coordinate of center of the circlethat passes through (x,y) and r is its radius. Figure 6shows OD segmentation even in the presence of brightlesions.
Lesion classification
Early detection of DR signs is very important for re-liable diagnosis. Computerized classification of retinalimages for detection of DR has been carried out frommany different perspectives. However, due to similaritybetween early signs of DR and small blood vessels(capillaries), success of already presented algorithmshave been very limited. Moreover OD and bright le-sions show same properties. Therefore, classifier designneeds to be less sensitive to blood vessels and OD.NPDR lesions appear with distinguishable propertiessuch as color, size and shape etc. Microaneurysms(MA) are small in size and they appear in dark redcolor circles shape, Haemorrhages (H) are mediumsize dark red color dots. Exudates (HE) and CottonWool Spots(CWS) are of yellow and whitish colors
respectively. Different properties for classification ofdark and bright lesions are summarized in Table 1.Feature input vectors are formed using properties givenin Table 1. In this paper, we made a feature vectorV = { f1, f2, f3, f4, f5, f6} for candidate lesions. The setwhich we have used for classification consist of follow-ing features:
Area ( f1), that is the count of number of pixels in eachcandidate lesion;Mean Hue ( f2), mean Saturation ( f3) and meanValue ( f4) for each lesion are calculated in order todifferentiate the lesions on basis of their color;Eccentricity ( f5), which is the measure of circularness.For a circular region, eccentricity is always zero or nearzero.Mean gradient magnitude ( f6) for edge pixels is com-puted to differentiate between strong and blur edges.
For accurate classification, we propose two majorinnovations in the classification stage as compared to
Table 1 Classificationproperties for differentNPDR lesions
Lesions Color Size Shape Edge Class
Microaneurysm (MA) Dark red Small Round Clear Dark lesionHaemorrhage (H) Dark red Small-large Dot-flame shaped Clear-blur Dark lesionExudate (HE) Yellowish Small-large Irregular Sharp Bright lesionCotton wool spot (CWS) Whitish Small medium Oval shaped Blur Bright lesion
J Med Syst
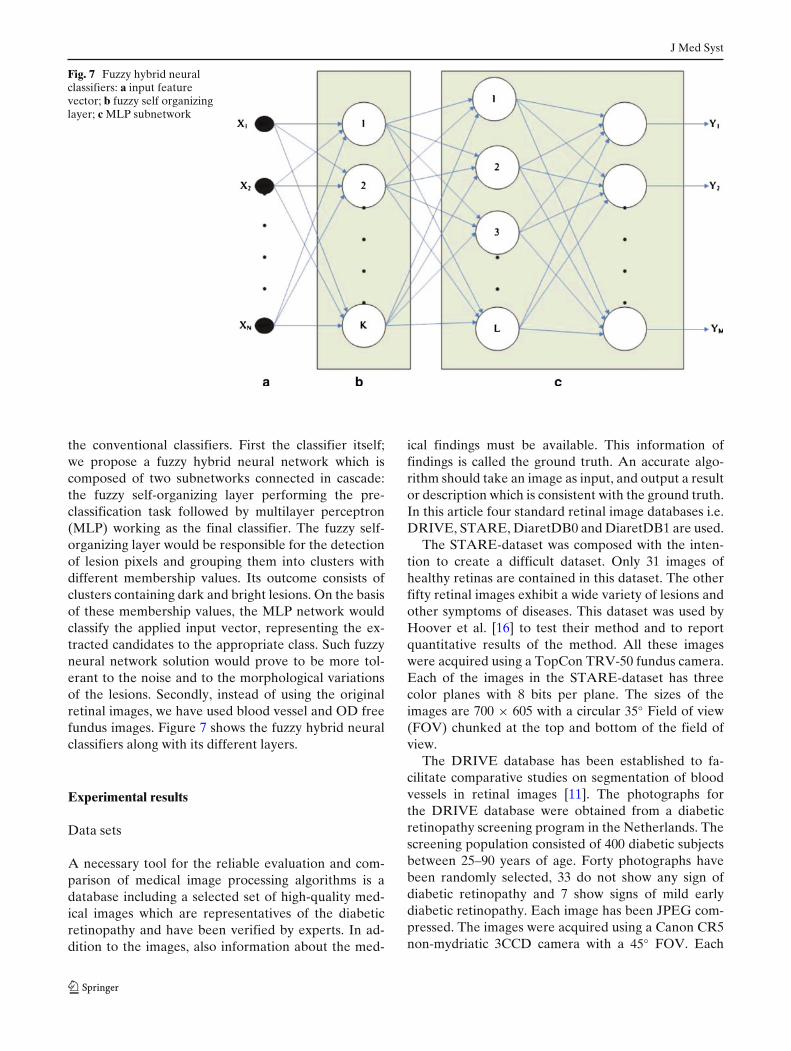
Fig. 7 Fuzzy hybrid neuralclassifiers: a input featurevector; b fuzzy self organizinglayer; c MLP subnetwork
the conventional classifiers. First the classifier itself;we propose a fuzzy hybrid neural network which iscomposed of two subnetworks connected in cascade:the fuzzy self-organizing layer performing the pre-classification task followed by multilayer perceptron(MLP) working as the final classifier. The fuzzy self-organizing layer would be responsible for the detectionof lesion pixels and grouping them into clusters withdifferent membership values. Its outcome consists ofclusters containing dark and bright lesions. On the basisof these membership values, the MLP network wouldclassify the applied input vector, representing the ex-tracted candidates to the appropriate class. Such fuzzyneural network solution would prove to be more tol-erant to the noise and to the morphological variationsof the lesions. Secondly, instead of using the originalretinal images, we have used blood vessel and OD freefundus images. Figure 7 shows the fuzzy hybrid neuralclassifiers along with its different layers.
Experimental results
Data sets
A necessary tool for the reliable evaluation and com-parison of medical image processing algorithms is adatabase including a selected set of high-quality med-ical images which are representatives of the diabeticretinopathy and have been verified by experts. In ad-dition to the images, also information about the med-
ical findings must be available. This information offindings is called the ground truth. An accurate algo-rithm should take an image as input, and output a resultor description which is consistent with the ground truth.In this article four standard retinal image databases i.e.DRIVE, STARE, DiaretDB0 and DiaretDB1 are used.
The STARE-dataset was composed with the inten-tion to create a difficult dataset. Only 31 images ofhealthy retinas are contained in this dataset. The otherfifty retinal images exhibit a wide variety of lesions andother symptoms of diseases. This dataset was used byHoover et al. [16] to test their method and to reportquantitative results of the method. All these imageswere acquired using a TopCon TRV-50 fundus camera.Each of the images in the STARE-dataset has threecolor planes with 8 bits per plane. The sizes of theimages are 700 × 605 with a circular 35◦ Field of view(FOV) chunked at the top and bottom of the field ofview.
The DRIVE database has been established to fa-cilitate comparative studies on segmentation of bloodvessels in retinal images [11]. The photographs forthe DRIVE database were obtained from a diabeticretinopathy screening program in the Netherlands. Thescreening population consisted of 400 diabetic subjectsbetween 25–90 years of age. Forty photographs havebeen randomly selected, 33 do not show any sign ofdiabetic retinopathy and 7 show signs of mild earlydiabetic retinopathy. Each image has been JPEG com-pressed. The images were acquired using a Canon CR5non-mydriatic 3CCD camera with a 45◦ FOV. Each
J Med Syst
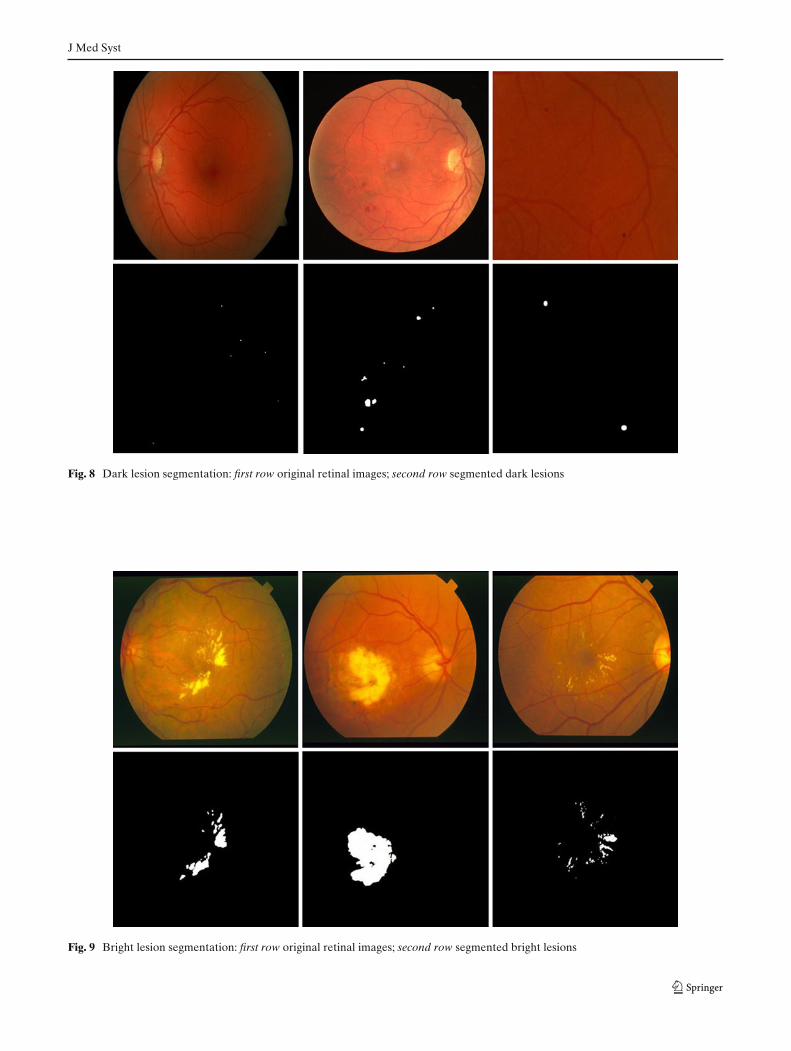
Fig. 8 Dark lesion segmentation: first row original retinal images; second row segmented dark lesions
Fig. 9 Bright lesion segmentation: first row original retinal images; second row segmented bright lesions
J Med Syst
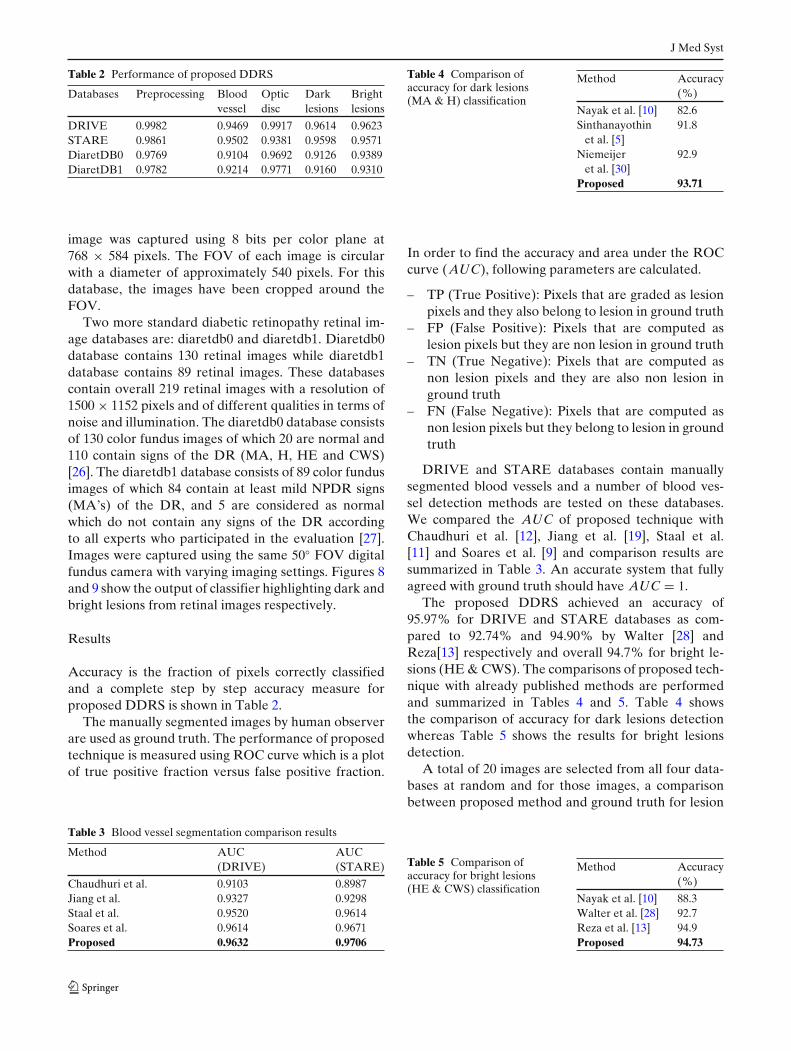
Table 2 Performance of proposed DDRS
Databases Preprocessing Blood Optic Dark Brightvessel disc lesions lesions
DRIVE 0.9982 0.9469 0.9917 0.9614 0.9623STARE 0.9861 0.9502 0.9381 0.9598 0.9571DiaretDB0 0.9769 0.9104 0.9692 0.9126 0.9389DiaretDB1 0.9782 0.9214 0.9771 0.9160 0.9310
image was captured using 8 bits per color plane at768 × 584 pixels. The FOV of each image is circularwith a diameter of approximately 540 pixels. For thisdatabase, the images have been cropped around theFOV.
Two more standard diabetic retinopathy retinal im-age databases are: diaretdb0 and diaretdb1. Diaretdb0database contains 130 retinal images while diaretdb1database contains 89 retinal images. These databasescontain overall 219 retinal images with a resolution of1500 × 1152 pixels and of different qualities in terms ofnoise and illumination. The diaretdb0 database consistsof 130 color fundus images of which 20 are normal and110 contain signs of the DR (MA, H, HE and CWS)[26]. The diaretdb1 database consists of 89 color fundusimages of which 84 contain at least mild NPDR signs(MA’s) of the DR, and 5 are considered as normalwhich do not contain any signs of the DR accordingto all experts who participated in the evaluation [27].Images were captured using the same 50◦ FOV digitalfundus camera with varying imaging settings. Figures 8and 9 show the output of classifier highlighting dark andbright lesions from retinal images respectively.
Results
Accuracy is the fraction of pixels correctly classifiedand a complete step by step accuracy measure forproposed DDRS is shown in Table 2.
The manually segmented images by human observerare used as ground truth. The performance of proposedtechnique is measured using ROC curve which is a plotof true positive fraction versus false positive fraction.
Table 3 Blood vessel segmentation comparison results
Method AUC AUC(DRIVE) (STARE)
Chaudhuri et al. 0.9103 0.8987Jiang et al. 0.9327 0.9298Staal et al. 0.9520 0.9614Soares et al. 0.9614 0.9671Proposed 0.9632 0.9706
Table 4 Comparison ofaccuracy for dark lesions(MA & H) classification
Method Accuracy(%)
Nayak et al. [10] 82.6Sinthanayothin 91.8
et al. [5]Niemeijer 92.9
et al. [30]Proposed 93.71
In order to find the accuracy and area under the ROCcurve (AUC), following parameters are calculated.
– TP (True Positive): Pixels that are graded as lesionpixels and they also belong to lesion in ground truth
– FP (False Positive): Pixels that are computed aslesion pixels but they are non lesion in ground truth
– TN (True Negative): Pixels that are computed asnon lesion pixels and they are also non lesion inground truth
– FN (False Negative): Pixels that are computed asnon lesion pixels but they belong to lesion in groundtruth
DRIVE and STARE databases contain manuallysegmented blood vessels and a number of blood ves-sel detection methods are tested on these databases.We compared the AUC of proposed technique withChaudhuri et al. [12], Jiang et al. [19], Staal et al.[11] and Soares et al. [9] and comparison results aresummarized in Table 3. An accurate system that fullyagreed with ground truth should have AUC = 1.
The proposed DDRS achieved an accuracy of95.97% for DRIVE and STARE databases as com-pared to 92.74% and 94.90% by Walter [28] andReza[13] respectively and overall 94.7% for bright le-sions (HE & CWS). The comparisons of proposed tech-nique with already published methods are performedand summarized in Tables 4 and 5. Table 4 showsthe comparison of accuracy for dark lesions detectionwhereas Table 5 shows the results for bright lesionsdetection.
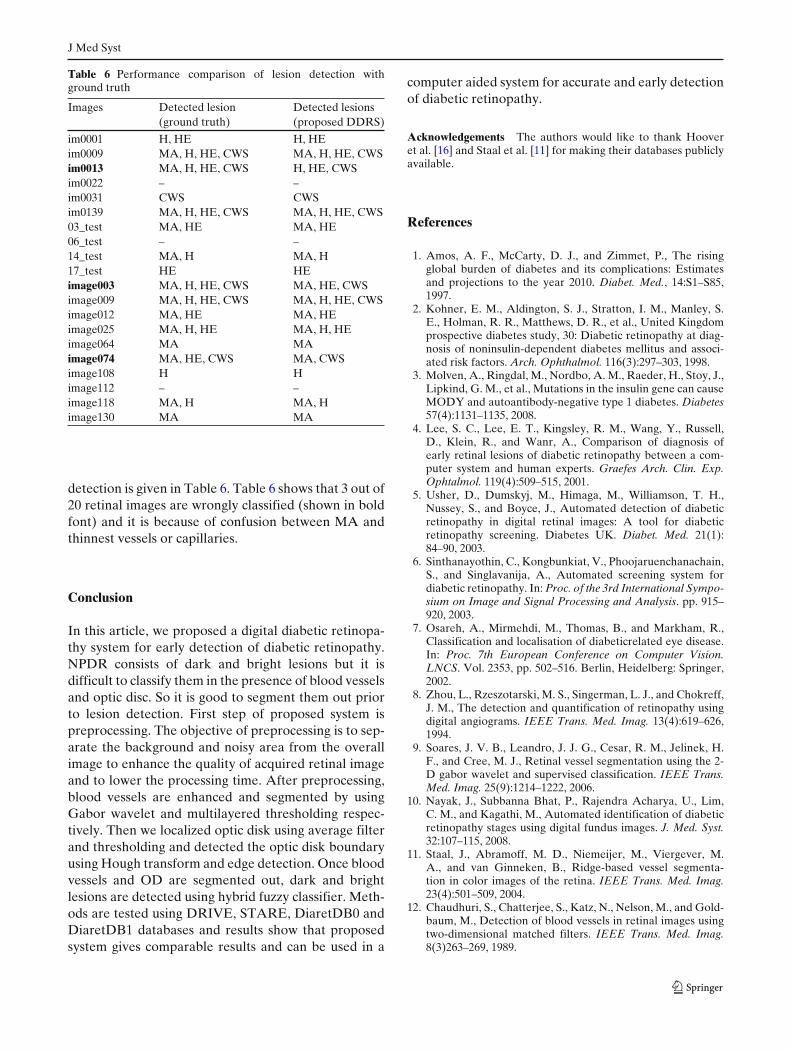
A total of 20 images are selected from all four data-bases at random and for those images, a comparisonbetween proposed method and ground truth for lesion
Table 5 Comparison ofaccuracy for bright lesions(HE & CWS) classification
Method Accuracy(%)
Nayak et al. [10] 88.3Walter et al. [28] 92.7Reza et al. [13] 94.9Proposed 94.73
J Med Syst
Table 6 Performance comparison of lesion detection withground truth
Images Detected lesion Detected lesions(ground truth) (proposed DDRS)
im0001 H, HE H, HEim0009 MA, H, HE, CWS MA, H, HE, CWSim0013 MA, H, HE, CWS H, HE, CWSim0022 – –im0031 CWS CWSim0139 MA, H, HE, CWS MA, H, HE, CWS03_test MA, HE MA, HE06_test – –14_test MA, H MA, H17_test HE HEimage003 MA, H, HE, CWS MA, HE, CWSimage009 MA, H, HE, CWS MA, H, HE, CWSimage012 MA, HE MA, HEimage025 MA, H, HE MA, H, HEimage064 MA MAimage074 MA, HE, CWS MA, CWSimage108 H Himage112 – –image118 MA, H MA, Himage130 MA MA
detection is given in Table 6. Table 6 shows that 3 out of20 retinal images are wrongly classified (shown in boldfont) and it is because of confusion between MA andthinnest vessels or capillaries.
Conclusion
In this article, we proposed a digital diabetic retinopa-thy system for early detection of diabetic retinopathy.NPDR consists of dark and bright lesions but it isdifficult to classify them in the presence of blood vesselsand optic disc. So it is good to segment them out priorto lesion detection. First step of proposed system ispreprocessing. The objective of preprocessing is to sep-arate the background and noisy area from the overallimage to enhance the quality of acquired retinal imageand to lower the processing time. After preprocessing,blood vessels are enhanced and segmented by usingGabor wavelet and multilayered thresholding respec-tively. Then we localized optic disk using average filterand thresholding and detected the optic disk boundaryusing Hough transform and edge detection. Once bloodvessels and OD are segmented out, dark and brightlesions are detected using hybrid fuzzy classifier. Meth-ods are tested using DRIVE, STARE, DiaretDB0 andDiaretDB1 databases and results show that proposedsystem gives comparable results and can be used in a
computer aided system for accurate and early detectionof diabetic retinopathy.
Acknowledgements The authors would like to thank Hooveret al. [16] and Staal et al. [11] for making their databases publiclyavailable.
References
1. Amos, A. F., McCarty, D. J., and Zimmet, P., The risingglobal burden of diabetes and its complications: Estimatesand projections to the year 2010. Diabet. Med., 14:S1–S85,1997.
2. Kohner, E. M., Aldington, S. J., Stratton, I. M., Manley, S.E., Holman, R. R., Matthews, D. R., et al., United Kingdomprospective diabetes study, 30: Diabetic retinopathy at diag-nosis of noninsulin-dependent diabetes mellitus and associ-ated risk factors. Arch. Ophthalmol. 116(3):297–303, 1998.
3. Molven, A., Ringdal, M., Nordbo, A. M., Raeder, H., Stoy, J.,Lipkind, G. M., et al., Mutations in the insulin gene can causeMODY and autoantibody-negative type 1 diabetes. Diabetes57(4):1131–1135, 2008.
4. Lee, S. C., Lee, E. T., Kingsley, R. M., Wang, Y., Russell,D., Klein, R., and Wanr, A., Comparison of diagnosis ofearly retinal lesions of diabetic retinopathy between a com-puter system and human experts. Graefes Arch. Clin. Exp.Ophtalmol. 119(4):509–515, 2001.
5. Usher, D., Dumskyj, M., Himaga, M., Williamson, T. H.,Nussey, S., and Boyce, J., Automated detection of diabeticretinopathy in digital retinal images: A tool for diabeticretinopathy screening. Diabetes UK. Diabet. Med. 21(1):84–90, 2003.
6. Sinthanayothin, C., Kongbunkiat, V., Phoojaruenchanachain,S., and Singlavanija, A., Automated screening system fordiabetic retinopathy. In: Proc. of the 3rd International Sympo-sium on Image and Signal Processing and Analysis. pp. 915–920, 2003.
7. Osareh, A., Mirmehdi, M., Thomas, B., and Markham, R.,Classification and localisation of diabeticrelated eye disease.In: Proc. 7th European Conference on Computer Vision.LNCS. Vol. 2353, pp. 502–516. Berlin, Heidelberg: Springer,2002.
8. Zhou, L., Rzeszotarski, M. S., Singerman, L. J., and Chokreff,J. M., The detection and quantification of retinopathy usingdigital angiograms. IEEE Trans. Med. Imag. 13(4):619–626,1994.
9. Soares, J. V. B., Leandro, J. J. G., Cesar, R. M., Jelinek, H.F., and Cree, M. J., Retinal vessel segmentation using the 2-D gabor wavelet and supervised classification. IEEE Trans.Med. Imag. 25(9):1214–1222, 2006.
10. Nayak, J., Subbanna Bhat, P., Rajendra Acharya, U., Lim,C. M., and Kagathi, M., Automated identification of diabeticretinopathy stages using digital fundus images. J. Med. Syst.32:107–115, 2008.
11. Staal, J., Abramoff, M. D., Niemeijer, M., Viergever, M.A., and van Ginneken, B., Ridge-based vessel segmenta-tion in color images of the retina. IEEE Trans. Med. Imag.23(4):501–509, 2004.
12. Chaudhuri, S., Chatterjee, S., Katz, N., Nelson, M., and Gold-baum, M., Detection of blood vessels in retinal images usingtwo-dimensional matched filters. IEEE Trans. Med. Imag.8(3)263–269, 1989.
J Med Syst
13. Reza, A. W., Eswaran, C., and Dimyati, K., Diagno-sis of diabetic retinopathy: Automatic extraction of op-tic disc and exudates from retinal images using marker-controlled watershed transformation. J. Med. Syst. 2010.doi:10.1007/s10916-009-9426-y
14. Narasimha-Iyer, H., Can, A., Roysam, B., Stewart, C. V.,Tanenbaum, H. L., Majerovics, A., and Singh, H., Robustdetection and classification of longitudinal changes in colorretinal fundus images for monitoring diabetic retinopathy.IEEE Trans. Biomed. Eng. 53(6):1084–1098, 2006.
15. Sinthanayothin, C., Boyce, J. A., Cook, H. L., andWilliamson, T. H., Automated localisation of the optic disc,fovea, and retinal blood vessels from digital colour fundusimages. Br. J. Ophthalmol. 83:902–910, 1999.
16. Hoover, A., Goldbaum, M., Locating the optic nerve in a reti-nal image using the fuzzy convergence of the blood vessels.IEEE Trans. Med. Imag. 22(8):951–958, 2003.
17. Tariq, A., and Akram, M. U., An automated system for col-ored retinal image background and noise segmentation. In:IEEE Symposium on Industrial Electronics and Applications(ISIEA 2010). pp. 405–409, 2010.
18. Vasilevski, A., and Siddiqi, K., Flux maximizing geometricflows. IEEE Trans. Pattern Anal. Mach. Intell. 24(12):1565–1578, 2002.
19. Jiang, X., and Mojon, D.: Adaptive local thresholding byverificationbased multithreshold probing with application tovessel detection in retinal images. IEEE Trans. Pattern Anal.Mach. Intell. 25(1):131–137, 2003.
20. Foracchia, M., Grisam, E., and Ruggeri, A., Detection of theoptic disc in retinal images by means of a geometrical modelof vessel structure. IEEE Trans. Med. Imag. 23(10):1189–1195, 2004.
21. Li, H., and Chutatape, O., Automated feature extraction incolor retinal images by a model based approach. IEEE Trans.Biomed. Eng. 51(2):246–254, 2004.
22. Mendona, A. M., Campilho, A. J., Segmentation of reti-nal blood vessels by combining the detection of centerlinesand morphological reconstruction. IEEE Trans. Med. Imag.25(9):1200–1213, 2006.
23. Antoine, J. P., Carette, P., Murenzi, R., and Piette, B., Imageanalysis with two-dimensional continuous wavelet transform.Signal Process. 31(3):241–272, 1993.
24. Gonzalez, R. C., and Woods, R. E., Digital image processing.Second edition. Englewood Cliffs, NJ: Prentice Hall, 2002.
25. Sekhar, S., Al-Nuaimy, W., Nandi, A. K., Automated lo-calisation of retinal optic disk using Hough transform, In:5th IEEE International Symposium on Biomedical Imaging:From Nano to Macro. pp. 1577–1580, 14–17 May 2008.
26. Kauppi, T., Kalesnykiene, V., Kamarainen, J. K., Lensu,L., Sorri, I., Uusitalo, H., Kälviäinen, H., Pietilä, J.,DIARETDB0: Evaluation database and methodology fordiabetic retinopathy algorithms. Technical Report, 2006.
27. Kauppi, T., Kalesnykiene, V., Kamarainen, J.-K., Lensu,L., Sorri, I., Raninen A., Voutilainen R., Uusitalo, H.,Kälviäinen, H., Pietilä, J., DIARETDB1 diabetic retinopathydatabase and evaluation protocol, Technical report, 2007.
28. Walter, T., Klein, J.-C., Massin, P., and Erginay, A., A con-tribution of image processing to the diagnosis of diabeticretinopathy-detection of exudates in color fundus images ofthe human retina. IEEE Trans. Med. Imag. 21(10):1236–1243,2002.
29. Akram, M. U., Khan, A., Iqbal, K., and Butt, W. H., Reti-nal image: Optic disk localization and detection. In: ImageAnalysis and Recognition, Lecture Notes in Computer Sci-ence, LNCS 6112, Portugal. pp. 40–49, Berlin, Heidelberg:Springer, 2010.
30. Niemeijer, M., Abramoff, M. D., and Ginneken, B. V., Infor-mation fusion for diabetic retinopathy CAD in digital colorfundus photographs. IEEE Trans. Med. Imag. 28(5):775–785,2009.
![Improvement of retinal blood vessel detection using ......(5) model-based techniques and (6) mathematical morphology [1]. In matched filtering methods, retinal images are filtered](https://img.pdfslide.us/doc/110x75/60f12576a9739b0fda316773/improvement-of-retinal-blood-vessel-detection-using-5-model-based-techniques.jpg)