Embed Size (px)
Citation preview
Automated Crop Mapping for Water Needs
Assessment from LANDSAT Imagery
Michal KollerAgCEL
Objectives
1. Develop remote sensing methods for crop classification with limited ground truth information
2. Develop historical record of crop classes in San Joaquin County for model calibration and inputs to other models
Available Data
San Joaquin County was selected the pilot study area.
1. Field border spatial database developed by California Department of Water Resources (DWR) – two surveys in 1988 and 1996 available for San Joaquin County
2. LANDSAT satellite imagery available annually in Spring and in Summer
3. Agricultural Commissioner’s Reports listing annual acreages of individual crops for the whole County
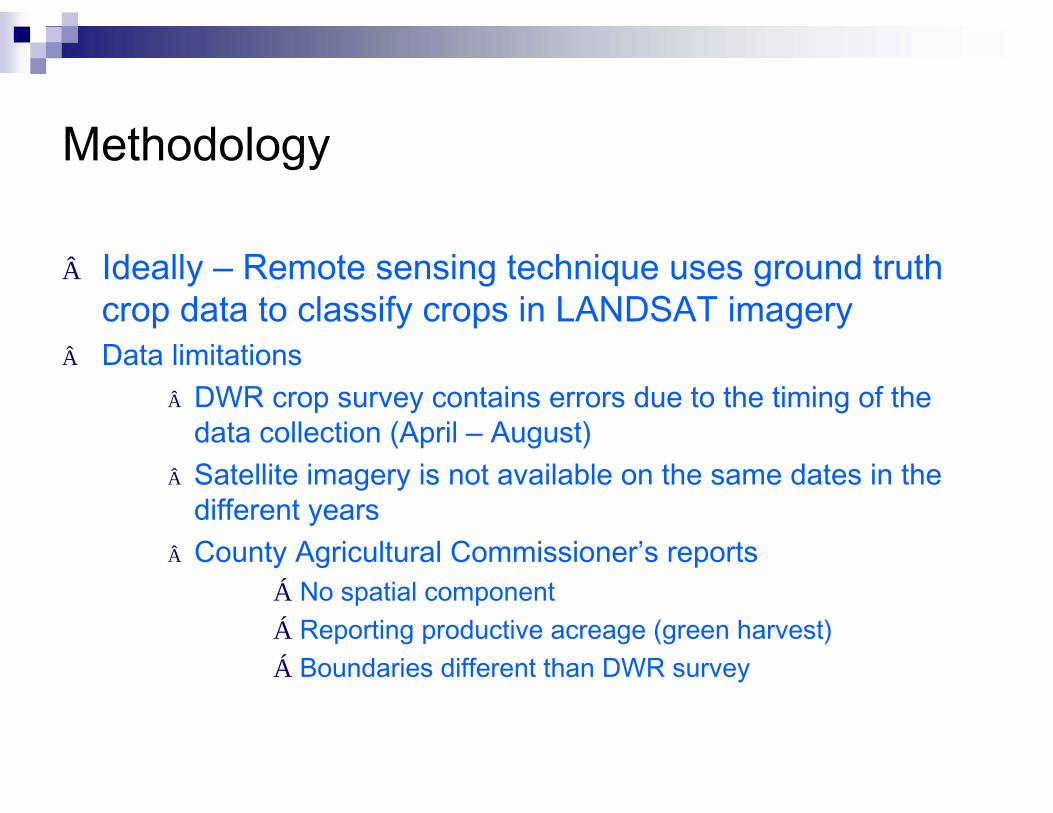
Methodology
 Ideally – Remote sensing technique uses ground truth crop data to classify crops in LANDSAT imagery
 Data limitations  DWR crop survey contains errors due to the timing of the
data collection (April – August)Â Satellite imagery is not available on the same dates in the
different years  County Agricultural Commissioner’s reports
Á No spatial component Á Reporting productive acreage (green harvest) Á Boundaries different than DWR survey
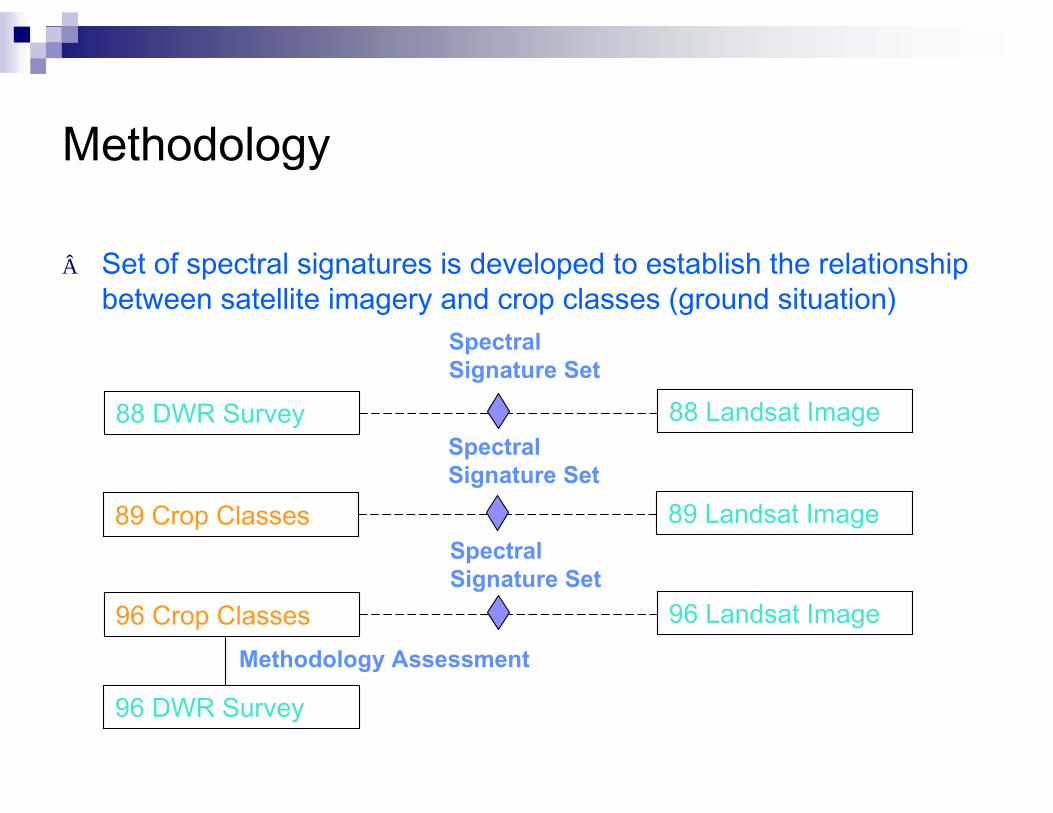
Methodology
 Set of spectral signatures is developed to establish the relationshipbetween satellite imagery and crop classes (ground situation)
SpectralSignature Set
88 DWR Survey 88 Landsat Image
89 Crop Classes 89 Landsat Image
SpectralSignature Set
SpectralSignature Set
96 Landsat Image96 Crop Classes
Methodology Assessment
96 DWR Survey
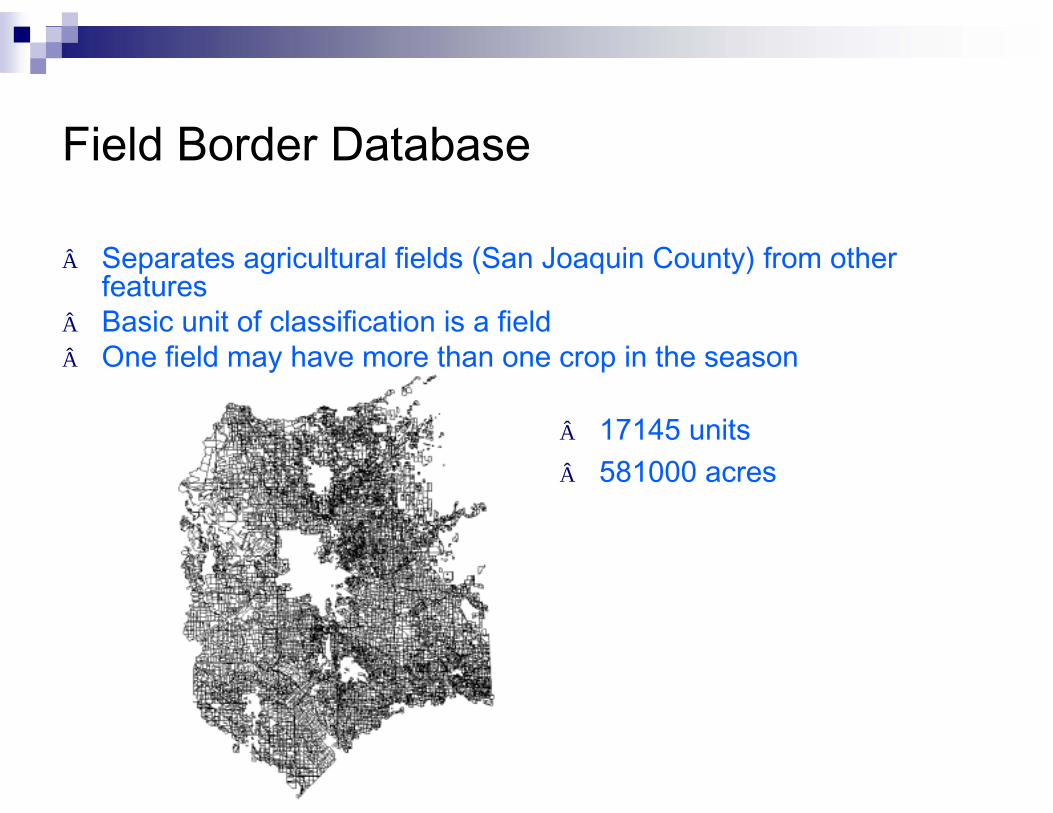
Field Border Database
 17145 units  581000 acres
 Separates agricultural fields (San Joaquin County) from other features
 Basic unit of classification is a field  One field may have more than one crop in the season
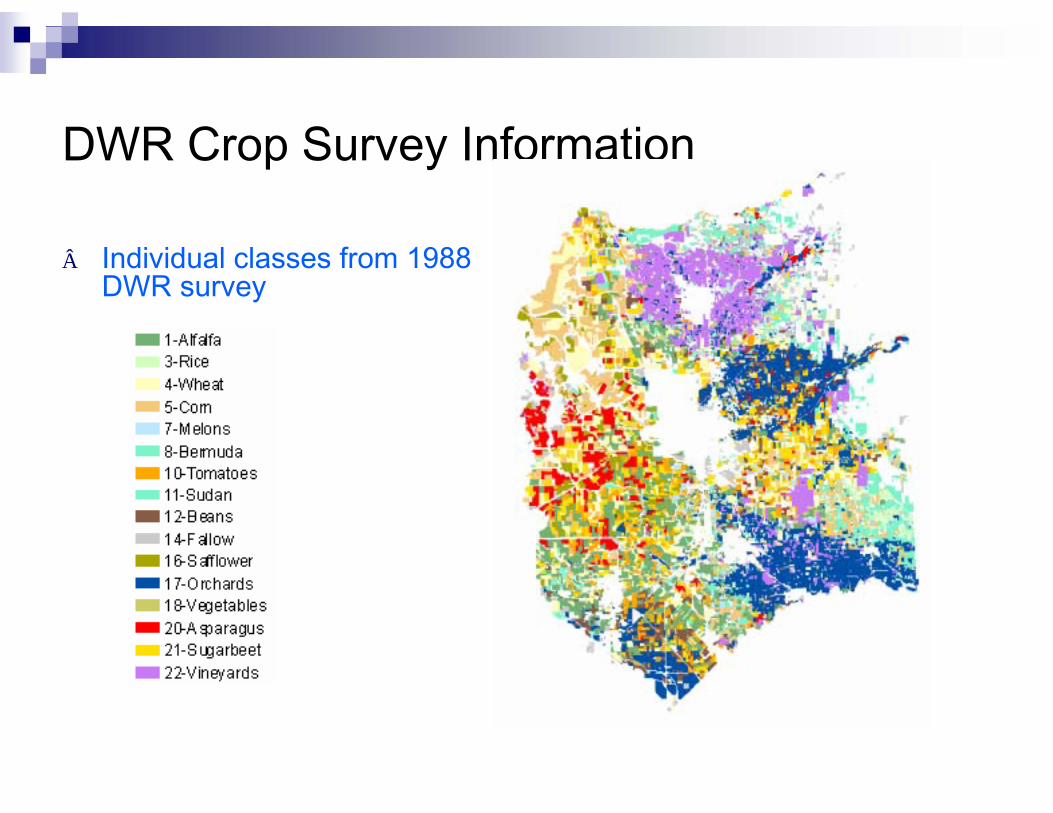
 Individual classes from 1988 DWR survey
DWR Crop Survey Information
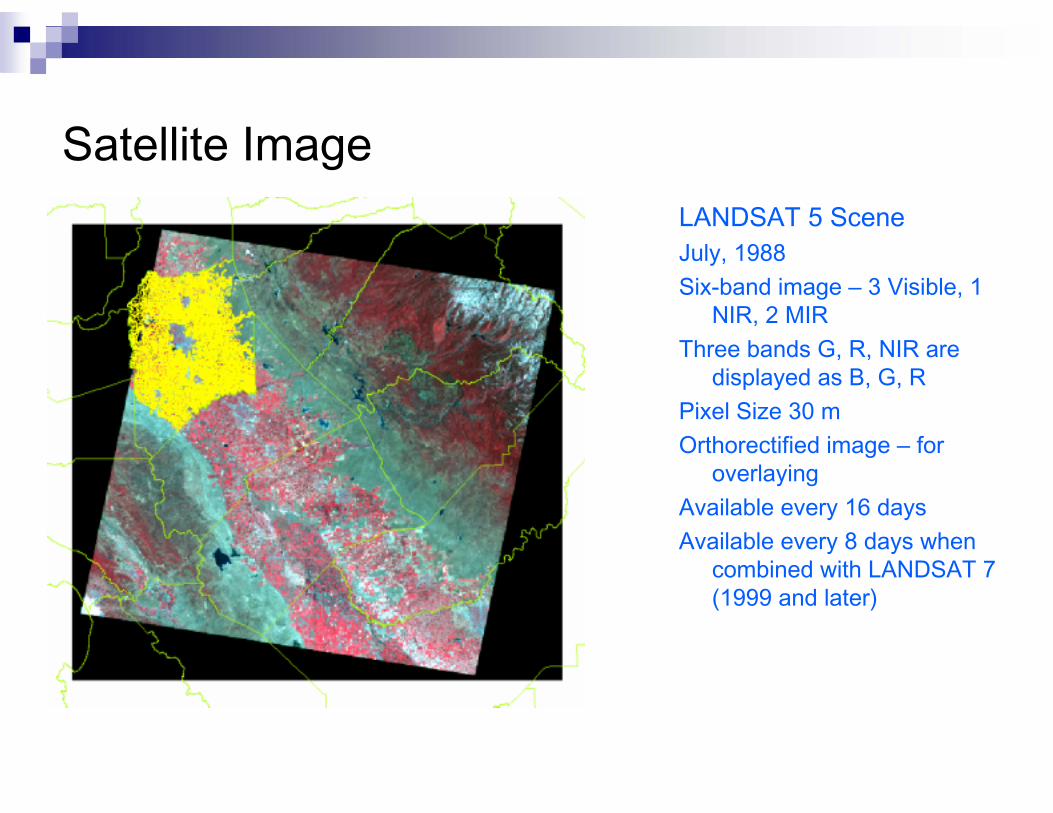
Satellite Image LANDSAT 5 Scene July, 1988 Six-band image – 3 Visible, 1
NIR, 2 MIR Three bands G, R, NIR are
displayed as B, G, R Pixel Size 30 mOrthorectified image – for
overlayingAvailable every 16 days Available every 8 days when
combined with LANDSAT 7 (1999 and later)
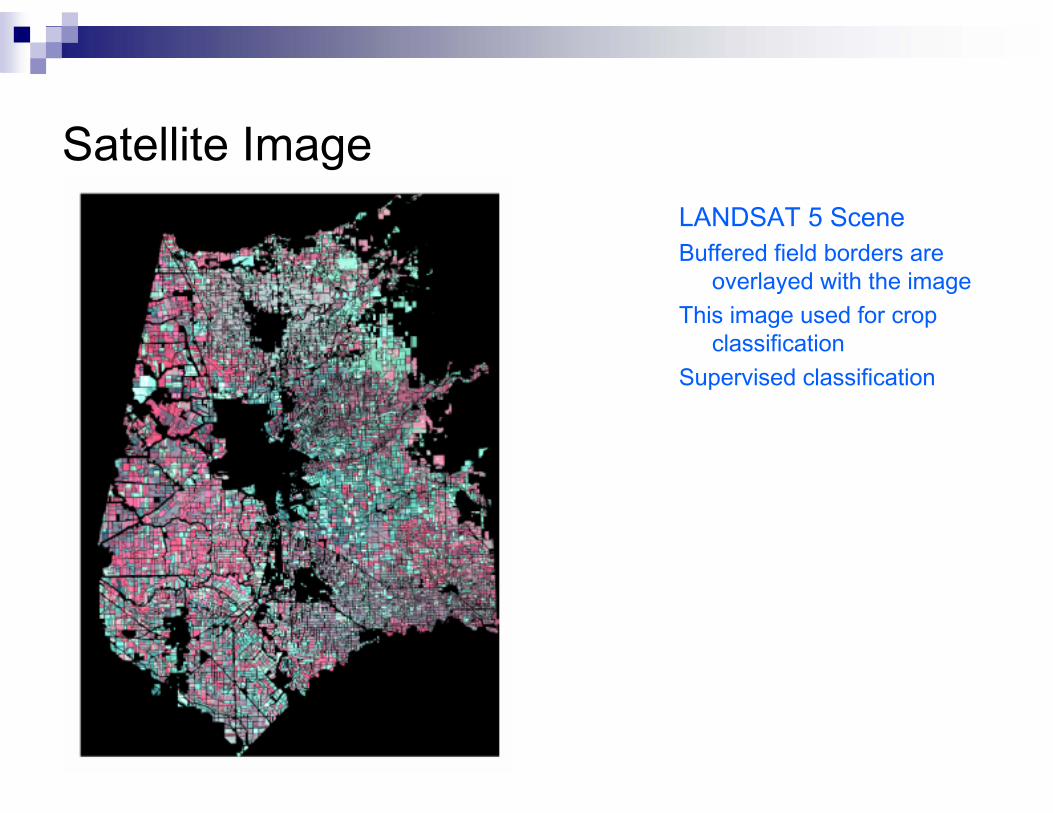
Satellite Image LANDSAT 5 Scene Buffered field borders are
overlayed with the image This image used for crop
classificationSupervised classification
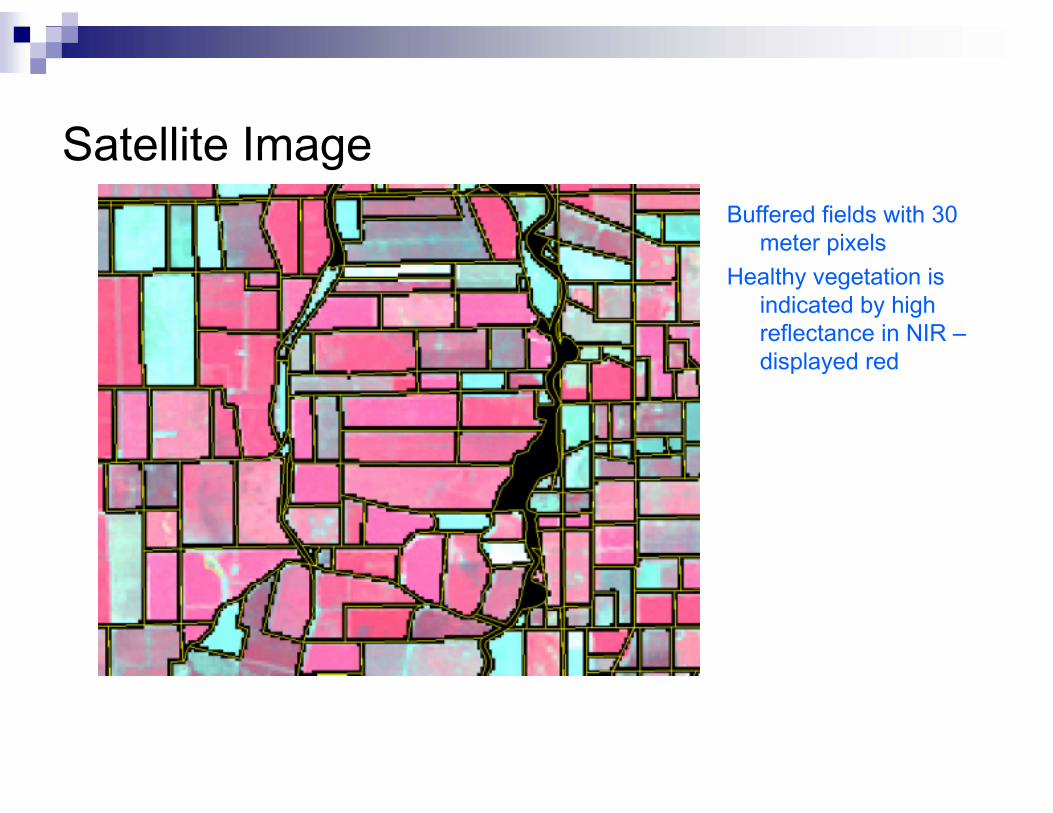
Satellite Image Buffered fields with 30
meter pixels Healthy vegetation is
indicated by high reflectance in NIR –displayed red
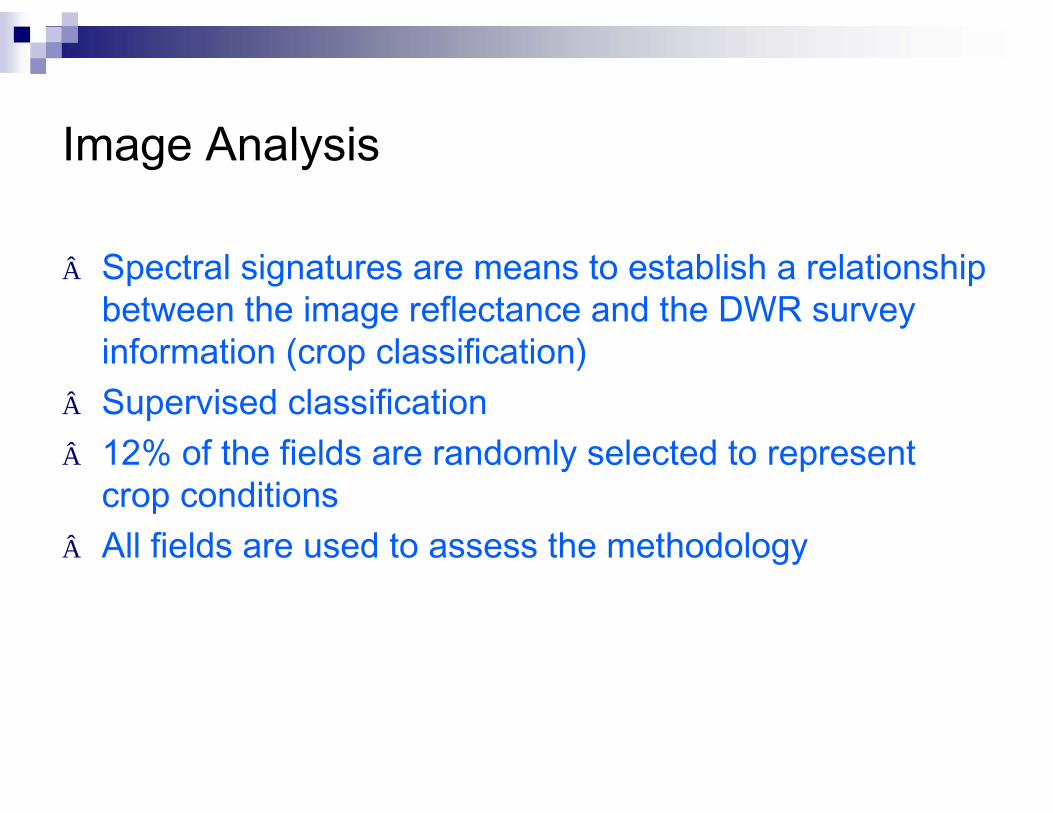
Image Analysis
 Spectral signatures are means to establish a relationship between the image reflectance and the DWR survey information (crop classification)
 Supervised classification  12% of the fields are randomly selected to represent
crop conditions  All fields are used to assess the methodology
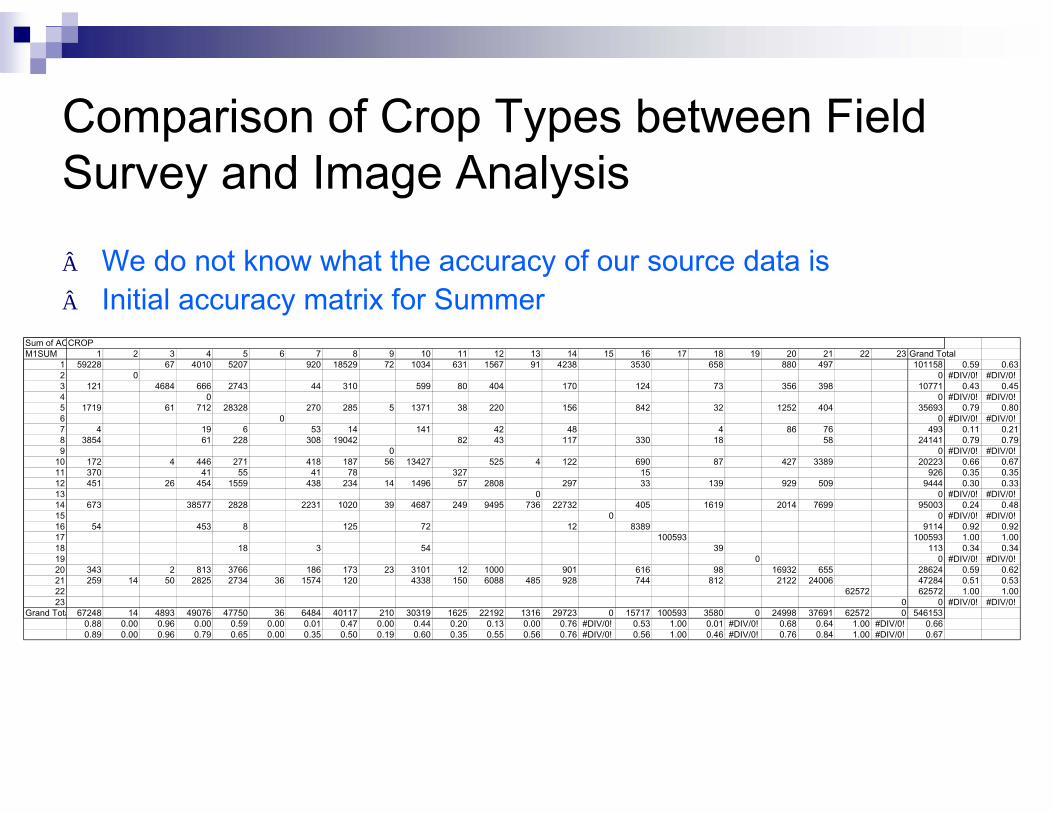
Comparison of Crop Types between Field Survey and Image Analysis
 We do not know what the accuracy of our source data is  Initial accuracy matrix for Summer
Sum of ACCROPM1SUM 1 2 3 4 5 6 7 8 9 10 11 12 13 14 15 16 17 18 19 20 21 22 23 Grand Total
1 59228 67 4010 5207 920 18529 72 1034 631 1567 91 4238 3530 658 880 497 101158 0.59 0.632 0 0 #DIV/0! #DIV/0!3 121 4684 666 2743 44 310 599 80 404 170 124 73 356 398 10771 0.43 0.454 0 0 #DIV/0! #DIV/0!5 1719 61 712 28328 270 285 5 1371 38 220 156 842 32 1252 404 35693 0.79 0.806 0 0 #DIV/0! #DIV/0!7 4 19 6 53 14 141 42 48 4 86 76 493 0.11 0.218 3854 61 228 308 19042 82 43 117 330 18 58 24141 0.79 0.799 0 0 #DIV/0! #DIV/0!
10 172 4 446 271 418 187 56 13427 525 4 122 690 87 427 3389 20223 0.66 0.6711 370 41 55 41 78 327 15 926 0.35 0.3512 451 26 454 1559 438 234 14 1496 57 2808 297 33 139 929 509 9444 0.30 0.3313 0 0 #DIV/0! #DIV/0!14 673 38577 2828 2231 1020 39 4687 249 9495 736 22732 405 1619 2014 7699 95003 0.24 0.4815 0 0 #DIV/0! #DIV/0!16 54 453 8 125 72 12 8389 9114 0.92 0.9217 100593 100593 1.00 1.0018 18 3 54 39 113 0.34 0.3419 0 0 #DIV/0! #DIV/0!20 343 2 813 3766 186 173 23 3101 12 1000 901 616 98 16932 655 28624 0.59 0.6221 259 14 50 2825 2734 36 1574 120 4338 150 6088 485 928 744 812 2122 24006 47284 0.51 0.5322 62572 62572 1.00 1.0023 0 0 #DIV/0! #DIV/0!
Grand Tota 67248 14 4893 49076 47750 36 6484 40117 210 30319 1625 22192 1316 29723 0 15717 100593 3580 0 24998 37691 62572 0 5461530.88 0.00 0.96 0.00 0.59 0.00 0.01 0.47 0.00 0.44 0.20 0.13 0.00 0.76 #DIV/0! 0.53 1.00 0.01 #DIV/0! 0.68 0.64 1.00 #DIV/0! 0.660.89 0.00 0.96 0.79 0.65 0.00 0.35 0.50 0.19 0.60 0.35 0.55 0.56 0.76 #DIV/0! 0.56 1.00 0.46 #DIV/0! 0.76 0.84 1.00 #DIV/0! 0.67
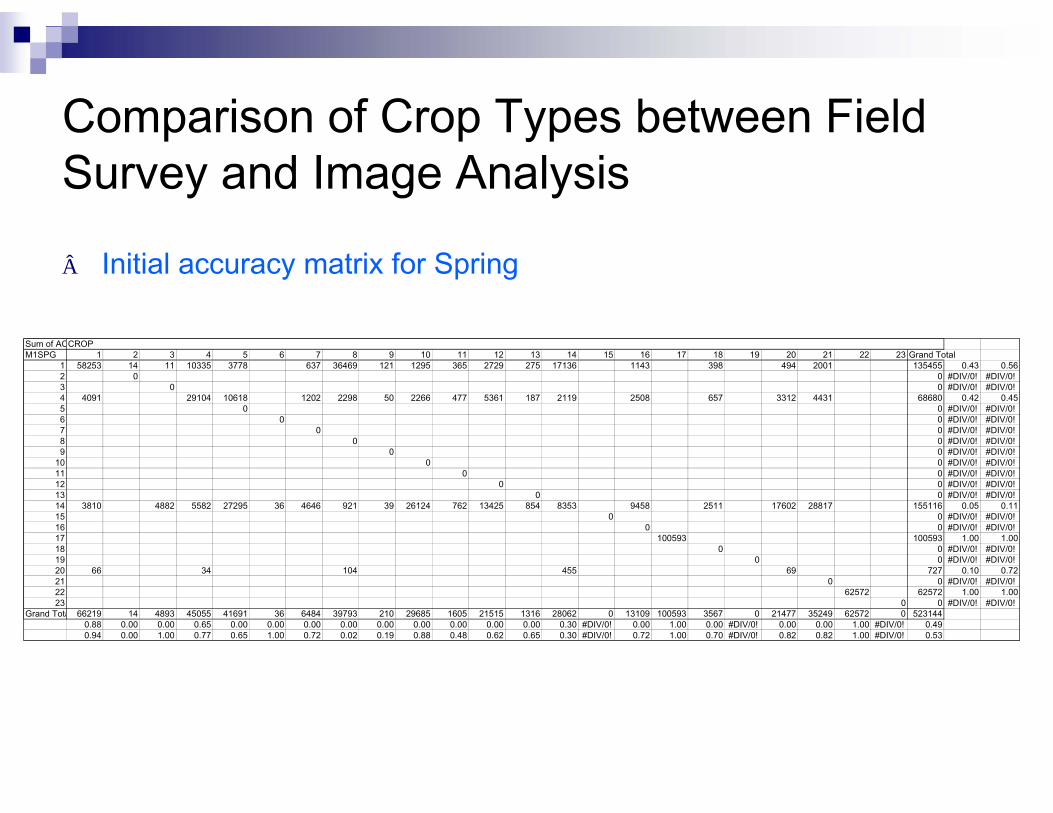
Comparison of Crop Types between Field Survey and Image Analysis
 Initial accuracy matrix for Spring
Sum of ACCROPM1SPG 1 2 3 4 5 6 7 8 9 10 11 12 13 14 15 16 17 18 19 20 21 22 23 Grand Total
1 58253 14 11 10335 3778 637 36469 121 1295 365 2729 275 17136 1143 398 494 2001 135455 0.43 0.562 0 0 #DIV/0! #DIV/0!3 0 0 #DIV/0! #DIV/0!4 4091 29104 10618 1202 2298 50 2266 477 5361 187 2119 2508 657 3312 4431 68680 0.42 0.455 0 0 #DIV/0! #DIV/0!6 0 0 #DIV/0! #DIV/0!7 0 0 #DIV/0! #DIV/0!8 0 0 #DIV/0! #DIV/0!9 0 0 #DIV/0! #DIV/0!
10 0 0 #DIV/0! #DIV/0!11 0 0 #DIV/0! #DIV/0!12 0 0 #DIV/0! #DIV/0!13 0 0 #DIV/0! #DIV/0!14 3810 4882 5582 27295 36 4646 921 39 26124 762 13425 854 8353 9458 2511 17602 28817 155116 0.05 0.1115 0 0 #DIV/0! #DIV/0!16 0 0 #DIV/0! #DIV/0!17 100593 100593 1.00 1.0018 0 0 #DIV/0! #DIV/0!19 0 0 #DIV/0! #DIV/0!20 66 34 104 455 69 727 0.10 0.7221 0 0 #DIV/0! #DIV/0!22 62572 62572 1.00 1.0023 0 0 #DIV/0! #DIV/0!
Grand Tota 66219 14 4893 45055 41691 36 6484 39793 210 29685 1605 21515 1316 28062 0 13109 100593 3567 0 21477 35249 62572 0 5231440.88 0.00 0.00 0.65 0.00 0.00 0.00 0.00 0.00 0.00 0.00 0.00 0.00 0.30 #DIV/0! 0.00 1.00 0.00 #DIV/0! 0.00 0.00 1.00 #DIV/0! 0.490.94 0.00 1.00 0.77 0.65 1.00 0.72 0.02 0.19 0.88 0.48 0.62 0.65 0.30 #DIV/0! 0.72 1.00 0.70 #DIV/0! 0.82 0.82 1.00 #DIV/0! 0.53
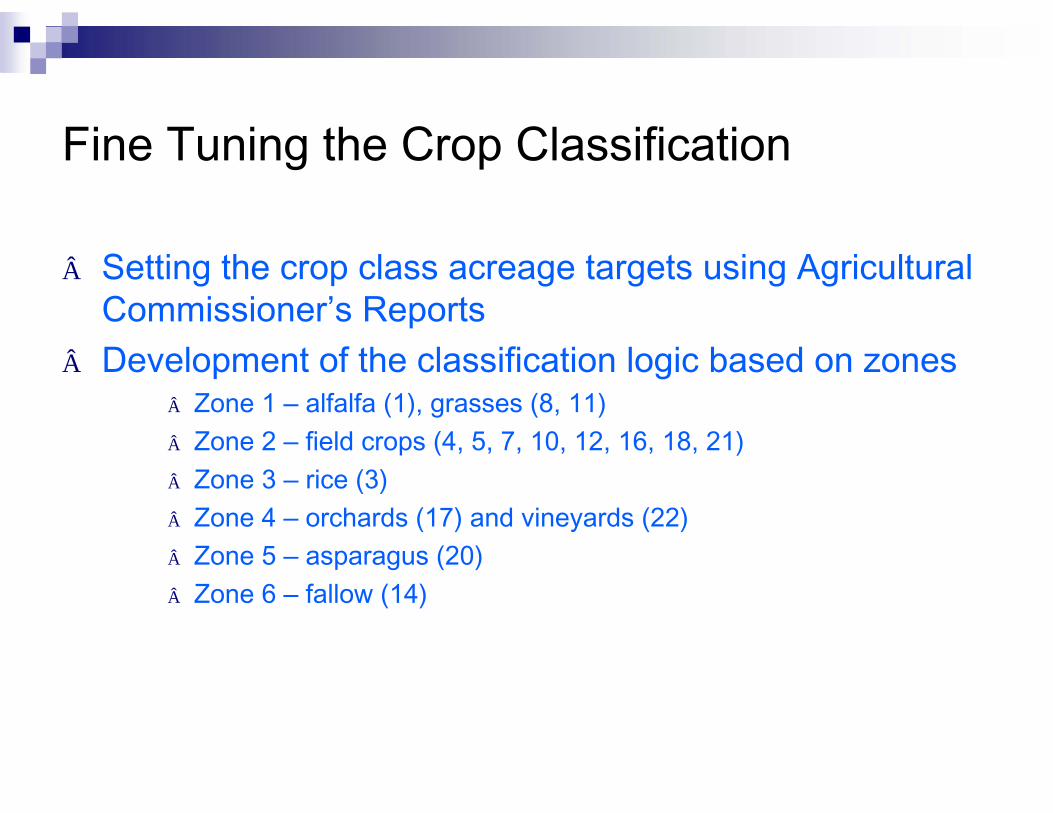
Fine Tuning the Crop Classification
 Setting the crop class acreage targets using Agricultural Commissioner’s Reports
 Development of the classification logic based on zones  Zone 1 – alfalfa (1), grasses (8, 11)  Zone 2 – field crops (4, 5, 7, 10, 12, 16, 18, 21)  Zone 3 – rice (3)  Zone 4 – orchards (17) and vineyards (22)  Zone 5 – asparagus (20)  Zone 6 – fallow (14)
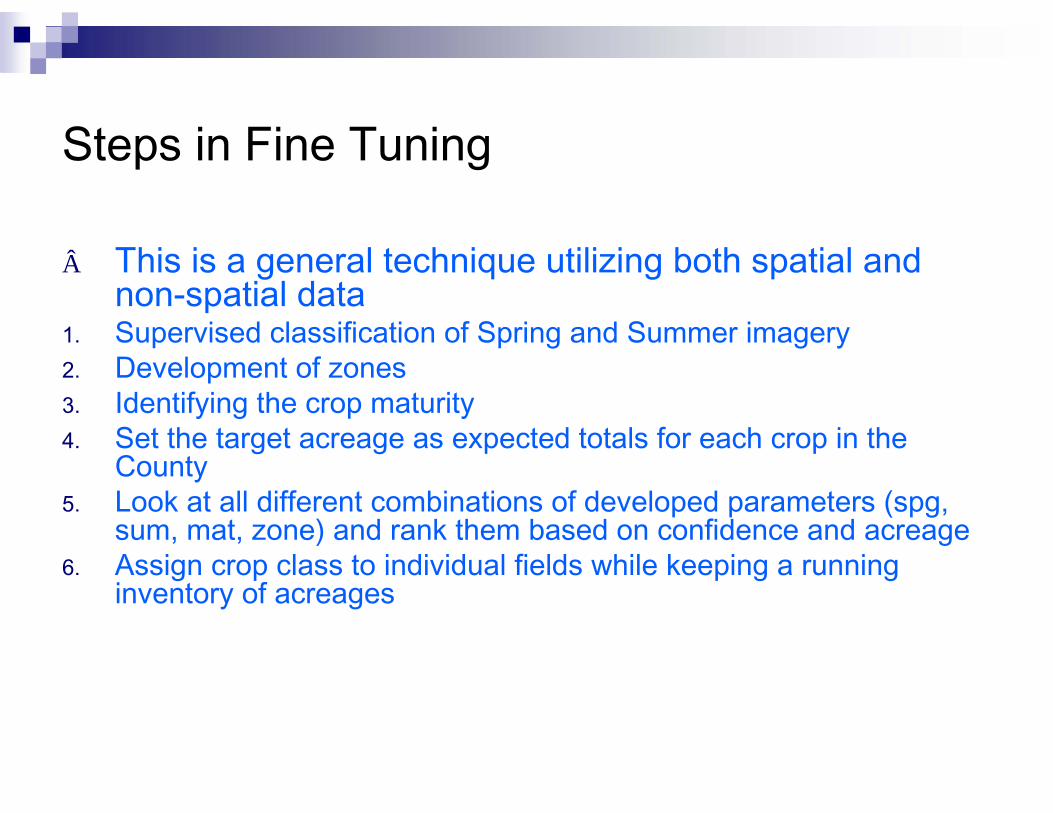
Steps in Fine Tuning
 This is a general technique utilizing both spatial and non-spatial data
1. Supervised classification of Spring and Summer imagery 2. Development of zones 3. Identifying the crop maturity 4. Set the target acreage as expected totals for each crop in the
County5. Look at all different combinations of developed parameters (spg,
sum, mat, zone) and rank them based on confidence and acreage 6. Assign crop class to individual fields while keeping a running
inventory of acreages
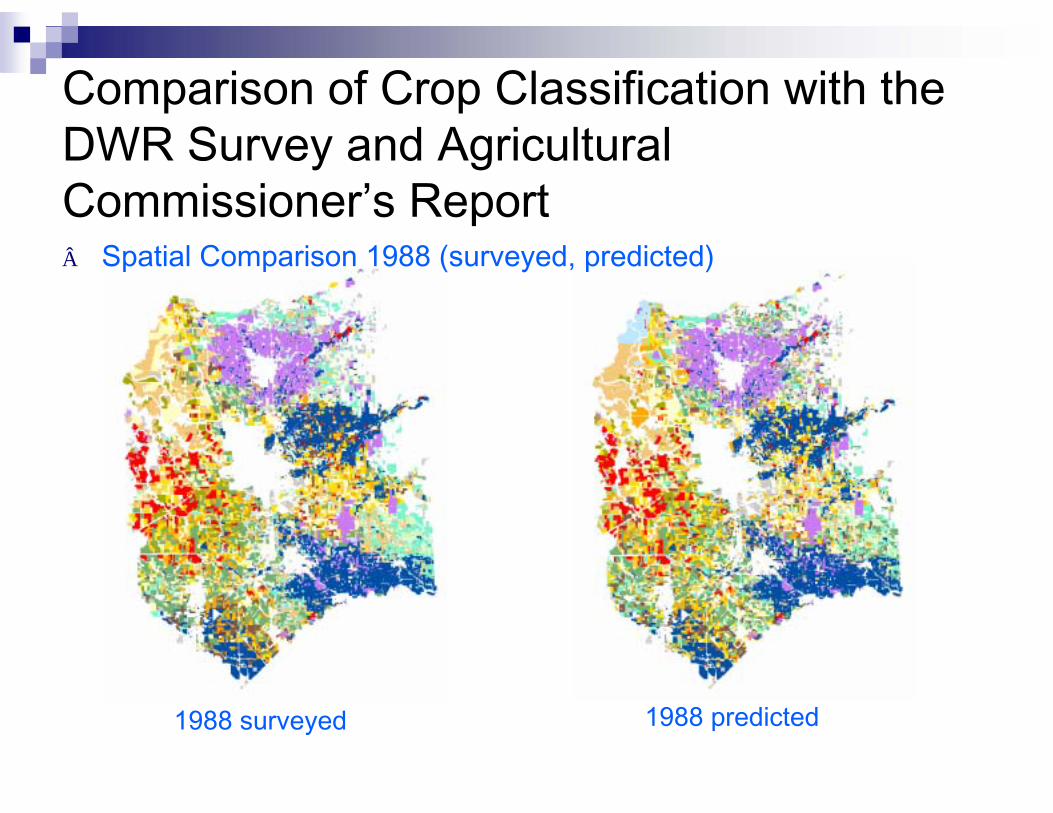
Comparison of Crop Classification with the DWR Survey and Agricultural Commissioner’s Report
1988 surveyed 1988 predicted
 Spatial Comparison 1988 (surveyed, predicted)
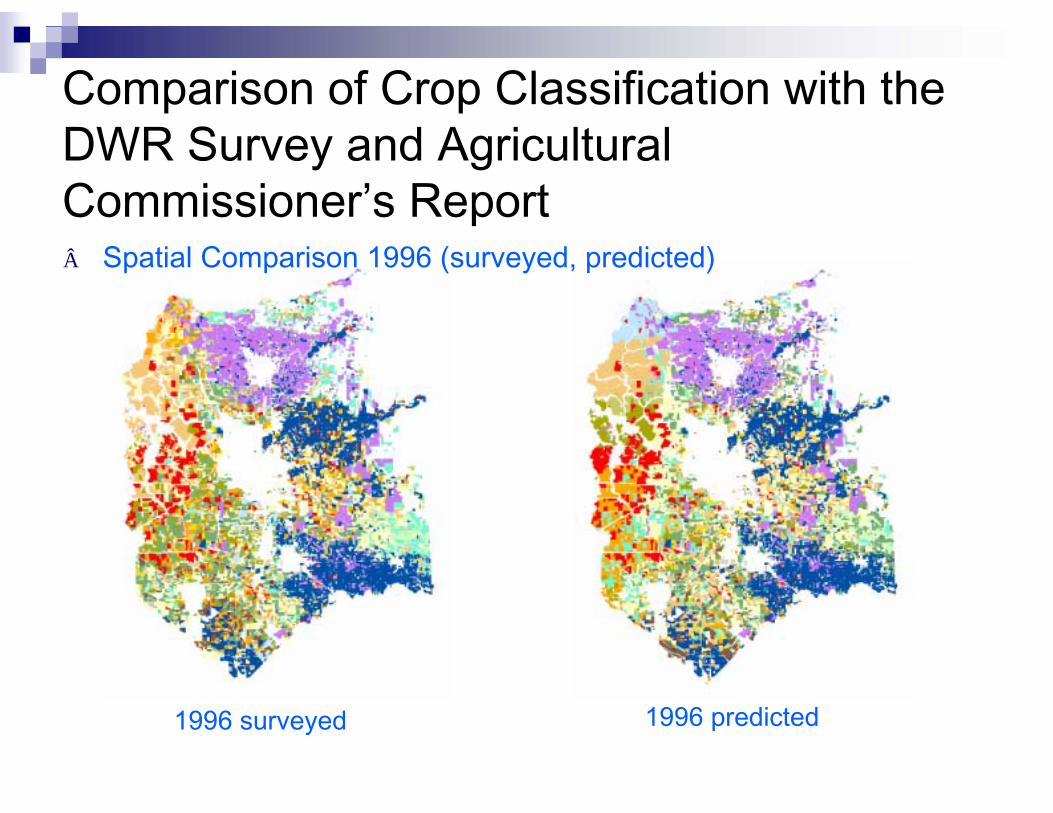
Comparison of Crop Classification with the DWR Survey and Agricultural Commissioner’s Report  Spatial Comparison 1996 (surveyed, predicted)
1996 surveyed 1996 predicted
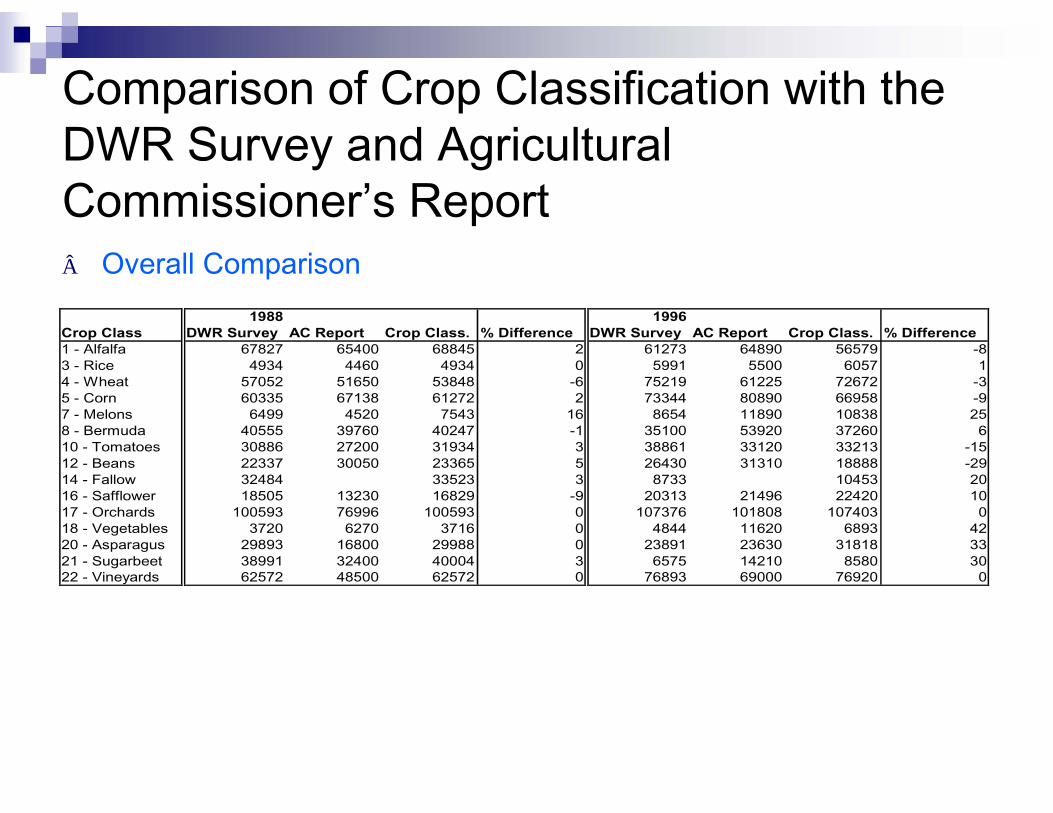
Comparison of Crop Classification with the DWR Survey and Agricultural Commissioner’s Report  Overall Comparison
1988 1996Crop Class DWR Survey AC Report Crop Class. % Difference DWR Survey AC Report Crop Class. % Difference1 - Alfalfa 67827 65400 68845 2 61273 64890 56579 -83 - Rice 4934 4460 4934 0 5991 5500 6057 14 - Wheat 57052 51650 53848 -6 75219 61225 72672 -35 - Corn 60335 67138 61272 2 73344 80890 66958 -97 - Melons 6499 4520 7543 16 8654 11890 10838 258 - Bermuda 40555 39760 40247 -1 35100 53920 37260 610 - Tomatoes 30886 27200 31934 3 38861 33120 33213 -1512 - Beans 22337 30050 23365 5 26430 31310 18888 -2914 - Fallow 32484 33523 3 8733 10453 2016 - Safflower 18505 13230 16829 -9 20313 21496 22420 1017 - Orchards 100593 76996 100593 0 107376 101808 107403 018 - Vegetables 3720 6270 3716 0 4844 11620 6893 4220 - Asparagus 29893 16800 29988 0 23891 23630 31818 3321 - Sugarbeet 38991 32400 40004 3 6575 14210 8580 3022 - Vineyards 62572 48500 62572 0 76893 69000 76920 0
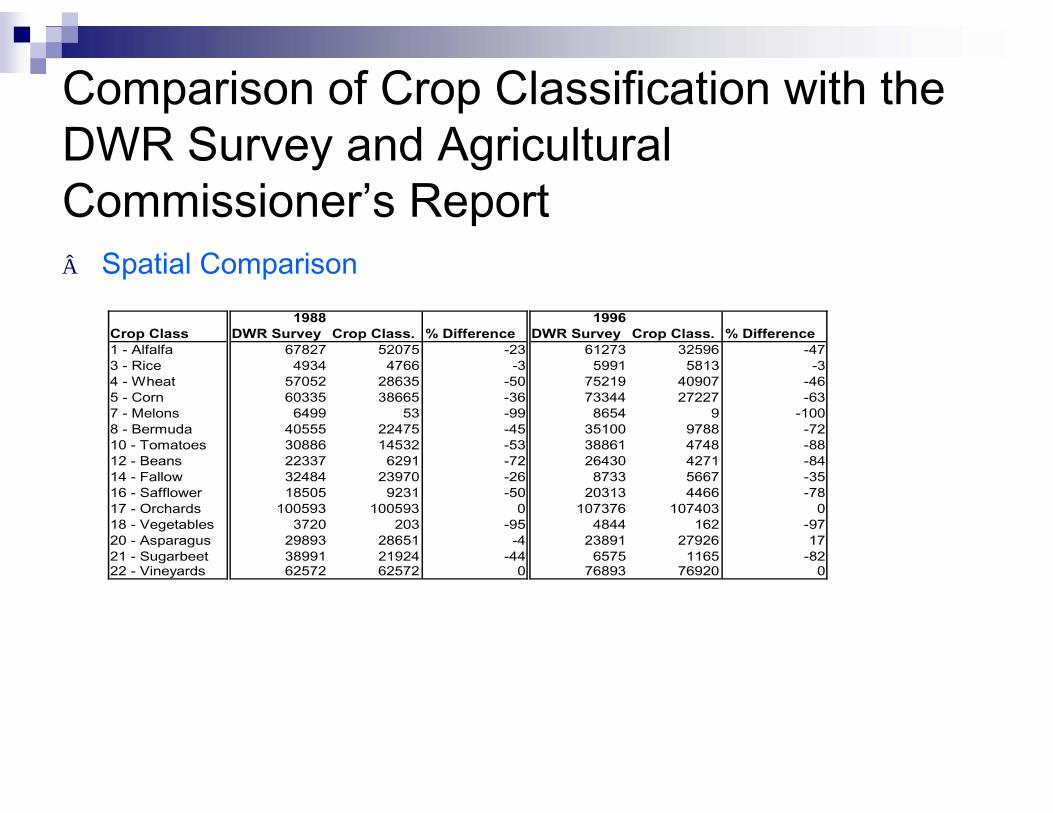
Comparison of Crop Classification with the DWR Survey and Agricultural Commissioner’s Report  Spatial Comparison
1988 1996Crop Class DWR Survey Crop Class. % Difference DWR Survey Crop Class. % Difference 1 - Alfalfa 67827 52075 -23 61273 32596 -473 - Rice 4934 4766 -3 5991 5813 -34 - Wheat 57052 28635 -50 75219 40907 -465 - Corn 60335 38665 -36 73344 27227 -637 - Melons 6499 53 -99 8654 9 -1008 - Bermuda 40555 22475 -45 35100 9788 -7210 - Tomatoes 30886 14532 -53 38861 4748 -8812 - Beans 22337 6291 -72 26430 4271 -8414 - Fallow 32484 23970 -26 8733 5667 -3516 - Safflower 18505 9231 -50 20313 4466 -7817 - Orchards 100593 100593 0 107376 107403 018 - Vegetables 3720 203 -95 4844 162 -9720 - Asparagus 29893 28651 -4 23891 27926 1721 - Sugarbeet 38991 21924 -44 6575 1165 -8222 - Vineyards 62572 62572 0 76893 76920 0