Embed Size (px)
Citation preview
ELSEVIER
NEUROSCIENCE
Journal of Neuroscience Methods 87 (1999) 147-158 METHODS
An automated system for the mapping and quantitative analysis of immunocytochemistry of an inducible nuclear protein
Guillermo A. Cecchi ", Sidarta Ribeiro b, Claudio V. Mello b, Marcelo 0. Magnasco ",* I
i " The Rockefeller University, Center for Studies in Physics and Biology, Laboratory of Mathematical Physics, 1230 York Avenue, New York, i
N Y 10021 -6399, USA Laboratory of Animal Behavior, The Rockefeller University, 1230 York Avenue, New York, N Y 10021, USA
Received 20 April 1998; received in revised form 19 October 1998; accepted 24 October 1998 I
Abstract
We describe here an automated system that accurately maps tissue sections stained by immunocytochemistry for an inducible nuclear protein. The sections are scanned with a computer-controlled microscope setup hooked to a CCD camera. Raw images captured at high resolution are filtered using highly selective criteria for the recognition of labeled cell nuclei. The total population of recognized labeled nuclei is then divided into separate bins, according to their labeling intensities. Finally, information about both the position and labeling intensity of labeled nuclei is represented in average density maps. The system was optimized for the quantitative mapping of neuronal cells expressing the inducible gene ZENK in the brain of songbirds, in response to stimulation with song, but should be of general applicability for the mapping of inducible nuclear proteins. O 1999 Elsevier Science B.V. All rights reserved.
Keywords: Mapping; Quantitative analysis; Immunocytochemistry; Inducible nuclear protein ~
1. Introduction
The activation of neuronal cells by extracellular stim- ulation typically results in the sharp and transient in- duction of immediate early genes (IEGs), several of which are encoding transcriptional regulators (Morgan and Curran, 1989). This response has been postulated to represent the early stages in a cascade of gene regulation leading to the modification of neuronal properties that could provide a basis for memory for- mation (Goelet et al., 1986). Irrespective of its precise function, analysis of the IEG response has become increasingly popular as a tool in the assessment of sensorimotor responses to particular stimuli and of physiological states (Chaudhuri, 1997).
* Corresponding author. Fax: f 1-212-327-8889; e-mail: [email protected].
Some intriguing insights into neural mechanisms in- I
volved in vocal communication in birds have originated from the finding that the IEG ZENK, also known as zif-268 (Christy et al., 1988), egr-1 (Sukhatme et al., 1988), NGFI-A (Milbrandt, 1987) and Krox-24 (Lemaire et al., 1988), as well as the c-jun gene (Nishimura and Vogt, 1988), are rapidly induced in the brain of songbirds when they hear playbacks of conspe- cific song (Mello et al., 1992; Nastiuk et al., 1994). This induction is most prominent in the caudomedial neos- triatum (NCM) and adjacent caudomedial hyperstria- turn ventrale (CMHV) (Mello and Clayton, 1994), both areas thought to participate in auditory processing (Chew et al., 1995, 1996a,b; Vates et al., 1996; Stripling et al., 1997). ZENK induction has also been observed in several telencephalic song control nuclei as a result of active singing behavior in captive as well as in wild songbirds (Jarvis and Nottebohm, 1997; Jarvis et al., 1997; Jin and Clayton, 1997). ZENK encodes a zinc finger transcriptional regulator of nuclear localization,
148 G.A. Cecchi et al. /Journal of Neurosc ,ience Methods 87 (1999) 147-158
and is thought to control the expression levels of down- stream genes that contain ZENK binding motifs in their promoters (Christy and Nathans, 1989; Gupta et al., 1991). ZENK induction in NCM could represent an early regulatory component whose induction is neces- sary for long-term neuronal habituation to song (Chew et al., 1995, 1996b).
We have recently used ZENK immunocytochemistry (ICC) to determine the time course of ZENK protein expression and the brain distribution of ZENK protein after song stimulation (Mello and Ribeiro, 1998). Due to its sensitivity, high spatial resolution and good tissue preservation, ZENK ICC can be counted among the best methods for functional mapping of brain areas involved in natural behaviors in vertebrates. Although other systems for tissue mapping are available (Alvarez- Buylla and Vicario, 1988; Hibbard et al., 1996), we decided to develop an automated system for ICC analy- sis that takes full advantage of the intrinsic properties of the ZENK ICC methodology. Our system accurately maps the spatial distribution and labeling intensities of immunopositive cell nuclei within a region of interest. Applied to songbirds, it allows for a high-resolution description of the brain's ZENK response to song stimulation (Ribeiro et al., 1998). With small adjust- ments, the system should be of general applicability to the mapping of labeled cell nuclei.
2. Method
2.1. Tissue preparation
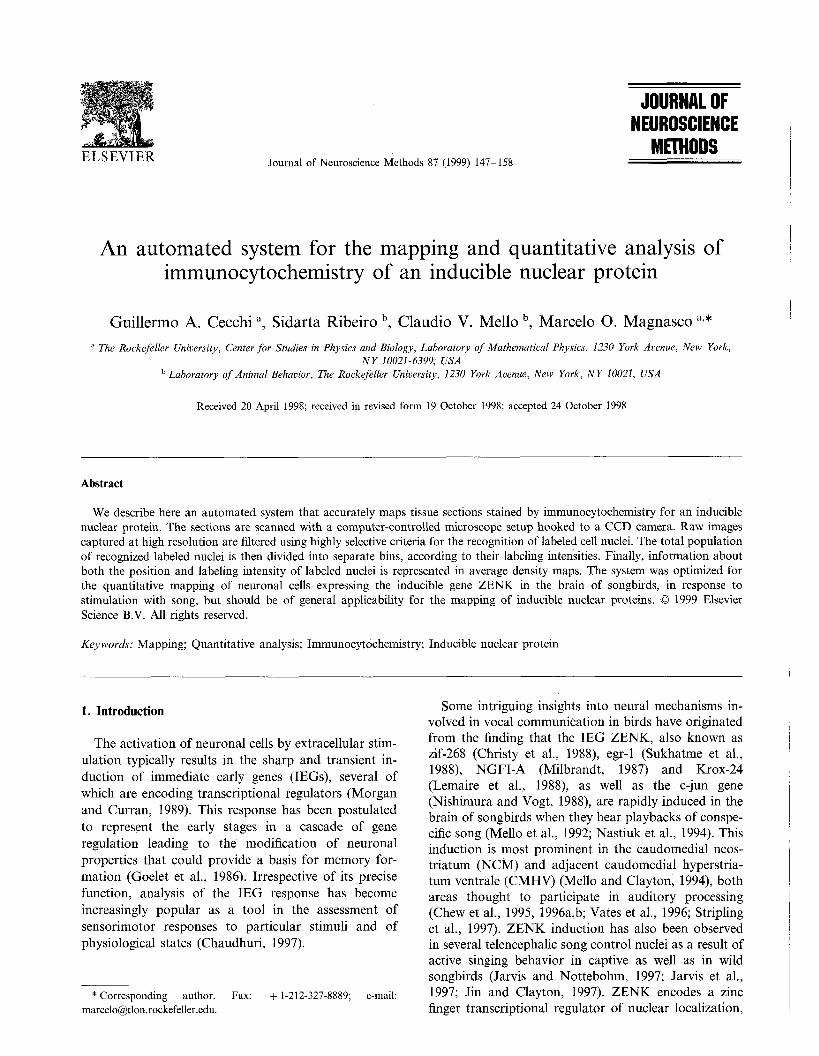
We analyzed brain sections from adult female ca- naries (Serinus canaria) stimulated with playbacks of a variety of auditory stimuli, including a whole canary song. Birds that heard only silence constituted an un- stimulated control group. Data from about 110 animals were used at various stages in the development of this mapping system. The animals were stimulated for a period of 30 min, essentially as described elsewhere (Mello and Ribeiro, 1998; Ribeiro et al., 1998). The birds were killed and perfused with fixative 60 min after the end of stimulation, which is well within the time of peak ZENK protein expression (Mello and Ribeiro, 1998). The brains were dissected, frozen and sectioned (20 pm) in the parasagittal plane (Fig. 1) and mounted onto sylanated slides. Particular care was taken to ensure that all brains were cut in the same orientation.
2.2. ZENK ICC
We used an anti-ZENK polyclonal antiserum (C-19; Santa Cruz Biotech., Santa Cruz, CA, USA) and a previously described ICC protocol (Mello and Ribeiro, 1998). For detection of antigen-bound primary anti-
body, we used the avidin-biotinperoxidase method (ABC Elite kit, Vector Laboratories); the final cell labeling was the result of 3,3'-diaminobenzidine (DAB) precipitation over cell nuclei, with nickel intensification. All sections to be compared were processed in parallel, using the same batches of reagents.
2.3. Imaging
2.3.1. System set-up Sections are scanned using a computer-controlled
microscope set-up, consisting of: 1. Silicon Graphics Indigo2 Workstation running
Unix, with o 195 MHz IP28 processor; o MIPS RlOOOO processor chip, revision 2.5; o MIPS RlOOlO floating point chip, revision 0.0; o 32 Kbytes data cache; o 32 Kbytes instruction cache; o l Mbyte secondary unified instructionldata
cache; o 320 Mbytes main memory; o SOLID IMPACT graphics board; o IMPACT compression board, unit 0, revision 0:O; o Software: the code of the navigator program (see
later), as well as the analysis, was written in C language.
2. Olympus BX60 upright microscope, with o UPLFL UPlan Fluorite 40Xl0.75 and 4X10.13
objectives; o Video Adapter with 0.3X reduction lens; o CCD camera Sony XC-77CE PAL-N (768 x 576
pixels); o Motorized Stepper Stage, 4 x 3 inches travel for
Olympus BX, Prior Scientific model 500-H 10 1; o Microstepping Motor Control Processor, three
axes, 1 pm precision, Prior Scientific model 500- H128V3, controllable from RS232 port.
Fig. 1. Parasagittal section of the canary brain at the level of NCM (1100-1300 pm lateral to mid-line). BS, brainstem; Cb, cerebellum; H, hyperstriatum; Hp, hippocampus; L, subfield L2a of field L; LPO, lobus parolfactorius; N, neostriatum; NCM, caudomedial neostria- tum. Scale 1. mm.
150 G.A. Cecchi et al. /Journal oj. Neuroscience Methods 87 (1999) 147-158
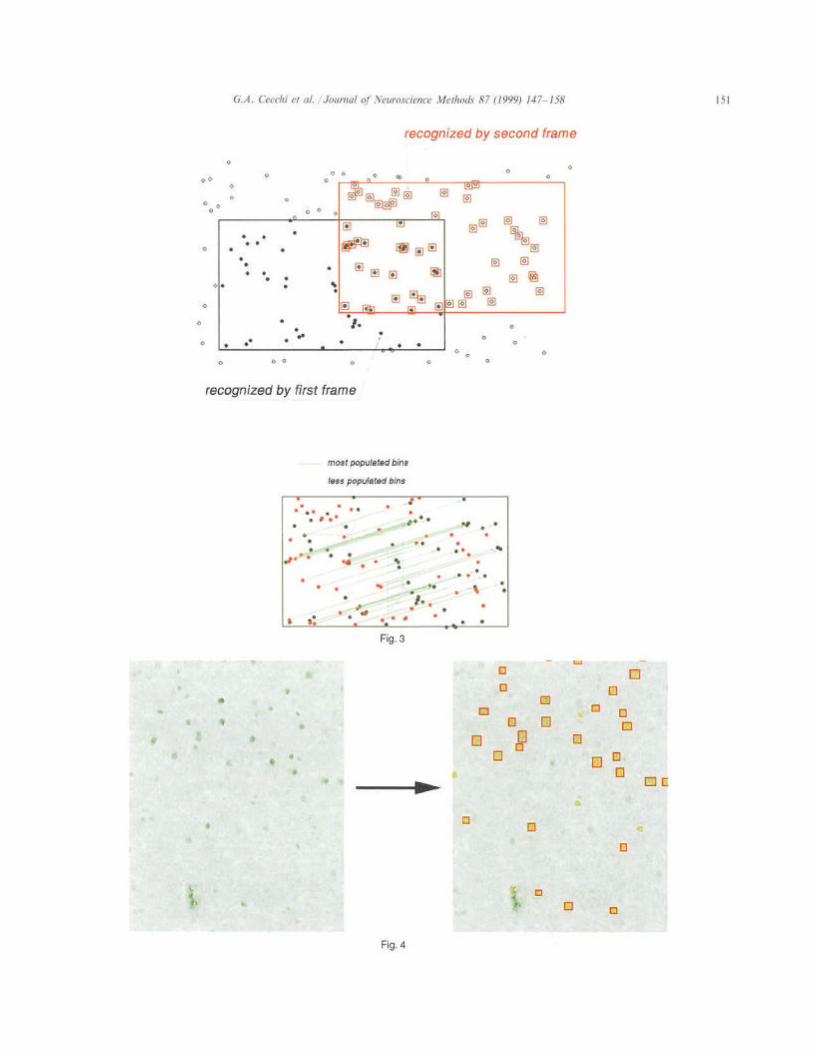
1. The first frame is selected as the origin of the coordinate system.
2. With the information provided by the stage, the next overlapping frame is selected. A histogram of inter-object distances between the frames is com- puted: using the relative position of the objects in each frame (equivalently, superimposing the frames), the vectorial distance is computed between each object in one frame and every object in the other frame; the resulting x, y values are then added to the x and y histograms.
3. The most populated bins in x and y are chosen, so that the corresponding values form the distance vector between the frames. This vector is used to correct the inter-frame distance provided by the stage (Fig. 3).
4. These inter-frame distance vectors are used to re- constitute the final image of the entire area of interest, iterating the process for all successive frames. We have estimated that the reconstruction error of this method is less than 1 pm in 500 pm of scanned tissue.
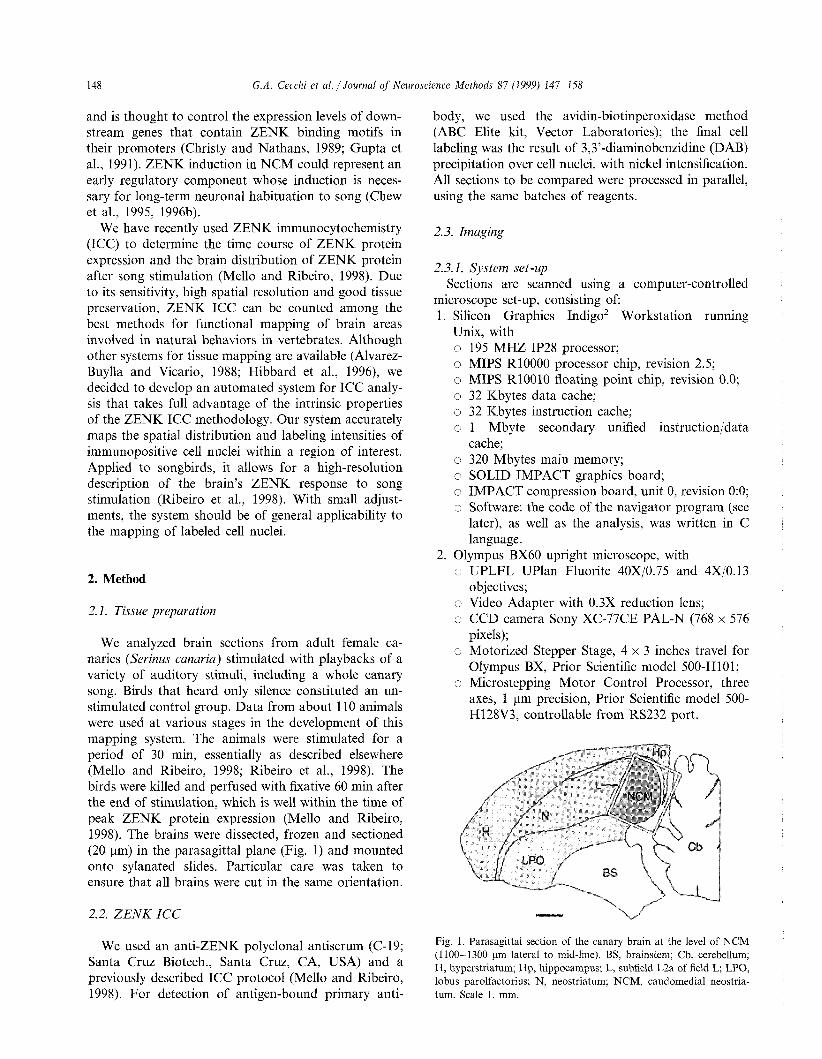
After this off-line processing, the final image is stored as a JPEG compressed movie file, with 1008 x 1008 pixels frames. To avoid discrepancies on the borders, there is an overlap between consecutive frames of 100 pixels. For a typical NCM (1 pm x 1.5 pm), the final movie file is around 8 MBytes in size, and the whole process takes about 10 min.
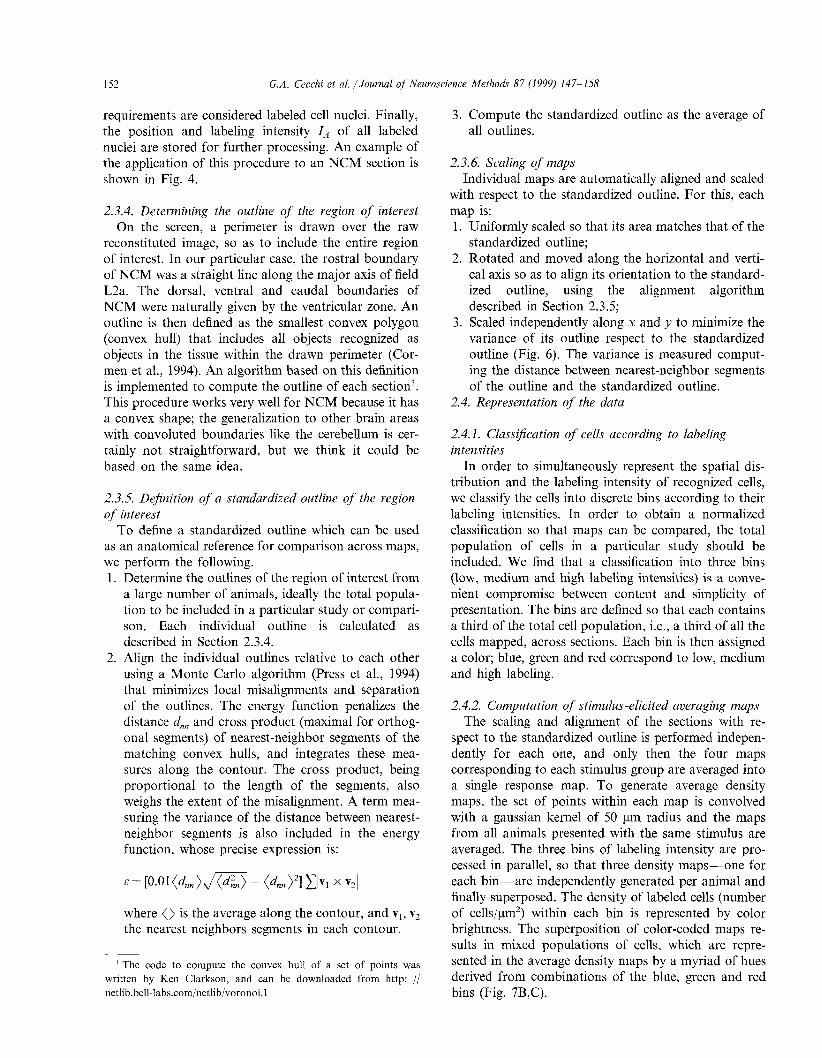
2.3.3. Description of recognition algorithm For each pixel, we measure the optical density (O.D.)
resulting from DAB-nickel precipitation. To imple- ment an edge detector, we first approximate the 'lapla- cian' of the image by multiplying each pixel value by alz, where a and z are, respectively, the variance and mean intensity on a 3 x 3 kernel centered at each pixel. The image thus obtained has peaks where the variation of the intensity relative to the local mean (in the scale of 1 pm) is high, and valleys where the relative varia- tion is low. Therefore, it works as an effective detector of edges whose length scale is in the order of 1 pm, compatible with the definition of the nucleus border under the microscope. The resulting images are then processed for object recognition, based on an algorithm
previously described (Bourdieu et al., 1995). The sup- port S of each object is computed filling the contours produced by the 'laplacian' (typically 'rings' for labeled nuclei). Anything outside the objects' support is consid- ered as tissue, on which the average (non-specific) back- ground labeling is computed. For each recognized object, we compute:
The ellipse E with constant intensity that best fits the shape and intensity distribution on the support. This is done by diagonalizing the inertia matrix, N, = 1 i(klj(k)I(k) - ( i ) o ) M
k s s (1)
where i(k), j(k) is the x, y position of pixel k, I(k) its intensity, and
-
k s s
M = C I(k) k t s
(4)
The eccentricity, as the ratio of the radia of E (eigenvalues of N,),
The variance of the actual contour respect to the contour of E,
where 4(k) = 1 if k is outside E, and 0 otherwise; $(t) = 1 if t is outside S, 0 otherwise; and MT is the total number of pixels in S. The variance of the intensity in S,
The labeling intensity relative to the average back- ground labeling B,
These measurements are then used to filter the ob- jects: 3 pm 5 diameter 5 10 pm; Ec 2 0.3; Vc 50.5; VI 5 1.5; I, 2 1.4; only objects satisfying all of these
152 G.A. Cecchi et al. /Journal of Neuroscience Methods 87 (1999) 147-158
requirements are considered labeled cell nuclei. Finally, the position and labeling intensity I, of all labeled nuclei are stored for further processing. An example of the application of this procedure to an NCM section is shown in Fig. 4.
2.3.4. Determining the outline of the region of interest On the screen, a perimeter is drawn over the raw
reconstituted image, so as to include the entire region of interest. In our particular case, the rostra1 boundary of NCM was a straight line along the major axis of field L2a. The dorsal, ventral and caudal boundaries of NCM were naturally given by the ventricular zone. An outline is then defined as the smallest convex polygon (convex hull) that includes all objects recognized as objects in the tissue within the drawn perimeter (Cor- men et al., 1994). An algorithm based on this definition is implemented to compute the outline of each section'. This procedure works very well for NCM because it has a convex shape; the generalization to other brain areas with convoluted boundaries like the cerebellum is cer- tainly not straightforward, but we think it could be based on the same idea.
2.3.5. De$nition of a standardized outline of the region of interest
To define a standardized outline which can be used as an anatomical reference for comparison across maps, we perform the following. 1. Determine the outlines of the region of interest from
a large number of animals, ideally the total popula- tion to be included in a particular study or compari- son. Each individual outline is calculated as described in Section 2.3.4.
2. Align the individual outlines relative to each other using a Monte Carlo algorithm (Press et al., 1994) that minimizes local misalignments and separation of the outlines. The energy function penalizes the distance d,, and cross product (maximal for orthog- onal segments) of nearest-neighbor segments of the matching convex hulls, and integrates these mea- sures along the contour. The cross product, being proportional to the length of the segments, also weighs the extent of the misalignment. A term mea- suring the variance of the distance between nearest- neighbor segments is also included in the energy function, whose precise expression is:
where () is the average along the contour, and v, , v, the nearest neighbors segments in each contour.
I The code to compute the convex hull of a set of points was written by Ken Clarkson, and can be downloaded from http: // netlib.bel1-labs.com/netlib/voronoi. 1
3. Compute the standardized outline as the average of all outlines.
2.3.6. Scaling of maps Individual maps are automatically aligned and scaled
with respect to the standardized outline. For this, each map is: 1. Uniformly scaled so that its area matches that of the
standardized outline; 2. Rotated and moved along the horizontal and verti-
cal axis so as to align its orientation to the standard- ized outline, using the alignment algorithm described in Section 2.3.5;
3. Scaled independently along x and y to minimize the variance of its outline respect to the standardized outline (Fig. 6). The variance is measured comput- ing the distance between nearest-neighbor segments of the outline and the standardized outline.
2.4. Representation of the data
2.4.1. Classification of cells according to labeling intensities
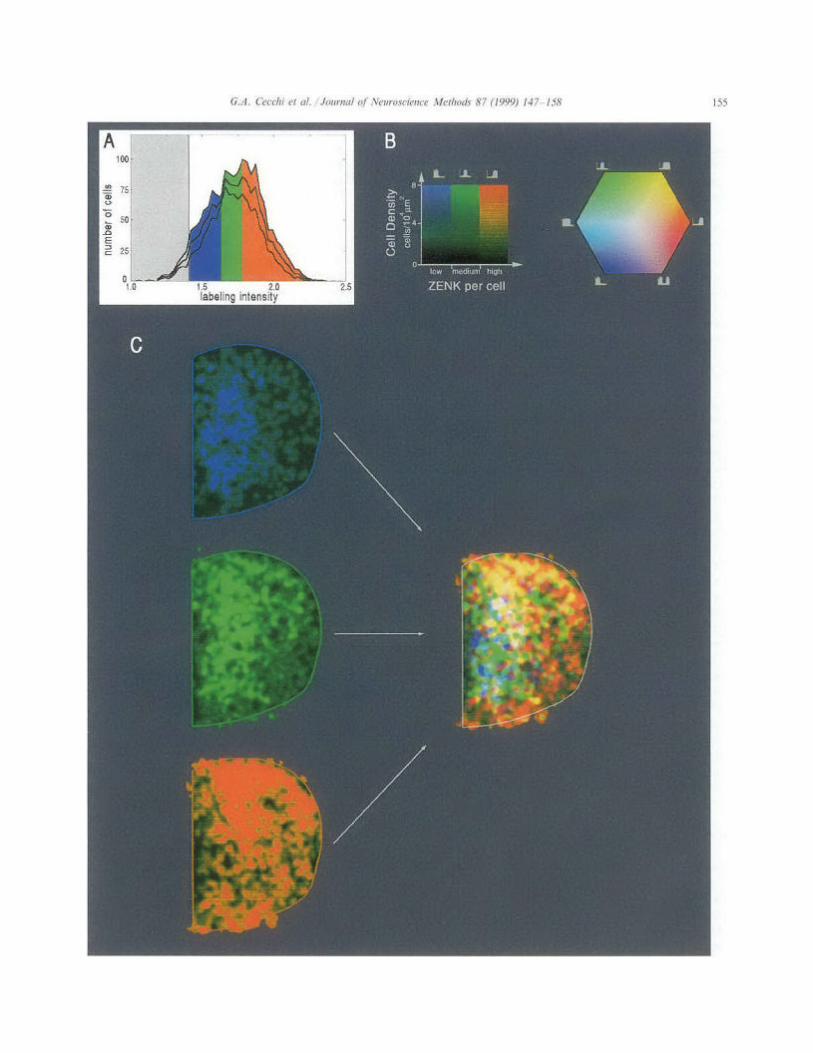
In order to simultaneously represent the spatial dis- tribution and the labeling intensity of recognized cells, we classify the cells into discrete bins according to their labeling intensities. In order to obtain a normalized classification so that maps can be compared, the total population of cells in a particular study should be included. We find that a classification into three bins (low, medium and high labeling intensities) is a conve- nient compromise between content and simplicity of presentation. The bins are defined so that each contains a third of the total cell population, i.e., a third of all the cells mapped, across sections. Each bin is then assigned a color; blue, green and red correspond to low, medium and high labeling.
2.4.2. Computation of stimulus-elicited averaging maps The scaling and alignment of the sections with re-
spect to the standardized outline is performed indepen- dently for each one, and only then the four maps corresponding to each stimulus group are averaged into a single response map. To generate average density maps, the set of points within each map is convolved with a gaussian kernel of 50 pm radius and the maps from all animals presented with the same stimulus are averaged. The three bins of labeling intensity are pro- cessed in parallel, so that three density maps-one for each bin-are independently generated per animal and finally superposed. The density of labeled cells (number of cells/pm2) within each bin is represented by color brightness. The superposition of color-coded maps re- sults in mixed populations of cells, which are repre- sented in the average density maps by a myriad of hues derived from combinations of the blue, green and red bins (Fig. 7B,C).

G.A. Cecchi et al. /Journal of Neuroscience Methods 87 (1999) 147-158
Fig. 5. Number of cells per intensity bin recognized by the system (hollow bars) and false negatives relative to exhaustive search by human observers (light shade). The dark shade indicates false negatives with intensities above 1.2 relative to background. The number of false negatives is less than 7% of the total number of cells with intensity above 1.2, although it is 14% relative to the first bin and decreases very fast for higher intensities. The arrows indicate the chosen intensity cut-off (right) and the lowest reliable cut-off (left).
For each particular stimulus in our study (a total of 20), one section from each of the four different animals was mapped and included in the average map. The only criterion to select a section was its position relative to the mid-line (1100-1300 pm), so that all sections were comparable across animals. We decided to apply a lower intensity cut-off, so that only cells with labeling above 1.4 times the background labeling were considered. This strategy proved to be satisfactory for the discrimination of the stimulus-elicited maps; however, we will discuss in Section 3 the possibility of lowering the cut-off while preserving a reasonable reliability in nuclei recognition.
2.4.3. Testing the reliability of the system To assess the reliability of the recognition procedure,
we tested it in comparison with trained experimentalists. A selected test region of a NCM section was scanned by the system to recognize cells labeled above the back- ground. On the same region, an exhaustive search of labeled cells was performed, using a consensus criterion between two subjects. The result of this search was then compared with the automatic procedure.
To test the reliability of the scaling and alignment procedure, we computed the ratios of the areas defined by individual NCM maps to that of the standardized NCM outline. In addition, we superimposed the outlines defined by all the individual maps used for the determi- nation of the standardized NCM outline.
3. Results
The results reported here were obtained from the group of 80 animals used to develop the system.
To perform the test of reliability of nuclei recognition, we selected an area of approximately 450 pm x 900 pm in a section of an animal stimulated with song. The system identified 355 nuclei with labeling above back- ground in that region. The comparison with the exhaus- tive search is as follows.
In 10 cases, the system misrecognized two closely opposed cells, connected by an isthmus of high labeling, as a unique cell. The system failed to recognize 96 cells (false nega- tives); all of these false negatives represent cells with low labeling intensity, as can be appreciated in Fig. 5. The reliability within each bin is high for relative labeling above 1.2 (86%) and increases to almost 99% for intensities above 1.4. This is consistent with the 20% (STD) variability of the background label- ing that we have observed across all sections, i.e. the choice of a unique background labeling per section precludes the recognition of weak cells.
As mentioned in Section 2.4.2, for our particular study, we set the lower cut-off for cell labeling intensity at 1.4 above background, which represents a reliability of 99%; nevertheless, the test shows that the cut-off could be confidently lowered to 1.2.

154 G.A. Cecchi et al. /Journal of Neuroscience Methods 87 (1999) 147-158
A Superposition of Standardized NCM The total population of labeled cells observed in the ~ l l Outlines Outline 80 animals was 36 000. The ranges of labeling intensity
to equally populate the three intensity bins were 1.40- 1.62 (blue), 1.62- 1.77 (green), and 1.77-2.68 (red). Fig.
- D 7C depicts how the maps of the three bins of labeling intensity were superimposed so as to generate an aver- age density map of the four animals stimulated with a whole song. In this final map, therefore, numbers of labeled nuclei are represented within three ranges of activation. It should be stressed that density maps do not
_, __ __ - *_I _- ,a,, ..* 1" *- _X. - represent pixels or densitometric unit per area, but rather, absolute numbers of labeled nuclei per unit area.
Individual Map Note that for the particular stimulus in Fig. 7C, a whole song, the three intensity populations are not balanced,
. . because the song elicits a strong response, resulting in a . . predominance of the red bin (high expression level). As
. . Alignment detailed elsewhere (Ribeiro et al., 1998), a classification Scaling of the cell nuclei population into three discrete bins of
labeling intensity provides essential information for the
1.80 1 I 0.0 20.0 40.0 60.0 80.0
section number
Fig. 6. (A) Scheme of alignment and scaling algorithm. The top part shows how the standardized NCM outline is extracted from the superposition of several (80) NCM outlines, after their alignment and scaling. The bottom part shows how individual maps are aligned and scaled respect to the standardized NCM outline. (B) Areas of individ- ual outlines after alignment and scaling are plotted relative to the area of the standardized NCM outline.
The efficacy of the scaling and alignment procedure can be appreciated in Fig. 6. Panel A shows how close individual outlines are aligned relative to the standard- ized outline after the procedure. Panel B shows that the areas of individual outlines approximates that of the standardized outline.
discrimination O~-ZENK expression patterns resulting from different auditory stimuli.
Finally, the interanimal variability in terms of cell labeling intensities was small within each stimulus group. This is shown in Fig. 7A, which depicts the distribution of labeling intensities for the group of animals stimulated with a whole song. The same is also true for several other auditory stimuli, as reported elsewhere (Ribeiro et al., 1998). Thus, different auditory stimuli elicit distinct labeling distributions, reflecting the specificity of NCM responsiveness; in consequence, the different stimuli can be rather easily discriminated by their characteristic profiles.
4. Discussion
We have described here a procedure that allows us to perform automated recognition and quantification of labeled nuclei using ICC. We would like to discuss two separate classes of problems that we had to deal with: quantification of ICC labeling and automated recogni- tion of labeled nuclei. /
4.1. Quantijication of ICC labeling
We used an ICC protocol based on the deposition of DAB, a chromophore that provides stable staining under bright field illumination, and can therefore be examined repeatedly over extended periods of time (Kugler, 1990).
Fig. 7. (A) Distribution of ZENK-labeled cells resulting from presentation of a whole song. The central line indicates mean values of the number of cells with a given labeling intensity, while the upper and lower lines represent the variance ( + S.E.M.). The shaded area indicate the lower cut-off adopted; the colored areas indicate the color-coding ranges according to three bins of labeling intensities (blue, 1.4-1.62; green, 1.62-1.77; red, 1.77-2.68; for the determination of these values, see Section 3). (B) The key on the left shows how brightness in each of the three color-coded ranges reflects cell density; the key on the right indicates how mixed cell populations result in various color mixtures. (C) Map of ZENK expression in NCM of canary resulting from stimulation with a whole song. The separate density maps for each of the three labeling intensity bins are shown on the left. The map resulting from the superposition of the three partial maps is shown on the right.
156 G.A. Cecchi et al. /Journal of Neurosc ience Methods 87 (1999) 147-158
Due to the non-linearity of DAB deposition, one can- not directly infer the precise protein content of labeled nuclei. For classifying nuclei into discrete bins of label- ing intensities, however, the only assumption needed is that the staining levels be monotonic with the amount of protein. Alternatively, fluorescent detection systems could minimize the non-linearity issue, but present their intrinsic disadvantages, particularly the short-lived light emission after ultraviolet excitation. Irrespective of the detection system employed, quantification of ICC label- ing is not a trivial task, and a substantial amount of work is required to solve the issue of variability. We have identified and addressed four main variability sources, which we discuss in detail.
4.1.1. Labeling variability It is well known that local differences in tissue perfu-
sion and fixation, as well as access to reagents during the ICC procedure, can have a strong influence on ICC staining levels. It is therefore essential to minimize these factors by reacting all sections in parallel, with the same batch of reagents. Any remaining differences have to be dealt with by using a normalization procedure. We have previously described that background labeling in our system is independent of specific cell labeling, as it persists when the primary antibody is pre-absorbed with its specific antigen, or even when incubation with the primary antibody is omitted from the ICC proce- dure (Mello and Ribeiro, 1998). We have therefore normalized cell labeling values to that of the back- ground labeling. An alternative procedure commonly adopted to address labeling variability consists of nor- malizing labeling respective to a different brain area. This has the drawback of potentially accentuating vari- ations in staining due to different access to perfused fixative, different position in the reaction vial, and differences in the response of different brain areas to the experimental condition (in our case, song stimula- tion). Our mapping procedure allows us to compute the precise value of background labeling, and therefore to normalize labeling to the background within the region mapped. To our minds, this is a more rigorous way of dealing with the issue of labeling variability.
4.1.2. Human error in the ident8cation of labeled cells A major concern we had at the beginning of our
work was the unreliability of humans to map a very large number of cells, over long periods of time (weeks to months), while using a consistent set of criteria. Our computerized system applies a single set of criteria for cell recognition to all maps, allowing for the compari- son of animals presented with different stimuli, or mapped at different times.
4.1.3. Histological variability Even when extreme care is taken to cut the brains
from different individuals in the same anatomical plane, it is inevitable that some variability results in section size, shape and orientation. Any attempt to compare sections across different animals must deal with this issue. Our scaling and alignment procedure in reference to a standardized outline of the region of interest allows us to normalize the entire data set in terms of size, shape and orientation of sections. Notice that the al- gorithm used for alignment and scaling does not de- pend on the ICC labeling patterns, but rather takes into account only the anatomical boundaries of the region of interest; this precludes the introduction of bias in the procedure, due to differential tissue responsiveness.
4.1.4. Intrinsic interanimal variability After minimizing or eliminating the main extrinsic
sources of variability, one still has to face the inter-indi- vidual variability of responses within the region of interest. We dealt with this issue by averaging the data of all animals per stimulus group. As the experimental procedure requires that the animal be killed, there is a limitation in the number of stimuli that can be reason- ably compared in a single study. This sets the limits of applicability of the ZENK mapping procedure for physiological studies, since a minimum number of ani- mals must be used per condition or stimulus to guaran- tee a meaningful interpretation. In the case of auditory responses in NCM, including four animals per group is sufficient to grant statistical confidence to the differ- ences observed across groups (Ribeiro et al., 1998).
4.2. Automated detection of labeled nuclei
The automated detection of ICC labeled nuclei in our system is an iterative process. For a first and rough detection of labeled objects in the tissue, we employ a low cutoff for the 'laplacian', or gradient of labeling intensity, so that labeled nuclei as well as similarly stained debris are included. This is more efficient than using directly the value of labeling intensity, as it eliminates artifactual objects with high labeling levels but fuzzy boundaries. Next, a set of restrictive filters is used to refine the initial selection. Finally, a more stringent cut-off for labeling intensities is applied, that takes into account the background staining variance. It should be pointed out that no single criterion is enough for a reasonable recognition of labeled cells; when applied in conjunction; however, the series of filters is highly efficient. Interestingly, the development of the system itself consisted of an initial educated guess of what should be the different filters and their values; with successive trials, the filter values became gradually more stringent.
Our automated system reliably recognizes 80-90% of the cells identified by trained human observers that have labeling intensities 20% above the background.

G.A. Cecchi et al. /Journal of Neuro science Methods 87 (1999) 147- 158 157
Even though tissue artifacts affect the recognition to a minor extent, the main source of discrepancies are weakly labeled cells. Human observers have particular difficulty in consistently identifying cells with low label- ing and deciding how they compare with tissue back- ground; this issue is easily solved by the automated system. On the other hand, the system has some difficulties in identifying weakly labeled cells where the labeling is spatially restricted to a small domain within the nucleus, or in separating closely opposed cells. The net result of the discrepancies between the human ob- servers and the automated mapping system is an under- estimation of the number of labeled nuclei by the latter. There are, however, considerable advantages of the automated system that constitute a satisfactory trade- off, including:
criteria consistency, accurate spatial localization, quantification of labeling intensities, and the ability to quickly process massive amounts of data. Attesting to the usefulness of the system, the infor-
mation it generated for the mapping of the ZENK responses in NCM to various auditory stimuli was enough to provide for a full classification of the result- ing ZENK expression patterns (Ribeiro et al., 1998).
Regarding the applicability of this method to areas with a more complex anatomy, we wish to discuss two different aspects. First, as already mentioned, NCM is a convex area, which helped in the computation of the boundary and, subsequently, in the comparison and averaging of sections from different animals. Convo- luted boundaries, like that of the cerebellum, cannot be naturally approximated by the convex hull of the tissue. There are, nevertheless, formal extensions of the convex hull, like the a-shape (Edelsbrunner et al., 1983), which could be implemented in dealing with non-convex out- lines. The second aspect is the reconstruction of the three-dimensional anatomy of an entire brain area of a single animal, and eventually the comparison of this 3D structure across animals. This is a more difficult task, given the lack of guidelines as to how successive sec- tions should be stacked. For particular brain areas, the problem could be attacked on the basis of prior knowl- edge on the anatomy. This problem notwithstanding, our method can provide the basis for any attempt towards the reconstruction of entire neuronal networks undergoing genomic activity in the brain.
Acknowledgements
We thank A. Alvarez-Buylla for lending his micro- scope in the initial phases of the project, and Bozenka Glatt and Kostadinka Arissian for helping in the aqui- sition of our optical table. Work supported by the
Mathers Foundation (MM), Kluge and CNPq Fellow- ships (SR) and NIDCD Grant # 02853 (CVM).
References
Alvarez-Buylla A, Vicario D S. Simple microcomputer system for mapping tissue sections with the light microscope. J Neurosci Methods 1988;25: 165-73.
Bourdieu L, Magnasco MO, Winkelman DA, Libchaber A. Actin filaments on myosin beds: The velocity distribution. Phys Rev E 1995;52(6):6573-9.
Chaudhuri A. Neural activity mapping with inducible transcription factors. Neuroreport 1997;S:III.
Chew SJ, Mello C, Nottebohm F, Jarvis E, Vicario DS. Decrements in auditory responses to a repeated conspecific song are long-last- ing and require two periods of protein synthesis in the songbird forebrain. Proc Natl Acad Sci USA 1995;92:3406-10.
Chew SJ, Vicario DS, Nottebohm F. A large-capacity memory sys- tem that recognizes the calls and songs of individual birds. Proc Natl Acad Sci USA 1996;93:1950-5.
Chew SJ, Vicario DS, Nottebohm F. Quanta1 duration of auditory memories. Science 1996;274:1909-14.
Christy B, Nathans D. DNA binding site of the growth factor-in- ducible protein Zif 268. Proc Natl Acad Sci USA 1989;86:8737- 41.
Christy B, Lau L, Nathans D. A gene activated in mouse 3T3 cells by serum factors encodes a protein with 'zinc finger' sequences. Proc Natl Acad Sci USA 1988;85:7857-61.
Cormen TH, Leiserson CE, Rivest RL. Introduction to Algorithms. Cambridge, MA: The MIT Press, 1994.
Edelsbrunner H, Kirkpatrick DG, Seidel R. On the shape of a set of points in the plane. IEEE Trans Information Theory 1983;IT- 29(4):551-9.
Goelet P, Castelucci V, Schacher S, Kandel E. The long and the short of long-term memory T a molecular framework. Nature 1986;332:419-22.
Gupta MP, Gupta M, Zak R, Sukhatme V P. Egr-I, a serum-in- ducible zinc-finger protein, regulates transcription of the rat car- diac a-myosin heavy chain gene. J Biol Chem 1991;266:12813-6.
Hibbard LS, McCasland JS, Brunstrom JE, Pearlman AL. Auto- mated recognition and mapping of immunolabelled neurons in the developing brain. J Microsc 1996;183:241-56.
Iris Media Library Programming Guide. Silicon Graphics, 1994. Jarvis ED, Nottebohm F. Motor-driven gene expression. Proc Natl
Acad Sci USA 1997;94:4097-102. Jarvis ED, Schwabl H, Ribeiro S, Mello CV. Brain gene regulation
by territorial singing behavior in freely ranging songbirds. Neu- roreport 1997;8:2073-7.
Jin H, Clayton DF. Localized changes in immediate early gene regulation during sensory and motor learning in zebra finches. Neuron 1997;19:1049-59.
Kugler P. Enzyme histochemical methods applied in the brain. Eur J Morphol 1990;28:109-20.
Lemaire P, Revelant 0 , Bravo R, Charnay P. Two mouse genes encoding potential transcription factors with identical DNA-bind- ing domains are activated by growth factors in cultured cells. Proc Natl Acad Sci USA 1988;85:4691-5.
Mello CV, Clayton DF. Song-induced ZENK gene expression in auditory pathways of songbird and its relation to the song control system. J Neurosci 1994;14:6652-66.
Mello CV, Ribeiro S. ZENK protein regulation by song in the brain of songbirds. J Comp Neurol 1998;393:426-38.
Mello CV, Vicario DS, Clayton DF. Song presentation induces gene expression in the songbird forebrain. Proc Natl Acad Sci USA 1992;89:6818-22.
158 G.A. Cecchi et al. /Journal of Neuroscience Methods 87 (1999) 147-158
Milbrandt J. A nerve growth factor-induced gene encodes a possible Ribeiro S, Cecchi GA, Magnasco MO, Mello C V. Toward a song transcriptional regulatory factor. Science 1987;238:797-9. code: syllabic representation in the canary brain. Neuron
Morgan JI, Curran T. Stimulus-transcription coupling of neurons: role 1998;21:359-71.
of cellular immediate-early genes. Trends Neurosci 1989;12:459- Stripling R, Volman SF, Clayton DF. Response modulation in the 63 zebra finch neostriatum: relationship to nuclear gene regulation. J "b.
Nastiuk KL, Mello CV, George JM, Clayton DF. Immediate-early Neurosci 1997;17:3883-93.
gene responses in the avian song control system: cloning and Sukhatme VP, Cao X, Chang LC, Tsai-Morris CH, Stamenkovitch D, verreira PCP, Cohen DR, Edwards SA, Shows TB, Curran T,
expression analysis of the canary c-jun cDNA. Brain research. Mol LeBeau MM, Adamson ED. A zinc finger-encoding gene coregu-
Brain Res 1994;27:299-309. lated with c-fos during growth and differentiation, and after Nishimura T, Vogt P. The avian homologe of the oncogene jun. cellular depolarization. Cell 1988;53:37-43.
Oncogene 1988;3:659-63. Vates GE, Broome BM, Mello CV, Nottebohm F. Auditory pathways Press W, Teukolsky SA, Vetterling WT, Flannery BP. Numerical of caudal telencephalon and their relation to the song system of
recipes in C. Cambridge: Cambridge University Press, 1994. adult male zebra finches. J Comp Neurol 1996;366:613-42.