Embed Size (px)
Citation preview
- 1 -
Automated analysis of ARISA data using ADAPT system
Robert Schmieder1,2, Matthew Haynes3, Elizabeth Dinsdale3, Forest Rohwer3, and Robert Edwards1,3,4§
1Department of Computer Science, San Diego State University, San Diego, CA, USA
2Computational Science Research Center, San Diego State University, San Diego, CA,
USA
3Department of Biology, San Diego State University, San Diego, CA, USA
4Mathematics and Computer Science Division, Argonne National Laboratory, Argonne,
IL, USA
§Corresponding author
Email addresses:
- 2 -
Abstract Background A goal of microbial community profiling projects is to understand the influence of
environmental changes on microbial communities. Here, we present a computational
system consisting of the database ADAPTdb and the program ADAPT for the analysis of
Automated Ribosomal Intergenic Spacer Analysis (ARISA) data sets. ARISA is a method
for analyzing the composition of microbial communities that is both faster and cheaper
than other community profiling techniques. ARISA relies on the analysis of intergenic
regions called Internal Transcribed Spacers (ITS), which are located between the 16S and
23S rRNA genes. The analysis of the data produced by ARISA requires a reliable
resource of known ITS regions and the bioinformatics tools to enable researchers to
automatically analyze their data. ARISA data analysis steps include profile filtering, data
transformation, database searching, value calculations, and sample comparison.
Results 16S-ITS-23S regions along with information about the organisms that the sequences
came from are stored and maintained in the database ADAPTdb. The data in ADAPTdb
are retrieved from different data resources, including the SEED and NCBI sequence
databases. The program ADAPT takes the manual data analysis process and
automatically characterizes ARISA data sets using the data in ADAPTdb. Additional
information associated with each 16S-ITS-23S region in the ADAPTdb database is used
by ADAPT for pathogenic and autotrophic/heterotrophic comparisons of organisms
among different ARISA samples.

- 3 -
Conclusions The program is publicly available through a user-friendly web interface, which allows
onsite analysis of ARISA data sets and automatic computation of the graphical and
tabular output. The interactive web interface facilitates navigation through the outputs
and export functionality for subsequent analysis, and is available at
http://edwards.sdsu.edu/adapt/.
Background There are growing numbers of researchers interested in exploring the composition and
function of complete microbial community samples. Cloning and sequencing individual
genes such as the 16S rRNA gene is relatively time consuming and low throughput.
Random community genomics and metagenomics are high throughput but are more
expensive. Fingerprinting methods such as Automated Ribosomal Intergenic Spacer
Analysis (ARISA, Figure 1A) [1] provide a cheap and convenient method to visualize the
temporal and spatial changes occurring in microbial communities. ARISA analyzes the
length of the intergenic spacer region between 16S and 23S rRNA genes (called ITS
region) present in almost all Bacteria and Archaea (Figure 1B). ARISA has been used
successfully to analyze several bacterial communities, including samples from freshwater
[1, 2], marine [3-9], and terrestrial environments [10-12]. It has been proven valuable in
clinical studies to detect and identify microbial species [13-15], and to differentiate
between closely related bacterial species [16, 17].
Here, we present ADAPT, a system designed for ARISA data analysis and the only
online resource capable of highlighting differences in community structure based on the
metadata associated with the organisms. The system provides a regularly updated
database of annotated 16S-ITS-23S regions (ADAPTdb) and a web-based program
- 4 -
(ADAPT) to automatically characterize the taxonomic composition of environmental
samples based on ARISA data sets mapped to the database. The taxonomic profiles
computed by ADAPT allow the user to compare samples to reveal the differences in
taxonomic composition of the underlying communities. Additionally, the system enables
the classification of the source organisms predicted by the 16S-ITS-23S regions into
autotrophic or heterotrophic types, and the prediction of whether the source organisms
are pathogenic.
Software design and computational platform The software system developed in this project consists of the ARISA data analysis
program (ADAPT) and the ADAPTdb database of annotated 16S-ITS-23S regions. The
system was designed in a two-tier architecture, consisting of bottom-tier (database
backend) and top-tier (analytical frontend). The two-tier approach was chosen to achieve
a less complex architecture and to allow rapid development. The bottom-tier provides
mechanisms for data storage and retrieval and consists of a relational database and server
(MySQL; Sun Microsystems, Santa Clara, CA) that provides fast access to the data. The
top-tier is responsible for the interaction with users. It receives input data, interacts with
the bottom-tier and presents the results via a user-friendly interface. In the
ADAPTdb/ADAPT system, the frontend layer is separated into a client-server
architecture, the ADAPTdb scripts on the user client and the ADAPT web interface on
the web server.
The frontend was implemented in Perl 5.8 using the following modules: Perl Database
Interface (DBI) module and its MySQL-specific DBI driver module DBD::mysql,
Common Gateway Interface (CGI) module, Graphics Draw (GD) module, Applied
- 5 -
Biosystems, Inc. Format (ABIF) module, and Algorithm::CurveFit module. The DBI and
DBD modules are used to communicate queries to the MySQL database and fetch
responses. The CGI module is used to generate the HTML content, and to input and
output data from and to the web interface. The GD module is used to generate the images
of the result charts. The ABIF module is used to read and parse the ABIF files, and lastly,
the Algorithm::CurveFit module is used to predict the fragment length of fragments
larger than the size standards.
The ADAPT web interface is currently running on a PC server with Fedora Linux using
an Apache HTTP server to support the web services. The web interface provides a high
level of compatibility with heterogeneous computing environments.
Cron jobs running on the server allow automatic updates by calling the update functions
of the ADAPTdb frontend layer to retrieve new data from the external data resources as
described below.
ADAPTdb data collection The generation of the ADAPTdb database was divided into two main steps. In the first
step, different external data resources were mined to identify valid 16S-ITS-23S regions
along with information about their source organisms. For this step, we were using the
NCBI Genome database [18] and the SEED database [19] as data resources. In the
second step, the 16S-ITS-23S regions and organism metadata were saved persistently in
the MySQL database.
Data from NCBI Genome database The NCBI Genome database contained sequence and organism data from 1,211 bacterial
and 76 archaeal species (as of May 30, 2009) [18, 20]. Data was retrieved from NCBI as

- 6 -
GenBank format (GBK) files using ESearch and EFetch from the Entrez Programming
Utilities (eUtils) [21, 22]. After retrieving the GBK files, each file was examined for 16S
and 23S rRNA annotations using regular expressions for "16S ribosomal RNA", "23S
ribosomal RNA", "16S rRNA", "23S rRNA", and their variants. Files that contained 16S
and 23S rRNA annotations were then parsed to find the feature type "rRNA" and checked
for descriptions containing "rRNA" or "ribosomal RNA" (usually in the "/product="
definition). The descriptions that contained “16S” represented 16S regions and those that
contained “23S” represented 23S regions. These regions were validated as described
below.
Data from the SEED database The SEED database contained 990 bacterial and 64 archaeal completely sequenced and
annotated genomes (as of May 30, 2009) [23]. Simple Object Access Protocol (SOAP)
web services were used to retrieve the annotation and sequence data from the SEED
database (Edwards et al., in preparation). Retrieved data was parsed to find valid 16S-
ITS-23S regions using a different algorithm than parsing the data retrieved from NCBI.
First, all RNAs in the genome data were recovered using the rnas_of() SOAP remote
procedural call (RPC). Annotations containing "SSU rRNA" and "LSU rRNA" were
extracted by using the function_of() RPC. Here, “SSU rRNA” regions were 16S regions
and “LSU rRNA” regions were 23S regions.
Find valid 16S-ITS-23S regions Finding valid 16S-ITS-23S regions among the data retrieved from remote sites required
additional steps. First, all the 16S and 23S rRNA gene regions that lay on the same contig
were identified. Overlapping regions on the same strand (16S with 16S, 23S with 23S,
- 7 -
16S with 23S) were discarded since these likely resulted from incorrect annotations.
Valid regions on the same contig met the following criteria: (a) 16S region before 23S on
forward strand; (b) 16S region after 23S on reverse strand; (c) 16S and 23S regions are
each at least 300 bp long; (d) distance between 16S and 23S regions is less than 3,000 bp
long. This process was repeated for every 16S gene. Only ITS regions that are less than
3,000 bp long were considered because it is very unlikely that bacterial or archaeal
genomes contain long sequences that are not coding for something, and such long regions
are probably due to incorrect or missing annotations.
Metadata retrieval If the entry of the external data resource contained at least one valid 16S-ITS-23S region,
additional information was extracted for this entry, such as the organism name,
taxonomy, NCBI taxonomy identifier (taxid), unique data resource accession number,
and 16S and 23S rRNA gene annotation information (contig, strand, start and stop
position). To retrieve the pathogenesis information for each organism entry, we used the
Lproks.txt file from the NCBI FTP server [24]. This file contained information about the
pathogenesis of Bacteria whose genomes were completely sequenced and in the NCBI
Genome database. If available, additional information about pathogenic hosts or targets
was extracted from this file.
The information about potential pathogenesis of the organisms in the ADAPTdb database
was available from constantly updated data resources, such as the Lproks file. However,
the autotrophic/heterotrophic classification was not available online in such a file. A
system for trophic (autotrophic and heterotrophic) level classification was developed
based on the phyla of the organisms in the database. All organisms stemming from the

- 8 -
same phyla were defined as having the same trophic type (Table 1) . Proteobacteria, for
example, can either grow as heterotrophs or facultative autotrophs depending on the
environmental conditions, but they were classified as heterotrophs in this work to allow a
unique classification for each phylum.
Data analysis using ADAPT ADAPT is a web-based program for the analysis of ARISA data sets. The program uses a
fingerprint database (ADAPTdb) to predict the taxonomic composition of the underlying
microbial communities and to perform trophic and pathogenic comparisons of the
samples from which the ARISA data were obtained. The results of the analysis are
displayed in the form of tables and charts.
Input data Currently, ADAPT is able to parse different file formats for data input, including raw
ABI data provided in .fsa or .ab1 files, or text files containing the extracted ARISA
profile data (usually .txt or .tsv files). It is possible to select more than one input file to
analyze multiple data sets simultaneously. The data parsing of raw ABI files requires
more steps than the parsing of text files. The additional steps include baselining,
smoothing, peak identification, and size calibration. The baselining step is used to ensure
the data has a linear baseline parallel to the horizontal axis. This is required for the
fluorescence intensity threshold filtering of the data, applied later. The smoothing step
removes local noise from the trace file peaks, enabling easier peak identification. The
previous steps and the peak identification are performed for both the sample and the size
standards extracted from the ABI file. After the extraction of the peak positions, the size
- 9 -
standards are used to calibrate the sample data and calculate the fragment length for each
peak.
These steps result in an ARISA profile for the sample. Alternatively, the user may supply
their own profile, or one that was saved from an earlier analysis. The strategy for
analyzing these ARISA profiles with ADAPT can be divided into three steps: (1) profile
filtering of input trace files, (2) database search, and (3) calculating the outputs.
Additionally, ADAPT is able to perform multiple sample analysis in the third step if
more than one sample is provided in the ARISA data sets.
(1) Profile filtering The profile filtering removes noise and uninformative peaks using user-specified
threshold parameters. These parameters include the fragment length range (to filter out
peaks that would give fragments that are too short or too long) and the fluorescence
intensity or peak-height threshold (to exclude background fluorescence with an intensity
too close to the baseline). The fluorescence intensity threshold is automatically calculated
or set to a fixed value. If the user combines both options, the higher value will be used as
threshold.
(2) Database search After filtering the profiles, ADAPT performs a database search using the fragment
lengths from the ARISA profile and the user-provided primer set. The primer set is used
to calculate the expected fragment length from the database entries. The fragment lengths
of the ARISA data are then mapped to the fragment lengths of the database entries to find
similar regions.
- 10 -
Differences in the fragment analysis machines and methods used to generate the ARISA
profiles can cause variability. Since the DNA in the ARISA samples is separated by gel
electrophoresis, each band is a distribution across the gel. Moreover, the size standards
are not evenly distributed through the length of the electropherogram. Therefore, the
length of the fragment associated with each peak is a distribution of likely lengths and the
length of every fragment cannot be determined with 100% accuracy. Furthermore, two
fragments of identical length could erroneously result in peaks representing two different
lengths.
ADAPT uses a binning strategy to address this type of variability, and to compensate for
inexact matches during the mapping to database entries. The user is required to set a bin
value b. For an ARISA fragment of length l, all database entries within a length window
of l ± b are grouped into the same bin. Therefore, a bin value of 0 would only allow exact
matches. Since the inaccuracy of gelelectrophoresis increases as the fragment length
increases (largely from diffusive band spreading) [6], different bin values should be used
for different fragment lengths. To reduce the complexity, users are only able to set bin
values for certain fragment length intervals of < 600, from 600 to 899, and > 899 bp.
After setting the bin values for the length intervals, the database is queried for each input
length in its bin. A length of 400 bp and a bin value of three, for example, would query
the database for fragments within the length window from 397 bp to 403 bp and use the
values found for further calculations.
Additionally, ADAPT allows the use of filters before mapping the input fragment length
against the database entries. The user specifies which database entries should be used

- 11 -
based on taxonomy and origin of the data (external data resource such as SEED and
NCBI).
(3) Output calculation The ADAPTdb database contains taxonomic information for the organisms associated
with each 16S-ITS-23S region, which is used to characterize the taxonomic composition
of the original microbial sample and to calculate autotrophic/heterotrophic and
pathogenic/non-pathogenic fractions. The fraction calculations are based on the
taxonomic profiles and fluorescence intensity (peak height) information of the input
ARISA data sets. The fluorescence intensity indicates the number of fragments with the
same length, which is interpreted as the number of organisms with a fragment of this
particular length. The intensity is used to weight each fragment length in the taxonomic
profile for a quantitative interpretation of the ARISA profiles.
Many genomes contain multiple 16S-ITS-23S regions (Table 2). For example,
Escherichia coli K12 contains seven regions. A filter has been added to restrict the data
analysis output to those cases where every 16S-ITS-23S region in the genome is found in
the sample. This results in a more accurate approach to identify species based on all 16S-
ITS-23S regions than on only one region.
ADAPT implements an average fraction calculation to perform autotrophic/heterotrophic
and pathogenic/non-pathogenic comparisons. The fractions are calculated in the same
manner for both comparisons. For each fragment length in an ARISA profile, the
fluorescence intensity is represented as a percentage of the total fluorescence intensities
from the whole sample. The number of database entries that match each fragment length
(in its bin) from each trophic type is normalized to the total number of database entries
- 12 -
that match that fragment length. The product of this fraction and the percentage
fluorescence intensity defines the proportion of each trophic type for each fragment
length in the ARISA profile, and the sum of all these fractions describes the overall
community.
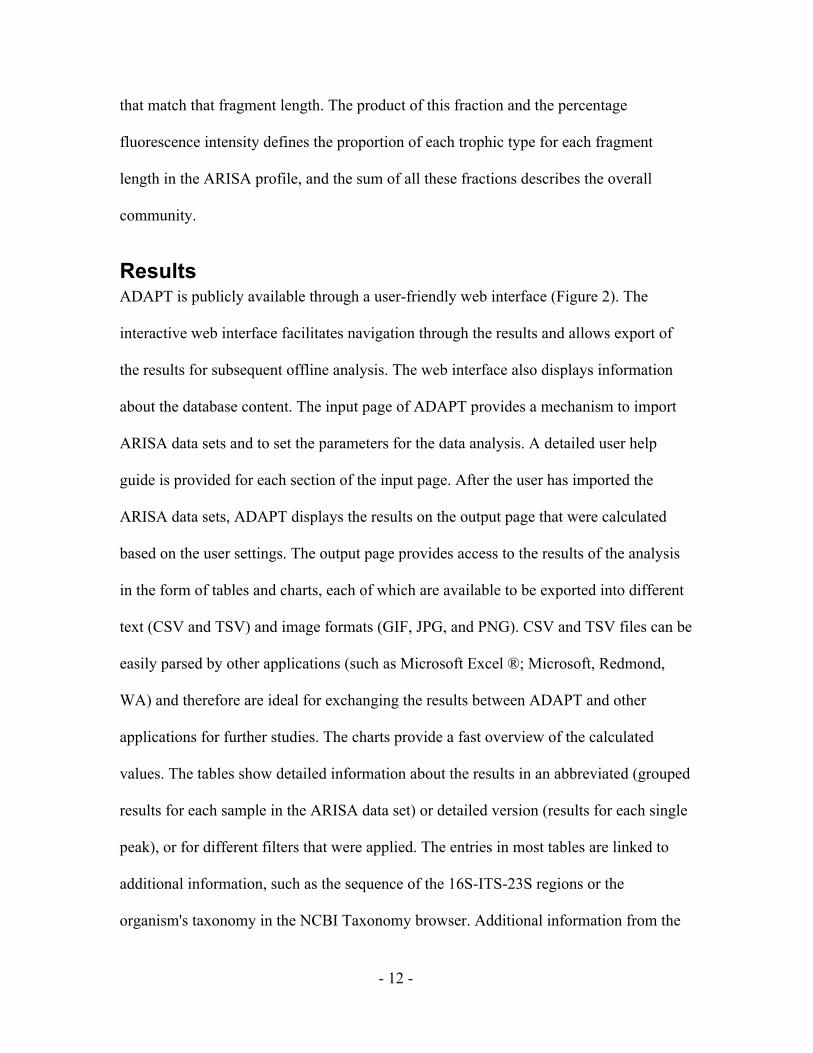
Results ADAPT is publicly available through a user-friendly web interface (Figure 2). The
interactive web interface facilitates navigation through the results and allows export of
the results for subsequent offline analysis. The web interface also displays information
about the database content. The input page of ADAPT provides a mechanism to import
ARISA data sets and to set the parameters for the data analysis. A detailed user help
guide is provided for each section of the input page. After the user has imported the
ARISA data sets, ADAPT displays the results on the output page that were calculated
based on the user settings. The output page provides access to the results of the analysis
in the form of tables and charts, each of which are available to be exported into different
text (CSV and TSV) and image formats (GIF, JPG, and PNG). CSV and TSV files can be
easily parsed by other applications (such as Microsoft Excel ®; Microsoft, Redmond,
WA) and therefore are ideal for exchanging the results between ADAPT and other
applications for further studies. The charts provide a fast overview of the calculated
values. The tables show detailed information about the results in an abbreviated (grouped
results for each sample in the ARISA data set) or detailed version (results for each single
peak), or for different filters that were applied. The entries in most tables are linked to
additional information, such as the sequence of the 16S-ITS-23S regions or the
organism's taxonomy in the NCBI Taxonomy browser. Additional information from the

- 13 -
results that are not shown on the charts (but given in the tables) are displayed by ADAPT
in so called “tool tips” that appear when the users cursor is over the chart. Furthermore,
the ADAPT web frontend shows information about the ADAPTdb database, which is
used for the ARISA data analysis.
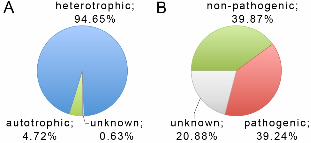
The current version of ADAPTdb (as of May 30, 2009) contains 4,069 16S-ITS-23S
entries and 953 organism entries retrieved from either the NCBI Genome database or the
SEED database. The organism entries are grouped into two domains, 21 phyla, 345
genera, and 639 species. Of the 953 organism entries, 902 (94.65%) are classified as
heterotrophic, 45 (4.72%) as autotrophic, and six (0.63%) are unknown (Figure 3A). For
the pathogenicity, 374 (39.24%) of the organism entries are pathogenic, 380 (39.87%) are
non-pathogenic, and the pathogenesis of 199 (20.88%) is unknown (Figure 3B).
The average number of ITS regions per organism varies among the phyla (Table 2). Nine
bacterial and two archaeal phyla have on average less than two ITS regions per organism
whereas the Proteobacteria have on average 4.21 ITS regions and the Firmicutes have on
average 7.21 ITS regions per organism. The overall average number of ITS regions per
organism in ADAPTdb is 4.27. Of course, the number of database entries in ADAPTdb
will increase with the automatic updates of new entries in the external data resources.
Application example In the following example, the ADAPT system was applied to the analysis of ARISA data
sets to explore the relative number of autotrophic and heterotrophic, as well as pathogenic
and non-pathogenic bacteria on water overlying coral reefs. Water samples were
collected in 2005 at coral reefs near two of the Northern Line Islands: Kiritimati
(Chistmas Island) and Tabuaeran (Fanning Island). The islands lie within the same
- 14 -
biogeographic region, but show a gradient of human disturbance. The population gradient
(estimated population from the 2005 census: Tabuaeran 2,539, Kiritimati 5,115) was used
to investigate the influence of human activities on the microbes living in the coral reefs.
Bacterial DNA was extracted from the filtrate captured from approximately 1 liter of
seawater as described in Dinsdale et al. [25], one sample per island was processed using
ARISA as described in Fisher et al. [1], and analyzed using the ADAPT program.
The PCR primers used in this experiment and selected in the ADAPT input interface
were 1406f as forward primer (5'-TGYACACACCGCCCGT-3') and 23Sr as reverse
primer (5'-GGGTTBCCCCATTCRG-3'). The input format was a text file (available as
SOM) and therefore, a size standard was not selected in ADAPT. The fragment length
range was set from 300 bp to 2,000 bp. The bin values for the analysis were set to three (a
window of ±1 bp) for fragment lengths < 600 bp, and to five (a window of ±2 bp) for
fragment lengths ≥ 600 bp. The fluorescence intensity (peak-height) threshold was set to
a minimum threshold value of 50 fluorescence units greater than the baseline. The data
used for the analysis were filtered to only use organisms of the kingdom Bacteria and that
were retrieved from either the NCBI Genome or the SEED database.
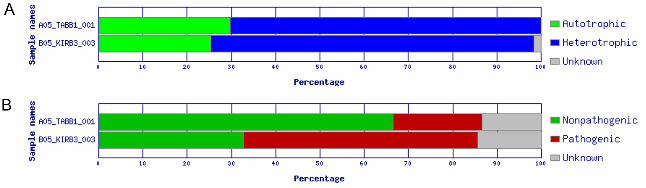
The analysis identified 24 peaks for the sample from Kiritimati matching 39 potential
organisms in the database and 22 peaks for the sample from Tabuaeran matching 25
potential organisms. There were five common fragment lengths in both samples (309,
415, 493, 528, and 732 bp) and four common potentially matching organisms
(Cyanothece sp. ATCC 51142, Lactobacillus gasseri, Streptococcus pneumoniae SP14-
BS69, and Syntrophus aciditrophicus SB). Additionally, the analysis identified a range of
pathogenic bacterial species present on the two islands (Table 3). The microbial
- 15 -
communities of the coral reefs near the two Northern Line Islands showed a high
percentage of heterotrophic organisms: 72.95% for Kiritimati and 70.32% for Tabuaeran
(Figure 4A). In addition, the Kiritimati coral reef water sample showed a higher
abundance of pathogens (53.02%) compared to non-pathogens (32.65%) than in the
Tabuaeran water sample with 20.13% pathogenic and 66.51% non-pathogenic species
(Figure 4B).
Discussion ARISA is fast, cheap, reproducible, and accurate. The sensitivity, in this case the ability
to detect a single-nucleotide difference in sequence length, of ARISA is high compared to
other fingerprinting techniques. The ARISA technique allows the detection of different
fragment lengths in organisms displaying 99% 16S rRNA gene similarity, suggesting a
higher level of resolution than other techniques [5, 26]. ARISA has previously been used
to analyze the genetic structure of several bacterial communities including samples from
freshwater, bacterioplankton, and different soils. In addition to the community or
environmental studies, the technique was used for clinical applications. The ease of use
and the rapid detection and identification of pathogens present in a sample may be
promising for molecular diagnostics of infectious diseases. Rapid detection is particularly
useful because it would allow quick initiation of the appropriate antimicrobial therapy.
Although ARISA has many advantages over similar techniques, it also has drawbacks
that may limit its widespread application. Some of the drawbacks are unique to ARISA,
but most are common to all environmental sampling techniques. The most abundant
bacteria within a sample result in the strongest signal (highest peaks). Therefore, the
abundance of bacteria present in lesser numbers or near the detection limit may not be

- 16 -
measured accurately. Consequently, peaks representing fragments of organisms with low
abundance may be classified as noise or not even detected. Second, environmental
samples are random sampling of the entire microbial community. Hence, taxonomic
profiles obtained for different samples from the same environment may show some
degree of variation. Third, PCR amplification is a stochastic process that is susceptible to
biases. PCR-based techniques such as ARISA may be biased by uneven amplification
efficiencies of the PCR fragments due to sequence heterogeneity [27, 28], differential
extractability of cells in communities [29], or differences in the amount of DNA per cell.
These errors are common to all methods that use PCR amplification, such as T-RFLP and
16S rRNA sequence analysis. As shown in Table 2, some Archaea and Bacteria contain
multiple ITS regions, which can either be exact copies or vary slightly within one
organism. Multiple exact copies of the same ITS region may increase the intensity of a
PCR fragment of a certain length. In the analysis of the ARISA data sets, this may distort
the results (e.g. higher peaks).
An alternative to ARISA for analyzing the taxonomic composition of environmental
samples is the 16S rRNA sequence analysis. Recently, DNA pyrosequencing techniques
have been used to sequence hypervariable regions of the 16S rRNA gene to investigate
the microbial diversity in different samples [30]. Pyrosequencing overcomes the low
throughput problem of conventional capillary sequencing, but is expensive both for
sequencing and data analysis.
ARISA is more reproducible than conventional gel-based techniques like T-RFLP. For
example, the instrumental automatism of ARISA guarantees its reproducibility among
different laboratories or operators. Additionally, ADAPT requires PCR primers and the

- 17 -
size standard in order to perform the analysis. This allows a higher level of comparability
between laboratories using different primer sets and size standards.
Previously established ITS region resources are not maintained anymore (e.g. RISSC
collection [31] and IWoCS database [32]), which causes the information to be outdated
and/or inaccurate. The development of the ADAPTdb database was driven by the need
for a maintained ITS region data resource that can be used for the analysis of ARISA data
sets and provides metadata for additional analysis. The ADAPTdb database contains 16S-
ITS-23S regions and metadata of their source organisms, including taxonomy, trophic
classification, and pathogenicity. ADAPT uses the ADAPTdb database to automatically
analyze ARISA data sets.
The usability of ADAPT has been demonstrated in several practical applications.
Although all the samples showed more heterotrophic than autotrophic organisms, the
composition of the reference ITS region database used by ADAPT skews these results:
approximately 92% of the database entries are classified as heterotrophic while only 8%
are classified as autotrophic. Therefore, the results may show a higher proportion of
heterotrophs than the samples actually contain. However, in the case the Line Island
analysis, the ARISA analysis supported the previous metagenomics analyses that showed
proportionally high numbers of heterotrophs on degraded reefs near Kiritimati and
Tabuaeran than on the healthy reef near Kingman [25]. The results also agree with the
previous results from Dinsdale et al. (2008) that showed there are more potential
pathogens at Kiritimati than on the other islands and that Kingman has the lowest
proportion of potential pathogens. In that study, the authors suggested that the increase of
human disturbance coincides with an increase of pathogenic species, some of which are
- 18 -
pathogenic for corals and fish. A higher number of pathogenic species may therefore
damage the coral health and reduce the number of small fish.
Fragment length binning, used to consider inexact matches during the mapping of input
data to the database is necessary to account for variability in fragment lengths caused by
different sequencing machines and methods used to generate the ARISA profiles.
However, it is not readily apparent what are appropriate bins. For example, prior studies
used different bin values in different fragment or ITS length intervals. Fuhrman and
Hewson (2004) used a bin value of three for lengths up to 500 bp and seven for lengths
longer than 500 bp [33]. Two years later, they used a bin value of three for lengths up to
700 bp, five for 700 bp to 1000 bp and ten for lengths longer than 1,000 bp [6]. Hewson
et al. (2006) used bin values of three for lengths from 400 bp to 700 bp, five from 700 bp
to 1,000 bp and eleven for lengths longer than 1,000 bp in their studies [34]. Ruan et al
(2006) suggested a binning strategy with variable bin values less than a maximal bin
value. The maximal bin values they used are three for lengths up to 600 bp, five for
lengths up to 698 bp and seven for lengths longer than 698 bp [35]. The ADAPT web
interface allows the user to set different bin values for length intervals of < 600 bp, from
600 bp to 899 bp, and > 899 bp. The standard bin values set as defaults in the web
interface are five (equivalent to window of ±2) for lengths smaller than 600 bp and seven
(equivalent to window of ±3) for lengths greater than or equal to 600 bp. For analysis
without length binning, the length window values can be set to 0 for each interval,
providing only exact length matches against the database entries of ADAPTdb.
Accurate identification of ITS regions depends on the correct annotation of flanking 16S
and 23S rRNA gene regions. Commonly, the mapping of ITS regions to a database is

- 19 -
done from the length of the ITS regions calculated from the stop of the 16S to the start of
the 23S rRNA gene. This approach requires a conserved length of the flanking regions
where the primers bind (inside the 16S and 23S rRNA genes) and accurate annotation of
the ends of the genes. Using the fragment length of the PCR product (determined by the
primers) instead overcomes limitations of annotation errors, as imposed by the fragment
length of wrongly annotated gene positions. Including the PCR primer sets used for the
generation of the ARISA data set gives the advantage that miss-annotations of flanking
rRNA regions will not change the outcome of the analysis of ADAPT.
The commonly used primer sets for ARISA [36, 37] might not allow amplification of all
16S-ITS-23S regions in ADAPTdb. The primer sets are designed to recognize the highly
conserved sequences in the flanking regions of the 16S and 23S rRNA genes. The
number of exact matches of the primer set to the 16S and 23S regions in the database
were compared (Table 4). The primer set 1406f/23Sr showed the best result with exact
matches against 87% of the regions, followed by the ITSF/ITSReub primer set with 36%
exact matches. We found no exact matches of the S-D-Bact-1522-b-S-20/L-D-Bact-132-
a-A-18 primer set against the 16S-ITS-23S regions in the database. Of course, allowing
mismatches as may occur during PCR amplification in the primer sequences showed
higher numbers of matching regions for all three primer sets (data not shown).
Jensen et al. (1993) reported that around 85% of the species they analyzed produced
more than one peak in the ARISA profile [38]. Most of the genomes contain one or two
sets of 16S and 23S rRNA genes. We found that five of the bacterial genomes in the
NCBI Genome database contain 12 and another five 13 copies of the 16S and 23S rRNA
gene. Only a few genomes were annotated with different numbers of 16S and 23S rRNA

- 20 -
genes. Since 16S and 23S rRNA gene products are subunits of the same enzyme it is
unlikely that the number of copies varies for the two genes and this is more likely to
either incorrect or incomplete annotations. Because of interoperonic length variation, a
single organism can contribute more than one peak to a sample. This can cause problems
if the analysis does not account for multiple different ITS regions in one organism and
identifies the different ITS regions as individual organisms. Therefore, using only
completely sequenced microbial genomes for the analysis can significantly reduce this
limitation of ARISA. All (annotated) 16S and 23S rRNA gene regions from complete
genomes (including the ITS regions) in ADAPTdb were retrieved from the external
databases and are used to compensate for multiple peaks in a single organism. The
taxonomic composition of the ARISA sample is calculated in ADAPT based on the
fragment lengths that are present in the complete genome for a specific organism.
Organisms that can be detected in ARISA data sets are only those that are represented in
the reference database used to analyze ARISA data sets. Therefore, it is important to
provide as many regions as possible in the database that is used for the analysis. As the
number of sequenced organisms is continuously increasing, it becomes possible to fill in
the gaps of missing regions in the ADAPTdb database. Keeping ADAPTdb up-to-date
with information of newly sequenced organisms requires regular updates. The newly
developed ADAPTdb is equipped with an automated update function that ensures weekly
updates from data resources such as the NCBI Genome database and the SEED database.
In the future, including data resources with ITS regions from organisms whose genomes
are not fully sequenced may prove advantageous.
- 21 -
Conclusions ADAPT provides a free, platform-independent tool to the research community that
enables the users to automatically analyze ARISA data sets via an easy-to-use web
interface. Environmental samples from the Line Islands were analyzed using these tools
to recapitulate the trophic differences seen in other studies and attributed to human
impact. ADAPT and ADAPTdb enable rapid assessment of environmental communities
by ARISA.
Availability and requirements • Project name: ADAPT
• Project home page: http://edwards.sdsu.edu/adapt
• Operating system(s): Web service, platform independent
• Programming language: Perl
• Restrictions to use by non-academics: None
Authors' contributions RS has designed and implemented the database and web application, tested the program,
and drafted the initial manuscript. ED collected the water samples. MH extracted the
DNA, processed the samples to generate the ARISA data sets, and participated in the
GUI component design. FR and RE conceived of the study, and participated in its design
and coordination. All authors read and approved the final version of the manuscript.
Acknowledgements We thank Lutz Krause, Ramy K. Aziz, and Peter Salamon for helpful discussions. This
work was supported by grants DBI 0850356 Advances in Bioinformatics from the
- 22 -
National Science Foundation, the Gordon and Betty Moore Foundation, and the Canadian
Institute for Advanced Research.

- 23 -
References 1. Fisher MM, Triplett EW: Automated approach for ribosomal intergenic
spacer analysis of microbial diversity and its application to freshwater bacterial communities. Appl Environ Microbiol 1999, 65(10):4630-4636.
2. Yannarell AC, Triplett EW: Geographic and environmental sources of variation in lake bacterial community composition. Appl Environ Microbiol 2005, 71(1):227-239.
3. Brown MV, Schwalbach MS, Hewson I, Fuhrman JA: Coupling 16S-ITS rDNA clone libraries and automated ribosomal intergenic spacer analysis to show marine microbial diversity: development and application to a time series. Environ Microbiol 2005, 7(9):1466-1479.
4. Brown MV, Fuhrman JA: Marine bacterial microdiversity as revealed by internal transcribed spacer analysis. Aquat Microb Ecol 2005, 41(1):15-23.
5. Danovaro R, Luna GM, Dell'anno A, Pietrangeli B: Comparison of two fingerprinting techniques, terminal restriction fragment length polymorphism and automated ribosomal intergenic spacer analysis, for determination of bacterial diversity in aquatic environments. Appl Environ Microbiol 2006, 72(9):5982-5989.
6. Fuhrman JA, Hewson I, Schwalbach MS, Steele JA, Brown MV, Naeem S: Annually reoccurring bacterial communities are predictable from ocean conditions. Proc Natl Acad Sci U S A 2006, 103(35):13104-13109.
7. Hewson I, Capone DG, Steele JA, Fuhrman JA: Influence of Amazon and Orinoco offshore surface water plumes on oligotrophic bacterioplankton diversity in the west tropical Atlantic. Aquatic Microbial Ecology 2006, 43(1):11-22.
8. Leuko S, Goh F, Allen MA, Burns BP, Walter MR, Neilan BA: Analysis of intergenic spacer region length polymorphisms to investigate the halophilic archaeal diversity of stromatolites and microbial mats. Extremophiles 2007, 11(1):203-210.
9. Fuhrman JA, Steele JA, Hewson I, Schwalbach MS, Brown MV, Green JL, Brown JH: A latitudinal diversity gradient in planktonic marine bacteria. Proc Natl Acad Sci U S A 2008, 105(22):7774-7778.
10. Ranjard L, Poly F, Lata JC, Mougel C, Thioulouse J, Nazaret S: Characterization of bacterial and fungal soil communities by automated ribosomal intergenic spacer analysis fingerprints: biological and methodological variability. Appl Environ Microbiol 2001, 67(10):4479-4487.
11. Kirk JL, Beaudette LA, Hart M, Moutoglis P, Klironomos JN, Lee H, Trevors JT: Methods of studying soil microbial diversity. J Microbiol Methods 2004, 58(2):169-188.
- 24 -
12. Jones CM, Thies JE: Soil microbial community analysis using two-dimensional polyacrylamide gel electrophoresis of the bacterial ribosomal internal transcribed spacer regions. J Microbiol Methods 2007, 69(2):256-267.
13. Baudart J, Lemarchand K, Brisabois A, Lebaron P: Diversity of Salmonella strains isolated from the aquatic environment as determined by serotyping and amplification of the ribosomal DNA spacer regions. Appl Environ Microbiol 2000, 66(4):1544-1552.
14. Clementino MM, de Filippis I, Nascimento CR, Branquinho R, Rocha CL, Martins OB: PCR analyses of tRNA intergenic spacer, 16S-23S internal transcribed spacer, and randomly amplified polymorphic DNA reveal inter- and intraspecific relationships of Enterobacter cloacae strains. J Clin Microbiol 2001, 39(11):3865-3870.
15. Gonzalez-Escalona N, Jaykus LA, DePaola A: Typing of Vibrio vulnificus strains by variability in their 16S-23S rRNA intergenic spacer regions. Foodborne Pathog Dis 2007, 4(3):327-337.
16. Boyer SL, Flechtner VR, Johansen JR: Is the 16S-23S rRNA internal transcribed spacer region a good tool for use in molecular systematics and population genetics? A case study in cyanobacteria. Mol Biol Evol 2001, 18(6):1057-1069.
17. Xu D, Cote JC: Phylogenetic relationships between Bacillus species and related genera inferred from comparison of 3' end 16S rDNA and 5' end 16S-23S ITS nucleotide sequences. Int J Syst Evol Microbiol 2003, 53(Pt 3):695-704.
18. NCBI Genome database [http://www.ncbi.nlm.nih.gov/sites/entrez?db=genome]
19. Overbeek R, Disz T, Stevens R: The SEED: a peer-to-peer environment for genome annotation. Commun ACM 2004, 47(11):46-51.
20. Sayers EW, Barrett T, Benson DA, Bryant SH, Canese K, Chetvernin V, Church DM, DiCuccio M, Edgar R, Federhen S et al: Database resources of the National Center for Biotechnology Information. Nucleic Acids Res 2009, 37(Database issue):D5-15.
21. Schuler GD, Epstein JA, Ohkawa H, Kans JA: Entrez: molecular biology database and retrieval system. Methods Enzymol 1996, 266:141-162.
22. Entrez Programming Utilities (eUtils) Homepage [http://www.ncbi.nlm.nih.gov/entrez/query/static/eutils_help.html]
23. The SEED Viever [http://seed-viewer.theseed.org/]
24. Lproks.txt file with pathogenesis information [ftp://ftp.ncbi.nih.gov/genomes/Bacteria/lproks_0.txt]
25. Dinsdale EA, Pantos O, Smriga S, Edwards RA, Angly F, Wegley L, Hatay M, Hall D, Brown E, Haynes M et al: Microbial ecology of four coral atolls in the Northern Line Islands. PLoS ONE 2008, 3(2):e1584.
- 25 -
26. Jaspers E, Overmann J: Ecological significance of microdiversity: identical 16S rRNA gene sequences can be found in bacteria with highly divergent genomes and ecophysiologies. Appl Environ Microbiol 2004, 70(8):4831-4839.
27. Suzuki M, Rappe MS, Giovannoni SJ: Kinetic bias in estimates of coastal picoplankton community structure obtained by measurements of small-subunit rRNA gene PCR amplicon length heterogeneity. Appl Environ Microbiol 1998, 64(11):4522-4529.
28. Polz MF, Cavanaugh CM: Bias in template-to-product ratios in multitemplate PCR. Appl Environ Microbiol 1998, 64(10):3724-3730.
29. Polz MF, Harbison C, Cavanaugh CM: Diversity and heterogeneity of epibiotic bacterial communities on the marine nematode Eubostrichus dianae. Appl Environ Microbiol 1999, 65(9):4271-4275.
30. Sogin ML, Morrison HG, Huber JA, Mark Welch D, Huse SM, Neal PR, Arrieta JM, Herndl GJ: Microbial diversity in the deep sea and the underexplored "rare biosphere". Proc Natl Acad Sci U S A 2006, 103(32):12115-12120.
31. Garcia-Martinez J, Bescos I, Rodriguez-Sala JJ, Rodriguez-Valera F: RISSC: a novel database for ribosomal 16S-23S RNA genes spacer regions. Nucleic Acids Res 2001, 29(1):178-180.
32. D'Auria G, Pushker R, Rodriguez-Valera F: IWoCS: analyzing ribosomal intergenic transcribed spacers configuration and taxonomic relationships. Bioinformatics 2006, 22(5):527-531.
33. Hewson I, Fuhrman JA: Richness and diversity of bacterioplankton species along an estuarine gradient in Moreton Bay, Australia. Appl Environ Microbiol 2004, 70(6):3425-3433.
34. Hewson I, Fuhrman JA: Improved strategy for comparing microbial assemblage fingerprints. Microb Ecol 2006, 51(2):147-153.
35. Ruan Q, Steele JA, Schwalbach MS, Fuhrman JA, Sun F: A dynamic programming algorithm for binning microbial community profiles. Bioinformatics 2006, 22(12):1508-1514.
36. Cardinale M, Brusetti L, Quatrini P, Borin S, Puglia AM, Rizzi A, Zanardini E, Sorlini C, Corselli C, Daffonchio D: Comparison of different primer sets for use in automated ribosomal intergenic spacer analysis of complex bacterial communities. Appl Environ Microbiol 2004, 70(10):6147-6156.
37. Jones SE, Shade AL, McMahon KD, Kent AD: Comparison of primer sets for use in automated ribosomal intergenic spacer analysis of aquatic bacterial communities: an ecological perspective. Appl Environ Microbiol 2007, 73(2):659-662.
38. Jensen MA, Webster JA, Straus N: Rapid identification of bacteria on the basis of polymerase chain reaction-amplified ribosomal DNA spacer polymorphisms. Appl Environ Microbiol 1993, 59(4):945-952.
- 26 -
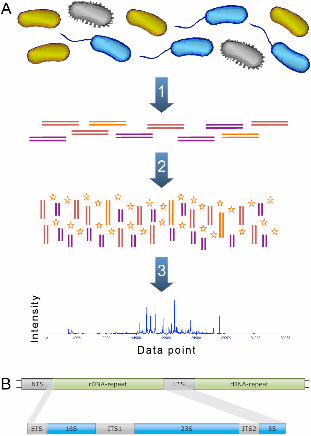
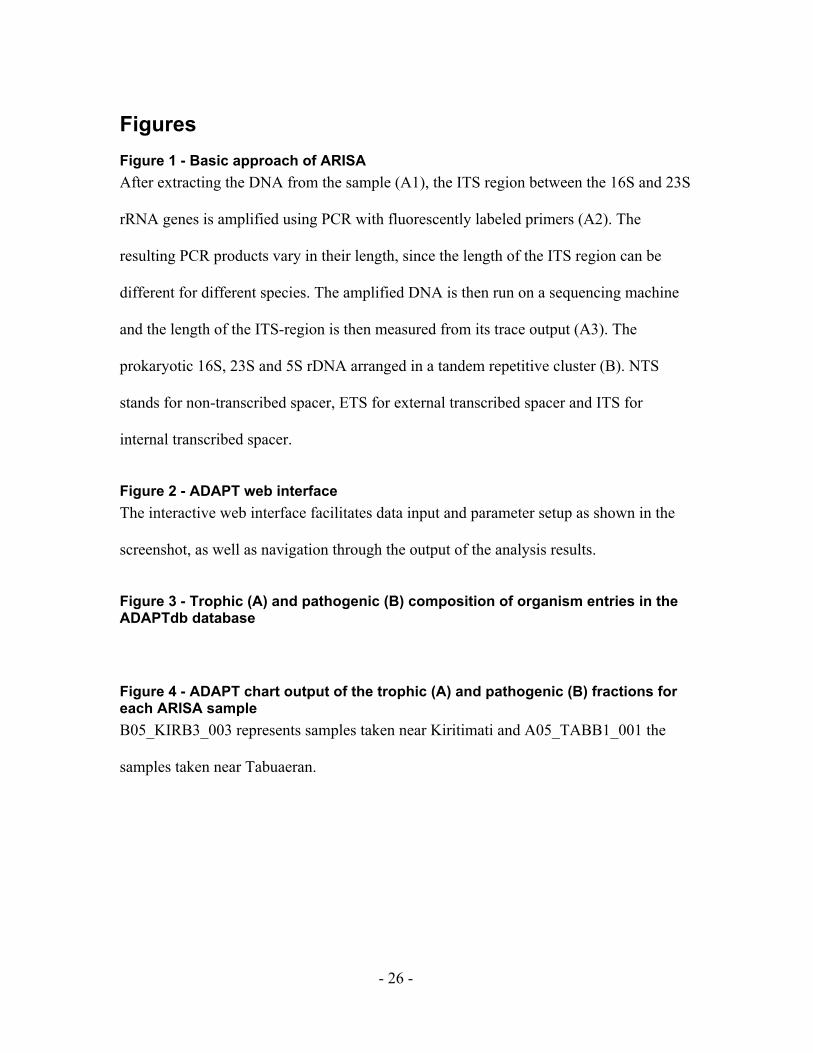
Figures Figure 1 - Basic approach of ARISA After extracting the DNA from the sample (A1), the ITS region between the 16S and 23S
rRNA genes is amplified using PCR with fluorescently labeled primers (A2). The
resulting PCR products vary in their length, since the length of the ITS region can be
different for different species. The amplified DNA is then run on a sequencing machine
and the length of the ITS-region is then measured from its trace output (A3). The
prokaryotic 16S, 23S and 5S rDNA arranged in a tandem repetitive cluster (B). NTS
stands for non-transcribed spacer, ETS for external transcribed spacer and ITS for
internal transcribed spacer.
Figure 2 - ADAPT web interface The interactive web interface facilitates data input and parameter setup as shown in the
screenshot, as well as navigation through the output of the analysis results.
Figure 3 - Trophic (A) and pathogenic (B) composition of organism entries in the ADAPTdb database
Figure 4 - ADAPT chart output of the trophic (A) and pathogenic (B) fractions for each ARISA sample B05_KIRB3_003 represents samples taken near Kiritimati and A05_TABB1_001 the
samples taken near Tabuaeran.

- 27 -
Tables Table 1 - Trophic type classification for phyla in ADAPTdb
Trophic type Phylum autotrophic Aquificae Cyanobacteria Nitrospirae heterotrophic Acidobacteria Actinobacteria Bacteroidetes Bacteroidetes/Chlorobi group Chlamydiae Chlamydiae/Verrucomicrobia group Chlorobi Chloroflexi Crenarchaeota Deinococcus-Thermus Euryarchaeota Firmicutes Fusobacteria Korarchaeota Proteobacteria Spirochaetes Synergistetes Tenericutes Thermotogae Verrucomicrobia unknown Deferribacteres Dictyoglomi Gemmatimonadetes unknown
- 28 -
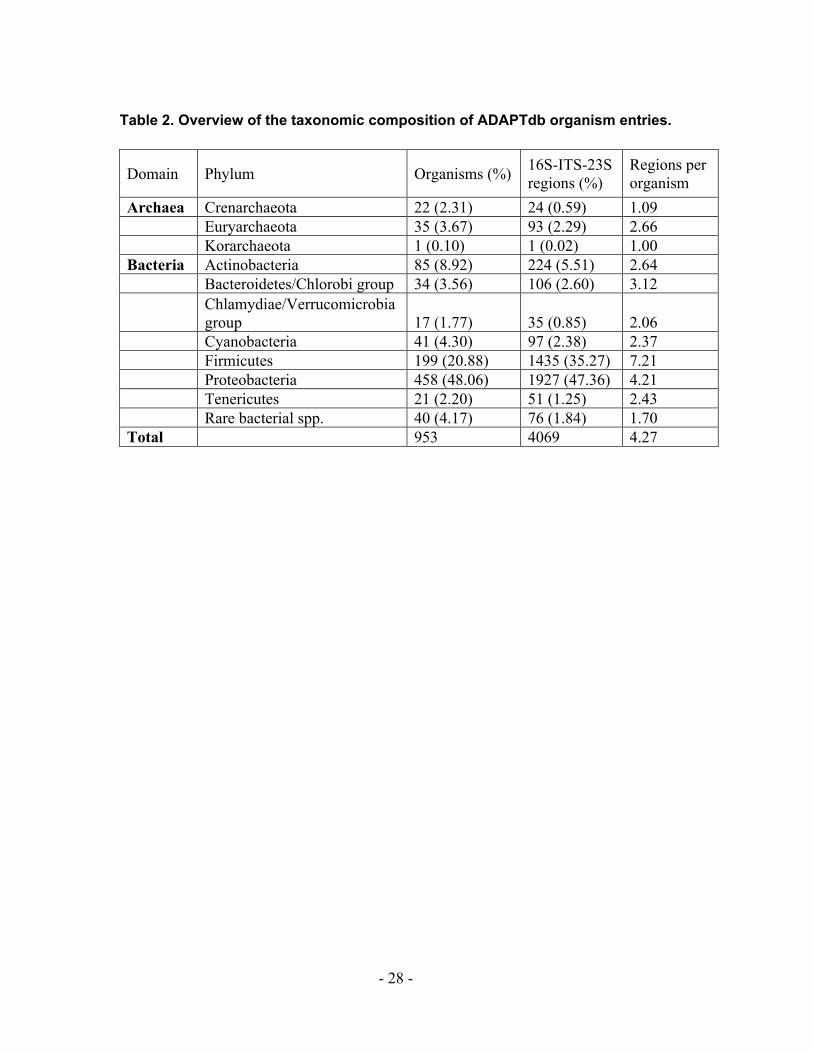
Table 2. Overview of the taxonomic composition of ADAPTdb organism entries.
Domain Phylum Organisms (%) 16S-ITS-23S regions (%)
Regions per organism
Archaea Crenarchaeota 22 (2.31) 24 (0.59) 1.09 Euryarchaeota 35 (3.67) 93 (2.29) 2.66 Korarchaeota 1 (0.10) 1 (0.02) 1.00 Bacteria Actinobacteria 85 (8.92) 224 (5.51) 2.64 Bacteroidetes/Chlorobi group 34 (3.56) 106 (2.60) 3.12
Chlamydiae/Verrucomicrobia group 17 (1.77) 35 (0.85) 2.06
Cyanobacteria 41 (4.30) 97 (2.38) 2.37 Firmicutes 199 (20.88) 1435 (35.27) 7.21 Proteobacteria 458 (48.06) 1927 (47.36) 4.21 Tenericutes 21 (2.20) 51 (1.25) 2.43 Rare bacterial spp. 40 (4.17) 76 (1.84) 1.70 Total 953 4069 4.27
- 29 -
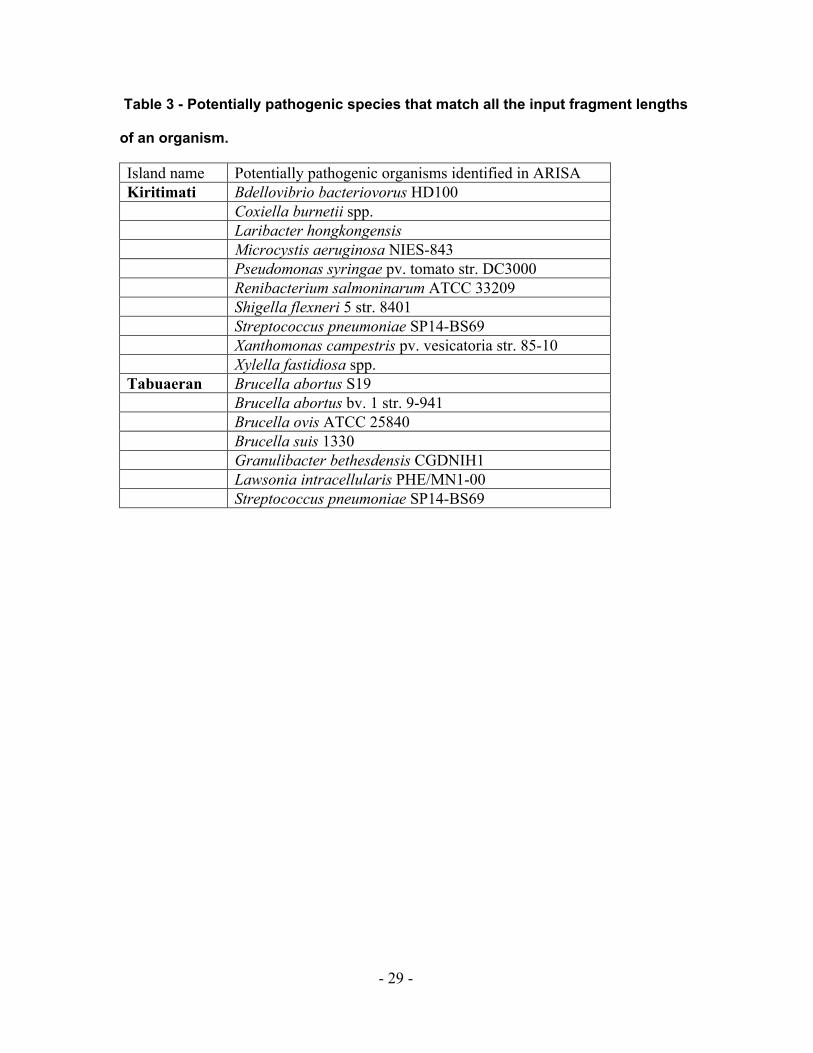
Table 3 - Potentially pathogenic species that match all the input fragment lengths
of an organism.
Island name Potentially pathogenic organisms identified in ARISA sample Kiritimati Bdellovibrio bacteriovorus HD100
Coxiella burnetii spp. Laribacter hongkongensis Microcystis aeruginosa NIES-843 Pseudomonas syringae pv. tomato str. DC3000 Renibacterium salmoninarum ATCC 33209 Shigella flexneri 5 str. 8401 Streptococcus pneumoniae SP14-BS69 Xanthomonas campestris pv. vesicatoria str. 85-10 Xylella fastidiosa spp. Tabuaeran Brucella abortus S19 Brucella abortus bv. 1 str. 9-941 Brucella ovis ATCC 25840 Brucella suis 1330 Granulibacter bethesdensis CGDNIH1 Lawsonia intracellularis PHE/MN1-00 Streptococcus pneumoniae SP14-BS69

- 30 -
Table 4 - Number of regions and organisms matching different primer sets that
were used for the ARISA analysis
Primer set Regions matching primer set (%)
Regions not matching primer set (%)
Organisms matching primer set with all regions (%)
Organisms matching primer set with any regions (%)
1406f/23Sr 3441 (87) 510 (13) 745 (78) 764 (80) ITSF/ITSReub 1433 (36) 2518 (64) 390 (41) 401 (42) S-D-Bact-1522-b-S-20/L-D-Bact-132-a-A-18
0 (0) 3951 (100) 0 (0) 0 (0)
The numbers are based on exact matches for the kingdom Bacteria. Introducing
mismatches to S-D-Bact-1522-b-S-20/L-D-Bact-132-a-A-18 showed regions matching
the primer set.