Embed Size (px)
Citation preview

AutoForecast Solutions
Engine, Transmission, & Drivetrain Trends and OutlookSeptember 16, 2015
Global Powertrain Analysis
Brian MaximVice President, Global Powertrain Forecasting

AutoForecast Solutions
Global Engine & Transmission Analysis
2

AutoForecast Solutions
Global Engine Volumes(By Major Configuration)
3
20022003
20042005
20062007
20082009
20102011
20122013
20142015
20162017
20182019
20202021
2022
0
10,000,000
20,000,000
30,000,000
40,000,000
50,000,000
60,000,000
70,000,000
80,000,000
90,000,000Top 4 Engine Configurations
I4
I3
V6
V8
Calendar Year
Vol
ume
(000
)
0
2,000,000
4,000,000
6,000,000
8,000,000
10,000,000
12,000,000
14,000,000
16,000,000
I3 Total
I3
Calendar Year
Vol
um
e (0
00
)
20142016
20182020
2022
01,000,0002,000,0003,000,0004,000,0005,000,0006,000,0007,000,0008,000,0009,000,000
10,000,000
I3 By Region
AP
EE
ME/A
NA
SA
WE
Calendar Year
Vol
um
e (0
00
)198%Growth

AutoForecast Solutions
Global Engine Trends• Programs gravitating down similar paths
• Smaller engine programs looking fairly similar• 2.0L I4 GDI Turbo
• Still replacing smaller V6s• Offered as upgrade to non-turbo 2.0L
• 1.5L GDI Turbo• Some are 1.4L or 1.6L• Replacing larger I4s
• 1.0L GDI Turbo• Replacing medium and small I3/I4s
• 3.0L 6-cylinder with GDI• 3.0L is a global approach
• Fiat Chrysler (FCA), GM and Ford differ slightly• V8s diverge
• Reserved more for sports cars and truck based vehicles• Non-NA assemblers choosing GDI • NA assemblers going different paths, embracing different technologies
4

AutoForecast Solutions
Accelerated Global GDI Adoption
50
5,000,000
10,000,000
15,000,000
20,000,000
25,000,000GDI Adoption
APEEME/ANASAWE
Calendar Year
Vol
um
e (0
00
)
0
2,000,000
4,000,000
6,000,000
8,000,000
10,000,000
12,000,000Gasoline Turbo Adoption
APEEME/ANASAWE
Calendar Year
Vol
um
e (0
00
)
20152016
20172018
20192020
20212022
0
1,000,000
2,000,000
3,000,000
4,000,000
5,000,000
6,000,000
7,000,000
8,000,000
9,000,000
Turbocharged GDI Adoption
AP
EE
ME/A
NA
SA
WE
Calendar Year
Vol
um
e (0
00
)

AutoForecast Solutions
Light Vehicle Diesel Volume Analysis
6
0
5,000,000
10,000,000
15,000,000
20,000,000
25,000,000Global Diesel
WE
SA
NA
ME/A
EE
AP
Calendar Year
Vo
lum
e (0
00
)
0
200,000
400,000
600,000
800,000
1,000,000
1,200,000
1,400,000
North America
Calendar Year
Vol
um
e (0
00
)
Most growth from Asia• India and China lead the way• West Europe stabilizing• Mild growth in North America
North America adding applications• Small diesels on full-sized pickups• Some car offerings increasing slightlyFuel and purchase price cost pressures still a factor
AutoForecast Solutions
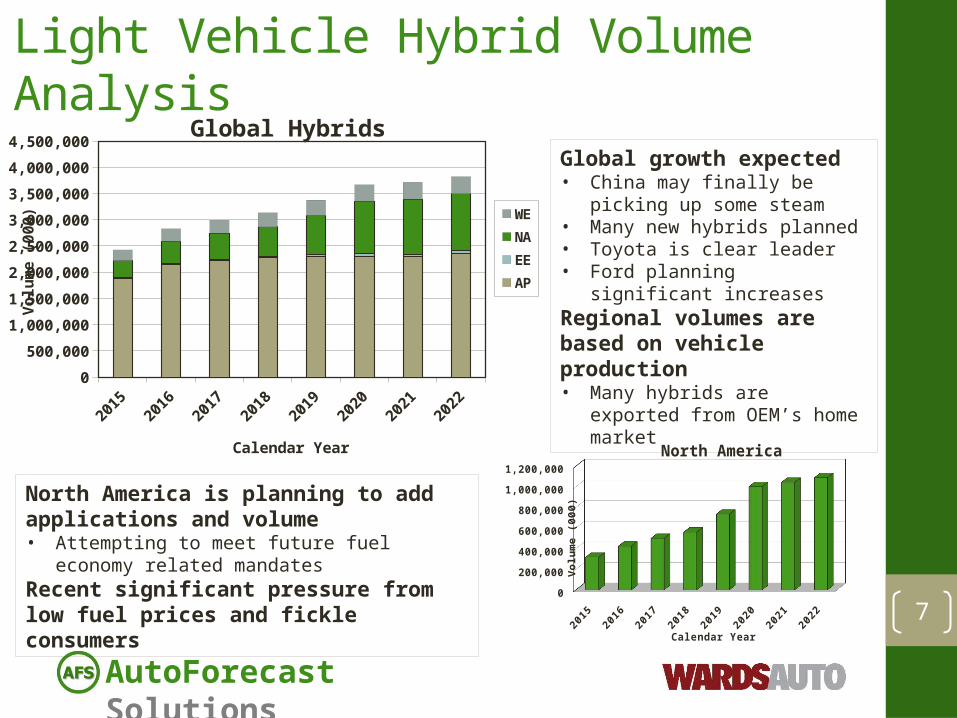
Light Vehicle Hybrid Volume Analysis
7
0
500,000
1,000,000
1,500,000
2,000,000
2,500,000
3,000,000
3,500,000
4,000,000
4,500,000Global Hybrids
WE
NA
EE
AP
Calendar Year
Vo
lum
e (0
00
)
0
200,000
400,000
600,000
800,000
1,000,000
1,200,000
North America
Calendar Year
Vol
um
e (0
00
)
Global growth expected• China may finally be picking up
some steam• Many new hybrids planned• Toyota is clear leader• Ford planning significant
increasesRegional volumes are based on vehicle production• Many hybrids are exported from
OEM’s home market
North America is planning to add applications and volume• Attempting to meet future fuel economy related
mandatesRecent significant pressure from low fuel prices and fickle consumers

AutoForecast Solutions
Light Vehicle EV Volume Analysis
8
0
100,000
200,000
300,000
400,000
500,000
600,000Global EVs
WE
NA
ME/A
EE
AP
Calendar Year
Vo
lum
e (0
00
)
020,00040,00060,00080,000
100,000120,000140,000160,000180,000200,000
North America
Calendar Year
Vol
um
e (0
00
)
Strong North American growth• Tesla and Renault/Nissan lead the way• Smaller volumes from traditional
manufacturersLow fuel prices hurt budget market vehicles
Global growth expected• China may finally be picking up
some steam• Many high-end sports car
models being added• All major OEMs adding
applications and volume

AutoForecast Solutions
North American Engine Volumes(By Major Configuration)
9
20022003
20042005
20062007
20082009
20102011
20122013
20142015
20162017
20182019
20202021
2022
0
2,000,000
4,000,000
6,000,000
8,000,000
10,000,000
12,000,000Top 3 Engine Configurations
I4
V6
V8
Calendar Year
Vol
ume
(000
)
0
100,000
200,000
300,000
400,000
500,000
600,000
700,000
800,000
I3
Calendar Year
Vol
um
e (0
00
)
0
50,000
100,000
150,000
200,000
250,000
300,000
350,000
H4
Calendar Year
Vol
um
e (0
00
)
247%Growth
Roughly 1/3 of global total
742%Growth

AutoForecast Solutions
North American Engine Trends• OEMs developing similar programs
• Smaller engine programs looking fairly similar• 2.0L I4 GDI Turbo• 1.4L -1.5L GDI Turbo
• Replacing larger I4s• 3.6L V6s for FCA and GM
• Ford taking a more fractured approach• 2.7L V6 EcoBoost• 3.3L V6 non-EcoBoost• 3.5L V6 sticks around
• V8s diverge• GM keeping OHV, but utilizing add-on technologies and reducing friction• Fiat-Chrysler keeping OHV but utilizing add-on technologies• Ford using more expensive OHC technologies
10

AutoForecast Solutions
Global Transmission TrendsBy Type
11
0
5,000,000
10,000,000
15,000,000
20,000,000
25,000,000
30,000,000
35,000,000
40,000,000
45,000,000Global Volume by Type
Man
Auto
DCT
CVT
Calendar Year
Vol
um
e (0
00
)
20152016
20172018
20192020
20212022
0%5%
10%15%20%25%30%35%40%45%50% Global Share by Type
Man
Auto
DCT
CVT
Calendar Year
Glo
bal
Sh
are
Manuals still dominate• Europe and developing markets
pushing volume• DCTs and CVTs gaining ground

AutoForecast Solutions
Global Automatic Adoption(Traditional Automatics)
12
0
2,000,000
4,000,000
6,000,000
8,000,000
10,000,000
12,000,000
14,000,000Regional Consumption Volumes
AP
EE
ME/A
NA
SA
WE
Calendar Year
Vol
um
e (0
00
)
20152016
20172018
20192020
20212022
0%
10%
20%
30%
40%
50%
60%
70%
80% Automatic Share In Each Region
AP
EE
ME/A
NA
SA
WE
Calendar Year
Reg
ion
al S
har
e
Influenced by North America and Europe• Asia Volumes mostly from China• North America prefers the traditional
automatic• Europe prefers manuals, keeping
volumes low

AutoForecast Solutions
Global CVT Adoption
13
0
2,000,000
4,000,000
6,000,000
8,000,000
10,000,000
12,000,000 Regional Consumption Volumes
AP
EE
ME/A
NA
SA
WE
Calendar Year
Vol
um
e (0
00
)
20152016
20172018
20192020
20212022
0%
5%
10%
15%
20%
25%
30%CVT Share In Each Region
AP
EE
ME/A
NA
SA
WE
Calendar Year
Reg
ion
al S
har
e
Strong Japanese Influence• Asia volumes mostly Japan with
some in China• NA a result of Japan• Other regions prefer DCTs and
automatics

AutoForecast Solutions
Global DCT Adoption
14
0
2,000,000
4,000,000
6,000,000
8,000,000
10,000,000
12,000,000 Regional Consumption Volumes
AP
EE
ME/A
NA
SA
WE
Calendar Year
Vol
um
e (0
00
)
20152016
20172018
20192020
20212022
0%
5%
10%
15%
20%
25%
30%
35%DCT Share In Each Region
AP
EE
ME/A
NA
SA
WE
Calendar Year
Reg
ion
al S
har
e
Strong European Influence• Asia Volumes mostly from China• Europe volumes fairly low due to
preferring manuals• North America influenced some by
Europe

AutoForecast Solutions
North America Transmission Trends
15
0
2,000,000
4,000,000
6,000,000
8,000,000
10,000,000
12,000,000
14,000,000Transmission Volume by Type
Auto
CVT
DCT
Man
Calendar Year
Vol
um
e (0
00
)
0
2,000,000
4,000,000
6,000,000
8,000,000
10,000,000
12,000,000
14,000,000Automatics Breakdown
A10
A9
A8
A7
A6
A5
A4
Calendar Year
Vol
um
e (0
00
)
NA Automatics - 2005
A4
A3A7
A6
A5
NA Transmissions - 2005
Auto
DCT
CVT
Man

AutoForecast Solutions
Recent Powertrain Developments• Evolving transmission programs
• GM/Ford FWD transmission agreement• Larger 9-speed to be replaced by an 8-speed• Ford to add small 8-speed to lineup
• To be built in 3 plants around the world• Will replace some medium 9-speeds, at lower end• Primarily replacing automatic 6-speeds and some DCTs
• CVT programs for Ford and GM coming back• Both are planning CVTs again, in lower volumes
• Ford applications are for non-North American vehicles• Magna acquisition of Getrag
• Will greatly expand Magna drivetrain portfolio• Will lead to closer relationship with Ford through Getrag/Ford JVs
• Ford to offer small diesel in F-150• 3.0L V6 to combat current Ram and future GM offerings
16

AutoForecast Solutions
Recent Powertrain Developments(cont.)
• Falling fuel prices – fuel economy less important • Consumers choosing larger engines again
• Choosing different vehicles with larger engines• Choosing larger engines within the vehicle category
• Hybrid and EV growth slowing• More difficult to justify added costs and/or compromises
• China is bucking the trend and growing
17Sales of fuel efficient vehicles in North America are
driven more by government incentives and mandates than by consumer preferences
Jan-0
8
Apr-08
Jul-0
8
Oct-08
Jan-0
9
Apr-09
Jul-0
9
Oct-09
Jan-1
0
Apr-10
Jul-1
0
Oct-10
Jan-1
1
Apr-11
Jul-1
1
Oct-11
Jan-1
2
Apr-12
Jul-1
2
Oct-12
Jan-1
3
Apr-13
Jul-1
3
Oct-13
Jan-1
4
Apr-14
Jul-1
4
Oct-14
Jan-1
5
Apr-15
Jul-1
5
20.0
21.0
22.0
23.0
24.0
25.0
26.0
27.0
Monthly US Fuel Economy, Weighted by New Vehicle Sales*
MPG
* From the Transportation Research Institute, University of Michigan
Small diesel programs being revived for pickups

AutoForecast Solutions
Global Drivetrain AnalysisSystems and Market Trends
18

AutoForecast Solutions
4WD/AWD Systems – Brief Overview• There are three basic 4WD/AWD systems
• Transfer Cases • An additional “gearbox” in conjunction with the transmission which
allows for the selection of neutral and at least one gear ratio, but usually two• Ford F150• Jeep Grand Cherokee
• Torque Adjustable Couplings• Allows for sending mechanical forces to the other set of tires not
normally powered by the transmission• BMW X-Drive• Chevrolet Equinox• Subaru Outback
• Electronic AWD• Two or four wheels of the vehicles are powered by electric motors
• Toyota Highlander Hybrid• Tesla Model X
19

AutoForecast Solutions
North American AWD/4WD Volumes(By Drive Type)
20
20152016
20172018
20192020
20212022
0
500
1,000
1,500
2,000
2,500
3,000
3,500
4,000
4,500AWD/4WD Volume by Type
AWD
4WD
AWD E
Calendar Year
Vo
lum
e (0
00
)
20152016
20172018
20192020
20212022
0102030405060708090
100
Electronic AWD
Calendar Year
Vol
um
e (0
00
)
20152016
20172018
20192020
20212022
0%
5%
10%
15%
20%
25%
NA Light Vehicle Production
AWD
4WD
AWD E
Calendar Year
Shar
e of
Tot
al
Volvo effect
Tesla effect

AutoForecast Solutions
European AWD/4WD Volumes(By Drive Type)
21
20152016
20172018
20192020
20212022
0
500
1,000
1,500
2,000
2,500
3,000
3,500AWD/4WD Volume by Type
AWD
4WD
AWD E
Calendar Year
Vo
lum
e (0
00
)
20152016
20172018
20192020
20212022
0
10
20
30
40
50
60
70
Electronic AWD
Calendar Year
Vol
um
e (0
00
)
20152016
20172018
20192020
20212022
0%
2%
4%
6%
8%
10%
12%
14%
16%European Light Vehicle Production
AWD
4WD
AWD E
Calendar Year
Shar
e of
Veh
icle
Tot
al
Porsche Pajuneffect

AutoForecast Solutions
European Market Trends• Mild growth of AWD/4WD
• As vehicle prices rise, more new vehicle purchases have a greater amount of options, including AWD/4WD• Consumers looking to purchase less expensive products moving toward
the used car market
• Growth in “CUVs” not pushing AWD growth as much• Most European CUVs are just normal hatchbacks that have been
raised higher• Most of these vehicles do not offer AWD systems
• European consumers do not purchase vehicles with AWD/4WD systems as much as other regions• For example, UK consumers do not opt AWD/4WD systems
22

AutoForecast Solutions
Full Size Truck Comparison(Best gasoline engine fuel economy)
23
Ram Pickup(Base & Fuel Economy)
Ford F-150(Fuel Economy)
Chevrolet Silverado(Base & Fuel Economy)
Ford F-150(Base)
Curb Weight (lbs.) 4,503 4,168 4,521 4,050
Length/Width/Height (in.) 209.0/79.4/74.6 209.3/79.9/75.5 205.6/80.0/74.0 209.3/79.9/75.5
Engine 3.6L V6 DOHC 2.7L V6 DOHC TwinTurbo 4.3L V6 OHV 3.5L V6 DOHC
Transmission 8-Speed Automatic 6-Speed Automatic 6-Speed Automatic 6-Speed Automatic
HP (SAE net)Torque (lb.-ft.)
305@6400269@4175
325@5750375@3000
285@5300305@3900
282@6250253@4250
GVWR (lbs.) 6,025 6,010 6,500 6,010
Towing Capacity (lbs.) 4,970 7,600 6,100 5,100
Payload (lbs.) 1,522 1,800 1,950 1,910
Fuel Economy (mpg)(city/highway/combined)
17/25/20 19/26/22 18/24/20 18/25/20
Cost (MSRP) $25,660 $26,825 $26,520 $26,030
2015MY, Standard cab, 6.5 foot box, 2WD, width without mirrors

AutoForecast Solutions
Powertrain Relationships
24

AutoForecast Solutions
OEM Agreements and Outsourcing Continues
• Significant agreements for diesels• Ford heavily relies on PSA designs
• Buys some from PSA, but builds most themselves• GM uses several different diesel designs
• Builds and uses designs from Isuzu, VM Motori and FCA around the world• FCA sources diesels from Cummins and VM Motori for Ram Pickups
• Gasoline engine designs• GM’s L850 I4 engines
• The “L” stands for Lotus, the primary designer• GM has greatly refined the engine since
• Hyundai’s Zeta (Theta) I4 family• Used by FCA and Mitsubishi
• Aston Martin will use Mercedes engines• Currently uses Ford based engines – from previous ownership
• Nissan building and using Mercedes 2.0L Turbo I4• Built in Decherd for MB and Nissan in North America 25

AutoForecast Solutions
OEM Agreements and Outsourcing Continues(Cont.)
• Transmission agreements• Significant cooperation between Ford and GM in North America
• GM is primary designer of FWD transmissions• Ford makes adjustments to give them a Ford flavor
• Started with the current mid and large A6s• Will extend to future A8s and A9s• Ford will produce them in their own plants
• Ford is primary designer of RWD transmissions• GM will make adjustments to give them a GM flavor
• Includes 10-speed units for trucks and large SUVs• GM will produce them in their own plants
• FCA heavily relying on ZF• FCA licensed designs and is producing them in their own plants
• 8-speed RWD automatics for trucks• 9-speed FWD automatics for medium and larger FWD vehicles
• Most recently Magna’s purchase of Getrag• Highlights how transmissions are becoming a huge area of growth
• Significant experience and volume of DCTs 26

AutoForecast Solutions
Mandates
27
AutoForecast Solutions
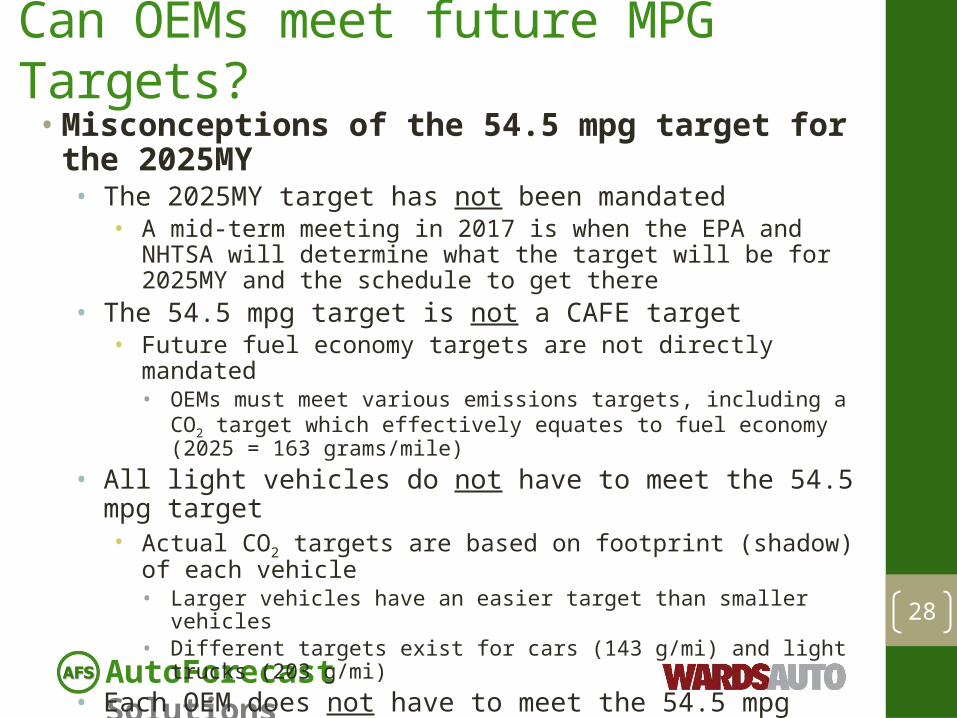
Can OEMs meet future MPG Targets?• Misconceptions of the 54.5 mpg target for the 2025MY
• The 2025MY target has not been mandated• A mid-term meeting in 2017 is when the EPA and NHTSA will determine
what the target will be for 2025MY and the schedule to get there• The 54.5 mpg target is not a CAFE target
• Future fuel economy targets are not directly mandated• OEMs must meet various emissions targets, including a CO2 target which
effectively equates to fuel economy (2025 = 163 grams/mile)• All light vehicles do not have to meet the 54.5 mpg target
• Actual CO2 targets are based on footprint (shadow) of each vehicle• Larger vehicles have an easier target than smaller vehicles• Different targets exist for cars (143 g/mi) and light trucks (203 g/mi)
• Each OEM does not have to meet the 54.5 mpg target• Targets are determined by individual product lines and their footprints
• No pressure to build small cars to offset fuel economy of large cars• No pressure to build cars to offset fuel economy of pickups and SUVs
28
AutoForecast Solutions
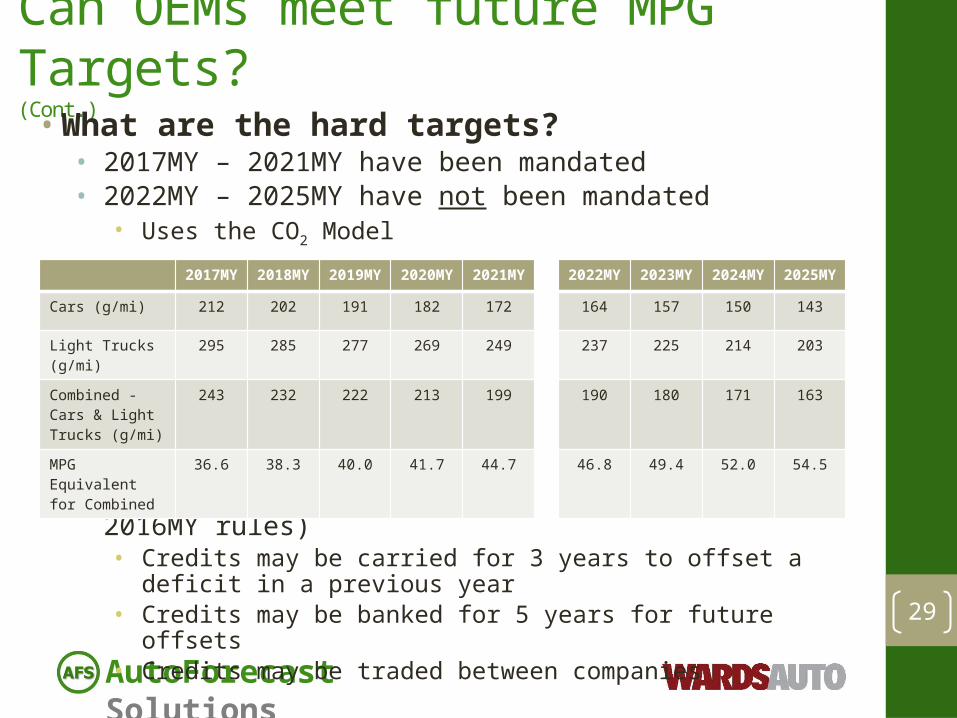
Can OEMs meet future MPG Targets?(Cont.)
• What are the hard targets?• 2017MY – 2021MY have been mandated• 2022MY – 2025MY have not been mandated
• Uses the CO2 Model
29
• Credit Banking and Trading (same as 2012MY-2016MY rules)• Credits may be carried for 3 years to offset a deficit in a previous year• Credits may be banked for 5 years for future offsets• Credits may be traded between companies
2017MY 2018MY 2019MY 2020MY 2021MY 2022MY 2023MY 2024MY 2025MY
Cars (g/mi) 212 202 191 182 172 164 157 150 143
Light Trucks (g/mi) 295 285 277 269 249 237 225 214 203
Combined - Cars & Light Trucks (g/mi)
243 232 222 213 199 190 180 171 163
MPG Equivalent for Combined
36.6 38.3 40.0 41.7 44.7 46.8 49.4 52.0 54.5

AutoForecast Solutions
Can OEMs meet future MPG Targets?(Cont.)
• Credits for implementing new technologies• Credits can be earned to help achieve targets
• Multiplier concept adopted for alternative powered vehicles• Each vehicle is multiplied by a factor in meeting emissions targets for the
2017MY to 2021MY timeframe – 2022MY+ uses no multipliers• EVs and FCVs (2.0 in 2017MY going to 1.5 in 2021MY)• PHEVs and CNG (1.6 in 2017MY going to 1.3 in 2021MY)
• Full-Size Pickup Hybridization Credits• Mild HEV - 10g/mi credit for each vehicle, if used on at least 20% in 2017MY
full-size pickups, ramping up to 80% in 2021MY• Strong HEV – 20g/mi credit for each vehicle, if used on at least 10% of pickups
• Air Conditioning credits• Using systems that reduce tailpipe CO2 through efficiency improvements• Using refrigerants with much less hydrofluorocarbons (HFCs)
• Off-Cycle credits (efficiency gains not reflected in test cycles)• Solar panels on hybrids• Start/stop systems• Active aerodynamics• Others – If OEM can provide proof that gains exist 30
AutoForecast Solutions
Future Powertrain Technologies• Areas of significant promise
• Compression ignition direct injected gasoline engines (CIDI)• Currently considered the holy grail for gasoline internal combustion
• Mazda claims release of SkyActive generation 2 around 2020 with CIDI• Electronic Valvetrain
• Has been in development for a fairly long time• Difficulty meeting velocity of operation requirements
• Innovative concepts• New battery chemistry for EVs and hybrids
• Increasing power density and shortening recharge times• More a question of when, rather than if
• Improved catalysts for better emissions• Greatly helping with cold start emissions
• Resurgence of 2-stroke• Possible revival using new technologies not previously available
31OEMS are continually going to push on their supply base to help meet current and potential future mandates and differentiate them in the market place.

AutoForecast Solutions
Engine, Transmission, & Drivetrain Trends and OutlookSeptember 16, 2015
Global Powertrain Analysis
Brian MaximVice President, Global Powertrain Forecasting