Embed Size (px)
Citation preview

This article appeared in a journal published by Elsevier. The attachedcopy is furnished to the author for internal non-commercial researchand education use, including for instruction at the authors institution
and sharing with colleagues.
Other uses, including reproduction and distribution, or selling orlicensing copies, or posting to personal, institutional or third party
websites are prohibited.
In most cases authors are permitted to post their version of thearticle (e.g. in Word or Tex form) to their personal website orinstitutional repository. Authors requiring further information
regarding Elsevier’s archiving and manuscript policies areencouraged to visit:
http://www.elsevier.com/copyright
Author's personal copy
Analysis
Cost of potential emerald ash borer damage in U.S. communities, 2009–2019
Kent F. Kovacs a,⁎, Robert G. Haight b, Deborah G. McCullough c,d, Rodrigo J. Mercader c,Nathan W. Siegert c, Andrew M. Liebhold e
a Department of Resource Economics, University of Nevada, Reno, Reno, NV 89557, United Statesb U.S. Forest Service Northern Research Station, 1992 Folwell Ave., St. Paul, MN 55108, United Statesc Department of Entomology, Michigan State University, East Lansing, MI 48824, United Statesd Department of Forestry, Michigan State University, East Lansing, MI 48824, United Statese U.S. Forest Service Northern Research Station, 180 Canfield Street, Morgantown, WV 26505, United States
a b s t r a c ta r t i c l e i n f o
Article history:Received 9 June 2009Received in revised form 28 August 2009Accepted 2 September 2009Available online 21 September 2009
Keywords:Natural disasterInvasive speciesEmerald ash borerCost of ash treatment, removal, andreplacement
Emerald ash borer (Agrilus planipennis Fairmaire), a phloem-feeding beetle native to Asia, was discoverednear Detroit, Michigan and Windsor, Ontario in 2002. As of March 2009, isolated populations of emerald ashborer (EAB) have been detected in nine additional states and Quebec. EAB is a highly invasive forest pest thathas the potential to spread and kill native ash trees (Fraxinus sp.) throughout the United States. We estimatethe discounted cost of ash treatment, removal, and replacement on developed land within communities in a25-state study area centered on Detroit using simulations of EAB spread and infestation over the next decade(2009–2019). An estimated 38 million ash trees occur on this land base. The simulations predict anexpanding EAB infestation that will likely encompass most of the 25 states and warrant treatment, removal,and replacement of more than 17 million ash trees with mean discounted cost of $10.7 billion. Expanding theland base to include developed land outside, as well as inside, communities nearly double the estimates ofthe number of ash trees treated or removed and replaced, and the associated cost. The estimates ofdiscounted cost suggest that a substantial investment might be efficiently spent to slow the expansion ofisolated EAB infestations and postpone the ultimate costs of ash treatment, removal, and replacement.
© 2009 Elsevier B.V. All rights reserved.
1. Introduction
Emerald ash borer (Agrilus planipennis Fairmaire) (Coleoptera:Buprestidae), a phloem-feeding beetle native to Asia, was discoverednear Detroit, Michigan and Windsor, Ontario in the summer of 2002.Increased awareness of emerald ash borer (EAB) and ongoing surveyefforts have led to the detection of numerous EAB populationsthroughout Michigan, Ohio and Indiana. Estimates indicate that morethan 53 million native ash (Fraxinus sp.) trees had been killed by EABin those states by 2007 (Smith et al., submitted for publication). ByMarch 2009, EAB infestations had been found in a total of ten statesand two Canadian provinces (Fig. 1).
Emerald ash borer has the potential to spread and kill ash treesthroughout the United States. Much of the damage caused by EABoccurs on developed land since ash trees have been a popular streettree for decades. The lowgenetic diversity of planted ash in the cities ofthe United States, predominantly white and green ash (F. americana,F. pennsylvanica), enhances the risk to the urban forest resource
(MacFarlane andMeyer, 2005). Most EAB in North America develop ina year, although at very low densities some larvae require two years todevelop (Tluczek et al., 2008). Adult beetles feed on small patches ofash foliage from late May through September and cause negligibledamage. Individual eggs are laid on the bark of ash trees at least 5 cm indiameter at breast height (1.4 m above ground) and hatch in 1–2 wks.Larvae feed under the bark on phloem and cambium, typically frommid summer through fall. Larval galleries effectively girdle the phloemand score the outer sapwood, disrupting nutrient and water transportwithin the tree (Cappaert et al., 2005). As EAB densities build overtime, tree health declines until the tree dies.
Trees with low densities of larvae typically exhibit few or noexternal symptoms (McCullough et al., 2009) and infestations arerarely discovered before canopy dieback or tree mortality occurs.Intensive analysis of trees in localized outlier sites has indicated thattrees typically must be infested by EAB for 3–4 years before theysuccumb (Siegert et al., 2006). Flight mill studies indicate that matedfemales may be physiologically able to fly 5 km (Taylor et al., 2006);however, most adults fly less than 100 m when ash trees are near.Long distance dispersal of EAB can also occur when humansinadvertently transport infested ash nursery trees, logs, firewood orrelated material. Because visual detection of eggs, larvae, and adultbeetles is difficult, multiple cohorts are likely to have dispersed beforethe first sign of infestation is detected.
Ecological Economics 69 (2010) 569–578
⁎ Corresponding author.E-mail addresses: [email protected] (K.F. Kovacs), [email protected]
(R.G. Haight), [email protected] (D.G. McCullough), [email protected](R.J. Mercader), [email protected] (N.W. Siegert), [email protected] (A.M. Liebhold).
0921-8009/$ – see front matter © 2009 Elsevier B.V. All rights reserved.doi:10.1016/j.ecolecon.2009.09.004
Contents lists available at ScienceDirect
Ecological Economics
j ourna l homepage: www.e lsev ie r.com/ locate /eco lecon

Author's personal copy
In response to the threat posed by EAB, federal, state and provincialagencies impose quarantines to restrict the movement of ash frominfested counties, conduct surveys to detect new infestations, andsupport research on EAB biology and management. These programsare expensive, yet there is little economic literature on the cost of EABmanagement and loss fromEABdamage, especially in developed areas.In one example, Sydnor et al. (2007) estimates EAB could result in theremoval and replacement costs of $1.0–$4.2 billion in Ohio commu-nities. Assessing the potential economic impacts of EAB is importantfor evaluating the benefits of efforts to slow the range expansion ofEAB, as well as investments in research on EAB biology andmanagement. To help address this gap, we estimate the discounted
cost of ash treatment, removal, and replacement in communities in a25-state study area centered on Detroit (Fig. 1) by simulating EABinfestation over the next decade (2009–2019) and calculating thecosts associated with ash treatment, removal, and replacement.
Our estimate of the discounted cost of treatment, removal, andreplacement in response to EAB infestation over the 10-yr horizon,$10.7 billion, indicates nearly $1 billion per year in tree treatment,removal, and replacement costs.1 Additional investments could
1 For comparison, the 2008 regulatory, survey and detection, outreach andeducation, biocontrol, and method development investment by the Animal and PlantHealth Inspection Service (APHIS) for EAB was $32 million (Chaloux, 2009).
Fig. 1. Study area with U.S. counties known to be infested (shaded) by emerald ash borer in March 2009. Dots outside the study area represent locations in Canada with known EABinfestations in March 2009. Inset shows cities with tree inventory information and mapping zones we used to estimate ash density. Lighter shaded mapping zones are only partiallycovered by our study area. Note: Rhode Island is not part of the study area because, according to the spreadmodel, no county of Rhode Island becomes infested during the study period.
570 K.F. Kovacs et al. / Ecological Economics 69 (2010) 569–578

Author's personal copy
include continued enforcement of quarantines to restrict transportmovement of ash material, surveys to detect new infestations, andoutreach to increase public awareness. Enhanced investments inresearch on effective control, containment and management strate-gies, survey methodology and related avenues that could slow EABexpansion are also warranted.
2. Methods
The study area (Fig. 1) includes 25 states that we predict will haveEAB infestations by 2019. The next decade (2009–2019) was chosenfor our analysis because this is a logical time frame for the purpose ofplanning a policy response to the EAB invasion. Projecting the EABinfestation and costs further than a decade would require assump-tions that are difficult to justify. Our approach to estimate thediscounted cost of ash treatment, removal, and replacement has threeprimary components. First, we estimate the number of ash trees ondeveloped land. Next, we predict the counties that will be infestedwith EAB over a 10-yr horizon. Finally, we predict the number of treesthat will be treated or removed and replaced in response to infestationand compute the total discounted cost of these activities.
2.1. Estimating the number of ash trees
We estimate the number of ash trees on developed land in U.S.Census-defined communities, which are geographic areas defined byjurisdictional or political boundaries and included in the U.S. Censusdefinitions of places (census-designated place, consolidated city, andincorporated place).2 We use a digital map of communities developedfrom the 2000U.S. Census by theU.S. Forest Service for an assessment ofurban and community forests as part of the Forest and RangelandRenewable Resources Planning Act of 1974 (Nowak and Greenfield,
2008). Communities cover 14.8 million ha in our 226 million ha studyarea.
Communities are defined as places of established human settle-ment and may include both developed and undeveloped land withintheir boundaries.We estimate numbers of ash trees on developed landwithin communities because these ash trees will likely be the highestpriority to treat, remove, and replace. We identify developed landusing the 2001 National Land Cover Database (NLCD, 2001). The NLCD2001 is a raster-based land cover classification derived from satelliteimagery and consistently appliedwith a 30×30 m2 resolution over theUnited States (Homer et al., 2007). The NLCD 2001 has four developedland cover classes based on the percentage of impervious surface andvegetation cover (Homer et al., 2004), and these four land classes cover7.5 million ha of the 14.8 million ha of community land in our studyarea (Table 1).3 We also report the area of tree canopy cover in thedeveloped portions of communities based on NLCD 2001. Tree canopycovers about 13% (942,002 ha) of developed land.
It is important to note that the U.S. Census contains a geographicdefinition of urban area based on population density in census blocksand block groups, which differs from our earlier definition ofcommunity. U.S. Census-defined urban areas and communities mayoverlap but they are not congruent (see Nowak and Greenfield, 2008for examples in the northeastern U.S.). We use communities and noturban areas as geographic units in this study because communitieshave geopolitical boundaries and people within these jurisdictions arelikely to organize and manage their ash trees in response to EABinfestation as a group.4
The numbers of ash trees on developed land in communities areestimated using forest inventory information for 16 cities and threeregions (Table 2) that we obtained from web sites, publications, andpersonal communication with city foresters (Nowak et al., 2001;
2 For detailed definitions, see http://www.census.gov/geo/www/cob/pl_metadata.html.
3 For detailed information, see http://www.mrlc.gov/nlcd.php.4 A small number of “communities” may be historical or special-use districts that no
longer have formal geopolitical boundaries.
Table 1Developed land and canopy cover in U.S. Census Communities and in all land in the study area.
State U.S. Census Communities All land
Developed land(ha)
Canopy cover(ha)
Developed land(ha)
Canopy cover(ha)
Arkansas 223,000 33,500 776,000 177,000Connecticut 136,000 34,000 297,000 96,000Delaware 19,600 962 51,400 2,870Illinois 753,000 47,400 1,690,000 87,800Indiana 368,000 27,800 965,000 54,000Iowa 251,000 18,500 1,060,000 41,000Kentucky 180,000 8980 739,000 89,700Maine 74,300 8360 292,000 20,900Maryland 203,000 21,400 308,000 37,700Massachusetts 252,000 49,700 496,000 134,000Michigan 528,000 53,900 1,590,000 237,000Minnesota 361,000 27,500 1,110,000 64,100Missouri 394,000 39,700 1,210,000 159,000New Hampshire 53,100 9910 180,000 40,200New Jersey 276,000 55,900 474,000 93,600New York 537,000 137,000 1,130,000 296,000North Carolina 500,000 88,700 1,220,000 228,000Ohio 673,000 59,900 1,510,000 156,000Pennsylvania 397,000 54,100 1,260,000 254,000South Carolina 206,000 45,100 663,000 147,000Tennessee 395,000 50,800 938,000 134,000Vermont 19,600 2410 132,000 23,700Virginia andDistrict of Columbia
316,400 35,080 801,400 147,980
West Virginia 75,300 11,700 429,000 148,000Wisconsin 307,000 19,700 970,000 121,000Total 7,498,300 942,002 20,291,800 2,990,550
Note: Rhode Island is not part of the study area because, according to the spread model, no county of Rhode Island becomes infested during the study period.
571K.F. Kovacs et al. / Ecological Economics 69 (2010) 569–578

Author's personal copy
Smith et al., submitted for publication; Sydnor et al., 2007). For the 16cities, the inventory information includes estimates of the totalnumber of ash trees within city boundaries, including trees on publicand private lands. For each city, we divide the number of ash trees bythe area of canopy cover on developed land to obtain an estimate ofash density (Table 2, right-hand column). Across the 16 cities, averageash density is 87 trees per ha of tree cover with a range of three treesper ha in Washington DC to 289 trees per ha in Chicago. Thesignificant variation of the ash densities is because of the wide rangein the ecological, cultural, and historical differences of the cities acrossthe study area.
We also use forest inventory information from three regional studiesof ash resources. Smith et al. (submitted for publication) recorded thespecies, size, and damage of trees in 249 circular 900 m2 plots in a corearea of EAB infestation in Michigan, Ohio, and Indiana in 2007. Of the249 plots, 67 were located in NLCD 2001 developed land types. Fromthese67plots,weestimate an ashdensity of 71 trees perha cover for the33-county core area (Table 2). MacFarlane et al. (submitted forpublication) developed and implemented a large-scale forest inventoryto determine the abundance and spatial distribution of ash trees in 1335plots in southern Lower Michigan in 2004. For the 324 plots on thedeveloped land types of IFMAP, a land classification developed fromsatellite imagery for the state ofMichigan,we estimate an ash density of107 trees per ha cover for southern Lower Michigan. Additionally,Sydnor et al. (2007) surveyed 67 communities in Ohio in 2005 todetermine the size of the ash resource. Based on their estimate of4.3 millionash trees in communities ofOhio,we estimate anaverage ashdensity of 72 trees per ha cover in Ohio communities.
The forest inventory information for cities and regions is the basis forestimatingnumbersof ash treesondeveloped landwithin communities.First, we divide the study area into mapping zones (Fig. 1, inset). Themapping zones are from theNLCD2001 and represent areas of relativelyhomogenous landform, soil, vegetation and spectral reflectance (Homer
et al., 2004). Then, we assign each city or region to a mapping zone andcompute average ash density (trees per ha cover) for the zone.5 Finally,we multiply the average ash density times the area of tree cover ondeveloped lands in communities to estimate number of ash trees in themapping zone. If we did not have inventory information for a particularzone, we use the ash density of the nearest zone.
Since the cost of managing ash trees in areas of EAB infestationdepends on tree size and land use, we also estimate the number of ashtrees by size class and land use in the developed portion ofcommunities in each mapping zone. The extensive tree inventory forthe city of Chicago includes estimates of all trees within the urbanboundary for seven land uses and several diameter classes. From thisdetailed inventory information, we compute ash density (trees per hacover) for residential areas (single-family, multi-unit, and planneddevelopment), non-residential areas (downtown, industrial, openspace, and commercial) and three tree diameter classes (2.5–30 cm,30–61 cm, and >61 cm) (Table 3).6 Street trees are the responsibilityof the community, and we include street trees in the category of non-residential areas. We reallocate 10% of trees from residential areas tothe non-residential areas to account for the street trees, based onestimates of the number of street trees in Indianapolis (Peper et al.,2008). Becausemost of the city tree inventories only include estimatesof numbers of ash trees, we use the relative ash tree densities acrossland use and size classes in Chicago to estimate ash tree densities byland use and size class in each of the other cities.
2.2. Predicting EAB infestation
We use a probabilistic model of EAB spread to compute 100scenarios of EAB infestation across the study area over the next decade,2009–2019. The model is run on a 7046 equidistant point gridextending from 30.25 to 49.64 °N and 61.12 to 98.22 °W, excludingmajor bodies of water. This effectively divides the study area into cellsapproximately 23×25 km2 in size. The model uses a negativeexponential function to predict the annual probability that EAB in aninfested cell will spread and cause an infestation in a vacant cell at adetectable level. The probability of spread, p, depends on the distance,d (km), between cell midpoints:7
p = 0:94e−0:06d ð1Þ
In each scenario, the model begins with the locations of known EABinfestations in the U.S. and Canada in March 2009 (Fig. 1) and predictsthe spread of the infestations for 10 years to March 2019. During eachyear, each vacant cell is tested to see whether it becomes infested at a
5 For example, if forest inventory information is available for three cities in amapping zone, the average ash density of the three cities is the ash density for thezone.
6 Seven land uses (separated into residential and non-residential areas) and threetree diameter classes are chosen because this is how the most detailed forestinventory, from Chicago, categorizes trees. The ash densities for residential and non-residential areas and the three diameter classes for all the cities and regions in Table 2are based on the ash distribution across these categories from Chicago. For the lowerbound of the smallest tree diameter class, a tree less than 1″ (2.54 cm), is considered ashrub and is not part of the inventory.
7 The spread model does not include population dynamic processes, simply the rateat which infestations are detected.
Table 3Ash (Fraxinus sp.) density by land use and diameter class for the city of Chicago.
Land use Percent ofurban land
Ash treesper ha cover
Ash trees per ha cover bydiameter class
2.5–30 cm 30–61 cm >61 cm
Residential 0.64 141.7 47.5 34.6 8.6Non–residential 0.36 551.9 177.1 17.3 4.3
Table 2Developed land, canopy cover, and ash (Fraxinus sp.) density for selected cities andregions in the eastern United States.
Areas Developedland (ha)
Canopycover (ha)
Ash trees per hadeveloped land
Ash trees per hacanopy cover
CitiesAtlanta, GA 24,846 8418 1.57 4.62Baltimore, MD 18,593 1219 16.03 244.44Boston, MA 11,357 663 2.35 40.18Chicago, IL 57,162 1338 6.77 289.37Indianapolis, IN 72,360 8417 2.05 17.65Livonia, MI 8859 981 2.61 23.58Milwaukee, WI 23,142 822 4.08 114.92Minneapolis, MN 13,733 1243 14.58 161.06Morgantown, WV 1745 309 22.01 124.22Palatine, IL 3300 303 7.94 86.47Philadelphia, PA 29,854 1310 4.36 99.27Syracuse, NY 5912 467 1.13 14.24Troy, MI 8273 940 7.03 61.83Urbana, IL 2477 145 3.40 58.13Washington, DC 13,362 9797 2.40 3.27Wilmington, DE 2522 99 1.62 41.20
Mean 18,594 2279 6.25 86.53Regions
MI, OH, INa 919,470 85,139 6.60 71.28MIb 339,773 35,118 11.06 107.04OHc 673,000 59,900 6.41 72.03
a Counties of Michigan: Gladwin, Arenac, Midland, Gratiot, Saginaw, Tuscola, Huron,Sanilac, Lapeer, Genesse, St. Clair, Shiawassee, Clinton, Eaton, Ingham, Livingston,Oakland, Macomb, Kalamazoo, Calhoun, Jackson,Washtenaw,Wayne, Branch, Hillsdale,Lenawee, Monroe. Counties of Indiana: Lagrange, Steuben. Counties of Ohio: Williams,Fulton, Lucas. (Smith et al., submitted for publication).
b Counties include Gratiot, Mecosta, Montcalm, Newaygo, Barry, Calhoun, Clinton,Eaton, Ionia, Jackson, Shiawassee, Ingham, Livingston, Washtenaw, Kent. (MacFarlaneet al., submitted for publication).
c Urban areas of Ohio (Sydnor et al., 2007).
572 K.F. Kovacs et al. / Ecological Economics 69 (2010) 569–578

Author's personal copy
detectable level.8 The test is a series of Bernoulli trials using theprobabilities of movement from all of the infested cells at thebeginning of the year. If at least one trial is positive, then the vacantcell becomes infested. The two parameters of the probability modelwere selected by contrasting the predictions from simulations startingwith a single infestation near the initial infestation in Wayne County,Michigan, in 1994 (Siegert et al., 2006) to the observed infestations asof March 2009. In particular, 500 simulations of the model wereperformed for each of the 500 permutations of the two parameters(ranging from 0.5–1.5 and 0.01–0.1) and the results were summarizedby distance from the epicenter into 80.5 km intervals. Subsequently,the mean square difference between the actual proportion of infestedcounties and the predicted proportion of counties infested by distanceclass was determined for each model permutation and used toidentify the best fitting parameters.
Muirhead et al. (2006) estimated a negative exponential functionto predict the annual probability of EAB spread based on known sites ofinfestation between 2002 and 2004. Since that model was developed,many more sites have been discovered that were infested between2002 and 2004. Further, dendrochronological evidence suggests thatmany of the sites discovered between 2002 and 2004 were alreadyinfested before 2002 (Siegert et al. unpublished data). Therefore,manyof the infestations discovered between 2002 and 2004 representedimprovements in detection abilities rather than new infestations. Notsurprisingly, the parameters of the two negative exponential modelsdiffer. We do not attempt to mechanistically model long distancemovement of EAB mediated by humans and leave that to future work.
We overlay a map of counties on the center points of the grid topredict whether each county is infested each year. A county isconsidered infested when EAB is detected in at least one grid pointwithin the county. In cases where a county does not have a grid pointwithin its boundaries,9 the county is considered infested when EAB ispresent at the point nearest a boundary. Once an infestation has beendetected in a county, it takes time for EAB to spread and infest all ofthe ash trees in the county. Smitley et al. (2008) estimated that ashdecline moved outward from a point of infestation at a rate of 10.6 kmper year. Evidence from U.S. Forest Service Forest Inventory andAnalysis plots suggests that catastrophic ash mortality in a countybecomes apparent about five years after an infestation has beendetected there (Liebhold et al. unpublished data). From this evidence,we assume that the percent of the ash that is infested in a countyincreases linearly from 0–100% in five years following the detection ofthe initial infestation.
2.3. Estimating the cost of EAB damage
When EAB infests a community, we assume that a homeowner ortree manager maximizes the present value of a stream of benefits andcosts associatedwith each tree by choosing among four actions—1) donothing, 2) remove, 3) remove and replace, or 4) treat with aninsecticide that prevents injury from EAB.10 The annual benefit of atree represents a premium to the property value and depends on treesize (Table 4). Anderson and Cordell (1985) show that the presence ofone medium size hardwood tree on the front of a property increasesthe property value of single-family home by 0.8%, andwe use the priceof an average home in Ohio to compute the premium (AmericanCommunity Survey, 2006). The costs of removal and replacementdepend on tree size, with community managers paying slightly lessthan homeowners (Table 4). Removal and replacement costs comefrom an EAB cost calculator for Indiana (http://www.entm.purdue.
edu/EAB/) and represent the costs of managing 15 cm, 45 cm, and76 cm diameter trees.11
Treatment to prevent injury from EAB commonly involvesinjecting a systemic insecticide directly into the base of the tree. Aninsecticide with emamectin benzoate as an active ingredient preventscolonization and injury from EAB for two years (McCullough et al., inpress). We use insecticide treatment costs (Table 4) from the EABcost calculator for Indiana (http://www.entm.purdue.edu/EAB/) andassume that treatment is required every two years.
We formulate a discrete-time dynamic-programming model todetermine the optimal action depending on tree size (see Appendix A).Given our assumptions of tree benefits and management costs, theoptimal action, from an economic perspective, is to remove and replacesmaller trees (<45 cmdiameter for homeowners and<61 cmdiameterfor tree managers) and treat larger trees. Larger trees have high valuethat can be sustained through time with treatment. Conversely, it isbetter to remove and replace small ash trees to hasten the benefits oflonger-living replacement trees and avoid the cost of treatment.
For each of the 100 scenarios of EAB infestation, we sum the annualdiscounted treatment, removal and replacement costs that take placeover the 10-yr horizon. When a county becomes infested, we assumethat all larger trees (>45 cm diameter for homeowners and >61 cmdiameter for tree managers) are treated with an insecticideimmediately and then every two years until the end of the 10-yrhorizon. Smaller trees (<45 cm diameter for homeowners and<61 cm diameter for tree managers) are removed and replaced atthe time of infestation, assuming that 20% of the ash trees are infestedeach year following the county's initial infestation.12 For home-owners, half the ash trees in the tree diameter size class 30–61 cm aretreated, and the other half are removed and replaced. For treemanagers, all the ash trees in the tree diameter class 30–61 cm areremoved and replaced. Once the discounted cost is computed for eachinfestation scenario, we compute themean and standard deviation fortotal discounted cost over the 100 simulations.
The annual costs of treatment, removal, and replacement arediscounted to the present with a 2% real discount rate. Howarth(2009) observes that the future benefits of a public good, such as theremoval and replacement of a dead ash tree, should be discounted at arate close to the market rate of return for risk-free financial assets.This holds true even when the public good has risk characteristicsequivalent to those of risky forms of wealth such as corporate stocks.
8 There is no information available on the level of the infestation. The model onlydescribes when an infestation is detected.
9 This is the case for some counties in Virginia, for instance.10 The homeowner and tree manager models assume that the insecticide is 100%effective at preventing ash trees from being infested.
11 The City of Westland began a major ash tree removal in 2002 and finished in late2004 with a median removal and replacement cost of $635 per tree (MichiganDepartment of Natural Resources, 2007).12 The decisions are optimal according to the model, but a number of factors, forexample sentimental attachment or uncertainty surrounding the effectiveness of thetreatment, could result in a different decision by homeowner or tree manager.
Table 4Management costs and annual benefits estimated for homeowners and communitymanagers based on ash tree diameter at breast height (DBH; 1.4 m aboveground).
Landowner Costs and benefits ($/tree)
Remove Remove and replace Treat Annual benefit
Tree size=2.5–30 cm in DBHHomeowner 200 600 54 289Community 150 450 50 289
Tree size=30–61 cm in DBHHomeowner 400 800 120 723Community 300 600 100 723
Tree size = >61 cm in DBHHomeowner 1100 1500 200 1259Community 900 1200 150 1259
Costs estimates come from the EAB Cost Calculator (http://www.entm.purdue.edu/EAB/).
573K.F. Kovacs et al. / Ecological Economics 69 (2010) 569–578
Author's personal copy
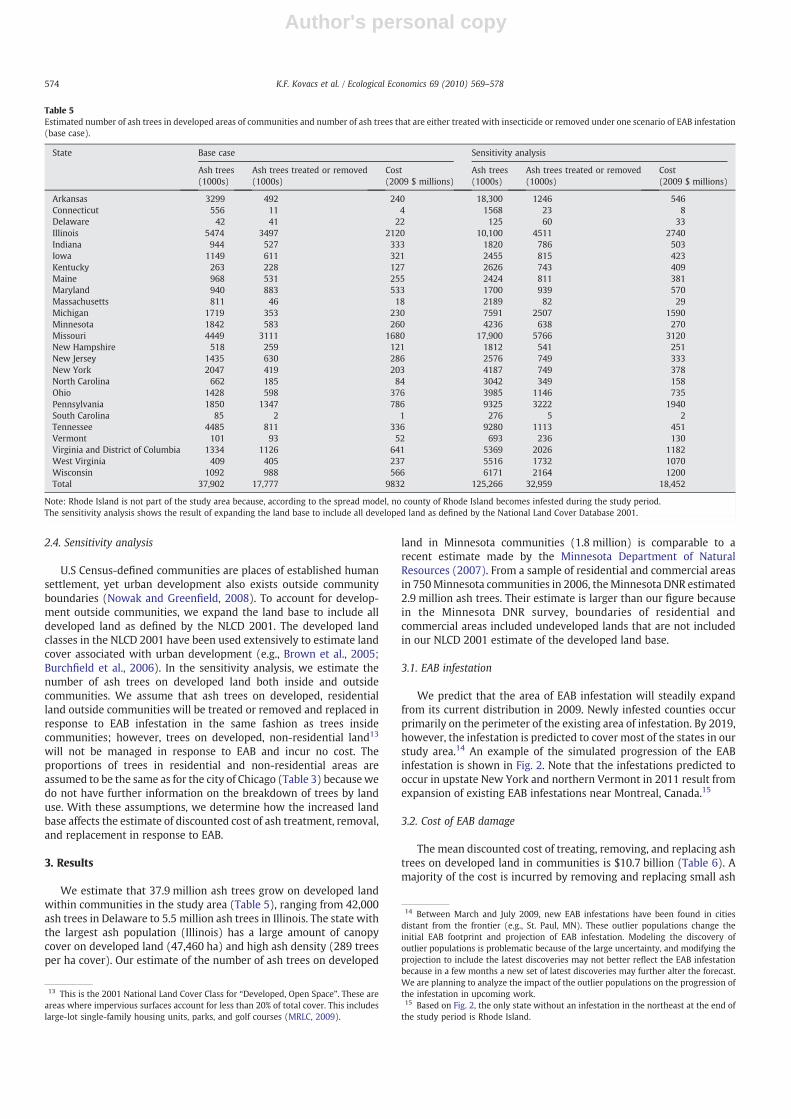
2.4. Sensitivity analysis
U.S Census-defined communities are places of established humansettlement, yet urban development also exists outside communityboundaries (Nowak and Greenfield, 2008). To account for develop-ment outside communities, we expand the land base to include alldeveloped land as defined by the NLCD 2001. The developed landclasses in the NLCD 2001 have been used extensively to estimate landcover associated with urban development (e.g., Brown et al., 2005;Burchfield et al., 2006). In the sensitivity analysis, we estimate thenumber of ash trees on developed land both inside and outsidecommunities. We assume that ash trees on developed, residentialland outside communities will be treated or removed and replaced inresponse to EAB infestation in the same fashion as trees insidecommunities; however, trees on developed, non-residential land13
will not be managed in response to EAB and incur no cost. Theproportions of trees in residential and non-residential areas areassumed to be the same as for the city of Chicago (Table 3) becausewedo not have further information on the breakdown of trees by landuse. With these assumptions, we determine how the increased landbase affects the estimate of discounted cost of ash treatment, removal,and replacement in response to EAB.
3. Results
We estimate that 37.9 million ash trees grow on developed landwithin communities in the study area (Table 5), ranging from 42,000ash trees in Delaware to 5.5 million ash trees in Illinois. The state withthe largest ash population (Illinois) has a large amount of canopycover on developed land (47,460 ha) and high ash density (289 treesper ha cover). Our estimate of the number of ash trees on developed
land in Minnesota communities (1.8 million) is comparable to arecent estimate made by the Minnesota Department of NaturalResources (2007). From a sample of residential and commercial areasin 750Minnesota communities in 2006, theMinnesota DNR estimated2.9 million ash trees. Their estimate is larger than our figure becausein the Minnesota DNR survey, boundaries of residential andcommercial areas included undeveloped lands that are not includedin our NLCD 2001 estimate of the developed land base.
3.1. EAB infestation
We predict that the area of EAB infestation will steadily expandfrom its current distribution in 2009. Newly infested counties occurprimarily on the perimeter of the existing area of infestation. By 2019,however, the infestation is predicted to cover most of the states in ourstudy area.14 An example of the simulated progression of the EABinfestation is shown in Fig. 2. Note that the infestations predicted tooccur in upstate New York and northern Vermont in 2011 result fromexpansion of existing EAB infestations near Montreal, Canada.15
3.2. Cost of EAB damage
The mean discounted cost of treating, removing, and replacing ashtrees on developed land in communities is $10.7 billion (Table 6). Amajority of the cost is incurred by removing and replacing small ash
13 This is the 2001 National Land Cover Class for “Developed, Open Space”. These areareas where impervious surfaces account for less than 20% of total cover. This includeslarge-lot single-family housing units, parks, and golf courses (MRLC, 2009).
14 Between March and July 2009, new EAB infestations have been found in citiesdistant from the frontier (e.g., St. Paul, MN). These outlier populations change theinitial EAB footprint and projection of EAB infestation. Modeling the discovery ofoutlier populations is problematic because of the large uncertainty, and modifying theprojection to include the latest discoveries may not better reflect the EAB infestationbecause in a few months a new set of latest discoveries may further alter the forecast.We are planning to analyze the impact of the outlier populations on the progression ofthe infestation in upcoming work.15 Based on Fig. 2, the only state without an infestation in the northeast at the end ofthe study period is Rhode Island.
Table 5Estimated number of ash trees in developed areas of communities and number of ash trees that are either treated with insecticide or removed under one scenario of EAB infestation(base case).
State Base case Sensitivity analysis
Ash trees(1000s)
Ash trees treated or removed(1000s)
Cost(2009 $ millions)
Ash trees(1000s)
Ash trees treated or removed(1000s)
Cost(2009 $ millions)
Arkansas 3299 492 240 18,300 1246 546Connecticut 556 11 4 1568 23 8Delaware 42 41 22 125 60 33Illinois 5474 3497 2120 10,100 4511 2740Indiana 944 527 333 1820 786 503Iowa 1149 611 321 2455 815 423Kentucky 263 228 127 2626 743 409Maine 968 531 255 2424 811 381Maryland 940 883 533 1700 939 570Massachusetts 811 46 18 2189 82 29Michigan 1719 353 230 7591 2507 1590Minnesota 1842 583 260 4236 638 270Missouri 4449 3111 1680 17,900 5766 3120New Hampshire 518 259 121 1812 541 251New Jersey 1435 630 286 2576 749 333New York 2047 419 203 4187 749 378North Carolina 662 185 84 3042 349 158Ohio 1428 598 376 3985 1146 735Pennsylvania 1850 1347 786 9325 3222 1940South Carolina 85 2 1 276 5 2Tennessee 4485 811 336 9280 1113 451Vermont 101 93 52 693 236 130Virginia and District of Columbia 1334 1126 641 5369 2026 1182West Virginia 409 405 237 5516 1732 1070Wisconsin 1092 988 566 6171 2164 1200Total 37,902 17,777 9832 125,266 32,959 18,452
Note: Rhode Island is not part of the study area because, according to the spread model, no county of Rhode Island becomes infested during the study period.The sensitivity analysis shows the result of expanding the land base to include all developed land as defined by the National Land Cover Database 2001.
574 K.F. Kovacs et al. / Ecological Economics 69 (2010) 569–578

Author's personal copy
trees on non-residential land. If all 37.9 million ash trees on developedland in communities are assumed to be removed and replaced at once,a common assumption in other studies (e.g., Sydnor et al., 2007), thetotal cost is $25.0 billion, more than double our estimate. Thedifference reflects our prediction that fewer than half of the37.9 million ash trees will be treated or removed and replaced inthe 10-yr horizon and our assumption that costs incurred later in thehorizon are discounted.
The discounted costs in Table 6 represent averages computed from100 simulations of EAB spread across the study area. For thesimulation illustrated in Fig. 2, slightly less than half of the ash treeson developed land in communities (17.7 million) are treated orremoved and replaced over the 10-yr horizon (Table 5). States withthe highest proportion of ash trees removed and replaced (>90%)
Fig. 2. A simulation of emerald ash borer distribution in counties fromMarch 2010 to March 2019. Darker counties are newly invaded while lighter counties became infested in prioryears. These maps represent only a single realization of 100 stochastic simulations.
Table 6Mean (± standard deviations in parentheses) discounted treatment, removal, andreplacement cost ($billion) computed over 100 simulations of EAB infestation.
Land use Diameter class (cm) Total
2.5–30 30–61 >61
Residential 1.45(0.09)
1.32(0.08)
0.30(0.02)
3.07(0.13)
Non-residential 6.14(0.42)
1.04(0.07)
0.43(0.02)
7.61(0.43)
Total 7.59(0.44)
2.36(0.10)
0.73(0.02)
10.68(0.69)
575K.F. Kovacs et al. / Ecological Economics 69 (2010) 569–578

Author's personal copy
have outlier populations in 2009 that expand across the entire stateduring the 10-yr horizon (West Virginia, Maryland, Delaware,Wisconsin, and Vermont). In Michigan and Ohio, small proportionsof ash are removed and replaced (0.21 and 0.42, respectively) becausemany counties were infested prior to 2009 and we assume that muchof the ash has already been removed and replaced.16 The totaldiscounted cost of treatment, removal, and replacement in thesimulation in Fig. 2 is $9.8 billion, slightly less than the average costcomputed from the 100 simulations of potential EAB spread.
3.3. Sensitivity analysis
Expanding the land base to include all developed land as definedby the NLCD 2001 more than triples the estimate of number of ashtrees from 37.9 million to 125.3 million (Table 5). Three regional ashinventories have estimates that are comparable to our state-wideestimates of ash on developed land. Using inventory plots located inNLCD 2001 developed land cover types, Smith et al. (submitted forpublication) estimated 6.1 million ash trees in a core area of EABinfestation in Michigan, Indiana and Illinois. We estimate 7.6 millionash trees on developed land for the entire state of Michigan. Based ona survey of community foresters in 67 Ohio communities, Sydnor et al.(2007) estimated 3.8 ash trees per capita in those communities. Thatfigure was multiplied by the total Ohio population to obtain theirestimate of 4.3 million urban ash trees in the state. Assuming thisestimate represents the number of ash trees on developed land, it iscomparable to our estimate of 4.0 million ash trees on developed landin Ohio. From 111 plots located in U.S. Census-defined urban areas inWisconsin, Cumming et al. (2007) estimated 5.2 million urban ashtrees compared with our estimate of 6.2 million ash trees ondeveloped land in Wisconsin. The main reason for the difference isthat U.S. Census-defined urban areas are based on population densityin county subdivisions and do not include small areas of developedland that do not meet the population density requirements.
Using the larger land base, we estimate that the number of ash treestreated or removed and replaced in response to one scenario of EABinfestation (32.9 million) is almost twice asmany aswe estimated usingdeveloped landwithin U.S. Census-defined communities (17.7 million).Similarly, the discounted cost of treatment, removal and replacement($18.5 billion) is almost twice asmuch as our estimate of thediscountedcost ($9.8 billion) of treatment, removal and replacement on developedland within communities. We note that the proportion of ash trees thatare treated or removed and replaced (0.26) in the sensitivity analysis isless than the proportion of ash trees treated or removed and replaced inthe base case (0.47). The difference is caused by our assumption in thesensitivity analysis that non-residential trees on developed land outsidecommunities are not treated or removed and replaced in response toinfestation.17 The sensitivity analysis demonstrates that estimates of thenumberof ash and cost of EABdamage aredependent on the data sourceand definition of the land base.
4. Conclusions
Our estimate of the discounted cost of treatment, removal, andreplacement in response to EAB infestation over a 10-yr horizon from2009–2019 is $10.7 billion. Since the cost of treating, removing, andreplacing all the 37.9 million ash trees on developed land incommunities at once is $25 billion, this indicates a justification for
substantial investment to slow the spread of EAB and postponetreatment, removal, and replacement costs if feasible. These invest-ments could include continued enforcement of quarantines to restricttransport movement of ash material, surveys to detect additionalinfestations, and outreach to increase public awareness. Enhancedinvestments in research on effective control, containment andmanagement strategies, survey methodology and related avenuesthat could slow the rate at which EAB populations build and expandare also warranted.
In addition to the land base assumption that we tested in thesensitivity analysis, other assumptions may affect our estimates oftreatment, removal, and replacement costs. Our cost estimates arebased on the assumption that homeowners and community forestersmanage ash trees to maximize present value of tree benefit netmanagement cost, and the best actions are either treatment orremoval and replacement. If homeowners or community forestershave cost constraints or place lower values on ash trees than weassume, fewer ash trees than we predict will be treated or removedand replaced, and we overestimate management costs. Treatingrather than removing and replacing trees larger than 30 cm indiameter is economically beneficial, assuming that treatment effec-tively prevents EAB damage. Very large trees (> 61 cm diameter) canbe difficult to treat effectively with systemic insecticides because ofthe difficulty of ensuring that the product is well distributed withinthe tree (Herms et al., 2009). Accounting for a reduction ineffectiveness would narrow the range of tree sizes for which it isbetter to treat, which will increase the overall estimate of manage-ment cost because tree removal and replacement is more expensive.
USDA Plant Protection and Quarantine (PPQ) within the Animal andPlant Health Inspection Service (APHIS) and the state plant pestregulatory agencies monitor and regulate potential pathways forartificial movement.18 We did not attempt to specifically model longdistance dispersal of EAB caused by humans, and as a result, we do notpredict the establishment of outlier populations. To the extent that theestablishment of outlier EAB populations increases the rate at whichcounties become infested, ourmodel underestimates the progression ofspread and the discounted cost of treatment, removal, and replacement.
Two other issues need further attention to improve estimates ofthe economic impacts of EAB. A systematic sample of communityforests throughout the study area is needed to obtain statisticallysound estimates of the number and size of ash trees on residential andnon-residential lands. While estimates of ash abundance in commu-nities for which tree inventory data are available appear robust,expanding those numbers to places without tree inventories, as we dohere, should be viewed with some caution because inventories areonly available from a limited number of communities and do notrepresent a random sample. Our estimate of the discounted cost oftreatment, removal, and replacement in response to EAB infestation isonly a management cost and represents an income transfer fromhomeowners and communities to the tree-care industry. There arealso net losses to society from the invasion of EAB (e.g., losses inmarket and non-market values of ash trees) that need to be counted,including losses of forest landowners and thewood products industry.
Acknowledgement
The authors are grateful to David Nowak and Eric Greenfield forsharing digital maps of U.S. Census-defined communities and data for2001 NLCD developed areas and tree cover. Anne Cumming, DouglasMoore, David Nowak, Amelia Nuding, Lindsey Purcell, Noel Schneeber-ger, David Sivyer, Eric Smith, and T. Davis Sydnor provided tree
16 Evidence of removal rates from Michigan and Ohio of ash trees on developed landwould be useful for calibrating the removal of trees in the simulation model. Asystematic sample of ash tree removals in developed areas infested prior to 2009 isneeded to obtain statistically sound estimates of the removal rates of urban ash.17 We assume that ash on non-residential land outside of communities does notinfluence property values since the trees are not sufficiently close to dwellingstructures to have an amenity effect on property values. The optimal action is “donothing” since any other actions yields no benefit and is costly.
18 There are no outlier populations found that post-date when these regulatoryprograms were fully operational. The regulatory program investments are assumed tobe effective and necessary to maintain. We thank an anonymous reviewer for pointingthis out.
576 K.F. Kovacs et al. / Ecological Economics 69 (2010) 569–578

Author's personal copy
inventory information for cities and regions. This work was conductedas part of the Ecological and Economic Impacts of Non-native ForestPests and Pathogens in North America Working Group, supported byTheNature Conservancy and TheNational Center for Ecological Analysisand Synthesis, a Center funded by NSF (Grant #DEB-0553768), theUniversity of California, Santa Barbara, and the State of California. Theauthors also acknowledge the support of the U.S. Forest ServiceNorthern Research Station.
Appendix A
We suppose an infestation of the emerald ash borer has reached aparticular city. A homeowner ormanager has four options for each ashtree: 1) do nothing, 2) remove the ash tree, 3) remove the ash tree andreplace it with another tree resistant to the emerald ash borer (e.g., amaple tree), or 4) treat the ash tree with a chemical that preventsinfestation. We formulate a discrete-time dynamic-programmingmodel to determine the optimal action depending on tree age, fromwhich we calculate tree size using equations for predicting thediameter of street trees (Peper et al., 2001).
We assume that the landowner chooses the action that maximizesthe present value of tree benefit net the cost of treatment, removal, orremoval and replacement. The annual benefit of a tree represents apremium to the property value and depends on tree age. The tree mayalso cause a reduction in property value if it dies and is left standing(Holmes and Smith, 2007).19 We define an optimal value function V(a) as the present value of the optimal sequence of actions applied toan ash tree age a. If the landowner does nothing, the dead tree resultsin an annual loss of property value, cdn(a), that diminishes over timeas the tree decomposes. The landowner may remove the ash tree withcost crm(a). Removing and replacing the ash tree produce a presentvalue of a stream of benefits associated with the replacement tree,pmaple, net removal and replacement cost crp(a). Treating the ashproduces a benefit pash(a) during the year net cost of treatment ctreat(a) plus the discounted value of the optimal policy for the ash tree oneyear older, V(a+1). The optimal value function is:
VðaÞ = max
−cdnðaÞ donothing−crmðaÞ removepmaple−crpðaÞ removeandreplacepashðaÞ−ctreatðaÞ + δVða + 1Þ treat
8>><>>:
where δ is the discount factor. The optimal value function is solvedbackward from amaximum age nwhenwe assume that the ash tree iseither removed or replaced:
VðnÞ = max−crmðnÞ removepmaple−crpðnÞ removeandreplace :
�
We solve this dynamic-programming model with the managementcosts and benefits in Table 4, a real discount rate of 2%, and amaximum tree age of 85 years. The optimal action is to remove andreplace trees less than 30 cm diameter and treat larger trees. It isbetter to treat trees larger than 30 cm diameter because they havehigh value which can be sustained through time with the treatment.Likewise, it is better to remove and replace small ash trees to hastenthe attainment of the benefits of longer-living replacement trees.
References
American Community Survey (ACS), 2006. Public Use Microdata Sample. U.S. CensusBureau — ACS. [Distributor].
Anderson, L.M., Cordell, H.K., 1985. Residential property values improve by landscapingwith trees. Southern Journal of Applied Forestry 9, 162–166.
Brown, D.G., Johnson, K.M., Loveland, T.R., Theobald, D.M., 2005. Rural land-use trendsin the conterminous United States, 1950–2000. Ecological Applications 15,1851–1863.
Burchfield, M., Overman, H.G., Puga, D., Turner, M.A., 2006. Causes of sprawl: a portraitfrom space. Quarterly Journal of Economics 121, 587–633.
Cappaert, D.L., McCullough, D.G., Poland, T.M., Siegert, N.W., 2005. Emerald ash borer inNorth America: a research and regulatory challenge. American Entomologist 51 (3),152–165.
Chaloux, P. APHIS, Acting National Program Coordinator, EAB: Personal CommunicationAugust 7, 2009.
Cumming, A.B., Nowak, D.J., Twardus, D.B., Hoehn, R., Mielke, M., Rideout, R., 2007. NA-FR-05-07 Urban Forests of Wisconsin: Pilot Monitoring Project 2002. U.S.Department of Agriculture, Forest Service, Northeastern Area State and PrivateForestry, Newtown Square, PA. 33 pp.
Herms, D.A., McCullough, D.G., Smitley, D.R., Sadof, C., Williamson, R.C., Nixon, P.L.,Insecticide options for protecting ash trees from emerald ash borer. Extensionbulletin available at http://www.emeraldashborer.info/files/Multistate_EAB_Insec-ticide_Fact_Sheet.pdf and Ohio State University Extension. Wooster, Ohio. 2009.
Holmes, T.P., Smith, B., 2007. Linking Sudden Oak Death with Spatial Economic ValueTransfer. Proceedings of the Sudden Oak Death Third Science Symposium. U.S.Forest Service Gen. Tech. Rep. PSW-GTR-214. 294 pp. http://www.fs.fed.us/psw/publications/documents/psw_gtr214/psw_gtr214_289-298_holmes.pdf.
Homer, C., Huang, C., Yang, L., Wylle, B., Coan, M., 2004. Development of a 2001 NationalLand-Cover Database for the United States. Photogrammetric Engineering andRemote Sensing 70, 829–840.
Homer, C., Dewitz, J., Fry, J., Coan, M., Hossain, N., Larson, C., Herold, N., McKerrow, A.,Vandriel, J.N., Wickham, J., 2007. Completion of the 2001 National Land CoverDatabase for the conterminous United States. Photogrammetric Engineering andRemote Sensing 73, 337–341.
Howarth, R.B., 2009. Discounting, uncertainty, and revealed time preference. LandEconomics 85 (1), 24–40.
MacFarlane, D.W., Meyer, S.P., 2005. Characteristics and distribution of potential ashtree hosts for emerald ash borer. Forest Ecology and Management 213, 15–24.
MacFarlane, D.W., Friedman, S.K., Rubin, B.D. and Schneeberger, N.F., Assessing thespatial distribution of ash trees for increased efficiency in sampling for the emeraldash borer. Unpublished report submitted for publication to U.S. Forest ServiceNortheastern Area.
McCullough, D.G., Poland, T.M., Cappaert, D., 2009. Emerald ash borer (Agrilusplanipennis Fairmaire) attraction to ash trees stressed by girdling, herbicide orwounding. Canadian Journal of Forest Research. 39(7), 1331–1345.
McCullough, D.G., Siegert, N.W., Bedford, J., in press. Slowing ash mortality: a potentialstrategy to SLAM emerald ash borer in outlier sites. Proceedings of the NorthAmerican symposium on Invasive Forest Species. January, 2009. Annapolis,Maryland.
Michigan Department of Natural Resources, 2007. Emerald Ash Borer PreparednessPlan. Report on file with the Forest, Mineral and Fire Management, MichiganDepartment of Natural Resources, Lansing, MI. 37 pp. http://www.goodcamper.info/files/EAB_Preparedness_Plan_Final.pdf.
Minnesota Department of Natural Resources, 2007. Rapid assessment of ash and elmresources in Minnesota communities. Report on File with the Resource AssessmentUnit, Forestry Division, Minnesota Department of Natural Resources, Grand Rapis,MN. 15 p.
Multi-Resolution Land Characteristics Consortium (MRLC). NLCD 2001 Land CoverClass Definitions. http://www.mrlc.gov/nlcd_definitions.php#. May 13, 2009.
Muirhead, J.R., Leung, B., van Overdijk, C., Kelly, D.W., Nandakumar, K., Marchant, K.R.,MacIsaac, H.J., 2006. Modelling local and long-distance dispersal of invasiveemerald ash borer Agrilus planipennis (Coleoptera) in North America. Diversity andDistributions 12, 71–79.
Nowak, D.J. and Greenfield, E.J. 2008. Urban and community forests of New England:Connecticut, Maine, Massachusetts, New Hampshire, Rhode Island, Vermont. Gen.Tech. Rep. NRS-38. Newtown Square, PA: U.S. Department of Agriculture, ForestService, Northern Research Station. 62 pp.
Nowak, D.J., Noble, M.H., Sisinni, S.M., Dwyer, J.F., 2001. Assessing the US urban forestresource. Journal of Forestry 99 (3), 37–42.
Peper, P.J., McPherson, E.G., Mori, S.M., 2001. Equations for predicting diameter, height,crown width, and leaf area of San Joaquin Valley street trees. Journal ofArboriculture 27 (6), 306–317.
Peper, P.J., McPherson, E.G., Simpson, J.R., Vargas, K.E. and Xiao, Q., 2008. City ofIndianapolis, Indiana, Municipal Forest Resource Analysis. Center for Urban ForestResearch. U.S. Department of Agriculture, Pacific Southwest Research Station, Tech.Rep. for Indy Parks and Recreation Department. City of Indianapolis, Indiana. 2 pp.
Siegert, N.W., McCullough, D.G., Liebhold, A.M. and Telewski, F.W., 2006. Spread anddispersal of emerald ash borer: a dendrochronological approach. P. 10, In: Mastro,V., R. Reardon and G. Parra, compilers. Proceedings of the Emerald Ash BorerResearch and Technology Development Meeting. September 26–27, 2005. Pitts-burg, Pennsylvania. U.S. Forest Service, Forest Health Technology Enterprise Team,FHTET-2005–16.
Smith, E.L., Storer, A.J. and Roosien, B.K., Emerald ash borer infestation rates inMichigan, Ohio, and Indiana. Unpublished report submitted for publication to U.S.Forest Service Northeastern Area.
Smitley, D., Davis, T., Rebek, E., 2008. Progression of ash canopy thinning and diebackoutward from the initial infestation of emerald ash borer (Coleoptera: Buprestidae)in southeastern Michigan. Journal of Economic Entomology 101, 1643–1650.
Sydnor, T.D., Bumgardner, M., Todd, A., 2007. The potential economic impacts ofemerald ash borer (Agrilus planipennis) on Ohio, U.S., communities. Arboriculture &Urban Forestry 33 (1), 48–54.
19 Note though, that unless the homeowner has their home on the market, this lossmay not be an immediate concern.
577K.F. Kovacs et al. / Ecological Economics 69 (2010) 569–578

Author's personal copy
Taylor, R.A.J., Poland, T.M., Bauer, L.S. and Haack, R.A., 2006. Is emerald ash borer anobligate migrant? P. 14, In: Mastro, V., R. Reardon and G. Parra, compilers.Proceedings of the Emerald Ash Borer Research and Technology DevelopmentMeeting. September 26–27, 2005. Pittsburg, Pennsylvania. U.S. Forest Service,Forest Health Technology Enterprise Team, FHTET-2005-16.
Tluczek, A.R., McCullough, D.G., Poland, T.M. and Anulewicz, A.C., 2008. Effects of hoststress on EAB development: what makes a good home? Pp. 32–33, In: Mastro, V.and R. Reardon, compilers. Proceedings of the Emerald Ash Borer Research andTechnology Development Meeting. October 2007. Pittsburg, PA. U.S. Forest Service,Forest Health Technology Enterprise Team, FHTET-2008-07.
578 K.F. Kovacs et al. / Ecological Economics 69 (2010) 569–578