Embed Size (px)
Citation preview
Author's personal copy
On the feasibility of solar-powered irrigation
Leah C. Kelley a,*, Eric Gilbertson a, Anwar Sheikh b, Steven D. Eppinger c, Steven Dubowsky a
aDepartment of Mechanical Engineering, Massachusetts Institute of Technology, Cambridge, MA 02139, USAbDepartment of Mechanical Engineering, King Fahd University of Petroleum and Minerals, Dhahran 31261, Saudi Arabiac Sloan School of Management, Massachusetts Institute of Technology, Cambridge, MA 02139, USA
Contents
1. Introduction . . . . . . . . . . . . . . . . . . . . . . . . . . . . . . . . . . . . . . . . . . . . . . . . . . . . . . . . . . . . . . . . . . . . . . . . . . . . . . . . . . . . . . . . . . . . . . . . . . . . 26701.1. Motivation. . . . . . . . . . . . . . . . . . . . . . . . . . . . . . . . . . . . . . . . . . . . . . . . . . . . . . . . . . . . . . . . . . . . . . . . . . . . . . . . . . . . . . . . . . . . . . . . 26701.2. Background and literature . . . . . . . . . . . . . . . . . . . . . . . . . . . . . . . . . . . . . . . . . . . . . . . . . . . . . . . . . . . . . . . . . . . . . . . . . . . . . . . . . . . 26711.3. Approach . . . . . . . . . . . . . . . . . . . . . . . . . . . . . . . . . . . . . . . . . . . . . . . . . . . . . . . . . . . . . . . . . . . . . . . . . . . . . . . . . . . . . . . . . . . . . . . . . 26711.4. Results and conclusions . . . . . . . . . . . . . . . . . . . . . . . . . . . . . . . . . . . . . . . . . . . . . . . . . . . . . . . . . . . . . . . . . . . . . . . . . . . . . . . . . . . . . 2671
2. Analysis . . . . . . . . . . . . . . . . . . . . . . . . . . . . . . . . . . . . . . . . . . . . . . . . . . . . . . . . . . . . . . . . . . . . . . . . . . . . . . . . . . . . . . . . . . . . . . . . . . . . . . . 26712.1. Assumptions . . . . . . . . . . . . . . . . . . . . . . . . . . . . . . . . . . . . . . . . . . . . . . . . . . . . . . . . . . . . . . . . . . . . . . . . . . . . . . . . . . . . . . . . . . . . . . 26712.2. Exemplar irrigation system . . . . . . . . . . . . . . . . . . . . . . . . . . . . . . . . . . . . . . . . . . . . . . . . . . . . . . . . . . . . . . . . . . . . . . . . . . . . . . . . . . 26712.3. Irrigation requirements . . . . . . . . . . . . . . . . . . . . . . . . . . . . . . . . . . . . . . . . . . . . . . . . . . . . . . . . . . . . . . . . . . . . . . . . . . . . . . . . . . . . . 2672
2.3.1. Determining solar insolation. . . . . . . . . . . . . . . . . . . . . . . . . . . . . . . . . . . . . . . . . . . . . . . . . . . . . . . . . . . . . . . . . . . . . . . . . . 26722.3.2. Water . . . . . . . . . . . . . . . . . . . . . . . . . . . . . . . . . . . . . . . . . . . . . . . . . . . . . . . . . . . . . . . . . . . . . . . . . . . . . . . . . . . . . . . . . . . . 2672
2.4. Technical feasibility . . . . . . . . . . . . . . . . . . . . . . . . . . . . . . . . . . . . . . . . . . . . . . . . . . . . . . . . . . . . . . . . . . . . . . . . . . . . . . . . . . . . . . . . 26722.5. General trends. . . . . . . . . . . . . . . . . . . . . . . . . . . . . . . . . . . . . . . . . . . . . . . . . . . . . . . . . . . . . . . . . . . . . . . . . . . . . . . . . . . . . . . . . . . . . 26752.6. Economic feasibility . . . . . . . . . . . . . . . . . . . . . . . . . . . . . . . . . . . . . . . . . . . . . . . . . . . . . . . . . . . . . . . . . . . . . . . . . . . . . . . . . . . . . . . . 2676
2.6.1. Assumptions . . . . . . . . . . . . . . . . . . . . . . . . . . . . . . . . . . . . . . . . . . . . . . . . . . . . . . . . . . . . . . . . . . . . . . . . . . . . . . . . . . . . . . 26762.6.2. Capital costs. . . . . . . . . . . . . . . . . . . . . . . . . . . . . . . . . . . . . . . . . . . . . . . . . . . . . . . . . . . . . . . . . . . . . . . . . . . . . . . . . . . . . . . 26762.6.3. Operating and maintenance costs. . . . . . . . . . . . . . . . . . . . . . . . . . . . . . . . . . . . . . . . . . . . . . . . . . . . . . . . . . . . . . . . . . . . . . 26772.6.4. Fuel costs . . . . . . . . . . . . . . . . . . . . . . . . . . . . . . . . . . . . . . . . . . . . . . . . . . . . . . . . . . . . . . . . . . . . . . . . . . . . . . . . . . . . . . . . . 26772.6.5. Carbon tax and government subsidies . . . . . . . . . . . . . . . . . . . . . . . . . . . . . . . . . . . . . . . . . . . . . . . . . . . . . . . . . . . . . . . . . . 26782.6.6. Total lifetime costs . . . . . . . . . . . . . . . . . . . . . . . . . . . . . . . . . . . . . . . . . . . . . . . . . . . . . . . . . . . . . . . . . . . . . . . . . . . . . . . . . 2678
2.7. Summary . . . . . . . . . . . . . . . . . . . . . . . . . . . . . . . . . . . . . . . . . . . . . . . . . . . . . . . . . . . . . . . . . . . . . . . . . . . . . . . . . . . . . . . . . . . . . . . . . 26783. Case studies . . . . . . . . . . . . . . . . . . . . . . . . . . . . . . . . . . . . . . . . . . . . . . . . . . . . . . . . . . . . . . . . . . . . . . . . . . . . . . . . . . . . . . . . . . . . . . . . . . . . 2679
3.1. Geographic location selection. . . . . . . . . . . . . . . . . . . . . . . . . . . . . . . . . . . . . . . . . . . . . . . . . . . . . . . . . . . . . . . . . . . . . . . . . . . . . . . . . 26793.2. Technical feasibility . . . . . . . . . . . . . . . . . . . . . . . . . . . . . . . . . . . . . . . . . . . . . . . . . . . . . . . . . . . . . . . . . . . . . . . . . . . . . . . . . . . . . . . . 26793.3. Economic feasibility . . . . . . . . . . . . . . . . . . . . . . . . . . . . . . . . . . . . . . . . . . . . . . . . . . . . . . . . . . . . . . . . . . . . . . . . . . . . . . . . . . . . . . . . 2680
Renewable and Sustainable Energy Reviews 14 (2010) 2669–2682
A R T I C L E I N F O
Article history:Received 18 May 2010Accepted 20 July 2010
Keywords:PhotovoltaicIrrigationFeasibilityAgriculturalRural
A B S T R A C T
Solar-powered agricultural irrigation is an attractive application of renewable energy. However, to bepractical it must be both technically and economically feasible. Here, a method is presented forcalculating the feasibility of photovoltaic-powered (PVP) irrigation. The feasibility is expressed as afunction of location, which includes climate data, aquifer depth and cost, including local political policiessuch as carbon taxes. A discounted cash flow analysis is used to compare the lifecycle costs ofphotovoltaic-, diesel engine- and electrical grid-powered irrigation systems. Five examples illustrate themethod’s application. These results suggest that PVP irrigation is technically and economically feasible,provided that there is enough land available for the solar array.
! 2010 Elsevier Ltd. All rights reserved.
* Corresponding author at: Department of Mechanical Engineering, Massachusetts Institute of Technology, 77 Massachusetts Ave., Building 3-472m, Cambridge, MA02139-4307, USA. Tel.: +1 617 253 5095; fax: +1 617 258 7881.
E-mail address: [email protected] (L.C. Kelley).
Contents lists available at ScienceDirect
Renewable and Sustainable Energy Reviews
journa l homepage: www.e lsev ier .com/ locate / rser
1364-0321/$ – see front matter ! 2010 Elsevier Ltd. All rights reserved.doi:10.1016/j.rser.2010.07.061

Author's personal copy
4. Conclusions . . . . . . . . . . . . . . . . . . . . . . . . . . . . . . . . . . . . . . . . . . . . . . . . . . . . . . . . . . . . . . . . . . . . . . . . . . . . . . . . . . . . . . . . . . . . . . . . . . . . 2681Acknowledgements . . . . . . . . . . . . . . . . . . . . . . . . . . . . . . . . . . . . . . . . . . . . . . . . . . . . . . . . . . . . . . . . . . . . . . . . . . . . . . . . . . . . . . . . . . . . . . 2681References . . . . . . . . . . . . . . . . . . . . . . . . . . . . . . . . . . . . . . . . . . . . . . . . . . . . . . . . . . . . . . . . . . . . . . . . . . . . . . . . . . . . . . . . . . . . . . . . . . . . . 2681
1. Introduction
1.1. Motivation
Fossil fuel power is a major contribution to carbon-basedclimate change and air pollution. In addition, rising fossil fuel costsand energy self-sufficiency have made the development of viablesources of clean energy critical for many parts of the world.Photovoltaic-powered (PVP) pumping for crop irrigation has beensuggested as an application, as it is an energy intensive activity that
Nomenclature
A annual cost ($)
ACO2annual carbon tax ($/year)
Af field area (m2)
AO&M, cleaning
annual operating and maintenance costs of solar
panel cleaning ($/year)
AO&M,d annual operating and maintenance costs of diesel
system ($/year)
Ar ratio of solar panel array area to field area
As area of the solar array (m2)
CCO2net present value of lifecycle carbon taxes ($)
Ccool capacity of the diesel generator engine coolant
tank (L)
Cdiesel total diesel system capital cost ($)
Cdiesel fuel net present value of lifetime diesel fuel costs ($)
CE cost of an arbitrary maintenance event ($/event)
Celec capital cost of grid-based system ($)
Cfuel net present value of the fuel costs ($)
Cfuel elec net present value of the lifetime electricity cost ($)
Cgen retail generator price ($)
Cinc net present value of renewable energy incentives
and income tax rebates ($)
CLCC net present value of total system lifecycle cost ($)
CM annual cost of an arbitrary maintenance event ($/
year)
CM,air annual costofdiesel engineairfilter changes ($/year)
CM,oil annual cost of diesel engine oil change ($/year)
CM,oil,filt annual cost of diesel engineoil filter changes ($/year)
CO&M net present value of operation and maintenance
costs ($)
CO&M,pv total lifecycle operating and maintenance cost of
photovoltaic system ($)
Coil capacity of the diesel generator lubrication oil
tank (L)
CPV capital cost of the photovoltaic array
Ctr retail transformer price ($)
Csys system capital cost ($)
D number of days to clean photovoltaic panels
ET evapotranspiration rate (m/day)
F load factor
FE replacement frequency
FM annual frequency of maintenance event
FV future value ($)
G fixed annual electricity price increase ($/kWh/year)
Gd number of days in the growing season (days)
g gravitational constant (9.81 m/s2)
Hd annual number of hours the diesel generator
operates (h/year)
Hp number of equivalent peak sunshine hours (h/day)
h pumping head (m)
Iav average solar insolation (kWh/m2/day)
Imax solar radiation used by solar panel manufacturer
for power rating (W/m2)
Ip peak solar radiation (w/m2)
Itr transformer installation cost ($)
i discount rate (%)
L labor price ($/h)
MC molar mass of carbon (kg/mol)
MCO2molar mass of CO2 (kg/mol)
mCO2mass of CO2 produced in 1 year (kg/year)
n system lifetime (years)
Pcleaning net present value of solar panel cleaning cost ($)
Pgen, ratedpower rating for diesel generator (kW)
Pinv net present value of inverter replacement costs ($)
Pp pump power (W)
PV present value ($)
Q volumetric flow rate (m3/s)
RCO2carbon tax rate ($/kg CO2)
Rtr transformer power rating (kVA)
t time (h)
Uinit starting unit price of electricity ($/kWh)
Uiniv unit cost of electronics ($/W)
UNPV, diesel
net present value of the unit cost of diesel fuel ($/L)
UNPV, elec
net present value of the unit cost of electricity ($/
kWh)
Upv unit cost of photovoltaic array ($/W)
Vhour hourly fuel consumption (L/h)
Wp power rating of the photovoltaic array
Wtr transformer weight (lbs)
wcarbon mass fraction of carbon in the diesel fuel
x number of years after which an arbitrary expendi-
ture occurs (years)
y project year in which electronics are replaced
hp pump efficiency
hsa solar array conversion efficiency
r water density (kg/m3)
rfuel density of the diesel fuel (kg/L)
L.C. Kelley et al. / Renewable and Sustainable Energy Reviews 14 (2010) 2669–26822670
Author's personal copy
is well suited for implementation with renewable energy sources[1]. However, to be practical, PVP irrigation, like all alternativeenergy applications, must be both technically and economicallyfeasible. For irrigation, this feasibility is dependent on manyfactors, such as crop type, location, water depth, conventionalenergy costs, government incentives and carbon taxes. In thispaper this feasibility is addressed.
1.2. Background and literature
PVP irrigation for very small farms has been well-studied andimplemented [1,2]. In early 2003, Shell and WorldWater & PowerCorporation installed a demonstration 36-kW, 50 HP PVP pumppowered by a 108-foot long solar array in the San Joaquin Valley,California [3]. This was a demonstration unit; PVP irrigation forlarger commercial farms has not been implemented.
Previous feasibility studies evaluated either the economicfeasibility or the technical feasibility of PVP irrigation. Most of thestudies are system size-specific and location-specific. Studiesfocusing on systems with power requirements on the order of1 kW have been conducted for sites in Namibia, Jordan and India[4–6]. Site-specific technical feasibility assessments based primar-ily on solar insolation have been conducted in Saharan Africa,Botswana and Sudan [7–9]. A method for sizing a PVP irrigationsystem based on climate, geographic location, soil quality and cropwater requirements was applied to 10-hectare olive grove nearBadajoz, Spain [10]; economic costs were not considered.
The Jordanian study [5] addresses both technical and economi-cal feasibility of PVP pumping for drinking water, using the costannuity method. Its results concur with the other studies cited: forthe geographic locations selected, PVP pumping for drinking wateror for irrigation is economically feasible at low power require-ments, such as when pumping at high flow rates from shallowwells and at low flow rates from deeper wells.
The literature concludes that PVP irrigation is both technicallyand economically feasible for very small systems on the order ofone acre. However, a generalized method for determining bothtechnical and economic feasibility, applicable to systems of anysize, has not yet been developed.
1.3. Approach
Here, a generalized method to determine the technical andeconomic feasibility of PVP irrigation systems is developed.Technical feasibility is determined as a function of crop typeand geographic location, which includes the factors of climate, landquality, groundwater depth and water recharge rate. The maxi-mum required daily volumetric flow rate for crop irrigation isdetermined from the crop’s maximum evapotranspiration rateduring its growing season. The maximum evapotranspiration rateis a function of crop type, soil conditions and weather conditions.The maximum daily required flow rate is used to determine thepumping power needed. The corresponding solar panel areaneeded to provide the required power is calculated using averagemonthly solar insolation and compared to the total field area.
If technical feasibility is defined as the ability to put together asystem with existing technologies and have it perform in thedesired fashion, then solar-powered irrigation is technicallyfeasible for all locations where agricultural irrigation is needed.Following the sizing method presented here, one will be able todetermine howmuch land is required for the solar array. Assumingone has the land available, including roofs of farm buildings, thereis no other technological breakthrough needed.
One can argue that there are no deep-well solar-poweredpumps on the market, which is true. However, there are plenty ofdeep-well commercial pumps available that use conventional
power sources. Making them operate using solar power is a matterof assembling the proper electronics. So, technical feasibility is stilldetermined by whether or not one has the land available.
Economic feasibility is a function of crop type and geographiclocation. Here,methods of discounted cash flow (DCF) analysis [11]are applied. The net present value of the lifetime system costs of aPVP irrigation system are compared to that of diesel-powered andelectrical grid-powered irrigation systems. After determining thepower required and the needed solar panel area, the diesel andelectrical components are selected with the same power require-ments. Capital costs, annual operating and maintenance costs, andfuel costs for all three systems are determined. The PVP irrigationsystem is considered economically feasible if its lifetime systemcost is the lowest among all alternatives.
1.4. Results and conclusions
The results for technical feasibility agree with those from paststudies, showing that PVP irrigation is technically feasible in areaswith high solar insolation. As defined in this paper, there are notechnological barriers to implementing PVP irrigation, providedone has enough land available for the PV array.
PVP irrigation is economically feasible for all examplesconsidered. Although the capital costs of the photovoltaic panelsexceed those of both the diesel generator and the electricaltransformer, the dominant costs from a lifecycle perspective arethe costs of a 25-year supply of diesel fuel or electricity.
2. Analysis
2.1. Assumptions
In this analysis, a new pumping system that uses conventionaldiesel power, electrical power from the grid, or alternatively, solarpower from photovoltaic arrays to power the irrigation pumping isto be installed. The photovoltaic systems are assumed to bemounted horizontally and do not incorporate any sun tracking.Locations are assumed to be above local aquifers, so there is noneed to transport water over large distances. The water in theaquifer is of suitable quality and there is no need to desalinate ortreat thewater. In addition, it is assumed the location has sufficientrainfall so that the water extracted from the aquifer during periodsof irrigationwill be replaced over the course of the year. For a givenlocation an appropriate crop type is selected. Also, it is assumedthat the land has enough topsoil and/or fertilizer to producehealthy plants, so soil quality is not considered.
2.2. Exemplar irrigation system
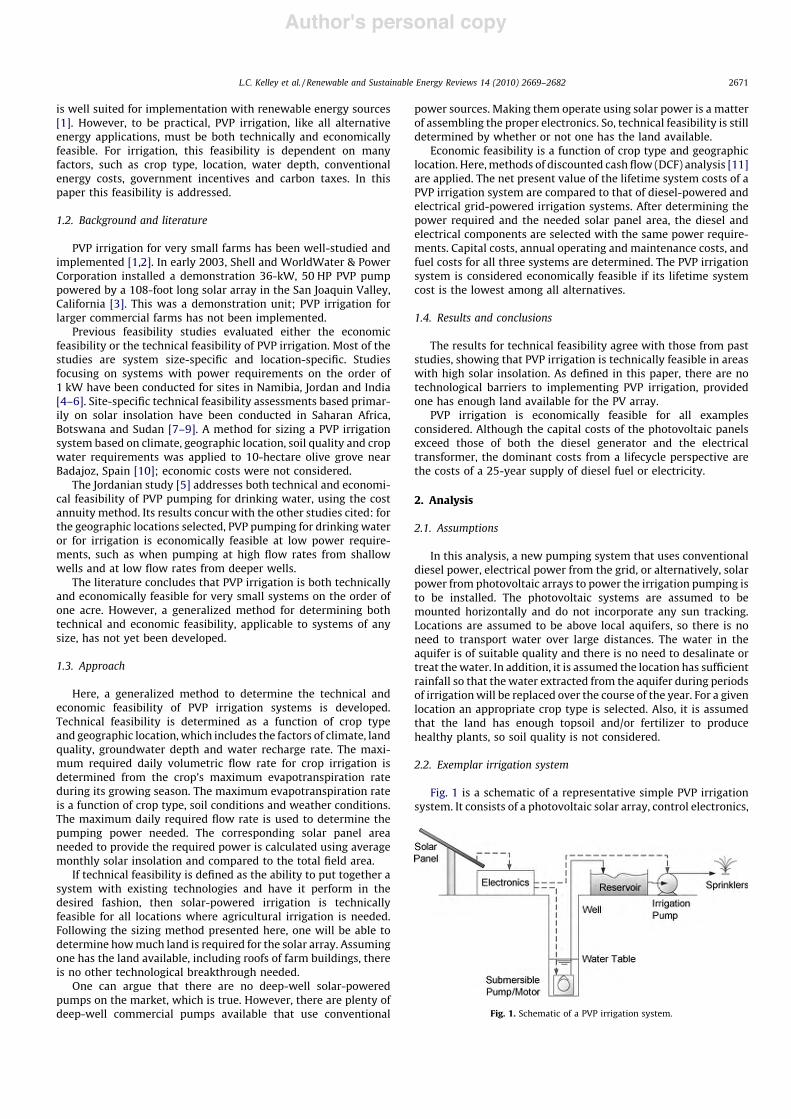
Fig. 1 is a schematic of a representative simple PVP irrigationsystem. It consists of a photovoltaic solar array, control electronics,[(Fig._1)TD$FIG]
Fig. 1. Schematic of a PVP irrigation system.
L.C. Kelley et al. / Renewable and Sustainable Energy Reviews 14 (2010) 2669–2682 2671

Author's personal copy
a submersible pump powered by a DCmotor or an ACmotor, and aninverter. Although only one well and pump are shown in the figure,often more than one well and pump are needed to irrigate largerfields [12]. Not shown in the figure are the water distributioncomponents at the field level, such as the irrigation ditches andpiping networks. These components arenot included in the analysis,as they are also required by the conventional energy-poweredsystems used for comparison. Although a reservoir, irrigation pumpand sprinklers are shown, they may not be necessary for someirrigation. For this analysis, it is assumed that the reservoir iscovered, so evaporation from the reservoir is ignored.
The major difference between photovoltaic-, diesel- and grid-powered irrigation systems is the power source. The schematics forthe diesel- and grid-powered systems are almost identical to Fig. 1.A diesel engine/generator set or an electrical transformer andtransmission lines are substituted for the photovoltaic array.
2.3. Irrigation requirements
In some areas, irrigation may only be necessary during dryperiods within the growing season. In other areas, year-roundirrigation may be required. The requirements for the type ofirrigation are local sunlight, groundwater, rain, soil conditions andcrop type.
2.3.1. Determining solar insolationSolar insolation is the sumof the solar radiation receivedover the
course of a day at the earth’s surface, and is measured in kWh/m2/day. On a cloudy day, the light is scattered more than it is on a clearday, hence the amount of light reaching the surface is diminished.Regions of similar latitude having many cloudy days, such as theAmazon rainforest, will have much lower average insolation levelsthan, say, the Sahara desert. This is illustrated in Fig. 2, which showsthe yearly average insolation over the earth’s surface.
The areas with highest annual average solar insolation areregions near the equator with small variations in insolation
between summer and winter, including Saharan Africa, India,Central Australia, and Central America. Geographic regions off theequator typically experience their peak levels of daily solarinsolation during their summer months. Crops are typicallyplanted and grown during the spring and summer, so the averagemonthly solar insolation during this time is of key importance. Theinsolation during the growing season is a critical factor used in thisanalysis for the feasibility of solar-powered irrigation.
The three-boxed geographic regions in Fig. 2 are the Southwest-ernUnited States, Spainand theMediterranean, and theMiddleEast.All three are off the equator, have high average insolation andrequire irrigation during the summer, as is demonstrated in Section2.2. The five representative cases presented later are from thesethree regions.
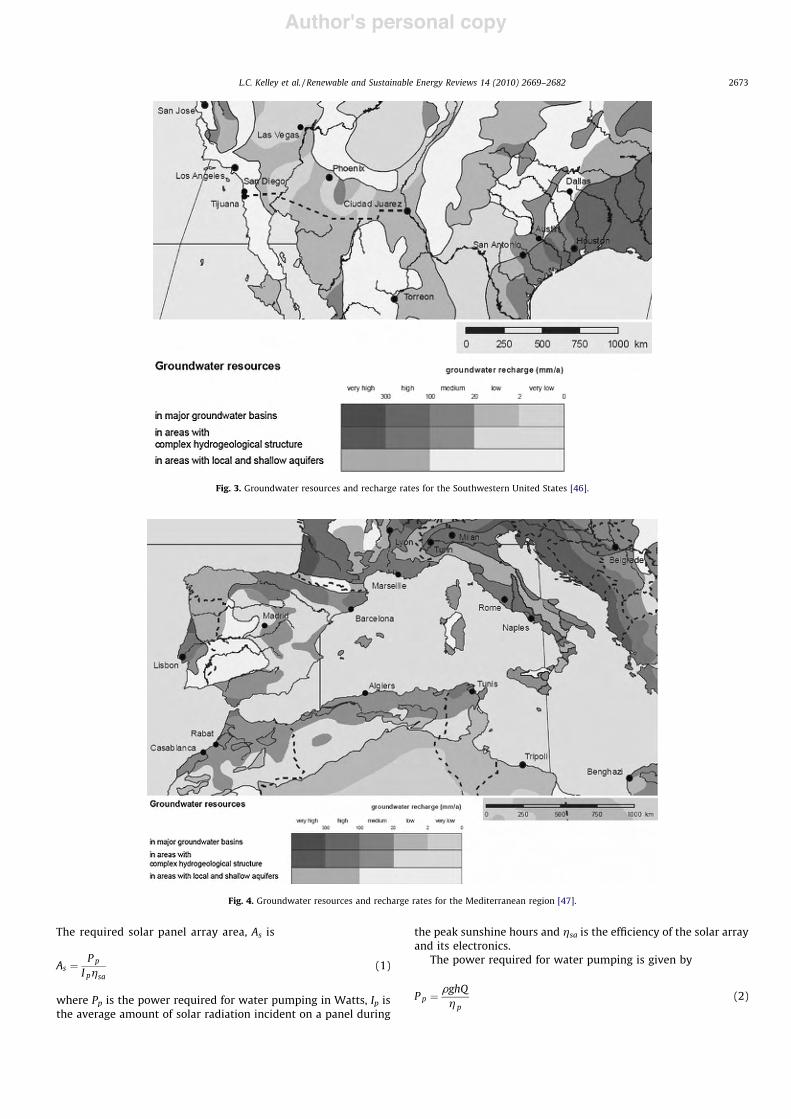
2.3.2. WaterIrrigation requires readily accessible groundwater. For sustain-
able farming, the amount of water removed from the groundwatersource during periods of irrigation must be replenished during thewinter months. Figs. 3–5 show the hydrological structure andgroundwater recharge rates for the Southwestern United States,Spain and theMiddle East, respectively. All three regions have highsolar insolation and require irrigation during their summermonths. The regions also have low to medium recharge rates;hence irrigation needs to be carefully planned. Such issues arebeyond the scope of this paper, since they do not affect thetechnical or financial feasibility of PV-powered irrigation systems.However, as surface and shallowwater supplies become scarce, thetendency to tap deeper resources will increase.
2.4. Technical feasibility
A PVP irrigation system is considered to be technicallyfeasible if there is enough land available to mount the solararray. Here it is assumed that the land required for the solarpanels is approximately the same as the area of the solar panels.
[(Fig._2)TD$FIG]
Fig. 2. Global average solar insolation. Selected regions with high insolation, left to right, are the Southwestern United States, Spain and the Mediterranean region, and theMiddle East. Image courtesy of NASA Langley Research Center Atmospheric Science Data Center from the Surface meteorology and Solar Energy Dataset (http://eosweb.larc.nasa.gov) [45].
L.C. Kelley et al. / Renewable and Sustainable Energy Reviews 14 (2010) 2669–26822672
Author's personal copy
The required solar panel array area, As is
As !P p
I phsa(1)
where Pp is the power required for water pumping in Watts, Ip isthe average amount of solar radiation incident on a panel during
the peak sunshine hours and hsa is the efficiency of the solar arrayand its electronics.
The power required for water pumping is given by
P p ! rghQh p
(2)
[(Fig._3)TD$FIG]
Fig. 3. Groundwater resources and recharge rates for the Southwestern United States [46].[(Fig._4)TD$FIG]
Fig. 4. Groundwater resources and recharge rates for the Mediterranean region [47].
L.C. Kelley et al. / Renewable and Sustainable Energy Reviews 14 (2010) 2669–2682 2673

Author's personal copy
where Q is the maximum volumetric flow rate in m3/s, r is thedensity of water, g is the gravitational constant, h is the totaldynamic head in meters, and hp is the pump/motor efficiency.
The total dynamic head consists of the height the water must belifted, plus the energy losses inmeters due to pipe friction. For deep-well pumping (i.e. greater than about 10 m), the total dynamic head,h, is approximated by the local aquifer depth. For surface pumping,dynamic head is calculated from pipe friction losses.
The maximum flow rate required is given by
Q !ET " A f
3600t(3)
where ET is the maximum evapotranspiration rate for the givencrop in m/day, Af is the field area in m2, and t is the number ofpumping hours per day.
For the photovoltaic system, t is equivalent to the number ofpeak sunshine hours per day, Hp. At the earth’s surface, the
standard peak solar radiation received is approximately 1000W/m2 (1 kW/m2) [13]. Solar radiation for an arbitrary location overthe course of a clear day has a distribution as shown in Fig. 6(a),below. One can see that the level of radiation varies. The total areaunder the curve is the amount of total solar insolation received in 1day. The number of peak sunshine hours is given by the equivalenttime at peak solar radiation that produces the same insolation, asshown in Fig. 6(b). The areas under the curves in Fig. 6 are equal.
The average monthly solar insolation, Iav, for a geographic areais found using:
Iav ! Hp " I p (4)
where Ip is 1 kW/m2 andHp is the average number of peak sunshinehours per day during the month requiring the largest volume ofwater for irrigation. This is the amount of time the pump isassumed to run, so Hp is equal to t.
[(Fig._5)TD$FIG]
Fig. 5. Groundwater resources and recharge rates for the Middle East [47].
[(Fig._6)TD$FIG]
Fig. 6. (a) Typical clear sky irradiation over the course of 1 day and (b) maximum irradiation over an equivalent number of hours.
L.C. Kelley et al. / Renewable and Sustainable Energy Reviews 14 (2010) 2669–26822674
Author's personal copy
Substituting Eqs. (2)–(4) into (1) yields an expression for solarpanel array area as a function of location (solar insolation, fieldarea and well depth) and crop type (evapotranspiration rate, ET):
As !rgh" ET " A f
3600#1000W=kW$Iavhsahp(5)
Eq. (5) can be rearranged to give the area ratio as a function oflocation and crop type:
Ar !As
A f! rgh" ET
3600#1000 W=kW$Iavhsahp(6)
where Ar is the ratio of solar panel array area to field area.
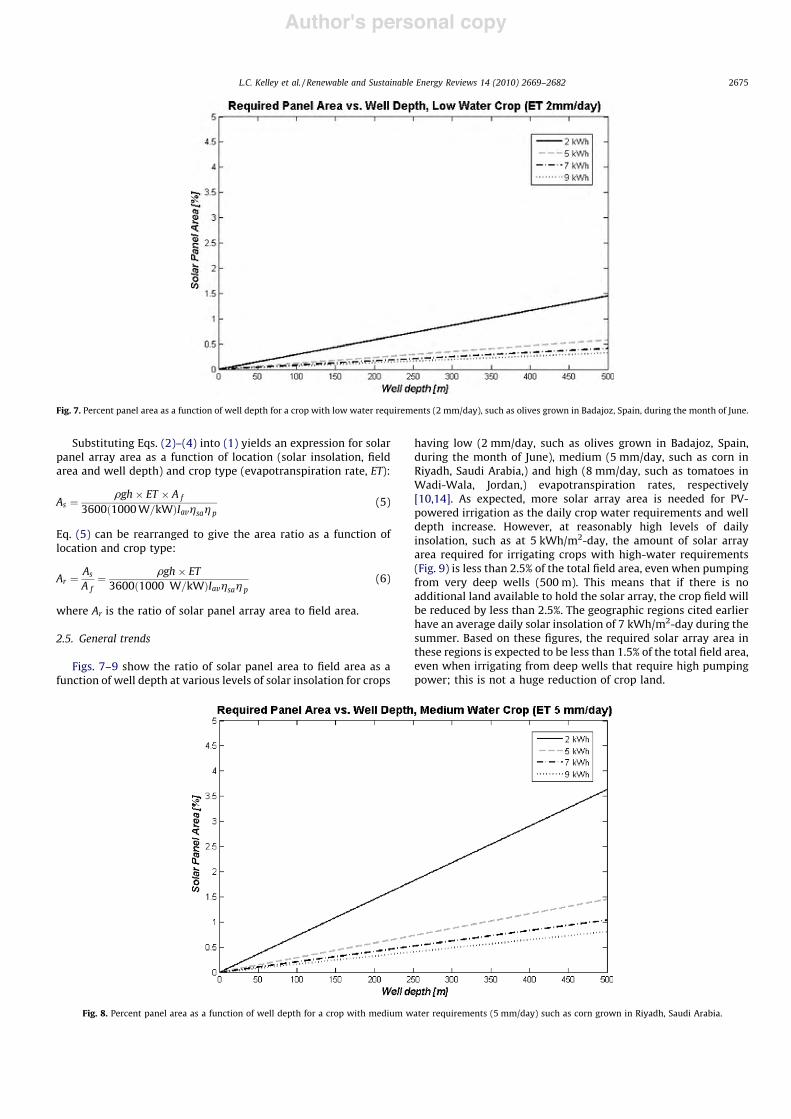
2.5. General trends
Figs. 7–9 show the ratio of solar panel area to field area as afunction of well depth at various levels of solar insolation for crops
having low (2 mm/day, such as olives grown in Badajoz, Spain,during the month of June), medium (5 mm/day, such as corn inRiyadh, Saudi Arabia,) and high (8 mm/day, such as tomatoes inWadi-Wala, Jordan,) evapotranspiration rates, respectively[10,14]. As expected, more solar array area is needed for PV-powered irrigation as the daily crop water requirements and welldepth increase. However, at reasonably high levels of dailyinsolation, such as at 5 kWh/m2-day, the amount of solar arrayarea required for irrigating crops with high-water requirements(Fig. 9) is less than 2.5% of the total field area, even when pumpingfrom very deep wells (500 m). This means that if there is noadditional land available to hold the solar array, the crop field willbe reduced by less than 2.5%. The geographic regions cited earlierhave an average daily solar insolation of 7 kWh/m2-day during thesummer. Based on these figures, the required solar array area inthese regions is expected to be less than 1.5% of the total field area,even when irrigating from deep wells that require high pumpingpower; this is not a huge reduction of crop land.
[(Fig._7)TD$FIG]
Fig. 7. Percent panel area as a function of well depth for a crop with low water requirements (2 mm/day), such as olives grown in Badajoz, Spain, during the month of June.
[(Fig._8)TD$FIG]
Fig. 8. Percent panel area as a function of well depth for a crop with medium water requirements (5 mm/day) such as corn grown in Riyadh, Saudi Arabia.
L.C. Kelley et al. / Renewable and Sustainable Energy Reviews 14 (2010) 2669–2682 2675

Author's personal copy
In regions receiving low amounts of solar insolation, solar arrayarea increases drastically with well depth and daily crop waterrequirements. However, regions with very low average daily solarinsolation (2 kWh per day) are close to the poles and are notusually farmed and/or irrigated, so the fact that a high-water crop(Fig. 9) requires a solar array taking up over 5% of the field areawhen irrigating from a deep well is somewhat meaningless. So, inareas requiring irrigation with reasonable amounts of averagesummer insolation (4–5 kWh/m2-day), solar-powered irrigation istechnically feasible, and, if one has no additional land for panels,the total solar array areawill reduce the field area by less than 1.5%.
2.6. Economic feasibility
2.6.1. AssumptionsHere it is assumed that PVP irrigation is economically feasible if
its lifecycle costs are lower than those of comparative convention-ally powered diesel and electric grid-based systems. Althoughwind turbines can also be used to power irrigation systems, itsstudy was beyond the scope of this work.
Lifecycle costs include the equipment capital costs, mainte-nance costs, operational costs, fuel costs and equipment salvagevalue. In our approach, a comparative discounted cash flow (DCF)method is used [11]. With DCF, all future costs, such maintenancecosts after 2 years, are converted to equivalent current amounts(present values) via a discount rate, an assumed constant interestrate. This discount rate assumes that the difference betweeninflation and the rate at which a bank charges interest is constant.Future costs are adjusted to their present values using thefollowing equation:
PV ! FV
#1% i$x(7)
where PV is the present value, FV is the future value, i is thediscount rate and x is the number of years in the future when thefuture expenditure occurs.
Here only differences between alternative power systems willbe compared, so when the cost differences of the solar-powered,diesel-powered and electric grid-powered irrigation alternativesare compared, costs associated with components present in all ofthese irrigation schemes are not included. It is assumed that a
submersible pump/motor will be used, and that the same pumpcan be powered by electricity produced through solar panels,diesel generators and from electricity from the grid. So, thesubmersible pump/motor cost is not included in the analysis.Similarly, the costs of the reservoir, water distribution system andwell drilling are also not included in the analysis, as they areassumed to be independent of the power source used.
2.6.2. Capital costs
2.6.2.1. Photovoltaic system. The capital cost of the photovoltaicarray, with its wiring, support structures, installation, inverter andrelated electronics, is given by
C pv ! WpU pv (8)
where Cpv is the capital cost of the solar array, Wp is the powerrating of the array inWatts andUpv is the unit cost in USD perWatt.
The peak power rating of the array is found using:
Wp ! AsImaxhsa (9)
where As is the area of the solar array calculated for the location,using Eqs. (5) or (6), hsa is the efficiency of the solar array and Imax isthe solar radiation used by the manufacturer for its power rating(typically 1000W/m2).
2.6.2.2. Diesel system. The power rating for the appropriate dieselgenerator to drive the pump, Pgen,rated, is
Pgen;rated !P p
F(10)
where Pp is the power required by the pump/motor from Eq. (2)and F is the load factor.
The capital cost of the generator is then estimated using:
Cgen ! $234:23Pgen;rated % $3400 (11)
Eq. (11) is based on generator dealer pricing [15,16]. Prices areassumed to include the cost of the associated control electronics.An installation cost of 10% of the retail price is assumed [17]. Thetotal capital cost of the diesel generator system, Cdiesel, is then givenby
Cdiesel ! #1:1$Cgen (12)
[(Fig._9)TD$FIG]
Fig. 9. Percent panel area as a function of well depth for a cropwith high-water requirements (8 mm/day), such as tomatoes grown during the summer inWadi-Wala, Jordan.
L.C. Kelley et al. / Renewable and Sustainable Energy Reviews 14 (2010) 2669–26822676

Author's personal copy
2.6.2.3. Grid-based electrical system. The major capital equipmentneeded for a grid-based power system is a transformer to stepdown the grid voltage to a level appropriate for the pumpingsystem. It is assumed that the kilovolt-Amp (kVA) rating of thetransformer, R
tr
, is equivalent to the amount of power in kW thetransformermust handle, and that the motor starting power is lessthan or equal to themaximum required power, P
p
, given by Eq. (2):
Rtr ! P p (13)
The installation cost, Itr, is given by [18]:
Itr ! 42:06#W0:46tr $ (14)
where Wtr is the weight of the transformer.The total capital cost for the grid-powered system is
Celec ! Ctr % Itr (15)
where Ctr is the retail transformer price, based on required power[19].
2.6.3. Operating and maintenance costsAnnual operating and maintenance costs and their net present
values for each type of system are calculated. A uniform annualseries can be converted to lifetime net present value, PV, using thefollowing relationship [11]:
PV ! A#1% i$n & 1
i#1% i$n(16)
where A is the annual cost, i is the annual discount rate and n is thesystem lifetime in years.
Scheduled major component replacement costs are alsoconverted to net present value.
2.6.3.1. Photovoltaic system. Operating and maintenance costs ofthe PV power system, CO&M; pv, consist of the costs associated withcleaning the solar panels and replacing the inverters. Therefore:
CO&M; pv ! Pcleaning % Pinv (17)
where Pcleaning is the net present value of the cleaning costs and Pinv
is the net present value of inverter replacement.It is assumed that all the panels are manually cleaned once a
month using a high-pressure water spray. Assuming that a laborercan clean 100 m2 of panel per hour and that 1 h per day for setupand cleanup is needed, the annual cost in USD for cleaning,AO&M,cleaning, is given by
AO&M; cleaning ! 12" LAs
100% 2D
! "(18)
where L is the local labor cost in USD, including overhead, As is thearea of the solar array from Eq. (5), and D is the number of days ittakes to clean the panels in 1 month.
Eq. (16) is then used to obtain the net present value of themaintenance costs.
The electronics are assumed to need replacement once duringthe solar irrigation system lifetime. Assuming that a one-time
paymentwill bemade in the yth year of the project, the net presentvalue of the electronics replacement costs is given by
Pinv ! UinvWp#1% i$&y (19)
where Pinv is the net present value of the electronics cost, Uinv is theunit cost of the electronics, in USD/W, i is the annual discount rate,y is the number of years between the present time and the date atwhich the electronics are replaced andWp is the rated power of thesolar array calculated in Eq. (9).
2.6.3.2. Diesel system. The diesel system contains air, fuel, oil, andwater separator filters that require replacement. Lubrication oiland coolant need to be replaced periodically. Table 1 shows thecosts for filter, oil, and engine coolant changes, where Coil is thecapacity of the lubrication oil tank and Ccool is the capacity of theengine coolant tank, from [20]. The costs of filters, lubrication oil,and coolant, and themaintenance frequencies, labor and durationsare estimated from the literature [20–24]. Here, the labor cost isbased on the average cost of labor for a skilledmaintenanceworkerin the U.S. [22]. In general, labor costs for maintenance vary widelyby country.
The diesel system is only operated part of the year, during thegrowing season. The number of hours the diesel system operatesannually, Hd, is given by
Hd ! GdHp (20)
whereGd is the number of days in the growing season, andHp is thehours per day the pump operates. The annual frequency of amaintenance event, FM, is given by
FM ! Hd
FE(21)
whereHd is the annual operational hours from Eq. (20) and FE is thereplacement frequency from Table 1 for that particular event.
The annual cost of a specific type of maintenance event, CM, isthen given by
CM ! CEFM (22)
where CE is the cost of the event from Table 1. The total annualmaintenance cost for the diesel system is the sum of the costs of allmaintenance events:
AO&M;d ! CM;cool % CM;air % CM;oil filt % CM;oil (23)
This is converted to net present worth using Eq. (16).
2.6.3.3. Grid-based electrical system. The operating and mainte-nance costs associated with a grid-based electrical system areassumed to be negligible and they are not included here.
2.6.4. Fuel costsThere are no fuel costs associated with the PV panels; fuel costs
associated with diesel and grid-based systems to dominate thesystem lifecycle costs, as shown in the case studies. Calculations forexample cases show that deep-well pumping is not economicallyfeasible, regardless of the type of power system used.
Table 1Calculations of maintenance costs for diesel systems.
Diesel system component Price per unit (USD) Replacement frequency (h) Duration (h) Labor cost (USD) Total cost per event (USD)
Air filter 80/filter 600a 2a 61.12 114.12Oil/fuel/water separator filter 50/filter 300b 2a 61.12 111.12Lubrication oil change 8.32/L 250b 0.67a 20.37 Coil(8.32) +20.37Engine coolant change 1.65/L 12,000h or 6 yearsb 0.67a 20.37 Ccool(1.65) +20.37
a From [20].b From [22].
L.C. Kelley et al. / Renewable and Sustainable Energy Reviews 14 (2010) 2669–2682 2677

Author's personal copy
2.6.4.1. Diesel fuel. The price of diesel fuel varies geographicallybased on subsidies and taxes. Here its openmarket price is used. Theshort term open market price fluctuates based on supply anddemandaswell as futures trading and speculation, so historical datacannot be used to predict future fossil fuel prices. The US EnergyInformation Administration publishes an Annual Energy Outlookthat includes projections of future fossil fuel prices through 2035,including industrial distillate fuel. Here, the 2010 Annual EnergyOutlook projections are used. Fig. 10 [25] shows the projected openmarket price of distillate fuel oil (diesel fuel) in 2008 USD/L.
The lifetime diesel fuel cost, Cdiesel fuel, for a system is calculatedusing:
Cdiesel fuel ! UNPV ;diesel " Vhour " Hd (24)
where UNPV,diesel is the net present value of the price of diesel fuelper liter, found using Eq. (7), Vhour is the amount of fuel the dieselengine consumes per hour and Hd is the annual operating hours,given by Eq. (20).
2.6.4.2. Grid-based electricity. The price and projected increases ofelectricity vary by geographic region, hence local electricity pricesneed to be used in this analysis. Electric power plants can be coal-fired, oil-fired, nuclear-powered, geothermal, hydroelectric, etc.Historic price data for each region is needed to determine the localprice escalation. For the analysis proposed here, price is assumed tobe a gradient (linear) series. The net present value of the unit price ofelectricity (USD/kilowatt hour is used here) over the system lifetime,UNPV,elec, is
UNPV ;elec ! Uinit#1% i$n & 1
i#1% i$n% G
1& #1% ni$#1% i$&n
i2
# $(25)
where Uinit is the initial price of the electricity, G is the fixedamount the price increases each year, i is the discount rate and n isthe system lifetime in years [11].
The lifetime electricity cost is calculated using:
C fuel;elec ! UNPV ;elec " Hd (26)
where Hd is the number of hours the electric system runs per year,given by Eq. (20).
2.6.5. Carbon tax and government subsidiesIn an effort to reduce global warming, many countries have
imposed taxes on the production of CO2; this increases the annualcost of running a diesel system. The annual carbon tax, ACO2
, isgiven by
ACO2! RCO2
"mCO2(27)
where RCO2is the carbon tax rate andmCO2
is the mass in kg of CO2
produced per year.The annual mass of CO2 produced is found using:
mCO2! r fuelVhourHdwcarbon
MCO2
MC(28)
where rfuel is the density of the fuel in kg/L, Vhour is the amount offuel the engine consumes per hour, Hd is the annual operatinghours given by Eq. (20),wcarbon is the mass fraction of carbon in thediesel fuel,MCO2
is the molar mass of CO2 andMC is the molar massof carbon.
Eq. (16) is used to convert the annual cost of the carbon tax to itsnet present worth. Carbon taxes are not included in therepresentative case studies presented in Section 3.
Subsidies and incentives for PV systems, such as tax rebates,grants, feed-in tariffs, net metering and renewable energycertificates (RECs), are location-specific and are often complicated.For example, in Germany producers of PV power are paid for theelectric power produced and fed into the electric grid based on thetype of PV system (i.e. groundmounted, roof mounted) and systemsize. In California, a combination of investment subsidies, feed-intariffs and net metering are used; PV plant owners are also able togenerate and sell RECs. Feed-in tariffs and net metering require thePV array to be connected to the electrical grid. Subsidies andincentives can make a substantial difference in the economicfeasibility of a PVP irrigation system and should be consideredwhen analyzing a system. However, since subsidies and incentivesare complex and widely variant, they are not considered here.
Income taxes and credits are also widely variant and complex.We expect that inclusion of income tax credits for large capitalexpenditures will favor renewable energy systems, since capitalcosts for renewable energy systems are typicallymuch higher thancapital costs for diesel or grid systems. Therefore, income taxes andcredits are not considered.
2.6.6. Total lifetime costsThe total system lifetime costs, CLCC, are the sum of the capital
costs, Csys, operating and maintenance costs, CO&M, fuel costs, Cfueland carbon tax, CCO2
, minus any alternative energy incentives, Cinc:
CLCC ! Csys % CO&M % C fuel % CCO2& Cinc (29)
2.7. Summary
For a given crop type, well depth and expected amount of solarinsolation, the amount of solar array area needed to power anirrigation system is determined by Eq. (5):
As !rgh" ET " A f
3600#1000W=kW$I phsahp(5)
The lifetime costs of the solar array and comparable diesel andgrid-based electric systems are determined using Eq. (29):
CLCC ! Csys % CO&M % C fuel % CCO2& Cinc (29)
where Csys is determined using Eq. (8) for the solar array, Eq. (12)for the diesel system and Eq. (15) for the grid-based system. Theoperating and maintenance costs CO&M are determined usingEqs. (17) and (23) for the solar and diesel systems, respectively.Operating and maintenance costs associated with the grid-basedelectrical systems are negligible. The fuel costs for the diesel andelectric systems are determine either from price projectionsconverted to net present value using Eqs. (8) and (24), or byapproximating costs as gradient series using Eq. (25) and thencalculating the lifetime cost using Eq. (26).
[(Fig._10)TD$FIG]
Fig. 10. Projected annual market price of industrial distillate fuel [25].
L.C. Kelley et al. / Renewable and Sustainable Energy Reviews 14 (2010) 2669–26822678

Author's personal copy
3. Case studies
3.1. Geographic location selection
Locations selected for case studies have high solar resources, areclose to local aquifers and use agricultural irrigation. The selectedregions are: Badajoz, Spain; Riyadh, Saudi Arabia;Albuquerque,NewMexico; Tell-Amara, Lebanon; andWadi-Wala, Jordan. Solar data forthese locations are given in the NASA SurfaceMeteorology and SolarEnergy Tables, which is compiled by the Atmospheric Science DataCenter at NASA Langley and provides data for any latitude andlongitude [26]. The panels are assumed to be flat, horizontal surfaces(no tilt) so the averagepeak sunshinehours onahorizontal surface atthe given locations were used. Crop types and aquifer depths arebased on current farming practices in the selected regions [10,27–33]. This information, along with crop water requirements, ispresented in Table 2.
With the exception of the data for olive trees in Spain, cropwaterrequirements for the entire growth cycle, from sowing to harvest,weredeterminedusing the Food andAgricultureOrganizationof theUnited Nations (FAO) CLIMWAT 2.0 database and CROPWAT 8.0software [14]. CROPWAT uses the Penman–Monteith equations tooutput a daily evapotranspiration (ET) rate for the crop selecteddependent on the climate, altitude, and time of year [34]. This ratechanges over the course of the growing season, so the softwareprovides the evapotranspiration rate for the crop for every 10daysofits growing cycle. Fig. 11 shows a sample table for tomatoes grownnear Wadi-Wala in Jordan, planted on April 15th.
Table 3 summarizes the parameters that are the sameacross the representative cases. The system lifetime is assumed
to be 25 years, the warranted lifetime of most solar panels [35].Salvage value of all equipment is assumed to be negligible. Thephotovoltaic panels and associated electronics are assumed tohave an efficiency of 14% [35] and the pump/motor andassociated electronics have a subsystem efficiency of 65%[36]. The motor/pump is assumed to run on 220 V.
A price of 9.00 USD/W for the PV system is assumed; this isbased on analysis of the actual cost of installed PV systemsprovided by California Solar Statistics [37]. The price forreplacement of the electronics associated with the PV systems is0.72 USD/W [38]. A labor cost of 30.15 USD is assumed [39]. Aconstant discount rate of 5% is used.
Tables 4–6 show additional parameters used for the economicanalysis of the diesel- and grid-powered irrigation systems[19,20,40–44]. Fuel consumption is estimated from the manufac-turer’s data sheets [20].
As shown in Table 6, electricity prices in Riyadh and Tell-Amara have no associated escalation rates. In Saudi Arabia, theelectricity rate has remained constant for the past 10 years.Since the electricity prices are not directly tied to the marketand are set by the Electricity and Co-Generation RegulatoryAuthority, it is unreasonable to assume an escalation rate. Nohistorical data was obtained for electricity prices in Lebanon, soit was not possible to determine an escalation rate. In both cases,electricity prices were assumed constant.
3.2. Technical feasibility
Table 7 shows the required solar panel area for eachrepresentative case. The results agree with the analysis shown
Table 2Technical feasibility parameters for representative cases by location.
Location Badajoz Riyadh Albuquerque Tell-Amara Wadi-Wala
Crop type Olive treesa Maize Peppers Potatoes TomatoesMaximum water needed (mm/day) 3.14a 4.26 9.38 7.94 8.22Time of year Julya April June July JulyGrowing season length (days) 214a 130 121 129 145Total dynamic depth (m) 20a 300 5 100 55Operating time (peak hours sun/day) 7.68 6.19 7.23 7.83 7.53Volumetric flow rate (m3/s) 0.046 0.077 0.146 0.114 0.123Power required (kW) 13.9 350.3 11.0 172.0 101.9
a From [10].
[(Fig._11)TD$FIG]
Fig. 11. Sample of crop water requirements obtained from CROPWAT for tomatoes grown in Wadi-Wala, Jordan. For this case, the tomatoes require the most water in themiddle of July.
L.C. Kelley et al. / Renewable and Sustainable Energy Reviews 14 (2010) 2669–2682 2679
Author's personal copy
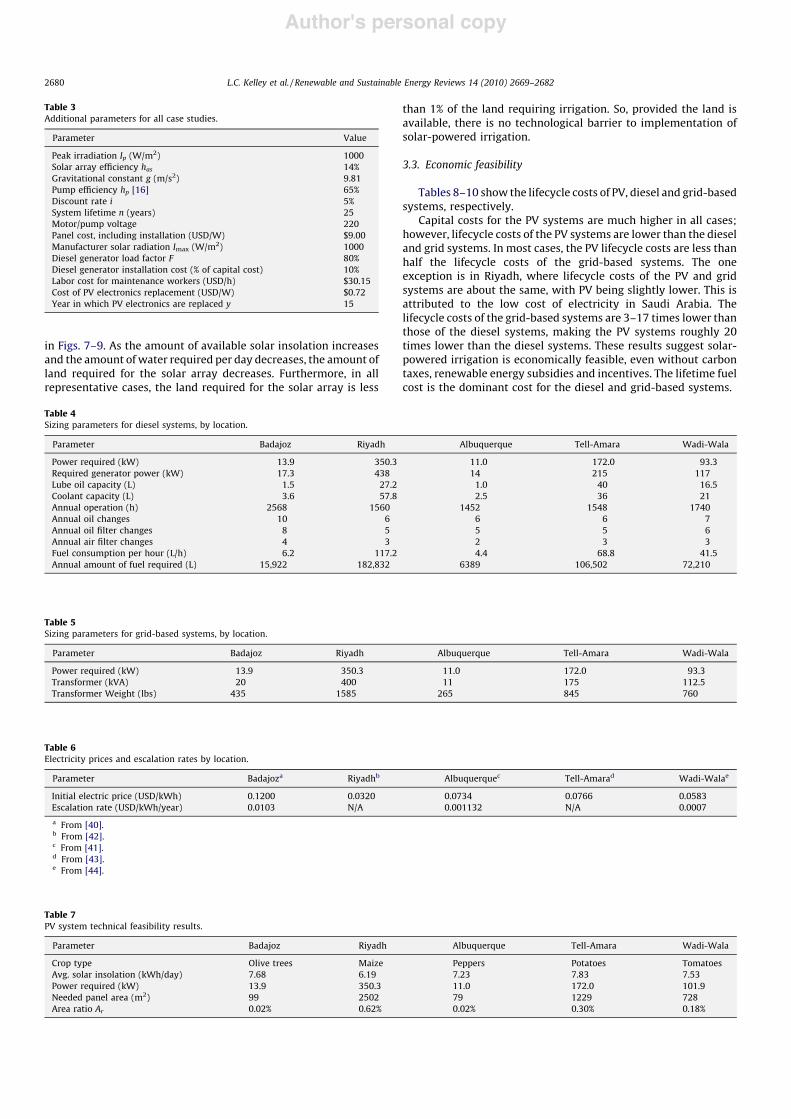
in Figs. 7–9. As the amount of available solar insolation increasesand the amount of water required per day decreases, the amount ofland required for the solar array decreases. Furthermore, in allrepresentative cases, the land required for the solar array is less
than 1% of the land requiring irrigation. So, provided the land isavailable, there is no technological barrier to implementation ofsolar-powered irrigation.
3.3. Economic feasibility
Tables 8–10 show the lifecycle costs of PV, diesel and grid-basedsystems, respectively.
Capital costs for the PV systems are much higher in all cases;however, lifecycle costs of the PV systems are lower than the dieseland grid systems. In most cases, the PV lifecycle costs are less thanhalf the lifecycle costs of the grid-based systems. The oneexception is in Riyadh, where lifecycle costs of the PV and gridsystems are about the same, with PV being slightly lower. This isattributed to the low cost of electricity in Saudi Arabia. Thelifecycle costs of the grid-based systems are 3–17 times lower thanthose of the diesel systems, making the PV systems roughly 20times lower than the diesel systems. These results suggest solar-powered irrigation is economically feasible, even without carbontaxes, renewable energy subsidies and incentives. The lifetime fuelcost is the dominant cost for the diesel and grid-based systems.
Table 3Additional parameters for all case studies.
Parameter Value
Peak irradiation Ip (W/m2) 1000Solar array efficiency has 14%Gravitational constant g (m/s2) 9.81Pump efficiency hp [16] 65%Discount rate i 5%System lifetime n (years) 25Motor/pump voltage 220Panel cost, including installation (USD/W) $9.00Manufacturer solar radiation Imax (W/m2) 1000Diesel generator load factor F 80%Diesel generator installation cost (% of capital cost) 10%Labor cost for maintenance workers (USD/h) $30.15Cost of PV electronics replacement (USD/W) $0.72Year in which PV electronics are replaced y 15
Table 7PV system technical feasibility results.
Parameter Badajoz Riyadh Albuquerque Tell-Amara Wadi-Wala
Crop type Olive trees Maize Peppers Potatoes TomatoesAvg. solar insolation (kWh/day) 7.68 6.19 7.23 7.83 7.53Power required (kW) 13.9 350.3 11.0 172.0 101.9Needed panel area (m2) 99 2502 79 1229 728Area ratio Ar 0.02% 0.62% 0.02% 0.30% 0.18%
Table 6Electricity prices and escalation rates by location.
Parameter Badajoza Riyadhb Albuquerquec Tell-Amarad Wadi-Walae
Initial electric price (USD/kWh) 0.1200 0.0320 0.0734 0.0766 0.0583Escalation rate (USD/kWh/year) 0.0103 N/A 0.001132 N/A 0.0007
a From [40].b From [42].c From [41].d From [43].e From [44].
Table 5Sizing parameters for grid-based systems, by location.
Parameter Badajoz Riyadh Albuquerque Tell-Amara Wadi-Wala
Power required (kW) 13.9 350.3 11.0 172.0 93.3Transformer (kVA) 20 400 11 175 112.5Transformer Weight (lbs) 435 1585 265 845 760
Table 4Sizing parameters for diesel systems, by location.
Parameter Badajoz Riyadh Albuquerque Tell-Amara Wadi-Wala
Power required (kW) 13.9 350.3 11.0 172.0 93.3Required generator power (kW) 17.3 438 14 215 117Lube oil capacity (L) 1.5 27.2 1.0 40 16.5Coolant capacity (L) 3.6 57.8 2.5 36 21Annual operation (h) 2568 1560 1452 1548 1740Annual oil changes 10 6 6 6 7Annual oil filter changes 8 5 5 5 6Annual air filter changes 4 3 2 3 3Fuel consumption per hour (L/h) 6.2 117.2 4.4 68.8 41.5Annual amount of fuel required (L) 15,922 182,832 6389 106,502 72,210
L.C. Kelley et al. / Renewable and Sustainable Energy Reviews 14 (2010) 2669–26822680

Author's personal copy
Although our lifecycle cost analysis indicates solar-poweredirrigation is economically viable, the high capital costs of the PVarray mean larger initial cash outlays, which will likely needfinancing. Depending on the size of the array, this can be difficult.For example, would a farmer in Saudi Arabia be able to finance a $3million solar array at the assumed discount rate? Lifecycle costs ofthe PV systems may be lower, but the ability to fund the initialcapital costs may provide its own barrier to successful implemen-tation of a solar-powered irrigation system.
4. Conclusions
A method for determining the technical and economicfeasibility of PVP irrigation systems, applicable to any geographiclocation and crop type, is developed and applied to severalexample cases. Technical feasibility is determined from themaximum power required for irrigation, which is dependent oncrop type and geographic location. Economic feasibility isdetermined by comparing lifecycle costs of PVP irrigation systemsto diesel- and grid-based irrigation systems. Carbon taxes andfinancial incentives for installing alternative energy systems areincluded in the method, although they are not applied to theexamples.
The results of the technical feasibility analysis agree with theresults from past studies, and also show that there is notechnological barrier to implementation of PVP irrigation. Thelimiting factor is land availability; as long as there is physical spacefor the panels, there is no reasonwhy they cannot be used to poweran irrigation system. This does not address whether or not it isappropriate to use deep-well sources for crop irrigation in the firstplace. Pumping from deep-well sources may not be appropriatesince theymay not be replenished sufficiently each year during therainy season, or may include non-trivial amounts of heavy metals.Such a discussion is beyond the scope of this work.
The price of diesel fuel has increased significantly since the late1980s and early 1990s, when many of the previous economicfeasibility studies were performed. The results of this studysuggest that the price of diesel fuel has increased sufficientlywithin the last 10 years to make PVP irrigation economicallyfeasible, despite the high capital costs of photovoltaic systems. Asthe price of the solar panels decreases, the capital costs willdecrease, making PVP systems even more economically attractive.
Acknowledgements
The authors would like to thank the King Fahd University ofPetroleum and Minerals in Dhahran, Saudi Arabia, for funding theresearch reported in this paper through the Center for CleanWaterand Clean Energy at MIT and KFUPM. The authors also thank theMIT Department of Mechanical Engineering for their support ofthis research, as well as Amy Bilton and Richard Heller for theirhelpful comments and assistance in producing figures.
References
[1] Barlow R, McNelis B, Derrick A. Solar pumping: an introduction and update onthe technology, performance, costs, and economics. London: IntermediateTechnology Publications Ltd.; 1993.
[2] Roul R. India’s solar power—greening India’s future energy demand. ecoworld.-com, EcoWorld Inc, <http://www.ecoworld.com/fuels/indias-solar-power.-html>; 15 May 2007 [accessed 13.01.2010].
[3] World’s largest solar irrigation pump dedicated in San Joaquin Valley, Solar e-Clips. Californiasolarcenter.org, <http://www.californiasolarcenter.org/solar-eclips/2003.04/20030408-1.html>; April 2003 [accessed 13.01.2010].
[4] Feasibility assessment for the replacement of diesel pumps with solar pumps,Final Report: September 2006, Ministry of Mines and Energy Barrier Removalto Namibian Renewable Energy Programme (NAMREP); 2006.
[5] Mahmoud M. Experience results and techno-economic feasibility of usingphotovoltaic generators instead of diesel motors for water pumping from ruraldesert wells in Jordan. IEE Proceedings C Generation, Transmission andDistribution 1990;137:391–4 [see also IEE Proceedings-Generation, Transmis-sion and Distribution].
Table 8PV system costs.
Parameter Badajoz Riyadh Albuquerque Tell-Amara Wadi-Wala
Cost of panels $124,700 $3,152,500 $99,100 $1,548,400 $916,800Cost of maintenance labor $926 $6,501 $880 $3,550 $2,387Cost of electronics replacement $997 $25,220 $792 $12,387 $7,334Annual maintenance cost $1,923 $32,417 $1,673 $15,937 $9,721Lifetime maintenance cost $15,084 $248,789 $13,121 $124,993 $76,246Total system cost $139,800 $3,406,700 $112,200 $1,673,400 $993,000
Table 9Diesel system costs.
Parameter Badajoz Riyadh Albuquerque Tell-Amara Wadi-Wala
Cost of diesel engine/generator $10,000 $52,500 $8,000 $45,000 $25,000Installation $1,000 $5,300 $800 $4,500 $2,500Lifetime maintenance costs 14,800 $19,500 $8,200 $24,400 $16,900Lifetime operating costs $7,800 $41,200 $6,300 $35,300 $19,600Lifetime fuel costs $4,227,200 $48,541,900 $1,696,200 $28,276,400 $19,171,800Total lifecycle costs $4,260,800 $48,660,400 $1,719,500 $28,385,600 $19,235,800
Table 10Grid-based system costs.
Parameter Badajoz Riyadh Albuquerque Tell-Amara Wadi-Wala
Cost of transformer $8,300 $56,800 $7,600 $25,800 $17,800Cost of installation $700 $1,300 $600 $900 $900Lifetime electricity cost $1,325,200 $3,428,900 $255,700 $3,994,800 $2,171,200Total lifecycle cost $1,334,200 $3,487,400 $263,900 $4,021,500 $2,189,900
L.C. Kelley et al. / Renewable and Sustainable Energy Reviews 14 (2010) 2669–2682 2681
Author's personal copy
[6] Meah K, Ula S, Barrett S. Solar photovoltaic water pumping—opportunities andchallenges. Renewable and Sustainable Energy Reviews 2008;12:1162–75.
[7] Hamidat A, Benyoucef B, Hartani T. Small-scale irrigation with photovoltaicwater pumping system in Sahara regions. Renewable Energy 2003;28:1081–96.
[8] Anderson P. The role, reliability and limitations of solar photo-voltaic systemsin Botswana. In: Ninth international conference on harmonics and quality ofpower. 2000. p. 973–82.
[9] Omer AM. Solar water pumping clean water for Sudan rural areas. RenewableEnergy 2001;24:245–58.
[10] Cuadros F, Lopez-Rodrıguez F, Marcos A, Coello J. A procedure to size solar-powered irrigation (photoirrigation) schemes. Solar Energy 2004;76:465–73.
[11] White J, Case K, Pratt D. Principles of engineering economic analysis. Hoboken,NJ: Wiley Higher Education; 2010.
[12] Karrassik I, Messina J, Cooper P, Heald C. The pump handbook. New York:McGraw-Hill; 2008.
[13] Honsberg C, Bowden S. Photovoltaics CDROM. Available: <http://pvcdrom.p-veducation.org/> [accessed 15.03.2010].
[14] Databases and Software Food and Agriculture Organization of the UnitedNations, Water Development and Management Unit. Available: <http://www.fao.org/nr/water/infores_databases.html>; 2009 [accessed 18.01.2010].
[15] Inventory, Dieselserviceandsupply.com. Diesel Services and Supply, Inc.,Brighton, CO. Available: <http://www.dieselserviceandsupply.com/New-Generators/>; 2009 [accessed 14.07.2009].
[16] Caterpillar Inventory. Express generators power suppliers. A Division ofTurnkey Electric, LLC, Atkinson, NH. Available: <http://www.expressgener-ators.com/inventory.html>; July 2009 [accessed 14.07.2009].
[17] Muselli M, Notton G, Louche A. Design of hybrid-photovoltaic power genera-tor, with optimization of energy management. Solar Energy 1999;65:143–57.
[18] Appliances and commercial equipment standards: distribution transformers,Chapter 7: markups for equipment price determination. United StatesDepartment of Energy, Energy Efficiency and Renewable Energy, BuildingTechnologies Program. Available: <http://www1.eere.energy.gov/buildings/appliance_standards/commercial/pdfs/dist_trans_chp_7.pdf>; April 2009[accessed 18.01.2010].
[19] eCatalog, GE Consumer & Industrial Electrical Distribution. General ElectricCompany. Available: <http://products.geindustrial.com/IndustrialProducts/Dispatcher?CATALOG=ED>; 2009 [accessed 18.07.2010].
[20] Caterpillar power generation family of sites. CAT-ElectricPower.com,Caterpillar, Inc. Available: <http://www.cat.com/power-generation>; 2009[accessed 2307.2009].
[21] CAT extended life coolant for commercial engines. Toromontcat.com. Toro-mont Cat Power Systems. Available: <http://www.toromontcat.com/power-systems/prsupport_industrial_06.asp>; 2008 [accessed 27.07.2009].
[22] Hourlycompensationcosts inU.S. dollars inmanufacturing, 32countries orareas and selected economic groups, 1996–2007, United States Department ofLabor, Bureau of Labor Statistics. Available: <ftp://ftp.bls.gov/pub/special.re-quests/ForeignLabor/ichccaesuppt02.txt>; March 2009 [accessed 18.01. 2010].
[23] Diesel Engine Filters, Go2Marine.com. Mariner Supply Inc. Available: <http://www.go2marine.com/>; 2009 [accessed 23.07.2009].
[24] Amisol, Synthetic 10W-30/SAE 30 Heavy Duty Diesel Oil, Online Catalog.SignatureLube.com. Available: <http://www.amsoil.com/catalog.aspx?GroupID=74&zo=320430>; 2009 [accessed 23.07.2009].
[25] Annual Energy Outlook 2010 Early Release Overview. United States Govern-ment, Energy Information Administration. Available: <http://www.eia.doe.-gov/oiaf/aeo/>; 14 December 2009 [accessed 30.04.2010].
[26] NASA surface meteorology and solar energy—available tables, National Aero-nautics and Space Administration, Atmospheric Science and Data Center.Available: <http://eosweb.larc.nasa.gov/cgi-bin/sse/sse.cgi>; 2009 [accessed18.01.2010].
[27] Sheikh A, Al-Sharaawi M. Appendix F: Design and manufacturing of solarsystems and devices for challenging environments. King Fahd University ofPetroleum and Minerals, Dhahran, Saudi Arabia, Unpublished Work; 2009.Report Number KFUPM-CWCE-002.
[28] Food and agricultural commodities production: top production-Jordan-2007,FAOSTAT Database. Food and Agriculture Organization of the United Nations.
Available: <http://faostat.fao.org/site/339/default.aspx>; 2009 [accessed 18.01.2010].
[29] Food and agricultural commodities production: top production – Lebanon –2007, FAOSTAT Database. Food and Agriculture Organization of the UnitedNations. Available: <http://faostat.fao.org/site/339/default.aspx>; 2009[accessed 18.01.2010].
[30] El-Sharif A. Climatic constraints and potential corn production in SaudiArabia—a study in agroclimate. Geo Journal 1986;13:119–27.
[31] New Mexico Crop Information, New Mexico Climate Center, Department ofAgronomy and Horticulture, New Mexico State University, Las Cruses, NM.Available: <http://weather.nmsu.edu/nmcrops/>; 30 October 2001 [accessed18.01.2010].
[32] Earp D, Postlethwait J, Witherspoon J. Environmental topic: water, Albuquer-que’s environmental story, educating for a sustainable community. Friends ofAlbuquerque’s environmental story. Available: <http://www.cabq.gov/aes/s5water.html>; June 2006 [accessed 18.01.2010].
[33] El-Naser H, NuseibehM, Assaf K, Kessler S, Ben-Zvi M. Overview ofmiddle eastwater resources, water resources of Palestinian, Jordanian, and Israeli Interest.JordanianMinistry ofWater and Irrigation, PalestinianWater Authority, IsraeliHydrological Service, Middle East Water Data Banks Project. Available:<http://exact-me.org/overview/p15.htm>; 1998 [accessed 18.01.2010].
[34] Allen R, Pereira L, Raes D, Smith M. FAO irrigation and drainage paper number56: crop evapotranspiration (guidelines for computing crop water require-ments). Food and Agriculture Organization of the United Nations, p. 135–40.
[35] Solar Cell Technologies, Solarbuzz.com. Available: <http://www.solarbuzz.-com/Technologies.htm>; 2009 [accessed 18.01.2010].
[36] Canessa P, Weddington J. Program thesis and design for a diesel pumpingefficiency program. Fresno, CA: Center for Irrigation Technology, CSU; 2006.
[37] California solar statistics—raw data, go solar California, California solar initia-tive. Californiasolarstatistics.ca. Available:<http://www.californiasolarstatis-tics.ca.gov/reports/8-26-2009/Dashboard.html>; 2009 [accessed 18.01.2010].
[38] Inverter price environment. Solarbuzz, Solarbuzz.com. Available: <http://www.solarbuzz.com/Inverterprices.htm>; 2009 [accessed 18.01.2010].
[39] Minimumwage. United States Department of Labor, Wage and Hour Division.Available: <http://www.dol.gov/whd/minimumwage.htm>; July 24, 2009[accessed 8.01.2010].
[40] Electricity prices for households. United States Government, Energy Informa-tion Administration. Available: <http://www.eia.doe.gov/emeu/internation-al/elecprih.html>; 18 August 2008 [accessed 18.01.2010].
[41] Average retail price of electricity to ultimate customers by end-use sector, bystate. United States Government, Energy Information Administration. Avail-able: <http://www.eia.doe.gov/cneaf/electricity/epm/table5_6_a.html>; 14August 2009 [accessed 18.01.2010].
[42] Current tariff, electricity and co-generation regulatory authority. Kingdom ofSaudi Arabia. Available <http://www.ecra.gov.sa/currenttariff.aspx>; 2009[accessed 18.03.2010].
[43] Chapter 7: Energy, Lebanon state of the environment report. Ministry of theEnvironment, LEDO. Available: <http://www.moe.gov.lb/SiteCollectionDocu-ments/www.moe.gov.lb/Reports/SOER2002/Chap%207.%20Energy%20.pdf>;2001 [accessed 18.01.2010].
[44] Electricity tariff as end of 2005. National Electric Power Company, Jordan.Available: <http://www.nepco.com.jo/english_etariff.html>; 2007 [accessed18.01.2010].
[45] NASA surface meteorology and solar energy: global/regional data. NationalAeronautics and Space Administration, Atmospheric Science and Data Center,<http://eosweb.larc.nasa.gov/sse>; 2009 [accessed 14.07.2009].
[46] Struckmeier W, Richts A. Groundwater resources map of North America. BGRHanover/UNESCO Paris, Hanover, Germany, <http://www.whymap.org/cln_092/nn_1055978/whymap/EN/Downloads/Continental__maps/con-timaps__node__en.html?__nnn=true>; 2008 [accessed 14.07.2009].
[47] Struckmeier W, Richts A. Groundwater resources map of Africa. BGR Hanover/UNESCO Paris, Hanover, Germany. Available: <http://www.whymap.org/cln_092/nn_1055978/whymap/EN/Downloads/Continental_maps/con-timaps_node_en.html?_nnn=true>; 2008 [accessed 14.07.2009].
L.C. Kelley et al. / Renewable and Sustainable Energy Reviews 14 (2010) 2669–26822682