Embed Size (px)
Citation preview

This article appeared in a journal published by Elsevier. The attachedcopy is furnished to the author for internal non-commercial researchand education use, including for instruction at the authors institution
and sharing with colleagues.
Other uses, including reproduction and distribution, or selling orlicensing copies, or posting to personal, institutional or third party
websites are prohibited.
In most cases authors are permitted to post their version of thearticle (e.g. in Word or Tex form) to their personal website orinstitutional repository. Authors requiring further information
regarding Elsevier’s archiving and manuscript policies areencouraged to visit:
http://www.elsevier.com/copyright
Author's personal copy
Global implications of biomass and biofuel use in Germany – Recent trendsand future scenarios for domestic and foreign agricultural land useand resulting GHG emissions
S. Bringezu a, H. Schutz a,*, K. Arnold a, F. Merten a, S. Kabasci b, P. Borelbach b, C. Michels b,G.A. Reinhardt c, N. Rettenmaier c
aWuppertal Institute for Climate, Environment, Energy, Material Flows and Resource Management, Doppersberg 19, D-42103 Wuppertal, Germanyb Fraunhofer Institute for Environmental, Safety and Energy Technology UMSICHT, Osterfelder Strasse 3, D-46047 Oberhausen, Germanyc IFEU – Institute for Energy and Environmental Research, Wilckensstraße 3, D-69120 Heidelberg, Germany
a r t i c l e i n f o
Article history:Received 22 August 2008Received in revised form11 February 2009Accepted 19 March 2009Available online 12 May 2009
Keywords:BiomassBiofuelsBioenergyBiomaterialsGreenhouse gas emissionsGlobal land useLand-use change
a b s t r a c t
The global land area required to meet the German consumption of agricultural products for food andnon-food use was quantified, and the related greenhouse gas (GHG) emissions, particularly thoseinduced by land-use changes in tropical countries, were estimated. Two comprehensive business-as-usual scenarios describe the development corridor of biomass for non-food use in terms of energetic andnon-energetic purposes. In terms of land use, Germany was already a net importer of agricultural land in2004, and the net additional land required by 2030 is estimated to comprise 2.5–3.4 Mha. This is mainlydue to biofuel demand driven by current policy targets. Meeting the required biodiesel import demandwould result in an additional GWP of 23–37 Tg of CO2 equivalents through direct and indirect land-usechanges. Alternative scenario elements outline the potential options for reducing Germany’s landrequirement, which reflect future global per capita availability.
! 2009 Elsevier Ltd. All rights reserved.
1. Introduction
The European Union (EU) has set ambitious goals to increase theuse of renewable energies. In particular, the European Commission(EC) has proposed a binding target of 10% share of energy fromrenewable sources compared to the final consumption of energy inall forms of transport for each Member State in 2020. If biofuels aredeployed to meet the 10% target they need to fulfil the sustain-ability criteria as proposed by the European Commission (EC) [1].The latest proposal of the EU also calls on Member States topromote and encourage energy efficiency and energy saving. In thelight of recent research addressing the risks of biofuels, the ECproposes further to favour the use of biofuels produced fromwastes, residues, non-food cellulosic material, and ligno-cellulosicmaterial over the use of first generation biofuels. However, the neteffects of the use of alternative fuels instead of currently availablefirst generation biofuels remain to be investigated. Matter of fact,based on available technologies, and considering a realistic time
line for the development of next generation biofuels, meeting the10% target solely with biofuels would require a significant amountof imports, and agricultural land-use abroad [2,3].
In Germany, the biofuels’ quota law requires 8% of all transportfuels, by energy content, to be biofuels by 2015, with specific quotasfor bioethanol and biodiesel [4]. In 2007, the decisions made in thetownship of Meseberg by the German Government envisaged aneven more ambitious goal of 17% by energy content by 2020 [5]. In2008, following an intervention of car manufacturers claiming thatolder cars could be damaged with a bioethanol share of 10% byvolume, the environmental minister revisited the biomass strategyand issued a new biofuel target in the range of 12–15% by energycontent of final energy use in road transport by 2020, includinga cap for bioethanol of 5% by volume [6].
Germany has been the leading country in theworld for biodieselproduction and use with about two-fifths of global production(2.45 Mt or 41% of the global total) and almost half of globalconsumption (2.8 Mt or 47% of the global total) in 2006 [7].
Additionally, many other countries, especially the USA andemerging economies such as China, India and Brazil, are striving toincrease their production and use of biofuels [7] under similar
* Corresponding author. Tel.: þ49 202 2492240; fax: þ49 202 2492183.E-mail address: [email protected] (H. Schutz).
Contents lists available at ScienceDirect
Journal of Cleaner Production
journal homepage: www.elsevier .com/locate/ jc lepro
0959-6526/$ – see front matter ! 2009 Elsevier Ltd. All rights reserved.doi:10.1016/j.jclepro.2009.03.007
Journal of Cleaner Production 17 (2009) S57–S68

Author's personal copy
assumptions that have led to the development in Germany and theEU, i.e. that there will be benefits for the environment, in partic-ular for climate change and better opportunities for farmers’income and rural development [8], as well as positive effects byfuel diversification and security of supply. Meanwhile, consider-able concern has been growing regarding the negative conse-quences for the environment, increasing food prices, and socialissues (e.g. [9,10]). Tropical countries plan to use their highbiomass potential not only for domestic supply, but also forexport. An increasing global demand for biofuels thus acceleratesthe growing competition for land use between cropland andnatural ecosystems.
Bringezu et al. [11] have analysed the competition betweenmajor non-food material and energy products as well as foodproducts in Germany. Corroborating earlier studies of Rosegrantet al. [12] and OECD-FAO [13], they concluded that increased energycropping will lead to price increases for agricultural goods, not onlyfor those directly used for energy generation, but principally for allagricultural raw materials competing on the short to long-term forscarce production factors. This development is enhanced byeconomic incentives for the production of energy crops, and inparticular by national and supranational biofuel quotas, like thosein the USA, the EU and Germany. A shift in supply to raw materialsand/or fuels from regions with economically favourable productionis a possible option to mitigate price increases, but bears significantrisks for the environment and social standards, and may not avoidexpansion of arable land.
A special concern arises from land-use change induced by thegrowing demand for biofuels and the subsequent GHG emissions.Fargione et al. [14] accounted for the greenhouse gas (GHG) debt
arising from the conversion of various land types, such as grass-lands, savannahs and rainforest. Searchinger et al. [15] estimatedGHG emissions resulting from overall land use for US biofuelconsumption. Extreme GHG emissions may result from thedrainage of peat land forests for palm oil production, which ispushed, for instance, by rising demand in German municipalstations for combined heat and power [16].
Policymakers in the EU and in Germany are aiming to over-come the negative environmental and social consequences ofbiofuels by introducing sustainability standards [1,17]. Animportant point is the reduction of GHG emissions through theuse of biofuels. The proposal for a new EU directive on energy usefrom renewable sources [1] forsees at least 35% GHG emissionsaving from the use of transport fuels from biomass, with effectfrom 2017 even at least 50% and 60% for plants starting operationin 2017. However, a basic deficiency of such product andproduction based standards is that they are not capable ofcontrolling indirect effects of land-use change, a circumstancewhich is also acknowledged by their proponents. Whereas it ispossible to define default values of GHG emissions and accountfor the conversion of different natural biomes, thereby excludinghectares that have been transformed from natural land in recentyears, the product standards can hardly avoid displacementeffects. If the overall demand for biomass grows faster than theaverage yields, it can only be supplied by a net expansion ofcultivated area. It is therefore of paramount importance to suffi-ciently estimate the dynamics of biofuel cultivation, especiallytheir global land requirements and subsequent impacts, in orderto assess the net effect of increasing the quotas, and use, ofbiomass and biofuels in certain countries.
Fig. 1. Overview of methodological approach.
S. Bringezu et al. / Journal of Cleaner Production 17 (2009) S57–S68S58

Author's personal copy
This paper provides an overview of non-food biomass1 use inGermany to-date and projections under business-as-usual condi-tions up to 2030. It provides answers to the main questions:
– How much agricultural land worldwide will Germany requirefor its supply with biofuels, other bioenergy and biomaterials,and to which extent will Germany have to rely on land inforeign countries?
– How much agricultural land worldwide will be necessary tosecure domestic consumption of all agricultural goodsincluding nutrition, and how does this compare with globaldevelopment trends?
– What kind of potential environmental benefits with focus onGHG emissions are connected with the increased use ofbiomass for energy, in particular if land-use changes are takeninto account?
- Which alternative development pathways promise moreadvantages for climate and natural resources protection?
To this end, the global agricultural land required for thedomestic consumption of all agricultural goods in Germany isquantified and related to the worldwide per capita available crop-land in 2004 and 2030. The net effect of GHG emissions frombiofuel use in 2030 is estimated, with indirect land-use changestaken into account. From this, alternative scenario elements whichcould significantly contribute to sustainable development in termsof reduced land requirements and mitigated greenhouse gasemissions are described. Finally, conclusions towards sustainabledevelopment pathways are drawn.
2. Methods
The following section describes the basic methodologicalapproach, in terms of derivation of two BAU scenarios to describethe probable development corridor for the quantities of use ofbiomass based products in Germany until 2030, and principles toaccount for global land use for agricultural biomass and greenhousegas emissions including those from land-use changes. Fig. 1 showsan overview of the methodological approach.
The two BAU scenarios have been developed with leadingexperts in the field of energy and biomass scenarios, both internalto Wuppertal Institute and external. Our results are largely in linewith energy scenarios developed for the Federal Ministry for theEnvironment [18] and the Federal Ministry of Economics andTechnology [19].
2.1. Determination of the status quo and derivation of twoBAU scenarios
We analysed the most relevant market segments of biomass formaterial and energetic use with respect to current use and futuredevelopment potential, and with respect to those for whichprimary agricultural land use (cropland) is directly required. Thesemarket segments comprise energetic biomass (biofuels for trans-portation as biodiesel, plant oils, bioethanol, BtL and biogas, andbiomass for electricity/heat as plant oils and biogas) and non-energetic biomass (carbohydrate plants, oil plants, fibre plants,pharmaceutical plants).
Determination of the status quo and trend for agriculturalbiomass comprises quantities used for domestic supply andrequired cropland within Germany and abroad. Domestic supplywas differentiated by three sources: (1) domestic production basedon biomass cultivated on domestic agricultural land, (2) domesticproduction based on imported biomass cultivated on foreignagricultural land, and (3) foreign production (direct imports). Forenergetic biomass in general, government statistics [17,20] wereused to obtain quantities ([21,22] provided data for biogas forelectricity/heat and [23] for BtL), for non-energetic biomassa specific market study [21] was used in first place.
Prospective use of energetic biomass was determined in accor-dance with energy scenarios which are in line with governmenttargets for the use of renewable energy including biomass. Futureprobable development of the use of non-energetic biomass until2020 was based on specific market studies [21,24] and our esti-mation for the development until 2030 and for those segments notaddressed elsewhere [25].
Differentiation betweendomestic and foreign sources for biomasswas made considering the development of domestic productioncapacities, and in the case of non-food biomass from rapeseed thedomestic cropland available considering crop rotation limits.
In general, land use was calculated from quantities divided byyields. For the period 2006–2030we applied rates of yield increasesbased on a specific inquiry of agricultural experts in Germany.
A comprehensive description of the methods employed canbe found in our study for the Federal Environment AgencyGermany [26] and in the Appendix.
2.2. Global land use for all agricultural goods
The agricultural land use for imported biomass products was inthe first place calculated as total land required for the production ofthose products. For example, the land to grow rapeseed for bio-diesel was allocated completely to biodiesel. We call this landrequirement ‘‘gross production land’’.
Accounting for the agricultural land required for the consumptionof agricultural goods we calculate ‘‘net production land’’. In this case,land is allocated to several products derived from the crop harvest. Inour example, the land needed to grow rapeseed for biodiesel isallocated to different products produced on the same land, i.e. tobiodiesel and to rape-oilcake for animal feed (on the basis of theweight). This procedure avoids double-counting for the total globalagricultural landuse for consumptionof all agricultural products [27].
We calculated global land use for all imported (and exported)agricultural commodities in 2004 on the basis of net production land.To this end, imports and exports of agricultural commodities wereacquired in detail from European foreign trade statistics [28] inmetrictonnes. Yields for agricultural raw materials were taken from thedatabase of FAO [29]. Yields for agricultural animal or plant productswere taken from the database of the Wuppertal Institute [30].
Adding the domestically used agricultural land to the net landrequirement of foreign trade (imports minus exports) provides theglobal land use for domestic consumption of agricultural goods inGermany (‘‘net consumption land’’).
2.3. Accounting for greenhouse gas emissions
Greenhouse gas (GHG) emissions were accounted for as CO2equivalents for two components:
1. net GHG emissions from the life-cyclewide use of biofuels (incl.bioenergy for electricity and heat) in comparison to fossil fuels;
2. GHG emissions resulting from land-use changes in main supplyregions, i.e. tropical countries, in particular Brazil and South-east Asia.
1 Non-food biomass in this paper refers to biomass grown on agricultural land forthe purpose of use as biofuel (liquid or gaseous) for transport, biomass for thegeneration of electricity and/or heat (plant oils, energy plants for biogas), andbiomaterials (oils and fats, starch and sugar, natural fibres, pharmaceutical and dyeplants). See, e.g. Table 2 for categories.
S. Bringezu et al. / Journal of Cleaner Production 17 (2009) S57–S68 S59
Author's personal copy
The overall net greenhouse gas emission results from compo-nent 1 minus component 2.
For component 1 the following product pairs were chosen: –Biodiesel versus diesel from petroleum, – Plant oil as fuel versusdiesel from petroleum, – Bioethanol versus gasoline from petro-leum, – BtL versus diesel from petroleum, – Biomethane as fuelversus compressed natural gas (CNG) as fuel, – Plant oils for elec-tricity/heat versus fuel oil from petroleum for electricity/heat, and –Biogas for electricity/heat versus natural gas for electricity/heat.
The respective data were provided by IFEU and assume thatemissions related to cultivated biomass are depreciated, i.e. equallydivided, over a defined period (usually 25 years for plantations suchas palm oil).
Two basic questions were examined in the analysis of compo-nent 2:
(1) Which GHG emissions could result from Business-as-usual(BAU) development with the additional demand for biomassbased materials (2030 compared to 2004), if this demand wasmet through land-use change? The most relevant change ofgross production landwould result from the assumed import ofpalm and soybean-based biodiesel (at similar shares, repre-senting current relations). The land for sugar cane ethanolwould be of minor importance andwas not considered for GHGemissions.
(2) Which GHG emissions would likely be a result of the netadditional land requirement for the total consumption ofagricultural goods in 2030? It was considered that the requiredland for nutrition in Germany would decrease as a result ofincreases in yields and would therefore partially offset theincreasing demand for cropland for biofuels. GHG emissionsfrom an expansion of net consumption land would representthe minimum emissions to be expected – even if certificationexcluded direct land conversion for biofuels – as a result of therequired indirect land-use change.
The current development of land use for palm oil in Indonesiaand for soy in Brazil was analysed to evaluate the types of naturalland and their shares that could be converted by the extension ofagricultural land.
2.3.1. Oil palm cultivation in IndonesiaTwo-thirds of the current expansion of palm oil cultivation in
Indonesia depend on the destruction of rainforest, the remainingacreage intended for expansion is based on previously cultivated orto-date fallow land [31]. In the rainforest areas, one quarter of theland is on peat soil with a high carbon content – resulting inparticularly high greenhouse gas emissions when cultivated forpalm oil. The remaining rainforest land is on mineral soils. By 2030,a share of 50% from peat soils is expected [32]. If current trends
continue, in 2030 in Indonesia, 24% of the palm oil area were onformer peat soils, 43% on mineral rainforest soils and 33% on othersoils.
2.3.2. Soybean cultivation in BrazilAccording to [33], the overall expansion of agriculture is
expected to occur by 42% in the Cerrado area, 7% in the Amazonrainforest and 51% on former pastureland. Assuming a linearincrease of the cultivation area for soybeans, in 2030 it would bedistributed with 8% on former rainforest land, 28% on former Cer-rado soils and 64% on other soils.
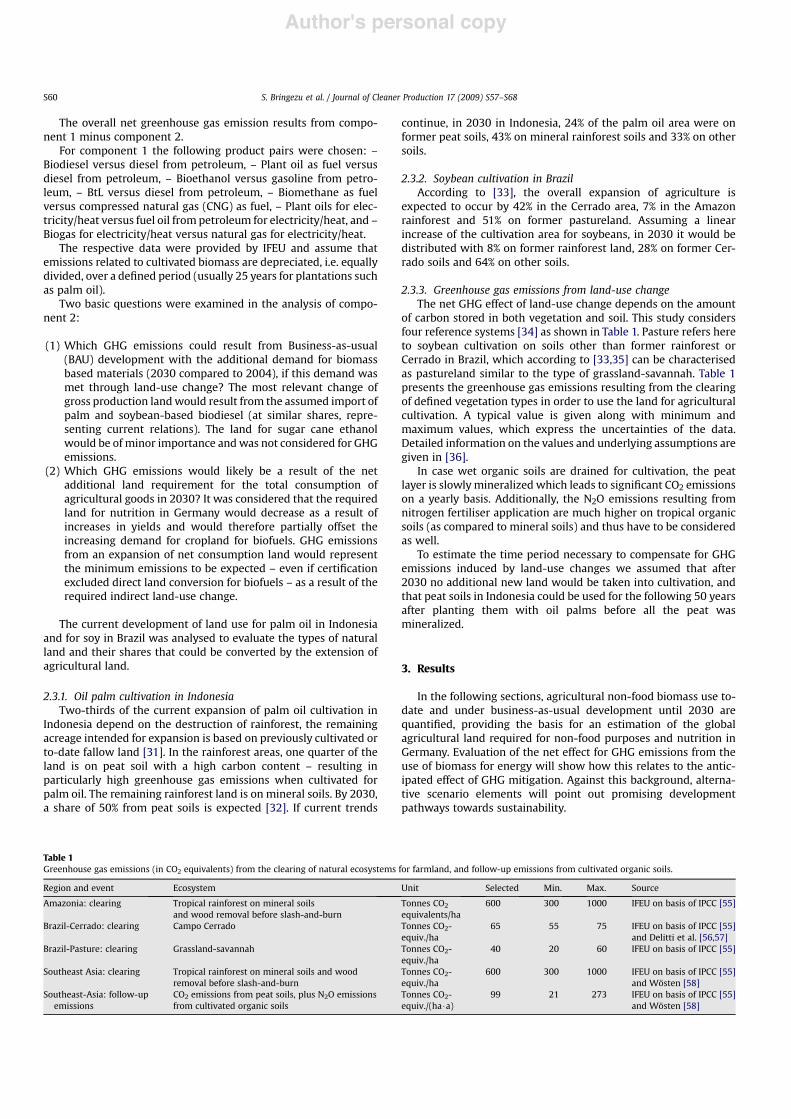
2.3.3. Greenhouse gas emissions from land-use changeThe net GHG effect of land-use change depends on the amount
of carbon stored in both vegetation and soil. This study considersfour reference systems [34] as shown in Table 1. Pasture refers hereto soybean cultivation on soils other than former rainforest orCerrado in Brazil, which according to [33,35] can be characterisedas pastureland similar to the type of grassland-savannah. Table 1presents the greenhouse gas emissions resulting from the clearingof defined vegetation types in order to use the land for agriculturalcultivation. A typical value is given along with minimum andmaximum values, which express the uncertainties of the data.Detailed information on the values and underlying assumptions aregiven in [36].
In case wet organic soils are drained for cultivation, the peatlayer is slowlymineralized which leads to significant CO2 emissionson a yearly basis. Additionally, the N2O emissions resulting fromnitrogen fertiliser application are much higher on tropical organicsoils (as compared to mineral soils) and thus have to be consideredas well.
To estimate the time period necessary to compensate for GHGemissions induced by land-use changes we assumed that after2030 no additional new land would be taken into cultivation, andthat peat soils in Indonesia could be used for the following 50 yearsafter planting them with oil palms before all the peat wasmineralized.
3. Results
In the following sections, agricultural non-food biomass use to-date and under business-as-usual development until 2030 arequantified, providing the basis for an estimation of the globalagricultural land required for non-food purposes and nutrition inGermany. Evaluation of the net effect for GHG emissions from theuse of biomass for energy will show how this relates to the antic-ipated effect of GHG mitigation. Against this background, alterna-tive scenario elements will point out promising developmentpathways towards sustainability.
Table 1Greenhouse gas emissions (in CO2 equivalents) from the clearing of natural ecosystems for farmland, and follow-up emissions from cultivated organic soils.
Region and event Ecosystem Unit Selected Min. Max. Source
Amazonia: clearing Tropical rainforest on mineral soilsand wood removal before slash-and-burn
Tonnes CO2
equivalents/ha600 300 1000 IFEU on basis of IPCC [55]
Brazil-Cerrado: clearing Campo Cerrado Tonnes CO2-equiv./ha
65 55 75 IFEU on basis of IPCC [55]and Delitti et al. [56,57]
Brazil-Pasture: clearing Grassland-savannah Tonnes CO2-equiv./ha
40 20 60 IFEU on basis of IPCC [55]
Southeast Asia: clearing Tropical rainforest on mineral soils and woodremoval before slash-and-burn
Tonnes CO2-equiv./ha
600 300 1000 IFEU on basis of IPCC [55]and Wosten [58]
Southeast-Asia: follow-upemissions
CO2 emissions from peat soils, plus N2O emissionsfrom cultivated organic soils
Tonnes CO2-equiv./(ha$a)
99 21 273 IFEU on basis of IPCC [55]and Wosten [58]
S. Bringezu et al. / Journal of Cleaner Production 17 (2009) S57–S68S60

Author's personal copy
3.1. Agricultural non-food biomass use in Germany
The use of biomass from arable land for non-food products hasbeen increasing in Germany recently (Table 2). Energetic usedominates, comprising two-thirds (69%) of all non-food biomass in2006. Biofuels for transport constitute the highest share, amount-ing to 4 million tonnes (Mt), or 62% of the total. Biomass productsfor electricity/heat add another 7%. The remaining use is formaterial products, which consumed about 2 Mt in 2006 and ismainly composed of starch and sugar (16% of the total) and plantoils and fats (14% of the total), with flax, hemp, pharmaceutical anddye plants contributing minor amounts.
From 2004 to 2006 the use of non-food biomass in Germanydoubled from 3.2 to 6.4 Mt. This was mainly due to energeticbiomass, and in particular biofuels rose almost threefold. In termsof tonnage, biodiesel contributed to the highest share of theincrease, growing by 1.6 Mt. In terms of growth rates, biogas –mainly produced from maize – for power and heat productionincreased more than tenfold within that two-year period. Bio-ethanol grew six times, and plant oils for direct fuels and for powerand heat five times. Thesemassive growth rates have been favouredby tax exemptions for biofuels in the context of the biofuel quotatargets of the German government, as well as guaranteed feed-intariffs for power production from energy plants supported by theGerman law on renewable energies (Erneuerbare Energien Gesetz –EEG). The same holds for plant oils used in municipal stations forcombined heat and power, mainly palm oil (67,298 t in 2006) andrapeseed oil (35,104 t in 2006).
Contrary to energetic use, the material use of non-food biomassincreased only slightly from 2004 to 2006, i.e. by 12%, with thestrongest contribution coming from starch and sugar used asfeedstocks for the chemical industry (Table 2). Consequently,biomass for non-energetic use made up only 31% of the total in2006, whereas it had accounted for 55% in 2004.
3.2. Business-as-usual development
The two business-as-usual scenarios (BAU I and II) describe thedevelopment corridor which can be expected if the ongoing majortrends of production and use of non-food agricultural biomasscontinue. Under these scenarios, the policy goals for bioenergy arereached, and the development potentials, as well as capacity limi-tations, e.g. for domestic agricultural production or refining, areconsidered. A more ambitious approach to increase efficiency in allsectors, in particular in engines and vehicles, would lead to a lowerdemand for biomass for energetic use2. Hence, the efficient use ofenergy is a key element for reducing GHG and global land use.Under BAU development, non-food biomass demand in Germanywill lead to a high increase in the global requirement for non-foodbiomass and the associated agricultural land through 2030.
In 2030, the total demand for non-food biomass in Germanywould reach 18.9–24.7 Mt (BAU I to II3), almost 3–4 times morethan in 2006 (Table 3). Biofuels would comprise the largest share ofthis, with 12–17 Mt in 2030. Of this, biodiesel would contribute tomore than half, with the remainder mainly comprised of similaramounts of plant oils used as direct fuels, bioethanol, and BtL(Biomass-to-Liquid). Biogas as a fuel would only play a minor role.Starting in 2010, BtL would increase 100–133 times, reaching1.5–2 Mt by 2030. Biomass for electricity/heat would comprise thesecond largest share of non-food biomass demand in 2030 at 2.4–2.8 Mt, with biogas contributing about three-fifths. The whole
Table 2Global requirement for non-food biomass use in Germany 2004–2006, based on biomass cultivated on agricultural land (in thousand metric tonnes).
Non-food biomass 2004 2005 2006 Share of grand total in 2006 Increase from 2004–2006 (factor)
BiofuelsBiodiesel 1185 1800 2791 43% 2.4Plant oils as direct fuel 130 196 710 11% 5.5Bioethanol 79 226 480 7% 6.1Total biofuels 1394 2222 3982 62% 2.9
Biomass for electricity and heatPlant oils for electricity/heat 20 28 102 2% 5.1Biogas for electricity/heat 33 205 362 6% 10.9Total biomass for electricity/heat 53 233 464 7% 8.7
Plant oils and fats for non-energetic usePlant oils and fats for non-energetic use 840 861 884 14% 1.1Lubricants and additives 20 21 22 0% 1.1Total plant oils and fats for non-energetic use 860 882 906 14% 1.1
Starch and sugar for non-energetic useStarch for non-energetic use 640 700 714 11% 1.1Sugar for non-energetic use 240 295 325 5% 1.4Total starch and sugar for non-energetic use 880 995 1038 16% 1.2
Natural fibres for non-energetic useFlax and Hemp 31 35 40 1% 1.3
Pharmaceutical and dye plantsPharmaceutical plants 22 30 32 0% 1.5Dye plants 0 0 0 0% 1.0Total pharmaceutical and dye plants 22 30 32 0% 1.5
Grand total 3240 4397 6462 100% 2.0Of which: for energetic use 1447 2455 4446 69% 3.1Of which: for non-energetic use 1793 1942 2016 31% 1.1Non-energetic use as % of grand total 55% 44% 31%
2 In the subsequent text ‘‘biofuels’’ stands for ‘‘liquid biofuels’’ and biogas whichare mainly used for transport; in addition, energetic use of biomass also comprisesplant oils and biogas, in particular from maize, which are mainly used for powerand heat generation.
3 Ranges given here and in the following refer to the expected developmentcorridor defined by BAU I and BAU II unless otherwise stated.
S. Bringezu et al. / Journal of Cleaner Production 17 (2009) S57–S68 S61

Author's personal copy
group would increase 5–6 times from 2006. Starch and sugar fornon-energetic use would be ranked third at 2.2–2.6 Mt (BAU I to II)in 2030, representing a doubling or a 2.5-fold increase from 2006.The fourth largest group would be plant oils and fats for non-energetic use at 1.4–1.7 Mt (BAU I to BAU II) in 2030, with increasesof 60–80% from 2006. Flax, hemp, pharmaceutical and dye plantswould still only contribute minor amounts in 2030, despitesignificant increases in their use. Overall, the increase under BAU upto 2030 would be dominated by energetic biomass at 3.3–4.5 timesthe use rate as compared to 2006, whereas biomass for non-ener-getic use would have slightly more than doubled over this period.
In 2030 the supply of Germanywith non-food biomass – in termsof mass flows – would depend 38–45% on imports (Table 3). Importdependency for energetic biomass use (31–40%) would be lowerthan for non-energetic biomass (61–65%). A particularly high importdependency, of around three-fifths to four-fifths of total supply,would be for plant oils for electricity/heat, plant oils and fats for non-energetic use, sugar for non-energetic use, flax and hemp, andpharmaceutical plants. Biofuels for transportation would depend32–42% (BAU I to BAU II) on imports, resulting mainly from similarshares for biodiesel (35–45%), bioethanol (30–66%), BtL (50% forboth BAU I and II), and only domestic supply for plant oils as fuels.
In 2006 Germany required 3.9 Mha of agricultural land world-wide for the total amount of non-food biomass used (Table 4; grossproduction land). Most of this land was required for energeticbiomass (ca. 80%), in particular for biofuels at 2.8 Mha, and amongthese for biodiesel at 2.1 Mha. Roughly two-fifths (41%) of the totalland requirement in 2006 was in foreign countries, the ratio was
25% for energetic biomass and an even higher share of foreign land,of 64%, for non-energetic use (mainly for plant oils and fats).
In 2030 Germany would require 11.4–11.9 Mha of agriculturalland for non-food biomass, almost 3 times more than in 2006, ofwhich about 90% would be for energetic use. Biofuels would largelydetermine this increase. The most important single contribution tothe increase in global land requirements would come frombiodiesel, with 6.9–7.6 Mha (BAU I to BAU II) of agricultural land. Inaddition, biomass for electricity/heat would demand a highcontribution of 1.1–1.26 Mha of agricultural land.
Due to its limited availability of domestic arable land, Germanywould rely mostly on foreign agricultural land to supply therequired non-food biomass – about 70–73% of the total (BAU II toBAU I). Four-fifths of the total land required for biofuels in 2030would have to be claimed from abroad; for biodiesel the share offoreign land would be even higher, i.e. 94–99%, because domesticrapeseed oil would be primarily used for direct fuel, electricity/heatgeneration, and non-energetic purposes.
3.3. Germany’s use of global agricultural land for foodand non-food consumption
In 2004 Germany claimed approximately 20.6 million hectares(Mha) worldwide for its consumption of agricultural goods. Forinternational comparison, this amounted to 2500 m2 per person,which was about as much land as was available in terms of cropland(arable land andpermanent crops; net consumption land) on averagefor the world’s population per person using data from the FAO [29]
Table 3Global requirement for non-food biomass use in Germany in 2030 according to BAU I and BAU II compared with 2006 and the share of imports in 2030, based on biomasscultivated on agricultural land (in thousand metric tonnes).
Non-food biomass Total demand Increase since 2006a Share of imports
2030 2030 (factor) 2030
BAU I BAU II BAU I BAU II BAU I BAU II
BiofuelsBiodiesel 7746 9116 2.8 3.3 35% 45%Plant oils as direct fuel 1622 2911 2.3 4.1 0% 0%Bioethanol 1464 2996 3.1 6.2 30% 66%BtL 1500 2000 100.0 133.3 50% 50%Biogas as fuel 16 34 6.7 13.5 0% 0%Total biofuels 12,349 17,057 3.1 4.3 32% 42%
Biomass for electricity and heatPlant oils for electricity/heat 921 1204 9.0 11.8 72% 79%Biogas for electricity/heat 1464 1626 4.0 4.5 0% 0%Total biomass for electricity/heat 2384 2830 5.1 6.1 28% 34%
Plant oils and fats for non-energetic usePlant oils and fats for non-energetic use 1378 1585 1.6 1.8 82% 84%Lubricants and additives 71 82 3.2 3.7 0% 0%Total plant oils and fats for non-energetic use 1449 1667 1.6 1.8 78% 79%
Starch and sugar for non-energetic useStarch for non-energetic use 943 990 1.3 1.4 12% 12%Sugar for non-energetic use 1261 1574 3.9 4.9 74% 79%Total starch and sugar for non-energetic use 2204 2565 2.1 2.5 47% 53%
Natural fibres for non-energetic useFlax and Hemp 329 378 8.3 9.5 76% 76%
Pharmaceutical and dye plantsPharmaceutical plants 159 182 4.9 5.7 71% 71%Dye plants 0 0 1.8 2.1 0% 0%Total pharmaceutical and dye plants 159 183 4.9 5.7 71% 71%
Grand Total 18,873 24,679 2.9 3.8 38% 45%Of which: for energetic use 14,733 19,888 3.3 4.5 31% 40%Of which: for non-energetic use 4140 4791 2.1 2.4 61% 65%Non-energetic use as % of grand total 22% 19%
a For BtL and Biogas as fuel the factor of increase refers to 2010 because in 2006 these fuels were not yet consumed resp. Biogas was used only in negligible amounts.
S. Bringezu et al. / Journal of Cleaner Production 17 (2009) S57–S68S62

Author's personal copy
(Fig. 2). Most of this global land requirement in 2004 were for animalbased nutrition (61%), while almost one-third (31%) was for plantbased nutrition, 3% for energetic biomass, and 4% for non-energeticbiomass. Germany’s global land requirement in 2004was in linewiththe worldwide per capita availability, but exceeded its domesticallyavailable agricultural land of 2063m2 per person by around 21%.
Since domestic land could onlymeet about one-fifth (19–22%) ofthe demand for biofuels in 2030, increased imports would benecessary – leading to an increase in the area required for theconsumption of all agricultural goods by 25.5–26 Mha in 2030. Thiswould equal 2800–2900 m2 per person. In 2030, 43–44% (BAU I toBAU II) of Germany’s global land requirement would be for animalbased nutrition, 23% (BAU I and BAU II) for plant based nutrition,27% (BAU I and BAU II) for energetic biomass, and 6–7% for non-energetic biomass. Germany’s global land requirement in 2030would exceed its domestically available agricultural land of2160 m2 per person by 30–36%, under BAU development for non-food biomass and given unchanged nutrition habits.
In 2030, domestic agricultural land in Germany would amountto 17 Mha (¼2160 m2 per person), and thus exceed on a per capitabasis the world’s cropland per person of 1983 m2 (based onprojections of cropland availability in 2030 by [37] and worldpopulation in 2030 by [38]).
3.4. Greenhouse gas emissions
In 2030 the estimated consumption of biodiesel would lead to37–54 Mt of greenhouse gas (GHG) emissions (in terms of CO2equivalents) from land-use changes in tropical countries (Table 5).
Taking GHG mitigation of 14–17 Mt through the use of biodieselinstead of fossil diesel into account, a net effect of 23–37 Mt ofgreenhouse gases would result from the use of expanded produc-tion areas abroad. This means 1.7–2.2 times more GHG emissionswould occur through biodiesel use. In case these trends continue,a net relief for the climate through Germany’s imported dieselquantities could not be expected before the period between 2040and 2050.
Taking the total GHG mitigation of 25–35 Mt gained through theuse of all energetic biomass instead of fossil energy into account(based on BAU I to BAU II), a net effect of 12–19 Mt of additionalgreenhouse gas emissions would result. This is due to the use ofexpanded production areas abroad. Sensitivity analysis showed thatthe negative balance of biodiesel could be mitigated, but not turnedto a positive effect, if the domestic agricultural area potentiallyavailable through yield increases was not used for export – as it islikely to be – but rather, for example, for the cultivation of plantsserving as feedstocks for second generation biofuel production likeBtL, which would in turn reduce the need for imports.
In 2030, the expansion of the net consumption land foragricultural goodswould lead to 13–27 Mt of greenhouse gas (GHG)emissions from land-use changes in tropical countries (Table 5).Taking the GHGmitigation of 14–17 Mt through the use of biodieselinstead of fossil diesel into account, a net effect from biodiesel useof only 1 Mt of emission reduction to 10 Mt more GHG emissionswould result.
Taking the total GHG mitigation gained through the use of25–35 Mt of energetic biomass instead of fossil energy into account,a net effect of 12–8 Mt of additional greenhouse gases would result,
Table 4Global agricultural land requirement for non-food biomass use in Germany in 2006 and 2030 under BAU I and II (in thousand hectares), and share of the agricultural landrequirement in foreign countries.
Non-food biomass Global land use in hectares Share of land-use abroad
2006 2030 2006 2030
BAU I BAU II BAU I BAU II
BiofuelsBiodiesel 2050 7626 6912 26% 94% 99%Plant oils as direct fuel 522 839 1,505 0% 0% 0%Bioethanol 238 439 670 100% 15% 45%BtL 0 198 264 0% 50% 50%Biogas as fuel 0 3 7 0% 0% 0%Total biofuels 2810 9105 9358 26% 81% 78%
Biomass for electricity and heatPlant oils for electricity/heat 45 266 323 0% 50% 59%Biogas for electricity/heat 295 839 932 0% 0% 0%Total biomass for electricity/heat 340 1105 1255 0% 12% 15%
Plant oils and fats for non-energetic usePlant oils and fats for non-energetic use 469 575 621 75% 76% 77%Lubricants and additives 6 15 17 0% 0% 0%Total plant oils and fats for non-energetic use 475 590 638 74% 74% 75%
Starch and sugar for non-energetic useStarch for non-energetic use 214 196 205 33% 12% 12%Sugar for non-energetic use 33 92 115 71% 74% 79%Total starch and sugar for non-energetic use 247 288 320 38% 32% 36%
Natural fibres for non-energetic useFlax and Hemp 27 225 259 93% 78% 78%
Pharmaceutical and dye plantsPharmaceutical plants 18 88 101 63% 71% 71%Dye plants 0 0 0 0% 0% 0%Total pharmaceutical and dye plants 18 88 101 63% 71% 71%
Grand total 3918 11,401 11,932 41% 73% 70%Of which: for energetic use 3150 10,210 10,613 25% 74% 71%Of which: for non-energetic use 768 1191 1319 64% 64% 66%Non-energetic use as % of grand total 20% 10% 11%
S. Bringezu et al. / Journal of Cleaner Production 17 (2009) S57–S68 S63

Author's personal copy
significantly less than mitigation without taking land-use changesinto account. Especially the use of biodiesel would decrease theoverall GHG savings by 52–77%.
3.5. Alternative scenario elements
In search of alternative development pathways we analysedcertain options with regard to their impact on global land-userequirements and GHG savings (Table 6). The basic strategy of usingnon-food biomass primarily for material purposes, re-use andrecycle it several times, and finally recovers the energetic value ofthe organic waste and residues would provide benefits in bothrespects, which appear obvious and are therefore not studied hereany further. Instead, the following options were included in thescenario analysis for Germany:
(1) substitution of biogas for the biofuels produced from energycrops in Germany and used for electricity and heat;
(2) replacement of the electricity from biogas derived from energycrops by photovoltaics;
(3) reduction of animal production in Germany;(4) reduction of the fuel consumption of the vehicle fleet;
(5) reduction of the consumption of animal based nutrition;(6) reduction of the share of wasted nutritional goods in trade,
commerce and households.
The analysis revealed that strategies on the supply side, such asin options (1)–(3) contribute to national GHG emission reductionin different degrees, but in terms of global land use shows no oronly a relatively small effect (Table 6). If biofuels from domesticcropland were replaced on the same area, GHG emissions could bereduced by 15.8–17.9 Mt (1a). If the energy content of biofuelsgrown on domestic land was replaced by biogas, 100 m2 per capitacould be saved (1b). The same saving potential of 100 m2 per capitacould be achieved if photovoltaics were substituted for biogas forelectricity generation, with an additional GHG emission reductionby 2.7– 3 Mt (2). Reduced domestic animal production wouldresult in constant land requirements and at the same time GHGemissions if domestic consumption would not be reduced, leadingonly to a shift of supply towards increased imports of animal basedfood (3).
A change in consumption would therefore be a prerequisite ifglobal land-use requirements were to be significantly reduced(Options 4–6).
0
500
1000
1500
2000
2500
3000
3500
2004 2030
squa
re m
eter
per
cap
ita
Global agricultural land formaterial biomass use inGermany
Global agricultural land forenergetic biomass use inGermany
Global agricultural land forplant-based nutrition inGermany
Global agricultural land foranimal-based nutrition inGermany
Domestic agricultural landin Germany
Cropland: World
Fig. 2. Global agricultural land use of Germany compared with domestically available agricultural land in Germany and cropland in the World; square meters per capita in 2004 and2030. On the basis of net consumption land, 2.800 m2 per Person would be available under BAU I in 2030 and 2930 m2 per Person under BAU II in 2030.
Table 5Global land use and greenhouse gas emissions from non-food biomass use in Germany in 2030.
Question 1 Question 2
a) Reference for emissionsfrom LUC: Gross productionland for biodiesel
b) Reference for emissionsfrom LUC: Net consumptionland for agricultural goods –its increase from 2004 to 2030
BAU I BAU II BAU I BAU II
1) Land requirements in million hectares 7.21 6.88 2.49 3.44Of which: for palm oil Indonesia 0.56 1.09 0.19 0.55Of which: for soya beans Brazil 6.65 5.79 2.29 2.89
2) GHG Emissions absolute from LUC inmillion tonnes CO2 equivalents (Component 2)
a 37 54 13 27
3) GHG Mitigation through Biodiesel in milliontonnes CO2 equivalents (Component 1)
b #14 #17 #14 #17
Net-Effect GHG for Biodiesel in milliontonnes CO2 equivalents
a plus b 23 37 #1 10
Year when GHG saving begins 2039 2050
4) GHG Mitigation through Biomass in milliontonnes CO2 equivalents (Component 1)
c #25 #35 #25 #35
Net-Effect GHG for Biomass in milliontonnes CO2 equivalents
a plus c 12 19 #12 #8
LUC: Land-use change; GHG Greenhouse gases. Note: for explanation of methodological approach please refer to Section 2 and [26] and to the Appendix.
S. Bringezu et al. / Journal of Cleaner Production 17 (2009) S57–S68S64

Author's personal copy
With a reduction in the fuel consumption of the car fleet (4) byapproximately 30% (according to the discussion of limiting CO2emissions to 130 g of CO2 per km), Germany’s use of globalagricultural land over the medium term would be reduced by500–600 m2 per capita (about 17–20% of global requirements in2030 under BAU II conditions), if the use of biofuels were completelyabandoned. The climate protective effect of this measure would bearound 29.6 Mt of greenhouse gas savings, significantly higher thanthe maximum effect that could be achieved by the use of biofuels, asintended by national quota regulations.
A reduction in the consumption of an animal based diet (5) toa level recommended by the German Society for Nutrition, wouldmean a net savings of up to about 500 m2 per capita.
In addition, a reduction in the share of wasted nutritional goodsin households (6) could result in savings of at least 200 m2 percapita, while the additional potential of reducing the losses inwholesale and retail trade remains open.
In total, options 4–6would lead to a savings potentialwhich couldcontribute significantly to sustainable development with regard toGermany’s requirement of global agricultural land, and which wouldeven leave some space for the production of biomass primarily formaterials (e.g. in bio-refineries) as well as for the supply of food forthe growing worldwide demand, or for using larger areas for natureprotection or organic cultivation. This potential could de facto only beused via measures aimed at changing consumption, which in turnwould synergistically support resource and climate protection.
4. Discussion
The BAU scenarios mean that Germany’s use of global croplandwould expand. The main contribution to this development comesfrom the increasing use of biofuels, which can only be met byincreasing imports. As a consequence, Germany would significantlycontribute to increasing the pressure to expand the global areaunder cultivation and the associated environmental impacts, suchas GHG emissions and a loss of biodiversity.
The results depend critically on the extent of domestic agricul-tural land available in the future for growing non-food biomass inGermany. Our assumptions here are in line with other relevantstudies with comparable scope [39–41]. There are two studieswhich arrive at higher domestic land potentials for growingrenewables [42,43], their results, however, are mainly due to theassumption of high yield increases which have been assessed to beunrealistic by our recent inquiry to German experts. In addition, allthese studies did not account for the total global agricultural landrequirement of Germany in the context of relevant globaldevelopment trends, and thus need to be re-considered for thatimportant aspect. Furthermore, in case environmental and natureconcerns were to be promoted more vigorously within Germany,
NGOs asking to enlarge the areas of low-intensity farming and ofnature conservation, the domestic agricultural land potential forgrowing non-food biomass in Germany could drop even signifi-cantly below our figures [39,40,44,45], with the consequence thatthe foreign share of global crop land use would grow, if demand forbiofuels was not accommodated.
Even if we widen the scope and include Member Countries of theEU, the situation will not change significantly. A study of Schonleberet al. [43] concludes that 36% of the 20% renewable energy sharetarget of the EU for 2020 could be met by agricultural energy cropsbut with only few EU-countries (especially Germany, France, Spain)contributing, whereas more than half of the EU Member Statescannot even meet the EU 2010 biofuels target of 5.75% by domesticproduction. Further, inmany countries like United Kingdom, Italy andGreece the domestic land potential does not reach for self-sufficiencyin food, leaving a strong dependency for imports from third countriesto meet supply with both food and energy. Also, Kavalov et al. [46]found that new member states ‘‘should be seen more as a positivebut small complement to EU-15 biofuel production, rather than asa large scale supplier of biofuels for the enlarged EU.’’
One may argue that the EU could source biofuels from feedstocksin Eastern Europe, e.g. in Ukraine as suggested by the ‘‘Refuel’’ study[47]. However, thiswould imply that net imports to the EU (includingfrom Ukraine) would increase along with its global land use,resulting in an extension of the global arable land area, thus resultingin a similar situation as found for Germany. Neither the Refuel studynor the EEA study [44] considers the global net land use associatedwith the total consumption of agricultural goods in those countries.
A key criterion for evaluating global resource use is the percapita availability of agricultural land. Of particular interest is thearea of cropland, which encompasses arable land and permanentcrops. On the one hand, this land provides the basis for plantderived nutrition for the world’s population, and on the other itscultivation is associated with various environmental impacts andits extension competes with natural ecosystems. In 2004, globalcropland was approximately 2500 m2 per person. Based on fore-casts from the UN and FAO [37,48] the world’s population in 2030will have increased by about 30% as compared to 2004, and theyields per hectare for cereals will have increased by about 29%, i.e.roughly keeping the same pace (Fig. 3).
Data from the FAO show that in the period between 1961 and2006 cereal yields rose, but that this increase in the last decade wasweakened4 (see also [49]), so that an extrapolation of linear growth,
Table 6Summary results from alternative scenario elements for Germany (Net consumption land).
Supply side Savings potential for global land requirement (2030) Savings potential for CO2 equivalents
(1) Biogas replaces biofuels a) Constantb) 100 m2 per capita
a) 15.8–17.9 Mtb) n.a.
(2) Photovoltaic replaces biogas 100 m2 per capita 2.7–3.0 Mt(3) Reduced domestic animal production þ/# at constant consumption þ/# at constant consumption
Demand side(4) Emission mitigation for automobiles
to 130 g CO2/km500–600 m2 per capita 29.6 Mt
23% Diesel, 27% gasoline(5) Reduced domestic animal based diet according
to recommendations of DGE400–500 m2 per capita n.a. (Synergistic)
(6) Reduction of wasted food in households ca. 200 m2 per capita n.a. (Synergistic)
a: Biogas produced from biomass on domestic land formerly used for biofuels. b: Biogas replaces the energy content of biofuels from domestic land DGE: Deutsche Gesellschaftfur Ernahrung (German Society for Nutrition) n.a.: no data available n.a. (synergistic): no data available, it can be assumed that a synergistic effect takes place leading tomitigation of global land requirement.
4 From 1961 to 2006, cereal yields in the world had increased by 43 kg per yearon average, from 1996 to 2006 the average increase p.a. was 35 kg, the period1993-2003 showed an increase of 38 kg p.a. on average (based on FAOSTAT onlinedata [29]).
S. Bringezu et al. / Journal of Cleaner Production 17 (2009) S57–S68 S65

Author's personal copy
or even higher increases in average yields, has to be seen critically.Scenarios from IFPRI [50] show that under unfavourable conditionsin the water sector (scenario ‘‘water crisis’’) the global cerealssupply per person would decline by 14 kg between 1995 and 2025(or by 4.6%). On the other hand, a favourable sustainable watersupply worldwidewould lead to increases of 19 kgmore cereals perperson between 1995 and 2025 (plus 6.2%), and BAU developmentwould result in a surplus of 17 kg per person over the same period(plus 5.4%). Future developments in the agricultural sector thusrange from declining to increasing per capita supply of the world’spopulation with cereals. Part of the increase will be offset by theincreasing demand for meat and dairy products in developingcountries (see below).
In this context one should also consider the fact that yields oncropland cannot be increased indefinitely if ecological restric-tions are taken into account. For example, even at maximisedefficiency, fertiliser application and thus yield, may be limiteddue to the leaching of minerals into the groundwater and theresulting water quality problems. The current situation in highyield farming areas is already characterised by eutrophication,like in the USA where corn for ethanol has already contributed toserious problems of eutrophication and hypoxia in the Mis-sissippi delta [51].
In 2030, only about 2000 m2 of cropland will be available perperson in the world, evenwhen considering the FAO forecasts of anabsolute extension of cultivated area by 120 Mha [37]. This wouldmean that per capita, one-fifth less will be available than in 2004.As such, factors like consumption patterns (animal versus plantbased diet) and yield increase will strongly effect the provision ofthe world’s population with products from agriculture.
Meat consumption in developing countries will increase from2004 to 2030 by 55%, while cereal consumption will increase by‘‘only’’ around 28% [48]. Since the production of animal feedrequires considerably more land than would be needed fora direct vegetarian diet of human beings, this development alonewill significantly increase the pressure for the expansion ofagricultural land at the expense of natural ecosystems. The extentof the increased land requirement for higher meat consumptionas opposed to plant nutrition depends on the types of meatsconsumed, and on factors such as the yield of different feedstuffsand the efficiency of feed conversion. As a starting point forcomparison, figures from Germany may be analysed, whichreveal that animal based food per nutrition value (cal), requiresa 4.8 times larger land area than the consumption of plant food(based on [52]). It is also expected that in countries currentlysuffering from hunger, food consumption will rise significantly inthe future, and thus further increase the demand for additional
acreage requirements (for arable land and permanent crops),although this additional requirement can hardly be quantified [9].
This means that the demand for nutrition alone puts growingpressure on the further expansion of cultivated land. The demandfor biofuels as fuel crops will increase this pressure on the scarceagriculturally usable land. BAU development would lead Germanyto globally use 2800–2900 m2 per person of intensively cultivatedagricultural land in 2030, which would clearly exceed the availableworldwide cropland of 2000 m2 per person.Without biofuel use fortransport, Germany’s use of global agricultural land would onlyamount to 2100–2200 m2 per person.
In our BAU scenarios we assumed increases in the yields ofanimal and plant based nutrition of 1% on average per year from2004 to 2030. If Germany were not to exceed the global per capitaavailability of cropland in 2030, yields for nutritional goods wouldhave to increase by an average of 2.4% per year, i.e. 2.4 times more.Such high increases can hardly be expected however. The FAO [37]assumes an average increase of 1.2% per year for cereal yields indeveloping countries between 1998 and 2030. IFPRI [50] alsoassumes that under BAU development a cereal yield increase by1.2% on average per year between 2004 and 2030 will occur. If a lessfavourable development was to take place, as in IFPRI’s water crisisscenario, a cereal yield increase of only 0.9% p.a. on average from2004 to 2030 would result. A more favourable developmentfollowing IFPRI’s sustainable water use scenario would bring abouta cereal yield increase of 1.3% p.a. on average between 2004 and2030.
This discussion has focused on cropland as intensively managedagricultural land in terms of arable land and permanent crops.Pastureland was not taken into account for data related to theworld situation. The reason for this is that much global pasturelandresembles semi-natural land instead, and is generally less exten-sively managed than cropland. Moreover, there is a controversyregarding the physical extension of global pastureland and a recentstudy [53] based on satellite data has claimed that significantly lessarea exists than had been previously suggested by FAO data. Since2003, the FAO has not reported on the area of global pasturelanddue to great uncertainties in basic data. Nevertheless, future studiesshould also take into account the area of intensively managedpastureland for global supply with agricultural goods.
It is difficult to predict the overall effect of these factorsregarding the global supply of food and non-food biomass. In thefuture, factors such as increased land degradation and the impactsof climate change will affect average yields. Given these parame-ters, developed countries like Germany should aim to reduce theirresource requirements in order to avoid conflicts, to mitigate land-use competition and to pave the way for a more sustainable globalresource management.
BAU development of biofuel use would be counterproductive tothe efforts put forth in Germany to combat climate change. Insteadof improvement, an additional contribution to global warmingwould result – caused by a global additional land requirement fromGermany driving land use changes in tropical countries towardscropland expansion at the expense of natural ecosystems. Further,serious environmental impacts, such as a progressive loss ofbiodiversity in the producing countries, would have to be expected.It is unlikely that these effects could be avoided by application ofthe biomass sustainability regulations proposed by either the EU orGermany. We have estimated the minimum net additional landrequired to supply Germany’s demand for food and non-foodbiomass products. Even if the planned production and productbased standards were to be applied successfully and excluded theuse of recently converted land for biofuel cropping, the additionalland requirements would have to be satisfied from cultivated areaselsewhere, thus leading to displacement of agriculture activities
60
80
100
120
140
160
2004 2030
Inde
x 20
04 =
100
Population
Cropland
Cropland per capita
Cereals yields in DC
Meat consumption in DC
Sources: UN population statistics [38] ; FAO [37, 48].Note : arrows indicate expected range of change based on FAO projections.
Fig. 3. Global trends in agriculture (cropland, cropland per capita, cereals yields),population growth, and meat consumption in developing countries, 2004–2030.
S. Bringezu et al. / Journal of Cleaner Production 17 (2009) S57–S68S66
Author's personal copy
and land cover transformation. Our results are in line with themodelling for the EU done by Eickhout et al. [3].
The new EU directive on energy use from renewable sources [1]calls for reviewing the impact of indirect land use change ongreenhouse gas emissions and addressing ways to minimise thisimpact. According to our analysis the risk of indirect effectsdepends on the overall demand of biofuels. Thus, any productspecific approach to define kind of a ‘‘risk adder’’ [54], would haveto be complemented by projections on the country or regionallevel. More research is needed to include the risk of indirect land-use change into the accounting for net effects of specific biofuels toGHG mitigation by considering the performance of both theconsuming country/region and the product/production on a global/life-cycle wide basis.
In order to reduce the pressure on global cropland and ecosys-tems significantly and to adjust demand to the worldwide averageuse of cropland, Germany’s global net land requirement comparedto BAU would have to decline by one quarter to one-third (BAU I toII; i.e. by 830–951 m2 per person). We have shown that this wouldbe possible if reductions were made in the average fuel consump-tion of the car fleet, the consumption of an animal based diet, andthe wasted nutritional goods in households.
Overall, a potential saving is possible which would contributesignificantly to a more sustainable global agricultural land use byGermany and would even provide a certain area for the productionof biomass for primary use as amaterial (for example, biopolymers)and to meet the growing global demand for food, or for increasingthe area available for organic farming. This potential can only bereached by changing national consumption patterns, with syner-gistic effects for the protection of natural resources and the climateworldwide.
5. Conclusions
We have shown that an increase in the use of biomass, and inparticular biofuels, in Germany would lead to an expansion ofcropland requirements in tropical regions. The consumption ofbiodiesel would increase GHG emissions induced by land-usechange for the next decades.
Purely product specific standards will not prevent displacementeffects due to the growing overall demand for biomass products. Inlight of the growing world demand for food and other agriculturalgoods, and the uncertainties associated with that, Germany shouldaim to decrease its overall global cropland requirement. The policytargets with implications for land use should be revised. Inparticular, the existing binding biofuel quotas should be reducedrather than increased. Moreover, effective programs to save energyand resources are needed. A higher efficiency in the use of biomassand mineral resources is indispensable to cope with the growingglobal scarcity of land. In general, biomass should be primarily usedfor food and material purposes, and the energy content should berecovered from by-products and organic wastes.
The analysis of global land use for domestic supply providesimportant knowledge on the global implications of nationalconsumption activities and the overall effect of international trade.In order to mitigate problem shifting between countries andregions, the analysis and monitoring of trans-boundary resourceuse and environmental impacts should be further strengthened.
Acknowledgements
We would like to thank three anonymous reviewers for theircomments valuable for improving the manuscript. We are verygrateful to our colleague Meghan O’Brien at Wuppertal Institute forcareful proof-reading of the draft version of this paper in terms of
linguistic corrections. We further thank Julia Munch and SvenGartner at IFEU for contributions to GHG emissions calculations.
Appendix. Supplementary data
Supplementary data associated with this article can be found inthe online version, at doi:10.1016/j.jclepro.2009.03.007
References
[1] EC – Council of the European Union. European Parliament legislative resolu-tion of 17 December 2008 on the proposal for a directive of the EuropeanParliament and of the Council on the promotion of the use of energy fromrenewable sources (COM(2008)0019 – C6-0046/2008 – 2008/0016(COD)).
[2] EC – European Commission. Biofuels progress report. Report on the progressmade in the use of biofuels and other renewable fuels in the Member States ofthe European Union. Brussels (Belgium): Commission Staff Working Docu-ment, SEC; 2006. 1721/2, 2006.
[3] Eickhout B, van den Born GJ, Notenboom J, van Oorschot M, Ros JPM, vanVuuren DP, et al. Local and global consequences of the EU renewable directivefor biofuels. Testing the sustainability criteria. Milieu en Natuur Planbureau.MNP report 500143001/2008.
[4] Bundesregierung. Gesetz zur Einfuhrung einer Biokraftstoffquote durchAnderung des Bundes-Immissionsschutzgesetzes und zur Anderung energie-und stromsteuerrechtlicher Vorschriften (Biokraftstoffquotengesetz – Bio-KraftQuG) vom 18. Dezember 2006. Bundesgesetzblatt Jahrgang 2006 Teil I Nr.62, ausgegeben zu Bonn am 21; Dezember 2006.
[5] Bundesregierung. Eckpunkte fur ein integriertes Energie- und Klimaprog-ramm. And follow-up process: BMELV, BMU et al.. Berlin: Roadmap Bio-kraftstoffe; 21.11.2007.
[6] BMU. Bundesministerium fur Umwelt, Naturschutz und Reaktorsicherheit.Weiterentwicklung der Strategie zur Bioenergie. Berlin; April 2008.
[7] REN21. Renewables 2007 – Global Status Report. Paris: REN21 Secretariat andWashington, DC: Worldwatch Institute. Copyright ! 2008 Deutsche Gesell-schaft fur Technische Zusammenarbeit (GTZ) GmbH.
[8] UN-Energy. Sustainable bioenergy: a framework for decision makers; 2007.[9] OECD. Environmental outlook to 2030. Paris: OECD, ISBN 978-92-64-04048-9;
2008.[10] Biofuelwatch, Carbon Trade Watch/TNI, Corporate Europe Observatory, Eco-
nexus, Ecoropa, Grupo de Reflexion Rural, Munlochy Vigil, NOAH (Friends ofthe Earth Denmark), Rettet den Regenwald und Watch Indonesia. Agrofuels –towards a reality check in nine key areas; 2007.
[11] Bringezu S, Schutz H, Arnold K, Bienge K, Borbonus S, Fischedick M, et al.Nutzungskonkurrenzen bei Biomasse - Auswirkungen der verstarkten Nut-zung von Biomasse im Energiebereich auf die stoffliche Nutzung in der Bio-masse verarbeitenden Industrie und deren Wettbewerbsfahigkeit durchstaatlich induzierte Forderprogramme. Ein Studie des Wuppertal Instituts furKlima, Umwelt, Energie GmbH (WI) und des Rheinisch-Westfalischen Institutfur Wirtschaftsforschung (RWI) fur das Bundesministerium fur Wirtschaft undTechnologie (BMWi). Endbericht 25. April 2008. Wuppertal, Essen.
[12] Rosegrant MW, Msangi S, Sulser T, Valmonte-Santos R. Biofuels and the globalfood balance. In: Hazell P, Pachauri RK, editors. Bioenergy and agriculture –promises and challenges, http://www.ifpri.org/2020/focus/focus14.asp; 2006.
[13] OECD-FAO. Agricultural outlook: 2007–2016. Paris: OECD; 2007.[14] Fargione J, Hill J, Tilman D, Polasky S, Hawthorne P. Land clearing and the
Biofuel Carbon debt. Sciencexpress 2008. 10.1126/science.1152747.[15] Searchinger T, Heimlich R, Houghton RA, Dong F, Elobeid A, Fabiosa J, et al. Use
of U.S. croplands for biofuels increases greenhouse gases through emissionsfrom land use changes. Sciencexpress 2008. 10.1126/science.1151861.
[16] Pastowski A, Fischedick M, Arnold K, Bienge K, Geibler J, Merten F, et al. Sozial-okologische Bewertung der stationaren energetischen Nutzung von impor-tierten Biokraftstoffen am Beispiel von Palmol. Endbericht zur gleichnamigenStudie im Auftrag des Bundesministerium fur Umwelt, Naturschutz undReaktorsicherheit. Wuppertal, Heidelberg, Wurzburg: Wuppertal Institut,Institut fur Energie- und Umweltforschung Heidelberg (IFEU), Wilhelm Mer-ton-Zentrum; 2007.
[17] Bundesregierung. Dritter nationaler Bericht zur Umsetzung der Richtlinie2003/30/EG vom 08.05.2003 ‘‘zur Forderung der Verwendung von Bio-kraftstoffen oder anderen erneuerbaren Kraftstoffen im Verkehrssektor’’ fur2005. Berlin; 2007.
[18] Nitsch J. Leitstudie 2007. ‘‘Ausbaustrategie Erneuerbare Energien’’ – Aktuali-sierung und Neubewertung bis zu den Jahren 2020 und 2030 mit Ausblick bis2050. Untersuchung im Auftrag des BMU. Stuttgart; 2007.
[19] EWI/Prognos. Energiereport IV. Die Entwicklung der Energiemarkte bis zumJahr 2030. Energiewirtschaftliche Referenzprognose. Schlussbericht. Im Auf-trag des Bundesministeriums fur Wirtschaft und Arbeit, Berlin. Koln, Basel;2005.
[20] BMU – Bundesministerium fur Umwelt, Naturschutz und Reaktorsicherheit.Erneuerbare Energien in Zahlen, Ausgabe; 2007.
[21] Meo Consulting Team, Institut fur Energetik und Umwelt gGmbH, FaserinstitutBremen. Marktanalyse Nachwachsende Rohstoffe. Gulzow: FNR – FachagenturNachwachsende Rohstoffe; 2006.
S. Bringezu et al. / Journal of Cleaner Production 17 (2009) S57–S68 S67

Author's personal copy
[22] FNR – Fachagentur Nachwachsende Rohstoffe. Nachwachsende Rohstoffe inder Industrie. Gulzow: Fachagentur fur Nachwachsende Rohstoffe (FNR),http://www.fnr-server.de/cms35/Produktgruppen.65.0.html; 2006.
[23] CHOREN: Pressemitteilung vom; 31.1.2007.[24] Meo Consulting Team, Faserinstitut Bremen und nova-Institut GmbH. Mark-
tanalyse Nachwachsende Rohstoffe Teil II. Gulzow: FNR; 2007.[25] Umsicht – Fraunhofer-Institut fur Umwelt-, Sicherheits- und Energietechnik.
Raster zur Beschreibung der Nawaro-Segmente Ole und Fette, Kohlehy-drathaltige Pflanzen und Faserpflanzen fur die stoffliche Nutzung. InterneDokumente. Wuppertal: Wuppertal Institut; 2006.
[26] Bringezu S, Schutz H, Schepelmann P, Lange U, von Geibler J, Bienge K, et al.Wuppertal Institut fur Klima, Umwelt, Energie; Fraunhofer-Institut furUmwelt-, Sicherheits- und Energietechnik – UMSICHT; IFEU – Institut furEnergie- und Umweltforschung Heidelberg (2008): ‘‘Optionen einer nach-haltigen Flachennutzung und Ressourcenschutzstrategien unter besondererBerucksichtigung der nachhaltigen Versorgung mit nachwachsenden Roh-stoffen’’. Vorhaben Z 6 – 91 054/82, Forschungskennzahl (FKZ) 205 93 153,Endbericht Mai 2008. Wuppertal.
[27] Bringezu S, Steger S. Biofuels and competition for global land use. In: Berger H,Prieß R, editors. ‘‘Bio im Tank. Chancen – Risiken-Nebenwirkungen’’, Confer-ence documentation of conference series ‘‘KyotoþLab’’ of the Heinrich-Boll-Foundation and the European Climate Forum. Global Issue Papers No. 20.Heinrich-Boll-Foundation. Berlin 2005. P. 64–79.
[28] EUROSTAT Comext. Intra- und extra-EU trade. DVD. Luxembourg.[29] FAOSTAT. data online at, http://faostat.fao.org/default.aspx.[30] Schutz H, Moll S, Bringezu S. Globalisation and the shifting environmental
burden: material trade flows of the european union. Wuppertal Paper 134e.Wuppertal: Wuppertal Institute, http://www.wupperinst.org/Sites/wp.html;July 2004.
[31] Grieg-Gran M, Haase M, Kessler JJ, Vermeulen S, Wakker E. The Dutcheconomic contribution to worldwide deforestation and forest degradation.Report prepared for Greenpeace Netherlands. London and Amsterdam; 2007.
[32] Hooijer A, Silvius M, Wosten H, Page S. Peat-CO2. Assessment of CO2 emis-sions from drained peatlands in SE Asia. Delft Hydraulics Report Q3943.Amsterdam; 2006.
[33] Flaskerud G. Brazil’s Soybean production and impact. NDSU ExtensionServices, North Dakota State University of Agriculture and Applied Science,and U.S. Department of Agriculture; 2003.
[34] Jungk N, Reinhardt GA. Landwirtschaftliche Referenzsysteme in okologischenBilanzierungen. Eine Basisanalyse. Heidelberg: IFEU; 2000.
[35] Morton DC, DeFries RS, Shimabukuro YE, Anderson LO, Arai E, Espirito-Santo FdB, et al. Cropland expansion changes deforestation dynamics in thesouthern Brazilian Amazon. PNAS Early Edition, www.pnas.org/cgi/doi/10.1073/pnas.0606377103; July 27, 2006. Contributed by Ruth S. DeFries.
[36] IFEU – Institut fur Energie- und Umweltforschung Heidelberg. Rettenmeier/Gartner/Munch/Reinhardt: Eigene Berechnungen und Abschatzungen unterVerwendung von /IPCC 2006/, /Delitti 2001/, /Delitti 2006/, /ArbeitsgruppeFeuerokologie Freiburg 2007/und andere. Heidelberg; 2007.
[37] FAO. World agriculture: towards 2015/2030. An FAO perspective. Rome/Lon-don: Food and Agriculture Organization (FAO)/Earthscan Publications; 2003.
[38] UN population statistics online: medium variant. Available at: http://www.un.org/popin/.
[39] Fritsche, U.R., Dehoust, G., Jenseit, W., Hunecke, K., Rausch, L., Schuler, D., et al.Stoffstromanalyse zur nachhaltigen energetischen Nutzung von Biomasse, Mai2004. Verbundprojekt BMU im Rahmen des ZIP, PR :FZ Julich. Endbericht.Darmstadt; 2004.
[40] Nitsch J, Krewitt W, Nast M, Viebahn P, Gartner S, Pehnt M, et al. Okologischoptimierter Ausbau der Nutzung erneuerbarer Energien in Deutschland.
Forschungsvorhaben im Auftrag des Bundesministeriums fur Umwelt, Natur-schutz und Reaktorsicherheit. Stuttgart, Heidelberg, Wuppertal; 2004.
[41] Nusser M, Sheridan P, Walz R, Seydel P, Wydra S. Makrookonomische Effektedes Anbaus und der Nutzung von nachwachsenden Rohstoffen. Studie fur dasBundesministerium fur Ernahrung, Landwirtschaft und Verbraucherschutzvertreten durch die Fachagentur Nachwachsende Rohstoffe e.V., Gulzow.Karlsruhe und Gießen, 2007.
[42] Thran D, Weber M, Scheuermann A, Frohlich N, Zeddies J, Henze A, et al.Nachhaltige Biomassenutzungsstrategien im europaischen Kontext. Studie furdas BMU. Endbericht. Leipzig; 2005.
[43] Schonleber N, Henze A, Zeddies, J. Angebotspotenziale der Landwirtschaft inEuropa zur Sicherung der Nahrungsmittelproduktion und ihr potenziellerBeitrag zu erneuerbaren Energien. In: Paper prepared for presentation at the47th annual conference of the GEWISOLA (German Association of AgriculturalEconomists) and the 17th annual conference of the OGA (Austrian Associationof Agricultural Economists), ‘Changing Agricultural and Food Sector’, Freising/Weihenstephan, Germany, September 26–28, 2007.
[44] EEA – European Environment Agency. Howmuch bioenergy can Europe producewithout harming the environment. Report No. 7/2006. Copenhagen; 2006.
[45] NABU. Biomassenutzung aus Sicht des Natur- und Umweltschutzes. Natur-schutzbund Deutschland e.V. Berlin; 2007.
[46] Kavalov B, Jensen P, Papageorgiou D, Schwensen C, Olsson JP. Biofuelproduction potential of EU-Candidate Countries. JRC-IPTS, ESTO, Report EUR20835 EN, Sevilla; 2003.
[47] de Wit MP, Faaij APC. Biomass resources potential and related costs –assessment of the EU-27, Switzerland, Norway and Ukraine. Refuel WorkPackage 3 final report. Copernicus Institute – Utrecht University, theNetherlands; January 2008.
[48] FAO. World agriculture: towards 2030/2050. Interim report. Rome: Food andAgriculture Organization (FAO); 2006.
[49] Hazell P, Wood S. Drivers of change in global agriculture. Phil Trans R Soc B2008;363:495–515.
[50] Rosegrant MW, Cai X, Cline SA. World water and food to 2025: dealing withscarcity. Washington, DC: International Food Policy Research Institute (IFPRI);2002.
[51] Donner SD, Kucharik CJ. Corn-based ethanol production compromises goal ofreducing nitrogen export by the Mississippi River. Proc Natl Acad Sci USA2008;105(11):4513–8.
[52] Busch R. Untersuchung zur nachhaltigen Nutzung nachwachsender Rohstoffe:Globale Flachenbelegung Deutschlands fur Produktion und Konsum tierischerNahrungsmittel. Diplomarbeit an der Humboldt-Universitat zu Berlin, Geo-graphisches Institut, sowie personliche Mitteilungen. Berlin und Wuppertal;2008.
[53] Ramankutty N, Evan AT, Monfreda C, Foley JA. Farming the planet: 1.Geographic distribution of global agricultural lands in the year 2000. GlobalBiogeochem Cycles 2008:22. doi:10.1029/2007GB002952. GB1003.
[54] Fritsche UR. Beyond the German BSO: Scope of future work on land-userelated GHG. In: Presentation on the Workshop on Sustainable Biofuels; 25January 2008.
[55] IPCC. Guidelines for national greenhouse gas inventories. Hayama, Japan:Institute for Global Environmental Strategies (IGES); 2006.
[56] Delitti WBC, Meguro M, Pausas JG. Biomass and mineral mass estimates ina ‘‘cerrado’’ ecosystem. Revista Brasil Bot 2006;29(4):531–40.
[57] Delitti WBC, Pausas JG, Burger DM. Belowground biomass seasonal variationintwo Neotropical savannahs (Brazilian Cerrados) with different fire histories.Ann For Sci 2001;58:713–21.
[58] Wosten H. Alterra, Wageningen University and Research Centre: SchriftlicheMitteilung vom; 08.10.2007.
S. Bringezu et al. / Journal of Cleaner Production 17 (2009) S57–S68S68