Embed Size (px)
Citation preview

This article appeared in a journal published by Elsevier. The attachedcopy is furnished to the author for internal non-commercial researchand education use, including for instruction at the authors institution
and sharing with colleagues.
Other uses, including reproduction and distribution, or selling orlicensing copies, or posting to personal, institutional or third party
websites are prohibited.
In most cases authors are permitted to post their version of thearticle (e.g. in Word or Tex form) to their personal website orinstitutional repository. Authors requiring further information
regarding Elsevier’s archiving and manuscript policies areencouraged to visit:
http://www.elsevier.com/copyright

Author's personal copy
Modeling landscape dynamics in an Atlantic Rainforest region: Implications forconservation
Ana Maria G. Teixeira a, Britaldo S. Soares-Filho b, Simone R. Freitas a,c, Jean Paul Metzger a,*a Department of Ecology, Institute of Biosciences, University of Sao Paulo, Rua do Matao, 321, travessa 14, 05508-900 Sao Paulo, SP, Brazilb Center of Remote Sensing, Federal University of Minas Gerais, Av. Antonio Carlos, 6627, 31270-901 Belo Horizonte, MG, Brazilc Federal University of ABC, R. Catequese, 242, 09090-400 Santo Andre, SP, Brazil
1. Introduction
The Atlantic Rainforest is internationally recognized by its largenumber of species (1–8% of the world’s species), of which a largeamount is endemic (Myers et al., 2000; Galindo-Leal and Camara,2003). The last estimation from Mittermeier et al. (2005) identified8000 endemic plant species (40% of endemism), 148 birds (16%), 71mammals (27%), 94 reptiles (31%) and 286 amphibians (60%), tocite only the most studied taxonomic groups.
Nonetheless, the Atlantic Rainforest is probably one of the mostthreatened tropical biome. Originally, its extent reached out 1.48million km2, totalizing 17% of the Brazilian territory. However, by2005, only 160,000 km2 of its forests, equivalent to 11–12% of its
original forest cover, remained (Fundacao SOS Mata Atlantica andINPE, 2008; Ribeiro et al., submitted for publication). Historically,deforestation of the Atlantic Rainforest was closely related to themajor Brazilian economic cycles, beginning with the exploitationof Pau-Brasil, Caesalpinia echinata (16th century) and succeeded bythe expansion of sugar cane (from 18th century) and thewidespread conversion to pasturelands and coffee plantations(19th and 20th). More recently, deforestation has been related tourban sprawl and the expansion of Eucalyptus plantations (Dean,1997; Drummond, 2004). Even today, despite legal restrictions ondeforestation, the rate of forest loss is still high, ca. 0.25% per year(Fundacao SOS Mata Atlantica and INPE, 2008).
As a consequence of five century of intense occupation, theAtlantic Rainforest is highly fragmented, holding forest fragmentsin average lesser than 100 ha (Jorge and Garcia, 1997; Viana et al.,1997; Ranta et al., 1998; Morellato and Haddad, 2000; Galindo-Leal and Camara, 2003; Ribeiro et al., submitted for publication).
Forest Ecology and Management 257 (2009) 1219–1230
A R T I C L E I N F O
Article history:
Received 18 August 2008
Received in revised form 3 October 2008
Accepted 7 October 2008
Keywords:
Landscape dynamics
Atlantic Rainforest
Deforestation
Regrowth
Land-use and land-cover simulation
Biodiversity conservation
DINAMICA
A B S T R A C T
The dynamics of the Atlantic Rainforest loss and recovery are still not fully understood despite its long
history of human occupation. In this study, we investigated changes in an Atlantic Rainforest region due
to major biophysical and human proximate causes. First, we modeled land-cover and land-use changes
from 1962 to 2000, including deforestation and forest regrowth, and thereby simulated future landscape
trajectories to assess their possible effects on the conservation of forest species of the Ibiuna Plateau, a
region located in Southeastern Brazil within the Atlantic Rainforest biome. We modeled four scenarios
(status quo, random, law enforcement, and land-use intensification) and simulated their resulting landscape
trajectories for the year 2019 using DINAMICA. The landscape dynamics in the study region were
particularly intense. During the first period of 1962–1981, the rate of forest regrowth (3% year�1) was
greater than the rate of deforestation (2% year�1), whereas in the latter period of 1981–2000, increasing
urbanization and the spreading of rural establishments resulted in more deforestation (2.9% year�1) than
regrowth (1% year�1). These dynamics imprinted a heterogeneous landscape, leading to the
predominance of progressively younger secondary forests with increasingly less capacity of hosting
sensitive forest species. The influence of proximate causes on the dynamics of deforestation and forest
regrowth showed consistent patterns, such as higher forest regrowth rates near rivers, on steep slopes
and far from dirt roads, whereas losses in young secondary vegetation and forest were far from rivers, on
gentle slopes and near urban areas. Of the modeled scenarios, only the law enforcement scenario may lead
to the recovery of a network of interconnected forest patches, suggesting that simply the enforcement of
current forest laws, which prohibit deforestation on unsuitable agricultural areas and along river margins
and establish a minimum of 20% of forest remnant per rural property, may effectively favor forest species
conservation in the short term (two decades) without the need of any forest restoration effort.
� 2008 Elsevier B.V. All rights reserved.
* Corresponding author. Tel.: +55 11 3091 7564; fax: +55 11 3091 8096.
E-mail address: [email protected] (J.P. Metzger).
Contents lists available at ScienceDirect
Forest Ecology and Management
journal homepage: www.e lsev ier .com/ locate / foreco
0378-1127/$ – see front matter � 2008 Elsevier B.V. All rights reserved.
doi:10.1016/j.foreco.2008.10.011
Author's personal copy
Currently, more than 500 Atlantic Rainforest endemic species ofdifferent taxa are considered highly vulnerable to extinction(Conservation International do Brasil, 2000; Galindo-Leal andCamara, 2003). Despite the high risk of species extinctions, thedynamics of Atlantic Rainforest loss and recovery have not yetbeen fully investigated, contrary to the large number of studies forthe Brazilian Amazon (e.g. Skole and Tucker, 1993; Dale et al.,1996; Walker and Homma, 1996; Alves et al., 1999; Lauranceet al., 2001; Achard et al., 2002; Metzger, 2002; Soares-Filho et al.,2002, 2004, 2006; Ferraz et al., 2005).
Landscape dynamics studies and models have been widely usedto understand the proximate causes and underlying driving forcesof tropical deforestation (see review in Geist and Lambin, 2002), todetect structural thresholds in deforestation patterns (Oliveira-Filho and Metzger, 2006), and also to forecast outcomes fromdifferent scenarios of land-use management, such as potentialcarbon emission and habitat loss (Soares-Filho et al., 2006),alterations in the hydrological cycle (Costanza et al., 2002), andclimate change (Sampaio et al., 2007).
In this context, this study aimed: (i) to model the dynamics ofdeforestation and forest regrowth in a fragmented AtlanticRainforest region in order to understand the major biophysicaland human proximate causes controlling the dynamics from 1962to 2000; (ii) thereby to simulate future changes in the landscapestructure and composition to assess their potential effects onspecies conservation under a range of plausible land-use manage-ment scenarios.
2. Study site
The study site is located on the Ibiuna Plateau, 60 km west fromthe city of Sao Paulo (238410S–238470S; 478020W–478070W). Thisarea belongs to the Serra do Mar ridge, a bio-geographical region(Silva and Casteleti, 2003) with the highest level of endemism forseveral taxonomic groups in the whole Atlantic Rainforest biome(Manne et al., 1999; Costa et al., 2000; Brown and Freitas, 2000).The study site encompassed an area of 7800 ha of which 31% isforested (Fig. 1). The Ibiuna Plateau is situated just above theParanapiacaba Serra, in a transitional zone between the continuous(>80%) coastal rain forest in the south, and the highly deforested(<3%) and fragmented mesophyllous semi-decidual forest ofinland Sao Paulo State (Kronka et al., 2005). The forests of studysite may be classified as ‘‘lower mountain rain forest’’ (Oliveira-Filho and Fontes, 2000), but also contain species from the Araucaria
mixed forest, the semi-deciduous forest and Cerrado (woodysavanna) regions (Catharino et al., 2006).
The region’s substrate is predominantly composed of Pre-Cambrian crystalline rocks, essentially with high metamorphicgrade, such as migmatites and granites (Almeida, 1964). Differentrelief systems can be observed, such as mountain plateau withsteep slopes, mountain with moderate to gradual slopes, andalluvial plains ranging from 860 to 1060 m of elevation (Ross and
Moroz, 1997; Oliveira, 1999). According to the American SoilTaxonomy, the main soils in the region are alfisols, ultisols, oxisolsand inseptisols (Ross and Moroz, 1997). The climate of Ibiuna ismild hot and humid Cfa type according to Koppen system (Koppen,1948). Mean month temperatures range between 27 and 11 8C. Theaverage annual precipitation is about 1300–1400 mm, with thedriest months and the lowest average temperatures from April toAugust (30–60 mm/month) and the wettest (200–260 mm/month)and warmest months from November to March (SABESP, 1997).
On the Ibiuna Plateau, the dynamics of deforestation and forestregrowth have been strongly linked to the growth of the city of SaoPaulo, in terms of supply of charcoal for power generation, mainlyduring the Second World War, and lately for agricultural products(Seabra, 1971). More recently, better access to the region has led toan intense periurban expansion as well as to the proliferation ofweekend country houses for middle-class families.
The boundaries of the study site were defined by a buffer zonesurrounding 21 fragments that have been object of undergoingresearches aiming to assess the effects of forest fragmentation onseveral taxonomic groups and ecological processes (e.g. Pardiniet al., 2005; Uezu et al., 2005; Silva et al., 2007; Durigan et al., 2008;Martensen et al., 2008; among others).
3. Methods
3.1. Mapping landscape dynamics
We used aerial photographs from 1962 (1:25,000), 1981(1:35,000) and 2000 (1:10,000) to map land-use and land-coverchanges. As explained below, the same mapping procedure wasapplied to all imagery products to allow comparisons regardingclassification accuracy and to reduce errors in the subsequentanalyses.
The photos were scanned at 1 m resolution and georeferencedwith an RMS error ranging from 5 to 12 m. Five land-use and land-cover classes were defined based on the level of detail available forthe smallest scale imagery (1:35,000, Table 1). These classesincluded (1) buildings, (2) crops fields, (3) forest plantation, (4)forest and (5) young secondary vegetation (Fig. 2). Photointerpretation was performed by only two trained people in orderto reduce errors related with different abilities of interpretation.All subsequent analyses and simulations were performed usingraster layers at 15 m resolution.
We evaluated the mapping accuracy by visiting 65 vegetationpoints randomly distributed throughout the study area. As a result,we obtained an overall accuracy of 88% for the native vegetationclasses and higher than 95% for the other land-use classes of the2000 map (Silva et al., 2007). First, all five land-use and land-coverclasses were used to quantify the changes in the landscape and toanalyze the influence of proximate causes on them. Finally, in thescenario modeling process, the three land-use classes: (1)buildings, (2) crop fields, (3) forest plantation—were merged into
Table 1Land-use and land-cover classes specified in the aerial photograph classification (Ibiuna Plateau, Brazil).
Land-use and land-cover classes Description
Land-use
Urban and rural buildings Isolated buildings, hedges, grouped buildings, condominia, settlements
Crop fields Mostly crop fields or fallow fields, but also with some areas used for cattle ranching or some abandoned/disturbed
herbaceous vegetation, with or without shrubs
Forest plantation Forest plantation with exotic species, e.g. Pinus spp. and Eucalyptus spp.
Land-cover
Young secondary vegetation Shrub to arboreal vegetation with up to 5–6 m height continuous canopy
Forest Intermediate to old secondary forest with canopy height usually >10 m, with or without emergent trees up to 30–35 m
A.M.G. Teixeira et al. / Forest Ecology and Management 257 (2009) 1219–12301220

Author's personal copy
a single class called ‘‘land-use’’, resulting into four land-use/land-cover transitions comprising deforestation, forest regrowth, loss ofyoung secondary vegetation, and regrowth of young secondaryvegetation (Table 1).
3.2. Model calibration
We used the Weights of Evidence method (Soares-Filho et al.,2004) to select the variables most related to observed landscapechanges as well as to quantify their influences on each of themodeled transitions. This method produces as a result transitionprobability maps that depict the integrated influence of proximatecauses on the modeled transitions (Soares-Filho et al., 2004). Thevariables we examined comprised a set of biophysical and humanfactors that spatially determine the location of the changes thusreferred as proximate causes. This set includes slope, elevation,
distances to rivers, major and secondary roads, urban centers, anddistances to previously forested, regrowth and deforested areas(Tinker et al., 1998; Endress and Chinea, 2001; Felicısimo et al.,2002; Nagendra et al., 2003; Soares-Filho et al., 2004; Hietel et al.,2004). All spatial variables were either derived from topographicmap (1:10,000 scale, elevation level interval of 5 m) or from theseries of derived landscape maps. Since Weights of Evidencecoefficients are obtained for map categories of each spatial variableunder analysis, all continuous gray-tone maps needed to becategorized. For elevation and slope, we used regular intervals,respectively, of 40 m (from 860 to >1020 m) and 58 (from 08 to>308). For distance variables, such as distances to rivers and mainroads, the distance classes followed geometric ranges (for example,0–50, 50–100, 100–200, 200–400 m) in order to obtain narrowerbuffers closer to the geographical feature under consideration. Abasic assumption for the Weights of Evidence method is that the
Fig. 1. The study region (box) in the State of Sao Paulo, Southeastern Brazil. The limits of the Atlantic Rainforest are depicted in gray in Sao Paulo (IF, 2005) and South America
maps (CRIA, 2008). In detail, aerial photographs showing the landscape in April 2000 (forest cover in gray and black) and two maps showing the landscape dynamics for two
time periods: 1962–1981 and 1981–2000.
A.M.G. Teixeira et al. / Forest Ecology and Management 257 (2009) 1219–1230 1221
Author's personal copy
variables must be spatially independent. We tested the spatialindependence of the aforementioned variables using the Crammercoefficient (V) and found that all variables, except the pair distanceto secondary roads and distance to urban centers, have valueslower than an empirical threshold (V < 0.45), and thus are spatiallyindependent (Almeida et al., 2003).
3.3. Simulation set up and running
We used DINAMICA, a landscape dynamics cellular automatamodel (Soares-Filho et al., 2002, www.csr.ufmg.br/dinamica), torun the landscape change simulations. The model was calibratedfor two time periods, i.e. 1962–1981 and 1981–2000, using thetransition matrices and the Weights of Evidence coefficientsobtained by cross-tabulating 1962 and 1981 maps and 1981 and2000 maps. Finally, annual time-step simulation maps wereproduced from 1962 to 2000.
To approximate the simulated landscape structure of the actualone, we tested different models changing the parameters of thetransition functions employed by DINAMICA: the Expander andthe Patcher (Soares-Filho et al., 2002). These functions incorporatecellular automata local rules conceived to mimic the neighborhoodinfluence on the transition of a cell state. The Expander is dedicatedonly to the expansion or contraction of previous patches of acertain land-use and land-cover class (Soares-Filho et al., 2002). Inturn, the Patcher is designed to form new patches through aseedling mechanism (Soares-Filho et al., 2002). DINAMICA allowsto split the quantity of simulated changes between these twofunctions as well as to vary the mean size, size variance andisometry of the simulated patches of change. Since DINAMICAtransition functions employ a stochastic cell selection mechanism,10 replicates were produced for each model tested.
The structure of the simulated landscapes was compared withthe actual 2000 landscape using cluster and principal componentanalyses (Zar, 1999). We used FRAGSTATS1 software (version 3.3;McGarigal and Marks, 1995) to measure a set landscape indices,which included the number of patches (NP), the largest patch index(LPI), the area-weighted mean patch area (AREA_AM) and theclumpiness index (CLUMPY). The simulated landscape withstructure most similar to the 2000 landscape resulted from a
model with 80% of changes assigned to Expander and 20% toPatcher, and with deforestation simulated patches having 20 ha asmean patch size. Patch size variance was set to zero and isometryvalue was set to 2.0. The transition function parameters of the bestfitted model, along with the Weights of Evidence derived for the1981–2000 period, were employed to simulate the future land-scape trajectories onto 2019 under each of the modeled scenarios.
3.4. Scenario modeling
Insights of the effects of land-use practices and managementon a region’s landscape dynamics can be evaluated by confrontingscenarios consisting of alternative assumptions (Almeida et al.,2003; Soares-Filho et al., 2004, 2006). In this study, we modeledfour scenarios to evaluate the implications of possible landscapetrajectories on the conservation of the Ibiuna Plateau forests.These scenarios are status quo, random, land-use intensification
(pessimistic scenario) and law enforcement (optimistic scenario).All scenarios, except the random, were established from plausibleperspectives with respect to the land-use and land-coverobserved trends as well as to the compliance of the currentenvironmental laws. Resulting landscape changes within eachmodeled scenario were simulated from 2000 to 2019 using annualtime-steps.
The status quo scenario, which was used as a baseline forcomparison, assumed that historical trends observed during 1981–2000 time period will continue into the future. Thus, this scenarioapplies a Markovian approach, simply projecting the changes intothe future using transition rates annualized from the 1981–2000time-period transition matrix (for details see Soares-Filho et al.,2002). The random scenario involved the same approach of thestatus quo scenario; however, the influence of proximate causes onthe landscape dynamics, as determined by the Weights of Evidencecoefficients, was removed. In this manner, the random scenarioaimed to assess the resulting landscape structure if the changeshad no spatial influence. In the land-use intensification (pessimistic)scenario, we modified the 1981–2000 annualized transition matrixso that all changes from young secondary forest to forest werereallocated to the transition from young secondary vegetation toland-use, and then used this modified transition matrix to forecast
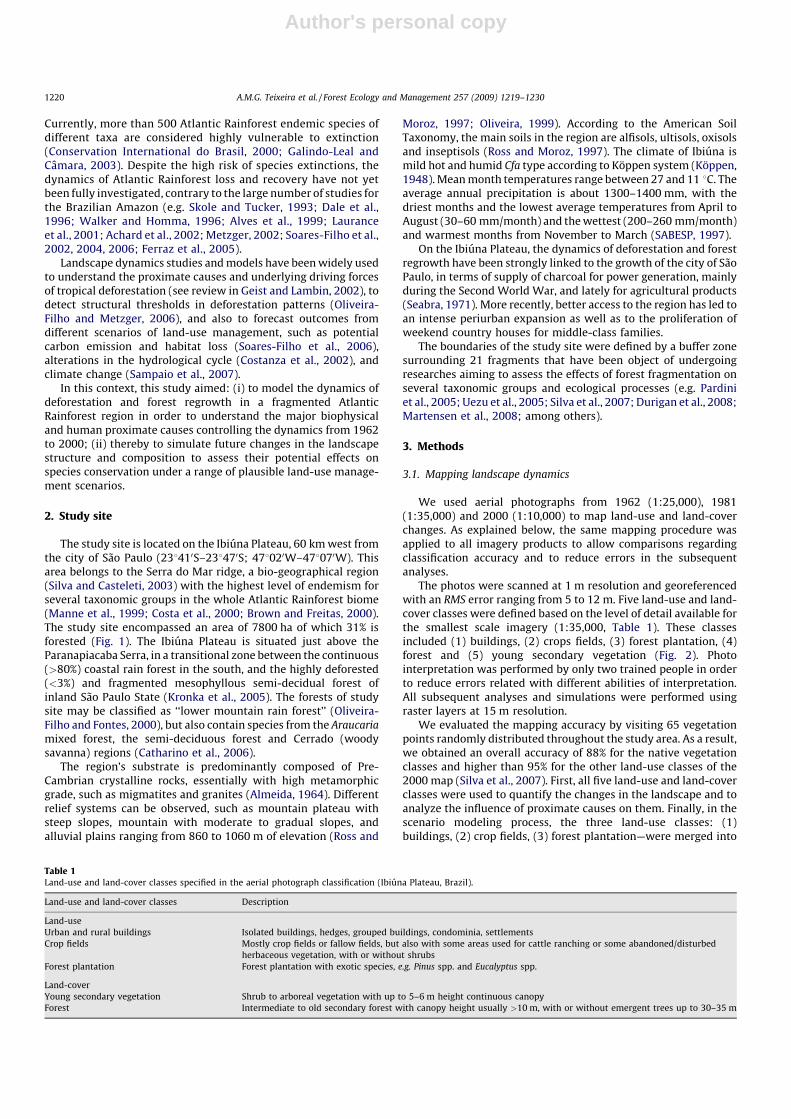
Fig. 2. Land-use and land-cover maps of the studied landscape for 1962, 1981 and 2000 (Plateau of Ibiuna, SE Brazil).
A.M.G. Teixeira et al. / Forest Ecology and Management 257 (2009) 1219–12301222
Author's personal copy
the future landscape trajectory. Hence, the land-use intensification
scenario represents a reduction in fallow areas as a response tobetter access to the region provided by newly paved highways. Inthe law enforcement (optimistic) scenario, the annualized transi-tion matrix of 1981–2000 had its deforestation rate set to zero toduly abide by the current environmental laws, which protectriparian forest and impede deforestation on steep slopes and ontop of hills and ridges.
For each scenario, we performed 10 simulation replicates from2000 to 2019 – similarly to Castro et al. (2005) – and analyzed theresulting landscapes with respect to their conservation potentialfor strictly forest species, which are most sensitive to forestfragmentation. In this step, we employed the landscape metrics:number of forest patches (NP), largest forest patch index (LPI),mean forest patch area (AREA_MN) and mean forest proximityindex distribution (PROX_MN) calculated with a search radius of800 m (McGarigal and Marks, 1995). These landscape metrics aresignificantly correlated; however, this is not a limitation for theproposed analysis.
The main objective of this analysis was to identify the bestlandscape configuration for forest species conservation, which ishypothetically a landscape with: (i) a high forest cover; (ii) a smallnumber of forest fragments; (iii) a high largest forest patch indexthat can support stable populations and be source for small patches;(iv) a large mean forest patch area; and (v) a high mean forestproximity index. This analysis did not consider different perceptionsof landscapes by individual species (Vos et al., 2001; Opdam et al.,2003; Fischer and Lindenmayer, 2007), nor the effect of the matrixon the function of the landscape (Antongiovanni and Metzger, 2005;Belisle, 2005; Taylor et al., 2006; Umetsu and Pardini, 2007; Umetsuet al., 2008) and the quality of forest habitat (Harrison and Fahrig,1995). However, this approach allowed for a preliminary compar-ison of the modeled scenarios with respect to their potential forbiodiversity conservation, especially when there is no otherbiological information available. To test if there was significantdifference between the modeled scenarios, we employed the test ofvariance (ANOVA) on each landscape metric (NP, LPI, AREA_MN,PROX_MN), using each of the 10 simulation runs per scenario as anindependent value. When difference was found using ANOVA,Tukey’s HSD post hoc test was used (a = 0.05) (Zar, 1999).
4. Results
4.1. Landscape dynamics
The dominant land-use and land-cover for all three mappedyears were forest (43.8% of the whole landscape in 1962, 48.3% in
1981, and 33.3% in 2000) and crop fields (36.2%, 37.7%, 35.8% for1962, 1981, and 2000, respectively; Fig. 2). In 1962 and 1981,urban and rural buildings (0.6%, 1.5%) and forest plantation (2.2%,3%) had little expression, however, in 2000, the areal percent ofthose land-use classes increased significantly (16.6% and 6.8%,respectively). Young secondary vegetation showed a constantreduction over time, decreasing from 17.2% in 1962 to 9.6% in 1981and 7.6% in 2000, pointing out a tendency of land-use intensifica-tion. Both time periods were highly dynamic modifying approxi-mately half of the landscape (50.7% between 1962 and 1981; 45.8%between 1981 and 2000).
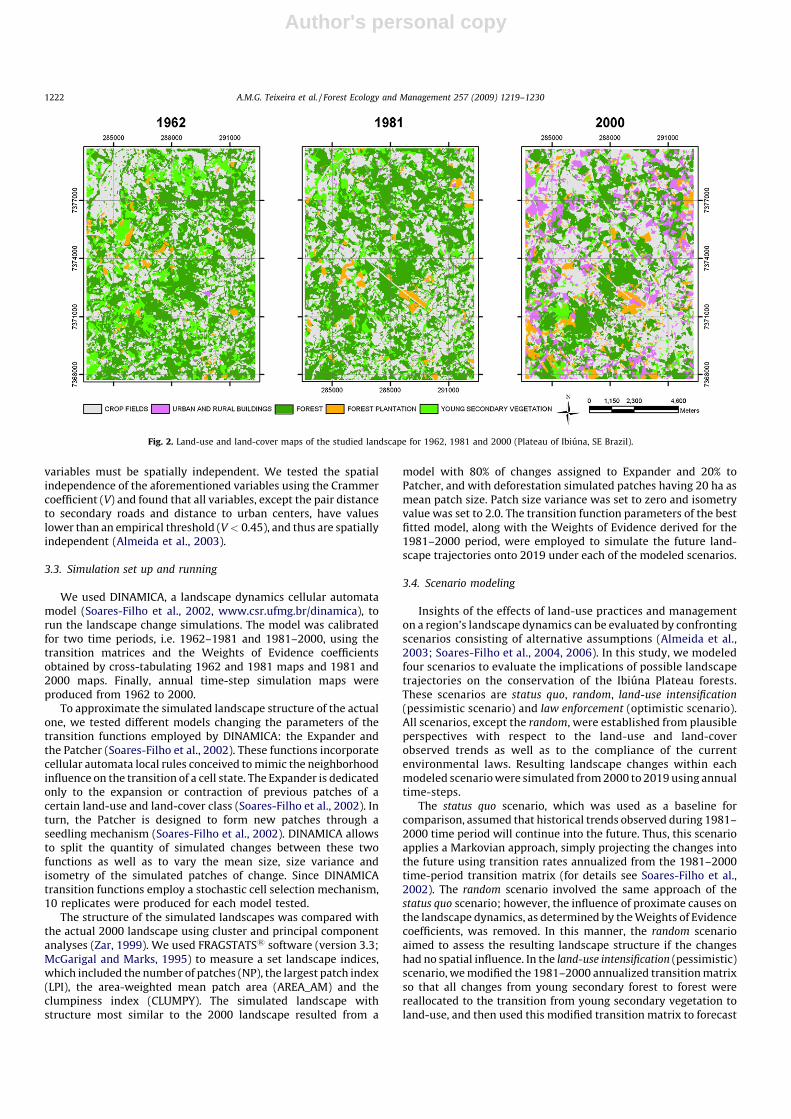
Landscape dynamics between 1962 and 1981 were character-ized by greater forest regrowth than deforestation (Fig. 3). Whileforest and young secondary vegetation were converted to crops(852.8 ha deforested and 393.7 ha young secondary vegetationloss), forest regrowth from abandoned crops fields (734.2 ha) andyoung secondary vegetation (735.8 ha) was also high. Regrowth ofyoung secondary vegetation mostly occurred from crop fields(56.8% of the whole young secondary vegetation recoveredbetween 1962 and 1981). The transition from forest to youngsecondary vegetation, which probably represented deforestationfollowed by regrowth, also contributed to the young secondaryvegetation class in 1981 (238.8 ha). The total area of deforestationwas 1232.5 ha (64.9 ha/year) and the total area of forestregeneration was 1566 ha (82.4 ha/year). Young secondary vege-tation increased 593.6 ha and lost 1162.9 ha. Thus, this trendresulted in a reduction of young secondary vegetation (�569.3 ha)and in an expansion of forest (333.4 ha).
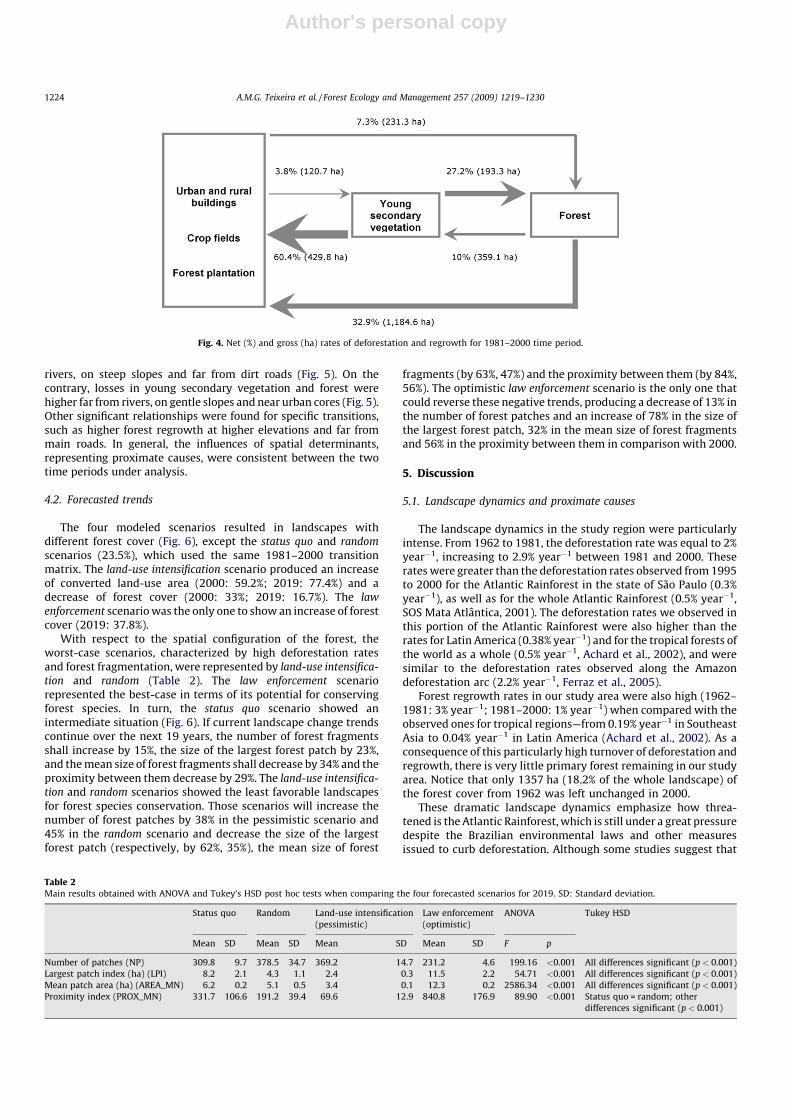
The second time period (1981–2000) was characterized by anexpansion of urban and rural buildings (1020% or 1125.2 ha) and areduction in the native vegetation extent (Fig. 4). The increase ofurban and rural buildings took place at the expense of crop fields(48.8% of the whole urban and rural buildings in 2000) and forestland (32%). In 2000, 17.7% of the whole forest and 11% of youngsecondary vegetation in 1981 were replaced by urban and ruralbuildings and crop fields. Most young secondary vegetation in2000 was forest in 1981 (359.1 ha, corresponding to 63.2% of youngsecondary vegetation in 2000), suggesting that land was abandon-ment soon after deforestation. In this time period, total deforesta-tion was 1543.7 ha (81.2 ha/year), while forest regrowth was424.6 ha (22.3 ha/year). Young secondary vegetation increased479.8 ha and at the same time lost 623.1 ha. As a result, losses inforest cover and in young secondary vegetation amounted,respectively, to 1117.1 and 143.3 ha.
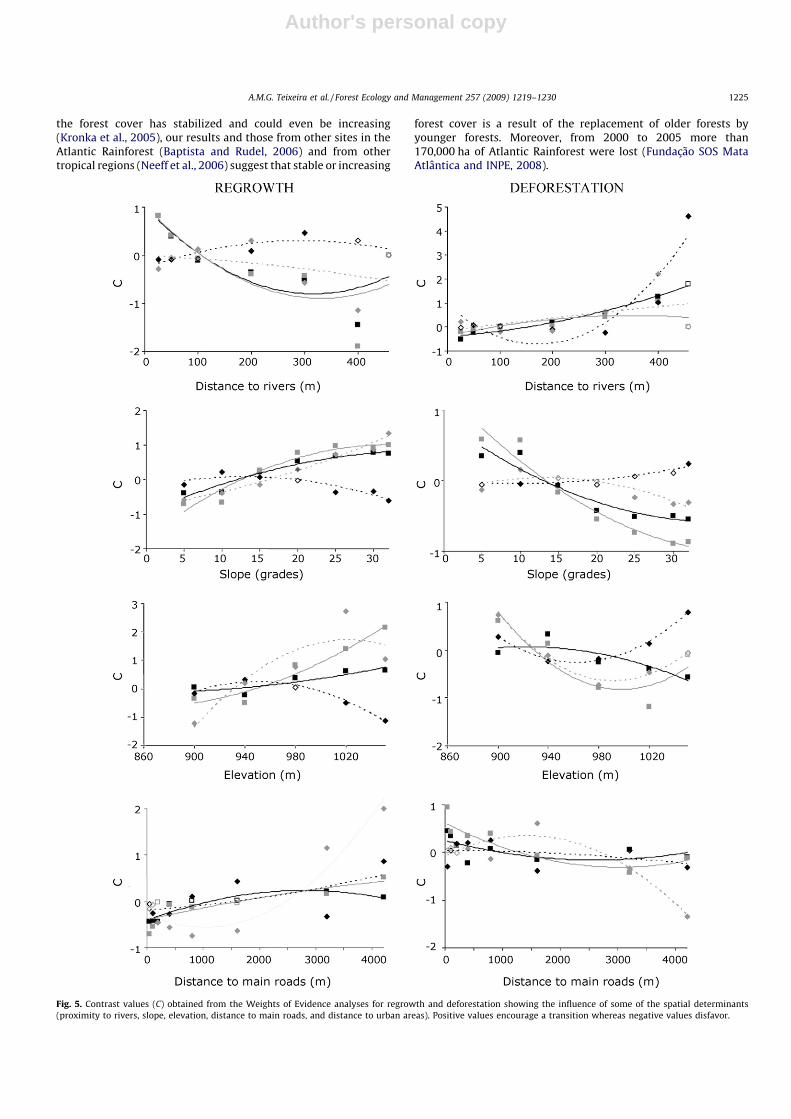
The Weights of Evidence analysis allowed us to identify theinfluence of spatial determinants on the analyzed transitions. Somepatterns were consistent, particularly, higher forest regrowth near
Fig. 3. Net (%) and gross (ha) rates of deforestation and regrowth for 1962–1981 time period.
A.M.G. Teixeira et al. / Forest Ecology and Management 257 (2009) 1219–1230 1223
Author's personal copy
rivers, on steep slopes and far from dirt roads (Fig. 5). On thecontrary, losses in young secondary vegetation and forest werehigher far from rivers, on gentle slopes and near urban cores (Fig. 5).Other significant relationships were found for specific transitions,such as higher forest regrowth at higher elevations and far frommain roads. In general, the influences of spatial determinants,representing proximate causes, were consistent between the twotime periods under analysis.
4.2. Forecasted trends
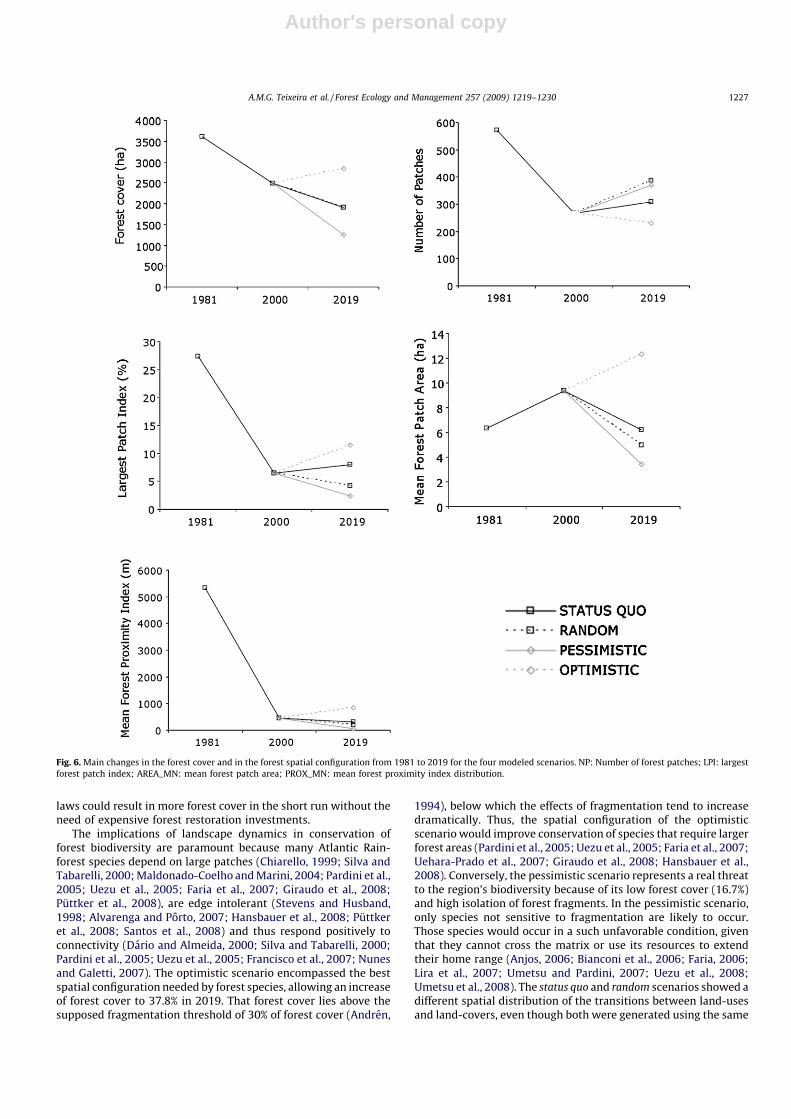
The four modeled scenarios resulted in landscapes withdifferent forest cover (Fig. 6), except the status quo and random
scenarios (23.5%), which used the same 1981–2000 transitionmatrix. The land-use intensification scenario produced an increaseof converted land-use area (2000: 59.2%; 2019: 77.4%) and adecrease of forest cover (2000: 33%; 2019: 16.7%). The law
enforcement scenario was the only one to show an increase of forestcover (2019: 37.8%).
With respect to the spatial configuration of the forest, theworst-case scenarios, characterized by high deforestation ratesand forest fragmentation, were represented by land-use intensifica-
tion and random (Table 2). The law enforcement scenariorepresented the best-case in terms of its potential for conservingforest species. In turn, the status quo scenario showed anintermediate situation (Fig. 6). If current landscape change trendscontinue over the next 19 years, the number of forest fragmentsshall increase by 15%, the size of the largest forest patch by 23%,and the mean size of forest fragments shall decrease by 34% and theproximity between them decrease by 29%. The land-use intensifica-
tion and random scenarios showed the least favorable landscapesfor forest species conservation. Those scenarios will increase thenumber of forest patches by 38% in the pessimistic scenario and45% in the random scenario and decrease the size of the largestforest patch (respectively, by 62%, 35%), the mean size of forest
fragments (by 63%, 47%) and the proximity between them (by 84%,56%). The optimistic law enforcement scenario is the only one thatcould reverse these negative trends, producing a decrease of 13% inthe number of forest patches and an increase of 78% in the size ofthe largest forest patch, 32% in the mean size of forest fragmentsand 56% in the proximity between them in comparison with 2000.
5. Discussion
5.1. Landscape dynamics and proximate causes
The landscape dynamics in the study region were particularlyintense. From 1962 to 1981, the deforestation rate was equal to 2%year�1, increasing to 2.9% year�1 between 1981 and 2000. Theserates were greater than the deforestation rates observed from 1995to 2000 for the Atlantic Rainforest in the state of Sao Paulo (0.3%year�1), as well as for the whole Atlantic Rainforest (0.5% year�1,SOS Mata Atlantica, 2001). The deforestation rates we observed inthis portion of the Atlantic Rainforest were also higher than therates for Latin America (0.38% year�1) and for the tropical forests ofthe world as a whole (0.5% year�1, Achard et al., 2002), and weresimilar to the deforestation rates observed along the Amazondeforestation arc (2.2% year�1, Ferraz et al., 2005).
Forest regrowth rates in our study area were also high (1962–1981: 3% year�1; 1981–2000: 1% year�1) when compared with theobserved ones for tropical regions—from 0.19% year�1 in SoutheastAsia to 0.04% year�1 in Latin America (Achard et al., 2002). As aconsequence of this particularly high turnover of deforestation andregrowth, there is very little primary forest remaining in our studyarea. Notice that only 1357 ha (18.2% of the whole landscape) ofthe forest cover from 1962 was left unchanged in 2000.
These dramatic landscape dynamics emphasize how threa-tened is the Atlantic Rainforest, which is still under a great pressuredespite the Brazilian environmental laws and other measuresissued to curb deforestation. Although some studies suggest that
Fig. 4. Net (%) and gross (ha) rates of deforestation and regrowth for 1981–2000 time period.
Table 2Main results obtained with ANOVA and Tukey’s HSD post hoc tests when comparing the four forecasted scenarios for 2019. SD: Standard deviation.
Status quo Random Land-use intensification
(pessimistic)
Law enforcement
(optimistic)
ANOVA Tukey HSD
Mean SD Mean SD Mean SD Mean SD F p
Number of patches (NP) 309.8 9.7 378.5 34.7 369.2 14.7 231.2 4.6 199.16 <0.001 All differences significant (p < 0.001)
Largest patch index (ha) (LPI) 8.2 2.1 4.3 1.1 2.4 0.3 11.5 2.2 54.71 <0.001 All differences significant (p < 0.001)
Mean patch area (ha) (AREA_MN) 6.2 0.2 5.1 0.5 3.4 0.1 12.3 0.2 2586.34 <0.001 All differences significant (p < 0.001)
Proximity index (PROX_MN) 331.7 106.6 191.2 39.4 69.6 12.9 840.8 176.9 89.90 <0.001 Status quo = random; other
differences significant (p < 0.001)
A.M.G. Teixeira et al. / Forest Ecology and Management 257 (2009) 1219–12301224
Author's personal copy
the forest cover has stabilized and could even be increasing(Kronka et al., 2005), our results and those from other sites in theAtlantic Rainforest (Baptista and Rudel, 2006) and from othertropical regions (Neeff et al., 2006) suggest that stable or increasing
forest cover is a result of the replacement of older forests byyounger forests. Moreover, from 2000 to 2005 more than170,000 ha of Atlantic Rainforest were lost (Fundacao SOS MataAtlantica and INPE, 2008).
Fig. 5. Contrast values (C) obtained from the Weights of Evidence analyses for regrowth and deforestation showing the influence of some of the spatial determinants
(proximity to rivers, slope, elevation, distance to main roads, and distance to urban areas). Positive values encourage a transition whereas negative values disfavor.
A.M.G. Teixeira et al. / Forest Ecology and Management 257 (2009) 1219–1230 1225

Author's personal copy
The transformation of mature forest to secondary forests is acommon process in the tropics (Brown and Lugo, 1990; Gehringet al., 2005; Mayaux et al., 2005; Wright, 2005), and has profoundecological effects, particularly related to CO2 balance (Steininger,2004) and species conservation (Chazdon, 2003; Wright andMuller-Landau, 2006; Gardner et al., 2007a). The secondary forestof Atlantic Rainforest can sustain a high diversity of birds (Dunn,2004; Becker and Agreda, 2005; Uezu et al., 2005), small mammals(Wu et al., 1996; Pardini et al., 2005), frogs, reptiles (Dixo, 2005;Gardner et al., 2007b; Ficetola et al., 2008) and plants (Martin et al.,2004; Bernacci et al., 2006), thus those forests play an importantrole in species conservation. However, some of the mostendangered and sensitive species have close relation with thestructure and composition of primary forest, and thus needprimary forests to survive. This seems to be particularly the case of37 bird species in the study region (Develey and Metzger, 2006),native montane birds of Malaysia (Soha et al., 2006), and largemammals in the Brazilian Amazon (Parry et al., 2007). Theconversion of forests in cultural landscape where young secondaryforest fragments dominate hinders the survival of many species,hence reducing biodiversity (Gardner et al., 2007a).
The time interval adopted in this study is reasonable long (19years) to embrace different short-term trends in the socio-economic drivers of deforestation and regrowth. Thereof, theobserved landscape dynamics should be understood as a net resultof these different short-term trends over the two time-periodsunder consideration. But, despite this broad temporal scale, it ispossible to assert that the shift in the balance between deforesta-tion and regrowth rates from 1962–1981 to 1981–2000 is acommon tendency over the whole Atlantic Rainforest of Sao PauloState (Dean, 1997). In the early 20th century, there was an increasein charcoal production in that region, mainly during the SecondWorld War because of the oil supply crisis (Dean, 1997). Demandfor charcoal decreased henceforth, thus contributing to a forestrecovery as observed during the 1962–1981 time-period. Anotherplausible explanation for the intense forest regrowth can beattributed to the issue of forestry laws in 1965, constrainingnatural resources exploitation. This earlier time-period couldsuggest the beginning of a forest transition, i.e. the transition fromdeforestation to forestation (Rudel et al., 2005), however, the latertime period (1981–2000) was characterized by the comeback ofdeforestation and decline of regrowth rates. Those changes areassociated with the improvements of roads, which allowed better
access to the region, and to the expansion of large-scale agriculturethat does not make use of fallow periods. This situation is commonfor most part of the Serra do Mar region, suggesting that forestregrowth is not a general process in Southern Brazil (Baptista andRudel, 2006). For the study region, the rate of deforestation waseven higher than the regional rates due to the close proximity tothe city of Sao Paulo, thus reflecting a land speculation processtrigged by the establishment of country houses and condomi-niums.
As observed in tropics, deforestation was higher near roads(Apan and Peterson, 1998; Tinker et al., 1998; Nagendra et al.,2003; Soares-Filho et al., 2004; Cabral et al., 2007) and in lower andless steep terrain where transport and mechanical agriculture areeasier (Apan and Peterson, 1998). Deforestation was likely far fromrivers, probably because those rivers are non-navigable andriparian vegetation is protected by environmental law. Nativeforest regrowth showed an opposite pattern for the same reasons,occurring far from roads, steep terrain and near rivers. Forestregrowth was also higher near young secondary vegetation.Guariguata and Ostertag (2001) and DeWalt et al. (2003) founda similar pattern suggesting that native vegetation patches work asa source of propagules for regrowth. Thus, loss of forest and thetransformation of primary to secondary forests did not occurhomogeneously or randomly; they were more likely to haveoccurred in sites more suitable for agriculture (Flamenco-Sandovalet al., 2007; Killeen et al., 2007; Fearnside, 2008). This commonpattern of landscape dynamics (Pressey et al., 1996; Scott et al.,2001) points out the importance of valuing biodiversity inimpacted sites when selecting areas for conservation (Margulesand Pressey, 2000; Metzger and Casatti, 2006).
5.2. Implications of the modeled scenarios for conservation
Small changes in the transition matrix led to very distinctlandscapes. Only the optimistic scenario (no deforestationallowed) increased forest cover and decreased the number offorest patches in the landscape. The increase of forest cover in theoptimistic scenario was mostly due to forest regrowth, instead ofagriculture abandonment. Those results suggest that forestpreservation efforts should be accompanied by actions that couldstimulate forest regrowth, especially where forest regrowth ismore likely and land is less suitable for crop production. Thisscenario also showed that the application of the environmental
Fig. 5. (Continued ).
A.M.G. Teixeira et al. / Forest Ecology and Management 257 (2009) 1219–12301226
Author's personal copy
laws could result in more forest cover in the short run without theneed of expensive forest restoration investments.
The implications of landscape dynamics in conservation offorest biodiversity are paramount because many Atlantic Rain-forest species depend on large patches (Chiarello, 1999; Silva andTabarelli, 2000; Maldonado-Coelho and Marini, 2004; Pardini et al.,2005; Uezu et al., 2005; Faria et al., 2007; Giraudo et al., 2008;Puttker et al., 2008), are edge intolerant (Stevens and Husband,1998; Alvarenga and Porto, 2007; Hansbauer et al., 2008; Puttkeret al., 2008; Santos et al., 2008) and thus respond positively toconnectivity (Dario and Almeida, 2000; Silva and Tabarelli, 2000;Pardini et al., 2005; Uezu et al., 2005; Francisco et al., 2007; Nunesand Galetti, 2007). The optimistic scenario encompassed the bestspatial configuration needed by forest species, allowing an increaseof forest cover to 37.8% in 2019. That forest cover lies above thesupposed fragmentation threshold of 30% of forest cover (Andren,
1994), below which the effects of fragmentation tend to increasedramatically. Thus, the spatial configuration of the optimisticscenario would improve conservation of species that require largerforest areas (Pardini et al., 2005; Uezu et al., 2005; Faria et al., 2007;Uehara-Prado et al., 2007; Giraudo et al., 2008; Hansbauer et al.,2008). Conversely, the pessimistic scenario represents a real threatto the region’s biodiversity because of its low forest cover (16.7%)and high isolation of forest fragments. In the pessimistic scenario,only species not sensitive to fragmentation are likely to occur.Those species would occur in a such unfavorable condition, giventhat they cannot cross the matrix or use its resources to extendtheir home range (Anjos, 2006; Bianconi et al., 2006; Faria, 2006;Lira et al., 2007; Umetsu and Pardini, 2007; Uezu et al., 2008;Umetsu et al., 2008). The status quo and random scenarios showed adifferent spatial distribution of the transitions between land-usesand land-covers, even though both were generated using the same
Fig. 6. Main changes in the forest cover and in the forest spatial configuration from 1981 to 2019 for the four modeled scenarios. NP: Number of forest patches; LPI: largest
forest patch index; AREA_MN: mean forest patch area; PROX_MN: mean forest proximity index distribution.
A.M.G. Teixeira et al. / Forest Ecology and Management 257 (2009) 1219–1230 1227

Author's personal copy
transition matrix. The status quo scenario resulted in a landscapemore favorable for biodiversity conservation than the random
scenario, indicating that when economic activities tend to formclusters, larger fragments of native vegetation remain, which favordirectly biodiversity conservation (Franklin and Forman, 1987; Liet al., 1993; Forman and Mellinger, 1999; Metzger, 2001).
One of the main drivers of biodiversity impoverishment intropical forests is land-use and land-cover changes (Sala et al.,2000). The inferences made in this study should be considered withcaution because they were based solely on analysis of landscapespatial configuration. However, our approach can be useful whenextensive biodiversity inventories or ecological data are notavailable or are difficult to obtain, as landscape metrics arestrongly related to biodiversity indicators (Margules et al., 2002;Metzger, 2006). Within this context, historical studies describingland-use and land-cover dynamics and simulations of futurelandscapes represent a powerful tool to foresee the consequencesof landscape dynamics on biodiversity conservation.
6. Conclusion
The Brazilian Atlantic Rainforest has experienced extensivechanges in its land-use and land-cover during the last 100 years,with high rates of both deforestation and regrowth, resulting in afragmented landscape dominated by progressively youngersecondary forests. These changes have reduced the amount ofhabitat for forest species. Modeled scenarios indicated that simplythe enforcement of current environmental laws could be veryeffective in increasing the forest cover and for improving thechance of forest species conservation. Conversely, if currentdeforestation and regrowth trends across the Atlantic Rainforestcontinue, native forest cover may reduce drastically, furtherthreatening species that require large and undisturbed patches ofnative forest.
Acknowledgements
We would like to thank Jose Salatiel Rodrigues Pires and ToddHawbaker for invaluable comments on earlier drafts of thismanuscript. We are also very grateful to Dr. Hawbaker for hisreview of the English. This study was supported by FAPESP (Proc.nos. 99/05123-4, 00/01587-5, 2006/02673-9). The project alsoreceives support from CNPq.
References
Achard, F., Eva, H.D., Stibig, H.J., Mayaux, P., Gallego, J., Richards, T., Malingreau, J.-P.,2002. Determination of deforestation rates of the world’s humid tropicalforests. Science 297, 999–1002.
Almeida, C.M., Batty, M., Monteiro, A.M.V., Camara, G., Soares-Filho, B.S., Cerqueira,G.C., Pennachin, C.L., 2003. Stochastic cellular automata modeling of urban landuse dynamics: empirical development and estimation. Computers, Environ-ment and Urban Systems 27, 481–509.
Almeida, F.F.M., 1964. Os fundamentos geologicos do relevo paulista, vol. 41.Boletim do Instituto Geografico e Geologico do Estado de Sao Paulo, pp.167–262.
Alvarenga, L.D.P., Porto, K.C., 2007. Patch size and isolation effects on epiphytic andepiphyllous bryophytes in the fragmented Brazilian Atlantic forest. BiologicalConservation 134, 415–427.
Alves, D.S., Pereira, J.L.G., Sousa, C.L., Soares, J.V., Yamaguchi, F., 1999. Characterizinglandscape changes in central Rondonia using Landsat TM imagery. InternationalJournal of Remote Sensing 20, 2877–2882.
Andren, H., 1994. Effects of habitat fragmentation on birds and mammals inlandscapes with different proportions of suitable habitat: a review. Oikos 71,355–366.
Anjos, L., 2006. Bird species sensitivity in a fragmented landscape of the AtlanticForest in Southern Brazil. Biotropica 38, 229–234.
Antongiovanni, M., Metzger, J.P., 2005. Influence of matrix habitats on the occur-rence of insectivorous bird species in Amazonian forest fragments. BiologicalConservation 122, 441–451.
Apan, A.A., Peterson, J.A., 1998. Probing tropical deforestation: the use of GIS andstatistical analysis of georeferenced data. Applied Geography 18, 137–152.
Baptista, S.R., Rudel, T.K., 2006. A re-emerging Atlantic forest? Urbanization,industrialization and the forest transition in Santa Catarina, southern Brazil.Environmental Conservation 33, 195–202.
Becker, C.D., Agreda, A., 2005. Bird community differences in mature and secondgrowth garua forest in Machalilla National Park Ecuador. Ornitologia Neotro-pical 16, 297–319.
Belisle, M., 2005. Measuring landscape connectivity: the challenge of behaviorallandscape ecology. Ecology 86, 1988–1995.
Bernacci, L.C., Franco, G.A.D.C., Arbocz, G.F., Catharino, E.L.M., Durigan, G., Metzger,J.P., 2006. O efeito da fragmentacao florestal na composicao e riqueza de arvoresna regiao da Reserva Morro Grande (Planalto de Ibiuna, SP). Revista do InstitutoFlorestal 18, 121–166.
Bianconi, G.V., Mikich, S.B., Pedro, W.A., 2006. Movements of bats (MammaliaChiroptera) in Atlantic Forest remnants in southern Brazil. Revista Brasileirade Zoologia 23, 1199–1206.
Brown Jr., K.S., Freitas, A.V.L., 2000. Atlantic Forest butterflies: indicators for land-scape conservation. Biotropica 32, 934–956.
Brown, S., Lugo, A.E., 1990. Tropical secondary forests. Journal of Tropical Ecology 6,1–32.
Cabral, D.C., Freitas, S.R., Fiszon, J.T., 2007. Combining sensors in landscape ecology:imagery-based and farm-level analysis in the study of human-driven forestfragmentation. Sociedade & Natureza 19, 69–87.
Castro, C.L., Pielke Sr., R.A., Leoncini, G., 2005. Dynamical downscaling: assessmentof value retained and added using the Regional Atmospheric Modeling System(RAMS). Journal of Geophysical Research 110, 05108.
Catharino, E.L.M., Bernacci, L.C., Franco, G.A.D.C., Durigan, G., Metzger, J.P., 2006.Aspectos da composicao e diversidade do componente arboreo das florestas daReserva Florestal do Morro Grande, Cotia, SP. Biota Neotropica 6, 1–28 (http://www.biotaneotropica.org.br/v6n2/pt/abstract?article+bn00306022006).
Chazdon, R.L., 2003. Tropical forest recovery: legacies of human impact and naturaldisturbances. Perspectives in Plant Ecology, Evolution and Systematics 6, 51–71.
Chiarello, A.G., 1999. Effects of fragmentation of the Atlantic forest on mammalcommunities in south-eastern Brazil. Biological Conservation 89, 71–82.
Conservation International do Brasil, Fundacao SOS Mata Atlantica, FundacaoBiodiversitas, Instituto de Pesquisas Ecologicas, Secretaria do Meio Ambientedo Estado de Sao Paulo, SEMAD/Instituto Estadual de Florestas-MG, 2000.Avaliacao e acoes prioritarias para a conservacao da biodiversidade da MataAtlantica e Campos Sulinos. MMA/SBF, Brasılia.
Costa, L.P., Leite, Y.L.R., Fonseca, G.A.B., Fonseca, M.T., 2000. Biogeography of SouthAmerican forest mammals: endemism and diversity in the Atlantic Forest.Biotropica 32, 872–881.
Costanza, R., Voinov, A., Boumans, R., Maxwell, T., Villa, F., Wainger, L., Voinov, H.,2002. Integrated ecological economic modeling of the Patuxent riverwatershed, Maryland. Ecological Monographs 72, 203–231.
CRIA, 2008. Centro de Referencia em Informacao Ambiental. http://www.cria.org.br/marinez/.
Dale, V.H., O’Neill, R.V., Pedlowski, M., Southworth, F., 1996. Causes and effects ofland-use change in Central Rondonia Brazil. Photogrammetric Engineering &Remote Sensing 59, 997–1005.
Dario, F.R., Almeida, A.F., 2000. Influencia de corredor florestal sobre a avifauna daMata Atlantica. Scientia Forestalis 58, 99–109.
Dean, W., 1997. With Broadax and Firebrand: The Destruction of the BrazilianAtlantic Forest. University of California Press, Berkeley.
Develey, P., Metzger, J.P., 2006. Emerging threats to birds in Brazilian AtlanticForest: the roles of forest loss and configuration in a severely fragmentedecosystem. In: Laurance, W., Peres, C. (Eds.), Emerging Threats to TropicalForests. University of Chicago Press, Chicago, pp. 269–290.
DeWalt, S.J., Maliakal, S.K., Denslow, J.S., 2003. Changes in vegetation structure andcomposition along a tropical forest chronosequence: implications for wildlife.Forest Ecology and Management 182, 139–151.
Dixo, M., 2005. Diversidade de sapos e lagartos de serrapilheira numa paisagemfragmentada do Planalto Atlantico de Sao Paulo. Ph.D. thesis. Universidade deSao Paulo, Sao Paulo.
Drummond, J., 2004. Brazil. In: Krech, III, S., McNeill, J.R., Merchant, C. (Eds.), En-cyclopedia of World Environmental History. Routledge, New York, pp. 161–169.
Dunn, R.R., 2004. Recovery of faunal communities during tropical forest regenera-tion. Conservation Biology 18, 302–309.
Durigan, G., Bernacci, L.C., Franco, G.A.D.C., Arbocz, G., Metzger, J.P., Catharino,E.L.M., 2008. Estadio sucessional e fatores geograficos como determinantes dasimilaridade florıstica entre comunidades florestais no Planalto Atlantico,Estado de Sao Paulo, Brasil. Acta Botanica Brasılica 22, 51–62.
Endress, B.A., Chinea, J.D., 2001. Landscape patterns of tropical forest recovery in theRepublic of Palau. Biotropica 33, 555–565.
Faria, D., 2006. Phyllostomid bats of a fragmented landscape in the north-easternAtlantic forest, Brazil. Journal of Tropical Ecology 22, 531–542.
Faria, D., Paciencia, M.L.B., Dixo, M., Laps, R.R., Baumgarten, J., 2007. Ferns, frogs,lizards, birds and bats in forest fragments and shade cacao plantations in twocontrasting landscapes in the Atlantic forest Brazil. Biodiversity and Conserva-tion 16, 2335–2357.
Fearnside, P.M., 2008. The roles and movements of actors in the deforestation ofBrazilian Amazonia. Ecology and Society 13, 23.
A.M.G. Teixeira et al. / Forest Ecology and Management 257 (2009) 1219–12301228

Author's personal copy
Felicısimo, A.M., Frances, E., Fernandez, J.M., Gonzalez-Dıez, A., Varas, J., 2002.Modelling the potential distribution of forest with a GIS. PhotogrammetricEngineering & Remote Sensing 68, 455–461.
Ferraz, S.F.B., Vettorazzi, C.A., Theobald, D.M., Ballester, M.V.R., 2005. Landscapedynamics of Amazonian deforestation between 1984 and 2002 in centralRondonia, Brazil: assessment and future scenarios. Forest Ecology and Manage-ment 204, 67–83.
Ficetola, G.F., Furlani, D., Colombo, G., De Bernardi, F., 2008. Assessing the value ofsecondary forest for amphibians: Eleutherodactylus frogs in a gradient of forestalteration. Biodiversity and Conservation 17, 2185–2195.
Fischer, J., Lindenmayer, D.B., 2007. Landscape modification and habitat fragmenta-tion: a synthesis. Global Ecology & Biogeography 16, 265–280.
Flamenco-Sandoval, A., Ramos, M.M., Masera, O.R., 2007. Assessing implications ofland-use and land-cover change dynamics for conservation of a highly diversetropical rain forest. Biological Conservation 138, 131–145.
Forman, R.T.T., Mellinger, A.D., 1999. Road networks and forest spatial patterns:comparing cutting-sequence models for forestry and conservation. In: Craig,J.L., Mitchell, N., Saunders, D.A. (Eds.), Nature Conservation 5: Nature Conserva-tion in Production Environments: Managing the Matrix. Surrey Beatty & Sons,Chipping Norton, pp. 71–80.
Francisco, M.R., Gibbs, H.L., Galetti, M., Lunardi, V.O., Galetti Jr., P.M., 2007. Geneticstructure in a tropical lek-breeding bird, the blue manakin Chiroxiphia caudatain the Brazilian Atlantic Forest. Molecular Ecology 16, 4908–4918.
Franklin, J.F., Forman, R.T.T., 1987. Creating landscape patterns by forest cutting:ecological consequences and principles. Landscape Ecology 1, 5–18.
Fundacao SOS Mata Atlantica, INPE, 2008. Atlas dos remanescentes florestais daMata Atlantica perıodo 2000–2005. Fundacao SOS Mata Atlantica/InstitutoNacional de Pesquisas Espaciais, Sao Paulo.
Galindo-Leal, C., Camara, I.G., 2003. The Atlantic Forest of South America: Biodi-versity Status, Threats and Outlook. Island Press, Washington.
Gardner, T.A., Barlow, J., Parry, L.W., Peres, C.A., 2007a. Predicting the uncertainfuture of tropical forest species in a data vacuum. Biotropica 39, 25–30.
Gardner, T.A., Ribeiro-Junior, M.A., Barlow, J., Avila-Pires, T.C.S., Hoogmoed, M.S.,Peres, C.A., 2007b. The value of primary, secondary and plantation forests for aneotropical herpetofauna. Conservation Biology 21, 775–787.
Gehring, C., Denich, M., Vlek, P.L.G., 2005. Resilience of secondary forest regrowthafter slash-and-burn agriculture in central Amazonia. Journal of Tropical Ecol-ogy 21, 519–527.
Geist, H.J., Lambin, E.F., 2002. Proximate causes and underlying driving forces oftropical deforestation. BioScience 52, 143–150.
Giraudo, A.R., Matteucci, S.D., Alonso, J., Herrera, J., Abramson, R.R., 2008. Comparingbird assemblages in large and small fragments of the Atlantic Forest hotspots.Biodiversity and Conservation 17, 1251–1265.
Guariguata, M.R., Ostertag, R., 2001. Neotropical secondary forest succession:changes in structural and functional characteristics. Forest Ecology and Man-agement 148, 185–206.
Hansbauer, M.M., Storch, I., Leu, S., Nieto-Holguina, J.-P., Pimentel, R.G., Knauer, F.,Metzger, J.P., 2008. Movements of neotropical understory passerines affectedby anthropogenic forest edges in the Brazilian Atlantic rainforest. BiologicalConservation 141, 782–791.
Harrison, S., Fahrig, L., 1995. Landscape pattern and population conservation. In:Hansson, L., Fahrig, L., Merriam, H.G. (Eds.), Mosaic Landscapes and EcologicalProcesses. Chapman and Hall, New York, pp. 293–308.
Hietel, E., Waldhardt, R., Otte, A., 2004. Analysing land-cover changes in relation toenvironmental variables in Hesse, Germany. Landscape Ecology 19, 473–489.
Jorge, L.A.B., Garcia, G.J., 1997. A study of habitat fragmentation in SoutheasternBrazil using remote sensing and geographic information systems (GIS). ForestEcology and Management 98, 35–47.
Killeen, T.J., Calderon, V., Soria, L., Quezada, B., Steininger, M.K., Harper, G., Solor-zano, L.A., Tucker, C.J., 2007. Thirty years of land-cover change in Bolivia. Ambio36, 600–606.
Koppen, W., 1948. Climatologia. Editora Fondo Cultura Economica, Cidade do Mexico.Kronka, F.J.N., Nalon, M.A., Matsukuma, C.K., 2005. Inventario florestal da vegetacao
natural do Estado de Sao Paulo. Secretaria do Meio Ambiente; Instituto Flor-estal, Sao Paulo.
Laurance, W.F., Albernaz, A.K.M., Costa, C., 2001. Is deforestation accelerating in theBrazilian Amazon. Environmental Conservation 28, 305–311.
Li, H., Franklin, J.F., Swanson, F.J., Spies, T.A., 1993. Developing alternative forestcutting patterns: a simulation approach. Landscape Ecology 8, 63–75.
Lira, P.K., Fernandez, F.A.S., Carlos, H.S.A., Curzio, P.L., 2007. Use of a fragmentedlandscape by three species of opossum in south-eastern Brazil. Journal ofTropical Ecology 23, 427–435.
Maldonado-Coelho, M., Marini, M.A., 2004. Mixed-species bird flocks from BrazilianAtlantic forest: the effects of forest fragmentation and seasonality on their size,richness and stability. Biological Conservation 116, 19–26.
Manne, L.L., Brooks, T.M., Pimm, S.L., 1999. Relative risk of extinction of passerinebirds on continents and islands. Nature 399, 258–261.
Margules, C.R., Pressey, R.L., 2000. Systematic conservation planning. Nature 405,243–253.
Margules, C.R., Pressey, R.L., Williams, P.H., 2002. Representing biodiversity: dataand procedures for identifying priority areas for conservation. Journal ofBiosciences 27, 309–326.
Martensen, A.C., Pimentel, R.G., Metzger, J.P., 2008. Relative effects of fragment sizeand connectivity on bird community in the Atlantic Rain Forest: implicationsfor conservation. Biological Conservation 141, 2184–2192.
Martin, P.H., Sherman, R.E., Fahey, T.J., 2004. Forty years of tropical forest recoveryfrom agriculture: structure and floristics of secondary and old-growth riparianforests in the Dominican Republic. Biotropica 36, 297–317.
Mayaux, P., Holmgren, P., Achard, F., Eva, H., Stibig, H.-J., Branthomme, A., 2005.Tropical forest cover change in the 1990s and options for future monitoring.Philosophical Transactions of the Royal Society B: Biological Sciences 360, 373–384.
McGarigal, K., Marks, B.J., 1995. FRAGSTATS: Spatial Pattern Analysis Program forQuantifying Landscape Structure. PNW-GTR-351. U.S. Department of Agricul-ture, Forest Service, Pacific Northwest Research Station, Portland.
Metzger, J.P., 2001. Effects of deforestation pattern and private nature reserves onthe forest conservation in settlement areas of the Brazilian Amazon. BiotaNeotropica 1, 1–14.
Metzger, J.P., 2002. Landscape dynamics and equilibrium in areas of slash-and-burnagriculture with short and long fallow period (Bragantina region NE BrazilianAmazon). Landscape Ecology 17, 419–431.
Metzger, J.P., 2006. How to deal with non-obvious rules for biodiversity conserva-tion in fragmented landscapes. The Brazilian Journal of Nature Conservation 4,125–139.
Metzger, J.P., Casatti, L., 2006. Do diagnostico a conservacao da biodiversidade: oestado da arte do programa BIOTA/FAPESP. Biota Neotropica 6 (http://www.biotaneotropica.org.br/v6n2/pt/download?point-of-view+bn00106022006+item).
Mittermeier, R.A., Gil, P.R., Hoffmann, M., Pilgrim, J., Brooks, J., Miitermeier, C.G.,Lamourux, J., Fonseca, G.A.B., 2005. Hotspots Revisited: Earth’s BiologicallyRichest and most Endangered Terrestrial Ecoregions. Cemex, Washington,DC.
Morellato, L.P.C., Haddad, C.F.B., 2000. Introduction: the Brazilian Atlantic Forest.Biotropica 32, 786–792.
Myers, N., Mittermeier, R.A., Mittermeier, C.G., Fonseca, G.A.B., Kent, J., 2000.Biodiversity hotspots for conservation priorities. Nature 403, 853–858.
Nagendra, H., Southworth, J., Tucker, C., 2003. Accessibility as a determinant oflandscape transformation in western Honduras: linking pattern and process.Landscape Ecology 18, 141–158.
Neeff, T., Lucas, R.M., Santos, J.R., Brondizio, E.S., Freitas, C.C., 2006. Area and age ofsecondary forests in Brazilian Amazonia 1978–2002: an empirical estimate.Ecosystems 9, 609–623.
Nunes, M.F.C., Galetti, M., 2007. Use of forest fragments by blue-winged macaws(Primolius maracana) within a fragmented landscape. Biodiversity and Con-servation 16, 953–967.
Oliveira, J.B., 1999. Solos do Estado de Sao Paulo: descricao das classes registradasno mapa pedologico. IAC, Campinas.
Oliveira-Filho, A.T., Fontes, M.A.L., 2000. Patterns of floristic differentiation amongAtlantic Forests in Southeastern Brazil, and the influence of climate. Biotropica32, 793–810.
Oliveira-Filho, F.J., Metzger, J.P., 2006. Thresholds in landscape structure for threecommon deforestation patterns in the Brazilian Amazon. Landscape Ecology 21,1061–1073.
Opdam, P., Verboom, J., Pouwels, R., 2003. Landscape cohesion: an index for theconservation potential of landscapes for biodiversity. Landscape Ecology 18,113–126.
Pardini, R., Souza, S.M., Braga-Neto, R., Metzger, J.P., 2005. The role of foreststructure, fragment size and corridors in maintaining small mammal abun-dance and diversity in an Atlantic forest landscape. Biological Conservation 124,253–266.
Parry, L., Barlow, J., Peres, C.A., 2007. Large-vertebrate assemblages of primary andsecondary forests in the Brazilian Amazon. Journal of Tropical Ecology 23, 653–662.
Pressey, R.L., Possingham, H.P., Margules, C.R., 1996. Optimality in reserve selectionalgorithms: when does it matter and how much. Biological Conservation 76,259–267.
Puttker, T., Meyer-Lucht, Y., Sommer, S., 2008. Fragmentation effects on populationdensity of three rodent species in secondary Atlantic Rainforest Brazil. Studieson Neotropical Fauna and Environment 43, 11–18.
Ranta, P., Blom, T., Niemela, J., Joensuu, E., Siitonen, M., 1998. The fragmentationAtlantic rain forest of Brazil: size, shape and distribution of forest fragments.Biodiversity and Conservation 7, 385–403.
Ribeiro, M.C., Metzger, J.P., Martensen, A.C., Ponzoni, F., Hirota, M. Brazilian Atlanticforest: how much is left and how is the remaining forest distributed? Implica-tions for conservation. Submitted for publication.
Ross, J.L.S., Moroz, I.C., 1997. Mapa geomorfologico do Estado de Sao Paulo: escala1:500.000. FFLCH-USP, IPT e FAPESP, Sao Paulo.
Rudel, T.K., Coomes, O.T., Moran, E., Achard, F., Angelsen, A., Xu, J., Lambin, E., 2005.Forest transitions: towards a global understanding of the land use change.Global Environmental Change 15, 23–31.
SABESP, 1997. Programa de conservacao do sistema Cotia. Relatorio Conclusivo(tomo 3): avaliacao ambiental. SABESP/Fundacao Brasileira para o Desenvolvi-mento Sustentavel, Sao Paulo.
Sala, O.E., Chapin III, F.S., Armesto, J.J., Berlow, E., Bloomfield, J., Dirzo, R., Huber-Sanwald, E., Huenneke, L.F., Jackson, R.B., Kinzig, A., Leemans, R., Lodge, D.M.,Mooney, H.A., Oesterheld, M., Poff, N.L., Sykes, M.T., Walker, B.H., Walker, M.,Wall, D.H., 2000. Global biodiversity scenarios for the year 2100. Science 287,1770–1774.
Sampaio, G., Nobre, C., Costa, M.H., Satyamuryty, P., Soares-Filho, B.S., Cardoso, M.,2007. Regional climate change over eastern Amazonia caused by pasture andsoybean cropland expansion. Geophysical Research Letters 34, 1–7.
A.M.G. Teixeira et al. / Forest Ecology and Management 257 (2009) 1219–1230 1229
Author's personal copy
Santos, B.A., Peres, C.A., Oliveira, M.A., Grillo, A., Alves-Costa, C.P., Tabarelli, M., 2008.Drastic erosion in functional attributes of tree assemblages in Atlantic forestfragments of northeastern Brazil. Biological Conservation 141, 249–260.
Scott, J.M., Murray, M., Wright, R.G., Csuti, B., Morgan, P., Pressey, R.L., 2001.Representation of natural vegetation in protected areas: capturing the geo-graphic range. Biodiversity and Conservation 10, 1297–1301.
Seabra, M., 1971. Vargem Grande: organizacao e transformacoes de um setor docinturao-verde paulistano. Instituto de Geografia, Universidade de Sao Paulo,Sao Paulo.
Silva, J.M.C., Casteleti, C.H.M., 2003. Status of the biodiversity of the Atlantic Forestof Brazil. In: Galindo-Leal, C., Camara, I.G. (Eds.), The Atlantic Forest of SouthAmerica: Biodiversity Status, Threats, and Outlook. Island Press, Washington,pp. 43–59.
Silva, J.M.C., Tabarelli, M., 2000. Tree species impoverishment and the future flora ofthe Atlantic forest of northeast Brazil. Nature 404, 72–74.
Silva, W.G., Metzger, J.P., Simoes, S., Simonetti, C., 2007. Relief influence on thespatial distribution of the Atlantic Forest cover on the Ibiuna Plateau, SP.Brazilian Journal of Biology 67, 631–637.
Skole, D., Tucker, C., 1993. Tropical deforestation and habitat fragmentation in theAmazon: satellite data from 1978 to 1988. Science 260, 1905–1910.
Soares-Filho, B., Alencar, A., Nepstad, D., Cerqueira, G., Diaz, M.C.V., Rivero, S.,Solorzano, L., Voll, E., 2004. Simulating the response of land-cover changesto road paving and governance along a major Amazon highway: the Santarem-Cuiaba corridor. Global Change Biology 10, 745–764.
Soares-Filho, B.S., Cerqueira, G.C., Pennachin, C.L., 2002. DINAMICA—a stochasticcellular automata model designed to simulate the landscape dynamics in anAmazonian colonization frontier. Ecological Modelling 154, 217–235.
Soares-Filho, B.S., Nepstad, D.C., Curran, L.M., Cerqueira, G.C., Garcia, R.A., Ramos,C.A., Voll, E., McDonald, A., Lefebvre, P., Schlesinger, P., 2006. Modelling con-servation in the Amazon basin. Nature 440, 520–523.
Soha, M.C.K., Sodhia, N.S., Limb, S.L.H., 2006. High sensitivity of montane birdcommunities to habitat disturbance in Peninsular Malaysia. Biological Con-servation 129, 149–166.
Steininger, M.K., 2004. Net carbon fluxes from forest clearance and regrowth in theAmazon. Ecological Applications 14, S313–S322.
Stevens, S.M., Husband, T.P., 1998. The influence of edge on small mammals:evidence from Brazilian Atlantic forest fragments. Biological Conservation85, 1–8.
Taylor, P., Fahrig, L., With, K., 2006. Landscape connectivity: a return to basics. In:Crooks, K.R., Sanjayan, M. (Eds.), Connectivity Conservation. Cambridge Uni-versity Press, Cambridge, pp. 29–43.
Tinker, D.B., Resor, C.A.C., Beauvais, G.P., Kipfmueller, K.F., Fernandes, C.I., Baker,W.L., 1998. Watershed analysis of forest fragmentation by clearcuts and roadsin a Wyoming forest. Landscape Ecology 13, 149–165.
Uehara-Prado, M., Brown Jr., K.S., Freitas, A.V.L., 2007. Species richness, compositionand abundance of fruit-feeding butterflies in the Brazilian Atlantic Forest:comparison between a fragmented and a continuous landscape. Global Ecology& Biogeography 16, 43–54.
Uezu, A., Beyer, D.D., Metzger, J.P., 2008. Can agroforest woodlots work as steppingstones for birds in the Atlantic forest region? Biodiversity and Conservation 17,1907–1922.
Uezu, A., Metzger, J.P., Vielliard, J.M.E., 2005. Effects of structural and functionalconnectivity and patch size on the abundance of seven Atlantic Forest birdspecies. Biological Conservation 123, 507–519.
Umetsu, F., Pardini, R., 2007. Small mammals in a mosaic of forest remnants andanthropogenic habitats—evaluating matrix quality in an Atlantic forest land-scape. Landscape Ecology 22, 517–530.
Umetsu, F., Pardini, R., Metzger, J.P., 2008. Importance of estimating matrix qualityfor modeling species distribution in complex tropical landscapes: a test withAtlantic forest small mammals. Ecography 31, 359–370.
Viana, V.M., Tabanez, A.A.J., Batista, J.L.F., 1997. Dynamics and restoration of forestfragments in the Brazilian Atlantic Moist Forest. In: Laurance, W.F.,Bierregaard, Jr.,R.O. (Eds.),Tropical Forest Remnants: Ecology, Management, and Conservation ofFragmented Communities. The University of Chicago Press, Chicago, pp. 351–385.
Vos, C.C., Verboom, J., Opdam, P.F.M., Ter Braak, C.J.F., 2001. Toward ecologicallyscaled landscape indices. The American Naturalist 183, 24–41.
Walker, R., Homma, A.K.O., 1996. Land use and land cover dynamics in the BrazilianAmazon: an overview. Ecological Economics 18, 67–80.
Wright, S.J., 2005. Tropical forests in a changing environment. Trends in Ecology andEvolution 20, 553–560.
Wright, S.J., Muller-Landau, H.C., 2006. The future of tropical forest species. Bio-tropica 38, 207–301.
Wu, D.-L., Luo, J., Fox, B.J., 1996. A comparison of ground-dwelling small mammalcommunities in primary and secondary tropical rainforests in China. Journal ofTropical Ecology 12, 215–230.
Zar, J.H., 1999. Biostatistical Analysis. Prentice Hall, New Jersey.
A.M.G. Teixeira et al. / Forest Ecology and Management 257 (2009) 1219–12301230