Embed Size (px)
Citation preview
1
Authorized shares: To limit, or not to limit, that is the question
William B. Elliott
and
Hilmi Songur*
ABSTRACT
In the legal literature there is some debate regarding the efficacy and relevance of the
concept of limited authorized shares. Proponents to limitations on authorized shares
argue that it resolves a power struggle between managers and shareholders.
Opponents suggest that there are sufficient protections in place, and limitations are an
expensive anachronism. We use the announcement of a stock split to examine this
question. Stock splits cause an “inadvertent” shock to the amount of authorized, but
unissued shares (hereafter, excess-shares). We find that the market reacts differentially
to this shock, relative to the pre-split level of excess-shares. This result holds even
after controlling for other factors from the literature known to be related to abnormal
split announcement returns. Our evidence is consistent with the premise that
nontrivial economic benefits accrue to shareholders from a reduction in management’s
power to issue stock and shareholders of firms that have a very high pre-split level of
excess-shares benefit the most.
JEL Classification Numbers: G12, G32
Key Words: stock splits, authorized shares, agency costs
Current Draft: October, 2016
* Elliott is at John Carroll University and Songur is at Northwest Missouri State University. We thank
Mary Becker, Erik Devos, Edward A. Dyl, Fariz Huseynov (EFA 2014 discussant), Kimberly Fresenburg
(FMA 2014 discussant), Scott Moore, Jim Schneringer, Harold Schwartz, Jim Upson, Richard Warr,
Stewart Zimmerman, and participants at the FMA Annual 2014 Meetings, Eastern Finance Association
2014 Meetings, UTEP Seminar Series, University of New Mexico, and Kent State University for their
comments and suggestions. We retain responsibility for any remaining errors. All correspondence should
be addressed to William B. Elliott. Mailing address: Boler School of Business, John Carroll University, 1
John Carroll Blvd., University Heights, OH 44118, E-mail: [email protected], Voice: 216.397.4584.
2
Authorized shares: To limit, or not to limit, that is the question
ABSTRACT
In the legal literature there is some debate regarding the efficacy and relevance of the
concept of limited authorized shares. Proponents to limitations on authorized shares
argue that it resolves a power struggle between managers and shareholders.
Opponents suggest that there are sufficient protections in place, and limitations are an
expensive anachronism. We use the announcement of a stock split to examine this
question. Stock splits cause an “inadvertent” shock to the amount of authorized, but
unissued shares (hereafter, excess-shares). We find that the market reacts differentially
to this shock, relative to the pre-split level of excess-shares. This result holds even
after controlling for other factors from the literature known to be related to abnormal
split announcement returns. Our evidence is consistent with the premise that
nontrivial economic benefits accrue to shareholders from a reduction in management’s
power to issue stock and shareholders of firms that have a very high pre-split level of
excess-shares benefit the most.
JEL Classification Numbers: G12, G32
Key Words: Stock splits, Authorized Shares, Agency costs
3
I. Introduction
Ever since the dawn of the corporate form of organization, a firm’s Certificate of
Incorporation (a.k.a. Corporate Charter) has contained two provisions, par value (and the
associated ‘stated capital’) and authorized shares. As the typical par value has shrunk to
fractions of a penny, the importance of par value and stated capital as a means of protecting
shareholders against dilution, has faded with time. However, the number of authorized shares
continues to place real limits on the number of shares a firm may issue, at least without first
obtaining shareholder approval (Hanks, 1995). In the short-run, the number of authorized shares
in the corporate charter places an upper bound on the total shares of stock that may be issued.
There has been some question in the legal literature regarding the efficacy and continued
relevance of authorized shares (see Ganor [2011] and Hanks [1995]). Our paper contributes to
this debate. To the best of our knowledge, we are the first authors in the finance/legal literature
to examine this particular issue.1
On the one hand, skeptics suggest that limitations on the level of authorized shares no longer
serves a purpose that isn’t already more effectively served through other means (Hanks, 1995).
They argue that the board of directors retains and controls the authority to issue new shares, and
thus is a sufficient check on the power of management. Further, when it becomes necessary to
increase the level of authorized shares, the firm incurs significant costs. Changes to the charter
requires that a proxy be drafted, revised, reviewed by the SEC, possibly revised again, not to
mention that it usually requires a two-thirds majority for approval (since this fraction is of total
shares outstanding, it usually is a much larger fraction of votes actually cast). This process can
1 Bhagat, Brickley, and Lease (1986) study the announcement return effects of proposals by management to increase
the amount of authorized shares in general as well as the frequency of activities that require excess authorized
shares.
4
take several months and culminates with a shareholder meeting (sometimes this may be a special
meeting expressly for the purpose of increasing the level of authorized shares).
On the other hand, Ganor (2011) suggests that limitations on authorized shares helps to
balance the power struggle between management and shareholders.2 This may especially be true
around the time of a merger/tender offer, either friendly or hostile. During a hostile takeover,
target firm management could engage in defensive strategies such as a poison pill. Conversely,
in a tender offer by a friendly acquirer, management of the target firm could offer the acquirer a
top-up option. Briefly, top-up options allow the acquirer to speed up completion of the deal, and
potentially block or reduce the threat of competing bids. Both of these strategies require that the
target firm have substantial amounts of excess authorized shares (i.e. authorized but not yet
issued). 3 With sufficient excess authorized shares (for brevity, hereafter: excess-shares)
available, management (and/or the BOD) need not seek shareholder approval in either a poison
pill strategy or a top-up option.
Our study takes advantage of a unique corporate announcement as a platform to study
whether there is any apparent value to limitations on the level of authorized shares. That event is
the announcement of a stock split. Stock split announcements have been studied extensively in
the finance literature, beginning with the seminal paper by Fama, Fisher, Jensen, and Roll in
1969. Simply stated, stock splits result in an increase in the shares outstanding (e.g. a 2-for-1
stock split doubles the number of shares outstanding).4 Since the total number of authorized
shares is stated in the charter, the stock split cannot change that number. However, as a result of
2 Ganor (2011) describes in detail the legal aspects of authorized common stock as it relates to a firm’s management
and shareholders. 3 We do not differentiate between never issued excess-shares and treasury stock (shares that had previously been
issued but have subsequently been repurchased). 4 While it is common for large stock distributions to be accounted for as either a large stock dividend or as a stock
split, the effect of the shares outstanding and the excess shares is identical.
5
the stock split, there will be fewer excess-shares. Even more importantly, because activities such
as poison pills and top-up options may require multiples of the total shares outstanding to dilute
certain shareholder positions, the ratio of excess-shares to shares outstanding (hereafter, the
excess-ratio) decreases at an even faster rate.
For the purposes of our study, we assume that the effect of the stock split announcement on
the level of excess-shares is largely an “inadvertent” shock. Obviously for a firm to engage in a
stock split, management must first determine whether there are sufficient excess-shares. As such
they will have paid some attention to the level of excess-shares. However it is unlikely that a
reduction in the level of excess-shares is the raison d’être for the stock split or even of secondary
importance. More likely, determining the sufficiency of excess-shares is a necessary and
perfunctory activity performed prior to announcing the split. Our confidence that the reduction
in excess-shares is unintended or inadvertent lies largely in the prior study of stock splits. The
finance literature is replete with a number of theories related to the motivation for stock splits
and their concomitant positive stock price reaction. Previous studies suggest that the market
reaction may be a signal, a means to reduce information asymmetry, a deviation from the
efficient markets hypothesis, or possibly may even affect the tax-option value of the stock.5
However, none of the prior studies suggest that the primary reason for a split is to cause a
reduction in the excess-shares.
Our sample is comprised of NYSE/AMEX/Nasdaq listed firms that are incorporated in
Delaware and announced at least a 2-for-1 and not more than a 6-for-1 stock split between 1998
and 2011. We hand collect the number of authorized shares from 10Ks and proxy statements
filed on the Securities and Exchange Commission’s (SEC) EDGAR database.
5 Grinblatt, Masulis, and Titman (1984); Asquith, Healy, and Palepu (1989); McNichols and Dravid (1990); Nayak
and Prabhala (2001); Brennan and Copeland (1988); Ikenberry, Ranine, and Stice (1996); Desai and Jain (1997);
Ikenberry and Ramnath (2002); and Lamoureux and Poon (1987).
6
To examine the effect of the quantity of excess-shares on stock split announcement returns,
we first sort the sample, from high-to-low, by the excess-ratio and divide the sample into
quartiles. Managers of firms in the upper quartile (those with the highest excess-ratio prior to
the split) have greater latitude to issue additional shares without first seeking shareholder
approval, relative to managers of firms in the lower quartile. The five-day average cumulative
abnormal return (hereafter, CAR) surrounding the split announcement of firms in the upper
quartile is 4.96%, while the five-day average CAR of firms in the lower quartile is 2.43% (the
2.53% difference is statistically significant at the five percent level). If the split announcement is
truly an inadvertent shock to the level of excess-shares, one interpretation of this result is that the
market places a substantial value on the reduction of authorized shares for those firms that
previously had the highest levels of excess-shares.
We also examine the variation in split announcement CARs using a multivariate regression
framework. After controlling for a host of variables that the existing literature suggests are
related to or help to explain split announcement returns, we find that the pre-split excess-ratio
remains positively correlated to the abnormal returns and is not only statistically significant but
economically significant as well. This evidence is consistent with the premise that the market
interprets the reduction in the excess-ratio as a more positive signal for firms that had a higher
pre-split excess-ratio. As a result of the split, managers are less able to engage in corporate
activities that require a large amount of new stock (e.g. poison pill defense or top-up option),
without first seeking shareholder approval.
Given the above findings, we explore whether the splitting firms with the highest levels of
excess-shares may also suffer from higher levels of agency problems. In other words, is it
possible that the firms with the highest levels of excess-shares also have other agency problems,
7
in addition to higher levels of excess-shares, between managers and shareholders. In summary,
we find evidence consistent with the premise that firms that face higher agency costs tend to
have a higher post-split excess-ratio.
Our paper adds to two separate strands of literature. First, it adds empirical evidence to the
debate regarding the necessity of limitations on authorized shares. Our evidence is most
consistent with the conjecture that limitations on authorized shares are valuable, and likely this
value is the result of balancing the power struggle between shareholders and managers.
Secondly, we provide evidence consistent with the hypothesis that there is some optimal level of
authorized shares. For firms with too few excess-shares, the ability of management to engage in
normal corporate activities is likely constrained. Conversely, firms with too many excess-shares
allow management an opportunity to engage in transactions that may be detrimental to
shareholders.
The remainder of this paper is organized as follows. In Section II we discuss the previous
literature, motivation for the paper, and develop our hypotheses. Section III presents the method
and sample construction. Sections IV and V present the empirical results and Section VI
summarizes the results.
II. Motivation and Hypothesis Development
Delaware General Corporation Law and exchange rules
Delaware General Corporation Law (DGCL) states that the number of authorized shares must
be specified in a firm’s certificate of incorporation.6 The certificate of incorporation may only be
6 8 Del. C. 1953, § 102, http://delcode.delaware.gov/title8/c001/sc01/index.shtml
8
changed by a vote of the shareholders. As a result, the maximum number of shares outstanding,
at least in the short-run, is constrained by the number of shares authorized in the certificate of
incorporation. The announcement of a stock split results in the transfer of a portion of the excess
authorized shares to shares outstanding. While there is no reason to believe that this is the raison
d’être for the stock split announcement, a split clearly affects the amount of excess authorized
shares, and in turn, may limit the manager’s power to issue new stock in the future.
However, some of the flexibility granted by DGCL is limited by exchange listing rules. Both
the NYSE and the Nasdaq require that, for non-cash transactions, any issuance of new shares that
is greater than or equal to 20% of current shares outstanding must be approved by shareholders.7
These rules do not, however, apply to stock issuances for cash, either public or private. Nor do
they apply in the case of some takeover strategies. While the exchange rules are designed to
protect shareholder interests, Becht, Polo and Rossi (2014) find that firms generally avoid a
shareholder vote by issuing less than 20% of their shares as consideration and paying the rest in
other securities or in cash. Another situation in which the exchange rules are not limiting is
when the firm becomes a private corporation. For example, the implementation of a top-up
option in a leveraged buyout (see Ganor [2011] and Devos, Elliott, and Songur [2015]), by virtue
of the fact that the firm becomes private and is no longer listed, would not face the constraints
imposed by the exchanges. Further, the 20% limitation is for a single transaction. As such, a
firm could engage in multiple stock-based mergers, each of which require less than the 20%
share limit, without triggering the requirement for shareholder approval.
7See the NYSE Listed Company Manual:
http://nysemanual.nyse.com/LCMTools/PlatformViewer.asp?selectednode=chp%5F1%5F4%5F10&manual=%2Flc
m%2Fsections%2Flcm%2Dsections% .
9
Authorized shares
Consider the following example of how a firm may be affected by a stock split and the
associated reduction in excess-shares. If a firm has 125 million shares authorized and 25 million
outstanding, there are 100 million shares available for issue in the future. With 100 million
excess-shares, the management of the firm could grant a top-up option to a friendly acquirer in a
tender offer8. Under Delaware law, a bidder that attains 90% ownership of a target firm, may use
a short-form merger to complete the buyout. Short-form mergers do not require a shareholder
meeting or vote, and as such effectively “freeze-out” any remaining shareholders from
preventing the merger. A poison pill strategy may also be used when there are sufficient excess-
shares to protect target management against a hostile bidder. Both strategies require large
amounts of excess-shares, much larger amounts then are necessary for the normal operation of
the firm.
However, if our example firm had previously done a two-for-one stock split, the number of
excess-shares would drop to 75 million and management would no longer be able to engage in a
top-up option, at least not with a 50% stock holding (this is but one example of how a split may
constrain managements power over shareholders).9 So, regardless of the primary rationale for
8 Typically, the friendly bidder obtains a minimum of 50% ownership through the tender offer (in the example that
would be 12.5 million shares). After the bidder successfully attains the minimum percentage of shares, the target
firm issues enough additional shares to the bidder, at the tender offer price, such that the bidders’ ownership reaches
90% (in our example this would require that an additional 100 million shares be issued to the bidder). Thus, after
exercise of the top-up option, the bidder owns 112.5 million shares, or a 90% stake in the firm. As a result of the
top-up option, the old shareholders position has been diluted to a 10% stake in the firm. While the minimum position
gained by the bidder in the tender offer is 50%, it is not infrequent to find that the top-up option requires a higher
percentage ownership before being triggered. However, it is not clear whether this is designed ex ante with the total
amount of available excess-shares in mind. For a more detailed discussion and analysis of the top-up options see
Devos, Elliott and Songur (2015). 9 Of course, the number of shares authorized may be changed, but not without shareholder consent. Further, it would
also be possible for the target firm’s management to issue a top-up option with a higher minimum percentage
ownership required of the bidder firm.
10
the stock split, as a result of the reduction in excess-shares, the balance of power to issue new
shares has shifted toward shareholders.
Changes to the level of authorized shares
A split clearly affects the amount of excess authorized shares and, in turn, limits the
manager’s power to issue new stock in the future (whether or not it is binding depends upon the
particular corporate activity). Consider the following statement made by Hewlett Packard
Company (HP) in their DEF 14A filing (proxy statement), dated January 25, 2001:
“The Board of Directors believes that the availability of additional authorized but unissued
shares will provide the Company with the flexibility to issue common stock for a variety of
corporate purposes, such as to effect future stock splits in the form of stock dividends, to
make acquisitions through the use of stock, to raise equity capital, to adopt additional
employee benefit plans or to reserve additional shares for issuance under such plans and
under plans of acquired companies.” [italics added for emphasis; for the entire proposal see
Appendix A]
The above paragraph is but an example of numerous similar statements made by firms that
wish to increase the level of their authorized shares. Of particular note, HP cites an increase in
“flexibility to issue common stock” as the primary rationale for its proposed increase in
authorized shares. Note that at the time of HP’s proposal, the firm had 4.8 billion shares
authorized and a total of 2.48 billion shares outstanding or reserved, leaving 2.32 billion shares
of authorized but unissued shares. Granted, 2.32 billion of excess-shares is not quite enough to
affect a two-for-one stock split (which the firm had previously done seven times, most recently
only 4 months prior to this proposal). However, management was not asking to bring the
authorized shares up to 5 billion, they were requesting an increase to 9.6 billion, a doubling of
the current number of authorized shares. As a result, HP’s management would have ample
11
opportunity to engage in many activities in addition to a stock split; such as stock-based mergers
or a variety of pro/anti-takeover measures (interestingly, there is no mention in HP’s statement
regarding potential use of the additional shares in a top-up option nor for use in a poison pill
strategy).
If management is able to gain shareholder approval for an increase in the level of authorized
shares with 100% certainty, then does the reduction caused by a stock split matter? This is a fair
question, especially in light of evidence that any type of proposals, when supported by
management, are rarely turned down by shareholders (Maug and Rydqvist [2001]; Gillan and
Starks [2007]; Yermack [2010]). However, there are some cases where proposals to increase the
level of authorized shares have been voted down. In 2009, American International Group (AIG)
attempted to increase its level of authorized shares from 5 billion to 9.225 billion. At the time of
the vote, AIG had approximately 2.7 billion shares outstanding. It appears that after having lost
more than 95% of its value in 2008, shareholders were in no frame of mind to give management
any additional excess-shares. Another recent example was a proposed increase of authorized
shares from 25 million to 75 million (shares outstanding as of the date of the proxy stood at just
under 18.1 million) by the management of The Andersons Inc. Both firms appear to have been
surprised by the failure of the proposed increase.10 Further, simply because we only observe a
small percentage of failed proposals to increase the level of authorized shares, does not imply
that most firms are able to increase their authorized shares. It seems likely that management may
only recommend proposals that they believe are highly likely to obtain shareholder approval. As
10 “Mike Anderson (president and chief executive) said the proposal for added shares would have given the company
flexibility to raise money to make an acquisition, although there were no immediate plans to issue more shares or
use them for business ventures. Gary Smith, company treasurer, said most publicly traded firms are authorized to
issue three times the amount of stock that they have outstanding. With 18 million outstanding and only 25 million
authorized, we’re getting kind of tight, he said. Authorization to issue more shares must be given at annual meetings,
which made yesterday’s vote critical.” Excerpted from the Toledo Blade:
http://www.toledoblade.com/local/2009/05/09/Andersons-stock-bid-rejected.html
12
such, the distribution of observed proposals to increase authorized shares may be censored. At a
minimum, in the short term, management loses some flexibility when a stock split causes a
decrease in the excess-shares and it introduces a potential cost, required to increase the amount
of authorized shares.
Previous research related to authorized shares
The finance literature has paid scant attention to the impact that the number of authorized
shares has on corporate decisions. Part of this neglect may be due to the paucity of the variable in
the primary databases that are used by researchers. For instance, Carter, Lycnh, and Tuna (2007)
cite lack of availability of data in electronic format as the reason they don’t include authorized
shares in their study. To our knowledge, Bhagat, Brickley, and Lease (1986) are the only other
researchers in the finance literature to have focused their study on authorized shares.
Specifically, they hypothesize that if the number of authorized shares is binding, any abnormal
announcement returns associated with an increase in the number of authorized shares will
capture the likelihood of a subsequent event involving the issuance of stock. As Bhagat et al.
point out, a sufficient amount of excess-shares is an essential precursor to many widely studied
activities in corporate finance (e.g. SEOs, stock-based mergers, stock splits, changes in
ownership and control [e.g. such as poison pills and the top-up option]) and as such, should be
included in any analysis of the subsequent corporate events to fully capture the market reaction.
When they attempt to find the market reaction to the announcement of an increase in authorized
shares for industrial firms, their results are statistically insignificant. However, for utilities, they
find a positive 2.83% 11-day CAR, statistically significant at the one-percent level.
The lack of additional study by finance researchers notwithstanding, legal scholars have paid
more attention to the role of authorized shares. According to Hanks (1995) the concept of a
13
limited number of shares available has been in existence for as long as there have been publicly-
traded corporations, at least in the United States. Hanks argues against a limit on authorized
shares, in part because:
“…limits on the number of authorized shares of stock impose excessive burdens and
costs. With the typical publicly traded corporation, the process of amending its charter is
long and costly and, therefore, is not undertaken lightly. The board of directors must
approve the charter amendment and submit the matter to a meeting of the stockholders.
If the annual stockholders’ meeting is not due to be held in the succeeding few months, a
special meeting must be called. A proxy statement must typically be drafted, reviewed,
submitted to the SEC, reviewed by the SEC staff, revised, resubmitted, and mailed to
stockholders. This part of the process alone can easily consume several weeks. …
Typically, the vote requirement for a charter amendment will be two-thirds of the votes
entitled to be cast, which will generally amount to a much larger percentage of the votes
actually cast.”
Yet, twenty years after publication of Hanks’ critique on limited authorized shares, the limits
remain. On average, firms appear to select levels of authorized shares that are only four to six
times their shares outstanding at the time of their IPO (Ganor [2011]). The par value of a share
has a similarly long history, however, the typical par value has decreased to a tiny fraction of a
dollar and many times it is set at a fraction of a penny. Thus, making par value, and the related
concept of stated capital virtually meaningless. The Delaware Secretary of State collects an
annual franchise fee based upon the firm’s authorized capital, however, that fee is capped at
$180,000. For many firms in our sample, it is likely that their franchise tax has already reached
the cap.11 Therefore, any additional authorized shares would pose no further financial impact on
11 The average (median) level of authorized shares for our sample firms is about 54,000,000 (5,400,000). Using the
‘Authorized Shares Method,’ the average firm certainly faces the maximum Delaware franchise tax of $180,000
(firms with 24 million or more authorized shares would pay the maximum). The approximate franchise tax for the
median firm would be $41,000.
14
the firm. Also, if limitations on authorized shares serve little or no purpose, that isn’t otherwise
controlled through other mechanisms (e.g. limitations placed on firms by the NYSE or Nasdaq),
why then hasn’t every firm chosen an initial level of authorized shares that would yield at least
10 or 20 times their initial shares outstanding?
Ganor’s (2011) recent work on the subject helps to answer this question. She conjectures
that high levels of excess-shares empowers managers to engage in activities that may not be in
the best interest of shareholders. In particular, she examines the use of poison pills, top-up
options, and white squires as means by which managers may use excess-shares to achieve a
desired outcome during the battle for control of a firm. Ganor also provides limited empirical
evidence on the excess-ratios of non-financial companies incorporated in Delaware shortly after
their initial public offering. She finds average excess-ratios of 4.55, 4.74, and 5.79 for IPO firms
in the years 2003, 2008, and 2009, respectively. She does not find any significant correlations
between the excess-ratio and firm size, nor whether the pre-IPO firm was backed by a venture
capital firm.
Stock splits and agency costs
Stock splits have confounded researchers for more than forty years. Numerous theories have
been promulgated in an effort to explain the surprisingly large abnormal announcement return
for what otherwise appears to be an inconsequential change to the firm. Easley, O’Hara, and
Saar (2001) categorize these theories into three broad groups; the trading range, reduction of
information asymmetries, and the optimal tick size theories. Many of these papers contend that
splits are primarily cosmetic (e.g. Barker, 1956; Brennan and Copeland, 1988; Easley, O’Hara,
Saar 2001). From the standpoint of immediate cashflows, the previous literature is indeed
correct, splits result in no immediate cashflows of any consequence. The direct costs of
15
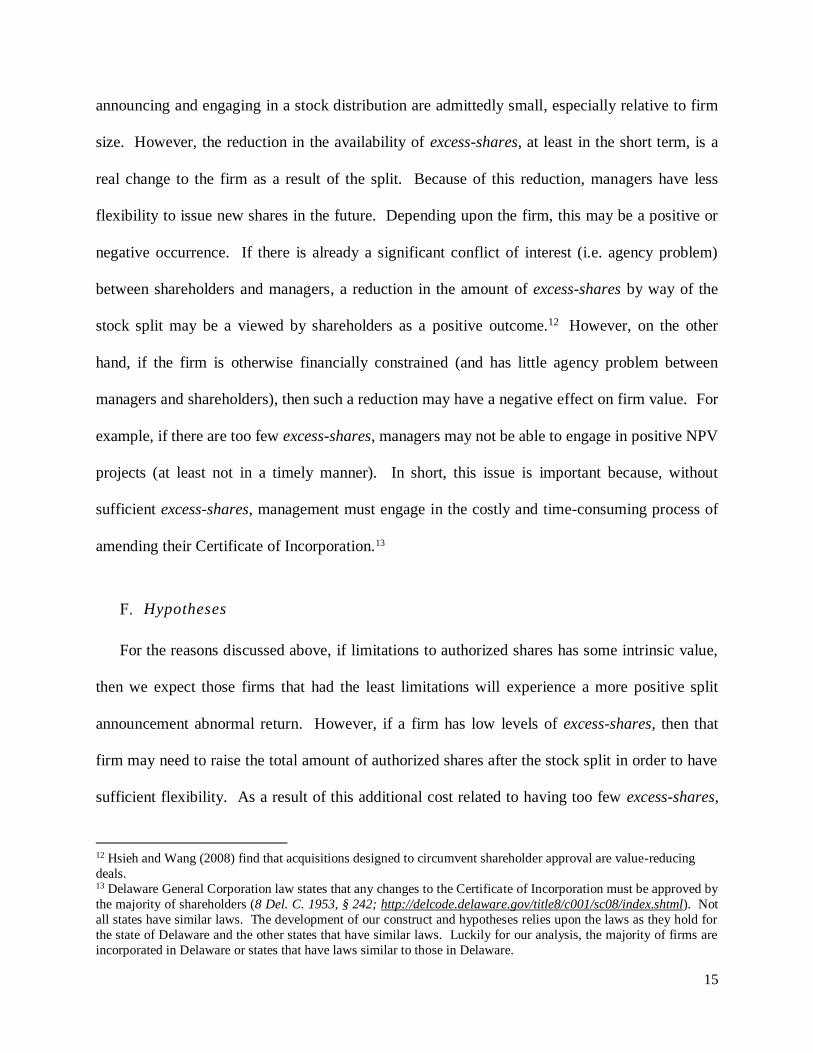
announcing and engaging in a stock distribution are admittedly small, especially relative to firm
size. However, the reduction in the availability of excess-shares, at least in the short term, is a
real change to the firm as a result of the split. Because of this reduction, managers have less
flexibility to issue new shares in the future. Depending upon the firm, this may be a positive or
negative occurrence. If there is already a significant conflict of interest (i.e. agency problem)
between shareholders and managers, a reduction in the amount of excess-shares by way of the
stock split may be a viewed by shareholders as a positive outcome.12 However, on the other
hand, if the firm is otherwise financially constrained (and has little agency problem between
managers and shareholders), then such a reduction may have a negative effect on firm value. For
example, if there are too few excess-shares, managers may not be able to engage in positive NPV
projects (at least not in a timely manner). In short, this issue is important because, without
sufficient excess-shares, management must engage in the costly and time-consuming process of
amending their Certificate of Incorporation.13
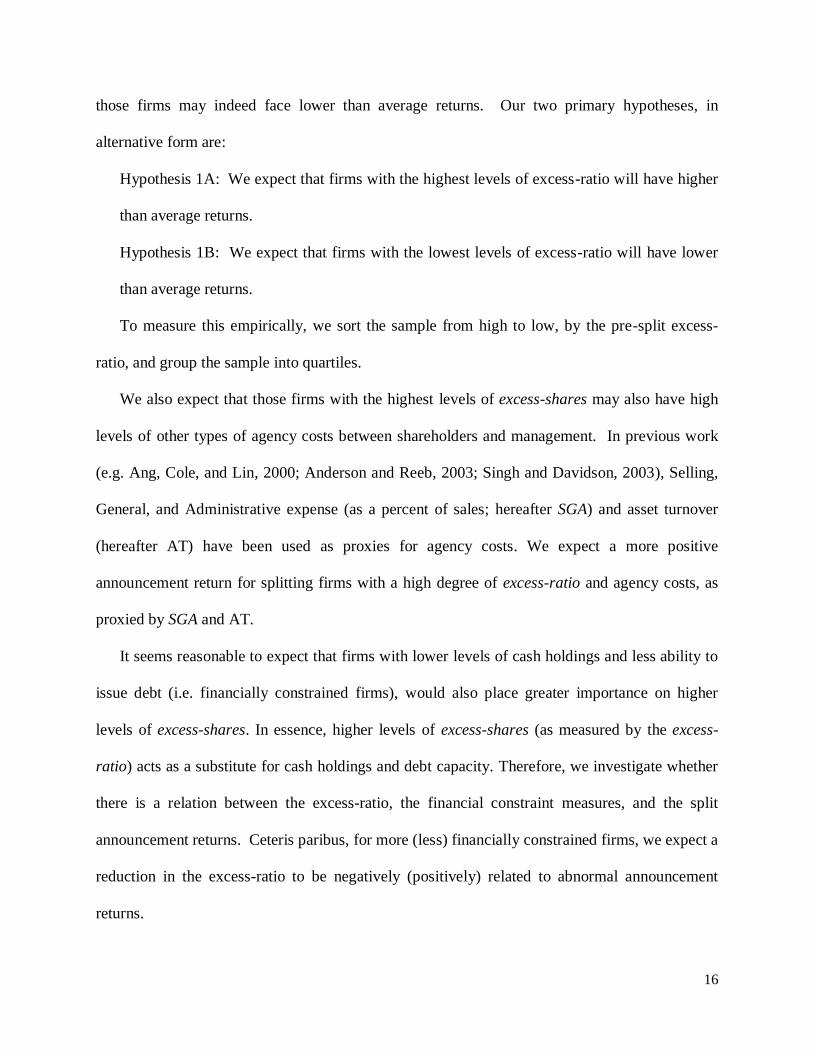
Hypotheses
For the reasons discussed above, if limitations to authorized shares has some intrinsic value,
then we expect those firms that had the least limitations will experience a more positive split
announcement abnormal return. However, if a firm has low levels of excess-shares, then that
firm may need to raise the total amount of authorized shares after the stock split in order to have
sufficient flexibility. As a result of this additional cost related to having too few excess-shares,
12 Hsieh and Wang (2008) find that acquisitions designed to circumvent shareholder approval are value-reducing
deals. 13 Delaware General Corporation law states that any changes to the Certificate of Incorporation must be approved by
the majority of shareholders (8 Del. C. 1953, § 242; http://delcode.delaware.gov/title8/c001/sc08/index.shtml). Not
all states have similar laws. The development of our construct and hypotheses relies upon the laws as they hold for
the state of Delaware and the other states that have similar laws. Luckily for our analysis, the majority of firms are
incorporated in Delaware or states that have laws similar to those in Delaware.
16
those firms may indeed face lower than average returns. Our two primary hypotheses, in
alternative form are:
Hypothesis 1A: We expect that firms with the highest levels of excess-ratio will have higher
than average returns.
Hypothesis 1B: We expect that firms with the lowest levels of excess-ratio will have lower
than average returns.
To measure this empirically, we sort the sample from high to low, by the pre-split excess-
ratio, and group the sample into quartiles.
We also expect that those firms with the highest levels of excess-shares may also have high
levels of other types of agency costs between shareholders and management. In previous work
(e.g. Ang, Cole, and Lin, 2000; Anderson and Reeb, 2003; Singh and Davidson, 2003), Selling,
General, and Administrative expense (as a percent of sales; hereafter SGA) and asset turnover
(hereafter AT) have been used as proxies for agency costs. We expect a more positive
announcement return for splitting firms with a high degree of excess-ratio and agency costs, as
proxied by SGA and AT.
It seems reasonable to expect that firms with lower levels of cash holdings and less ability to
issue debt (i.e. financially constrained firms), would also place greater importance on higher
levels of excess-shares. In essence, higher levels of excess-shares (as measured by the excess-
ratio) acts as a substitute for cash holdings and debt capacity. Therefore, we investigate whether
there is a relation between the excess-ratio, the financial constraint measures, and the split
announcement returns. Ceteris paribus, for more (less) financially constrained firms, we expect a
reduction in the excess-ratio to be negatively (positively) related to abnormal announcement
returns.
17
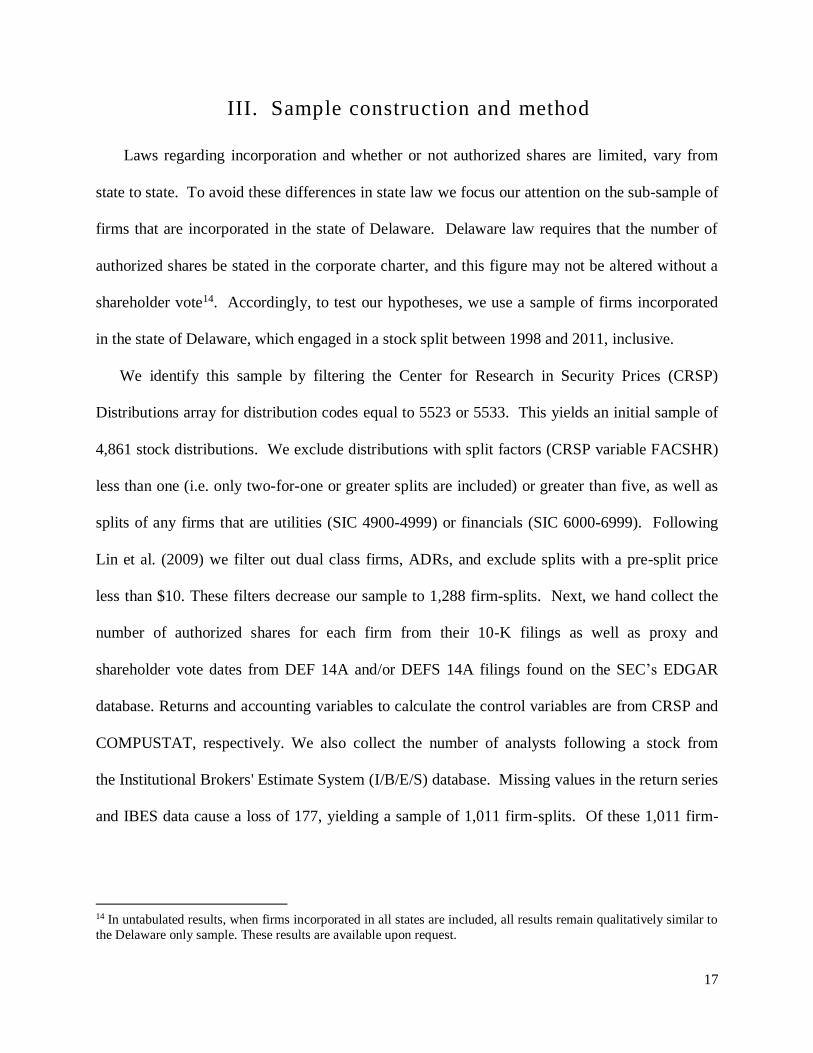
III. Sample construction and method
Laws regarding incorporation and whether or not authorized shares are limited, vary from
state to state. To avoid these differences in state law we focus our attention on the sub-sample of
firms that are incorporated in the state of Delaware. Delaware law requires that the number of
authorized shares be stated in the corporate charter, and this figure may not be altered without a
shareholder vote14. Accordingly, to test our hypotheses, we use a sample of firms incorporated
in the state of Delaware, which engaged in a stock split between 1998 and 2011, inclusive.
We identify this sample by filtering the Center for Research in Security Prices (CRSP)
Distributions array for distribution codes equal to 5523 or 5533. This yields an initial sample of
4,861 stock distributions. We exclude distributions with split factors (CRSP variable FACSHR)
less than one (i.e. only two-for-one or greater splits are included) or greater than five, as well as
splits of any firms that are utilities (SIC 4900-4999) or financials (SIC 6000-6999). Following
Lin et al. (2009) we filter out dual class firms, ADRs, and exclude splits with a pre-split price
less than $10. These filters decrease our sample to 1,288 firm-splits. Next, we hand collect the
number of authorized shares for each firm from their 10-K filings as well as proxy and
shareholder vote dates from DEF 14A and/or DEFS 14A filings found on the SEC’s EDGAR
database. Returns and accounting variables to calculate the control variables are from CRSP and
COMPUSTAT, respectively. We also collect the number of analysts following a stock from
the Institutional Brokers' Estimate System (I/B/E/S) database. Missing values in the return series
and IBES data cause a loss of 177, yielding a sample of 1,011 firm-splits. Of these 1,011 firm-
14 In untabulated results, when firms incorporated in all states are included, all results remain qualitatively similar to
the Delaware only sample. These results are available upon request.
18
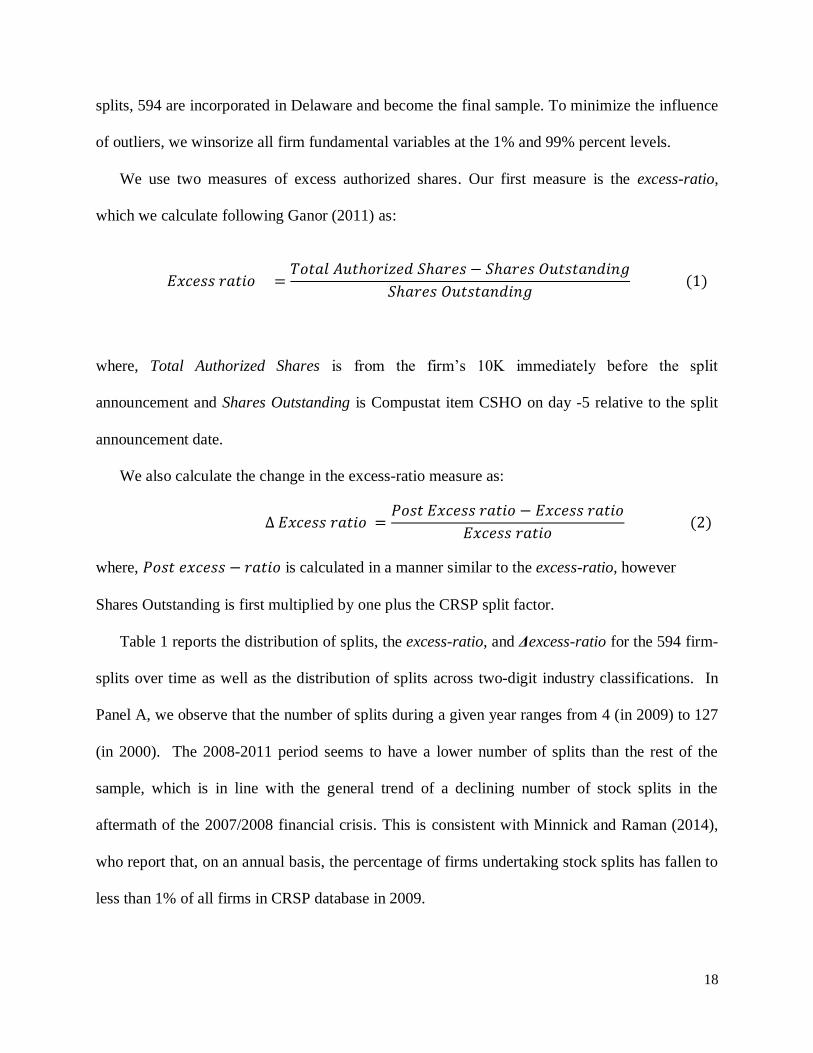
splits, 594 are incorporated in Delaware and become the final sample. To minimize the influence
of outliers, we winsorize all firm fundamental variables at the 1% and 99% percent levels.
We use two measures of excess authorized shares. Our first measure is the excess-ratio,
which we calculate following Ganor (2011) as:
𝐸𝑥𝑐𝑒𝑠𝑠 𝑟𝑎𝑡𝑖𝑜 =𝑇𝑜𝑡𝑎𝑙 𝐴𝑢𝑡ℎ𝑜𝑟𝑖𝑧𝑒𝑑 𝑆ℎ𝑎𝑟𝑒𝑠 − 𝑆ℎ𝑎𝑟𝑒𝑠 𝑂𝑢𝑡𝑠𝑡𝑎𝑛𝑑𝑖𝑛𝑔
𝑆ℎ𝑎𝑟𝑒𝑠 𝑂𝑢𝑡𝑠𝑡𝑎𝑛𝑑𝑖𝑛𝑔 (1)
where, Total Authorized Shares is from the firm’s 10K immediately before the split
announcement and Shares Outstanding is Compustat item CSHO on day -5 relative to the split
announcement date.
We also calculate the change in the excess-ratio measure as:
∆ 𝐸𝑥𝑐𝑒𝑠𝑠 𝑟𝑎𝑡𝑖𝑜 =𝑃𝑜𝑠𝑡 𝐸𝑥𝑐𝑒𝑠𝑠 𝑟𝑎𝑡𝑖𝑜 − 𝐸𝑥𝑐𝑒𝑠𝑠 𝑟𝑎𝑡𝑖𝑜
𝐸𝑥𝑐𝑒𝑠𝑠 𝑟𝑎𝑡𝑖𝑜 (2)
where, 𝑃𝑜𝑠𝑡 𝑒𝑥𝑐𝑒𝑠𝑠 − 𝑟𝑎𝑡𝑖𝑜 is calculated in a manner similar to the excess-ratio, however
Shares Outstanding is first multiplied by one plus the CRSP split factor.
Table 1 reports the distribution of splits, the excess-ratio, and Δexcess-ratio for the 594 firm-
splits over time as well as the distribution of splits across two-digit industry classifications. In
Panel A, we observe that the number of splits during a given year ranges from 4 (in 2009) to 127
(in 2000). The 2008-2011 period seems to have a lower number of splits than the rest of the
sample, which is in line with the general trend of a declining number of stock splits in the
aftermath of the 2007/2008 financial crisis. This is consistent with Minnick and Raman (2014),
who report that, on an annual basis, the percentage of firms undertaking stock splits has fallen to
less than 1% of all firms in CRSP database in 2009.
19
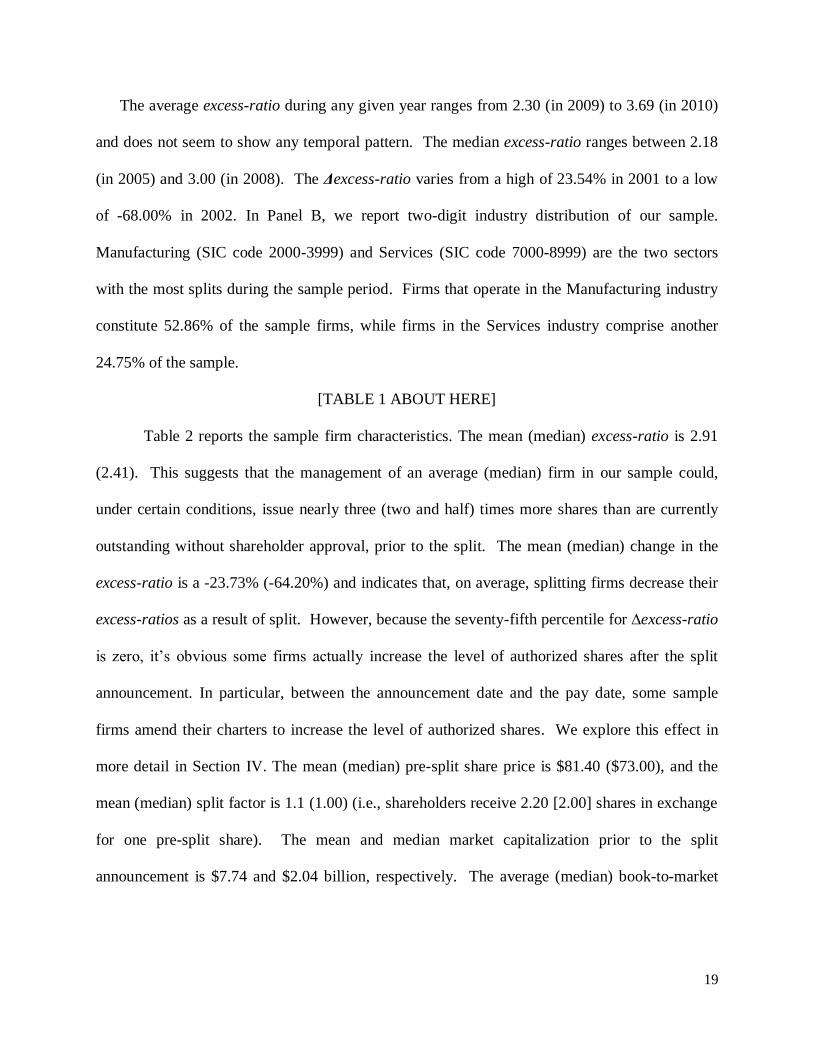
The average excess-ratio during any given year ranges from 2.30 (in 2009) to 3.69 (in 2010)
and does not seem to show any temporal pattern. The median excess-ratio ranges between 2.18
(in 2005) and 3.00 (in 2008). The Δexcess-ratio varies from a high of 23.54% in 2001 to a low
of -68.00% in 2002. In Panel B, we report two-digit industry distribution of our sample.
Manufacturing (SIC code 2000-3999) and Services (SIC code 7000-8999) are the two sectors
with the most splits during the sample period. Firms that operate in the Manufacturing industry
constitute 52.86% of the sample firms, while firms in the Services industry comprise another
24.75% of the sample.
[TABLE 1 ABOUT HERE]
Table 2 reports the sample firm characteristics. The mean (median) excess-ratio is 2.91
(2.41). This suggests that the management of an average (median) firm in our sample could,
under certain conditions, issue nearly three (two and half) times more shares than are currently
outstanding without shareholder approval, prior to the split. The mean (median) change in the
excess-ratio is a -23.73% (-64.20%) and indicates that, on average, splitting firms decrease their
excess-ratios as a result of split. However, because the seventy-fifth percentile for ∆excess-ratio
is zero, it’s obvious some firms actually increase the level of authorized shares after the split
announcement. In particular, between the announcement date and the pay date, some sample
firms amend their charters to increase the level of authorized shares. We explore this effect in
more detail in Section IV. The mean (median) pre-split share price is $81.40 ($73.00), and the
mean (median) split factor is 1.1 (1.00) (i.e., shareholders receive 2.20 [2.00] shares in exchange
for one pre-split share). The mean and median market capitalization prior to the split
announcement is $7.74 and $2.04 billion, respectively. The average (median) book-to-market
20
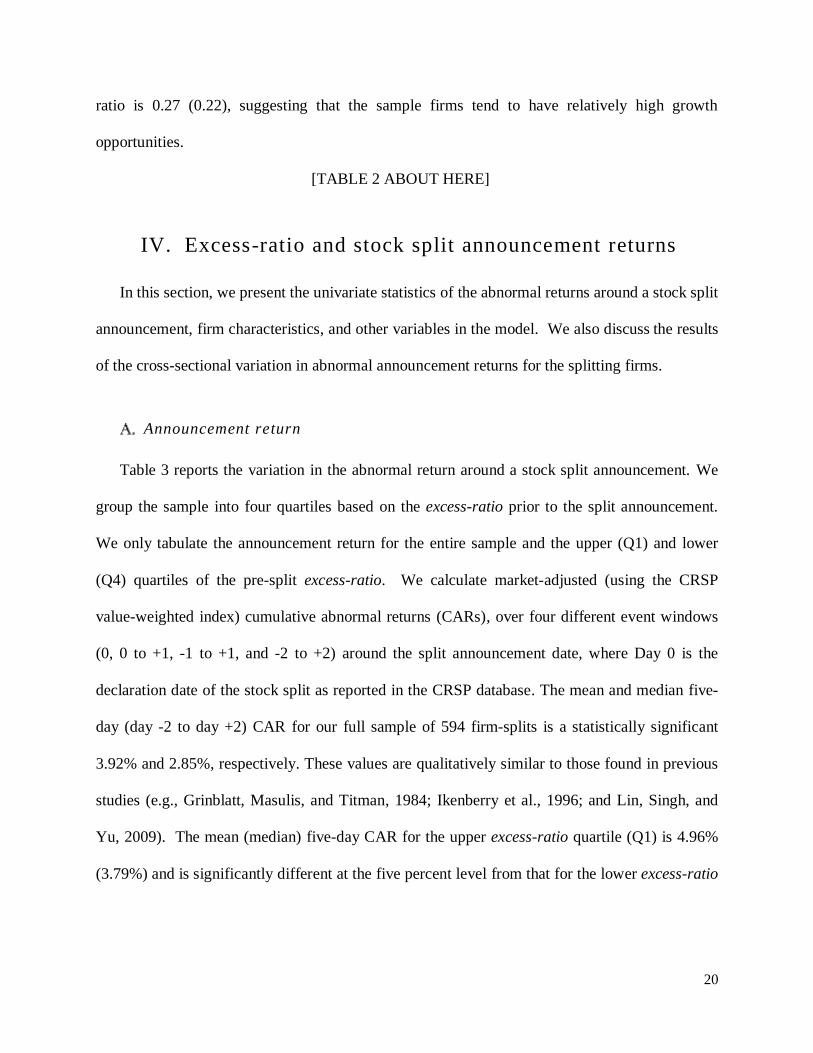
ratio is 0.27 (0.22), suggesting that the sample firms tend to have relatively high growth
opportunities.
[TABLE 2 ABOUT HERE]
IV. Excess-ratio and stock split announcement returns
In this section, we present the univariate statistics of the abnormal returns around a stock split
announcement, firm characteristics, and other variables in the model. We also discuss the results
of the cross-sectional variation in abnormal announcement returns for the splitting firms.
Announcement return
Table 3 reports the variation in the abnormal return around a stock split announcement. We
group the sample into four quartiles based on the excess-ratio prior to the split announcement.
We only tabulate the announcement return for the entire sample and the upper (Q1) and lower
(Q4) quartiles of the pre-split excess-ratio. We calculate market-adjusted (using the CRSP
value-weighted index) cumulative abnormal returns (CARs), over four different event windows
(0, 0 to +1, -1 to +1, and -2 to +2) around the split announcement date, where Day 0 is the
declaration date of the stock split as reported in the CRSP database. The mean and median five-
day (day -2 to day +2) CAR for our full sample of 594 firm-splits is a statistically significant
3.92% and 2.85%, respectively. These values are qualitatively similar to those found in previous
studies (e.g., Grinblatt, Masulis, and Titman, 1984; Ikenberry et al., 1996; and Lin, Singh, and
Yu, 2009). The mean (median) five-day CAR for the upper excess-ratio quartile (Q1) is 4.96%
(3.79%) and is significantly different at the five percent level from that for the lower excess-ratio
21
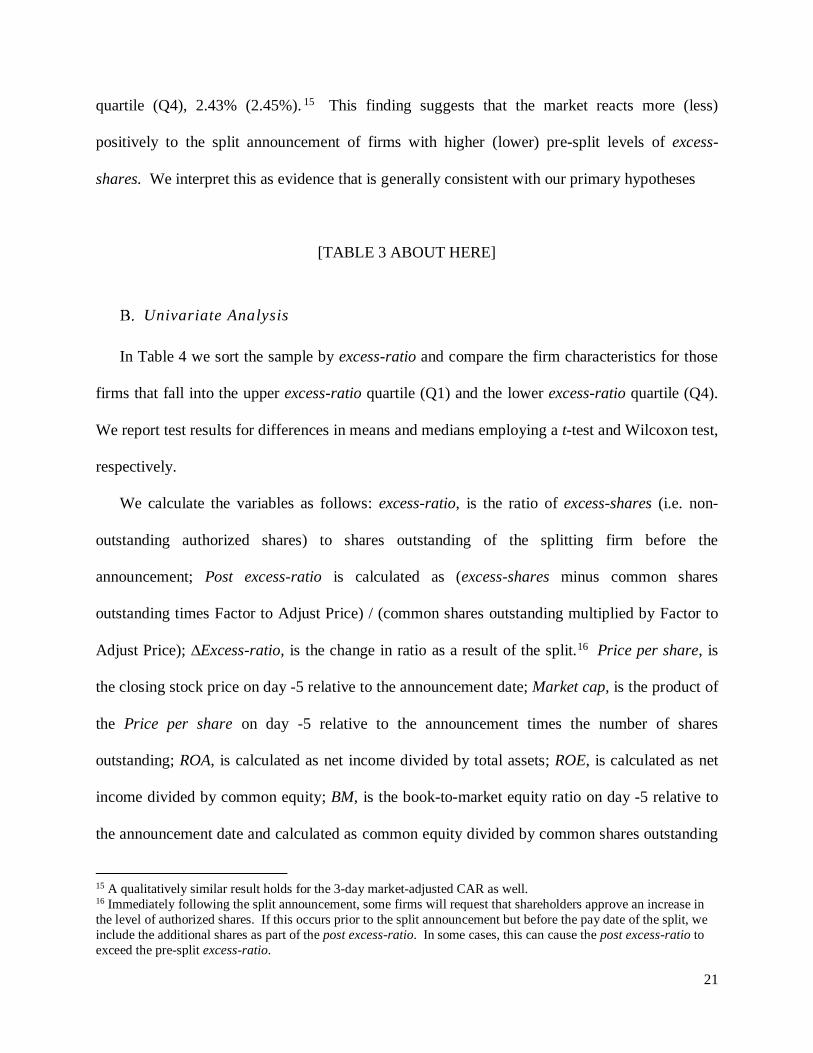
quartile (Q4), 2.43% (2.45%). 15 This finding suggests that the market reacts more (less)
positively to the split announcement of firms with higher (lower) pre-split levels of excess-
shares. We interpret this as evidence that is generally consistent with our primary hypotheses
[TABLE 3 ABOUT HERE]
Univariate Analysis
In Table 4 we sort the sample by excess-ratio and compare the firm characteristics for those
firms that fall into the upper excess-ratio quartile (Q1) and the lower excess-ratio quartile (Q4).
We report test results for differences in means and medians employing a t-test and Wilcoxon test,
respectively.
We calculate the variables as follows: excess-ratio, is the ratio of excess-shares (i.e. non-
outstanding authorized shares) to shares outstanding of the splitting firm before the
announcement; Post excess-ratio is calculated as (excess-shares minus common shares
outstanding times Factor to Adjust Price) / (common shares outstanding multiplied by Factor to
Adjust Price); ∆Excess-ratio, is the change in ratio as a result of the split.16 Price per share, is
the closing stock price on day -5 relative to the announcement date; Market cap, is the product of
the Price per share on day -5 relative to the announcement times the number of shares
outstanding; ROA, is calculated as net income divided by total assets; ROE, is calculated as net
income divided by common equity; BM, is the book-to-market equity ratio on day -5 relative to
the announcement date and calculated as common equity divided by common shares outstanding
15 A qualitatively similar result holds for the 3-day market-adjusted CAR as well. 16 Immediately following the split announcement, some firms will request that shareholders approve an increase in
the level of authorized shares. If this occurs prior to the split announcement but before the pay date of the split, we
include the additional shares as part of the post excess-ratio. In some cases, this can cause the post excess-ratio to
exceed the pre-split excess-ratio.
22
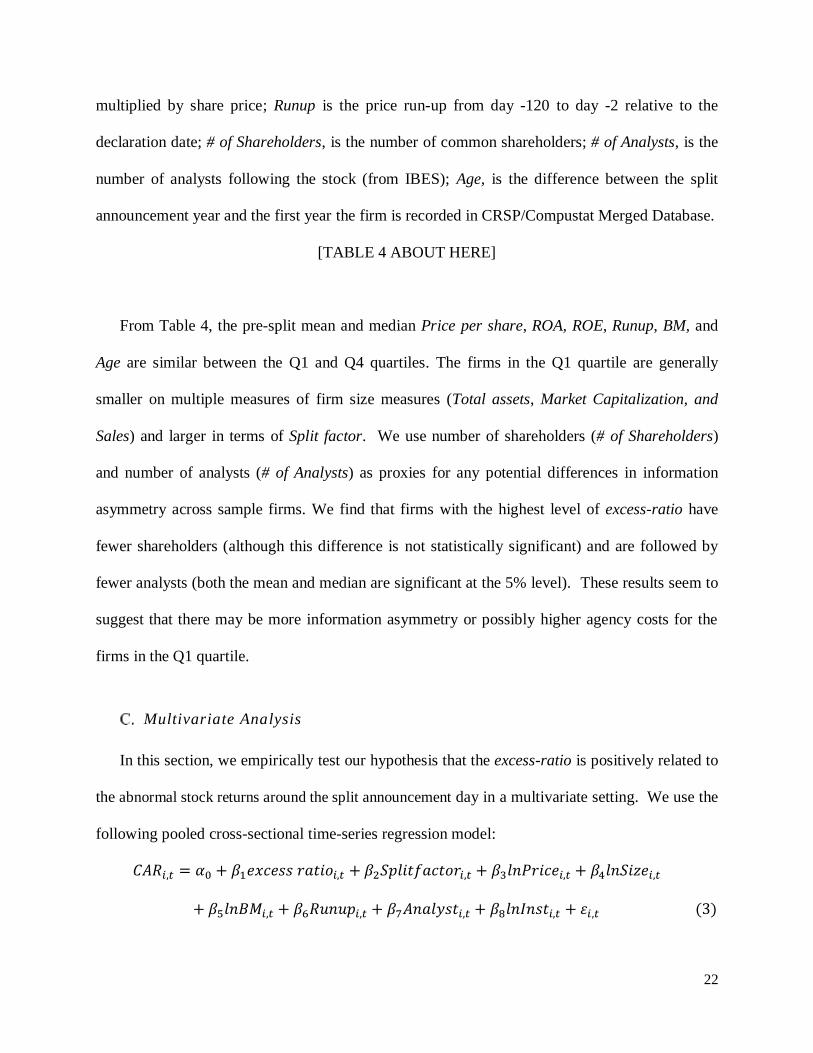
multiplied by share price; Runup is the price run-up from day -120 to day -2 relative to the
declaration date; # of Shareholders, is the number of common shareholders; # of Analysts, is the
number of analysts following the stock (from IBES); Age, is the difference between the split
announcement year and the first year the firm is recorded in CRSP/Compustat Merged Database.
[TABLE 4 ABOUT HERE]
From Table 4, the pre-split mean and median Price per share, ROA, ROE, Runup, BM, and
Age are similar between the Q1 and Q4 quartiles. The firms in the Q1 quartile are generally
smaller on multiple measures of firm size measures (Total assets, Market Capitalization, and
Sales) and larger in terms of Split factor. We use number of shareholders (# of Shareholders)
and number of analysts (# of Analysts) as proxies for any potential differences in information
asymmetry across sample firms. We find that firms with the highest level of excess-ratio have
fewer shareholders (although this difference is not statistically significant) and are followed by
fewer analysts (both the mean and median are significant at the 5% level). These results seem to
suggest that there may be more information asymmetry or possibly higher agency costs for the
firms in the Q1 quartile.
Multivariate Analysis
In this section, we empirically test our hypothesis that the excess-ratio is positively related to
the abnormal stock returns around the split announcement day in a multivariate setting. We use the
following pooled cross-sectional time-series regression model:
𝐶𝐴𝑅𝑖,𝑡 = 𝛼0 + 𝛽1𝑒𝑥𝑐𝑒𝑠𝑠 𝑟𝑎𝑡𝑖𝑜𝑖,𝑡 + 𝛽2𝑆𝑝𝑙𝑖𝑡𝑓𝑎𝑐𝑡𝑜𝑟𝑖,𝑡 + 𝛽3𝑙𝑛𝑃𝑟𝑖𝑐𝑒𝑖,𝑡 + 𝛽4𝑙𝑛𝑆𝑖𝑧𝑒𝑖,𝑡
+ 𝛽5𝑙𝑛𝐵𝑀𝑖,𝑡 + 𝛽6𝑅𝑢𝑛𝑢𝑝𝑖,𝑡 + 𝛽7𝐴𝑛𝑎𝑙𝑦𝑠𝑡𝑖,𝑡 + 𝛽8𝑙𝑛𝐼𝑛𝑠𝑡𝑖,𝑡 + 𝜀𝑖,𝑡 (3)
23
The dependent variable is the 5-day market-adjusted CAR for the splitting firm (CAR [-2, 2]),
following Ikenberry et al. (1996).17 We include control variables that have been used in previous
studies to explain abnormal stock split announcement returns. Grinblatt, Masulis, and Titman
(1984), among others (Brennan and Copeland [1988], and Lin et al. [2009]), used the split factor
(𝑆𝑝𝑙𝑖𝑡𝑓𝑎𝑐𝑡𝑜𝑟) as a proxy for the strength of the signal. We also control for the pre-split stock
price (logged) with 𝑙𝑛𝑃𝑟𝑖𝑐𝑒. The book-to-market ratio (ln𝐵𝑀) and firm size (lnSize) is included
by Ikenberry et al. (1996), while the pre-split price run-up (𝑅𝑢𝑛𝑢𝑝) is used by Grinblatt,
Masulis, and Titman (1984) as a cross-sectional determinant of abnormal split announcement
returns. We also control for any cross-sectional variation in asymmetric information with the
number of analysts following the firm (𝐴𝑛𝑎𝑙𝑦𝑠𝑡𝑖). Finally, we include institutional ownership
(𝑙𝑛𝐼𝑛𝑠𝑡), which is the fraction of a firm’s shares that are held by institutional investors (13f) in
the calendar quarter before the split declaration from the Thomson Reuters Ownership Database,
as an additional proxy for asymmetric information. We estimate the standard errors using
White’s (1980) heteroscedasticity consistent covariance matrix.
Table 5 presents the results of estimating Equation 3. Models 1 and 2 only include the
excess-ratio and only differ in that Model 2 incorporates year fixed effects. In Model 3 and
Model 4 we add all the control variables described above. And again, Model 4 has year fixed
effects while Model 3 does not. The coefficient on the excess-ratio is positive and statistically
significant in all four models.18 The excess-ratio is statistically significant at the one-percent
level in Models 1 and 2 and at the five-percent level in Models 3 and 4. Consistent with prior
literature (Grinblatt et al., 1984; and Lin et al., 2009), LnPrice, and 𝑙𝑛𝐵𝑀𝑖 are significant and
17 Our results are robust if we use CAR (-1, +1) in lieu of CAR (-2, +2) as the dependent variable. 18 The results are qualitatively similar when we use the natural log of the excess-ratio variable.
24
negatively related to the split announcement return in all models and lnSize is negative and
significant in Model 3 only.
[TABLE 5 ABOUT HERE]
Overall, these findings suggest that firms with higher pre-split levels of excess-ratios, have
more positive abnormal returns than those with lower levels of excess-ratios. This result is
consistent with our univariate findings and suggests that the market reacts more positively to the
split announcement of firms with greater power to issue stock.
Robustness tests
1. Agency costs and excess shares
The significantly higher abnormal announcement returns for firms with high levels of excess-
shares, which are subsequently reduced by the stock split, suggest that these firms may also
suffer from high agency costs in general. To access whether this is true, we attempt to relate the
pre-split levels of the excess-ratio to proxies for agency costs. We use two proxies for agency
costs, SGA as a percent of sales and asset turnover, two variables used in previous literature (e.g.
Ang, Cole, and Lin, 2000; Anderson and Reeb, 2003; Singh and Davidson, 2003).
A firm`s selling, general, and administrative (SG&A) expense (as a percent of sales), which
represents the costs related to the management function and to the sale of products and includes
managerial salaries, rents, insurance, utilities, supplies, and advertising costs. Higher levels of
SG&A expenses are a close approximation of managerial pay and perquisite consumption in
terms of higher salaries, large office complexes, and other organizational support facilities.
These costs reflect managerial discretionary expenses and may be a good proxy for agency costs.
Second, we measure agency cost as the ratio of annual sales to total assets (i.e. asset utilization).
This ratio measures management’s ability to utilize assets efficiently. A high asset turnover ratio
25
shows a large amount of sales and ultimately cash flow that are generated for a given level of
assets. On the contrary, a low ratio would indicate that management is under-utilizing, or
possibly mismanaging assets. While a higher asset turnover may be identified with efficient
asset management practices and hence creating value for shareholders, a lower sales to asset ratio
reflects asset deployment for unproductive purposes. Therefore, firms with considerable agency
conflict will likely have lower asset turnover.
In Table 6, we report the average excess-ratio for the upper and lower quartiles based on
the of SG&A expense ratio and Asset turnover. Firms with the highest percentage of SG&A have
an average excess-ratio of 3.15 while those with the lowest levels of SG&A have an average
excess-ratio of 2.94. These differences are statistically insignificant but in the hypothesized
direction. The excess-ratio means across the two quartiles for the asset turnover are also in the
expected direction, however the difference is still statistically insignificant. However, the
difference in the means of the post excess-ratio across the two quartiles for both the SG&A
measure as well as asset turnover are in the expected direction and both are significant at the
one-percent level. We know that some firms, immediately following the split announcement, ask
shareholders to amend the corporate charter to increase the level authorized shares. It appears
that this is more likely the case for the firms with higher levels of agency problems.
[TABLE 6 ABOUT HERE]
In Table 7 we estimate Equation 3, with two additional variables. First, we include one
of the proxies for agency costs (AT is included in Models 1 & 2, SG&A is included in Models
3&4). We also include an interacted variable. We create a binary variable based upon AT,
where the variable equals one when a firm’s asset turnover is in the lowest quartile, and zero
otherwise. This variable is interacted with the excess-ratio. A similar interacted variable is
26
created for the SG&A proxy, except the binary variable takes on a value of one when the SG&A
of the firm is in the highest quartile, and zero otherwise. If a reduction in the amount of excess-
shares helps to mitigate the firm’s conflicts of interest, we expect to find a positive and
significant coefficient on the interacted variable.
[TABLE 7 ABOUT HERE]
In Model 2, the coefficient on the interaction term between the SG&A dummy variable and
the excess-ratio is positive and statistically significant at the 5 percent level. This is consistent
with our expectation that for firms with the highest levels of agency problems, a decrease in the
management’s ability to issue new stock, is viewed favorably by shareholders.
2. Amending the Charter Prior to the Split Pay Date
Our earlier analysis (see Table 2) shows that approximately one-fourth of the firms in our
sample reverse some or all of the reduction in their excess-ratio during the period between the
announcement and the pay date of the stock split. At first glance, this charter amending behavior
may appear to call into question our prior analysis. However, consider that there may be an
optimal level of excess-shares (see Appendix B for a brief description of one possible model).
Prior to the split, if a firm were above its optimal level of excess-shares, the effect of the split
would be to move it closer to this optimum. However, for a firm that was either at its optimum
or slightly below, the split would move the firm further from the optimal level of excess-shares.
For these firms, it may make sense for them to bear the expense of amending their corporate
charter to increase the level of excess-shares.
If firms behave as though there were some optimal level of excess-shares, then we would
expect to observe more firms with low, pre-split levels of excess-shares amending their charters
27
after the split announcement, and vice versa. Table 8 presents the number of firms for the
highest and lowest quartiles, based upon the pre-split excess-ratio, that request that their
shareholders vote on a charter amendment to increase the level of authorized shares.
Approximately, one-in-ten (10.8%) firms with the highest levels of pre-split excess-ratio request
a charter amendment, while nearly two-thirds (62.4%) of firms with the lowest levels of pre-split
excess-ratio amend their charters. It appears that firms behave as though there were some
optimal level of authorized shares.
[TABLE 8 ABOUT HERE]
We also add a bivariate variable, Amend, to our regression model in an effort to more
closely examine this difference. Amend has a value of 1 if the sample firm increased its
authorized shares after the split announcement but before the pay date and is zero for those that
do not increase their authorized shares after to the split announcement. Table 9 presents the
results of this analysis. Relative to the results from Table 5, the coefficient on the pre-split
excess-ratio remains positive, but is now significant at the one-percent level rather than five-
percent. Amend is also positive and significant at the five-percent level. The control variables
maintain their signs and statistical significance. This result suggests that at the time of the
announcement, the market anticipates, and reacts positively to the charter amendment request. In
part, it may also reflect the market reaction to firms who simultaneously announce an increase to
their authorized shares and the stock split. A subset of our sample firms have insufficient
excess-shares for a stock split, and as a result, they announce a stock split, conditioned upon
shareholder approval of an increase in the firm’s level of authorized shares. The increase
requested typically increases the excess-ratio, net of the split, relative to the pre-split excess-
ratio. However, it is important to note that the positive and statistically significant result remains
28
for the excess-ratio. These two results together are consistent with the premise that firms have
some optimal level of authorized shares and adds further evidence that limitations on the level of
authorized shares may continue to play a valuable role in mitigating the agency relationship
between managers and shareholders.
[TABLE 9 ABOUT HERE]
V. Conclusion
Hanks (1995) argues that the limitation on the number of authorized, but unissued shares (i.e.
excess-shares) available to managers is a historical artifact from the early days of the
corporation, and that it should be abolished. Ganor (2011) suggests that limiting the amount of
unissued shares is an important means of reducing the conflict of interest between managers and
shareholders. In this study, we provide some empirical evidence to help resolve this debate. In
particular, we examine an event that causes a significant decrease in the amount of excess-shares,
namely a stock split. When a firm splits its shares, the number of new shares needed is equal to
the pre-split shares outstanding times the split factor. The amount of excess-shares (i.e.
authorized but previously not issued) is reduced by the same amount. Since it is unlikely that the
primary reason for the split is to reduce the amount of excess-shares, we treat this reduction as an
“unintentional” result of the stock split.
We divide our sample of firm-splits into quartiles, based on the firm’s excess-ratio (defined
as the number of excess-shares divided by the number of shares outstanding). The average 5-day
abnormal announcement return for firms with the highest levels of excess-ratio is 4.96% and this
is statistically different from the average of 2.43% for firms with the lowest levels of excess-
ratio. This appears to indicate that the market interprets the split announcement and concomitant
29
reduction in the excess-ratio for firms with very high levels of excess-shares as a positive signal.
This result holds in a multivariate setting with control variables commonly included in previous
studies of abnormal announcement returns around stock splits.
We also examine the relation between the excess-ratio and proxies for agency costs (asset
turnover and SG&A expense ratio). While there appears to be no difference in the levels of the
excess-ratio in the upper and lower quartiles, based on each of the agency cost proxies, we do
find that the post excess-ratio is significantly higher for the firms with higher agency costs. Thus
it seems possible that those firms with higher agency costs are either more likely to reverse the
effect of the split with an amendment to the charter and/or began with a higher level of
authorized shares prior to the split.
Finally, we examine the frequency with which firms choose to increase their excess-shares in
conjunction with the stock split announcement. About one-fourth of splitting firms reverse all or
some of the reduction caused by the split. Approximately 10% of those firms that had a pre-split
excess-ratio that ranked among the highest quartile based on excess-ratio, requested that
shareholders approve an increase in the firm’s authorized shares. However, for those firms that
had a pre-split excess-ratio among the lowest 25%, nearly two-thirds of the firms requested an
increase in their authorized shares.
Overall, our findings are most consistent with the premise that managers’ power to issue
stock becomes more constrained as a result of the split, likely through reduced agency costs, and
hence increases firm value. The evidence also suggests that a limit on the level of authorized
shares is important in balancing the agency relationship between managers and shareholders.
30
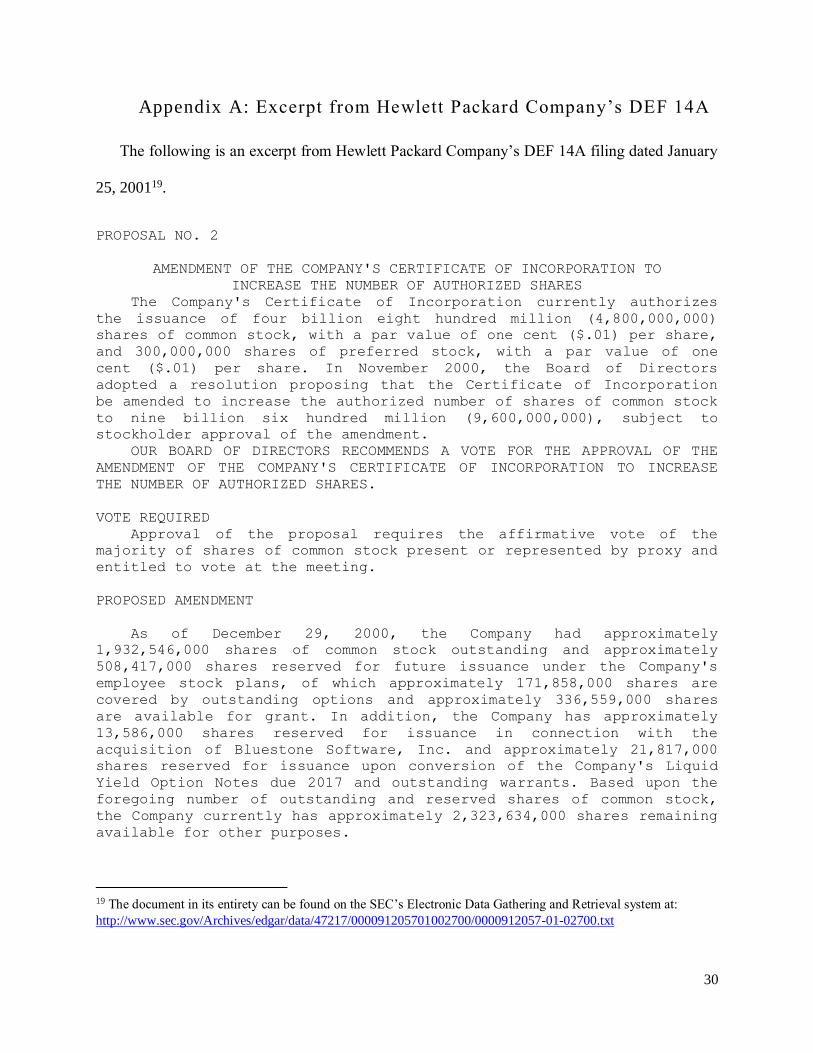
Appendix A: Excerpt from Hewlett Packard Company’s DEF 14A
The following is an excerpt from Hewlett Packard Company’s DEF 14A filing dated January
25, 200119.
PROPOSAL NO. 2
AMENDMENT OF THE COMPANY'S CERTIFICATE OF INCORPORATION TO
INCREASE THE NUMBER OF AUTHORIZED SHARES
The Company's Certificate of Incorporation currently authorizes
the issuance of four billion eight hundred million (4,800,000,000)
shares of common stock, with a par value of one cent ($.01) per share,
and 300,000,000 shares of preferred stock, with a par value of one
cent ($.01) per share. In November 2000, the Board of Directors
adopted a resolution proposing that the Certificate of Incorporation
be amended to increase the authorized number of shares of common stock
to nine billion six hundred million (9,600,000,000), subject to
stockholder approval of the amendment.
OUR BOARD OF DIRECTORS RECOMMENDS A VOTE FOR THE APPROVAL OF THE
AMENDMENT OF THE COMPANY'S CERTIFICATE OF INCORPORATION TO INCREASE
THE NUMBER OF AUTHORIZED SHARES.
VOTE REQUIRED
Approval of the proposal requires the affirmative vote of the
majority of shares of common stock present or represented by proxy and
entitled to vote at the meeting.
PROPOSED AMENDMENT
As of December 29, 2000, the Company had approximately
1,932,546,000 shares of common stock outstanding and approximately
508,417,000 shares reserved for future issuance under the Company's
employee stock plans, of which approximately 171,858,000 shares are
covered by outstanding options and approximately 336,559,000 shares
are available for grant. In addition, the Company has approximately
13,586,000 shares reserved for issuance in connection with the
acquisition of Bluestone Software, Inc. and approximately 21,817,000
shares reserved for issuance upon conversion of the Company's Liquid
Yield Option Notes due 2017 and outstanding warrants. Based upon the
foregoing number of outstanding and reserved shares of common stock,
the Company currently has approximately 2,323,634,000 shares remaining
available for other purposes.
19 The document in its entirety can be found on the SEC’s Electronic Data Gathering and Retrieval system at:
http://www.sec.gov/Archives/edgar/data/47217/000091205701002700/0000912057-01-02700.txt
31
The following is the text of the first paragraph of Article IV of
the Certificate of Incorporation of the Company, including the
proposed amendment to the second sentence thereof:
The Corporation is authorized to issue two classes of stock to be
designated, respectively, Preferred Stock, par value $0.01 per share
("Preferred"), and Common Stock, par value $0.01 per share ("Common").
The total number of shares of Common that the Corporation shall have
authority to issue is 9,600,000,000. The total number of shares of
Preferred that the Corporation shall have authority to issue is
300,000,000. The Preferred Stock may be issued from time to time in
one or more series.
PURPOSE AND EFFECT OF THE PROPOSED AMENDMENT
The Board of Directors believes that the availability of
additional authorized but unissued shares will provide the Company
with the flexibility to issue common stock for a variety of corporate
purposes, such as to effect future stock splits in the form of stock
dividends, to make acquisitions through the use of stock, to raise
equity capital, to adopt additional employee benefit plans or to
reserve additional shares for issuance under such plans and under
plans of acquired companies.
Increasing the number of shares of common stock that the Company
is authorized to issue would give the Company additional flexibility
with respect to future stock splits and stock dividends. On seven
occasions the Company has effected either a stock split or a stock
dividend in the form of a stock split. The last such action was a 2-
for-1 stock split in the form of a stock dividend payable in October
2000. Also in 2000, the Company agreed to issue approximately
13,586,000 shares of common stock to acquire Bluestone Software, Inc.
The Board of Directors believes that the proposed increase in
authorized common stock would facilitate the Company's ability to
accomplish stock splits in the form of a stock dividend and other
business and financial objectives in the future without the necessity
of delaying such activities for further shareowner approval, except as
may be required in particular cases by the Company's charter
documents, applicable law or the rules of any stock exchange or
national securities association trading system on which the Company's
securities may then be listed. Other than as permitted or required
under the Company's employee benefit plans and under outstanding
options, warrants and other securities convertible into common stock,
and the acquisition described above, the Board of Directors has no
immediate plans, understandings, agreements or commitments to issue
additional common stock for any purposes. Whether or not the Company's
shareowners approve this proposal will not impact the Company's
existing agreements to issue stock, including pursuant to the
acquisition described above. No additional action or authorization by
the Company's shareowners would be necessary prior to the issuance of
such additional shares, unless required by applicable law or the rules
of any stock exchange or national securities association trading
system on which the common stock is then listed or quoted. The Company
reserves the right to seek a further increase in authorized shares
from time to time in the future as considered appropriate by the Board
of Directors.
32
Under the Company's Certificate of Incorporation, the Company's
shareowners do not have preemptive rights with respect to common
stock. Thus, should the Board of Directors elect to issue additional
shares of common stock, existing shareowners would not have any
preferential rights to purchase such shares. If the Board of Directors
elects to issue additional shares of common stock, such issuance could
have a dilutive effect on the earnings per share, book value per share
voting power and shareholdings of current shareowners.
The proposal could have an anti-takeover effect, although that is
not its intention. For example, if the Company were the subject of a
hostile takeover attempt, it could try to impede the takeover by
issuing shares of common stock, thereby diluting the voting power of
the other outstanding shares and increasing the potential cost of the
takeover. The availability of this defensive strategy to the Company
could discourage unsolicited takeover attempts, thereby limiting the
opportunity for the Company's shareowners to realize a higher price
for their shares than is generally available in the public markets.
The Board of Directors is not aware of any attempt, or contemplated
attempt, to acquire control of the Company, and this proposal is not
being presented with the intent that it be utilized as a type of anti-
takeover device. In addition to the Company's common stock, the
Company's Certificate currently empowers the Board of Directors to
authorize the issuance of one or more series of preferred stock
without shareowner approval. No shares of preferred stock of the
Company are issued or outstanding. No change to the Company's
preferred stock authorization is requested by the Amendment.
If the proposed amendment is adopted, it will become effective
upon filing of a Certificate of Amendment to the Company's Certificate
of Incorporation with the Delaware Secretary of State. However, if the
Company's shareowners approve the proposed amendment to the Company's
Certificate of Incorporation, the Board retains discretion under
Delaware law not to implement the proposed amendment. If the Board
exercised such discretion, the number of authorized shares would
remain at current levels.
33
Appendix B: A Stylized Model for the Determination
of an Optimal Excess-Ratio
Since this variable is relatively unstudied in the literature, we propose a relatively
straightforward framework with which to view the excess authorized share ratio (excess-ratio).
While we do not directly test the construct that we describe herein, it provides the reader with a
brief background of how an optimal excess-ratio may arise. Clearly, this optimal excess-ratio
may vary from firm to firm. The level of the excess-ratio selected by the firm is the result of
minimizing the total costs related to excess authorized shares. These costs take two forms. First,
as the excess-ratio increases, there will be an increase in the power that is held by the firm’s
management and a concomitant decrease in power held by the shareholders. This will lead to a
greater need to monitor managers and result in an increase of agency costs. In our stylized
model, we assume that the agency costs are increasing in excess-shares at an increasing rate.
From a practical point of view, this function makes intuitive sense. Very low levels of excess-
ratio (excess-ratio less than one) does not grant much power to managers. Such levels would
only allow managers to implement small seasoned equity issues, engage in small stock mergers,
or stock dividends. Even moderate levels of excess-ratio would prevent managers from
engaging in some takeover strategies that require higher levels of excess-shares. It is only the
very highest levels of excess-ratio that require shareholders to more closely monitor
management.
The second cost related to the excess-ratio is what we term transaction costs. These costs
can take several forms and are decreasing in excess-ratio at a decreasing rate. First, they include
the direct costs related to the process of increasing the excess-ratio. That is, if a firm has a low
level of excess-shares and wishes to engage in some corporate activity that requires additional
34
shares, the firm must first obtain permission from the shareholders (in practice, this is sometimes
done at a special meeting of the shareholders called expressly for the purpose of increasing the
level of authorized shares). A second cost that we group under the ‘transaction cost’ category is
the potential that the firm will forgo a particular activity because it does not have sufficient
excess authorized shares. An example of which would be a positive NPV project that may only
be available for a limited time, or one in which a competitor may be able to begin more quickly
because they have sufficient excess authorized shares or other slack resources (e.g. available debt
capacity). For example, a stock-based merger could be one such project.
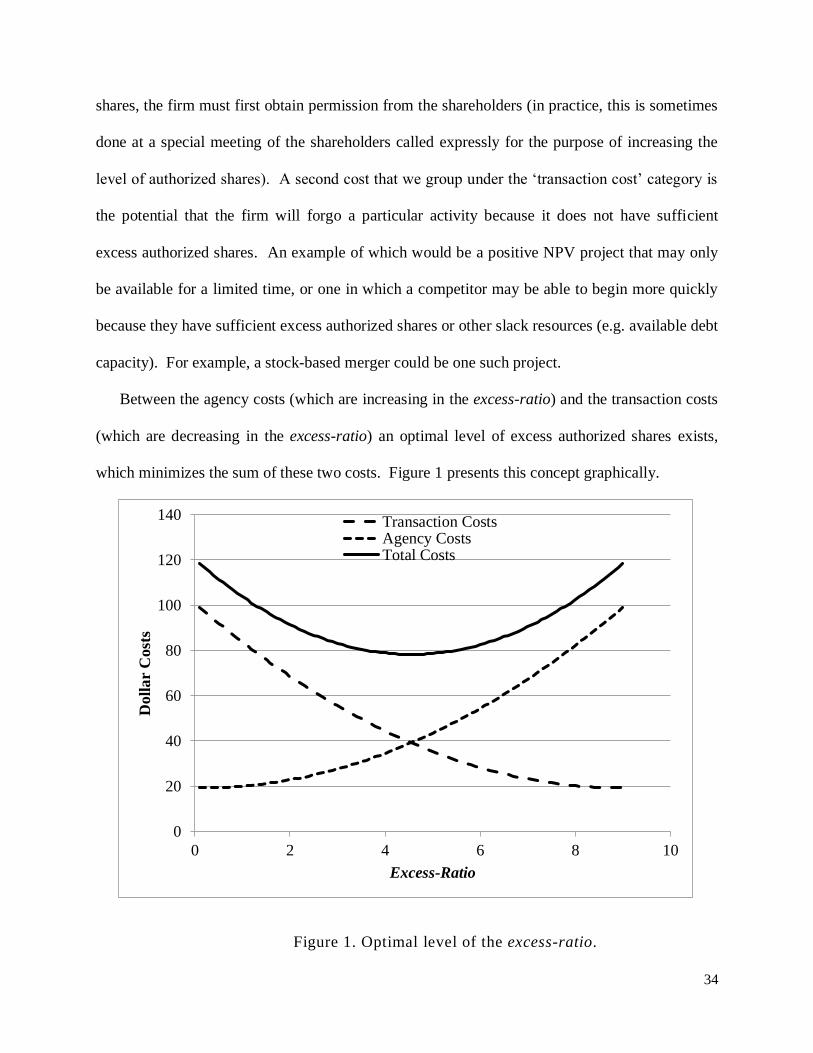
Between the agency costs (which are increasing in the excess-ratio) and the transaction costs
(which are decreasing in the excess-ratio) an optimal level of excess authorized shares exists,
which minimizes the sum of these two costs. Figure 1 presents this concept graphically.
F i g u r e 1Figure 1. Optimal level of the excess-ratio.
0
20
40
60
80
100
120
140
0 2 4 6 8 10
Doll
ar
Cost
s
Excess-Ratio
Transaction CostsAgency CostsTotal Costs
35
This trade-off between agency costs and transaction costs clearly does not capture the
entirety of the actions related to the decision to split a firm’s shares. However, at the margin it
may play an important role. Further, the firms in our sample, namely firms that have enjoyed a
run-up in share price, may not face the same type of agency costs related to the excess-ratio that
non-splitting firms might face. In fact, the shareholders of splitting firms may be much less
concerned by agency costs (which may be an irrational response to the current success of the
firm), when their managers have been successful in increasing the value of the firm. However,
for our purposes this will bias against finding a result in our empirical analysis.
36
VI. References
Anderson, R., Reeb, D.M., 2003. Founding family ownership and firm performance: evidence
from the S&P 500. J. Financ. 58, 1301–1329.
Ang, J., Cole, R., Lin, J., 1999. Agency costs and ownership structure. J. Financ. 55, 81–106.
Asquith, P., Healy, P., Palepu, K., 1989. Earnings and stock splits. Account Rev. 54, 387–403.
Barker, C.A., 1956. Effective stock splits. Harvard Bus. Rev. 34,101–106.
Becht, M., Polo, A., Rossi, S. 2014. Does Mandatory Shareholder Voting Prevent Bad
Acquisitions?. European Corporate Governance Institute (ECGI)-Finance Working Paper,
(422).
Bhagat, S., Brickley, J. A., Lease, R. C., 1986. The authorization of additional common stock: an
empirical investigation. Financ. Manage. 15, 45–53.
Brennan, M. J., Copeland, T. E., 1988. Stock splits, stock prices, and transaction costs. J. Financ.
Econ. 22, 83–101.
Carter, M.E., Lynch, L.J., Tuna, A.I., 2007. The role of accounting in the design of CEO equity
compensation, Account Rev. 82, 327–358.
Desai, H., Jain, P. C., 1997. Long-run common stock returns following stock splits and reverse
splits. J. Bus. 70, 409–433.
Devos, E., Elliott, W. B., Songur, H., 2015, Top-up Options and Tender Offers. Working paper.
Easley, D., O’Hara, M., Saar, G., 2001. How stock splits affect trading: a microstructure
approach. J. Financ. Quant. Anal. 36, 25–51.
Fama, E.F., Fisher, L., Jensen, M., Roll, R., 1969. The adjustment of stock prices to new
information. Int. Econ. Rev.10, 1–21.
Ganor, M., 2011. The power to issue stock. Wake Forest Law Review 46, 701–743.
Grinblatt, M., Masulis, R., Titman, S., 1984. The valuation effects of stock splits and stock
dividends. J. Financ. Econ. 13, 461–490.
Gompers, P. A., Ishii, J. L., Metrick, A., 2003. Corporate Governance and Equity Prices. Q. J.
Econ. 118-1, 1007–1055.
Hadlock, C., Pierce, J., 2010. New Evidence on Measuring Financial Constraints: Moving
Beyond the KZ Index. Rev. Financ. Stud. 23, 1909–1940.
37
Hanks Jr., J. J., 1995, Removing the Limits on Authorized Stock. Wash. U. L. Q. 73, 479-495.
Harford, J. 1999. Corporate Cash Reserves and Acquisitions. J. Financ. 54, 1969–97.
Hsieh, J., Wang, Q. 2008. Shareholder voting rights in mergers and acquisitions. Georgia
Institute of Technology working paper.
Ikenberry, D. L., Ramnath, S., 2002. Underreaction to self-selected news events: The case of
stock splits. Rev. Financ. Stud. 15, 489–526.
Ikenberry, D. L., Ranine, G., Stice, E. K., 1996. What do stock splits really signal? J. Financ.
Quant. Anal. 31, 357–375.
Jensen, M.C., 1986. Agency costs of free-cash-flow, corporate finance, and takeovers. Am.
Econ. Rev. 76, 323–329.
Jensen, M.J., Meckling, W.R., 1976. Theory of the firm: Managerial behavior, agency cost, and
ownership structure J. Financ. Econ. 3, 305–360.
Kaplan, S. N., Zingales, L., 1997. Do Financial Constraints Explain Why Investment Is
Correlated with Cash Flow? Q. J. Econ.112:169–216.
Kim, C. S., Mauer, D., Sherman, A., 1998. The Determinants of Corporate Liquidity: Theory and
Evidence. J. Financ. Quant. Anal. 33, 335–59.
Lamont, O., Polk, C., Saa-Requejo, J., 2001. Financial Constraints and Stock Returns. Rev.
Financ. Stud. 14, 529–554.
Lamoureux, C., Poon, P., 1987. The Market Reaction to Stock Splits. J. Financ. 42, 1347–1370.
Lin, J. C., Singh, A. K., Yu, W., 2009. Stock splits, trading continuity, and the cost of equity
capital. J. Financ. Econ. 93-3, 474–489.
Maug, E., Rydqvist, K., 2001. What is the Function of the Shareholder Meeting? Evidence from
the U.S. Proxy Voting Process. Working Paper. Humboldt University and Norwegian School
of Management.
McNichols, M., Dravid, A., 1990. Stock dividends, stock splits, and signaling. J. Financ. 45,
857–879.
Minnick, K., Raman, K. 2014. Why are Stock Splits Declining? Financ. Manage. 43, 29-60.
Nayak, S., Prabhala N. R., 2001. Disentangling the dividend information in splits: A
decomposition using conditional event-study methods. Rev. Financ. Stud. 14, 1083–1116.
38
Opler, T., Pinkowitz, L., Stulz, R., Williamson, R., 1999. The Determinants and Implications of
Corporate Cash Holdings. J. Financ. Econ. 52, 3–46.
Singh, M., Davidson III, W.N., 2003. Agency costs, ownership structure and corporate
governance mechanisms. J. Bank. Financ. 27, 793 – 816.
Smith, R., L., 1987. The choice of issuance procedure and the cost of competitive and negotiated
underwriting: An examination of the impact of Rule 50. J. Financ. 42, 703–720.
White, H., 1980. A heteroskedasticity-consistent covariance matrix estimator and a direct test for
heteroscedasticity. Econometrica 48, 817–838.
Whited, T., Wu, G., 2006. Financial Constraints Risk. Rev. Financ. Stud. 19, 531–559.
Yermack, D. 2010. Shareholder voting and corporate governance. Annu. Rev. Financ. Econ., 2,
103-125.
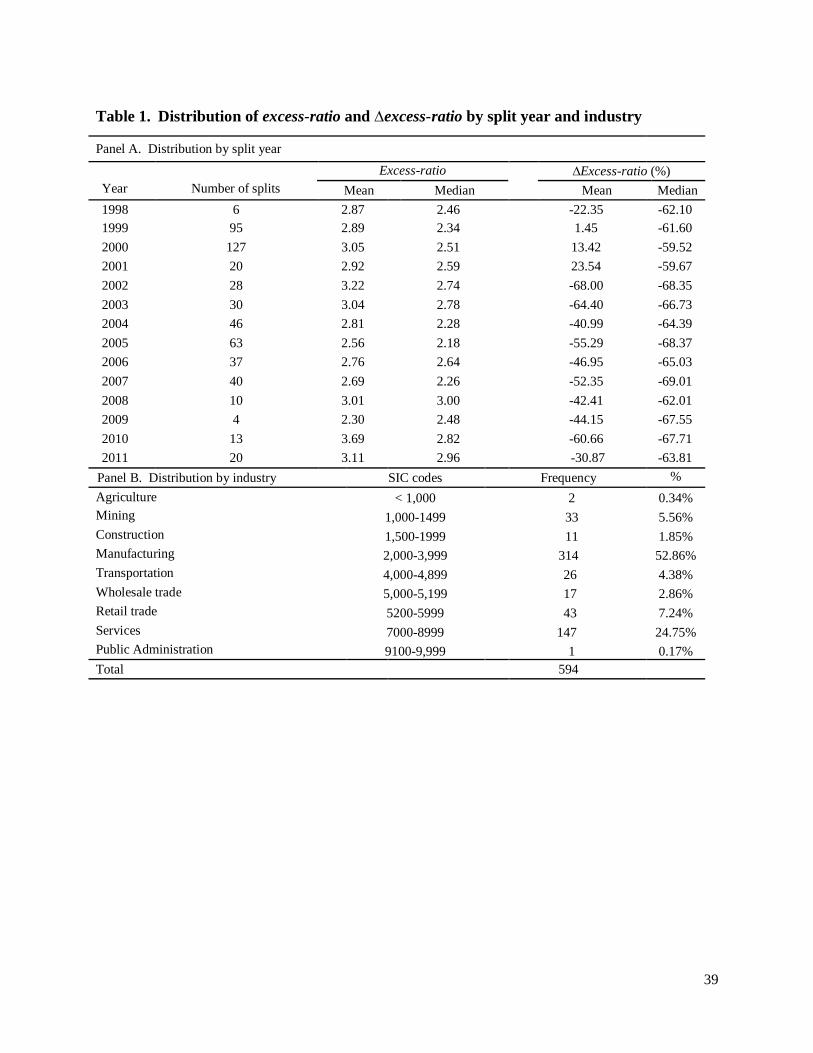
39
Table 1. Distribution of excess-ratio and ∆excess-ratio by split year and industry
Panel A. Distribution by split year
Year
Number of splits
Excess-ratio ∆Excess-ratio (%)
Mean Median Mean Median
1998 6 2.87 2.46 -22.35 -62.10
1999 95 2.89 2.34 1.45 -61.60
2000 127 3.05 2.51 13.42 -59.52
2001 20 2.92 2.59 23.54 -59.67
2002 28 3.22 2.74 -68.00 -68.35
2003 30 3.04 2.78 -64.40 -66.73
2004 46 2.81 2.28 -40.99 -64.39
2005 63 2.56 2.18 -55.29 -68.37
2006 37 2.76 2.64 -46.95 -65.03
2007 40 2.69 2.26 -52.35 -69.01
2008 10 3.01 3.00 -42.41 -62.01
2009 4 2.30 2.48 -44.15 -67.55
2010 13 3.69 2.82 -60.66 -67.71
2011 20 3.11 2.96 -30.87 -63.81
Panel B. Distribution by industry SIC codes Frequency %
Count Agriculture < 1,000 2 0.34%
Mining 1,000-1499 33 5.56%
Construction 1,500-1999 11 1.85%
Manufacturing 2,000-3,999 314 52.86%
Transportation 4,000-4,899 26 4.38%
Wholesale trade 5,000-5,199 17 2.86%
Retail trade 5200-5999 43 7.24%
Services 7000-8999 147 24.75%
Public Administration 9100-9,999 1 0.17%
Total 594
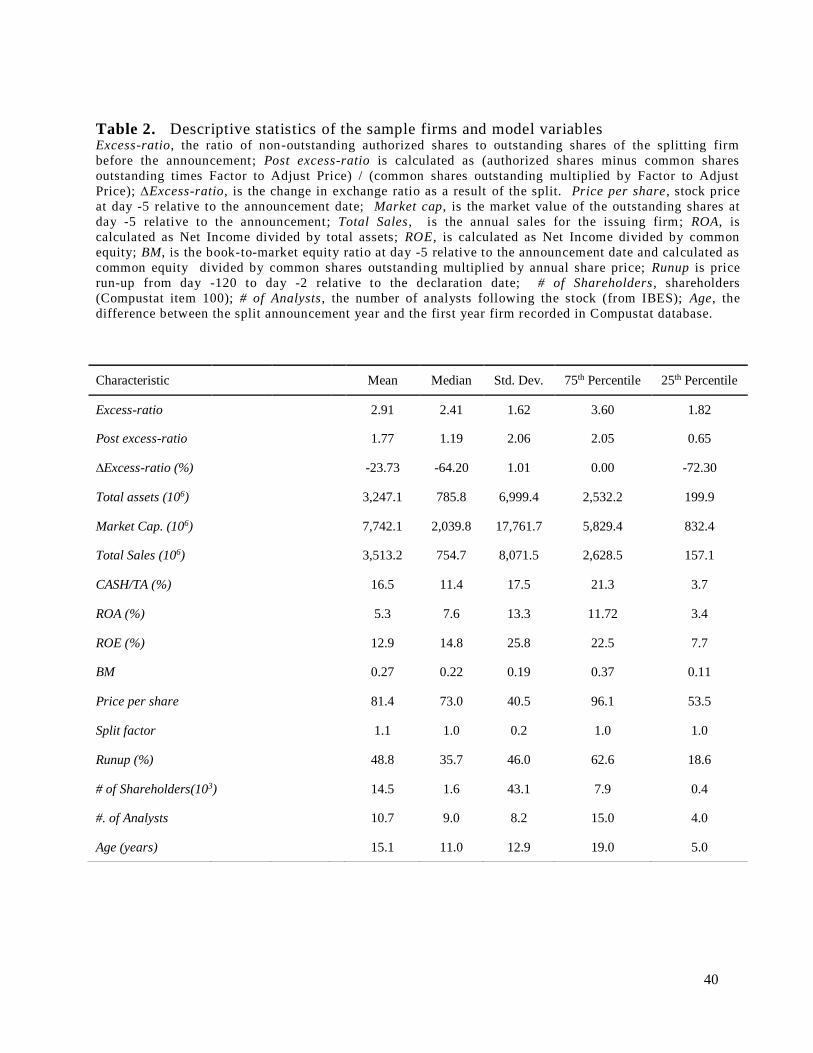
40
Table 2. Descriptive statistics of the sample firms and model variables Excess-ratio, the ratio of non-outstanding authorized shares to outstanding shares of the splitting firm
before the announcement; Post excess-ratio is calculated as (authorized shares minus common shares
outstanding times Factor to Adjust Price) / (common shares outstanding multiplied by Factor to Adjust
Price); ∆Excess-ratio, is the change in exchange ratio as a result of the split. Price per share, stock price
at day -5 relative to the announcement date; Market cap, is the market value of the outstanding shares at
day -5 relative to the announcement; Total Sales, is the annual sales for the issuing firm; ROA, is
calculated as Net Income divided by total assets; ROE, is calculated as Net Income divided by common
equity; BM, is the book-to-market equity ratio at day -5 relative to the announcement date and calculated as
common equity divided by common shares outstanding multiplied by annual share price; Runup is price
run-up from day -120 to day -2 relative to the declaration date; # of Shareholders , shareholders
(Compustat item 100); # of Analysts, the number of analysts following the stock (from IBES); Age, the
difference between the split announcement year and the first year firm recorded in Compustat database.
Characteristic
Mean Median Std. Dev. 75th Percentile 25th Percentile
Excess-ratio 2.91 2.41 1.62 3.60 1.82
Post excess-ratio 1.77 1.19 2.06 2.05 0.65
∆Excess-ratio (%) -23.73 -64.20 1.01 0.00 -72.30
Total assets (106) 3,247.1 785.8 6,999.4 2,532.2 199.9
Market Cap. (106) 7,742.1 2,039.8 17,761.7 5,829.4 832.4
Total Sales (106) 3,513.2 754.7 8,071.5 2,628.5 157.1
CASH/TA (%) 16.5 11.4 17.5 21.3 3.7
ROA (%) 5.3 7.6 13.3 11.72 3.4
ROE (%) 12.9 14.8 25.8 22.5 7.7
BM 0.27 0.22 0.19 0.37 0.11
Price per share 81.4 73.0 40.5 96.1 53.5
Split factor 1.1 1.0 0.2 1.0 1.0
Runup (%) 48.8 35.7 46.0 62.6 18.6
# of Shareholders(103) 14.5 1.6 43.1 7.9 0.4
#. of Analysts 10.7 9.0 8.2 15.0 4.0
Age (years) 15.1 11.0 12.9 19.0 5.0
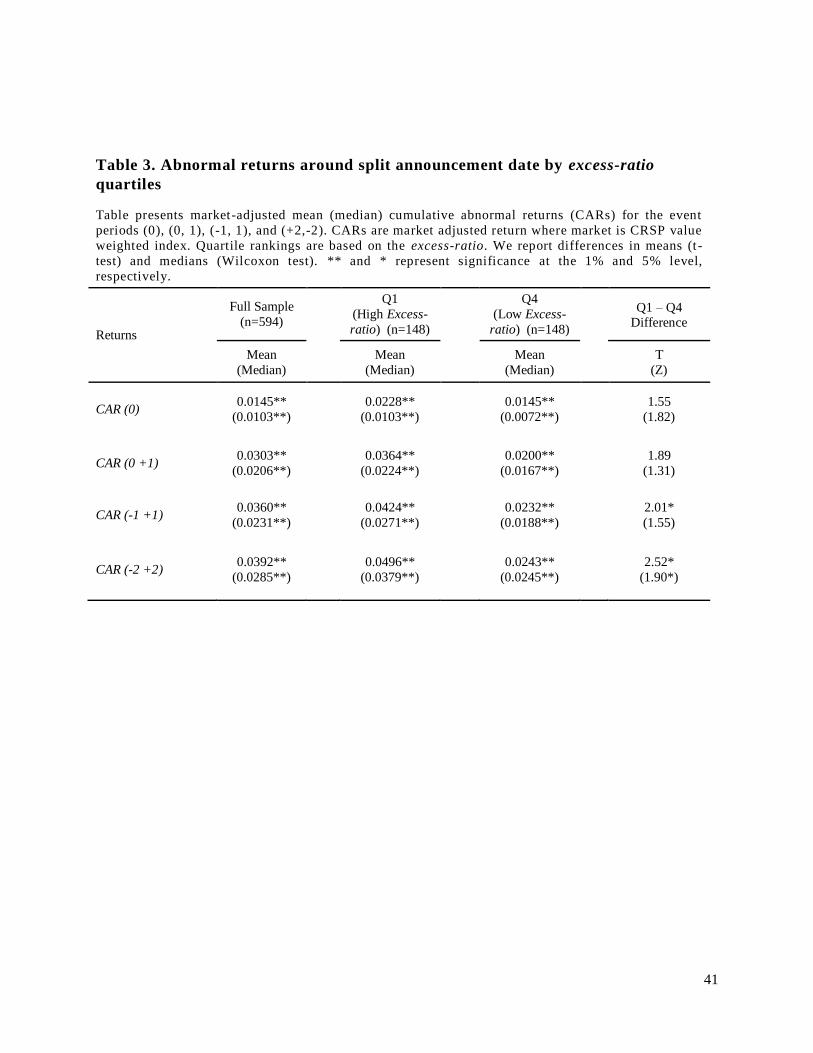
41
Table 3. Abnormal returns around split announcement date by excess-ratio
quartiles
Table presents market-adjusted mean (median) cumulative abnormal returns (CARs) for the event
periods (0), (0, 1), (-1, 1), and (+2,-2). CARs are market adjusted return where market is CRSP value
weighted index. Quartile rankings are based on the excess-ratio. We report differences in means (t -
test) and medians (Wilcoxon test). ** and * represent significance at the 1% and 5% level,
respectively.
Returns
Full Sample
(n=594)
Q1
(High Excess-
ratio) (n=148)
Q4
(Low Excess-
ratio) (n=148)
Q1 – Q4 Difference
Mean
(Median)
Mean
(Median)
Mean
(Median)
T
(Z)
CAR (0) 0.0145**
(0.0103**)
0.0228**
(0.0103**)
0.0145**
(0.0072**)
1.55
(1.82)
CAR (0 +1) 0.0303**
(0.0206**)
0.0364**
(0.0224**)
0.0200**
(0.0167**)
1.89
(1.31)
CAR (-1 +1) 0.0360**
(0.0231**)
0.0424**
(0.0271**)
0.0232**
(0.0188**)
2.01*
(1.55)
CAR (-2 +2) 0.0392**
(0.0285**)
0.0496**
(0.0379**)
0.0243**
(0.0245**)
2.52*
(1.90*)
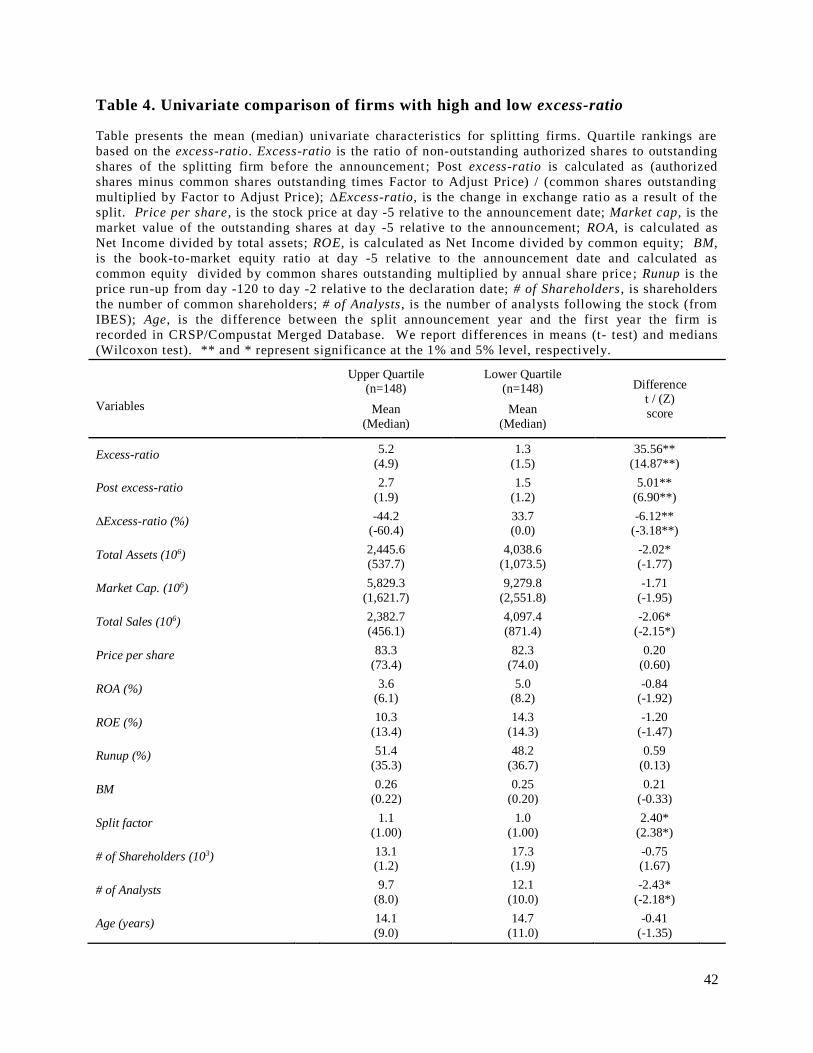
42
Table 4. Univariate comparison of firms with high and low excess-ratio
Table presents the mean (median) univariate characteristics for splitting firms. Quartile rankings are
based on the excess-ratio. Excess-ratio is the ratio of non-outstanding authorized shares to outstanding
shares of the splitting firm before the announcement ; Post excess-ratio is calculated as (authorized
shares minus common shares outstanding times Factor to Adjust Price) / (common shares outstanding
multiplied by Factor to Adjust Price); ∆Excess-ratio, is the change in exchange ratio as a result of the
split. Price per share, is the stock price at day -5 relative to the announcement date; Market cap, is the
market value of the outstanding shares at day -5 relative to the announcement; ROA, is calculated as
Net Income divided by total assets; ROE, is calculated as Net Income divided by common equity; BM,
is the book-to-market equity ratio at day -5 relative to the announcement date and calculated as
common equity divided by common shares outstanding multiplied by annual share price ; Runup is the
price run-up from day -120 to day -2 relative to the declaration date; # of Shareholders , is shareholders
the number of common shareholders; # of Analysts , is the number of analysts following the stock (from
IBES); Age, is the difference between the split announcement year and the first year the firm is
recorded in CRSP/Compustat Merged Database. We report differences in means (t- test) and medians
(Wilcoxon test). ** and * represent significance at the 1% and 5% level, respectively.
Variables
Upper Quartile (n=148)
Lower Quartile (n=148) Difference
t / (Z)
score Mean
(Median)
Mean
(Median)
Excess-ratio 5.2
(4.9)
1.3
(1.5)
35.56**
(14.87**)
Post excess-ratio 2.7
(1.9)
1.5
(1.2)
5.01**
(6.90**)
∆Excess-ratio (%) -44.2
(-60.4) 33.7 (0.0)
-6.12** (-3.18**)
Total Assets (106) 2,445.6
(537.7)
4,038.6
(1,073.5)
-2.02*
(-1.77)
Market Cap. (106) 5,829.3
(1,621.7)
9,279.8
(2,551.8)
-1.71
(-1.95)
Total Sales (106)
2,382.7
(456.1)
4,097.4
(871.4)
-2.06*
(-2.15*)
Price per share 83.3
(73.4)
82.3
(74.0)
0.20
(0.60)
ROA (%) 3.6
(6.1) 5.0
(8.2) -0.84
(-1.92)
ROE (%) 10.3
(13.4)
14.3
(14.3)
-1.20
(-1.47)
Runup (%) 51.4
(35.3)
48.2
(36.7)
0.59
(0.13)
BM 0.26
(0.22)
0.25
(0.20)
0.21
(-0.33)
Split factor 1.1
(1.00)
1.0
(1.00)
2.40*
(2.38*)
# of Shareholders (103)
13.1 (1.2)
17.3 (1.9)
-0.75 (1.67)
# of Analysts
9.7
(8.0)
12.1
(10.0)
-2.43*
(-2.18*)
Age (years)
14.1
(9.0)
14.7
(11.0)
-0.41
(-1.35)
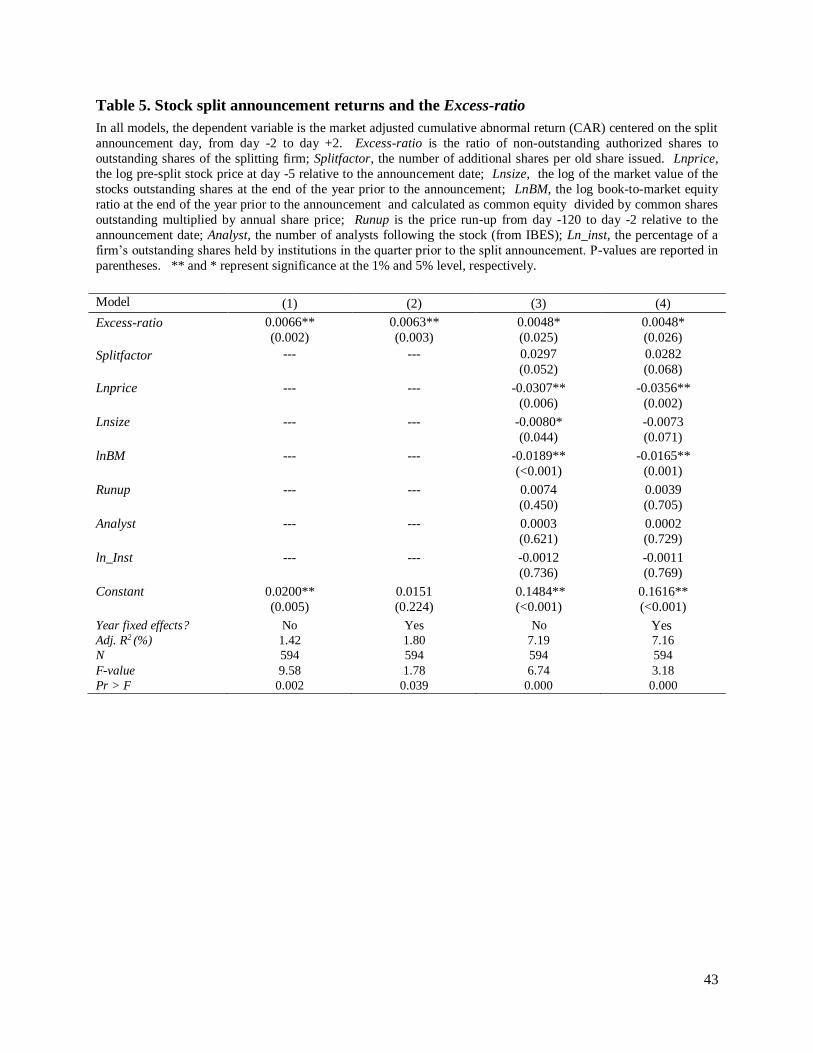
43
Table 5. Stock split announcement returns and the Excess-ratio
In all models, the dependent variable is the market adjusted cumulative abnormal return (CAR) centered on the split
announcement day, from day -2 to day +2. Excess-ratio is the ratio of non-outstanding authorized shares to
outstanding shares of the splitting firm; Splitfactor, the number of additional shares per old share issued. Lnprice,
the log pre-split stock price at day -5 relative to the announcement date; Lnsize, the log of the market value of the
stocks outstanding shares at the end of the year prior to the announcement; LnBM, the log book-to-market equity
ratio at the end of the year prior to the announcement and calculated as common equity divided by common shares
outstanding multiplied by annual share price; Runup is the price run-up from day -120 to day -2 relative to the
announcement date; Analyst, the number of analysts following the stock (from IBES); Ln_inst, the percentage of a
firm’s outstanding shares held by institutions in the quarter prior to the split announcement. P-values are reported in
parentheses. ** and * represent significance at the 1% and 5% level, respectively.
Model (1) (2) (3) (4)
Excess-ratio 0.0066**
(0.002)
0.0063**
(0.003)
0.0048*
(0.025)
0.0048*
(0.026)
Splitfactor --- --- 0.0297
(0.052)
0.0282
(0.068)
Lnprice --- --- -0.0307**
(0.006)
-0.0356**
(0.002)
Lnsize --- --- -0.0080*
(0.044)
-0.0073
(0.071)
lnBM --- --- -0.0189**
(<0.001)
-0.0165**
(0.001)
Runup --- --- 0.0074
(0.450)
0.0039
(0.705)
Analyst --- --- 0.0003
(0.621)
0.0002
(0.729)
ln_Inst --- --- -0.0012
(0.736)
-0.0011
(0.769)
Constant 0.0200**
(0.005)
0.0151
(0.224)
0.1484**
(<0.001)
0.1616**
(<0.001)
Year fixed effects? No Yes No Yes
Adj. R2 (%) 1.42 1.80 7.19 7.16
N 594 594 594 594
F-value 9.58 1.78 6.74 3.18
Pr > F
0.002
0.039 0.000 0.000
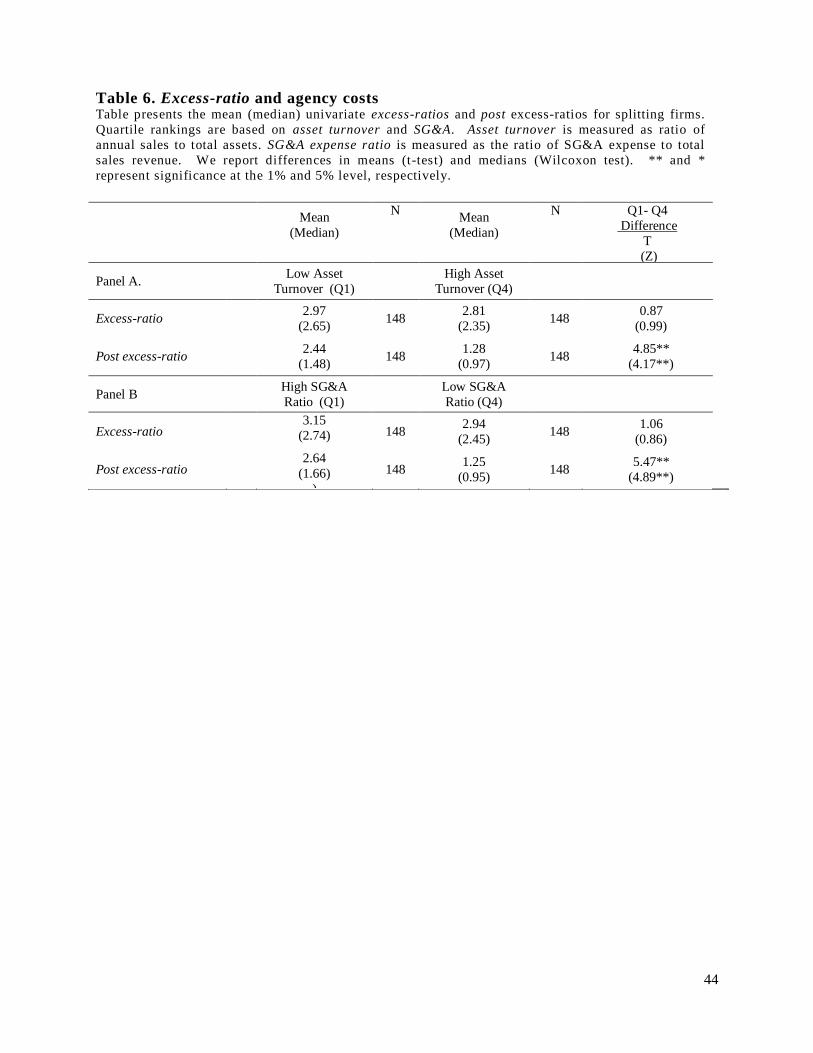
44
Table 6. Excess-ratio and agency costs Table presents the mean (median) univariate excess-ratios and post excess-ratios for splitting firms.
Quartile rankings are based on asset turnover and SG&A. Asset turnover is measured as ratio of
annual sales to total assets. SG&A expense ratio is measured as the ratio of SG&A expense to total
sales revenue. We report differences in means (t-test) and medians (Wilcoxon test). ** and *
represent significance at the 1% and 5% level, respectively.
Mean
(Median)
N
Mean
(Median)
N
Q1- Q4
Difference
T
(Z)
Panel A. Low Asset
Turnover (Q1)
High Asset
Turnover (Q4)
Excess-ratio
2.97
(2.65) 148
2.81
(2.35) 148
0.87
(0.99)
Post excess-ratio
2.44
(1.48) 148
1.28
(0.97) 148
4.85**
(4.17**)
Panel B
High SG&A
Ratio (Q1)
Low SG&A
Ratio (Q4)
Excess-ratio
3.15
(2.74)
)
148 2.94
(2.45) 148
1.06
(0.86)
Post excess-ratio
2.64
(1.66)
)
148 1.25
(0.95) 148
5.47**
(4.89**)
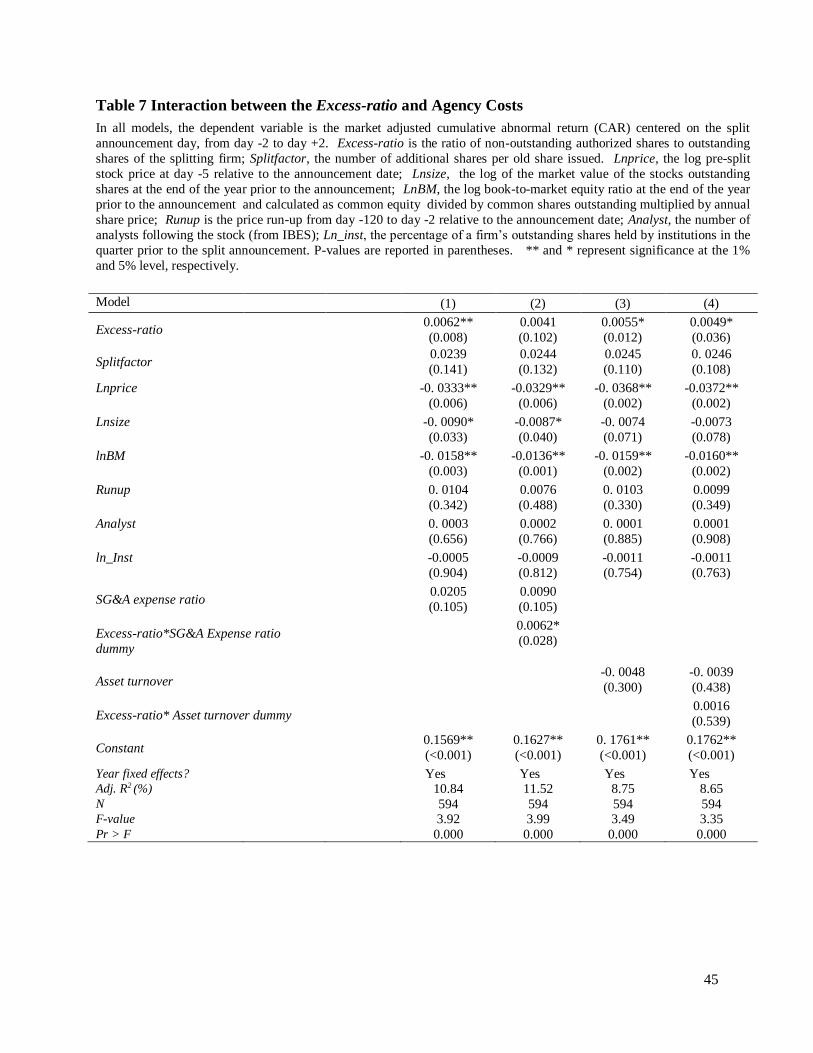
45
Table 7 Interaction between the Excess-ratio and Agency Costs
In all models, the dependent variable is the market adjusted cumulative abnormal return (CAR) centered on the split
announcement day, from day -2 to day +2. Excess-ratio is the ratio of non-outstanding authorized shares to outstanding
shares of the splitting firm; Splitfactor, the number of additional shares per old share issued. Lnprice, the log pre-split
stock price at day -5 relative to the announcement date; Lnsize, the log of the market value of the stocks outstanding
shares at the end of the year prior to the announcement; LnBM, the log book-to-market equity ratio at the end of the year
prior to the announcement and calculated as common equity divided by common shares outstanding multiplied by annual
share price; Runup is the price run-up from day -120 to day -2 relative to the announcement date; Analyst, the number of
analysts following the stock (from IBES); Ln_inst, the percentage of a firm’s outstanding shares held by institutions in the
quarter prior to the split announcement. P-values are reported in parentheses. ** and * represent significance at the 1%
and 5% level, respectively.
Model (1) (2) (3) (4)
Excess-ratio 0.0062**
(0.008)
0.0041
(0.102)
0.0055*
(0.012)
0.0049*
(0.036)
Splitfactor 0.0239
(0.141)
0.0244
(0.132)
0.0245
(0.110)
0. 0246
(0.108)
Lnprice -0. 0333**
(0.006)
-0.0329**
(0.006)
-0. 0368**
(0.002)
-0.0372**
(0.002)
Lnsize -0. 0090*
(0.033)
-0.0087*
(0.040)
-0. 0074
(0.071)
-0.0073
(0.078)
lnBM -0. 0158**
(0.003)
-0.0136**
(0.001)
-0. 0159**
(0.002)
-0.0160**
(0.002)
Runup 0. 0104
(0.342)
0.0076
(0.488)
0. 0103
(0.330)
0.0099
(0.349)
Analyst 0. 0003
(0.656)
0.0002
(0.766)
0. 0001
(0.885)
0.0001
(0.908)
ln_Inst -0.0005
(0.904)
-0.0009
(0.812)
-0.0011
(0.754)
-0.0011
(0.763)
SG&A expense ratio
0.0205
(0.105)
0.0090
(0.105)
Excess-ratio*SG&A Expense ratio
dummy
0.0062*
(0.028)
Asset turnover -0. 0048
(0.300)
-0. 0039
(0.438)
Excess-ratio* Asset turnover dummy
0.0016
(0.539)
Constant
0.1569**
(<0.001)
0.1627**
(<0.001)
0. 1761**
(<0.001)
0.1762**
(<0.001)
Year fixed effects? Yes Yes Yes Yes Adj. R2 (%) 10.84 11.52 8.75 8.65 N 594 594 594 594 F-value 3.92 3.99 3.49 3.35 Pr > F
0.000 0.000 0.000 0.000
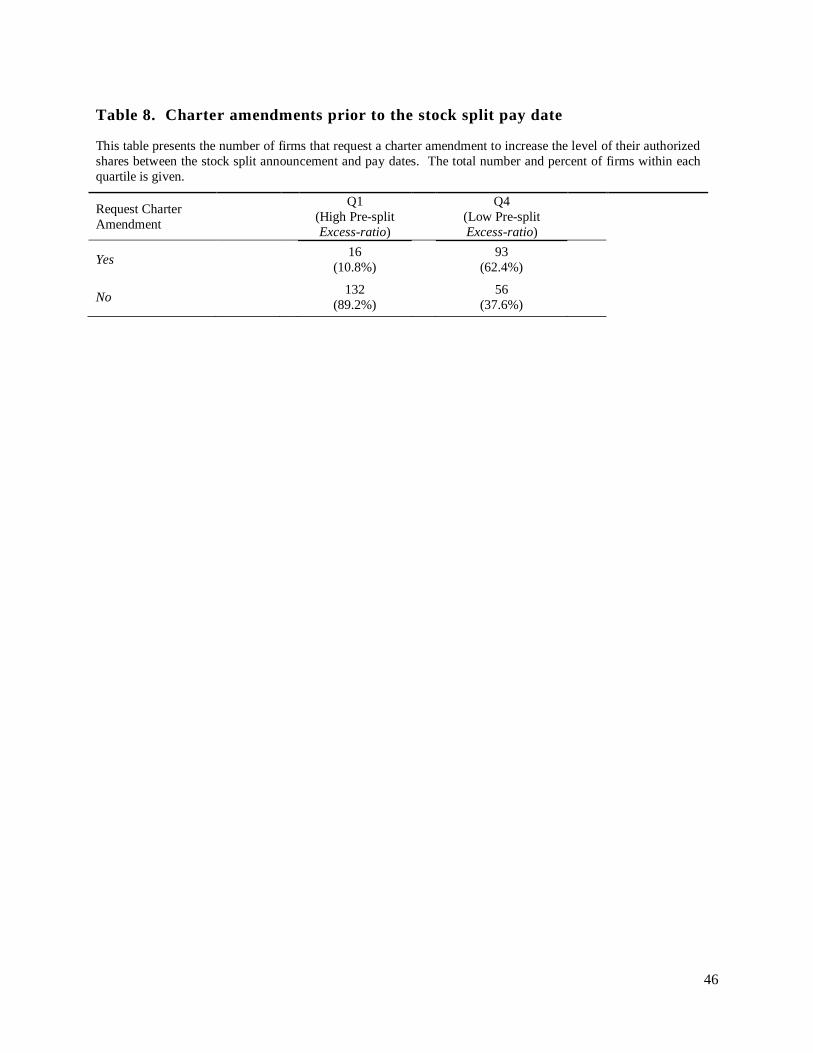
46
Table 8. Charter amendments prior to the stock split pay date
This table presents the number of firms that request a charter amendment to increase the level of their authorized
shares between the stock split announcement and pay dates. The total number and percent of firms within each
quartile is given.
Request Charter
Amendment
Q1
(High Pre-split
Excess-ratio)
Q4
(Low Pre-split
Excess-ratio)
Yes 16
(10.8%)
93
(62.4%)
No 132
(89.2%)
56
(37.6%)
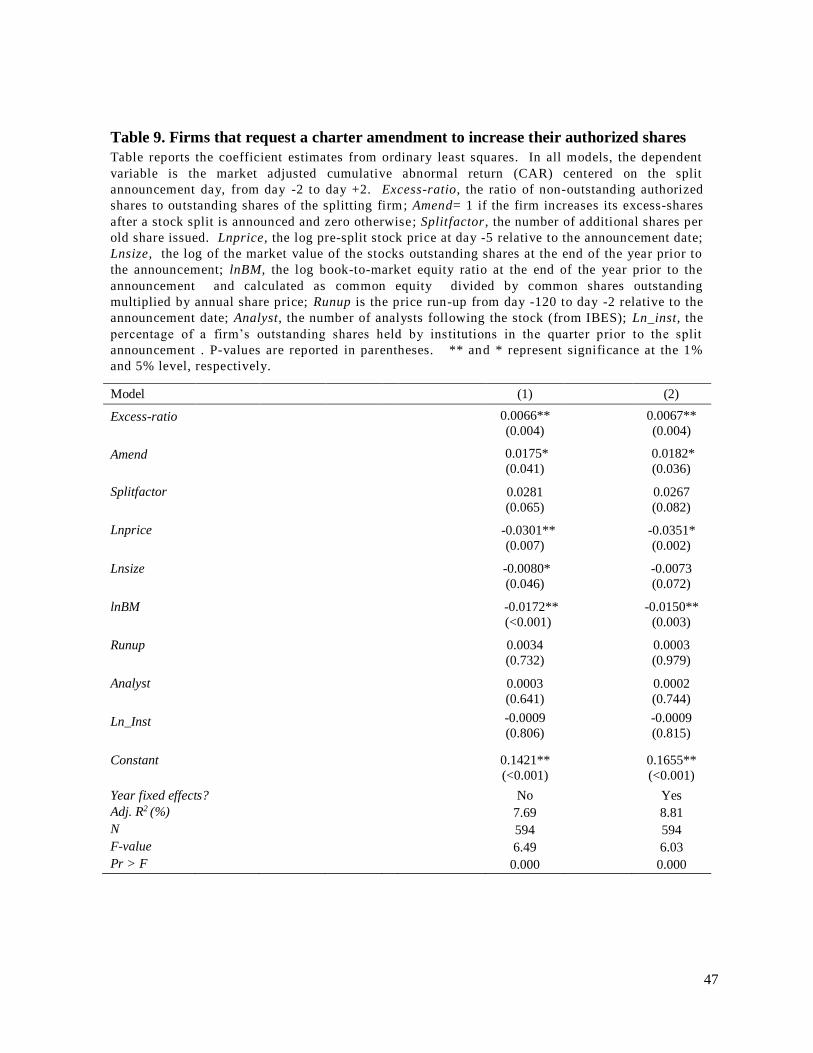
47
Table 9. Firms that request a charter amendment to increase their authorized shares
Table reports the coefficient estimates from ordinary least squares. In all models, the dependent
variable is the market adjusted cumulative abnormal return (CAR) centered on the split
announcement day, from day -2 to day +2. Excess-ratio, the ratio of non-outstanding authorized
shares to outstanding shares of the splitting firm; Amend= 1 if the firm increases its excess-shares
after a stock split is announced and zero otherwise; Splitfactor, the number of additional shares per
old share issued. Lnprice, the log pre-split stock price at day -5 relative to the announcement date;
Lnsize, the log of the market value of the stocks outstanding shares at the end of the year prior to
the announcement; lnBM, the log book-to-market equity ratio at the end of the year prior to the
announcement and calculated as common equity divided by common shares outstanding
multiplied by annual share price; Runup is the price run-up from day -120 to day -2 relative to the
announcement date; Analyst, the number of analysts following the stock (from IBES); Ln_inst, the
percentage of a firm’s outstanding shares held by institutions in the quarter prior to the split
announcement . P-values are reported in parentheses. ** and * represent significance at the 1%
and 5% level, respectively.
Model (1) (2)
Excess-ratio
0.0066**
(0.004)
0.0067**
(0.004)
Amend
0.0175*
(0.041)
0.0182*
(0.036)
Splitfactor
0.0281
(0.065)
0.0267
(0.082)
Lnprice
-0.0301**
(0.007)
-0.0351*
(0.002)
Lnsize
-0.0080*
(0.046)
-0.0073
(0.072)
lnBM
-0.0172**
(<0.001)
-0.0150**
(0.003)
Runup
0.0034
(0.732)
0.0003
(0.979)
Analyst
0.0003
(0.641)
0.0002
(0.744)
Ln_Inst
-0.0009
(0.806)
-0.0009
(0.815)
Constant
0.1421**
(<0.001)
0.1655**
(<0.001)
Year fixed effects? No Yes
Adj. R2 (%) 7.69 8.81
N 594 594
F-value 6.49 6.03
Pr > F
0.000 0.000