Embed Size (px)
Citation preview

CLASS A, C, I AND S SHARES
ANNUAL REPORT AS OF NOVEMBER 30, 2019
THIS REPORT IS AUTHORIZED FOR DISTRIBUTION ONLY TO SHAREHOLDERS
AND TO OTHERS WHO HAVE RECEIVED A COPY OF THE PROSPECTUS.

Beginning on January 1, 2021, as permitted by regulations adopted by the Securities and Exchange Commission, paper copies of the Fund’s shareholder reports like this one will no longer be sent by mail, unless you specifically request paper copies of the reports. Instead, the reports will be made available on the Fund’s website www.saratogacap.com, and you will be notified by mail each time a report is posted and provided with a website link to access the report.
If you already elected to receive shareholder reports electronically, you will not be affected by this change and you need not take any action. You may elect to receive shareholder reports and other communications from the Fund electronically by contacting your financial intermediary (such as a broker-dealer or bank) or, if you are a direct investor, by following the instructions included with paper Fund documents that have been mailed to you.

TABLE OF CONTENTS Chairman’s Letter ................................................................................................ Page 1
Investment Review............................................................................................... Page 5
Schedules of Investments ..................................................................................... Page 18
Statements of Assets and Liabilities .................................................................... Page 37
Statements of Operations ..................................................................................... Page 38
Statements of Changes in Net Assets................................................................... Page 39
Financial Highlights ............................................................................................. Page 41
Notes to Financials ............................................................................................... Page 47
Report of Independent Registered Public Accounting Firm ................................ Page 59
Supplemental Information ................................................................................... Page 60
Privacy Notice ...................................................................................................... Page 64
TRUSTEES AND OFFICERS Bruce E. Ventimiglia ....................................................... Trustee, Chairman, President & CEO Patrick H. McCollough ................................................... Trustee Udo W. Koopmann ......................................................... Trustee Floyd E. Seal .................................................................... Trustee Stephen H. Hamrick ........................................................ Trustee Stephen Ventimiglia ........................................................ Vice President & Secretary Jonathan W. Ventimiglia................................................. Vice President, Assistant Secretary, Treasurer & Chief Financial Officer James S. Vitalie ............................................................... Vice President Emile Molineaux ............................................................. Chief Compliance Officer Rose Anne Casaburri ....................................................... Assistant Secretary Aaron J. Smith ................................................................. Assistant Treasurer Investment Manager Distributor Saratoga Capital Management, LLC Northern Lights Distributors, LLC 1616 N. Litchfield Rd., Suite 165 17605 Wright Street, Suite 2 Goodyear, Arizona 85395 Omaha, Nebraska 68130 Transfer & Shareholder Servicing Agent Custodian Gemini Fund Services, LLC BNY Mellon Corp. 17605 Wright Street, Suite 2 225 Liberty Street Omaha, Nebraska 68130 New York, New York 10286 Administrator & Fund Accounting Agent Custody Administrator Gemini Fund Services, LLC Gemini Fund Services, LLC 80 Arkay Drive, Suite 110 80 Arkay Drive, Suite 110 Hauppauge, New York 11788 Hauppauge, New York 11788

THE SARATOGA ADVANTAGE TRUST ANNUAL REPORT TO SHAREHOLDERS
January 2, 2020
Dear Shareholder:
We are pleased to provide you with this annual report on the investment strategies and performance of six of the portfolios in the Saratoga Advantage Trust (the “Trust”). This report covers the twelve months from December 1, 2018 through November 30, 2019.
We believe that successful investing requires discipline and patience. Try to stay focused on your long-term investment goals. Don’t let short-term stock and bond market fluctuations or investment manias change your long-term investment strategy.
ECONOMIC OVERVIEW
As measured by Real Gross Domestic Product (GDP), the value of the production of goods and services in the United States advanced by an annualized growth rate (AGR) of 2.1% during Q3 of 2019. This was an increase from the 2.0% AGR during Q2. The largest component of GDP is Personal Consumption Expenditures (PCE); over the intermediate term it has continued to grow at a moderate pace. This primary macroeconomic sector is critical to the general health of the GDP. At 41 quarters, the current economic expansion is the longest running in US history, featuring an AGR of 2.3%. The second longest US expansion, ended in Q4 2000, lasted for 39 quarters and had an average growth rate of 3.75%. Why such a slowdown in GDP growth? We note several important long-term developments. Generational slowdowns in population growth, disposable personal income and personal consumption expenditures seem to indicate that the 1990’s expansion was an outlier period within the broader GDP trend. It should be noted that negative population growth trends have exceeded the slowdown in disposable income and personal consumption expenditures, as well as GDP growth. Additional data suggests that population trends are at least partially causal, though productivity growth and income allocation also play a part. With inflation trends also moderating over a long period, it is likely that we need to make more disposable money and grow our population if consistent economic growth over 3% is to remain possible. At the December 11, 2019 Federal Reserve Open Market Committee (the Committee) meeting, the Committee released the following statement, in part: “Information received since the Federal Open Market Committee met in October indicates that the labor market remains strong and that economic activity has been rising at a moderate rate. Job gains have been solid, on average, in recent months, and the unemployment rate has remained low. Although household spending has been rising at a strong pace, business fixed investment and exports remain weak. On a 12 month basis, overall inflation and inflation for items other than food and energy are running below 2
1

percent… The Committee decided to maintain the target range for the federal funds rate at 1 1/2 to 1-3/4 percent. The Committee judges that the current stance of monetary policy is appropriate to support sustained expansion of economic activity, strong labor market conditions, and inflation near the Committee's symmetric 2 percent objective.” Monetary Policy: In the most recent FOMC statement, the Committee said that it will continue to monitor incoming information to fashion its economic outlook. Furthermore, it will monitor inflationary pressures and employment data to assess the appropriate path of the target range for the federal funds rate. The Fed has stopped draining their balance sheet and are once again adding to it. Our most recent data now suggests that the Fed has reached an accommodative stance. As of November 2019, the growth rates of two money supply measures we use throughout our proprietary economic research, M2 and MZM, have reversed their dramatic declines and are now up significantly from their lows and are in a solid positive trend. Currency in Circulation (CIC) is a main component of the Monetary Base. The CIC has stabilized and is up from its recent low, and it should start to increase as the Fed adds to its balance sheet. We feel that the Fed current policy stance is appropriate relative to current economic developments. Regarding the Fed Funds rate, we study the rate relative to both inflation and short-term/intermediate-term interest rates. Our research indicates that the current rate should be viewed as accommodative. Unless underlying economic data changes, we believe the Fed should move cautiously with its Fed Funds target rate range while allowing the money supply to get back to a normal growth rate. Interest Rates: Starting in 2016, the Fed Funds rate and most Treasury rates began increasing. In late-2018 a trend reversal saw declines in most of the rate array. Typically, when interest rates are increasing the yield curve declines, and when rates decline the yield curve advances; currently, the yield curve has started to increase in most of the array, but modestly. The monthly yield curve spread, as measured by the 10-year T-Note (10y TN) minus the 1-year T-Bill (1y TB), continued in a down trend to a cycle low of -0.14 in August 2019 and increased marginally in November to +0.24. We are pleased that the current yield spread levels are mostly positive. If the current business cycle gains a bit more traction, our productivity level index (Saratoga’s Economic Proficiency Model™) suggests the yield curve should continue to increase. Equity Valuations: As of December 31, 2019, the S&P 500 index sits at 3,230. Our proprietary valuation work uses both fundamental and technical analysis and provides justification for the S&P 500 at roughly 3,380 at the end of June 2020. The S&P 500 closed out the year with Q4 2019 earnings up marginally over +7% y-o-y (Q4 earnings are close to finalizing). Consensus estimates for the S&P 500 earnings for the second quarter of 2020 are near $147.35. We still believe the market is in fair-value range and should remain in this range over the intermediate term. To us, fair-value means the stock market should perform within the parameter of its historic mean. In order to create a range of equity market outcomes, we use a valuation tool which we refer to as our Proper PE Valuation™ tool. Among other things, this analysis provides us with a set of ranges above and below which we consider the S&P 500 overvalued or undervalued, respectively. Our primary valuation algorithm currently sets an appropriate S&P 500 PE in the range of 22.7 to 23.5. Additional analysis suggests an S&P 500 fair-value range of roughly 3,110 to 3,400. This algorithm is earnings, GDP and CPI dominant. The current levels and trends for earnings, GDP and CPI data indicate that we are likely to stay in fair-value range for the near-term, however we are watching corporate earnings growth closely, as that data has the potential to change valuation levels quickly.
2

Inflation: Inflation, as measured by the consumer price index (CPI), was up 2.05% y-o-y in November 2019, while the CPI-excluding-food-and-energy was up nearly 2.3% during the same period. These measures of inflation are hovering at the Fed’s symmetric 2% inflation objective. We believe inflation should remain restrained, keeping its growth rate near or below the Fed’s long-term objective over the intermediate term. Growth in the wage (total private, average weekly earnings of all employees) complex appears to have stalled. A near-term top looks to have been formed at roughly 3.6% in October 2019, with wage growth falling back to 2.3% as of December 2019. This provides CPI a likely relief and should keep the Fed accommodative until wage pressure is back in place. Most of the Producer Price complex has steadied or is falling more slowly than it had been. The Final Demand index has resumed its slower growth path and as of November 2019 it was 1.1%. Processed goods for intermediate demand and Unprocessed Goods are still negative y-o-y but are off their cycle lows. There is a great deal of slack on the cost-side of inflation. We currently see room for the Fed to reduce its control group of interest rates, with the demand for goods and the cost of goods looking to be well in balance.
COMPARING THE PORTFOLIOS’ PERFORMANCE TO BENCHMARKS
When reviewing the performance of the portfolios against their benchmarks, it is important to note that the Trust is designed to help investors to implement an asset allocation strategy to meet their individual needs as well as select individual investments within each asset category among the myriad of choices available. Each Saratoga portfolio was formed to represent an asset class, and each portfolio’s institutional money manager was selected based on their ability to manage money within that class.
Therefore, the Saratoga portfolios can help investors to properly implement their asset allocation decisions and keep their investments within the risk parameters that they establish with their investment consultants. Without the intended asset class consistency of the Saratoga portfolios, even the most carefully crafted allocation strategy could be negated. Furthermore, the benchmarks do not necessarily provide precise standards against which to measure the portfolios, in that the characteristics of the benchmarks can vary widely at different points in time from the Saratoga portfolios (e.g., characteristics such as: average market capitalizations, price-to-earnings and price-to-book ratios, bond quality ratings and maturities, etc.). In addition, the benchmarks can potentially have a survivor bias built into them (i.e., the performance of only funds that are still in existence may remain part of the benchmark’s performance while funds that do not exist anymore may be removed from the benchmark’s performance).
ELECTRONIC DELIVERY AVAILABLE
This report can be delivered to you electronically. Electronic delivery can help simplify your record keeping. With electronic delivery, you’ll receive an email with a link to your Saratoga Advantage Trust quarterly statement, daily confirmations and/or semi-annual and annual reports each time one is available. You have the ability to choose which items you want delivered electronically. Choose one item or all items. It’s up to you. Please call our Customer Service Department toll-free at 1-888-672-4839 for instructions on how to establish electronic delivery.
3

AUTOMATED ACCOUNT UPDATES
I am pleased to inform you that you can get automated updates on your investments in the Saratoga Advantage Trust 24 hours a day, every day, by calling toll-free 1-888-672-4839. For additional information about the Trust, please call your financial advisor, visit our website at www.saratogacap.com or call 1-800-807-FUND.
Finally, following you will find specific information on the investment strategy and performance of six of the Trust’s portfolios. Please speak with your financial advisor if you have any questions about your investment in the Saratoga Advantage Trust or your allocation of assets among the Trust’s portfolios.
We remain dedicated to serving your investment needs. Thank you for investing with us.
Best wishes,
Bruce E. Ventimiglia Chairman, President and Chief Executive Officer
Investors should consider the investment objectives, risks, charges and expenses of the Saratoga Funds carefully. This and other information about the Saratoga Funds is contained in your prospectus, which should be read carefully. To obtain an additional copy of the prospectus, please call (800) 807-FUND. Past performance is not indicative of future results. Investments in stocks, bonds and mutual funds are not guaranteed and the principal value and investment return can fluctuate. Consequently, investors may receive back less than invested.
The S&P 500 is an unmanaged, capitalization-weighted index. It is not possible to invest directly in the S&P 500.
The security holdings discussed may not be representative of the Funds’ current or future investments. Portfolio holdings are subject to change and should not be considered to be investment advice. Any statements not of a factual nature constitute opinions which are subject to change without notice. Information contained herein was obtained from recognized statistical services and other sources believed to be reliable and we therefore cannot make any representation as to its completeness or accuracy. The Funds of the Saratoga Advantage Trust are distributed by Northern Lights Distributors, LLC, member FINRA/SIPC. 5204-NLD-2/5/2020
4
INVESTMENT REVIEW
JAMES ALPHA EHS PORTFOLIO
Advised by: James Alpha Advisors, LLC, New York, New York
Objective: The Portfolio seeks attractive long-term risk-adjusted returns relative to traditional financial market indices.
Total Aggregate Return for the Periods Ended November 30, 2019
One Year: 11/30/18-11/30/19
Inception: 8/18/17 – 11/30/19*
Class A With Sales Charge 0.05% 1.97% Without Sales Charge 6.12% 4.64% Class C With Sales Charge 4.09% 3.73% Without Sales Charge 5.09% 3.73% Class I 6.12% 4.64% Class S
6.32% 4.73%
*Annualized performance for periods greater than one year. Performance data quoted above is historical. Past performance does not guarantee future results and current performance may be lower or higher than the performance data quoted. The investment return and principal value of an investment will fluctuate, so that shares when redeemed, may be worth more or less than their original cost. For more performance numbers current to the most recent month-end please call (800) 807-FUND. The total operating expense ratio as stated in the fee table to the Portfolio’s prospectus dated March 29, 2019, is 3.83%, 4.55%, 3.58%, for the A, C, and I Classes, respectively, and May 31, 2019 Supplement is 3.38% for class S. The Portfolio’s Manager has contractually agreed to waive its fees and/or absorb expenses (excluding certain expenses) of the Portfolio through March 31, 2020, to ensure the total net operating expense ratio does not exceed 1.74%, 2.49% and 1.49% for the A, C and I classes, respectively, and to ensure the total net operating expense ratio does not exceed 1.12% for Class S throughout March 31, 2021.
PORTFOLIO INVESTMENT STRATEGIES AND TECHNIQUES The Portfolio seeks to achieve its investment objective by attempting to outperform the returns of a variety of hedged equity investment strategies. A hedged equity investment strategy typically involves establishing both long and short positions in equity or equity-linked instruments. The Portfolio expects to gain exposure to asset classes primarily through exchange-traded products such as exchange-traded notes (“ETNs”), exchange-traded funds (“ETFs”) and mutual funds, although the Portfolio may invest directly in currencies, equities and fixed income securities. The Portfolio also expects to invest in derivative instruments to gain exposure to one or more asset classes, individual investments or investment strategies. In constructing the Portfolio’s investments, the Portfolio’s Manager employs proprietary techniques and models to evaluate the drivers of performance of private funds that utilize hedged equity strategies. The Manager then identifies investments that it believes have similar drivers of performance to attempt to produce returns that correlate with, but are not identical to, the returns of the private funds tracked by the Manager. The Manager then determines the appropriate percentage that each particular investment strategy should represent of the entire Portfolio and weights the exposure to that investment strategy accordingly. The private fund returns on which the Manager’s models are based are pulled from various sources and do not represent the returns of the entire private fund universe. The private funds’ returns tracked by the Manager, the factors driving those returns and the percentage weightings assigned by the Manager to each investment strategy are all expected to change over time.
PORTFOLIO ADVISER COMMENTARY The annual period was marked by rallies in risky asset classes with some US equity markets hitting all-time highs. The first quarter of 2019 was a welcomed turnaround for most asset classes after the correction and volatility spike in the fourth quarter of 2018. Global equity markets showed little sign of concern at the start of 2019, as the rally continued straight up. However, the bond market gave a dose of caution as a portion of the yield curve inverted for the first time since 2007. The rally in US equity markets continued through Q2, supported by improving economic data and investor sentiment about negotiations with China over trade tariffs. Some trends in the US economy diverged in the second half of the year from pressure of a slowing global economy, weaker than expected corporate earnings growth, and the US-China trade war. Additionally, there was a notable shift in the equity market, with the large cap sector outperforming the small cap sector and value stocks generally outperforming their growth counterparts. As investor risk appetite returned and the Federal Reserve cut rates, the interest-rate-sensitive global real estate sector rallied. Additionally, the broad commodity market rallied to start the year, but fizzled during the second half of the year. The US yield curve flattened dramatically in August, before reverting to end the period at nearly the same level it started the period. Overall, though, rates dropped. For the period, the Equity Hedge sector provided decent performance. Healthcare and technology managers within the sector outperformed. Energy-oriented and market neutral managers were the top laggards during the period, albeit their overall sector weight is small.
5

% of Company Net AssetsJames Alpha Structured Credit Value Portfolio - Class S 28.7%American Beacon Sound Point Floating Rate Income - Class Y 6.7%iShares Micro-Cap ETF 5.8%iShares Russell Mid-Cap Growth ETF 4.8%SPDR Bloomberg Barclays Convertible Securities ETF 3.4%iShares MSCI EAFE ETF 2.6%iShares Russell 1000 Growth ETF 2.6%Invesco China Small Cap ETF 2.3%Invesco S&P 500 Pure Value ETF 2.3%AlphaClone Alternative Alpha ETF 2.2%
*Based on total net assets as of November 30, 2019.
Excludes short-term investments.
INVESTMENT REVIEW
Portfolio Composition*
HFRI Equity Hedge (Total Index): Investment Managers who maintain positions both long and short in primarily equity and equity derivative securities. A wide variety of investmentprocesses can be employed to arrive at an investment decision, including both quantitative and fundamental techniques; strategies can be broadly diversified or narrowly focused on specificsectors and can range broadly in terms of levels of net exposure, leverage employed, holding period, concentrations of market capitalizations and valuation ranges of typical portfolios. EHmanagers would typically maintain at least 50% exposure to, and may in some cases be entirely invested in, equities, both long and short.
Past performance is not predictive of future performance. The returns shown do not reflect the deduction of taxes that a shareholder would pay on fund distributions or on the redemptions ofthe fund shares.
A HYPOTHETICAL COMPARISON OF THE GROWTH OF $10,000 INVESTED IN THEJAMES ALPHA EHS PORTFOLIO VS. BENCHMARKS
SIGNIFICANT AREAS OF INVESTMENTAS A PERCENTAGE OF NET ASSETS
Top 10 Portfolio Holdings*
Equity Funds, 18.9%
International Funds, 21.4%
Sector Funds, 17.7%
Other/Cash Equivalents, 4.3%
Preferred Fund, 1.0%
Bonds, 35.7%
Biotechnology, 1.0%
$10,455
$11,093 $11,093
$11,237
$9,200
$9,700
$10,200
$10,700
$11,200
$11,700
Class A With Load Class A Class I HFRI Equity Hedge (Total Index)
6

INVESTMENT REVIEW
JAMES ALPHA EVENT DRIVEN PORTFOLIO
Advised by: James Alpha Advisors, LLC, New York, New York
Objective: The Portfolio seeks attractive long-term risk-adjusted returns relative to traditional financial market indices.
Total Aggregate Return for the Periods Ended November 30, 2019
One Year: 11/30/18-11/30/19
Inception: 8/18/17 – 11/30/19*
Class A With Sales Charge 2.59% 1.96% Without Sales Charge 8.87% 4.64% Class C With Sales Charge 7.87% 4.64% Without Sales Charge 8.87% 4.64% Class I 8.87% 4.64% Class S 9.06%
4.81%
*Annualized performance for periods greater than one year. Performance data quoted above is historical. Past performance does not guarantee future results and current performance may be lower or higher than the performance data quoted. The investment return and principal value of an investment will fluctuate, so that shares when redeemed, may be worth more or less than their original cost. For more performance numbers current to the most recent month-end please call (800) 807-FUND. The total operating expense ratio as stated in the fee table to the Portfolio’s prospectus dated March 29, 2019, is 3.40%, 4.15% and 3.15% for the A, C and I Classes, respectively, and May 31, 2019 Supplement is 3.12% for class S. The Portfolio’s Manager has contractually agreed to waive its fees and/or absorb expenses (excluding certain expenses) of the Portfolio through March 31, 2020, to ensure the total net operating expense ratio does not exceed 1.74%, 2.49% and 1.49% for the A, C and I classes, respectively, and to ensure the total net operating expense ratio does not exceed 1.12% for Class S throughout March 31, 2021.
PORTFOLIO INVESTMENT STRATEGIES AND TECHNIQUES The Portfolio seeks to achieve its investment objective by attempting to outperform the returns of a variety of “event driven” investment strategies. Event driven investment strategies seek to profit from investing in securities of companies on the basis that a specific event or catalyst will affect future pricing. The Portfolio will seek to outperform the returns of event driven investment strategies by investing in a variety of asset classes, including currencies, global equities and global fixed income securities. The Portfolio expects to gain exposure to these asset classes primarily through exchange-traded products such as exchange-traded notes (“ETNs”), exchange-traded funds (“ETFs”) and mutual funds, although the Portfolio may invest directly in currencies, equities and fixed income securities. The Portfolio also expects to invest in derivative instruments to gain exposure to one or more asset classes, individual investments or investment strategies. In constructing the Portfolio’s investments, the Portfolio’s Manager employs proprietary techniques and models to evaluate the drivers of performance of private funds that utilize event driven strategies. The Manager then identifies investments that it believes have similar drivers of performance to attempt to produce returns that correlate with, but are not identical to, the returns of the private funds tracked by the Manager. The Manager then determines the appropriate percentage that each particular investment strategy should represent of the entire Portfolio and weights the exposure to that investment strategy accordingly. The private fund returns on which the Manager’s models are based are pulled from various sources and do not represent the returns of the entire private fund universe. The private funds’ returns tracked by the Manager, the factors driving those returns and the percentage weightings assigned by the Manager to each investment strategy are all expected to change over time. The Portfolio may invest up to 25% of its total assets in a wholly-owned and controlled Cayman Islands subsidiary (the “Subsidiary”) to gain exposure to certain commodity-linked investments such as commodity futures, options and swap contracts. The commodity investments will be focused in four sectors of the commodities market: energy, precious metals, industrial metals and agricultural/livestock. The Portfolio may hold investments with commodity exposure outside of the Subsidiary and, therefore it is possible the Portfolio’s exposure to commodities could exceed 25%.
PORTFOLIO ADVISER COMMENTARY The annual period was marked by rallies in risky asset classes with some US equity markets hitting all-time highs. The first quarter of 2019 was a welcomed turnaround for most asset classes after the correction and volatility spike in the fourth quarter of 2018. Global equity markets showed little sign of concern at the start of 2019, as the rally continued straight up. However, the bond market gave a dose of caution as a portion of the yield curve inverted for the first time since 2007. The rally in US equity markets continued through Q2, supported by improving economic data and investor sentiment about negotiations with China over trade tariffs. Some trends in the US economy diverged in the second half of the year from pressure of a slowing global economy, weaker than expected corporate earnings growth, and the US-China trade war. Additionally, there was a notable shift in the equity market, with the large cap sector outperforming the small cap sector and value stocks generally outperforming their growth counterparts. As investor risk appetite returned and the Federal Reserve cut rates, the interest-rate-sensitive global real estate sector rallied. Additionally, the broad commodity market rallied to start the year, but fizzled during the second half of the year. The US yield curve flattened dramatically in August, before reverting to end the period at nearly the same level it started the period. Overall, though, rates dropped. For the period, Event Driven managers provided solid, if unspectacular, performance. The sector’s Credit Arbitrage and Activist sub-styles outperformed, while Distressed and Multi-Strategy underperformed and were the only sub-styles with negative returns for the period. Finally, the SWAP positions contributed 4.6% to the performance of the Portfolio during the annual period ended November 30, 2019.
7

INVESTMENT REVIEW
% of Company Net AssetsMerger Fund - Investor Class 25.3%Kellner Merger Fund - Institutional Class 18.6%James Alpha Structured Credit Value Portfolio - Class S 13.2%High Yield ETF 9.5%IQ Merger Arbitrage ETF 5.3%Invesco Global Short Term High Yield Bond ETF 3.4%SPDR Bloomberg Barclays Euro High Yield Bond UCITS ETF 3.0%Invesco S&P SmallCap Energy ETF 1.8%VanEck Vectors Emerging Markets High Yield Bond ETF 1.2%WisdomTree Japan Hedged SmallCap Equity Fund 1.0%
*Based on total net assets as of November 30, 2019.
Excludes short-term investments.
Past performance is not predictive of future performance. The returns shown do not reflect the deduction of taxes that a shareholder would pay on fund distributions or on the redemptions ofthe fund shares.
HFRI Event-Driven (Total) Index: Investment Managers who maintain positions in companies currently or prospectively involved in corporate transactions of a wide variety including but notlimited to mergers, restructurings, financial distress, tender offers, shareholder buybacks, debt exchanges, security issuance or other capital structure adjustments. Security types can rangefrom most senior in the capital structure to most junior or subordinated, and frequently involve additional derivative securities. Event Driven exposure includes a combination of sensitivitiesto equity markets, credit markets and idiosyncratic, company specific developments. Investment theses are typically predicated on fundamental characteristics (as opposed to quantitative),with the realization of the thesis predicated on a specific development exogenous to the existing capital structure.
A HYPOTHETICAL COMPARISON OF THE GROWTH OF $10,000 INVESTED IN THEJAMES ALPHA EVENT DRIVEN PORTFOLIO VS. BENCHMARKS
SIGNIFICANT AREAS OF INVESTMENTAS A PERCENTAGE OF NET ASSETS
Top 10 Portfolio Holdings* Portfolio Composition*
Event Driven Funds, 44.0%
Bond, 30.7%
Sector Funds, 12.2%
Equity Funds, 1.0%
International Funds, 3.7%
Preferred Fund, 0.1%
Other/Cash Equivalents, 8.3%
$10,454
$11,091 $11,091
$10,684
$9,000
$9,500
$10,000
$10,500
$11,000
$11,500
Class A With Load Class A Class I HFRI Event Driven (Total) Index
8

INVESTMENT REVIEW
JAMES ALPHA FAMILY OFFICE PORTFOLIO
Advised by: James Alpha Advisors LLC, New York, New York
Objective: The Portfolio seeks total return through capital appreciation and/or income, consistent with a reasonable level of risk, as determined by James Alpha Advisor, LLC.
Total Aggregate Return for the Periods Ended November 30, 2019
One Year: 11/30/18-11/30/19
Inception: 6/30/17 – 11/30/19*
Class A With Sales Charge 2.17% 1.74% Without Sales Charge 8.40% 4.26% Class C With Sales Charge 6.68% 3.59% Without Sales Charge 7.68% 3.59% Class I 8.81% 4.54% Class S 8.94% 4.97% *Annualized performance for periods greater than one year. Performance data quoted above is historical. Past performance does not guarantee future results and current performance may be lower or higher than the performance data quoted. The investment return and principal value of an investment will fluctuate, so that shares when redeemed, may be worth more or less than their original cost. For more performance numbers current to the most recent month-end please call (800) 807-FUND. The total operating expense ratio as stated in the fee table to the Portfolio’s prospectus dated March 29, 2019, is 2.82%, 3.70% and 2.67% for the A, C and I Classes, respectively, and May 31, 2019 Supplement is 2.63% for class S. The Portfolio’s Manager has contractually agreed to waive its fees and/or absorb expenses (excluding certain expenses) of the Portfolio through March 31, 2020, to ensure the total net operating expense ratio does not exceed 1.74%, 2.49% and 1.49% for the A, C and I classes, respectively, and to ensure the total net operating expense ratio does not exceed 1.12% for Class S throughout March 31, 2021.
PORTFOLIO INVESTMENT STRATEGIES AND TECHNIQUES Under normal market conditions, the Portfolio employs a multi-asset, multi-strategy investment program that seeks to replicate the asset allocation programs of successful family offices. In constructing the investment program, the Manager utilizes asset allocation data of multiple family offices to construct a diversified portfolio across a broad range of assets classes and investment strategies. The asset classes in which the Portfolio may invest can include U.S. and non-U.S. common stocks, U.S. and non-U.S. corporate, government and agency bonds and other debt instruments, real estate and real estate - related assets, such as mortgage-backed securities, asset-backed securities, currencies and commodities (e.g., metals, agricultural, energy, livestock and “soft” commodities such as coffee and sugar). The weighting of each asset class will change over time and new asset classes may be introduced from time to time. The Portfolio may also invest in instruments that provide exposure to hedge fund strategies, such as low-volatility, directional and fund of funds strategies, and in instruments that provide exposure to private equity strategies, such as mezzanine debt and leveraged buyout strategies. The Portfolio expects to achieve exposure to the above-mentioned asset classes primarily through exchange-traded funds (ETFs), mutual funds and closed-end funds (together, underlying funds) but has the ability to gain exposure through direct investment in stocks and bonds, unit investment trusts (UITs), private funds and other pooled investment vehicles, and through derivative instruments. In constructing the Portfolio, the Manager utilizes a three-step process that includes: 1) analyzing the asset allocation data of multiple family offices to produce a target asset allocation weighting, 2) identifying investments or investment vehicles that provide exposure to the desired asset classes, and 3) making tactical adjustments to the target asset allocation weightings to take advantage of current market conditions. Asset allocation weightings will be reassessed quarterly but tactical adjustments may be made more frequently than quarterly. The Portfolio may invest up to 25% of its total assets in a wholly-owned and controlled Cayman Islands subsidiary (the “Subsidiary”) to gain exposure to certain commodity-linked investments such as ETNs, CLNs and commodity futures and swaps. The Portfolio may hold investments with commodity exposure outside of the Subsidiary and, therefore it is possible the Portfolio’s exposure to commodities could exceed 25%, although the Manager does not currently anticipate that such exposure would exceed 25% of the Portfolio’s total assets. PORTFOLIO ADVISER COMMENTARY The annual period was marked by rallies in risky asset classes with some US equity markets hitting all-time highs. The first quarter of 2019 was a welcomed turnaround for most asset classes after the correction and volatility spike in the fourth quarter of 2018. Global equity markets showed little sign of concern at the start of 2019, as the rally continued straight up. However, the bond market gave a dose of caution as a portion of the yield curve inverted for the first time since 2007. The rally in US equity markets continued through Q2, supported by improving economic data and investor sentiment about negotiations with China over trade tariffs. Some trends in the US economy diverged in the second half of the year from pressure of a slowing global economy, weaker than expected corporate earnings growth, and the US-China trade war. Additionally, there was a notable shift in the equity market, with the large cap sector outperforming the small cap sector and value stocks generally outperforming their growth counterparts. As investor risk appetite returned and the Federal Reserve cut rates, the interest-rate-sensitive global real estate sector rallied. Additionally, the broad commodity market rallied to start the year, but fizzled during the second half of the year. The US yield curve flattened dramatically in August, before reverting to end the period at nearly the same level it started the period. Overall, though, rates dropped. At the end of the period, The James Alpha Family Office Portfolio’s underlying family office strategies had allocated roughly 53% of their portfolios to Public Equity, out of which 13.8% was International and 4.8% was Emerging Markets. Most of their Fixed Income allocation was in the US at 12.9%. The remaining significant allocations were to Private Equity, Hedge Funds, and Real Estate. They maintained around 5% in Cash & Equivalents.
9

INVESTMENT REVIEW
% of Total Company InvestmentsiShares Edge MSCI USA Quality Factor ETF 6.9%Invesco S&P 500 Equal Weight ETF 6.8%iShares Edge MSCI Min Vol Global ETF 6.8%PIMCO Active Bond Exchange-Traded Fund 6.4%Vanguard Total Bond Market ETF 6.2%Leland Thomson Reuters Private Equity Index Fund - Class I 5.2%SPDR S&P 500 ETF Trust 5.1%Invesco Global Listed Private Equity ETF 5.1%PIMCO Enhanced Short Maturity Active Exchange-Traded Fund 3.9%First Trust Dow Jones Select Microcap Index Fund 3.8%
*Based on total investments as of November 30, 2019.
Excludes short-term investments.
Top 10 Portfolio Holdings* Portfolio Composition*
INVESTMENT REVIEW
A HYPOTHETICAL COMPARISON OF THE GROWTH OF $10,000 INVESTED IN THEJAMES ALPHA FAMILY OFFICE PORTFOLIO VS. BENCHMARKS
The Dow Jones Moderate Portfolio Index is a member of the Relative Risk Index Series and designed to measure a total portfolio of stocks, bonds, and cash, allocated to represent aninvestor's desired risk profile. The Dow Jones Moderate Portfolio Index risk level is set to 60% of the Dow Jones Global Stock CMAC Index’s downside risk (past 36 months).
Past performance is not predictive of future performance. The returns shown do not reflect the deduction of taxes that a shareholder would pay on fund distributions or on theredemptions of the fund shares.
A HYPOTHETICAL COMPARISON OF THE GROWTH OF $10,000 INVESTED IN THE JAMES ALPHA FAMILY OFFICE PORTFOLIO VS. BENCHMARKS
SIGNIFICANT AREAS OF INVESTMENTAS A PERCENTAGE OF NET ASSETS
Sector Funds 7.8%
Bonds 22.9%
International Funds 26.3%
Equity Funds 34.4%
Open Ended Funds 5.2%
Other/Cash Equivalents 2.0%
Commodities 1.4%
$10,427
$11,063 $11,134
$11,918
$8,800$9,000$9,200$9,400$9,600$9,800
$10,000$10,200$10,400$10,600$10,800$11,000$11,200$11,400$11,600$11,800$12,000
Class A with Load Class A Class I Dow Jones Moderate Portfolio Index
10

INVESTMENT REVIEW
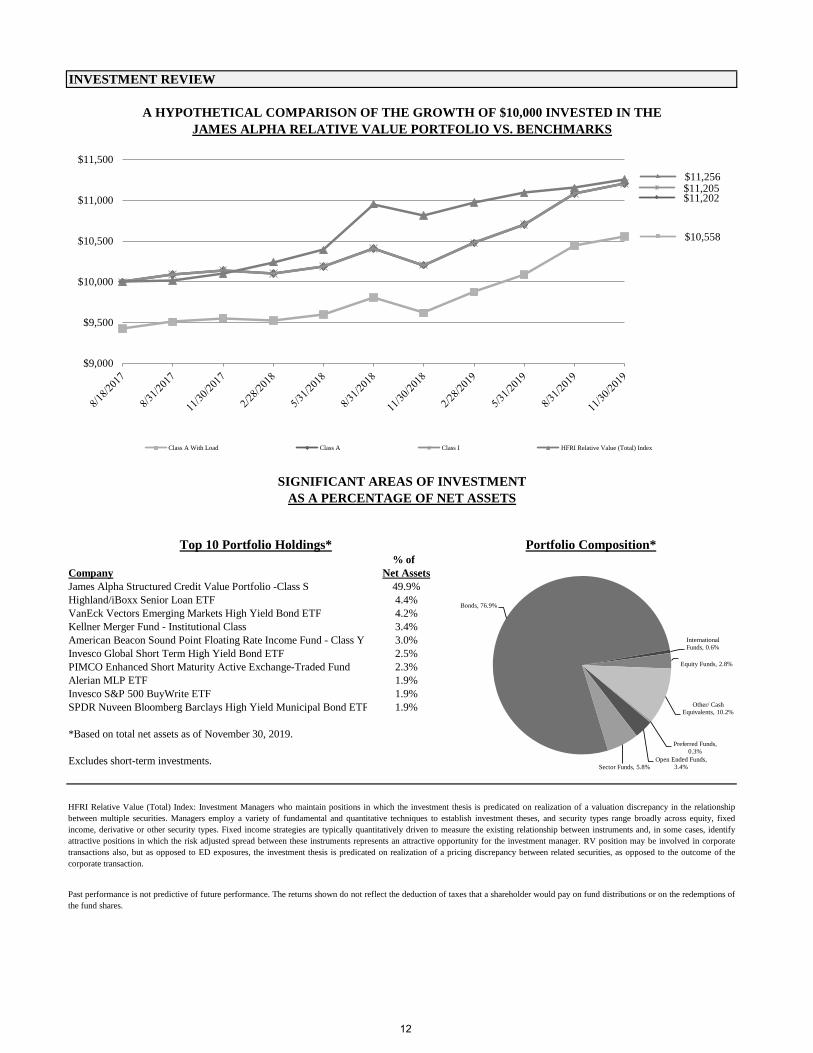
JAMES ALPHA RELATIVE VALUE PORTFOLIO
Advised by: James Alpha Advisors, LLC, New York, New York
Objective: The Portfolio seeks attractive long-term risk-adjusted returns relative to traditional financial market indices.
Total Aggregate Return for the Periods Ended November 30, 2019
One Year: 11/30/18-11/30/19
Inception: 8/18/17 – 11/30/19*
Class A With Sales Charge 3.45% 2.41% Without Sales Charge 9.77% 5.09% Class C With Sales Charge 8.77% 5.09% Without Sales Charge 9.77% 5.09% Class I 9.79% 5.10% Class S 10.07% 5.31% *Annualized performance for periods greater than one year. Performance data quoted above is historical. Past performance does not guarantee future results and current performance may be lower or higher than the performance data quoted. The investment return and principal value of an investment will fluctuate, so that shares when redeemed, may be worth more or less than their original cost. For more performance numbers current to the most recent month-end please call (800) 807-FUND. The total operating expense ratio as stated in the fee table to the Portfolio’s prospectus dated March 29, 2019, is 3.48%, 4.24% and 3.24% for the A, C and I Classes, respectively, and May 31, 2019 Supplement is 3.16% for class S. The Portfolio’s Manager has contractually agreed to waive its fees and/or absorb expenses (excluding certain expenses) of the Portfolio through March 31, 2020, to ensure the total net operating expense ratio does not exceed 1.74%, 2.49% and 1.49% for the A, C and I classes, respectively, and to ensure the total net operating expense ratio does not exceed 1.12% for Class S throughout March 31, 2021.
PORTFOLIO INVESTMENT STRATEGIES AND TECHNIQUES The Portfolio seeks to achieve its investment objective by attempting to outperform the returns of a variety of “relative value” investment strategies. Relative value investment strategies seek to identify and capitalize on valuation discrepancies between related financial instruments rather than on the direction of the general market. The Portfolio expects to gain exposure to asset classes primarily through exchange-traded products such as exchange-traded notes (“ETNs”), exchange-traded funds (“ETFs”) and mutual funds, although the Portfolio may invest directly in currencies, equities and fixed income securities. The Portfolio also expects to invest in derivative instruments to gain exposure to one or more asset classes, individual investments or investment strategies. In constructing the Portfolio’s investments, the Portfolio’s Manager employs proprietary techniques and models to evaluate the drivers of performance of private funds that utilize relative value investment strategies. The Manager then identifies investments that it believes have similar drivers of performance to attempt to produce returns that correlate with, but are not identical to, the returns of the private funds tracked by the Manager. The Manager then determines the appropriate percentage that each particular investment strategy should represent of the entire Portfolio and weights the exposure to that investment strategy accordingly. The private fund returns on which the Manager’s models are based are pulled from various sources and do not represent the returns of the entire private fund universe. The private funds’ returns tracked by the Manager, the factors driving those returns and the percentage weightings assigned by the Manager to each investment strategy are all expected to change over time. The Portfolio may invest up to 25% of its total assets in a wholly-owned and controlled Cayman Islands subsidiary (the “Subsidiary”) to gain exposure to certain commodity-linked investments such as commodity futures, options and swap contracts. The commodity investments will be focused in four sectors of the commodities market: energy, precious metals, industrial metals and agricultural/livestock. The Portfolio may hold investments with commodity exposure outside of the Subsidiary and, therefore it is possible the Portfolio’s exposure to commodities could exceed 25%.
PORTFOLIO ADVISER COMMENTARY The annual period was marked by rallies in risky asset classes with some US equity markets hitting all-time highs. The first quarter of 2019 was a welcomed turnaround for most asset classes after the correction and volatility spike in the fourth quarter of 2018. Global equity markets showed little sign of concern at the start of 2019, as the rally continued straight up. However, the bond market gave a dose of caution as a portion of the yield curve inverted for the first time since 2007. The rally in US equity markets continued through Q2, supported by improving economic data and investor sentiment about negotiations with China over trade tariffs. Some trends in the US economy diverged in the second half of the year from pressure of a slowing global economy, weaker than expected corporate earnings growth, and the US-China trade war. Additionally, there was a notable shift in the equity market, with the large cap sector outperforming the small cap sector and value stocks generally outperforming their growth counterparts. As investor risk appetite returned and the Federal Reserve cut rates, the interest-rate-sensitive global real estate sector rallied. Additionally, the broad commodity market rallied to start the year, but fizzled during the second half of the year. The US yield curve flattened dramatically in August, before reverting to end the period at nearly the same level it started the period. Overall, though, rates dropped. For the period, Relative Value managers provided solid risk-adjusted performance. Lower interest rates and an increasingly dovish Fed helped the sector’s Convertible Arbitrage and Sovereign fixed income styles, which outperformed during the period. Volatility oriented managers were slight detractors, posting negative returns for the period, though their overall sector weight was small. Finally, the SWAP positions contributed 5.1% to the performance of the Portfolio during the annual period ended November 30, 2019.
11
INVESTMENT REVIEW
% of Company Net AssetsJames Alpha Structured Credit Value Portfolio -Class S 49.9%Highland/iBoxx Senior Loan ETF 4.4%VanEck Vectors Emerging Markets High Yield Bond ETF 4.2%Kellner Merger Fund - Institutional Class 3.4%American Beacon Sound Point Floating Rate Income Fund - Class Y 3.0%Invesco Global Short Term High Yield Bond ETF 2.5%PIMCO Enhanced Short Maturity Active Exchange-Traded Fund 2.3%Alerian MLP ETF 1.9%Invesco S&P 500 BuyWrite ETF 1.9%SPDR Nuveen Bloomberg Barclays High Yield Municipal Bond ETF 1.9%
*Based on total net assets as of November 30, 2019.
Excludes short-term investments.
HFRI Relative Value (Total) Index: Investment Managers who maintain positions in which the investment thesis is predicated on realization of a valuation discrepancy in the relationshipbetween multiple securities. Managers employ a variety of fundamental and quantitative techniques to establish investment theses, and security types range broadly across equity, fixedincome, derivative or other security types. Fixed income strategies are typically quantitatively driven to measure the existing relationship between instruments and, in some cases, identifyattractive positions in which the risk adjusted spread between these instruments represents an attractive opportunity for the investment manager. RV position may be involved in corporatetransactions also, but as opposed to ED exposures, the investment thesis is predicated on realization of a pricing discrepancy between related securities, as opposed to the outcome of thecorporate transaction.
Past performance is not predictive of future performance. The returns shown do not reflect the deduction of taxes that a shareholder would pay on fund distributions or on the redemptions ofthe fund shares.
A HYPOTHETICAL COMPARISON OF THE GROWTH OF $10,000 INVESTED IN THEJAMES ALPHA RELATIVE VALUE PORTFOLIO VS. BENCHMARKS
SIGNIFICANT AREAS OF INVESTMENTAS A PERCENTAGE OF NET ASSETS
Top 10 Portfolio Holdings* Portfolio Composition*
Open Ended Funds, 3.4%Sector Funds, 5.8%
Bonds, 76.9%
International Funds, 0.6%
Equity Funds, 2.8%
Other/ Cash Equivalents, 10.2%
Preferred Funds, 0.3%
$10,558
$11,202 $11,205 $11,256
$9,000
$9,500
$10,000
$10,500
$11,000
$11,500
Class A With Load Class A Class I HFRI Relative Value (Total) Index
12

INVESTMENT REVIEW
JAMES ALPHA TOTAL HEDGE PORTFOLIO
Advised by: James Alpha Advisors, LLC, New York, New York
Objective: The Portfolio seeks attractive long-term risk-adjusted returns relative to traditional financial market indices.
Total Aggregate Return for the Periods Ended November 30, 2019
One Year: 11/30/18 – 11/30/19
Inception: 6/30/17 – 11/30/19*
Class A With Sales Charge 0.11% 0.81% Without Sales Charge 6.25% 3.31% Class C With Sales Charge 4.44% 2.61% Without Sales Charge 5.44% 2.61% Class I 6.54% 3.58% Class S 6.73% 3.70% *Annualized performance for periods greater than one year. Performance data quoted above is historical. Past performance does not guarantee future results and current performance may be lower or higher than the performance data quoted. The investment return and principal value of an investment will fluctuate, so that shares when redeemed, may be worth more or less than their original cost. For more performance numbers current to the most recent month-end please call (800) 807-FUND. The total operating expense ratio as stated in the fee table to the Portfolio’s prospectus dated March 29, 2019, is 3.62%, 4.14% and 3.24% for the A, C and I Classes, respectively, and May 31, 2019 Supplement is 3.12% for class S. The Portfolio’s Manager has contractually agreed to waive its fees and/or absorb expenses (excluding certain expenses) of the Portfolio through March 31, 2020, to ensure the total net operating expense ratio does not exceed 1.74%, 2.49% and 1.49% for the A, C and I classes, respectively, and to ensure the total net operating expense ratio does not exceed 1.12% for Class S throughout March 31, 2021.
PORTFOLIO INVESTMENT STRATEGIES AND TECHNIQUES The Portfolio seeks to achieve its investment objective by attempting to outperform the returns of a variety of investment strategies offered by private funds. The private fund investment strategies the returns of which the Portfolio will seek to outperform include “hedged equity,” “event driven,” “macro,” and “relative value” strategies. A hedged equity investment strategy typically involves establishing both long and short positions in equity or equity-linked instruments. Event driven investment strategies seek to profit from investing in securities of companies on the basis that a specific event or catalyst will affect future pricing. Macro based strategies aim to exploit macro-economic imbalances across the globe. Relative value strategies seek to identify and capitalize on valuation discrepancies between related financial instruments rather than on the direction of the general market. The Portfolio expects to gain exposure to these asset classes primarily through exchange-traded products such as exchange-traded notes (“ETNs”), exchange-traded funds (“ETFs”) and mutual funds, although the Portfolio may invest directly in currencies, equities and fixed income securities. The Portfolio also expects to invest in derivative instruments to gain exposure to one or more asset classes, individual investments or investment strategies. In constructing the Portfolio’s investments, the Portfolio’s Manager employs proprietary techniques and models to evaluate the drivers of performance of private funds that utilize hedged equity, event driven, macro and relative value strategies. The Manager then identifies investments that it believes have similar drivers of performance to attempt to produce returns that correlate with, but are not identical to, the returns of the private funds tracked by the Manager. The Manager then determines the appropriate percentage that each particular investment strategy should represent of the entire Portfolio and weights the exposure to that investment strategy accordingly. The private fund returns on which the Manager’s models are based are pulled from various sources and do not represent the returns of the entire private fund universe. The private funds’ returns tracked by the Manager, the factors driving those returns and the percentage weightings assigned by the Manager to each investment strategy are all expected to change over time. The Portfolio may invest up to 25% of its total assets in a wholly-owned and controlled Cayman Islands subsidiary (the “Subsidiary”) to gain exposure to certain commodity-linked investments such as commodity futures, options and swap contracts. The commodity investments will be focused in four sectors of the commodities market: energy, precious metals, industrial metals and agricultural/livestock. The Portfolio may hold investments with commodity exposure outside of the Subsidiary and, therefore it is possible the Portfolio’s exposure to commodities could exceed 25%.
PORTFOLIO ADVISER COMMENTARY The annual period was marked by rallies in risky asset classes with some US equity markets hitting all-time highs. The first quarter of 2019 was a welcomed turnaround for most asset classes after the correction and volatility spike in the fourth quarter of 2018. Global equity markets showed little sign of concern at the start of 2019, as the rally continued straight up. However, the bond market gave a dose of caution as a portion of the yield curve inverted for the first time since 2007. The rally in US equity markets continued through Q2, supported by improving economic data and investor sentiment about negotiations with China over trade tariffs. Some trends in the US economy diverged in the second half of the year from pressure of a slowing global economy, weaker than expected corporate earnings growth, and the US-China trade war. Additionally, there was a notable shift in the equity market, with the large cap sector outperforming the small cap sector and value stocks generally outperforming their growth counterparts. As investor risk appetite returned and the Federal Reserve cut rates, the interest-rate-sensitive global real estate sector rallied. Additionally, the broad commodity market rallied to start the year, but fizzled during the second half of the year. The US yield curve flattened dramatically in August, before reverting to end the period at nearly the same level it started the period. Overall, though, rates dropped. For the period, the Hedge Fund sector provided solid risk-adjusted performance. Each of the major strategy types within the sector provided positive returns. Equity Hedge and Macro managers benefitted the most from strong equity markets and profitable macroeconomic trends. Finally, the SWAP position contributed 0.8% to the performance of the Portfolio during the annual period ended November 30, 2019.
13

INVESTMENT REVIEW
% of Company Net AssetsJames Alpha Structured Credit Value Portfolio - Class S 26.7%iShares Micro-Cap ETF 3.2%Kellner Merger Fund - Institutional Class 2.9%PIMCO Enhanced Short Maturity Active Exchange-Traded Fund 2.8%Invesco Global Short Term High Yield Bond ETF 2.6%SPDR Bloomberg Barclays High Yield Bond ETF 2.5%Merger Fund - Investor Class 2.5%iShares Russell Mid-Cap Growth ETF 2.1%SPDR Bloomberg Barclays Convertible Securities ETF 2.0%Vanguard Total International Bond ETF 1.9%
*Based on total net assets as of November 30, 2019.
Excludes short-term investments.
The HFRI Fund Weighted Composite Index is a global, equal-weighted index of appx. 1,900 single-manager funds that report to HFR Database. Constituent funds report monthly net of all feesperformance in US Dollar and have a minimum of $50 Million under management or a twelve (12) month track record of active performance. The HFRI Fund Weighted Composite Index doesnot include Funds of Hedge Funds.
Past performance is not predictive of future performance. The returns shown do not reflect the deduction of taxes that a shareholder would pay on fund distributions or on the redemptions of thefund shares.
A HYPOTHETICAL COMPARISON OF THE GROWTH OF $10,000 INVESTED IN THEJAMES ALPHA TOTAL HEDGE PORTFOLIO VS. BENCHMARKS
SIGNIFICANT AREAS OF INVESTMENTAS A PERCENTAGE OF NET ASSETS
Top 10 Portfolio Holdings* Portfolio Composition*
Event Driven Funds, 5.4%
Sector Funds, 12.7%
Equity Funds, 11.2%
International Funds, 13.3%
Bonds, 48.1%
Preferred Fund, 1.0%
Other/Cash Equivalents, 6.0%
Managed Futures Funds, 2.3%
$10,197
$10,819
$10,889 $10,825
$9,000
$9,200
$9,400
$9,600
$9,800
$10,000
$10,200
$10,400
$10,600
$10,800
$11,000
Class A With Load Class A Class I HRFI Fund Weighted Composite Index
14

INVESTMENT REVIEW
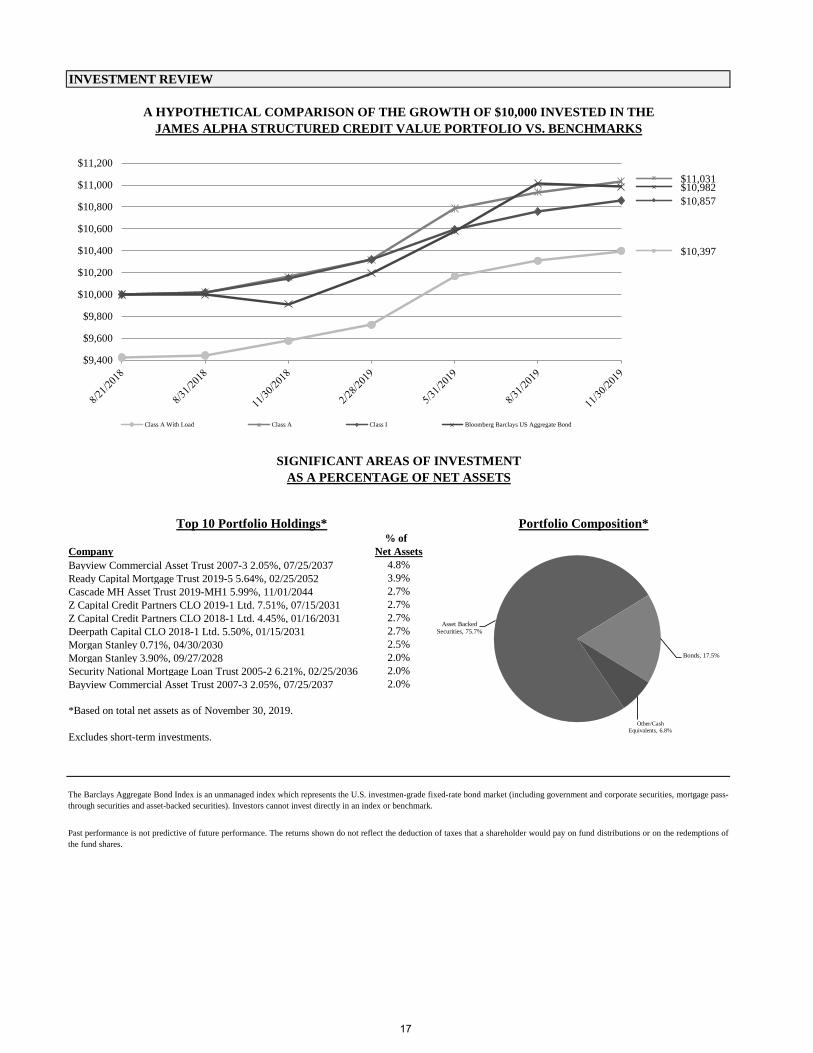
JAMES ALPHA STRUCTURED CREDIT VALUE PORTFOLIO
Advised by: James Alpha Advisors, LLC, New York, New York
Objective: The Portfolio seeks to provide a high level of risk-adjusted current income and capital appreciation.
Total Aggregate Return for the Period Ended November 30, 2019
One Year: 11/30/18 – 11/30/19
Inception: 8/21/18 – 11/30/19*
Class A With Sales Charge 2.33% 3.09% Without Sales Charge 8.57% 7.99% Class C With Sales Charge 5.29% 6.20% Without Sales Charge 6.29% 6.20% Class I 6.97% 6.65% Class S 7.36% 7.04% *Inception date is August 14, 2018. Start of performance is August 21, 2018. Performance data quoted above is historical. Past performance does not guarantee future results and current performance may be lower or higher than the performance data quoted. The investment return and principal value of an investment will fluctuate, so that shares when redeemed, may be worth more or less than their original cost. For more performance numbers current to the most recent month-end please call (800) 807-FUND. The total operating expense ratio as stated in the fee table to the Portfolio’s prospectus dated March 29, 2019, is 2.19%, 3.02% and 2.02% for the A, C and I Classes, respectively, and May 31, 2019 Supplement is 1.88% for class S. The Portfolio’s Manager has contractually agreed to waive its fees and/or absorb expenses (excluding certain expenses) of the Portfolio through March 31, 2020, to ensure the total net operating expense ratio does not exceed 1.74%, 2.49% and 1.49% for the A, C and I classes, respectively, and to ensure the total net operating expense ratio does not exceed 1.12% for Class S throughout March 31, 2021
PORTFOLIO INVESTMENT STRATEGIES AND TECHNIQUES
The Portfolio seeks to achieve its investment objectives, under normal conditions, by investing at least 80% of the Portfolio’s net assets plus any borrowings for investment purposes in structured credit securities, and in other investments that have economic characteristics similar to such securities. Structured credit securities include, but are not limited to, mortgage backed-securities (“MBS”), including residential mortgage-backed securities (“RMBS”), commercial mortgage-backed securities (“CMBS”); asset-backed securities (“ABS”); collateralized mortgage obligations (“CMOs”); collateralized loan obligations (“CLOs”); collateralized bond obligations (“CBOs”); collateralized debt obligations (“CDOs”); mortgage derivatives such as stripped RMBS and inverse floaters; and other securitized assets. The use of inverse floaters by the Portfolio creates effective leverage. The Portfolio’s investments in RMBS may include agency and nonagency RMBS, including to-be-announced MBS (“TBA”), and non-U.S. dollar denominated RMBS. The Portfolio’s investments in CMOs may include whole loan CMOs backed by prime, Alt-A, and subprime collateral. The Sub-Adviser considers prime loans to represent borrowers with good to excellent credit; the Sub-Adviser considers subprime loans to represent borrowers with a higher risk of default than loans to prime borrowers and therefore carry higher interest rates; and the Sub-Adviser considers Alt-A loans to represent borrowers with a credit risk profile between that of prime and subprime loans. The Portfolio may invest without limit in securitizations backed by loans and expects that most Alt-A and subprime securitizations in which the Portfolio intends to invest will be composed entirely of such loans. The Portfolio’s investments in ABS include ABS backed by student loans, auto loans, or nontraditional collateral such as single family rentals and aircraft leases. The Portfolio concentrates its investments (i.e., invests more than 25% of its net assets) in RMBS, CMBS, and other mortgage-related securities (such as CMOs), and treats such investments as investments in a group of industries. The Portfolio may also invest in corporate bonds and other fixed income securities. The Portfolio seeks to minimize interest rate risk by maintaining a short to intermediate average portfolio duration (i.e., within a zero to three (0 to 3) year range), as calculated by the Sub-Adviser, although the Portfolio’s average duration may be shorter or longer at any time or from time to time depending on market conditions and other factors. While the Portfolio seeks to maintain a short to intermediate average portfolio duration, there is no limit on the maturity or duration of any individual security in which the Portfolio may invest. In addition, the Sub-Adviser manages the liquidity of the Portfolio’s holdings at both the individual security level and the portfolio level, using a proprietary technique that attempts to optimize the tradeoff between the yield and liquidity of the portfolio. In pursuing its objective, the Portfolio may sell securities short from time to time, predominately in conjunction with long positions with similar characteristics for the purposes of hedging or managing interest rate or credit spread risk, or occasionally for exploiting relative value differences between two securities, not for predicting the overall direction of the market. The Portfolio may also employ TBA for these short selling activities. TBA sales are forward-settling sales of agency MBS where the underlying pools of mortgage loans are not known at the time of the original transaction, but are announced just before settlement based on a “cheapest-to-deliver” algorithm. The Portfolio may invest in options, futures and swaps (including interest rate swaps, credit default swaps, total return swaps and swaptions). The Portfolio may invest in such instruments, without limitation, for hedging purposes designed to manage interest rate, credit spread and other risks.
15

The Portfolio may invest without limit in debt securities that are rated below investment grade (also known as “junk bonds”). The Portfolio does not have a target allocation to investment grade or below investment grade securities, but may invest a significant portion of its assets in non-agency RMBS, which are below investment grade securities. The Sub-Adviser defines investment grade securities as those that are rated BBB or higher by Standard & Poor’s Ratings Services (“S&P”) or Baa or higher by Moody’s Investors Service, Inc. (“Moody’s”), for example, or are rated investment grade by any other Nationally Recognized Statistical Rating Organization (“NRSRO”), or if unrated, determined by the Sub-Adviser to be of comparable quality. The Portfolio may invest a significant portion of its assets in Rule 144A securities, as a significant portion of current issuance in the ABS and MBS markets are Rule 144A securities. Rule 144A securities are not registered under the Securities Act of 1933, as amended (the “1933 Act”) and can be traded only among large institutional buyers and sellers, including the Portfolio, that meet the requirements of Rule 144A. The Portfolio employs a value style investing approach that seeks to invest in securities providing undervalued cash flows within markets the Sub-Adviser deems inefficient. When investing Portfolio assets in all types of securities, the Sub-Adviser analyzes their expected future cash flows based on collateral composition and expected performance, deal structure including credit enhancement, state variables such as interest shortfalls and servicer advances and other factors in order to project expected return parameters such as yield and average life. The Sub-Adviser employs a comprehensive risk management process tailored to the securities held in the Portfolio that considers systematic risk, cash flow risk and liquidity risk of the securities. The Sub-Adviser, using a proprietary quantitative analysis model, projects security cash flows and values such cash flows at what it deems to be the appropriate discount rate based on price discovery resulting from relatively active trading and publicly available pricing information. The Sub-Adviser’s proprietary quantitative analysis model to evaluate RMBS securities considers borrower and servicer behavior in projecting, at the loan-level, prepayment and default probability, default severity, and other factors affecting the cash flows of the security, which are then analyzed not only to identify undervalued securities, but also to stress test the credit risk of those securities. The Sub-Adviser considers selling securities when such securities have reached their price/valuation targets. The Sub-Adviser may also consider selling securities when the Sub-Adviser believes securities have become overvalued and replacing them with securities the Sub-Adviser believes to be undervalued to seek to offer the Portfolio better relative value and performance expectations. The Sub-Adviser may also sell and replace securities as necessary to rebalance and align the portfolio with its overall risk parameter targets.
PORTFOLIO ADVISER COMMENTARY 2019 will go down in the history books as a year of asset reflation with most risky and risk-free assets posting positive returns. Following December 2018’s unfortunate rate hike that helped drive a year-end sell-off, the Federal Reserve rapidly reversed its course in 2019 by adopting a much more accommodative monetary stance that was punctuated by a lowering of the target rate three times. Treasury rates responded to the monetary easing, trade related tensions, and $15 trillion of negatively yielding assets in the developed world by staging a significant rally in August. The yield curve flattened in 2019 after briefly inverting over the summer. Long duration assets did well. Risk assets shook off recessionary fears and trade-related volatility to post outsized returns in 2019. With the US economy expanding in 2019, credit spreads tightened significantly. Corporate yields are approaching all time record lows following the rally in Treasury rates and spread contraction. For 2019, both Investment Grade (IG) and High Yield (HY) posted double-digit absolute returns. The Agency Mortgage Backed Security sector, hampered by negative convexity, posted more modest returns compared to Corporates with absolute performance of 6.35% and excess return of 54bp vs similar duration Treasuries in 2019. Structured Credit sectors generally performed well in 2019. The Legacy Residential Mortgage Backed Security (RMBS) sector continued its strong performance underpinned primarily by its carry. Among Legacy sectors there was a clear preference for fixed-rate coupons and long spread duration assets as many investors shied away from floating rate securities and continued to bet on further spread compression. Long spread duration subprime mezzanine tranches were once again the best performers among Legacy RMBS securities. New issue Non-Agency RMBS sectors continued to benefit from positive technicals and strong fundamentals. While home price appreciation has moderated in 2019, net issuance was limited to around $30 billion driven primarily by Agency Credit Risk Transfer (CRT), Non-Qualified Mortgage and Jumbo Prime deals. While Commercial Mortgage Backed Securities (CMBS) new issue fixed-rate tranches underperformed similar duration IG Corporates, the CMBS credit curve continued to flatten. Collateralized Loan Obligations were one of the few sectors that saw marginal spread widening in 2019 on the back of supply concerns, preference for fixed-rate coupons, and collateral credit deterioration/rating downgrades.
16
INVESTMENT REVIEW
% of Company Net AssetsBayview Commercial Asset Trust 2007-3 2.05%, 07/25/2037 4.8%Ready Capital Mortgage Trust 2019-5 5.64%, 02/25/2052 3.9%Cascade MH Asset Trust 2019-MH1 5.99%, 11/01/2044 2.7%Z Capital Credit Partners CLO 2019-1 Ltd. 7.51%, 07/15/2031 2.7%Z Capital Credit Partners CLO 2018-1 Ltd. 4.45%, 01/16/2031 2.7%Deerpath Capital CLO 2018-1 Ltd. 5.50%, 01/15/2031 2.7%Morgan Stanley 0.71%, 04/30/2030 2.5%Morgan Stanley 3.90%, 09/27/2028 2.0%Security National Mortgage Loan Trust 2005-2 6.21%, 02/25/2036 2.0%Bayview Commercial Asset Trust 2007-3 2.05%, 07/25/2037 2.0%
*Based on total net assets as of November 30, 2019.
Excludes short-term investments.
The Barclays Aggregate Bond Index is an unmanaged index which represents the U.S. investmen-grade fixed-rate bond market (including government and corporate securities, mortgage pass-through securities and asset-backed securities). Investors cannot invest directly in an index or benchmark.
Past performance is not predictive of future performance. The returns shown do not reflect the deduction of taxes that a shareholder would pay on fund distributions or on the redemptions ofthe fund shares.
A HYPOTHETICAL COMPARISON OF THE GROWTH OF $10,000 INVESTED IN THEJAMES ALPHA STRUCTURED CREDIT VALUE PORTFOLIO VS. BENCHMARKS
SIGNIFICANT AREAS OF INVESTMENTAS A PERCENTAGE OF NET ASSETS
Top 10 Portfolio Holdings* Portfolio Composition*
Asset Backed Securities, 75.7%
Bonds, 17.5%
Other/Cash Equivalents, 6.8%
$10,397
$11,031
$10,857 $10,982
$9,400
$9,600
$9,800
$10,000
$10,200
$10,400
$10,600
$10,800
$11,000
$11,200
Class A With Load Class A Class I Bloomberg Barclays US Aggregate Bond
17

SCHEDULE OF INVESTMENTSJAMES ALPHA EHS PORTFOLIO November 30, 2019
Shares ValueCOMMON STOCK - 1.0 %BIOTECHNOLOGY - 1.0 %
3,729 Pacific Biosciences of California, Inc. * 19,167$
TOTAL COMMON STOCK (Cost - $26,327) 19,167
EXCHANGE TRADED FUNDS - 59.3 %BONDS - 0.3 %
22 iShares JP Morgan USD Emerging Markets Bond ETF 2,467 167 WisdomTree Interest Rate Hedged High Yield Bond 3,822
6,289 EQUITY FUNDS - 18.9 %
117 AdvisorShares STAR Global Buy-Write ETF 3,944 339 Invesco S&P 500 Equal Weight ETF 38,351 655 Invesco S&P 500 Pure Value ETF 44,547
1,200 iShares Micro-Cap ETF 113,532 19 iShares Russell 1000 ETF 3,313
291 iShares Russell 1000 Growth ETF 49,886 58 iShares Russell 1000 Value ETF 7,777 26 iShares Russell 2000 ETF 4,206 26 iShares Russell 2000 Growth ETF 5,459 26 iShares Russell 2000 Value ETF 3,253
623 iShares Russell Mid-Cap Growth ETF 94,104 10 iShares Russell Mid-Cap Value ETF 926
369,298 INTERNATIONAL FUNDS - 21.4 %
216 Columbia India Consumer ETF 9,056 62 Global X MSCI Nigeria ETF 838
1,858 Invesco China Small Cap ETF 45,168 46 iShares China Large-Cap ETF 1,883
2,254 iShares Edge MSCI Europe Momentum Factor UCITS ETF * 17,884 371 iShares Edge MSCI International Momentum Factor ETF 11,289 234 iShares Latin America 40 ETF 7,376 236 iShares MSCI Brazil ETF 10,023 745 iShares MSCI EAFE ETF 50,794 368 iShares MSCI Frontier 100 ETF 10,757
79 iShares MSCI Germany Small-Cap ETF 4,498 628 iShares MSCI India Small-Cap ETF 22,759 104 iShares MSCI Indonesia ETF 2,499
72 iShares MSCI Ireland ETF 3,241 275 iShares MSCI Japan ETF 16,343
19 iShares MSCI Japan Small-Cap ETF 1,441 60 iShares MSCI Peru ETF 2,061
177 iShares MSCI Philippines ETF 6,011 7 iShares MSCI Poland ETF 147
43 iShares MSCI South Korea ETF 2,514 77 iShares MSCI Taiwan ETF 3,038 18 iShares MSCI Thailand ETF 1,574
201 iShares MSCI United Kingdom Small-Cap ETF 8,356 42 SPDR EURO STOXX 50 ETF 1,668
368 SPDR S&P Emerging Asia Pacific ETF 36,220 277 VanEck Vectors Africa Index ETF 5,684 374 VanEck Vectors Brazil Small-Cap ETF 8,953
23 VanEck Vectors India Small-Cap Index ETF 759 21 VanEck Vectors Israel ETF 745
332 VanEck Vectors Russia ETF 8,054 69 VanEck Vectors Russia Small-Cap ETF 2,422
268 VanEck Vectors Vietnam ETF 4,272 377 Vanguard FTSE Emerging Markets ETF 15,857 540 Vanguard Total World Stock ETF 42,595 129 WisdomTree Emerging Markets SmallCap Dividend Fund 5,858
41 WisdomTree Europe SmallCap Dividend Fund 2,488 255 WisdomTree Japan Hedged SmallCap Equity Fund 10,915 570 WisdomTree Middle East Dividend Fund 11,029 773 Xtrackers Harvest CSI 300 China A-Shares ETF 21,319
418,388 PREFERRED FUND - 1.0 %
1,071 Invesco Financial Preferred ETF 19,953
See accompanying notes to financial statements.18

SCHEDULE OF INVESTMENTS (Continued)JAMES ALPHA EHS PORTFOLIO November 30, 2019
Shares ValueEXCHANGE TRADED FUNDS - 59.3 % (Continued)SECTOR FUNDS - 17.7 %
236 Alerian MLP ETF 1,848$ 741 AlphaClone Alternative Alpha ETF 43,119 253 Consumer Discretionary Select Sector SPDR Fund 30,980
6 Energy Select Sector SPDR Fund 353 74 First Trust Dow Jones Internet Index Fund * 10,191
789 First Trust Financial AlphaDEX Fund 26,234 496 Global X MSCI China Consumer Discretionary ETF 8,754
89 Invesco China Real Estate ETF 2,325 66 Invesco DB Agriculture Fund 1,066 19 Invesco DWA Consumer Cyclicals Momentum ETF 1,031
166 Invesco DWA Healthcare Momentum ETF * 14,950 54 Invesco S&P SmallCap Energy ETF 332 13 Invesco S&P SmallCap Health Care ETF * 1,684
5 Invesco S&P SmallCap Utilities 256 9 Invesco Water Resources ETF 338
65 iShares Core S&P/TSX Capped Composite Index ETF 1,333 167 iShares Expanded Tech-Software Sector ETF 38,743
19 iShares Global Timber & Forestry ETF 1,232 269 iShares Nasdaq Biotechnology ETF 32,186
71 iShares Silver Trust * 1,130 24 iShares STOXX Europe 600 Utilities UCITS ETF DE 902 29 iShares U.S. Consumer Services ETF 6,541 50 iShares U.S. Healthcare Providers ETF 9,743 27 iShares US Pharmaceuticals ETF 4,086
208 KraneShares CSI China Internet ETF 9,693 31 Materials Select Sector SPDR Fund 1,861 24 ProShares Short VIX Short-Term Futures ETF * 1,513
1,225 SPDR Bloomberg Barclays Convertible Securities ETF 67,008 17 SPDR Gold Shares * 2,344 58 SPDR S&P Oil & Gas Exploration & Production ETF 1,181
200 SPDR S&P Regional Banking ETF 11,244 30 VanEck Vectors Junior Gold Miners ETF 1,145 23 VanEck Vectors Low Carbon Energy ETF 1,598
5 VanEck Vectors Rare Earth/Strategic Metals ETF 63 31 VanEck Vectors Semiconductor ETF 4,120
607 VanEck Vectors Unconventional Oil & Gas ETF 5,930 347,057
TOTAL EXCHANGE TRADED FUNDS (Cost - $1,192,714) 1,160,985
` OPEN ENDED FUNDS - 35.4 %BOND FUNDS - 35.4 %
13,667 American Beacon Sound Point Floating Rate Income - Class Y 130,110 53,507 James Alpha Structured Credit Value Portfolio - Class S ^ 562,357
TOTAL OPEN ENDED FUNDS (Cost - $693,388) 692,467
SHORT-TERM INVESTMENTS - 3.2 %62,815 Dreyfus Institutional Preferred Government Money Market - Institutional Class, 1.59% ^^
(Cost - $62,815) 62,815
TOTAL INVESTMENTS - 98.9 % (Cost - $1,975,244) 1,935,434$
OTHER ASSETS LESS LIABILITIES - 1.1 % 20,750
NET ASSETS - 100.0% 1,956,184$
ETF - Exchange Traded Fund* Non-income producing securities. ^ Affiliated investment.^^ Money Market Fund; interest rate reflects seven-day effective yield on November 30, 2019.
See accompanying notes to financial statements.19

SCHEDULE OF INVESTMENTS (Continued)JAMES ALPHA EHS PORTFOLIO November 30, 2019
Settlement Local U.S. Dollar UnrealizedForeign Currency Date Counterparty* Currency Value (Depreciation)To Buy:Euro 12/27/2019 BNY 26,399 29,166$ (139)$ Japanese Yen 12/27/2019 BNY 1,288,758 11,795 (84) Mexican Peso 12/27/2019 BNY 33,970 1,736 (29)
42,697$ (252)$
Settlement Local U.S. Dollar UnrealizedForeign Currency Date Counterparty Currency Value AppreciationTo Sell: Australian Dollar 12/27/2019 BNY (4,137) (2,800)$ 19$ British Pound 12/27/2019 BNY (45,257) (58,608) 113 Canadian Dollar 12/27/2019 BNY (1,816) (1,368) 5
(62,776)$ 137$
Total Unrealized Depreciation On Forward Currency Contracts $ (115)
*BNY - Bank of New York
See accompanying notes to financial statements.20

SCHEDULE OF INVESTMENTS JAMES ALPHA EVENT DRIVEN PORTFOLIONovember 30, 2019
Shares ValueEXCHANGE TRADED FUNDS - 34.4 %BONDS - 17.4 %
21,519 High Yield ETF 713,706$ 11,326 Invesco Global Short Term High Yield Bond ETF 257,553
459 iShares Barclays USD Asia High Yield Bond Index ETF 4,870 68 iShares JP Morgan USD Emerging Markets Bond ETF 7,624
3,486 SPDR Barclays Euro High Yield Bond UCITS ETF 222,095 3,966 VanEck Vectors Emerging Markets High Yield Bond ETF 93,042
222 VanEck Vectors J.P. Morgan EM Local Currency Bond ETF 7,315 1,306,205
EQUITY FUNDS - 1.0 %502 iShares Micro-Cap ETF 47,494 138 iShares Russell 2000 ETF 22,324 43 iShares Russell Mid-Cap Value ETF 3,980
73,798 INTERNATIONAL FUNDS - 3.7 %
1,842 Global X MSCI Argentina ETF 43,582 432 Invesco China Small Cap ETF 10,502 13 iShares China Large-Cap ETF 532
212 iShares Latin America 40 ETF 6,682 459 iShares MSCI Brazil ETF 19,494 38 iShares MSCI Canada ETF 1,126
111 iShares Edge MSCI Europe Momentum Factor UCITS ETF * 881 241 iShares MSCI Emerging Markets ETF 10,252 110 VanEck Vectors Brazil Small-Cap ETF 2,633
1,185 VanEck Vectors Russia ETF 28,748 1,088 VanEck Vectors Russia Small-Cap ETF 38,185
448 Vanguard Total World Stock ETF 35,338 1,710 WisdomTree Japan Hedged SmallCap Equity Fund 73,197
310 Xtrackers Harvest CSI 300 China A-Shares ETF 8,550 279,702
PREFERRED FUND - 0.1 %576 Invesco Financial Preferred ETF 10,731
SECTOR FUNDS - 12.2 %3,268 Alerian Energy Infrastructure ETF 62,827
513 AlphaClone Alternative Alpha ETF 29,851 7 Consumer Discretionary Select Sector SPDR Fund 857
36 First Trust Financial AlphaDEX Fund 1,197 3,549 Global X Uranium ETF 38,400
579 Invesco DWA Energy Momentum ETF 14,720 254 Invesco KBW Property & Casualty ETF 18,052
21,875 Invesco S&P SmallCap Energy ETF 134,531 12,107 IQ Merger Arbitrage ETF * 397,897
7 IQ US Real Estate Small Cap ETF 184 225 iShares 7-10 Year Treasury Bond ETF 25,103 568 iShares Commodities Select Strategy ETF 18,140 458 ISHARES STOXX EUROPE 600 INSURANCE UCITS ETF DE 15,948 648 KraneShares CSI China Internet ETF 30,197 26 ProShares Merger ETF 990
296 SPDR Bloomberg Barclays Convertible Securities ETF 16,191 2 SPDR Dow Jones Global Real Estate ETF 105 9 SPDR S&P Insurance ETF 320
356 SPDR S&P Regional Banking ETF 20,014 1,486 SPDR S&P Retail ETF 66,395
217 Vanguard Real Estate ETF 20,196 912,115
TOTAL EXCHANGE TRADED FUNDS (Cost - $2,706,436) 2,582,551
EXCHANGE TRADED NOTE - 0.1 %BONDS - 0.1 %
760 iPath US Treasury 10-year Bear ETN * 8,763 TOTAL EXCHANGE TRADED NOTE (Cost - $8,201) 8,763
` OPEN ENDED FUNDS - 57.2 %BOND FUND - 13.2 %
94,231 James Alpha Structured Credit Value Portfolio - Class S ^ 990,373
EVENT DRIVEN FUNDS - 44.0 %124,433 Kellner Merger Fund - Institutional Class 1,399,866 110,149 Merger Fund - Investor Class 1,902,268
3,302,134
TOTAL OPEN ENDED FUNDS (Cost - $4,182,081) 4,292,507
See accompanying notes to financial statements.21

SCHEDULE OF INVESTMENTS (Continued)JAMES ALPHA EVENT DRIVEN PORTFOLIONovember 30, 2019
Shares ValueSHORT-TERM INVESTMENTS - 1.6 %
121,035 Dreyfus Institutional Preferred Government Money Market - Institutional Class, 1.59 % ^^ (Cost - $121,035) 121,035
TOTAL INVESTMENTS - 93.3 % (Cost - $7,017,753) 7,004,856$
OTHER ASSETS LESS LIABILITIES - 6.7 % 505,442
NET ASSETS - 100.0% 7,510,298$
ETF - Exchange Traded Fund* Non-income producing securities.^ Affiliated investment.^^ Money Market Fund; interest rate reflects seven-day effective yield on November 30, 2019.
OPEN RETURN SWAPS - 0.0 %
Notional Amount Reference Entity Shares Counterparty
Expiration Date
Pay/Receive Fixed Rate Variable Rate #
Unrealized Appreciation
149,234 MSCI AC World Daily Total Return 136 Goldman Sachs 6/24/2020 Pay 2.1346 5,564$ 126,941 MSCI AC World Daily Total Return 116 Goldman Sachs 6/24/2020 Pay 2.1346 4,749
91,923 MSCI AC World Daily Total Return 84 Goldman Sachs 6/24/2020 Pay 2.1346 3,432 78,772 Russell 2000 Total Return Index 10 Goldman Sachs 6/24/2020 Pay 1.7849 -
204,808 Russell 2000 Total Return Index 26 Goldman Sachs 6/24/2020 Pay 1.7849 - 135,052 S&P 500 Total Return Index 22 Goldman Sachs 6/22/2020 Pay 1.9023 -
13,745$
Notional Amount Reference Entity Shares Counterparty
Expiration Date
Pay/Receive Fixed Rate Variable Rate #
Unrealized Appreciation
2,368,224 Goldman Sachs HY Synthetic Corporate 5Y Total Return 14,317 Goldman Sachs 2/5/2020 Pay 2.1044 28,951$ 216,212 Goldman Sachs HY Synthetic Corporate 5Y Total Return 1,307 Goldman Sachs 2/5/2020 Pay 2.1044 2,617 241,924 Goldman Sachs HY Synthetic Corporate 5Y Total Return 1,463 Goldman Sachs 2/5/2020 Pay 2.1044 2,877
34,445$ # Variable rate is Libor plus 0.11% - 0.32 %
The Goldman Sachs HY Synthetic Corporate 5YR Total Return Strategy is comprised of the two following underlying assets. The Markit CDX/NA.HY 5 Year Long Total return Index ("Markit Index") and The Goldman Sachs 5-year Tresury Futures Index N1 Class B ("Goldman Futures Index"). The Markit Index tracks the performance of selling 5 year credit protection on the relevant on-the-run Markit CDX.NA.HY 5 year CDS contracts and the Goldman Futures Index tracks the excess return performance of a long notional position on a certain contract expiration of a bond future contract, which is “rolled” on a quarterly basis. The Strategy intends to provide exposure to the performance of the two underlying assets.
See accompanying notes to financial statements.22

SCHEDULE OF INVESTMENTS (Continued)JAMES ALPHA EVENT DRIVEN PORTFOLIO November 30, 2019
Settlement Local U.S. Dollar UnrealizedForeign Currency Date Counterparty* Currency Value AppreciationTo Buy:Japanese Yen 12/27/2019 BNY 4,795,432 43,890 (313)
43,890$ (313)$
Settlement Local U.S. Dollar UnrealizedForeign Currency Date Counterparty Currency Value Appreciation To Sell: Australian Dollar 12/27/2019 BNY (30,032) (20,328)$ 140$ Canadian Dollar 12/27/2019 BNY (145,076) (109,255) 401 Euro 12/27/2019 BNY (384,868) (425,208) 2,027 Mexican Peso 12/27/2019 BNY (198,830) (10,160) 168
(564,951)$ 2,736$
Total Unrealized Appreciation On Forward Currency Contracts $ 2,423
* BNY - Bank of New York
See accompanying notes to financial statements.
23

SCHEDULE OF INVESTMENTSJAMES ALPHA FAMILY OFFICE PORTFOLIO November 30, 2019
Shares ValueEXCHANGE TRADED FUNDS - 91.4 %BONDS - 22.9 %
13,094 Invesco Global Short Term High Yield Bond ETF 297,758$ 823 iShares 7-10 Year Treasury Bond ETF 91,822 326 iShares Core U.S. Aggregate Bond ETF 36,792
49 iShares JP Morgan USD Emerging Markets Bond ETF 5,494 4,971 PIMCO Active Bond Exchange-Traded Fund 539,701 3,253 PIMCO Enhanced Short Maturity Active Exchange-Traded Fund 331,025
664 SPDR Blackstone / GSO Senior Loan ETF 30,697 2 SPDR Bloomberg Barclays High Yield Bond ETF 217
6,163 Vanguard Total Bond Market ETF 519,479 1,376 Vanguard Total International Bond ETF 80,028
1,933,013 EQUITY FUNDS - 34.4 %
6,616 First Trust Dow Jones Select Microcap Index Fund 317,634 2,286 Invesco FTSE RAFI US 1000 ETF 283,075 5,096 Invesco S&P 500 Equal Weight ETF 576,510 2,640 iShares Edge MSCI Min Vol USA ETF 171,178 1,544 iShares Edge MSCI USA Momentum Factor ETF 191,410 5,879 iShares Edge MSCI USA Quality Factor ETF 579,963
578 iShares Micro-Cap ETF 54,685 1,375 SPDR S&P 500 ETF Trust 432,176 1,509 SPDR S&P 600 Small CapETF 106,581 1,458 Vanguard Russell 2000 ETF 189,613
2,902,825 INTERNATIONAL FUNDS - 26.3 %
34,233 Invesco Global Listed Private Equity ETF 429,282 4,953 iShares Edge MSCI Min Vol Emerging Markets ETF 282,519 5,999 iShares Edge MSCI Min Vol Global ETF 572,604 5,403 SPDR S&P International Small Cap ETF 168,706
31 Vanguard FTSE All World ex-US Small-Cap ETF 3,334 5,004 Vanguard FTSE All-World ex-US ETF 261,009 3,606 Vanguard FTSE Emerging Markets ETF 151,668
2 Vanguard Total International Stock ETF 108 2,635 Vanguard Total World Stock ETF 207,849 2,118 WisdomTree International SmallCap Dividend Fund 144,359
2,221,438 SECTOR FUNDS - 7.8 %
192 FlexShares Quality Dividend Index Fund 9,151 918 Invesco DWA Momentum ETF 58,225
1,801 iShares U.S. Real Estate ETF 167,853 1,193 SPDR Dow Jones International Real Estate ETF 48,436 3,040 VanEck Vectors Natural Resource ETF 109,481
764 Vanguard Real Estate ETF 71,106 1,233 Vanguard Total Stock Market ETF 197,305
661,557
TOTAL EXCHANGE TRADED FUNDS (Cost - $7,371,922) 7,718,833
EXCHANGE TRADED NOTES - 1.4 %COMMODITIES - 1.4 %
5,423 iPath Bloomberg Commodity Index Total Return ETN *(Cost - $116,754) 117,462
` OPEN ENDED FUNDS - 5.2 %SECTOR FUNDS - 5.2 %
32,837 Leland Thomson Reuters Private Equity Index Fund - Class I (Cost - $410,184) 439,807
SHORT-TERM INVESTMENTS - 2.1 %174,024 Dreyfus Institutional Preferred Government Money Market - Institutional Class, 1.59% ^
(Cost - $174,024) 174,024
TOTAL INVESTMENTS - 100.1 % (Cost - $8,072,884) 8,450,126$
LIABILITIES LESS OTHER ASSETS - (0.1) % (9,691)
NET ASSETS - 100.0 % 8,440,435$
ETF - Exchange Traded FundETN - Exchange Traded Note* Non-income producing securities. ^ Money Market Fund; interest rate reflects seven-day effective yield on November 30, 2019.
See accompanying notes to financial statements.24

SCHEDULE OF INVESTMENTS JAMES ALPHA RELATIVE VALUE PORTFOLIO November 30, 2019
Shares ValueEXCHANGE TRADED FUNDS - 33.5 %BONDS - 24.0 %
1,783 FinEx Tradable Russian Corporate Bonds UCITS ETF * 21,663$ 3,896 High Yield ETF 129,216
17,516 Highland/iBoxx Senior Loan ETF 304,516 7,811 Invesco Global Short Term High Yield Bond ETF 177,622 3,758 Invesco Senior Loan ETF 84,405
62 iShares 20+ Year Treasury Bond ETF 8,706 151 iShares 7-10 Year Treasury Bond ETF 16,847
6,868 iShares Barclays USD Asia High Yield Bond Index ETF 72,869 271 iShares Core U.S. Aggregate Bond ETF 30,585 10 iShares National Muni Bond ETF 1,141
1,545 PIMCO Enhanced Short Maturity Active Exchange-Traded Fund 157,219 2,494 SPDR Blackstone / GSO Senior Loan ETF 115,298
32 SPDR Bloomberg Barclays Euro High Yield Bond UCITS ETF 2,039 599 SPDR Bloomberg Barclays High Yield Bond ETF 64,896 250 SPDR Doubleline Total Return Tactical ETF 12,247
2,267 SPDR Nuveen S&P High Yield Municipal Bond ETF 134,161 12,366 VanEck Vectors Emerging Markets High Yield Bond ETF 290,106
2 VanEck Vectors International High Yield Bond ETF 50 1,496 VanEck Vectors J.P. Morgan EM Local Currency Bond ETF 49,293
11 Vanguard Mortgage-Backed Securities ETF 586 1,673,465
EQUITY FUNDS - 2.8 %1,533 AdvisorShares STAR Global Buy-Write ETF 51,677
316 First Trust BICK Index Fund 8,647 6,006 Invesco S&P 500 BuyWrite ETF 134,474
194,798 INTERNATIONAL FUNDS - 0.6 %
42 First Trust Emerging Markets AlphaDEX Fund 1,024 341 iShares Latin America 40 ETF 10,748 311 VanEck Vectors Brazil Small-Cap ETF 7,445 276 Vanguard Total World Stock ETF 21,771
40,988 PREFERRED FUNDS - 0.3 %
618 iShares Preferred & Income Securities ETF 22,990
SECTOR FUNDS - 5.8 %943 Alerian Energy Infrastructure ETF 18,129
17,332 Alerian MLP ETF 135,710 180 Energy Select Sector SPDR Fund 10,600 370 Invesco Variable Rate Preferred ETF 9,502 54 iShares Mortgage Real Estate ETF 2,371
1,476 iShares S&P GSCI Commodity Indexed Trust * 22,479 1,884 iShares STOXX Europe 600 Insurance UCITS ETF DE 65,601 2,245 SPDR Bloomberg Barclays Convertible Securities ETF 122,802
154 SPDR S&P Insurance ETF 5,467 333 VanEck Vectors Mortgage REIT Income ETF 7,932 67 Vanguard Real Estate ETF 6,236
406,829
TOTAL EXCHANGE TRADED FUNDS (Cost - $2,402,784) 2,339,070
` OPEN ENDED FUNDS - 56.3 %BOND FUNDS - 52.9 %
22,184 American Beacon Sound Point Floating Rate Income - Class Y 211,195 331,218 James Alpha Structured Credit Value Portfolio - Class S ^ 3,481,099
3,692,294 EVENT DRIVEN FUND - 3.4 %
21,134 Kellner Merger Fund - Institutional Class 237,761
TOTAL OPEN ENDED FUNDS (Cost - $3,823,601) 3,930,055
SHORT-TERM INVESTMENTS - 4.7 %323,759 Dreyfus Institutional Preferred Government Money Market - Institutional Class, 1.59% ^^
(Cost - $323,759) 323,759
TOTAL INVESTMENTS - 94.5 % (Cost - $6,550,144) 6,592,884$
OTHER ASSETS LESS LIABILITIES - 5.5 % 385,703
NET ASSETS - 100.0% 6,978,587$
ETF - Exchange Traded Fund * Non-income producing securities. ^ Affiliated investment.^^ Money Market Fund; interest rate reflects seven-day effective yield on November 30, 2019.
See accompanying notes to financial statements.
25

SCHEDULE OF INVESTMENTS (Continued)JAMES ALPHA RELATIVE VALUE PORTFOLIO November 30, 2019
OPEN RETURN SWAPS - 0.0 %
Notional Amount Reference Entity Shares Counterparty
Expiration Date
Pay/Receive Fixed Rate
Variable Rate #
Unrealized Appreciation/ (Depreciation)
46,889 MSCI AC World Daily Total Return Gross Index 42 Goldman Sachs 2/25/2020 Pay 1.7743 -$ 11,128 MSCI AC World Daily Total Return Gross Index 10 Goldman Sachs 2/25/2020 Pay 1.7743 - 85,942 S&P 500 Total Return Index 14 Goldman Sachs 6/22/2020 Pay 1.9023 -
-$
Notional Amount Reference Entity Shares Counterparty
Expiration Date
Pay/Receive Fixed Rate
Variable Rate #
Unrealized Appreciation/ (Depreciation)
2,943,916 Goldman Sachs HY Synthetic Corporate 5Y Total Return 17,797 Goldman Sachs 2/5/2020 Pay 2.1044 35,990 35,990$
# Variable rate is Libor plus 0.11% - 0.32%
The Goldman Sachs HY Synthetic Corporate 5YR Total Return Strategy is comprised of the two following underlying assets. The Markit CDX/NA.HY 5 Year Long Total return Index ("Markit Index") and The Goldman Sachs 5-year Tresury Futures Index N1 Class B ("Goldman Futures Index"). The Markit Index tracks the performance of selling 5 year credit protection on the relevant on-the-run Markit CDX.NA.HY 5 year CDS contracts and the Goldman Futures Index tracks the excess return performance of a long notional position on a certain contract expiration of a bond future contract, which is “rolled” on a quarterly basis. The Strategy intends to provide exposure to the performance of the two underlying assets.
See accompanying notes to financial statements.
26

SCHEDULE OF INVESTMENTS (Continued)JAMES ALPHA RELATIVE VALUE PORTFOLIO November 30, 2019
Settlement Local U.S. Dollar UnrealizedForeign Currency Date Counterparty* Currency Value AppreciationTo Buy:Japanese Yen 12/27/2019 BNY 1,523,103 13,940 (100)$
Settlement Local U.S. Dollar UnrealizedForeign Currency Date Counterparty Currency Value Appreciation To Sell: Euro 12/27/2019 BNY (94,106) (103,970)$ 496$
Total Unrealized Appreciation On Forward Currency Contracts $ 396
* BNY - Bank of New York
See accompanying notes to financial statements.
27

SCHEDULE OF INVESTMENTSJAMES ALPHA TOTAL HEDGE PORTFOLIONovember 30, 2019
Shares ValueEXCHANGE TRADED FUNDS - 59.5 %BONDS - 21.4%
225 Direxion Daily 20 Year Plus Treasury Bull 3x Shares * 6,476$ 583 FinEx Tradable Russian Corporate Bonds UCITS ETF * 7,083
4,638 High Yield ETF 153,825 9,245 Highland/iBoxx Senior Loan ETF 160,724
12,302 Invesco Global Short Term High Yield Bond ETF 279,747 1,491 Invesco Senior Loan ETF 33,488
388 iShares 7-10 Year Treasury Bond ETF 43,289 9,285 iShares Barclays USD Asia High Yield Bond Index ETF 98,514
226 iShares Core U.S. Aggregate Bond ETF 25,506 197 iShares Floating Rate Bond ETF 10,045
1,498 iShares iBoxx High Yield Corporate Bond ETF 130,236 494 iShares JP Morgan USD Emerging Markets Bond ETF 55,387
3,001 PIMCO Enhanced Short Maturity Active Exchange-Traded Fund 305,382 12 ProShares Merger ETF 457
1,703 SPDR Blackstone / GSO Senior Loan ETF 78,730 783 SPDR Bloomberg Barclays Euro High Yield Bond UCITS ETF 49,885
2,527 SPDR Bloomberg Barclays High Yield Bond ETF 273,775 932 SPDR Doubleline Total Return Tactical ETF 45,659 945 SPDR Nuveen Bloomberg Barclays High Yield Municipal Bond ETF 55,925
5,372 VanEck Vectors Emerging Markets High Yield Bond ETF 126,027 2,697 VanEck Vectors International High Yield Bond ETF 66,838
568 VanEck Vectors J.P. Morgan EM Local Currency Bond ETF 18,716 3,528 Vanguard Total International Bond ETF 205,188
579 WisdomTree Emerging Markets Local Debt Fund 20,138 1,916 WisdomTree Interest Rate Hedged High Yield Bond Fund 43,857
2,294,897 EQUITY FUNDS - 11.1 %
488 AdvisorShares STAR Global Buy-Write ETF 16,450 275 Global X S&P 500 Covered Call ETF 13,802
2,179 Invesco S&P 500 BuyWrite ETF 48,788 1,435 Invesco S&P 500 Equal Weight ETF 162,342 1,829 Invesco S&P 500 Pure Value ETF 124,390 3,661 iShares Micro-Cap ETF 346,367
40 iShares Russell 1000 ETF 6,976 812 iShares Russell 1000 Growth ETF 139,201 151 iShares Russell 1000 Value ETF 20,246 329 iShares Russell 2000 ETF 53,222
79 iShares Russell 2000 Growth ETF 16,588 97 iShares Russell 2000 Value ETF 12,137
1,513 iShares Russell Mid-Cap Growth ETF 228,539 33 iShares Russell Mid-Cap Value ETF 3,054 25 iShares S&P Mid-Cap 400 Growth ETF 5,829
1,197,931 INTERNATIONAL FUNDS - 13.3 %
604 Columbia India Consumer ETF 25,323 411 Global X MSCI Argentina ETF 9,724 174 Global X MSCI Nigeria ETF 2,352
4,981 Invesco China Small Cap ETF 121,088 131 iShares China Large-Cap ETF 5,363
8 iShares Currency Hedged MSCI EAFE ETF 249 6,293 iShares Edge MSCI Europe Momentum Factor UCITS ETF * 49,931 1,035 iShares Edge MSCI International Momentum Factor ETF 31,495
261 iShares EURO STOXX Mid UCITS ETF 17,697 887 iShares Latin America 40 ETF 27,958
1,263 iShares Morningstar Multi-Asset Income ETF 31,749 35 iShares MSCI All Country Asia ex Japan ETF 2,438
218 iShares MSCI Australia ETF 4,977 830 iShares MSCI Brazil ETF 35,250
7 iShares MSCI Canada ETF 207 2,369 iShares MSCI EAFE ETF 161,518 1,086 iShares MSCI Frontier 100 ETF 31,744
221 iShares MSCI Germany Small-Cap ETF 12,584 1,754 iShares MSCI India Small-Cap ETF 63,565
292 iShares MSCI Indonesia ETF 7,017 201 iShares MSCI Ireland ETF 9,049 990 iShares MSCI Japan ETF 58,836 223 iShares MSCI Japan Small-Cap ETF 16,911 174 iShares MSCI Peru ETF 5,977 493 iShares MSCI Philippines ETF 16,742
18 iShares MSCI Poland ETF 378 12 iShares MSCI South Africa ETF 595
See accompanying notes to financial statements.
28

SCHEDULE OF INVESTMENTS (Continued)JAMES ALPHA TOTAL HEDGE PORTFOLIONovember 30, 2019
Shares ValueEXCHANGE TRADED FUNDS - 59.5 % (Continued)INTERNATIONAL FUNDS - 13.3 % (Continued)
121 iShares MSCI South Korea ETF 7,075$ 223 iShares MSCI Taiwan ETF 8,797
49 iShares MSCI Thailand ETF 4,285 8 iShares MSCI UAE ETF 110 9 iShares MSCI United Kingdom ETF 296
561 iShares MSCI United Kingdom Small-Cap ETF 23,321 518 SPDR EURO STOXX 50 ETF 20,575
1,026 SPDR S&P Emerging Asia Pacific ETF 100,983 801 VanEck Vectors Africa Index ETF 16,437
1,150 VanEck Vectors Brazil Small-Cap ETF 27,529 63 VanEck Vectors India Small-Cap Index ETF 2,079 68 VanEck Vectors Israel ETF 2,411
1,137 VanEck Vectors Russia ETF 27,584 368 VanEck Vectors Russia Small-Cap ETF 12,915 747 VanEck Vectors Vietnam ETF 11,907
1,243 Vanguard FTSE Emerging Markets ETF 52,281 2,466 Vanguard Total World Stock ETF 194,518
97 WBI BullBear Rising Income 1000 ETF 2,680 359 WisdomTree Emerging Markets SmallCap Dividend Fund 16,302 180 WisdomTree Europe SmallCap Dividend Fund 10,921
83 WisdomTree International SmallCap Dividend Fund 5,657 859 WisdomTree Japan Hedged SmallCap Equity Fund 36,770
1,876 WisdomTree Middle East Dividend Fund 36,301 2,216 Xtrackers Harvest CSI 300 China A-Shares ETF 61,117
1,433,568 PREFERRED FUNDS - 1.0 %
1,316 Global X SuperIncome Preferred ETF 15,305 3,099 Invesco Financial Preferred ETF 57,734
114 Invesco Variable Rate Preferred ETF 2,928 726 iShares Preferred & Income Securities ETF 27,007
102,974 SECTOR FUNDS - 12.7 %
6,531 Alerian MLP ETF 51,138 2,144 AlphaClone Alternative Alpha ETF 124,759
805 Cambria Etf Cambria Core Equity ETF 22,146 913 CI First Asset Active Utility & Infrastructure ETF 8,387 707 Consumer Discretionary Select Sector SPDR Fund 86,572 114 Energy Select Sector SPDR Fund 6,713
52 ETFMG Alternative Harvest ETF 898 207 First Trust Dow Jones Internet Index Fund * 28,508
2,370 First Trust Financial AlphaDEX Fund 78,803 1,385 Global X MSCI China Consumer Discretionary ETF 24,445
16 Global X Scientific Beta US ETF 554 869 Global X Uranium ETF 9,403 249 Invesco China Real Estate ETF 6,505 307 Invesco DB Agriculture Fund 4,958
53 Invesco DWA Consumer Cyclicals Momentum ETF 2,875 85 Invesco DWA Energy Momentum ETF 2,161
463 Invesco DWA Healthcare Momentum ETF * 41,698 32 Invesco Optimum Yield Diversified Commodity Strategy No K-1 ETF 508
1,855 Invesco S&P SmallCap Energy ETF 11,408 36 Invesco S&P SmallCap Health Care ETF * 4,662
9 Invesco S&P SmallCap Information Technology ETF 839 14 Invesco S&P SmallCap Utilities & Communication Services ETF 717 24 Invesco Water Resources ETF 901
1,355 IQ Merger Arbitrage ETF * 44,532 9 IQ US Real Estate Small Cap ETF 236
181 iShares Core S&P/TSX Capped Composite Index ETF 3,711 465 iShares Expanded Tech-Software Sector ETF 107,878 127 iShares Global Clean Energy ETF 1,397
52 iShares Global Timber & Forestry ETF 3,372 24 iShares MBS ETF 2,595 26 iShares Mortgage Real Estate ETF 1,142
740 iShares Nasdaq Biotechnology ETF 88,541 1 iShares National Muni Bond ETF 114
2,929 iShares S&P GSCI Commodity Indexed Trust * 44,609 1,821 iShares S&P/TSX Capped Materials Index ETF 19,440
34 iShares S&P/TSX Global Gold Index ETF 389 197 iShares Silver Trust * 3,136
See accompanying notes to financial statements.
29

SCHEDULE OF INVESTMENTS (Continued)JAMES ALPHA TOTAL HEDGE PORTFOLIONovember 30, 2019
Shares ValueEXCHANGE TRADED FUNDS - 59.5 % (Continued)SECTOR FUNDS - 12.7 % (Continued)
58 iShares STOXX Europe 600 Banks UCITS ETF DE 878$ 196 iShares STOXX Europe 600 Basic Resources UCITS ETF DE 9,698 754 iShares STOXX Europe 600 Insurance UCITS ETF DE 26,254
59 iShares STOXX Europe 600 Utilities UCITS ETF DE 2,217 80 iShares U.S. Consumer Services ETF 18,045 10 iShares U.S. Financial Services ETF 1,485
139 iShares U.S. Healthcare Providers ETF 27,087 7 iShares U.S. Medical Devices ETF 1,819
75 iShares US Pharmaceuticals ETF 11,350 685 KraneShares CSI China Internet ETF 31,921
87 Materials Select Sector SPDR Fund 5,223 68 ProShares Short VIX Short-Term Futures ETF * 4,287
4,024 SPDR Bloomberg Barclays Convertible Securities ETF 220,113 1 SPDR Dow Jones Global Real Estate ETF 52
312 SPDR Gold Shares * 43,012 175 SPDR S&P Insurance ETF 6,213 300 SPDR S&P Metals & Mining ETF 8,298 163 SPDR S&P Oil & Gas Exploration & Production ETF 3,319 609 SPDR S&P Regional Banking ETF 34,238 176 SPDR S&P Retail ETF 7,864
98 United States Commodity Index Fund * 3,432 719 United States Natural Gas Fund LP * 12,820
93 VanEck Vectors Junior Gold Miners ETF 3,548 63 VanEck Vectors Low Carbon Energy ETF 4,378
107 VanEck Vectors Mortgage REIT Income ETF 2,549 6 VanEck Vectors Rare Earth/Strategic Metals ETF 76
86 VanEck Vectors Semiconductor ETF 11,430 1,695 VanEck Vectors Unconventional Oil & Gas ETF 16,560
61 Vanguard Real Estate ETF 5,677 1,364,493
TOTAL EXCHANGE TRADED FUNDS (Cost - $6,460,564) 6,393,863
EXCHANGE TRADED NOTES - 0.1 %BOND FUND - 0.0 %
184 iPath US Treasury 10-year Bear ETN * 2,122
COMMODITY FUNDS - 0.0 %267 ETRACS CMCI Total Return ETN * 3,785
4 iPath Series B Bloomberg Coffee Subindex Total Return ETN * 154 16 iPath Series B Bloomberg Grains Subindex Total Return ETN * 706
4,645 EQUITY FUND - 0.1 %
374 iPath Series B S&P 500 VIX Short-Term Futures ETN * 6,186
TOTAL EXCHANGE TRADED NOTES (Cost - $14,651) 12,953
` OPEN ENDED FUNDS - 34.4 %BOND FUND - 26.7 %
273,194 James Alpha Structured Credit Value Portfolio - Class S ^ 2,871,268
EVENT DRIVEN FUNDS - 5.4 %27,475 Kellner Merger Fund - Institutional Class 309,092 15,435 Merger Fund - Investor Class 266,556
575,648 MANAGED FUTURES FUNDS - 2.3 %
13,036 Altegris Futures Evolution Strategy Fund - Class I 120,188 14,870 AQR Managed Futures Strategy Fund - Class I * 125,204
245,392 TOTAL OPEN ENDED FUNDS (Cost - $3,613,329) 3,692,308
SHORT-TERM INVESTMENTS - 2.8 %MONEY MARKET FUND - 2.8 %
303,069 Dreyfus Institutional Preferred Government Money Market - Institutional Class, 1.59 % ^^(Cost - $303,069) 303,069
TOTAL INVESTMENTS - 96.8 % (Cost - $10,391,613) 10,402,193$
OTHER ASSETS LESS LIABILITES - 3.2 % 346,707
NET ASSETS - 100.0% 10,748,900$
ETF - Exchange Traded FundLP - Limited Partnership* Non-income producing securities. ^ Affliliated investment.^^ Money Market Fund; interest rate reflects seven-day effective yield on November 30, 2019.
See accompanying notes to financial statements.
30

SCHEDULE OF INVESTMENTS (Continued)JAMES ALPHA TOTAL HEDGE PORTFOLIONovember 30, 2019
TOTAL RETURN SWAP - 0.7 % Unrealized Gain
74,436$ 74,436$
James Alpha Index Swap Top 50 Holdings
Number of Contracts Open Long Future Contracts Counterparty Expiration
Percentage of Total Return
Swap Unrealized 18 2 year Euro-Schatz Future Deutsche Bank 2,177,336 12/6/2019 5,498$ 7.39%3 3 month Euro (EURIBOR) Deutsche Bank 810,520 9/14/2020 330 0.44%2 3 month Euro (EURIBOR) Deutsche Bank 680,462 3/15/2021 379 0.51%2 3 month Euro (EURIBOR) Deutsche Bank 638,621 6/14/2021 173 0.23%4 3 month Euro (EURIBOR) Deutsche Bank 1,127,841 9/13/2021 712 0.96%4 3 month Sterling Deutsche Bank 714,423 3/18/2020 267 0.36%4 3 month Sterling Deutsche Bank 576,126 6/17/2020 303 0.41%
15 3 month Sterling Deutsche Bank 2,371,873 9/16/2020 (921) (1.24)%4 3 month Sterling Deutsche Bank 663,610 12/16/2020 125 0.17%2 3 month Sterling Deutsche Bank 329,093 3/17/2021 51 0.07%4 3 month Sterling Deutsche Bank 661,571 6/16/2021 181 0.24%
10 3 year Australian Treasury Bond Future Deutsche Bank 817,718 12/16/2019 (686) (0.92)%3 10 year Italian Bond Future Deutsche Bank 510,851 3/6/2020 (826) (1.11)%2 10 year US Treasury Notes Future Deutsche Bank 321,239 3/20/2020 616 0.83%5 90 Day Bank Accepted Bill Future Deutsche Bank 835,588 3/12/2020 (416) (0.56)%8 90 Day Bank Accepted Bill Future Deutsche Bank 1,273,471 6/11/2020 227 0.30%3 90 Day Bank Accepted Bill Future Deutsche Bank 552,158 9/10/2020 (243) (0.33)%1 DAX Index Future Deutsche Bank 470,752 12/20/2019 12,220 16.42%
93 DJ EURO STOXX Banks Future Deutsche Bank 479,141 12/20/2019 30,216 40.59%12 EURO STOXX 50 Index Future Deutsche Bank 505,519 12/20/2019 2,071 2.78%3 Euro-BOBL Future Deutsche Bank 384,631 12/6/2019 4,444 5.97%6 Eurodollar Deutsche Bank 1,487,038 9/14/2020 (356) (0.48)%6 Eurodollar Deutsche Bank 1,437,123 9/13/2021 (760) (1.02)%4 Eurodollar Deutsche Bank 984,548 9/19/2022 (615) (0.83)%5 FTSE 100 Index Future Deutsche Bank 509,160 12/20/2019 1,174 1.58%
11 Light Sweet Crude Oil (WTI) Future Deutsche Bank 617,477 12/19/2019 41 0.06%4 Nikkei 225 (JPY) Future Deutsche Bank 410,709 12/12/2019 2,882 3.87%3 Nikkei 225 Index Deutsche Bank 347,253 12/12/2019 9,573 12.86%3 S&P Canada 60 Index Future Deutsche Bank 419,992 12/19/2019 8,968 12.05%
75,628
Number of Contracts Open Short Future Contracts Counterparty
Notional Value at November 30, 2019 Expiration
Unrealized Appreciation / (Depreciation)
Percentage of Total Return
Swap Unrealized (5) 3 month Euro (EURIBOR) Deutsche Bank 1,520,388 6/15/2020 931 1.25%(9) 5 year US Treasury Notes Future Deutsche Bank 1,105,080 3/31/2020 2,640 3.55%(0) 10 year Japanese Government Bond Future Deutsche Bank 406,724 12/13/2019 280 0.38%(8) AUD/USD Deutsche Bank 552,707 12/16/2019 4,949 6.65%(9) EUR/USD Deutsche Bank 1,260,857 12/16/2019 1,628 2.19%(2) Euro-BUND Future Deutsche Bank 331,854 12/6/2019 7,122 9.57%(3) Euro-BUND Future Deutsche Bank 553,251 3/6/2020 303 0.41%(7) Eurodollar Deutsche Bank 1,820,127 6/15/2020 830 1.12%(5) JPY/USD Deutsche Bank 596,590 12/16/2019 9,537 12.81%(3) Nikkei 225 Future Deutsche Bank 390,574 12/12/2019 (2,805) (3.77)%
25,415
TOTAL FUTURES CONTRACTS 101,043$
FUTURES CONTRACTS*
Notional Value at November 30, 2019
Unrealized Appreciation / (Depreciation)
The Deutsche Bank Total Return Swap provides exposure to the daily, total returns of the James Alpha Index, a proprietary index of the London Branch
of Deutsche Bank AG. The number of shares is 10,137, with a receivable rate of 1.85% The James Alpha Index features a basket of commodity trading
advisor (“CTA”) programs selected by James Alpha Advisors, LLC from an approved list of third-party managers offered through Deutsche Bank AG on
its DB Select platform. The James Alpha Index comprises a diversified collection of strategy and style types, including trend following, short-term
trading, discretionary, global macro, and sector specialists. According to the terms of the swap, James Alpha Advisors, LLC can modify the James Alpha
Index as frequently as daily, on a T+1 basis, by adjusting the notional value of the James Alpha Index, or by adding, deleting, or re-weighting the
constituent CTA programs. The swap became effective on August 2, 2018, and has a term of three years there from unless terminated earlier. (Notional
Value $1,000,000)
See accompanying notes to financial statements.
31
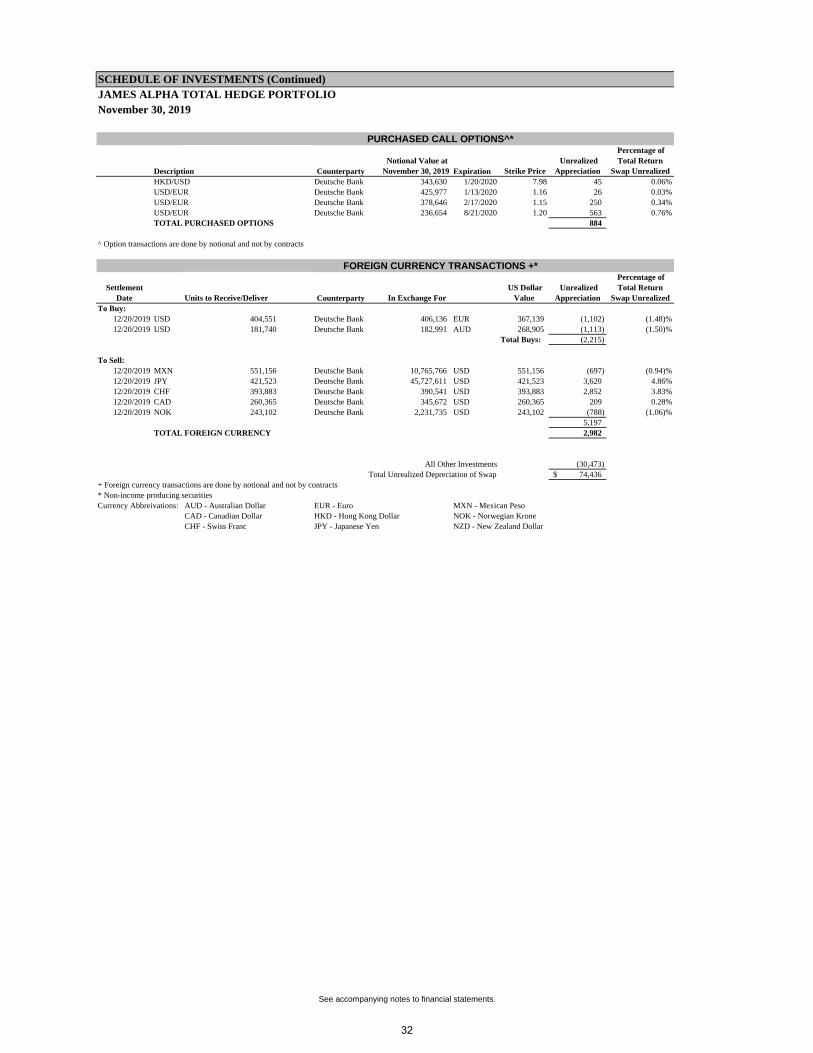
SCHEDULE OF INVESTMENTS (Continued)JAMES ALPHA TOTAL HEDGE PORTFOLIONovember 30, 2019
Description Counterparty Notional Value at
November 30, 2019 Expiration Strike Price Unrealized
Appreciation
Percentage of Total Return
Swap Unrealized HKD/USD Deutsche Bank 343,630 1/20/2020 7.98 45 0.06%USD/EUR Deutsche Bank 425,977 1/13/2020 1.16 26 0.03%USD/EUR Deutsche Bank 378,646 2/17/2020 1.15 250 0.34%USD/EUR Deutsche Bank 236,654 8/21/2020 1.20 563 0.76%TOTAL PURCHASED OPTIONS 884
^ Option transactions are done by notional and not by contracts
Settlement Date Units to Receive/Deliver Counterparty In Exchange For
US Dollar Value
Unrealized Appreciation
Percentage of Total Return
Swap Unrealized To Buy:
12/20/2019 USD 404,551 Deutsche Bank 406,136 EUR 367,139 (1,102) (1.48)%12/20/2019 USD 181,740 Deutsche Bank 182,991 AUD 268,905 (1,113) (1.50)%
Total Buys: (2,215)
To Sell:12/20/2019 MXN 551,156 Deutsche Bank 10,765,766 USD 551,156 (697) (0.94)%12/20/2019 JPY 421,523 Deutsche Bank 45,727,611 USD 421,523 3,620 4.86%12/20/2019 CHF 393,883 Deutsche Bank 390,541 USD 393,883 2,852 3.83%12/20/2019 CAD 260,365 Deutsche Bank 345,672 USD 260,365 209 0.28%12/20/2019 NOK 243,102 Deutsche Bank 2,231,735 USD 243,102 (788) (1.06)%
5,197 TOTAL FOREIGN CURRENCY 2,982
All Other Investments (30,473) Total Unrealized Depreciation of Swap 74,436$
+ Foreign currency transactions are done by notional and not by contracts* Non-income producing securitiesCurrency Abbreivations: AUD - Australian Dollar EUR - Euro MXN - Mexican Peso
CAD - Canadian Dollar HKD - Hong Kong Dollar NOK - Norwegian KroneCHF - Swiss Franc JPY - Japanese Yen NZD - New Zealand Dollar
FOREIGN CURRENCY TRANSACTIONS +*
PURCHASED CALL OPTIONS^*
See accompanying notes to financial statements.
32

SCHEDULE OF INVESTMENTS (Continued)JAMES ALPHA TOTAL HEDGE PORTFOLIONovember 30, 2019
UnrealizedSettlement Local U.S. Dollar Appreciation/
Foreign Currency Date Counterparty* Currency Value (Depreciation)To Buy:Japanese Yen 12/27/2019 BNY 4,484,023 41,039$ (293)$ Swiss Franc 12/27/2019 BNY 5,037 5,052 (62)
(355)$
UnrealizedSettlement Local U.S. Dollar Appreciation/
Foreign Currency Date Counterparty Currency Value (Depreciation)To Sell: Australian Dollar 12/27/2019 BNY (6,226) (4,214)$ 29$ British Pound 12/27/2019 BNY (137,731) (178,361) 342 Canadian Dollar 12/27/2019 BNY (51,234) (38,584) 141 Euro 12/27/2019 BNY (8,153) (9,008) 43 Mexican Peso 12/27/2019 BNY (81,676) (4,174) 69
(234,341)$ 624$
Total Unrealized Appreciation On Forward Currency Contracts $ 269
*BNY- Bank of New York
See accompanying notes to financial statements.
33

SCHEDULE OF INVESTMENTSJAMES ALPHA STRUCTURED CREDIT VALUE PORTFOLIONovember 30, 2019
Principal Variable Rate Coupon Rate (%) Maturity ValueBONDS & NOTES - 93.2 %ASSET BACKED SECURITIES - 75.7 %
79,328$ Adjustable Rate Mortgage Trust 2005-10 (b) 4.275 1/25/2036 75,118$ 91,599 Alternative Loan Trust 1998-4 (d) 6.869 8/25/2028 94,995
132,326 Alternative Loan Trust 2004-28CB 6.000 1/25/2035 133,478 180,546 Alternative Loan Trust 2004-J8 7.000 8/25/2034 190,800 107,169 Alternative Loan Trust 2004-J11 7.250 8/25/2032 116,664
90,615 Alternative Loan Trust 2005-14 (a) 1 Month LIBOR + 0.21% 1.918 5/25/2035 87,314 251,464 Alternative Loan Trust 2005-6CB 5.500 4/25/2035 257,060
79,414 Alternative Loan Trust 2005-54CB 5.500 11/25/2035 75,746 58,555 Alternative Loan Trust 2005-J11 6.000 10/25/2035 44,455 95,668 Alternative Loan Trust 2005-J11 5.500 11/25/2035 80,673
107,569 Alternative Loan Trust 2006-40T1 6.000 12/25/2036 54,786 50,000 Alternative Loan Trust Resecuritization 2005-12R 6.000 11/25/2034 49,828
136,701 American Residential Home Equity Loan Trust 1998-1 (a) 1 Month LIBOR + 2.18% 3.883 5/25/2029 131,992 189,733 ARCap 2003-1 Resecuritization Trust (c) 7.110 8/20/2038 189,619 480,377 Aspen Funding I Ltd. 9.060 7/10/2037 499,366
74,939 Banc of America Funding 2005-E Trust (a) COF 11 + 1.43 % 2.557 6/20/2035 58,230 174,836 Banc of America Funding 2007-2 Trust 6.000 3/25/2037 38,909
29,722 Banc of America Mortgage 2002-L Trust (b) 3.115 12/25/2032 24,894 90,216 Bayview Commercial Asset Trust 2005-2 (a,c) 1 Month LIBOR + 1.15% 2.858 8/25/2035 85,701
771,209 Bayview Commercial Asset Trust 2007-3 (a,c) 1 Month LIBOR + 0.34% 2.048 7/25/2037 736,034 1,878,778 Bayview Commercial Asset Trust 2007-3 (a,c) 1 Month LIBOR + 0.50% 2.208 7/25/2037 1,776,321
50,000 Bayview Financial Acquisition Trust (d) 6.096 12/28/2036 50,965 9,169 Bear Stearns ALT-A Trust 2004-11 (b) 3.333 11/25/2034 9,044
13,090 Bear Stearns ARM Trust 2003-7 (b) 4.225 10/25/2033 13,453 500,000 Bellemeade Re 2019-2 Ltd. (a,c) 1 Month LIBOR + 3.10% 4.808 4/25/2029 508,969 254,110 Cascade Funding Mortgage Trust 2019-RM3 (b,c) 4.000 6/25/2069 237,535
1,000,000 Cascade MH Asset Trust 2019-MH1 (b,c) 5.985 11/1/2044 1,009,662 256,213 Chase Funding Loan Acquisition Trust Series 2004-AQ1 (a) 1 Month LIBOR + 2.93% 4.633 5/25/2034 267,727 156,106 Chase Mortgage Finance Trust Series 2004-S2 5.500 2/25/2034 159,221 367,750 Chase Mortgage Finance Trust Series 2007-S3 6.000 5/25/2037 201,202 654,750 Chase Mortgage Finance Trust Series 2007-S3 0.000 5/25/2037 138,969 181,239 CHL Mortgage Pass-Through Trust 2002-19 6.250 11/25/2032 183,537 121,742 CHL Mortgage Pass-Through Trust 2004-HYB5 (b) 3.910 4/20/2035 115,962 112,567 CHL Mortgage Pass-Through Trust 2004-J9 5.500 1/25/2035 115,590 185,134 CHL Mortgage Pass-Through Trust 2006-J1 6.000 2/25/2036 139,735
75,668 Citigroup Mortgage Loan Trust, Inc. 6.750 8/25/2034 82,001 110,433 CitiMortgage Alternative Loan Trust Series 2007-A6 6.000 6/25/2037 108,908 598,958 Credit Suisse First Boston Mortgage Securities Corp. (b) 7.191 1/25/2032 598,321 148,770 Credit Suisse First Boston Mortgage Securities Corp. 5.500 6/25/2033 152,771 569,149 Credit Suisse First Boston Mortgage Securities Corp. 5.500 10/25/2033 604,410 189,716 Credit Suisse First Boston Mortgage Securities Corp. 5.500 10/25/2033 201,436 192,772 Credit Suisse First Boston Mortgage Securities Corp. (a) 1 Month LIBOR + 0.65% 2.358 9/25/2035 149,742
19,779 Credit-Based Asset Servicing & Securitization LLC (d) 5.062 9/25/2032 20,583 279,834 CSFB Mortgage-Backed Pass-Through Certificates Series 2004-4 6.000 8/25/2034 291,899
80,165 CSFB Mortgage-Backed Pass-Through Certificates Series 2005-3 5.750 7/25/2035 82,227 39,235 CSFB Mortgage-Backed Pass-Through Certificates Series 2005-10 5.250 11/25/2020 31,154
129,006 CSFB Mortgage-Backed Trust Series 2004-7 5.250 11/25/2034 130,377 329,672 CSMC Trust 2007-5R 6.500 7/26/2036 152,620
1,000,000 Deerpath Capital CLO 2018-1 LTD. (a,c) 3 Month LIBOR + 3.50% 5.501 1/15/2031 995,441 204,590 Delta Funding Home Equity Loan Trust 1999-3 (d) 8.061 9/15/2029 208,176 295,000 EdLinc Student Loan Funding Trust 2012-1 (a,c) 1 Month LIBOR + 4.24% 5.948 11/26/2040 348,937 413,203 Financial Asset Securities Corp AAA Trust 2005-1 (a,c) 1 Month LIBOR + 0.38% 2.080 2/27/2035 401,512 328,444 Financial Asset Securities Corp AAA Trust 2005-1 (a,c) 1 Month LIBOR + 0.41% 2.109 2/27/2035 316,479 110,316 First Horizon Alternative Mortgage Securities Trust 2007-FA4 6.250 8/25/2037 83,245
15,191 Freddie Mac Structured Pass-Through Certificates (a) 1 Month LIBOR + 0.13% 1.838 8/25/2031 15,135 17,386 Freddie Mac Structured Pass-Through Certificates (a) 12 Month TA + 1.40% 3.790 7/25/2044 17,820
200,000 GC FTPYME Pastor 4 FTA (a) 3 Month EURO + 2.40% 1.982 7/15/2045 89,730 173,080 GE Capital Mortgage Services Inc 1999-HE1 Trust (b) 6.700 4/25/2029 181,539
34,115 GMACM Mortgage Loan Trust 2005-AR3 (b) 4.304 6/19/2035 34,262 255,462 GSMPS Mortgage Loan Trust 2004-4 (c) 7.500 6/25/2034 280,081
53,482 GSMPS Mortgage Loan Trust 2005-RP2 (a,c) 1 Month LIBOR + 0.35% 2.058 3/25/2035 50,052 186,894 GSR Mortgage Loan Trust 2004-13F 4.250 11/25/2034 191,681
37,197 GSR Mortgage Loan Trust 2005-8F 6.000 11/25/2035 27,393 119,695 GSR Mortgage Loan Trust 2005-AR1 (b) 3.571 1/25/2035 119,519
6,877 GSR Mortgage Loan Trust 2005-AR3 (a) 1 Month LIBOR + 0.44% 2.148 5/25/2035 6,811 50,738 GSR Mortgage Loan Trust 2005-AR6 (b) 4.505 9/25/2035 51,845
500,000 Harvest Commercial Capital Loan Trust 2019-1 (b,c) 5.730 11/25/2031 500,000 85,000 HomeBanc Mortgage Trust 2005-3 (a) 1 Month LIBOR + 0.51% 2.218 7/25/2035 85,401
255,749 HSI Asset Loan Obligation Trust 2007-1 6.500 6/25/2037 148,888 168,299 Impac CMB Trust Series 2003-2F (d) 6.570 1/25/2033 171,536
72,254 Impac CMB Trust Series 2004-7 (a) 1 Month LIBOR + 1.80% 3.508 11/25/2034 73,523
See accompanying notes to financial statements.34

SCHEDULE OF INVESTMENTS (Continued) JAMES ALPHA STRUCTURED CREDIT VALUE PORTFOLIONovember 30, 2019
Principal Variable Rate Coupon Rate (%) Maturity ValueBONDS & NOTES - 93.2 % (Continued)ASSET BACKED SECURITIES - 75.7 % (Continued)
71,913$ IndyMac INDX Mortgage Loan Trust 2005-AR15 (b) 3.820 9/25/2035 67,677$ 282,168 JP Morgan Alternative Loan Trust (a) 1 Month LIBOR + 7.15% 5.442 12/25/2035 96,936 128,833 JP Morgan Chase Commercial Mortgage Securities Trust 2015-FL7 (a,c) 1 Month LIBOR + 3.75% 5.515 5/15/2028 126,757
76,110 JP Morgan Mortgage Trust 2005-A7 (b) 4.110 10/25/2035 78,713 40,107 JP Morgan Mortgage Trust 2006-A4 (b) 4.438 6/25/2036 35,960 40,992 MASTR Adjustable Rate Mortgages Trust 2003-2 (b) 4.612 7/25/2033 41,377 51,910 MASTR Adjustable Rate Mortgages Trust 2003-6 (b) 3.964 12/25/2033 51,383
296,965 MASTR Adjustable Rate Mortgages Trust 2005-7 (b) 3.865 9/25/2035 217,692 46,797 MASTR Adjustable Rate Mortgages Trust 2007-2 (a) 1 Month LIBOR + 0.15% 1.858 3/25/2047 45,596 74,148 MASTR Alternative Loan Trust 2003-7 6.500 12/25/2033 77,716 64,860 MASTR Alternative Loan Trust 2004-7 6.000 6/25/2034 67,072 92,858 MASTR Alternative Loan Trust 2007-1 0.000 10/25/2036 61,974 33,943 MASTR Asset Securitization Trust 2004-1 5.500 2/25/2034 33,960
205,906 Mellon Residential Funding Cor Mor Pas Thr Tr Ser 1999-tbc3 (b,c) 2.766 10/20/2029 181,906 123,464 Mellon Residential Funding Cor Mor Pas Thr Tr Ser 1999-tbc3 (b,c) 2.766 10/20/2029 93,298
43,222 Merrill Lynch Mortgage Investors Trust Series 2003-A6 (b) 4.036 9/25/2033 42,607 101,353 Merrill Lynch Mortgage Investors Trust Series MLCC 2006-2 (b) 4.173 5/25/2036 101,143
39,019 Morgan Stanley Dean Witter Capital I Inc Trust 2003-HYB1 (b) 3.837 3/25/2033 39,287 67,066 Morgan Stanley Mortgage Loan Trust 2004-8AR (b) 4.375 10/25/2034 69,829
127,032 Morgan Stanley Mortgage Loan Trust 2005-10 6.000 12/25/2035 99,127 39,795 Morgan Stanley Mortgage Loan Trust 2006-8AR (b) 4.269 6/25/2036 38,908
359,265 MortgageIT Trust 2004-2 (a) 1 Month LIBOR + 3.23% 4.933 12/25/2034 368,259 238,050 Nomura Asset Acceptance Corp. 2004-R1 A2 (c) 7.500 3/25/2034 243,897 148,617 Nomura Asset Acceptance Corp. 2007-1 1A3 (d) 5.957 3/25/2047 156,209
23,537 Option One Mortgage Accep Corp. Asset Back Certs Ser 2003-4 (a) 1 Month LIBOR + 2.48% 4.183 7/25/2033 24,761 62,241 Option One Mortgage Loan Trust 2002-3 (a) 1 Month LIBOR + 0.50% 2.208 8/25/2032 61,845
500,000 Peaks CLO 2 Ltd. (a,c) 3 Month LIBOR + 3.60% 5.566 7/20/2031 491,417 48,585 PHEAA Student Loan Trust 2015-1 (a,c) 1 Month LIBOR + 0.60% 2.308 10/25/2041 47,486 20,184 PHH Mortgage Trust Series 2008-CIM1 (a) 1 Month LIBOR + 2.25% 4.031 5/25/2038 20,844 31,884 RALI Series 2004-QS16 Trust 5.000 12/25/2019 31,887
112,136 RALI Series 2005-QA12 Trust (b) 4.859 12/25/2035 73,110 446,945 RAMP Series 2004-RS2 Trust (d) 5.590 2/25/2034 463,819 300,236 RBSGC Structured Trust 2008-A (c) 5.500 11/25/2035 293,988 109,174 RBSSP Resecuritization Trust 2009-1 (b,c) 6.000 8/26/2035 113,711 211,498 RBSSP Resecuritization Trust 2009-1 (b,c) 6.000 8/26/2035 201,097
1,500,000 Ready Capital Mortgage Trust 2019-5 (b,c) 5.639 2/25/2052 1,453,541 500,000 ReadyCap Commercial Mortgage Trust 2019-6 (b,c) 4.931 10/25/2052 491,905 340,846 Resecuritization Pass-Through Trust 2005-8R 6.000 10/25/2034 349,625
69,698 Residential Asset Securitization Trust 2004-A3 5.250 6/25/2034 69,822 1 RFMSI Series 2003-S11 Trust 5.000 6/25/2055 -
626 RFMSI Series 2006-SA2 Trust (b) 5.319 8/25/2036 606 15,136 Ryland Mortgage Securities Corp. (b) 0.000 4/29/2030 11,447 65,940 Saxon Asset Securities Trust 2001-2 (d) 7.170 3/25/2029 70,888
320,430 Saxon Asset Securities Trust 2003-3 (d) 4.668 12/25/2033 325,339 500,000 Seasoned Credit Risk Transfer Trust Series 2019-1 (b,c) 4.750 7/25/2058 500,901 711,555 Security National Mortgage Loan Trust 2005-2 (b,c) 6.213 2/25/2036 738,200
35,841 Sequoia Mortgage Trust 2004-8 (a) 1 Month LIBOR + 0.70% 2.424 9/20/2034 35,631 74,674 Sequoia Mortgage Trust 2004-10 (a) 1 Month LIBOR + 0.62% 2.344 11/20/2034 74,385
113,730 Sequoia Mortgage Trust 2005-2 (a) 1 Month LIBOR + 0.22% 1.944 3/20/2035 112,295 40,000 SLM Student Loan Trust 2012-7 (a) 1 Month LIBOR + 1.80% 3.508 9/25/2043 38,649
213,328 Southern Pacific Secured Asset Corp. 7.320 5/25/2027 213,013 50,896 Structured Adjustable Rate Mortgage Loan Trust Series 2005-15 (b) 4.136 7/25/2035 40,719 56,954 Structured Asset Securities Corp. (a) 1 Month LIBOR + 0.78% 2.811 12/25/2033 50,896
114,464 Structured Asset Securities Corp. Pass-Through Certificates Series 2002-AL1 3.450 2/25/2032 111,535 731,454 Terwin Mortgage Trust 2004-1HE (a,c) 1 Month LIBOR + 2.48% 4.183 2/25/2034 678,107 664,918 WaMu Mortgage Pass-Through Certificates Series 2003-S4 (b) 5.637 6/25/2033 678,460 117,106 WaMu Mortgage Pass-Through Certificates Series 2006-AR2 Trust (b) 4.251 3/25/2036 115,186
81,713 WaMu Mortgage Pass-Through Certificates Series 2006-AR11 Trust (a) COF 11 + 1.50 % 2.655 9/2/2046 84,016 116,027 Washington Mutual MSC Mortgage Pass-Through Certificates Series 2003-MS2 Trust 5.750 2/25/2033 118,575
1,000,000 Z Capital Credit Partners CLO 2018-1 Ltd. (a,c) 3 Month LIBOR + 2.45% 4.451 1/16/2031 1,001,717 1,000,000 Z Capital Credit Partners CLO 2019-1 Ltd. (a,c) 3 Month LIBOR + 5.25% 7.509 7/15/2031 1,003,074
500,000 Zais Clo 13 Ltd. (a,c) 3 Month LIBOR + 4.52% 6.599 7/15/2032 470,224 TOTAL ASSET BACKED SECURITIES 28,059,013
See accompanying notes to financial statements.35

SCHEDULE OF INVESTMENTS (Continued) JAMES ALPHA STRUCTURED CREDIT VALUE PORTFOLIONovember 30, 2019
Principal Variable Rate Coupon Rate (%) Maturity ValueBONDS & NOTES - 93.2 % (Continued)BANKS - 17.5 %
500,000$ Argentine Republic Government International Bond 7.1250 6/28/2117 205,467$ 150,000 Citigroup Global Markets Holdings, Inc. (a) (50*(USISDA30-USISDA02)) 10.0000 12/26/2028 150,525 115,000 Citigroup Global Markets Holdings, Inc. (a) (50*(USISDA30-USISDA02)) 8.5000 10/31/2038 109,871 615,000 Citigroup Global Markets Holdings, Inc. (a) (50*(USISDA30-USISDA02)) 12.0000 11/21/2038 597,841 277,000 Credit Suisse AG (a) (8*(USISDA30-USISDA02)) 2.8560 2/27/2030 199,440 204,000 Jefferies Group LLC (a) (9*(USISDA10-USISDA02)) 8.0000 8/31/2037 174,420
25,000 Morgan Stanley 8.0000 3/21/2027 26,250 299,000 Morgan Stanley (a) (5*(USISDA30-USISDA02)) 0.2100 8/30/2028 226,119 173,000 Morgan Stanley (a) (5*(USISDA30-USISDA02)) 0.2100 8/30/2028 131,696
1,000,000 Morgan Stanley (a) (8*(USISDA30-USISDA05)) 3.8960 9/27/2028 742,500 398,000 Morgan Stanley (a) (5*(USISDA30-USISDA02)) 1.9450 10/15/2028 299,495
1,209,000 Morgan Stanley (a) (10*(USISDA30-USISDA02)) 0.7050 4/30/2030 915,817 177,000 Morgan Stanley (a) (10*(USISDA30-USISDA02)) 0.7500 5/29/2030 129,210 142,000 Morgan Stanley (a) (8*(USISDA30-USISDA02)) 0.5640 7/31/2030 100,642 220,000 Morgan Stanley (a) (8.5*(USISDA30-USISDA02)) 3.1620 8/19/2030 152,350 216,000 Morgan Stanley (a) (8*(USISDA30-USISDA02)) 2.2590 8/31/2030 149,850 151,000 Morgan Stanley (a) (7*(USISDA30-USISDA02)) 1.8900 10/30/2030 105,700
39,000 Morgan Stanley 8.5000 5/31/2031 41,145 114,000 Morgan Stanley 8.5000 7/29/2031 119,415 288,000 Morgan Stanley (a) (4*(USISDA30-USISDA02)) 0.2440 2/28/2034 180,360 370,000 Morgan Stanley (a) (5*(USISDA30-USISDA02)) 1.3500 6/30/2034 232,638
70,000 Morgan Stanley (a) (5*(USISDA30-USISDA02)) 0.8900 10/8/2034 45,063 196,000 Morgan Stanley (a) (5*(USISDA30-USISDA02)) 1.2900 11/28/2034 125,930 204,000 Morgan Stanley (a) (4.5*(USISDA30-USISDA02)) 0.3173 12/31/2034 131,580 202,000 Morgan Stanley (a) (5*(USISDA30-USISDA02)) 1.2900 2/27/2035 129,280 209,000 Morgan Stanley (a) (9*(USISDA30-USISDA02)) 9.0000 4/30/2035 219,189 134,000 Morgan Stanley (a) (9*(USISDA30-USISDA02)) 8.0000 12/23/2035 137,183 132,000 Morgan Stanley (a) (10*(USISDA30-USISDA02)) 2.5300 2/29/2036 90,090
45,000 Morgan Stanley Finance LLC (a) (10*(USISDA30-USISDA02)) 9.0000 6/30/2036 30,994 65,000 Morgan Stanley Finance LLC (a) (15*(USISDA30-USISDA02)) 3.7950 7/29/2036 52,975
304,000 Morgan Stanley Finance LLC (a) (20*(USISDA30-USISDA02)) 9.0000 8/31/2036 252,700 309,000 Morgan Stanley Finance LLC (a) (20*(USISDA30-USISDA02)) 9.0000 11/29/2036 257,629
50,000 Morgan Stanley Finance LLC (a) (20*(USISDA30-USISDA02)) 9.0000 1/31/2037 41,500 6,504,864
TOTAL BONDS AND NOTES (Cost - $33,852,642) 34,563,877
U.S. GOVERNMENT & AGENCY OBLIGATIONS - 0.0 %U.S AGENCY COMMERCIAL MORTGAGE OBLIGATIONS - 0.0 %
47,433 Freddie Mac REMICS (a) 1 Month LIBOR + 6.39% 4.6246 11/15/2037 5,792 57,111 Freddie Mac REMICS (a) 1 Month LIBOR + 6.18% 4.4146 2/15/2038 5,923
203,943 Government National Mortgage Association (b) 0.9442 4/16/2053 5,605 TOTAL U.S. GOVERNMENT & AGENCY OBLIGATIONS (Cost - $15,470) 17,320
SHORT-TERM INVESTMENTS - 6.2 %Shares MONEY MARKET FUND - 6.2 %2,284,796 Dreyfus Institutional Preferred Government Money Market - Institutional Class, 1.59 % ^ 2,284,796
TOTAL SHORT-TERM INVESTMENTS (Cost -$2,284,796)
TOTAL INVESTMENTS - 99.4% (Cost - $36,152,908) 36,865,993$
OTHER ASSETS LESS LIABILITIES - 0.6 % 228,324
NET ASSETS - 100.0 % 37,094,317$
^ Money Market Fund; interest rate reflects seven-day effective yield on November 30, 2019.(a)(b)
(c)
(d)COF - Cost of FundsLIBOR - London Interbank offered rateTA - Treasury Average IndexUSISDA02 - 2 Year SwapUSISDA10 - 10 Year SwapUSISDA30 - 30 Year Swap
Variable rate security; the rate shown represents the rate at November 30, 2019.
Securities exempt from registration under Rule 144A of Securities Act of 1933. These securities may be resold in transactions exempt from registration to qualified institutional buyers. At November 30, 2019, these securities amounted to $15,567,569 or 42.0 % of net assets.
Variable or Floating rate security, the interest rate of which adjusts periodically based on changes in current interest rates and prepayments on the underlying pool of assets. The rate shown represents the rate at November 30, 2019.
Step-Up Bond; the interest rate shown is the rate in effect as of November 30, 2019.
See accompanying notes to financial statements.36

STATEMENTS OF ASSETS AND LIABILITIES November 30, 2019
1018 1019 1014 1020 1021
James Alpha James Alpha James Alpha James Alpha James Alpha James AlphaEHS Event Driven Family Office Relative Value Total Hedge Structured Credit
Portfolio Portfolio Portfolio Portfolio Portfolio Value PortfolioAssets:Investments in Affiliates, at cost 551,669$ 973,276$ -$ 3,366,344$ 2,792,939$ -$ Investments in Unaffiliated securities, at cost 1,423,575 6,044,477 8,072,884 3,183,800 7,598,674 36,152,908 Total Investments, at cost 1,975,244$ 7,017,753$ 8,072,884$ 6,550,144$ 10,391,613$ 36,152,908$
Investments in Affiliates, at value 562,357$ 990,373$ -$ 3,481,099$ 2,871,268$ -$ Investments in Unaffiliated securities, at value 1,373,077 6,014,483 8,450,126 3,111,785 7,530,925 36,865,993 Total Investments, at value 1,935,434$ 7,004,856$ 8,450,126$ 6,592,884$ 10,402,193$ 36,865,993$ Cash - - - - - 518,726 Foreign Cash ($0, $0, $0, $0, $0 and $35,504) - - - - - 35,010 Deposit in collateral account for Swaps - 440,000 - 320,000 280,601 - Unrealized appreciation on swaps - 48,190 - 35,990 74,436 - Unrealized appreciation on forward currency
exchange contracts 137 2,736 - 496 624 - Receivable for securities sold - - - - - - Receivable for open swaps 16,576 - 4,561 - Receivable for fund shares sold - - 154 14,850 556 390 Interest and dividends receivable 976 - 328 1,440 894 168,209 Receivable from manager 21,397 5,180 3,886 8,238 820 - Prepaid expenses and other assets 8,522 9,210 9,498 10,540 9,708 52,960
Total Assets 1,966,466 7,526,748 8,463,992 6,988,999 10,769,832 37,641,288
Liabilities:Payable for securities purchased - - - - - 505,125 Cash Overdraft ($0, $17, $0, $0, $3 and $0) - 17 - - 3 - Interest Payable - 521 - - - - Custody fees payable 1,836 2,570 3,922 338 4,560 542 Administration fees payable 2,033 1,794 3,159 852 2,066 1,669 Supervisory fee payable 1,254 1,254 1,332 1,254 1,332 1,250 Unrealized depreciation on forward currency
exchange contracts 252 313 - 100 355 - Payable to manager - - - - - 4,424 Trustee fees payable 181 198 431 321 361 741 Payable for distribution (12b-1) fees 9 - 144 - 102 1,233 Compliance officer fees payable 14 - 12 15 - - Accrued expenses and other liabilities 4,703 9,783 14,557 7,532 12,153 31,987
Total Liabilities 10,282 16,450 23,557 10,412 20,932 546,971
Net Assets 1,956,184$ 7,510,298$ 8,440,435$ 6,978,587$ 10,748,900$ 37,094,317$
Net Assets:Par value of shares of beneficial interest 1,878$ 6,955$ 7,735$ 6,410$ 10,231$ 35,320$ Paid in capital 2,130,938 7,077,410 8,456,246 6,395,245 10,707,243 35,262,097 Accumulated earnings (loss) (176,632) 425,933 (23,546) 576,932 31,426 1,796,900 Net Assets 1,956,184$ 7,510,298$ 8,440,435$ 6,978,587$ 10,748,900$ 37,094,317$
Net Asset Value Per Share Class ANet Assets 11$ 11$ 286,234$ 11$ 46,976$ 434,813$ Shares of beneficial interest outstanding 1 1 26,550 1 4,492 40,730 Net asset value 10.40$ (a) 10.76$ (a) 10.78$ 10.84$ (a) 10.46$ 10.68$ Offering price per share 11.03$ 11.42$ 11.44$ 11.50$ 11.10$ 11.33$ (maximum sales charge of 5.75%)
Class C Net Assets 5,730$ 11$ 106,665$ 11$ 41,448$ 1,468,344$ Shares of beneficial interest outstanding 556 1 9,973 1 3,993 140,540 Net asset value/offering price per share 10.31$ 10.76$ (a) 10.70$ 10.84$ (a) 10.38$ 10.45$
Class I Net Assets 225,835$ 440,566$ 628,965$ 277,011$ 5,095,188$ 4,982,261$ Shares of beneficial interest outstanding 21,725 40,950 58,150 25,559 485,579 476,307 Net asset value/offering price per share 10.40$ 10.76$ 10.82$ 10.84$ 10.49$ 10.46$
Class SNet Assets 1,724,608$ 7,069,710$ 7,418,571$ 6,701,554$ 5,565,288$ 30,208,899$ Shares of beneficial interest outstanding 165,527$ 654,578$ 678,874$ 615,438$ 528,996$ 2,874,396$ Net asset value/offering price per share 10.42$ 10.80$ 10.93$ 10.89$ 10.52$ 10.51$
(a) Doesn't recalculate due to rounding.
See accompanying notes to financial statements.
37

STATEMENTS OF OPERATIONSFor Year Ended November 30, 2019
James Alpha James Alpha James Alpha James Alpha James Alpha James AlphaEHS Event Driven Family Office Relative Value Total Hedge Structured Credit
Portfolio Portfolio Portfolio Portfolio Portfolio Value Portfolio Investment Income:Dividend income 73,895$ 256,315$ 285,286$ 163,417$ 302,712$ -$ Interest income 6,857 10,803 4,288 4,800 11,016 2,059,252 Dividend income from Affiliates 17,593 42,637 - 152,429 80,596 - Less: Foreign withholding taxes (23) - - - - -
Total Investment Income 98,322 309,755 289,574 320,646 394,324 2,059,252
Operating Expenses:Management fees 31,215 93,514 121,420 81,282 118,958 470,347 Custodian fees 16,005 12,379 12,763 11,628 35,872 16,708 Administration fees 11,538 19,319 21,349 16,420 27,479 101,027 Supervisory fees 15,002 15,002 15,001 15,002 15,002 23,191 Registration fees 31,511 31,033 32,767 30,074 34,225 26,411 Printing and postage expense 4,118 7,964 11,318 9,510 11,363 26,652 Shareholder servicing fee 5,279 18,724 20,355 17,037 15,761 32,667 Legal fees 622 17,896 10,239 16,496 19,628 16,586 Audit fees 3,419 17,955 14,959 11,848 8,245 24,452 Trustees' fees 495 1,404 1,661 1,284 1,938 8,429 Distribution (12b-1) fees Class A Shares - - 472 - 117 539 Class C Shares 55 - 1,102 - 403 7,592 Compliance officer fees 613 1,584 1,867 1,433 2,081 6,853 Insurance expense 93 220 250 180 264 608 Interest expenses 270 454 - 521 3,863 250 Miscellaneous expenses 4,714 5,687 5,248 5,853 6,445 6,566
Total Operating Expenses 124,949 243,135 270,771 218,568 301,644 768,878
Less: Expenses waived (63,980) (71,807) (69,096) (68,594) (94,545) (194,708) Waived management fees - Class S (18,242) (47,433) (64,397) (42,051) (37,358) (109,255)
Total Waivers (82,222) (119,240) (133,493) (110,645) (131,903) (303,963)
Net Operating Expenses 42,727 123,895 137,278 107,923 169,741 464,915
Net Investment Income 55,595 185,860 152,296 212,723 224,583 1,594,337
Realized and Unrealized Gain (Loss) on Investments:Net realized gain (loss) from:
Investments and Foreign currency transactions (106,051) 27,138 7,502 (86,940) (106,003) 688,178 Distribution of realized gain (loss) by underlying investment companies 2,175 14,838 6,740 (14,404) 4,387 -
Affiliated Investments 5,391 9,461 - 91,074 - - Swaps - 300,660 - 299,358 (4,514) -
Net realized gain (loss) (98,485) 352,097 14,242 289,088 (106,130) 688,178
Net change in unrealized appreciation (depreciation) on:
Investments and Foreign currency translations 205,725 93,992 539,126 96,154 453,836 494,885 Affiliated Investments 10,688 19,258 - 60,471 78,329 - Swaps - 128,658 - 112,698 93,175 -
Net change in unrealized appreciation (depreciation) 216,413 241,908 539,126 269,323 625,340 494,885 Net Realized and Unrealized .
Gain/(Loss) on investments 117,928 594,005 553,368 558,411 519,210 1,183,063
Net Increase (Decrease) in Net Assets Resulting From Operations 173,523$ 779,865$ 705,664$ 771,134$ 743,793$ 2,777,400$
See accompanying notes to financial statements.
38

STATEMENTS OF CHANGES IN NET ASSETS
Year Ended Year Ended Year Ended Year Ended Year Ended Year Ended November 30, 2019 November 30, 2018 November 30, 2019 November 30, 2018 November 30, 2019 November 30, 2018
Operations:Net investment income (loss) 55,595$ 47,411$ 185,860$ 166,826$ 152,296$ 170,624$ Net realized gain (loss) on investments (98,485) 138,791 352,097 (48,869) 14,242 (412,437)Net change in unrealized appreciation (depreciation) on investments 216,413 (289,004) 241,908 (217,992) 539,126 (256,814)Net increase (decrease) in net assets resulting from operations 173,523 (102,802) 779,865 (100,035) 705,664 (498,627)
Distributions to Shareholders:Total Distributions:
Class I (11,238) (1,688) (4,718) (1,358) (4,827) (1,084) Class A (0) * (0) * (0) * (0) * (1,345) (14) Class C (239) (41) (0) * (0) * (1,866) (233) Class S (275,436) (23,007) (231,112) (44,932) (299,154) (30,977)
Total Dividends and Distributions to Shareholders (286,913) (24,736) (235,830) (46,290) (307,192) (32,308)
Share Transactions ofBeneficial Interest (Note 5):Net proceeds from shares sold
Class I 11,678 - 229,788 - 391,077 9,750 Class A 1,000 - - - 220,477 64,443 Class C - 5,529 - - 6,000 45,400 Class S 983,229 7,048,757 3,977,140 11,875,979 2,784,438 13,755,223
Reinvestment of dividends and distributionsClass I 11,238 1,688 4,718 1,358 4,827 1,084 Class A 0 * 0 * 0 * 0 * 1,345 15 Class C 239 41 0 * 0 * 1,866 233 Class S 229,438 21,508 192,888 40,503 260,420 27,482
Redemption fee proceedsClass I - - 1 - 1 - Class A - - - - 0 * - Class C - - - - 0 * - Class S - - 20 - 21 -
Cost of shares redeemedClass I (8,049) - (20,194) - (15,376) - Class A (997) - - - (15,970) - Class C - - - - (32,950) (13,200) Class S (4,670,990) (4,317,064) (7,970,440) (7,222,275) (9,833,227) (4,284,948)
Net increase in net assets from share transactions of beneficial interest (3,443,214) 2,760,459 (3,586,079) 4,695,565 (6,227,051) 9,605,482
Total Increase (Decrease) in Net Assets (3,556,604) 2,632,921 (3,042,044) 4,549,240 (5,828,579) 9,074,547
Net Assets:Beginning of period 5,512,788 2,879,867 10,552,342 6,003,102 14,269,014 5,194,467 End of period 1,956,184$ 5,512,788$ 7,510,298$ 10,552,342$ 8,440,435$ 14,269,014$
* Less than $1.00.
James Alpha EHS Portfolio James Alpha Event Driven Portfolio James Alpha Family Office Portfolio
See accompanying notes to financial statements.
39
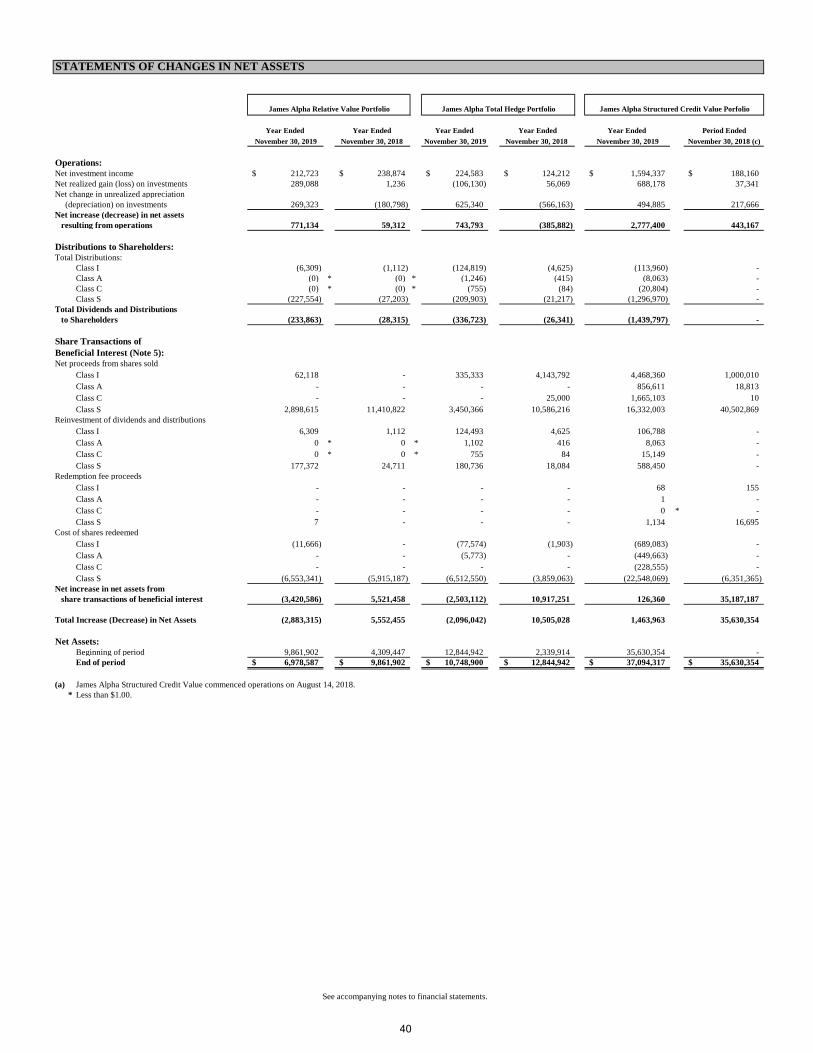
STATEMENTS OF CHANGES IN NET ASSETS
Year Ended Year Ended Year Ended Year Ended Year Ended Period EndedNovember 30, 2019 November 30, 2018 November 30, 2019 November 30, 2018 November 30, 2019 November 30, 2018 (c)
Operations:Net investment income 212,723$ 238,874$ 224,583$ 124,212$ 1,594,337$ 188,160$ Net realized gain (loss) on investments 289,088 1,236 (106,130) 56,069 688,178 37,341Net change in unrealized appreciation (depreciation) on investments 269,323 (180,798) 625,340 (566,163) 494,885 217,666Net increase (decrease) in net assets resulting from operations 771,134 59,312 743,793 (385,882) 2,777,400 443,167
Distributions to Shareholders:Total Distributions:
Class I (6,309) (1,112) (124,819) (4,625) (113,960) - Class A (0) * (0) * (1,246) (415) (8,063) - Class C (0) * (0) * (755) (84) (20,804) - Class S (227,554) (27,203) (209,903) (21,217) (1,296,970) -
Total Dividends and Distributions to Shareholders (233,863) (28,315) (336,723) (26,341) (1,439,797) -
Share Transactions ofBeneficial Interest (Note 5):Net proceeds from shares sold
Class I 62,118 - 335,333 4,143,792 4,468,360 1,000,010 Class A - - - - 856,611 18,813 Class C - - - 25,000 1,665,103 10 Class S 2,898,615 11,410,822 3,450,366 10,586,216 16,332,003 40,502,869
Reinvestment of dividends and distributionsClass I 6,309 1,112 124,493 4,625 106,788 - Class A 0 * 0 * 1,102 416 8,063 - Class C 0 * 0 * 755 84 15,149 - Class S 177,372 24,711 180,736 18,084 588,450 -
Redemption fee proceedsClass I - - - - 68 155 Class A - - - - 1 - Class C - - - - 0 * - Class S 7 - - - 1,134 16,695
Cost of shares redeemedClass I (11,666) - (77,574) (1,903) (689,083) - Class A - - (5,773) - (449,663) - Class C - - - - (228,555) - Class S (6,553,341) (5,915,187) (6,512,550) (3,859,063) (22,548,069) (6,351,365)
Net increase in net assets from share transactions of beneficial interest (3,420,586) 5,521,458 (2,503,112) 10,917,251 126,360 35,187,187
Total Increase (Decrease) in Net Assets (2,883,315) 5,552,455 (2,096,042) 10,505,028 1,463,963 35,630,354
Net Assets:Beginning of period 9,861,902 4,309,447 12,844,942 2,339,914 35,630,354 - End of period 6,978,587$ 9,861,902$ 10,748,900$ 12,844,942$ 37,094,317$ 35,630,354$
(a) James Alpha Structured Credit Value commenced operations on August 14, 2018.* Less than $1.00.
James Alpha Relative Value Portfolio James Alpha Total Hedge Portfolio James Alpha Structured Credit Value Porfolio
See accompanying notes to financial statements.
40
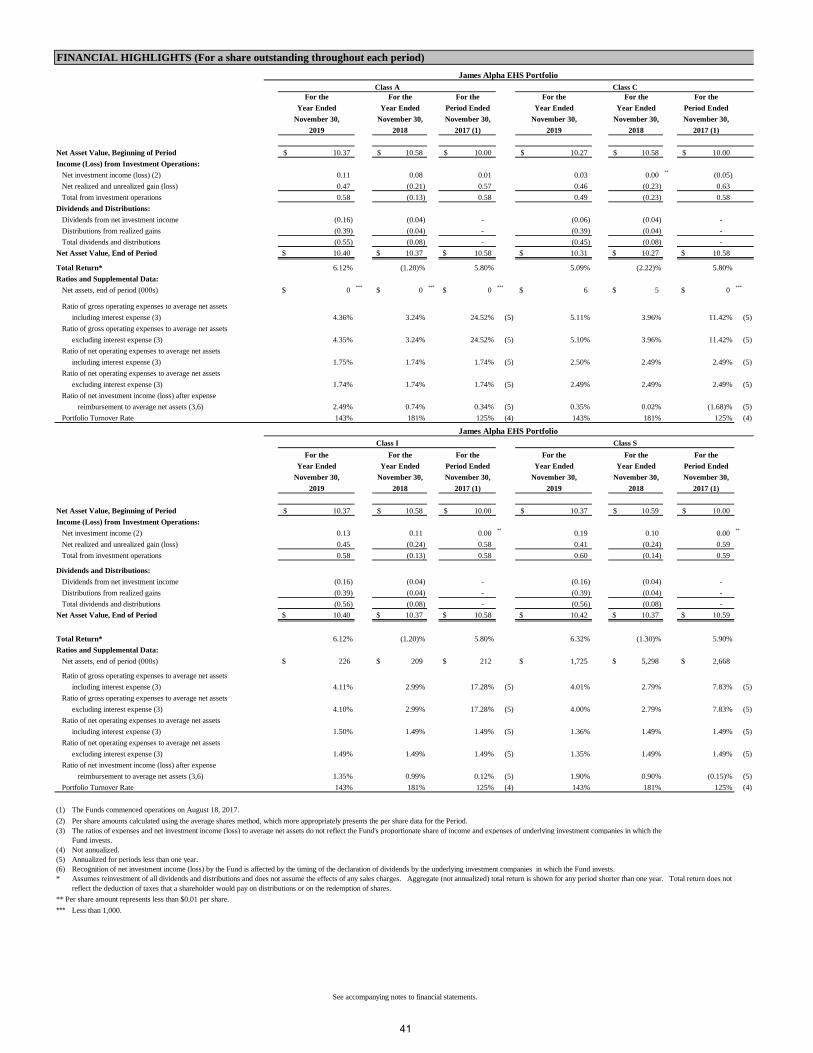
For the For the For the For the For the For theYear Ended Year Ended Period Ended Year Ended Year Ended Period Ended
November 30, November 30, November 30, November 30, November 30, November 30,2019 2018 2017 (1) 2019 2018 2017 (1)
Net Asset Value, Beginning of Period 10.37$ 10.58$ 10.00$ 10.27$ 10.58$ 10.00$ Income (Loss) from Investment Operations: Net investment income (loss) (2) 0.11 0.08 0.01 0.03 0.00 ** (0.05) Net realized and unrealized gain (loss) 0.47 (0.21) 0.57 0.46 (0.23) 0.63 Total from investment operations 0.58 (0.13) 0.58 0.49 (0.23) 0.58 Dividends and Distributions: Dividends from net investment income (0.16) (0.04) - (0.06) (0.04) - Distributions from realized gains (0.39) (0.04) - (0.39) (0.04) - Total dividends and distributions (0.55) (0.08) - (0.45) (0.08) - Net Asset Value, End of Period 10.40$ 10.37$ 10.58$ 10.31$ 10.27$ 10.58$
Total Return* 6.12% (1.20)% 5.80% 5.09% (2.22)% 5.80%Ratios and Supplemental Data: Net assets, end of period (000s) 0$ *** 0$ *** 0$ *** 6$ 5$ 0$ ***
Ratio of gross operating expenses to average net assets including interest expense (3) 4.36% 3.24% 24.52% (5) 5.11% 3.96% 11.42% (5)
Ratio of gross operating expenses to average net assets excluding interest expense (3) 4.35% 3.24% 24.52% (5) 5.10% 3.96% 11.42% (5)
Ratio of net operating expenses to average net assetsincluding interest expense (3) 1.75% 1.74% 1.74% (5) 2.50% 2.49% 2.49% (5)
Ratio of net operating expenses to average net assets excluding interest expense (3) 1.74% 1.74% 1.74% (5) 2.49% 2.49% 2.49% (5)
Ratio of net investment income (loss) after expense reimbursement to average net assets (3,6) 2.49% 0.74% 0.34% (5) 0.35% 0.02% (1.68)% (5)
Portfolio Turnover Rate 143% 181% 125% (4) 143% 181% 125% (4)
For the For the For the For the For the For theYear Ended Year Ended Period Ended Year Ended Year Ended Period Ended
November 30, November 30, November 30, November 30, November 30, November 30,2019 2018 2017 (1) 2019 2018 2017 (1)
Net Asset Value, Beginning of Period 10.37$ 10.58$ 10.00$ 10.37$ 10.59$ 10.00$ Income (Loss) from Investment Operations: Net investment income (2) 0.13 0.11 0.00 ** 0.19 0.10 0.00 **
Net realized and unrealized gain (loss) 0.45 (0.24) 0.58 0.41 (0.24) 0.59 Total from investment operations 0.58 (0.13) 0.58 0.60 (0.14) 0.59
Dividends and Distributions: Dividends from net investment income (0.16) (0.04) - (0.16) (0.04) - Distributions from realized gains (0.39) (0.04) - (0.39) (0.04) - Total dividends and distributions (0.56) (0.08) - (0.56) (0.08) - Net Asset Value, End of Period 10.40$ 10.37$ 10.58$ 10.42$ 10.37$ 10.59$
Total Return* 6.12% (1.20)% 5.80% 6.32% (1.30)% 5.90%Ratios and Supplemental Data: Net assets, end of period (000s) 226$ 209$ 212$ 1,725$ 5,298$ 2,668$
Ratio of gross operating expenses to average net assets including interest expense (3) 4.11% 2.99% 17.28% (5) 4.01% 2.79% 7.83% (5)
Ratio of gross operating expenses to average net assets excluding interest expense (3) 4.10% 2.99% 17.28% (5) 4.00% 2.79% 7.83% (5)
Ratio of net operating expenses to average net assetsincluding interest expense (3) 1.50% 1.49% 1.49% (5) 1.36% 1.49% 1.49% (5)
Ratio of net operating expenses to average net assets excluding interest expense (3) 1.49% 1.49% 1.49% (5) 1.35% 1.49% 1.49% (5)
Ratio of net investment income (loss) after expense reimbursement to average net assets (3,6) 1.35% 0.99% 0.12% (5) 1.90% 0.90% (0.15)% (5)
Portfolio Turnover Rate 143% 181% 125% (4) 143% 181% 125% (4)
(1) The Funds commenced operations on August 18, 2017.(2) Per share amounts calculated using the average shares method, which more appropriately presents the per share data for the Period.(3) The ratios of expenses and net investment income (loss) to average net assets do not reflect the Fund's proportionate share of income and expenses of underlying investment companies in which the
Fund invests.(4) Not annualized.(5) Annualized for periods less than one year.(6) Recognition of net investment income (loss) by the Fund is affected by the timing of the declaration of dividends by the underlying investment companies in which the Fund invests.*
** Per share amount represents less than $0.01 per share.*** Less than 1,000.
FINANCIAL HIGHLIGHTS (For a share outstanding throughout each period)
James Alpha EHS Portfolio
James Alpha EHS Portfolio
Assumes reinvestment of all dividends and distributions and does not assume the effects of any sales charges. Aggregate (not annualized) total return is shown for any period shorter than one year. Total return does not reflect the deduction of taxes that a shareholder would pay on distributions or on the redemption of shares.
Class A Class C
Class I Class S
See accompanying notes to financial statements.
41

For the For the For the For the For the For theYear Ended Year Ended Period Ended Year Ended Year Ended Period Ended
November 30, November 30, November 30, November 30, November 30, November 30,2019 2018 2017 (1) 2019 2018 2017 (1)
Net Asset Value, Beginning of Period 10.12$ 10.26$ 10.00$ 10.12$ 10.26$ 10.00$ Income (Loss) from Investment Operations: Net investment income (loss) (2) 0.09 0.13 0.03 0.08 0.14 (0.01) Net realized and unrealized gain (loss) 0.78 (0.21) 0.23 0.79 (0.22) 0.27 Total from investment operations 0.87 (0.08) 0.26 0.87 (0.08) 0.26 Dividends and Distributions: Dividends from net investment income (0.15) (0.05) - (0.15) (0.05) - Distributions from realized gains (0.08) (0.01) - (0.08) (0.01) - Total dividends and distributions (0.23) (0.06) - (0.23) (0.06) -
Net Asset Value, End of Period 10.76$ 10.12$ 10.26$ 10.76$ 10.12$ 10.26$
Total Return* 8.87% (0.71)% 2.60% 8.87% (0.71)% 2.60%Ratios and Supplemental Data: Net assets, end of period (000s) 0$ ** 0$ ** 0$ ** 0$ ** 0$ ** 0$ **
Ratio of gross operating expenses to average net assets including interest expense (3) 2.84% 2.39% 17.75% (5) 3.59% 3.14% 5.80% (5)
Ratio of gross operating expenses to average net assets excluding interest expense (3) 2.84% 2.39% 17.75% (5) 3.59% 3.14% 5.80% (5)
Ratio of net operating expenses to average net assetsincluding interest expense (3) 1.74% 1.74% 1.74% (5) 2.49% 2.49% 2.49% (5)
Ratio of net operating expenses to average net assets excluding interest expense (3) 1.74% 1.74% 1.74% (5) 2.49% 2.49% 2.49% (5)
Ratio of net investment income after expense reimbursement to average net assets (3,6) 0.85% 1.26% 1.03% (5) 0.36% 1.36% 0.34% (5)
Portfolio Turnover Rate 112% 221% 101% (4) 112% 221% 101% (4)
For the For the For the For the For the For theYear Ended Year Ended Period Ended Year Ended Year Ended Period Ended
November 30, November 30, November 30, November 30, November 30, November 30,2019 2018 2017 (1) 2019 2018 2017 (1)
Net Asset Value, Beginning of Period 10.12$ 10.26$ 10.00$ 10.14$ 10.26$ 10.00$ Income (Loss) from Investment Operations: Net investment income (2) 0.12 0.13 0.03 0.20 0.15 0.03 Net realized and unrealized gain (loss) 0.75 (0.21) 0.23 0.69 (0.21) 0.23 Total from investment operations 0.87 (0.08) 0.26 0.89 (0.06) 0.26
Dividends and Distributions: Dividends from net investment income (0.15) (0.05) - (0.15) (0.05) - Distributions from realized gains (0.08) (0.01) - (0.08) (0.01) - Total dividends and distributions (0.23) (0.06) - (0.23) (0.06) - Redemption Fees 0.00 *** - - 0.00 *** - -
Net Asset Value, End of Period 10.76$ 10.12$ 10.26$ 10.80$ 10.14$ 10.26$
Total Return* 8.87% (0.71)% 2.60% 9.06% (0.51)% 2.60%Ratios and Supplemental Data: Net assets, end of period (000s) 441$ 204$ 205$ 7,070$ 10,349$ 5,798$
Ratio of gross operating expenses to average net assets including interest expense (3) 2.59% 2.14% 11.16% (5) 2.60% 2.11% 4.99% (5)
Ratio of gross operating expenses to average net assets excluding interest expense (3) 2.59% 2.14% 11.16% (5) 2.60% 2.11% 4.99% (5)
Ratio of net operating expenses to average net assetsincluding interest expense (3) 1.49% 1.49% 1.49% (5) 1.32% 1.11% 1.49% (5)
Ratio of net operating expenses to average net assets excluding interest expense (3) 1.49% 1.49% 1.49% (5) 1.32% 1.11% 1.49% (5)
Ratio of net investment income after expense reimbursement to average net assets (3,6) 1.15% 1.25% 1.05% (5) 2.02% 1.50% 1.15% (5)
Portfolio Turnover Rate 112% 221% 101% (4) 112% 221% 101% (4)
(1) The Funds commenced operations on August 18, 2017.(2) Per share amounts calculated using the average shares method, which more appropriately presents the per share data for the Period.(3) The ratios of expenses and net investment income (loss) to average net assets do not reflect the Fund's proportionate share of income and expenses of underlying investment companies in which the
Fund invests.(4) Not annualized.(5) Annualized for periods less than one year.(6) Recognition of net investment income (loss) by the Fund is affected by the timing of the declaration of dividends by the underlying investment companies in which the Fund invests.*
** Less than 1,000.*** Per share amount represents less than $0.01 per share.
Class I Class S
Assumes reinvestment of all dividends and distributions and does not assume the effects of any sales charges. Aggregate (not annualized) total return is shown for any period shorter than one year. Total return does not reflect the deduction of taxes that a shareholder would pay on distributions or on the redemption of shares.
FINANCIAL HIGHLIGHTS (For a share outstanding throughout each period)
Class A Class C James Alpha Event Driven Portfolio
James Alpha Event Driven Portfolio
See accompanying notes to financial statements.
42

For the For the For the For the For the For theYear Ended Year Ended Period Ended Year Ended Year Ended Period Ended
November 30, November 30, November 30, November 30, November 30, November 30,2019 2018 2017 (1) 2019 2018 2017 (1)
Net Asset Value, Beginning of Period 10.16$ 10.51$ 10.00$ 10.09$ 10.50$ 10.00$ Income (Loss) from Investment Operations:
Net investment income (loss) (2) 0.06 0.04 (0.10) 0.03 (0.02) (0.11) Net realized and unrealized gain (loss) 0.77 (0.34) 0.61 0.73 (0.37) 0.61 Total from investment operations 0.83 (0.30) 0.51 0.76 (0.39) 0.50
Dividends and Distributions:Dividends from net investment income (0.18) (0.05) - (0.12) (0.02) - Distributions from realized gains (0.03) (0.00) ** - (0.03) (0.00) ** - Total dividends and distributions (0.21) (0.05) - (0.15) (0.02) -
Redemption Fees 0.00 ** - - 0.00 ** - -
Net Asset Value, End of Period 10.78$ 10.16$ 10.51$ 10.70$ 10.09$ 10.50$
Total Return* 8.40% (2.90)% 5.10% 7.68% (3.68)% 5.00%Ratios and Supplemental Data:
Net assets, end of period (000s) 286$ 65$ 3$ 107$ 126$ 99$
Ratio of gross operating expenses to average net assets (3) 2.99% 2.38% 3.85% (5) 3.65% 3.26% 5.30% (5) Ratio of net operating expenses to average net assets (3) 1.74% 1.82% 2.75% (5) 2.49% 2.83% 3.50% (5) Ratio of net investment income (loss) after expense
reimbursement to average net assets (3,6) 0.59% 0.38% (2.23)% (5) 0.39% (0.15)% (2.55)% (5) Portfolio Turnover Rate 86% 167% 75% (4) 86% 167% 75% (4)
For the For the For the For the For the For theYear Ended Year Ended Period Ended Year Ended Year Ended Period Ended
November 30, November 30, November 30, November 30, November 30, November 30,2019 2018 2017 (1) 2019 2018 2017 (1)
Net Asset Value, Beginning of Period 10.18$ 10.52$ 10.00$ 10.27$ 10.52$ 10.00$ Income (Loss) from Investment Operations:
Net investment income (loss) (2) 0.10 0.09 (0.03) 0.17 0.15 (0.07) Net realized and unrealized gain (loss) 0.77 (0.38) 0.55 0.72 (0.35) 0.59 Total from investment operations 0.87 (0.29) 0.52 0.89 (0.20) 0.52
Dividends and Distributions:Dividends from net investment income (0.20) (0.05) - (0.20) (0.05) - Distributions from realized gains (0.03) (0.00) ** - (0.03) (0.00) ** - Total dividends and distributions (0.23) (0.05) - (0.23) (0.05) -
Redemption Fees 0.00 ** - - 0.00 ** - 0.00 **
Net Asset Value, End of Period 10.82$ 10.18$ 10.52$ 10.93$ 10.27$ 10.52$
Total Return* 8.81% (2.74)% 5.20% 8.94% (1.87)% 5.20%Ratios and Supplemental Data:
Net assets, end of period (000s) 629$ 214$ 210$ 7,419$ 13,864$ 4,882$
Ratio of gross operating expenses to average net assets (3) 2.69% 2.23% 20.93% (5) 2.66% 2.19% 4.06% (5) Ratio of net operating expenses to average net assets (3) 1.49% 1.82% 2.50% (5) 1.33% 1.00% 2.50% (5) Ratio of net investment income (loss) after expense
reimbursement to average net assets (3,6) 0.92% 0.86% (0.74)% (5) 1.66% 1.40% (1.49)% (5) Portfolio Turnover Rate 86% 167% 75% (4) 86% 167% 75% (4)
(1) James Alpha Family Office commenced operations on June 30, 2017.(2) Per share amounts calculated using the average shares method, which more appropriately presents the per share data for the Period.(3) The ratios of expenses and net investment income (loss) to average net assets do not reflect the Fund's proportionate share of income and expenses of underlying investment companies in which the
Fund invests.(4) Not annualized.(5) Annualized for periods less than one year.(6) Recognition of net investment income (loss) by the Fund is affected by the timing of the declaration of dividends by the underlying investment companies in which the Fund invests.*
** Per share amount represents less than $0.01 per share.
FINANCIAL HIGHLIGHTS (For a share outstanding throughout each period)James Alpha Family Office
James Alpha Family Office
Assumes reinvestment of all dividends and distributions and does not assume the effects of any sales charges. Aggregate (not annualized) total return is shown for any period shorter than one year. Total return does not reflect the deduction of taxes that a shareholder would pay on distributions or on the redemption of shares.
Class A Class C
Class I Class S
See accompanying notes to financial statements.
43

For the For the For the For the For the For theYear Ended Year Ended Period Ended Year Ended Year Ended Period Ended
November 30, November 30, November 30, November 30, November 30, November 30,2019 2018 2017 (1) 2019 2018 2017 (1)
Net Asset Value, Beginning of Period 10.15$ 10.14$ 10.00$ 10.15$ 10.14$ 10.00$ Income (Loss) from Investment Operations:
Net investment income (2) 0.22 0.25 0.06 0.22 0.25 0.05 Net realized and unrealized gain (loss) 0.76 (0.18) 0.08 0.76 (0.18) 0.09 Total from investment operations 0.98 0.07 0.14 0.98 0.07 0.14
Dividends and Distributions:Dividends from net investment income (0.25) (0.06) - (0.25) (0.06) - Distributions from realized gains (0.04) - - (0.04) - - Total dividends and distributions (0.29) (0.06) - (0.29) (0.06) -
Net Asset Value, End of Period 10.84$ 10.15$ 10.14$ 10.84$ 10.15$ 10.14$
Total Return* 9.77% 0.65% 1.40% 9.77% 0.65% 1.40%Ratios and Supplemental Data:
Net assets, end of period (000s) 0$ ** 0$ ** 0$ ** 0$ ** 0$ ** 0$ **
Ratio of gross operating expenses to average net assets including interest expense (3) 2.95% 2.50% 18.36% (5) 3.70% 3.26% 7.98% (5)
Ratio of gross operating expenses to average net assets excluding interest expense (3) 2.94% 2.50% 18.36% (5) 3.69% 3.26% 7.98% (5)
Ratio of net operating expenses to average net assetsincluding interest expense (3) 1.75% 1.74% 1.74% (5) 2.50% 2.49% 2.49% (5)
Ratio of net operating expenses to average net assets excluding interest expense (3) 1.74% 1.74% 1.74% (5) 2.49% 2.49% 2.49% (5)
Ratio of net investment income after expense reimbursement to average net assets (3,6) 2.11% 2.44% 2.08% (5) 2.11% 2.44% 1.73% (5)
Portfolio Turnover Rate 118% 252% 115% (4) 118% 252% 115% (4)
For the For the For the For the For the For theYear Ended Year Ended Period Ended Year Ended Year Ended Period Ended
November 30, November 30, November 30, November 30, November 30, November 30,2019 2018 2017 (1) 2019 2018 2017 (1)
Net Asset Value, Beginning of Period 10.15$ 10.14$ 10.00$ 10.17$ 10.14$ 10.00$ Income (Loss) from Investment Operations:
Net investment income (2) 0.25 0.25 0.07 0.28 0.26 0.09 Net realized and unrealized gain (loss) 0.73 (0.18) 0.07 0.73 (0.17) 0.05 Total from investment operations 0.98 0.07 0.14 1.01 0.09 0.14
Dividends and Distributions:Dividends from net investment income (0.25) (0.06) - (0.25) (0.06) - Distributions from realized gains (0.04) - - (0.04) - - Total dividends and distributions (0.29) (0.06) - (0.29) (0.06) -
Redemption Fees 0.00 *** - - 0.00 *** - -
Net Asset Value, End of Period 10.84$ 10.15$ 10.14$ 10.89$ 10.17$ 10.14$ 1.40 Total Return* 9.79% 0.65% 1.40% 10.07% 0.85% 1.40%Ratios and Supplemental Data:
Net assets, end of period (000s) 277$ 204$ 203$ 6,702$ 9,658$ 4,107$
Ratio of gross operating expenses to average net assets including interest expense (3) 2.70% 2.26% 13.82% (5) 2.70% 2.18% 6.42% (5)
Ratio of gross operating expenses to average net assets excluding interest expense (3) 2.69% 2.26% 13.82% (5) 2.69% 2.18% 6.42% (5)
Ratio of net operating expenses to average net assetsincluding interest expense (3) 1.50% 1.49% 1.49% (5) 1.33% 1.18% 1.49% (5)
Ratio of net operating expenses to average net assets excluding interest expense (3) 1.49% 1.49% 1.49% (5) 1.32% 1.18% 1.49% (5)
Ratio of net investment income after expense reimbursement to average net assets (3,6) 2.35% 2.48% 2.55% (5) 2.62% 2.59% 3.02% (5)
Portfolio Turnover Rate 118% 252% 115% (4) 118% 252% 115% (4)
(1) The Fund commenced operations on August 18, 2017(2) Per share amounts calculated using the average shares method, which more appropriately presents the per share data for the Period.(3) The ratios of expenses and net investment income (loss) to average net assets do not reflect the Fund's proportionate share of income and expenses of underlying investment companies in which the
Fund invests.(4) Not annualized.(5) Annualized for periods less than one year.(6) Recognition of net investment income (loss) by the Fund is affected by the timing of the declaration of dividends by the underlying investment companies in which the Fund invests.*
** Less than 1,000.*** Per share amount represents less than $0.01 per share.
FINANCIAL HIGHLIGHTS (For a share outstanding throughout each period)James Alpha Relative Value Portfolio
Assumes reinvestment of all dividends and distributions and does not assume the effects of any sales charges. Aggregate (not annualized) total return is shown for any period shorter than one year. Total return does not reflect the deduction of taxes that a shareholder would pay on distributions or on the redemption of shares.
James Alpha Relative Value Portfolio
Class A Class C
Class I Class S
See accompanying notes to financial statements.
44

For the For the For the For the For the For theYear Ended Year Ended Period Ended Year Ended Year Ended Period Ended
November 30, November 30, November 30, November 30, November 30, November 30,2019 2018 2017 (1) 2019 2018 2017 (1)
Net Asset Value, Beginning of Period 10.10$ 10.38$ 10.00$ 10.04$ 10.37$ 10.00$ Income (Loss) from Investment Operations:
Net investment income (loss) (2) 0.16 0.13 0.02 0.08 0.05 (0.01) Net realized and unrealized gain (loss) 0.45 (0.33) 0.36 0.45 (0.33) 0.38 Total from investment operations 0.61 (0.20) 0.38 0.53 (0.28) 0.37
Dividends and Distributions:Dividends from net investment income (0.14) (0.06) - (0.08) (0.03) - Distributions from realized gains (0.11) (0.02) - (0.11) (0.02) - Total dividends and distributions (0.25) (0.08) - (0.19) (0.05) -
Net Asset Value, End of Period 10.46$ 10.10$ 10.38$ 10.38$ 10.04$ 10.37$
Total Return* 6.25% (1.90)% 3.80% 5.44% (2.66)% 3.70%Ratios and Supplemental Data:
Net assets, end of period (000s) 47$ 50$ 51$ 41$ 39$ 16$
Ratio of gross operating expenses to average net assets including interest expense (3) 2.77% 2.88% 8.32% (5) 3.53% 3.40% 10.32% (5)
Ratio of gross operating expenses to average net assets excluding interest expense (3) 2.74% 2.88% 8.32% (5) 3.50% 3.40% 10.32% (5)
Ratio of net operating expenses to average net assetsincluding interest expense (3) 1.77% 1.74% 1.74% (5) 2.52% 2.49% 2.49% (5)
Ratio of net operating expenses to average net assets excluding interest expense (3) 1.74% 1.74% 1.74% (5) 2.49% 2.49% 2.49% (5)
Ratio of net investment income (loss) after expense reimbursement to average net assets (3,6) 1.56% 1.30% 0.54% (5) 0.76% 0.45% (0.17)% (5)
Portfolio Turnover Rate 114% 195% 83% (4) 114% 195% 83% (4)
For the For the For the For the For the For theYear Ended Year Ended Period Ended Year Ended Year Ended Period Ended
November 30, November 30, November 30, November 30, November 30, November 30,2019 2018 2017 (1) 2019 2018 2017 (1)
Net Asset Value, Beginning of Period 10.13$ 10.40$ 10.00$ 10.14$ 10.40$ 10.00$ Income (Loss) from Investment Operations:
Net investment income (2) 0.18 0.12 0.04 0.20 0.16 0.03 Net realized and unrealized gain (loss) 0.46 (0.30) 0.36 0.46 (0.33) 0.37 Total from investment operations 0.64 (0.18) 0.40 0.66 (0.17) 0.40
Dividends and Distributions:Dividends from net investment income (0.17) (0.07) - (0.17) (0.07) - Distributions from realized gains (0.11) (0.02) - (0.11) (0.02) - Total dividends and distributions (0.28) (0.09) - (0.28) (0.09) -
Net Asset Value, End of Period 10.49$ 10.13$ 10.40$ 10.52$ 10.14$ 10.40$
Total Return* 6.54% (1.73)% 4.00% 6.73% (1.63)% 4.00%Ratios and Supplemental Data:
Net assets, end of period (000s) 5,095$ 4,523$ 520$ 5,565$ 8,233$ 1,753$
Ratio of gross operating expenses to average net assets including interest expense (3) 2.53% 2.50% 12.24% (5) 2.53% 2.38% 6.30% (5)
Ratio of gross operating expenses to average net assets excluding interest expense (3) 2.50% 2.50% 12.24% (5) 2.50% 2.38% 6.30% (5)
Ratio of net operating expenses to average net assetsincluding interest expense (3) 1.52% 1.49% 1.49% (5) 1.35% 1.39% 1.49% (5)
Ratio of net operating expenses to average net assets excluding interest expense (3) 1.49% 1.49% 1.49% (5) 1.32% 1.39% 1.49% (5)
Ratio of net investment income after expense reimbursement to average net assets (3,6) 1.74% 1.19% 0.84% (5) 2.00% 1.54% 0.66% (5)
Portfolio Turnover Rate 114% 195% 83% (4) 114% 195% 83% (4)
(1) James Alpha Total Hedge commenced operations on June 30, 2017.(2) Per share amounts calculated using the average shares method, which more appropriately presents the per share data for the Period.(3) The ratios of expenses and net investment income (loss) to average net assets do not reflect the Fund's proportionate share of income and expenses of underlying investment companies in which the
Fund invests.(4) Not annualized.(5) Annualized for periods less than one year.(6) Recognition of net investment income (loss) by the Fund is affected by the timing of the declaration of dividends by the underlying investment companies in which the Fund invests.* Assumes reinvestment of all dividends and distributions and does not assume the effects of any sales charges. Aggregate (not annualized) total return is shown for any period shorter than one year. Total return does not reflect the deduction
of taxes that a shareholder would pay on distributions or on the redemption of shares.
FINANCIAL HIGHLIGHTS (For a share outstanding throughout each period)
Class A Class C
Class I Class S
James Alpha Total Hedge
James Alpha Total Hedge
See accompanying notes to financial statements.
45

For the For the For the For theYear Ended Period Ended Year Ended Period Ended
November 30, November 30, November 30, November 30,2019 2018 (1) 2019 2018 (1)
Net Asset Value, Beginning of Period 10.16$ 10.00$ 10.16$ 10.00$ Income (Loss) from Investment Operations:
Net investment income (2) 0.41 0.10 0.32 0.10 Net realized and unrealized gain 0.46 0.06 0.31 0.06 Total from investment operations 0.87 0.16 0.63 0.16
Dividends and Distributions:Dividends from net investment income (0.34) - (0.33) - Distributions from realized gains (0.01) - (0.01) - Total dividends and distributions (0.35) - (0.34) -
Redemption Fees 0.00 ** - - -
Net Asset Value, End of Period 10.68$ 10.16$ 10.45$ 10.16$
Total Return* 8.67% # 1.60% 6.24% # 1.60%Ratios and Supplemental Data:
Net assets, end of period (000s) 435$ 19$ 1,468$ 0$ ***
Ratio of gross operating expenses to average net assets including interest expense (5) 2.38% 2.18% (3) 3.11% 3.01% (3)
Ratio of gross operating expenses to average net assets excluding interest expense (5) 2.38% 2.18% (3) 3.11% 3.01% (3)
Ratio of net operating expenses to average net assetsincluding interest expense (5) 1.74% 1.74% (3) 2.49% 2.49% (3)
Ratio of net operating expenses to average net assets excluding interest expense (5) 1.74% 1.74% (3) 2.49% 2.49% (3)
Ratio of net investment income (loss) after expense reimbursement to average net assets (5,6) 3.84% 3.27% (3) 3.09% 3.27% (3)
Portfolio Turnover Rate 111% 37% (4) 111% 37% (4)
For the For the For the For theYear Ended Period Ended Year Ended Year Ended
November 30, November 30, November 30, November 30,2019 2018 (1) 2019 2018 (1)
Net Asset Value, Beginning of Period 10.15$ 10.00$ 10.16$ 10.00$ Income (Loss) from Investment Operations:
Net investment income (2) 0.40 0.07 0.43 0.07 Net realized and unrealized gain 0.30 0.08 0.31 0.08 Total from investment operations 0.70 0.15 0.74 0.15
Dividends and Distributions:Dividends from net investment income (0.38) - (0.38) - Distributions from realized gains (0.01) - (0.01) - Total dividends and distributions (0.39) - (0.39) -
Redemption Fees 0.00 ** 0.00 ** 0.00 ** 0.01
Net Asset Value, End of Period 10.46$ 10.15$ 10.51$ 10.16$
Total Return* 6.97% 1.50% 7.36% 1.60%Ratios and Supplemental Data:
Net assets, end of period (000s) 4,982$ 1,007$ 30,209$ 34,604$
Ratio of gross operating expenses to average net assets including interest expense (5) 1.99% 2.01% (3) 1.93% 1.87% (3)
Ratio of gross operating expenses to average net assets excluding interest expense (5) 2.00% 2.01% (3) 1.93% 1.87% (3)
Ratio of net operating expenses to average net assetsincluding interest expense (5) 1.49% 1.49% (3) 1.13% 1.49% (3)
Ratio of net operating expenses to average net assets excluding interest expense (5) 1.49% 1.49% (3) 1.13% 1.49% (3)
Ratio of net investment income (loss) after expense reimbursement to average net assets (5,6) 3.88% 2.30% (3) 4.11% 2.27% (3)
Portfolio Turnover Rate 111% 37% (4) 111% 37% (4)
(1) James Alpha Structured Credit Value commenced operations on August 14, 2018. Start of performance is August 21, 2018.(2) Per share amounts calculated using the average shares method, which more appropriately presents the per share data for the Period.(3) Annualized for periods less than one year.(4) Not annualized.(5) The ratios of expenses and net investment income (loss) to average net assets do not reflect the Fund's proportionate share of income and expenses of underlying investment companies in which the
Fund invests.(6) Recognition of net investment income (loss) by the Fund is affected by the timing of the declaration of dividends by the underlying investment companies in which the Fund invests.*
** Per share amount represents less than $0.01 per share.*** Less than 1,000.# Includes adjustments in accordance with accounting principles generally accepted in the United States and, consequently, the net asset value for financial reporting purposes and the returns based upon those net asset values
may differ from the net asset values and returns for shareholder transactions. Adjustments may apply to some but not all years and classes.
FINANCIAL HIGHLIGHTS (For a share outstanding throughout the period)James Alpha Structured Credit Value
James Alpha Structured Credit Value
Assumes reinvestment of all dividends and distributions and does not assume the effects of any sales charges. Aggregate (not annualized) total return is shown for any period shorter than one year. Total return does not reflect the deduction of taxes that a shareholder would pay on distributions or on the redemption of shares.
Class I Class S
Class A Class C
See accompanying notes to financial statements.
46

NOTES TO FINANCIAL STATEMENTS
Year Ended November 30, 2019 1. ORGANIZATION AND SIGNIFICANT ACCOUNTING POLICIES The Saratoga Advantage Trust (the “Trust”) was organized on April 8, 1994, as a Delaware Statutory Trust and is registered under the Investment Company Act of 1940, as amended, as an open-end management investment company. The Trust commenced investment operations on September 2, 1994. The Trust currently consists of thirty series. These financial statements include the following six series: the James Alpha EHS Portfolio; the James Alpha Event Driven Portfolio, the James Alpha Family Office Portfolio, the James Alpha Relative Value Portfolio, the James Alpha Total Hedge Portfolio and the James Alpha Structured Credit Value Portfolio (collectively, the “Portfolios”). James Alpha Advisors, LLC (the “Manager” or “James Alpha Advisors”) serves as the Portfolios’ Advisor. Effective February 15, 2018 James Alpha Equity Hedge Portfolio changed its name to James Alpha EHS Portfolio. The James Alpha EHS Portfolio; the James Alpha Event Driven Portfolio, the James Alpha Family Office Portfolio, the James Alpha Relative Value Portfolio, James Alpha Total Hedge Portfolio and James Alpha Structured Credit Value Portfolio are diversified portfolios.
Portfolio Primary Objective James Alpha EHS James Alpha Event Driven James Alpha Family Office
Long-term risk-adjusted returns relative to traditional financial market indices. Long-term risk-adjusted returns relative to traditional financial market indices. Total return through capital appreciation and/or income, consistent with a reasonable level of risk, determined by the James Alpha Advisors, LLC.
James Alpha Relative Value Long-term risk-adjusted returns relative to traditional financial market indices. James Alpha Total Hedge James Alpha Structured Credit Value
Long-term risk adjusted returns relative to traditional financial market indices High level of risk adjusted current income and capital appreciation with a secondary objective of capital preservation.
Currently, all Portfolios offer Class A, Class C, Class I and Class S shares. Class A shares are offered at net asset value plus a maximum sales load of 5.75%. Class C shares are offered subject to a CDSC of 1.00%. Class I and Class S shares are offered at net asset value. Each class represents an interest in the same assets of the applicable Portfolio, and the classes are identical except for differences in their sales charge structures, ongoing service and distribution charges and the Class S share’s management fee. All classes of shares have equal voting privileges except that each class has exclusive voting rights with respect to its service and/or distribution plans. Shares of Class S of the Portfolios are available exclusively to investment advisers and broker-dealers that are affiliated with the Manager as a means of implementing asset allocation recommendations for their clients. Please see the Trust’s prospectuses for additional details. The following is a summary of significant accounting policies followed by the Portfolios in preparation of its financial statements. These policies are in conformity with accounting principles generally accepted in the United States of America (“GAAP”). The preparation of financial statements in conformity with GAAP requires management to make estimates and assumptions that affect the reported amounts of assets and liabilities and disclosure of contingent assets and liabilities at the date of the financial statements and the reported amounts of increases and decreases in net assets from operations during the reporting period. Actual results could differ from those estimates. Each Portfolio is an investment company and accordingly follows the investment company accounting and reporting guidance of the Financial Accounting Standards Board (FASB) Accounting Standard Codification Topic 946 "Financial Services – Investment Companies" including FASB Accounting Standard Update ASU 2013-08.
(a) Valuation of Investments Investment securities listed on a national securities exchange are valued at the last reported sale price on the valuation date. NASDAQ traded securities are valued at the NASDAQ Official Closing Price (NOCP). If there are no such reported sales, the securities are valued at the mean between current bid and ask. Short-term debt securities having a remaining maturity of sixty days or less may be valued at amortized cost or amortized value, which approximates market value. Any securities or other assets for which market quotations are not readily available are valued at their fair value as determined in good faith under procedures established by the Board of Trustees. There is no single standard for determining the fair value of such securities. Rather, in determining the fair value of a security, the board-appointed Fair Valuation Committee shall take into account the relevant factors and surrounding circumstances, a few of which may include: (i) the nature and pricing history (if any) of the security; (ii) whether any dealer quotations for the security are available; and (iii) possible valuation methodologies that could be used to determine the fair value of a security. Foreign currency and Forward currency exchange contracts are valued daily at the London close each day. Investments in foreign countries may involve certain considerations and risks not typically associated with domestic investments, including, but not limited to, the possibility of future political and economic developments and the level of government supervision and regulation of foreign securities markets. Swap transactions are valued through an independent pricing service or at fair value based on daily price reporting from the swap counterparty issuing the swap. Total return swaps on securities listed on an exchange shall be valued at the last quoted sales price or, in the absence of a sale, at the mean between the current bid and ask prices. The Portfolios utilize various methods to measure the fair value of most of its investments on a recurring basis. GAAP establishes a hierarchy that prioritizes inputs to valuation methods. The three levels of input are: Level 1 – Unadjusted quoted prices in active markets for identical assets and liabilities that the Portfolios have the ability to access. Level 2 – Observable inputs other than quoted prices included in level 1 that are observable for the asset or liability, either directly or indirectly. These inputs may include quoted prices for the identical instrument on an inactive market, prices for similar instruments, interest rates, prepayment speeds, credit risk, yield curves, default rates and similar data. Level 3 – Unobservable inputs for the asset or liability, to the extent relevant observable inputs are not available, representing the Portfolios’ own assumptions about the assumptions a market participant would use in valuing the asset or liability, and would be based on the best information available. The availability of observable inputs can vary from security to security and is affected by a wide variety of factors, including, for example, the type of security, whether the security is new and not yet established in the marketplace, the liquidity of markets, and other characteristics particular to the security. To the extent that valuation is based on models or inputs that are less observable or unobservable in the market, the determination of fair value requires more judgment. Accordingly, the degree of judgment exercised in determining fair value is greatest for instruments categorized in Level 3. The inputs used to measure fair value may fall into different levels of the fair value hierarchy. In such cases, for disclosure purposes, the level in the fair value hierarchy within which the fair value measurement falls in its entirety, is determined based on the lowest level input that is significant to the fair value measurement in its entirety.
47

NOTES TO FINANCIAL STATEMENTS Year Ended November 30, 2019 (Continued) The inputs or methodology used for valuing securities are not necessarily an indication of the risk associated with investing in those securities. The following tables summarize the inputs used as of November 30, 2019, for the Portfolios’ assets and liabilities measured at fair value:
James Alpha EHS Assets* Level 1 Level 2 Level 3 TotalCommon Stock 19,167$ -$ -$ 19,167$ Exchange Traded Funds 1,160,985 - - 1,160,985 Open Ended Funds 692,467 - - 692,467 Short-Term Investments 62,815 - - 62,815
Total 1,935,434$ -$ -$ 1,935,434$ Asset DerivativesForward Currency Contracts -$ 137$ -$ 137$
Total Assets 1,935,434$ 137$ -$ 1,935,571$ Liability DerivativesForward Currency Contracts -$ 252$ -$ 252$
Total Liabilities -$ 252$ -$ 252$
James Alpha Event Driven Assets* Level 1 Level 2 Level 3 TotalExchange Traded Funds 2,582,551$ -$ -$ 2,582,551$ Exchange Traded Note 8,763 - - 8,763 Open Ended Funds 4,292,507 - - 4,292,507 Short-Term Investments 121,035 - - 121,035
Total 7,004,856$ -$ -$ 7,004,856$ Asset DerivativesForward Currency Contracts -$ 2,736$ -$ 2,736$ Total Return Swap - 48,190 - 48,190
Total Assets 7,004,856$ 50,926$ -$ 7,055,782$ Liability DerivativesForward Currency Contracts -$ 313$ -$ 313$
Total Liabilities -$ 313$ -$ 313$
James Alpha Family Office Assets* Level 1 Level 2 Level 3 TotalExchange Traded Funds 7,718,833$ -$ -$ 7,718,833$ Exchange Traded Notes 117,462 - - 117,462 Open Ended Funds 439,807 - - 439,807 Short-Term Investments 174,024 - - 174,024
Total Assets 8,450,126$ -$ -$ 8,450,126$ James Alpha Relative Value Assets* Level 1 Level 2 Level 3 TotalExchange Traded Funds 2,339,070$ -$ -$ 2,339,070$ Open Ended Funds 3,930,055 - - 3,930,055 Short-Term Investments 323,759 - - 323,759
Total 6,592,884$ -$ -$ 6,592,884$ Asset DerivativesForward Currency Contracts -$ 496$ -$ 496$ Total Return Swap - 35,990 - 35,990
Total Assets 6,592,884$ 36,486$ -$ 6,629,370$
Liability DerivativesForward Currency Contracts -$ 100$ -$ 100$
Total Liabilities -$ 100$ -$ 100$
48

NOTES TO FINANCIAL STATEMENTS Year Ended November 30, 2019 (Continued)
James Alpha Total Hedge Assets* Level 1 Level 2 Level 3 TotalExchange Traded Funds 6,393,863$ -$ -$ 6,393,863$ Exchange Traded Notes 12,953 - - 12,953 Open Ended Funds 3,692,308 - - 3,692,308 Short-Term Investments 303,069 - - 303,069
Total 10,402,193$ -$ -$ 10,402,193$ Asset DerivativesForward Currency Contracts -$ 624$ -$ 624$ Total Return Swap - 74,436 - 74,436
Total Assets 10,402,193$ 75,060$ -$ 10,477,253$ Liability DerivativesForward Currency Contracts -$ 355$ -$ 355$
Total Liabilities -$ 355$ -$ 355$ James Alpha Structured Credit Value Assets* Level 1 Level 2 Level 3 TotalBonds & Notes -$ 34,563,877$ -$ 34,563,877$ U.S. Government & Agency Obligations - 17,320 - 17,320 Short-Term Investments 2,284,796 - - 2,284,796
Total Assets 2,284,796$ 34,581,197$ -$ 36,865,993$ There were no level 3 securities held during the year.
(b) Federal Income Tax It is each Portfolio’s policy to continue to qualify as a regulated investment company by complying with the provisions of the Internal Revenue Code that are applicable to regulated investment companies and to distribute substantially all of its taxable income and net realized gains to shareholders. Management has analyzed the Fund’s tax positions and has concluded that no liability for unrecognized tax benefits should be recorded related to uncertain tax positions taken on returns filed for open tax years ended November 30, 2017 to November 30, 2018, or expected to be taken in the Funds’ November 30, 2019 year-end tax returns. The Portfolios recognize the tax benefits of uncertain tax positions only when the position is “more likely than not” to be sustained assuming examination by tax authorities. Management has reviewed the tax positions in the open tax years of 2017 and 2018 and expected to be taken in the Portfolios’ 2019 returns, and concluded that no liability for unrecognized tax benefits should be recorded related to uncertain tax positions. The Portfolios identify its major tax jurisdictions as U.S. Federal, Arizona and foreign jurisdictions where the Portfolios make significant investments. The Portfolios recognize interest and penalties, if any, related to unrecognized tax benefits as income tax expense in the Statements of Operations. During the year ended November 30, 2019, the Portfolios did not incur any interest or penalties. (c) Security Transactions and Other Income Security transactions are recorded on the trade date. Dividend income is recognized on the ex-dividend date, and interest income is recognized on an accrual basis. Discounts and premiums on securities purchased are accreted and amortized, over the lives of the respective securities. Realized gains or losses from sales of securities are determined by comparing the identified cost of the security lot sold with the net sales proceeds. Withholding taxes on foreign dividends have been provided for in accordance with the Trust’s understanding of the applicable country’s tax rules and rates. (d) Dividends and Distributions The following table summarizes each Portfolio’s intended dividend and capital gain declaration policy:
Portfolio Income Dividends Capital Gains James Alpha EHS Annually Annually James Alpha Event Driven Annually Annually James Alpha Family Office Annually Annually James Alpha Relative Value Annually Annually James Alpha Total Hedge Annually Annually James Alpha Structured Credit Value Quarterly Annually
Each Portfolio records dividends and distributions to its shareholders on the ex-dividend date. The amount of dividends and distributions from net investment income and net realized gains are determined in accordance with federal income tax regulations, which may differ from GAAP. These “book-tax” differences are either permanent or temporary in nature. To the extent these differences are permanent in nature, such amounts are reclassified within the net asset accounts based on their federal tax-basis treatment; temporary differences do not require reclassification. To the extent dividends and distributions exceed current and accumulated earnings and profits for federal income tax purposes, they are reported as distributions of paid-in-surplus or tax return of capital. These reclassifications have no effect on net assets, results from operations or net asset value per share of each Portfolio. (e) Allocation of Expenses Expenses specifically attributable to a particular Portfolio are borne by that Portfolio. Other expenses are allocated to each Portfolio based on its net assets in relation to the total net assets of all the applicable Portfolios of the Trust or another reasonable basis.
49

NOTES TO FINANCIAL STATEMENTS Year Ended November 30, 2019 (Continued) (f) Indemnification The Trust indemnifies its Officers and Trustees for certain liabilities that may arise from the performance of their duties to the Trust. Additionally, in the normal course of business, the Portfolios enter into contracts that contain a variety of representations and warranties and which provide general indemnities. The Portfolios’ maximum exposure under these arrangements is unknown, as this would involve future claims that may be made against the Portfolios that have not yet occurred. However, based on experience, the risk of loss due to these warranties and indemnities appears to be remote. (g) Other The preparation of the financial statements in accordance with accounting principles generally accepted in the United States of America requires management to make estimates and assumptions that affect the reported amounts and disclosures in the financial statements. Actual results could differ from those estimates. Foreign currency. Investment securities and other assets and liabilities denominated in foreign currencies are translated into U.S. dollar amounts at the date of valuation. Purchases and sales of investment securities and income and expense items denominated in foreign currencies are translated into U.S. dollar amounts on the respective dates of such transactions. The Trust does not isolate that portion of the results of operations resulting from changes in foreign exchange rates on investments from the fluctuations arising from changes in market prices of securities held. Such fluctuations are included with the net realized and unrealized gain or loss from investments. Reported net realized foreign exchange gains or losses arise from sales of foreign currencies, currency gains or losses realized between the trade and settlement dates on securities transactions, and the difference between the amounts of dividends, interest, and foreign withholding taxes recorded on the company’s books and the U.S. dollar equivalent of the amounts actually received or paid. Net unrealized foreign exchange gains and losses arise from changes in the fair values of assets and liabilities, other than investments in securities at fiscal period end, resulting from changes in exchange rates. Foreign currency contracts. Certain Portfolios may enter into foreign currency exchange contracts. Because various Portfolios may invest in securities denominated in foreign currencies, they may seek to hedge foreign currency risks by engaging in foreign currency exchange transactions. These may include buying or selling foreign currencies on a spot basis, entering into foreign currency forward contracts, and buying and selling foreign currency options, foreign currency futures, and options on foreign currency futures. Currency exchange rates may fluctuate significantly over short periods and can be subject to unpredictable change based on such factors as political developments and currency controls by foreign governments 2. MANAGEMENT FEE, ADMINISTRATION FEE AND OTHER TRANSACTIONS WITH AFFILIATES (a) The management fees are payable to the Manager monthly by each Portfolio and are computed daily at the following annual rates of each Portfolio's average daily net assets: 1.20% for James Alpha Family Office and James Alpha Structured Credit Value; 1.00% for James Alpha EHS, James Alpha Event Driven, James Alpha Relative Value and James Alpha Total Hedge. Saratoga Capital Management, LLC (“SCM”) serves the Portfolios in a supervision capacity with responsibility to monitor the performance of the Portfolios’ outside service providers (other than sub-advisers, if any, which are monitored by the Manager), assist in the review of financial statements and other regulatory filings and board meeting materials related to each Portfolio. Pursuant to the supervision agreement with the Portfolios, the Portfolios pay SCM an annual supervision fee of the greater of $15,000 or 0.10% of the Portfolio’s average daily net assets, payable on a monthly basis, which fee decreases at various asset levels. SCM, a Delaware limited liability company, also acts as investment manager to certain other portfolios of the Saratoga Advantage Trust (the “Saratoga Funds”). (b) The Trust and the Manager on behalf of the Portfolios, have entered into Excess Expense Agreements (the “Expense Agreements”). In connection with the Expense Agreements, James Alpha Advisors is currently waiving, all or a portion of its management fees and/or assuming certain other operating expenses of certain Portfolios in order to maintain the expense ratios of each class of the Portfolios at or below predetermined levels (each an “Expense Cap”). The annual expense caps in effect at November 30, 2019, for each portfolio were: 1.74%, 2.49%, 1.49% and 1.12% for Class A, C, I and S shares, respectively, of James Alpha EHS, James Alpha Event Driven, James Alpha Family Office, James Alpha Relative Value, James Alpha Total Hedge and James Alpha Structured Credit Value. Prior to June 1, 2019 the expense cap was 1.49% for Class S. Prior to June 1, 2019 pursuant to a fee waiver and operating expense limitation agreement between James Alpha Advisors and the James Alpha Portfolios, James Alpha Advisors has contractually agreed to waive all of the James Alpha Portfolios’ management fees payable to James Alpha Advisors by the James Alpha Portfolios on Class S assets, less any portion of such fee that is payable by James Alpha Advisors to the Sub-Advisers. Under the terms of the Expense Agreements, the Manager and James Alpha Advisors are permitted to seek reimbursement from the Portfolios, subject to limitations, for fees they waived and Portfolio expenses they paid within three (3) years of the end of the fiscal year in which such fees were waived or expenses paid, as long as the reimbursement does not cause the Portfolio’s operating expenses to exceed (i) the expense cap in place at the time the advisory fees were waived or the expenses were incurred; or (ii) the current expense cap, whichever is less. The Expense Agreement with James Alpha Advisors shall continue through March 31, 2020 for A, C, I and March 31, 2021 for Class S. For the year ended November 30, 2019, the Manager waived fees of $63,980 for James Alpha EHS, $71,807 for James Alpha Event Driven, $69,096 for James Alpha Family Office, $68,594 for James Alpha Relative Value, $94,545 for James Alpha Total Hedge and $194,708 for James Alpha Structured Credit Value. The manager waived the following Class S Fees of:
Portfolio Class S Fee Waived
James Alpha EHS 18,242$
James Alpha Event Driven 47,433
James Alpha Family Office 64,397
James Alpha Relative Value 42,051
James Alpha Total Hedge 37,358
James Alpha Structured Credit Value 109,255
50

NOTES TO FINANCIAL STATEMENTS Year Ended November 30, 2019 (Continued) The following table shows the available waived expenses and expiration date for each Portfolio subject to potential recovery.
Portfolio 11/30/2020 11/30/2021 11/30/2022
James Alpha EHS 24,827$ 18,206$ 63,980$
James Alpha Event Driven 20,596 1,307 71,807
James Alpha Family Office 18,048 1,074 69,096
James Alpha Relative Value 23,014 1,524 68,594
James Alpha Total Hedge 30,795 18,473 94,545
James Alpha Structured Credit Value - 824 194,708
(c) Northern Lights Distributors, LLC (the “Distributor”) is the Trust’s Distributor. The Portfolios have adopted a Plan of Distribution pursuant to Rule 12b-1 under the 1940 Act (the “Plan”) with respect to the sale and distribution of Class A and C shares of the Portfolios. The Plan provides that each Portfolio will pay the Distributor or other entities, including the Manager, a fee, which is accrued daily and paid monthly, at the annual rate of 0.25% of the average daily net assets of Class A shares and 1.00% of the average daily net assets of each of the Portfolios’ Class C shares. A portion of the fee payable pursuant to the Plan, equal to 0.25% of the average daily net assets, is currently characterized as a service fee and it may be paid directly to the Manager, or other entities for providing support services. A service fee is a payment made for personal service and/or the maintenance of shareholder accounts. The aggregate of such service fee payments will not exceed 0.25% of average daily net assets. For the year ended, November 30, 2019, the Distributor received sales charges on sales of the Portfolios’ Class A shares. In addition, CDSCs were paid to the Manager for Class C shares. The Distributor and the Manager have advised the Portfolios that the approximate amounts are as follows: Portfolio Distributor Sales Charges CDSC's
Class A Class CJames Alpha EHS - - James Alpha Event Driven - - James Alpha Family Office 10,032 38 James Alpha Relative Value - - James Alpha Total Hedge - - James Alpha Structured Credit Value 2,638 2,187
(d) Gemini Fund Services, LLC (“GFS”), an affiliate of Northern Lights Distributors, LLC (the “Distributor”) provides administrative, fund accounting and transfer agency services to the Portfolios pursuant to agreements with the Trust, for which it receives from each Portfolio: (i) a minimum annual fee or basis points in decreasing amounts as assets reach certain breakpoints; and (ii) any related out-of-pocket expenses. Pursuant to the terms of the Trust’s Custody Administration Agreement with GFS (the “Custody Administration Agreement”), the Trust pays an asset-based fee in decreasing amounts as Trust assets reach certain breakpoints. The Trust also pays certain transaction fees and out-of-pocket expenses pursuant to the Custody Administration Agreement. (e) Affiliated Investments — The Funds’ transactions with affiliates represent holdings for which the respective Fund and the underlying investee fund have the same investment advisor or where the investee fund’s investment advisor is under common control with the Fund’s investment advisor. Companies which are affiliates of the Portfolios at November 30, 2019, are noted in the Portfolio’s Schedule of Investments.
Portfolio Affiliated HoldingValue at 11/30/18 Purchases Sales
Realized Gain/(Loss)
Dividend Income
Change in Unrealized Gain/(Loss)
Value at 11/30/19
James Alpha EHS James Alpha Structured Credit Value Portfolio -$ 817,604$ (271,326)$ 5,391$ 17,593$ 10,688$ 562,357$ James Alpha Event Driven James Alpha Structured Credit Value Portfolio 1,097,839 818,707 (954,892) 9,461 42,637 19,258 990,373 James Alpha Relative Value James Alpha Structured Credit Value Portfolio 4,423,217 1,725,833 (2,819,496) 91,074 152,429 60,471 3,481,099 James Alpha Total Hedge James Alpha Structured Credit Value Portfolio - 2,792,939 - - 80,596 78,329 2,871,268
In addition, certain affiliates of the Distributor provide services to the Trust as follows: Northern Lights Compliance Services, LLC (“NLCS”) - NLCS, an affiliate of GFS and the Distributor, provides a Chief Compliance Officer to the Trust, as well as related compliance services, pursuant to a consulting agreement between NLCS and the Trust. Under the terms of such agreement, NLCS receives customary fees from the Portfolios. Blu Giant, LLC (“Blu Giant”) – Blu Giant, an affiliate of GFS and the Distributor, provides EDGAR conversion and filing services as well as print management services for the Trust on an ad-hoc basis. For the provision of these services, Blu Giant receives customary fees from the Portfolios. On February 1, 2019, NorthStar Financial Services Group, LLC, the parent company of Gemini Fund Services, LLC (“GFS”) and its affiliated companies including Northern Lights Distributors, LLC (“NLD”), Northern Lights Compliance Services, LLC (“NLCS”) and Blu Giant, LLC (“Blu Giant”) (collectively, the “Gemini Companies”), sold its interest in the Gemini Companies to a third party private equity firm that contemporaneously acquired Ultimus Fund Solutions, LLC (an independent mutual fund administration firm) and its affiliates (collectively, the “Ultimus Companies”). As a result of these separate transactions, the Gemini Companies and the Ultimus Companies are now indirectly owned through a common parent entity, The Ultimus Group, LLC. Certain employees of GFS and NLCS are also officers of the Trust, and are not paid any fees directly by the Trust for serving in such capacity.
51

NOTES TO FINANCIAL STATEMENTS Year Ended November 30, 2019 (Continued) 3. INVESTMENT TRANSACTIONS (a) For the year ended November 30, 2019, the cost of purchases and proceeds from sales of investment securities, other than short-term securities, for the Portfolios were as follows: Portfolio Purchases SalesJames Alpha EHS 4,084,841$ 6,505,743$ James Alpha Event Driven 9,393,767 12,665,572 James Alpha Family Office 8,643,676 15,218,605 James Alpha Relative Value 8,921,616 12,275,161 James Alpha Total Hedge 12,767,928 14,751,072
James Alpha Structured Credit Value 44,743,965 38,575,008 (b) Other Investment Companies or Exchange Traded Funds – Certain Portfolios may invest up to 100% of their net assets in shares of affiliated and unaffiliated investment companies, including money market mutual funds, other mutual funds or exchange-traded funds (“ETFs”). An ETF generally is an open-end investment company, unit investment trust or a portfolio of securities deposited with a depository in exchange for depository receipts. ETFs provide investors the opportunity to buy or sell throughout the day an entire portfolio of securities in a single security. Although index mutual funds are similar to index-based ETFs, they are generally sold and redeemed only once per day at market close. The ETFs in which a Portfolio invests may be subject to liquidity risk. Liquidity risk exists when particular investments are difficult to purchase or sell, possibly preventing the sale of the security at an advantageous time or price. To the extent that the ETFs in which a Portfolio invests hold securities of companies with smaller market capitalizations or securities with substantial market risk, they will have a greater exposure to liquidity risk. In addition, ETFs are subject to the following risks that do not apply to conventional mutual funds that can be found in “Exchange-Traded Funds” below: (1) the market price of the ETF’s shares may trade at a discount to their net asset value; (2) an active trading market for an ETF’s shares may not develop or be maintained; or (3) trading of an ETF’s shares may be halted if the listing exchange deem such action appropriate, the shares are de-listed from the exchange, or the activation of market-wide “circuit breakers” (which are tied to large decreases in stock prices) halts stock trading generally. Additionally, ETFs have management fees, which increase their cost. In addition to the advisory and operational fees a Portfolio bears directly in connection with its own operation, the Portfolio also bears its pro rata portion of the advisory and operational expenses incurred indirectly through investments in other investment companies. (c) Swap Agreements – Certain portfolios are subject to equity price risk and/or interest rate risk in the normal course of pursuing their respective investment objectives. The Portfolios may enter into various swap transactions for investment purposes or to manage interest rate, equity, foreign exchange (currency), commodity or credit risk. These would be two-party contracts entered into primarily to exchange the returns (or differentials in rates of returns) earned or realized on particular pre-determined investments or instruments. The gross returns to be exchanged or “swapped” between parties are calculated with respect to a notional amount, i.e., the return on or increase in value of a particular dollar amount invested at a particular interest rate, in a particular foreign currency, or in a “basket” of securities representing a particular index or market segment. Changes in the value of swap agreements are recognized as unrealized gains or losses in the Statements of Operations by “marking to market” on a daily basis to reflect the value of the swap agreement at the end of each trading day. Payments received or paid at the beginning of the agreement are reflected as such on the Statements of Assets and Liabilities and may be referred to as upfront payments. The Portfolios amortize upfront payments and/or accrue for the fixed payment stream on swap agreements on a daily basis with the net amount recorded as a component of unrealized gain or loss on the Statements of Operations. A liquidation payment received or made at the termination of the swap agreement is recorded as a realized gain or loss on the Statements of Operations. The Portfolios segregate liquid securities having a value at least equal to the amount of their current obligation under any swap transaction. Entering into these agreements involves, to varying degrees, lack of liquidity and elements of credit, market, and counterparty risk in excess of amounts recognized on the Statements of Assets and Liabilities. The Portfolios’ maximum risk of loss from counterparty credit risk is the discounted net value of the cash flows to be received from the counterparty over the contract’s remaining life, to the extent that that amount is positive. The derivatives are not accounted for as hedging instruments under GAAP. The effect of derivative instruments on the Statements of Assets and Liabilities at November 30, 2019, were as follows:
Fund Derivative Risk Type
Location of derivatives on Statements of Assets and
LiabilitiesFair value of asset/liability
derivatives
James Alpha EHSForward Exchange Contracts Foreign Exchange Unrealized appreciation on forward
currency exchange contracts 137$ Unrealized depreciation on forward
currency exchange contracts (252) Totals (115)$
James Alpha Event DrivenForward Exchange Contracts Foreign Exchange Unrealized appreciation on forward
currency exchange contracts 2,736$ Unrealized depreciation on forward
currency exchange contracts (313) Swap Contracts Equity Unrealized appreciation on swaps 48,190
Totals 50,613$ James Alpha Relative Value
Forward Exchange Contracts Foreign Exchange Unrealized appreciation on forward currency exchange contracts 496$ Unrealized depreciation on forward
currency exchange contracts (100) Swap Contracts Equity Unrealized appreciation on swaps 35,990
Totals 36,386$ James Alpha Total Hedge
Forward Exchange Contracts Foreign Exchange Unrealized appreciation on forward currency exchange contracts 624$ Unrealized depreciation on forward
currency exchange contracts (355) Swap Contracts Equity Unrealized appreciation on swaps 74,436
Totals 74,705$
52

NOTES TO FINANCIAL STATEMENTS Year Ended November 30, 2019 (Continued) The effect of derivative instruments on the Statements of Operations for the year ended November 30, 2019, were as follows:
Portfolio Derivative Location of gain (loss) on derivatives Risk TypeRealized and unrealized gain
(loss) on derivatives
Net realized gain from investments and foreign currency transactions Foreign Exchange 3,257$ Net change in unrealized depreciation on investments and foreign currency transactions
Foreign Exchange (1,270)$
Swap ContractsNet realized gain on swaps
Equity 300,660$ Net change in unrealized appreciation on swaps
Equity 128,658$
Net realized gain from investments and foreign currency transactions Foreign Exchange 30,228$ Net change in unrealized appreciation on investments and foreign currency transactions
Foreign Exchange 1,057$
Swap ContractsNet realized gain on swaps
Equity 299,358$ Net change in unrealized appreciation on swaps
Equity 112,698$
Net realized gain from investments and foreign currency transactions Foreign Exchange 4,134$ Net change in unrealized appreciation on investments and foreign currency transactions
Foreign Exchange 567$
Swap ContractsNet realized loss on swaps
Equity (4,514)$ Net change in unrealized appreciation on swaps
Equity 93,175$
Net realized gain from investments and foreign currency transactions Foreign Exchange 18,035$ Net change in unrealized appreciation on investments and foreign currency transactions
Foreign Exchange (3,705)$
Forward Contracts
James Alpha Total Hedge
Forward Contracts
James Alpha EHSForward Contracts
James Alpha Event Driven
Forward Contracts
James Alpha Relative Value
The amounts of realized and changes in unrealized gains and losses on derivative instruments during the period as disclosed in the Statements of Operations serve as indicators of the volume of derivative activity for the Portfolios.
53

NOTES TO FINANCIAL STATEMENTS Year Ended November 30, 2019 (Continued) The following table presents the Portfolios’ assets and liabilities available for offset under a master netting arrangement net of collateral pledged as of November 30, 2019.
Gross Amounts Recognized in (Consolidated) Statements of
Assets and Liabilit iesFinancial Instruments
PledgedCash Collateral
Pledged Net Amount of Assets
EHS Description of Asset:
Forward Foreign
Currency Contracts 137$ - (252)$ (115)$
Total 137$ -$ (252)$ (115)$
Description of Liability:
Forward Foreign
Currency Contracts (252)$ 252$ -$ -$
(252)$ 252$ -$ -$
Event Driven Description of Asset:
Forward Foreign
Currency Contracts 2,736$ - (313)$ 2,423$
Total Return Swaps 48,190 - 48,190 -
Total 50,926$ -$ 47,877$ 2,423$
Description of Liability:
Forward Foreign
Currency Contracts (313)$ 313$ -$ -$
(313)$ 313$ -$ -$
Relative Value Description of Asset:
Forward Foreign
Currency Contracts 496$ - (100)$ 396$
Total Return Swaps 35,990 - 35,990 -
Total 36,486$ -$ 35,890$ 396$
Description of Liability:
Forward Foreign
Currency Contracts (100)$ 100$ -$ -$ (100)$ 100$ -$ -$
Total Hedge Description of Asset:
Forward Foreign
Currency Contracts 624$ - (355)$ 269$
Total Return Swaps 74,436 - 74,436 -
Total 75,060$ -$ 74,081$ 269$
Description of Liability:
Forward Foreign
Currency Contracts (355)$ 355$ -$ -$
(355)$ 355$ -$ -$
Gross Amounts not offset in the (Consolidated) Statements of Assets and Liabilit ies
54

NOTES TO FINANCIAL STATEMENTS Year Ended November 30, 2019 (Continued) 4. AGGREGATE UNREALIZED APPRECIATION AND DEPRECIATION – TAX BASIS
Cost for Tax Net Federal Tax Unrealized Unrealized Unrealized
Portfolio purposes Appreciation Depreciation App/DepJames Alpha EHS 1,979,426$ 43,264$ (87,141)$ (43,877)$ James Alpha Event Driven 7,034,313 122,747 (154,627) (31,880) James Alpha Family Office 8,092,574 404,889 (47,337) 357,552 James Alpha Relative Value 6,560,851 3,286,603 (3,254,966) 31,637 James Alpha Total Hedge 10,404,672 249,658 (252,406) (2,748) James Alpha Structured Credit Value 36,152,908 985,990 (272,905) 713,085
5. AUTHORIZED SHARES OF BENEFICIAL INTEREST AND PAR VALUE PER SHARE Each Portfolio has unlimited shares of beneficial interest authorized at $0.01 par value per share. For the periods indicated, transactions were as follows:
Year Ended Year Ended Year Ended Year Ended Year Ended Year Ended Year Ended Year EndedNovember 30, 2019 November 30, 2018 November 30, 2019 November 30, 2018 November 30, 2019 November 30, 2018 November 30, 2019 November 30, 2018
James Alpha EHSIssued 99 - - 526 1,178 - 101,410 661,042 Redeemed (99) - - - (786) - (470,602) (404,342) Reinvested from Dividends 0 * 0 * 25 4 1,173 160 23,925 2,035 Net Decrease in Shares - - 25 530 1,565 160 (345,267) 258,735
James Alpha Event DrivenIssued - - - - 22,267 - 387,179 1,157,310 Redeemed - - - - (1,935) - (772,834) (706,085) Reinvested from Dividends 0 * 0 * 0 * 0 * 483 133 19,703 3,971 Net Increase (Decrease) in Shares - - - - 20,815 133 (365,952) 455,196
James Alpha Family OfficeIssued 21,534 6,110 591 4,318 38,122 912 273,025 1,291,714 Redeemed (1,548) - (3,301) (1,281) (1,488) - (970,792) (408,304) Reinvested from Dividends 139 1 194 22 500 103 26,737 2,600 Net Increase (Decrease) in Shares 20,125 6,111 (2,516) 3,059 37,134 1,015 (671,030) 886,010
James Alpha Relative ValueIssued - - - - 5,930 - 276,520 1,121,719 Redeemed - - - - (1,095) - (627,776) (579,922) Reinvested from Dividends 0 * 0 * 0 * 0 * 613 110 17,453 2,439 Net Increase (Decrease) in Shares - - - - 5,448 110 (333,803) 544,236
James Alpha Total HedgeIssued - - - 2,397 34,021 396,158 344,901 1,017,450 Redeemed (576) - - - (7,693) (188) (646,523) (375,763) Reinvested from Dividends 114 40 78 8 12,834 446 18,613 1,744 Net Increase in Shares (462) 40 78 2,405 39,162 396,416 (283,009) 643,431
James Alpha Structured Credit ValueIssued 80,502 1,852 161,011 1 433,322 99,207 1,587,325 4,033,118 Redeemed (42,387) - (21,932) - (66,590) - (2,175,461) (627,780) Reinvested from Dividends 763 - 1,460 - 10,368 - 57,194 - Net Increase in Shares 38,878 1,852 140,539 1 377,100 99,207 (530,942) 3,405,338
Class I SharesClass A Shares Class C Shares Class S Shares
*Less than 1.
55

NOTES TO FINANCIAL STATEMENTS Year Ended November 30, 2019 (Continued) 6. DISTRIBUTIONS TO SHAREHOLDERS AND TAX COMPONENTS OF CAPITAL The tax character of fund distributions paid for the years ended November 30, 2019 and November 30, 2018 was as follows:
Ordinary Long-Term ReturnPortfolio Income Capital Gains Of Capital Total
James Alpha EHS 285,452$ 1,461$ -$ 286,913$ James Alpha Event Driven 230,393 5,437 - 235,830 James Alpha Family Office 307,192 - - 307,192 James Alpha Relative Value 231,979 1,884 - 233,863 James Alpha Total Hedge 327,487 9,236 - 336,723 James Alpha Structured Credit Value 1,439,797 - - 1,439,797
For the period ended November 30, 2019:
Ordinary Long-Term ReturnPortfolio Income Capital Gains Of Capital Total
James Alpha EHS 24,736$ -$ -$ 24,736$ James Alpha Event Driven 46,290 - - 46,290 James Alpha Family Office 32,187 121 - 32,308 James Alpha Relative Value 28,315 - - 28,315 James Alpha Total Hedge 26,341 - - 26,341 James Alpha Structured Credit Value - - - -
For the period ended November 30, 2018:
As of November 30, 2019, the components of accumulated earnings/ (deficit) on a tax basis were as follows:
Undistributed Undistributed Post October Loss Capital Loss Other Unrealized TotalOrdinary Long-Term and Carry Book/Tax Appreciation/ Accumulated
Portfolio Income Capital Gains Late Year Loss Forwards Differences (Depreciation) Earnings/(Deficits)James Alpha EHS -$ -$ (4,915)$ (127,725)$ -$ (43,992)$ (176,632)$ James Alpha Event Driven 455,390 - - - - (29,457) 425,933 James Alpha Family Office - - - (381,098) - 357,552 (23,546) James Alpha Relative Value 614,452 - - (69,553) - 32,033 576,932 James Alpha Total Hedge 178,149 - - (144,239) - (2,484) 31,426 James Alpha Structured Credit Value 1,042,023 42,326 - - - 712,551 1,796,900 The difference between book basis and tax basis undistributed net investment income, accumulated net realized gain, and unrealized appreciation/(depreciation) from investments is primarily attributable to the tax deferral of losses on wash sales, mark-to-market on open forward foreign currency contracts, swaps and passive foreign investment companies, and adjustments for partnerships, grantor trusts, and C-Corporation return of capital distributions. The unrealized appreciation/(depreciation) in the table above includes unrealized foreign currency gains (losses) of $(115), $2,423, $396, $264 and $(534) for the James Alpha EHS, James Alpha Event Driven, James Alpha Relative Value Portfolio, James Alpha Total Hedge and the James Alpha Structured Credit Value Portfolio, respectively. Capital losses incurred after October 31 within the fiscal year are deemed to arise on the first business day of the following fiscal year for tax purposes. The Funds elected to defer such capital losses as follows:
Post October Portfolio Losses
James Alpha EHS 4,915$ James Alpha Event Driven - James Alpha Family Office - James Alpha Relative Value - James Alpha Total Hedge - James Alpha Structured Credit Value -
56

NOTES TO FINANCIAL STATEMENTS Year Ended November 30, 2019 (Continued) At November 30, 2019, the Funds had capital loss carry forwards for federal income tax purposes available to offset future capital gains and capital losses utilized as follows:
CLCFPortfolio Short-Term Long-Term Total Utilized
James Alpha EHS 74,869$ 52,856$ 127,725$ -$ James Alpha Event Driven - - - 20,566 James Alpha Family Office 344,549 36,549 381,098 6,630 James Alpha Relative Value 21,225 48,328 69,553 - James Alpha Total Hedge 101,262 42,977 144,239 - James Alpha Structured Credit Value - - - -
Non-Expiring
Permanent book and tax differences, primarily attributable to the book/tax basis treatment of non-deductible expenses, the reclassification of Fund distributions, resulted in reclassifications for the Funds for the fiscal year ended November 30, 2019 as follows:
PaidIn Accumulated
Portfolio Capital Earnings (Losses)James Alpha EHS (11,206)$ 11,206$ James Alpha Event Driven (140) 140 James Alpha Family Office (9,094) 9,094 James Alpha Relative Value (3,353) 3,353 James Alpha Total Hedge - - James Alpha Structured Credit Value - -
7. BENEFICIAL OWNERSHIP (Unaudited)
The beneficial ownership, either directly or indirectly, of more than 25% of the voting securities of a Portfolio creates a presumption of control of the Portfolio under Section 2(a)(9) of the 1940 Act. As of November 30, 2019, the shareholders that own 25% or more of the voting securities are as follows:
Fund Shareholder O wnership %James Alpha EHS Cl A James Alpha Management LLC 100.00%James Alpha EHS Cl C George & Gloria Kiefer 99.81%James Alpha EHS Cl I Denis Nayden 98.19%James Alpha EHS Cl S National Financial Services LLC 100.00%James Alpha Event Driven Cl A James Alpha Management LLC 100.00%James Alpha Event Driven Cl C James Alpha Management LLC 100.00%James Alpha Event Driven Cl I Denis Nayden 49.65%James Alpha Event Driven Cl I Charles Schwab & Co.,Inc. 50.34%James Alpha Event Driven Cl S National Financial Services LLC 100.00%James Alpha Family Office Cl A Pershing LLC 43.22%James Alpha Family Office Cl A First National Bank 29.64%James Alpha Family Office Cl A Community National Bank 24.96%James Alpha Family Office Cl C Jerry Chesser & Carool Chesser 30.71%James Alpha Family Office Cl C Johnny Harrison & Billie Harrison 28.43%James Alpha Family Office Cl I Charles Schwab & Co.,Inc. 63.00%James Alpha Family Office Cl I Denis Nayden 35.39%James Alpha Family Office Cl S National Financial Services LLC 100.00%James Alpha Relative Value Cl A James Alpha Management LLC 100.00%James Alpha Relative Value Cl C James Alpha Management LLC 100.00%James Alpha Relative Value Cl I Denis Nayden 80.88%James Alpha Relative Value Cl S National Financial Services LLC 100.00%James Alpha Total Hedge Cl A Mainstar Trust 65.92%James Alpha Total Hedge Cl A First National Bank 34.06%James Alpha Total Hedge Cl C Sandra Joanne McNamara 61.23%James Alpha Total Hedge Cl C Chizuko Momii 38.75%James Alpha Total Hedge Cl I Denis Nayden 93.74%James Alpha Total Hedge Cl S National Financial Services LLC 100.00%James Alpha Structured Credit Value Cl A Charles Schwab & Co.,Inc. 83.39%James Alpha Structured Credit Value Cl C Pershing LLC 44.61%James Alpha Structured Credit Value Cl C Wells Fargo Clearing Services 27.14%James Alpha Structured Credit Value Cl C Cor Clearing LLC 26.40%James Alpha Structured Credit Value Cl I Charles Schwab & Co.,Inc. 39.95%James Alpha Structured Credit Value Cl I Pershing LLC 30.51%James Alpha Structured Credit Value Cl I Interactive Brokers LLC 26.25%James Alpha Structured Credit Value Cl S National Financial Services LLC 51.16%James Alpha Structured Credit Value Cl S Mac & Co. 48.84%
57
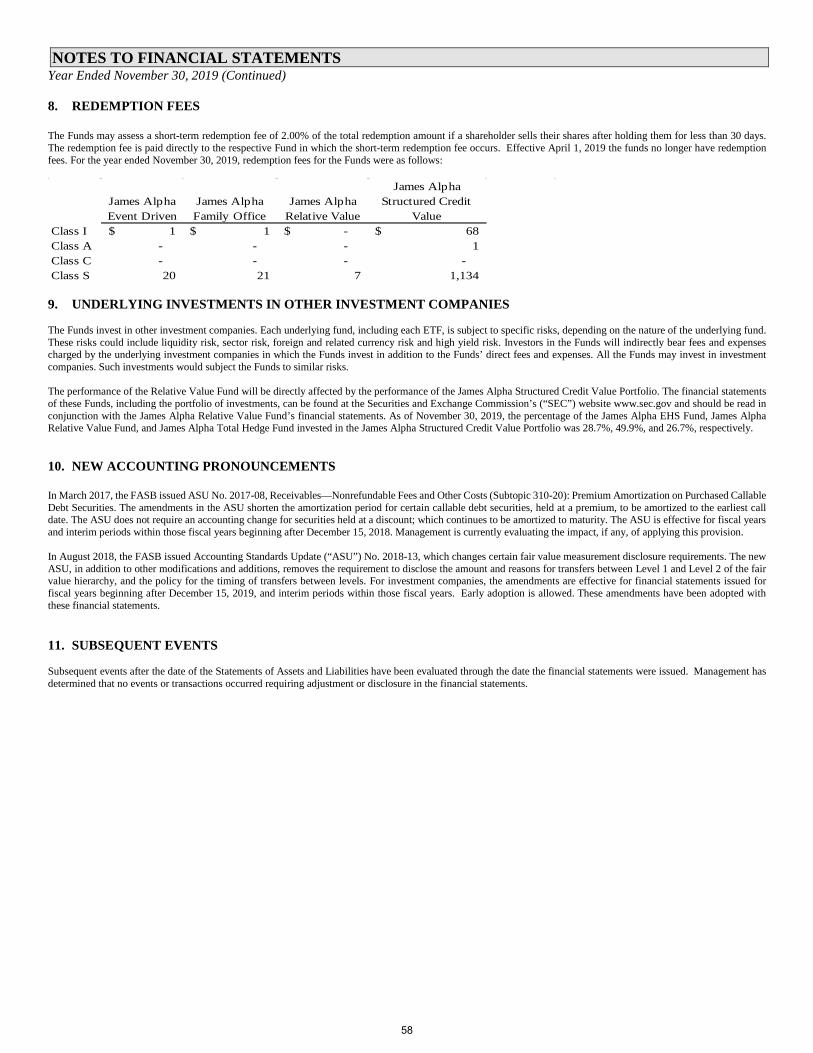
NOTES TO FINANCIAL STATEMENTS Year Ended November 30, 2019 (Continued) 8. REDEMPTION FEES
The Funds may assess a short-term redemption fee of 2.00% of the total redemption amount if a shareholder sells their shares after holding them for less than 30 days. The redemption fee is paid directly to the respective Fund in which the short-term redemption fee occurs. Effective April 1, 2019 the funds no longer have redemption fees. For the year ended November 30, 2019, redemption fees for the Funds were as follows:
James Alpha Event Driven
James Alpha Family Office
James Alpha Relative Value
James Alpha Structured Credit
ValueClass I 1$ 1$ -$ 68$ Class A - - - 1 Class C - - - - Class S 20 21 7 1,134
9. UNDERLYING INVESTMENTS IN OTHER INVESTMENT COMPANIES The Funds invest in other investment companies. Each underlying fund, including each ETF, is subject to specific risks, depending on the nature of the underlying fund. These risks could include liquidity risk, sector risk, foreign and related currency risk and high yield risk. Investors in the Funds will indirectly bear fees and expenses charged by the underlying investment companies in which the Funds invest in addition to the Funds’ direct fees and expenses. All the Funds may invest in investment companies. Such investments would subject the Funds to similar risks. The performance of the Relative Value Fund will be directly affected by the performance of the James Alpha Structured Credit Value Portfolio. The financial statements of these Funds, including the portfolio of investments, can be found at the Securities and Exchange Commission’s (“SEC”) website www.sec.gov and should be read in conjunction with the James Alpha Relative Value Fund’s financial statements. As of November 30, 2019, the percentage of the James Alpha EHS Fund, James Alpha Relative Value Fund, and James Alpha Total Hedge Fund invested in the James Alpha Structured Credit Value Portfolio was 28.7%, 49.9%, and 26.7%, respectively. 10. NEW ACCOUNTING PRONOUNCEMENTS In March 2017, the FASB issued ASU No. 2017-08, Receivables—Nonrefundable Fees and Other Costs (Subtopic 310-20): Premium Amortization on Purchased Callable Debt Securities. The amendments in the ASU shorten the amortization period for certain callable debt securities, held at a premium, to be amortized to the earliest call date. The ASU does not require an accounting change for securities held at a discount; which continues to be amortized to maturity. The ASU is effective for fiscal years and interim periods within those fiscal years beginning after December 15, 2018. Management is currently evaluating the impact, if any, of applying this provision. In August 2018, the FASB issued Accounting Standards Update (“ASU”) No. 2018-13, which changes certain fair value measurement disclosure requirements. The new ASU, in addition to other modifications and additions, removes the requirement to disclose the amount and reasons for transfers between Level 1 and Level 2 of the fair value hierarchy, and the policy for the timing of transfers between levels. For investment companies, the amendments are effective for financial statements issued for fiscal years beginning after December 15, 2019, and interim periods within those fiscal years. Early adoption is allowed. These amendments have been adopted with these financial statements. 11. SUBSEQUENT EVENTS Subsequent events after the date of the Statements of Assets and Liabilities have been evaluated through the date the financial statements were issued. Management has determined that no events or transactions occurred requiring adjustment or disclosure in the financial statements.
58

REPORT OF INDEPENDENT REGISTERED PUBLIC ACCOUNTING FIRM To the Shareholders and Board of Trustees of Saratoga Advantage Trust Opinion on the Financial Statements
We have audited the accompanying statements of assets and liabilities of James Alpha EHS Portfolio James Alpha Event Driven Portfolio, James Alpha Family Office Portfolio, James Alpha Relative Value Portfolio, James Alpha Total Hedge Portfolio, and the James Alpha Structured Credit Value Portfolio (the “Funds”), each a series of Saratoga Advantage Trust (the “Trust”), including the schedules of investments, as of November 30, 2019, the related statements of operations, the statements of changes in net assets, and financial highlights for the periods indicated thereon, and the related notes (collectively referred to as the “financial statements”). In our opinion, the financial statements present fairly, in all material respects, the financial position of the Funds as of November 30, 2019, the results of their operations, the changes in their net assets, and their financial highlights for the periods indicated thereon, in conformity with accounting principles generally accepted in the United States of America. Basis for Opinion
These financial statements are the responsibility of the Funds’ management. Our responsibility is to express an opinion on the Funds’ financial statements based on our audits. We are a public accounting firm registered with the Public Company Accounting Oversight Board (United States) (“PCAOB”) and are required to be independent with respect to the Funds in accordance with the U.S. federal securities laws and the applicable rules and regulations of the Securities and Exchange Commission and the PCAOB. We have served as the auditor of one or more of the funds in the Trust since 2003. We conducted our audits in accordance with the standards of the PCAOB. Those standards require that we plan and perform the audits to obtain reasonable assurance about whether the financial statements are free of material misstatement, whether due to error or fraud. The Funds are not required to have, nor were we engaged to perform, an audit of the Funds’ internal control over financial reporting. As part of our audits we are required to obtain an understanding of internal control over financial reporting, but not for the purpose of expressing an opinion on the effectiveness of the Funds’ internal control over financial reporting. Accordingly, we express no such opinion. Our audits included performing procedures to assess the risks of material misstatement of the financial statements, whether due to error or fraud, and performing procedures that respond to those risks. Such procedures included examining, on a test basis, evidence regarding the amounts and disclosures in the financial statements. Our audits also included evaluating the accounting principles used and significant estimates made by management, as well as evaluating the overall presentation of the financial statements. Our procedures included confirmation of securities owned as of November 30, 2019 by correspondence with the custodian and brokers; when replies were not received from brokers, we performed other auditing procedures. We believe that our audits provide a reasonable basis for our opinion. TAIT, WELLER & BAKER LLP Philadelphia, Pennsylvania January 29, 2020
59

SUPPLEMENTAL INFORMATION (Unaudited)
Beginning Account Ending Account Expense Paid Expense RatioValue - 6/01/2019 Value - 11/30/2019 6/01/2019-11/30/2019* [Annualized]
Actual Expenses James Alpha EHS - Class A $1,000.00 $1,056.90 $8.97 1.74%James Alpha EHS - Class C 1,000.00 1,051.00 12.81 2.49%James Alpha EHS - Class I 1,000.00 1,056.90 7.69 1.49%James Alpha EHS - Class S 1,000.00 1,058.90 5.78 1.12%James Alpha Event Driven – Class A 1,000.00 1,055.90 8.97 1.74%James Alpha Event Driven – Class C 1,000.00 1,055.90 12.83 2.49%James Alpha Event Driven – Class I 1,000.00 1,055.90 7.68 1.49%James Alpha Event Driven – Class S 1,000.00 1,057.80 5.78 1.12%James Alpha Family Office - Class A 1,000.00 1,084.50 9.10 1.74%James Alpha Family Office - Class C 1,000.00 1,080.80 12.99 2.49%James Alpha Family Office - Class I 1,000.00 1,086.30 7.80 1.49%James Alpha Family Office - Class S 1,000.00 1,088.60 5.86 1.12%James Alpha Relative Value - Class A 1,000.00 1,046.60 8.93 1.74%James Alpha Relative Value - Class C 1,000.00 1,046.60 12.77 2.49%James Alpha Relative Value - Class I 1,000.00 1,046.90 7.65 1.49%James Alpha Relative Value - Class S 1,000.00 1,048.60 5.77 1.12%James Alpha Total Hedge - Class A 1,000.00 1,047.00 8.93 1.74%James Alpha Total Hedge - Class C 1,000.00 1,042.20 12.75 2.49%James Alpha Total Hedge - Class I 1,000.00 1,048.00 7.64 1.49%James Alpha Total Hedge - Class S 1,000.00 1,049.90 5.78 1.12%James Alpha Structured Credit Value - Class A 1,000.00 1,022.60 8.81 1.74%James Alpha Structured Credit Value - Class C 1,000.00 1,019.90 12.63 2.49%James Alpha Structured Credit Value - Class I 1,000.00 1,024.80 7.58 1.49%James Alpha Structured Credit Value - Class S 1,000.00 1,026.60 5.69 1.12%
Shareholders of funds will pay ongoing expenses, such as advisory fees, distribution and services fees (12b-1 fees), and other fund expenses.The following examples are intended to help the shareholder understand the ongoing cost (in dollars) of investing in a fund and to comparethese costs with the ongoing costs of investing in other mutual funds. Please note, the expenses shown in the tables are meant to highlightongoing costs only and do not reflect any transactional costs, such as sales charges (loads), or contingent deferred sales charges (CDSCs) onredemptions.
This example is based on an investment of $1,000 invested at the beginning of the period and held for the entire period from June 1, 2019through November 30, 2019.
Actual Expenses: The first table provides information about actual account values and actual expenses. The shareholder may use theinformation in this line, together with the amount invested, to estimate the expenses that would be paid over the period. Simply divide accountvalue by $1,000 (for example, an $8,600 account value divided by $1,000 = 8.6), then multiply the result by the number under the headingentitled “Expenses Paid” to estimate the expenses paid on the account during the period.
60

SUPPLEMENTAL INFORMATION (Unaudited)(Continued)
Beginning Account Ending Account Expense Paid Expense RatioHypothetical Value - 6/01/2019 Value - 11/30/2019 6/01/2019-11/30/2019* [Annualized][5% Return Before Expenses] James Alpha EHS - Class A $1,000.00 $1,016.34 $8.80 1.74%James Alpha EHS - Class C 1,000.00 1,012.57 12.57 2.49%James Alpha EHS - Class I 1,000.00 1,017.59 7.54 1.49%James Alpha EHS - Class S 1,000.00 1,019.45 5.67 1.12%James Alpha Event Driven – Class A 1,000.00 1,016.34 8.80 1.74%James Alpha Event Driven – Class C 1,000.00 1,012.58 12.56 2.49%James Alpha Event Driven – Class I 1,000.00 1,017.60 7.54 1.49%James Alpha Event Driven – Class S 1,000.00 1,019.45 5.67 1.12%James Alpha Family Office - Class A 1,000.00 1,016.34 8.80 1.74%James Alpha Family Office - Class C 1,000.00 1,012.58 12.56 2.49%James Alpha Family Office - Class I 1,000.00 1,017.59 7.54 1.49%James Alpha Family Office - Class S 1,000.00 1,019.46 5.67 1.12%James Alpha Relative Value - Class A 1,000.00 1,016.34 8.80 1.74%James Alpha Relative Value - Class C 1,000.00 1,012.58 12.56 2.49%James Alpha Relative Value - Class I 1,000.00 1,017.60 7.54 1.49%James Alpha Relative Value - Class S 1,000.00 1,019.44 5.69 1.12%James Alpha Total Hedge - Class A 1,000.00 1,016.35 8.79 1.74%James Alpha Total Hedge - Class C 1,000.00 1,012.58 12.56 2.49%James Alpha Total Hedge - Class I 1,000.00 1,017.60 7.53 1.49%James Alpha Total Hedge - Class S 1,000.00 1,019.43 5.69 1.12%James Alpha Structured Credit Value - Class A 1,000.00 1,016.35 8.79 1.74%James Alpha Structured Credit Value - Class C 1,000.00 1,012.56 12.59 2.49%James Alpha Structured Credit Value - Class I 1,000.00 1,017.58 7.55 1.49%James Alpha Structured Credit Value - Class S 1,000.00 1,019.45 5.67 1.12%
Hypothetical Examples for Comparison Purposes: The second table below provides information about hypothetical account values andhypothetical expenses based on the fund’s actual expense ratio and an assumed rate of return of 5% per year before expenses, which is not thefund’s actual return. The hypothetical account values and expenses may not be used to estimate the actual ending account balance or expensespaid for the period. This information may be used to compare the ongoing costs of investing in the fund and other mutual funds. To do so, ashareholder would compare this 5% hypothetical example with the 5% hypothetical examples that appear in the shareholder reports of the othermutual funds.
* Expenses are equal to the Funds annualized expense ratio multiplies by the number of days in the period (183) divided by the number of days in the fiscal year (365).
61

SUPPLEMENTAL INFORMATION (Unaudited) (Continued)
Board of Trustees & Officers
The Trust is governed by a Board of Trustees, which oversees the Portfolios’ operations. Officers are appointed by the Trustees and serve at the pleasure of the Board. The table below shows, for each Trustee and Officer, his name, address, and age, the position held with the Trust, the length of time served as Trustee and Officer of the Trust, the Trustee’s or Officer’s principal occupations during the last five years, the number of portfolios in the Saratoga Family of Funds overseen by the Trustee or Officer, and other directorships held by the Trustee or Officer.
The Trust’s Statement of Additional Information contains additional information about the Trustees and Officers and is available without charge, upon request, by calling 1-800-807-FUND (3863).
Interested Trustees
Name, Age and Address Position(s) Held
with Trust Term* / Length of
Time Served Principal Occupation(s)
During Past 5 Years
Number of Portfolios in Fund
Complex Overseen by Trustee
Other Directorships Held by Trustee
Bruce E. Ventimiglia, 64 1616 N. Litchfield Rd. Suite 165 Goodyear, AZ 85395
President, CEO, and Chairman of the Board of Trustees**
Since September 1994
Chairman, President and Chief Executive Officer of Saratoga Capital Management, LLC
29 None
Independent Trustees
Name, Age and Address Position(s) Held
with Trust Term* / Length of
Time Served Principal Occupation(s)
During Past 5 Years
Number of Portfolios in Fund
Complex Overseen by Trustee
Other Directorships Held by Trustee
Patrick H. McCollough, 77 1616 N. Litchfield Rd. Suite 165 Goodyear, AZ 85395
Trustee Since September 1994
Retired 29 Chairman of the Board (2018 – Present), Trustee (2011-2018), Harbor Beach Community Hospital
Udo Koopmann, 78 1616 N. Litchfield Rd. Suite 165 Goodyear, AZ 85395
Trustee Since April 1997 Retired 29 None
Floyd E. Seal, 70 1616 N. Litchfield Rd. Suite 165 Goodyear, AZ 85395
Trustee Since April 1997 Retired. Director of Operations, Pet Goods Manufacturing & Imports (January 2013 – 2017
29 None
Stephen H. Hamrick, 67 1616 N. Litchfield Rd. Suite 165 Goodyear, AZ 85395
Trustee Since January 2003
President and Chief Executive Officer, Terra Capital Markets, LLC (January 2011-Present) (broker-dealer)
29 None
62

SUPPLEMENTAL INFORMATION (Unaudited) (Continued)
Senior Officers
Name, Age and Address Position(s) Held
with Trust Term* / Length of Time Served
Principal Occupation(s) During Past 5 Years
Number of Portfolios in Fund Complex Overseen
by Officer
Other Directorships
Held by Officer Stephen Ventimiglia, 63 1616 N. Litchfield Rd. Suite 165 Goodyear, AZ 85395
Vice President and Secretary **
Since September 1994
Vice Chairman and Chief Investment Officer of Saratoga Capital Management, LLC
29 None
Jonathan W. Ventimiglia, 36 1616 N. Litchfield Rd. Suite 165 Goodyear, AZ 85395
Treasurer, Chief Financial Officer, Vice President & Assistant Secretary***
Treasurer & Chief Financial Officer since July 2009; Vice President & Assistant Secretary since January 2008
Chief Financial Officer and Chief Compliance Officer of Saratoga Capital Management, LLC
29 None
James S. Vitalie, 60 1616 N. Litchfield Rd. Suite 165 Goodyear, AZ 85395
Vice President Since January 2011
Chief Executive Officer of James Alpha Advisors, LLC (September 2015 – Present); President of James Alpha Holdings, LLC (2017 – Present); President of James Alpha Management, LLC (March 2008 – 2017); Executive VicePresident of FDX Capital LLC (June 2012-Present)
29 Board Member, The Joshua
School (January 2016 – Present)
Board Member, Start from
Scratch (September
2019 - Present Emile R. Molineaux, 57 c/o Northern Lights Compliance Services, LLC 80 Arkay Drive, Suite 110 Hauppauge, NY 1788
Chief Compliance Officer
Since October 2019
Senior Compliance Officer (2011 – Present), Northern LightsCompliance Services, LLC
29 None
* Each Trustee will serve an indefinite term until his successor, if any, is duly elected and qualified. Officers of the Trust are elected annually. ** Bruce E. Ventimiglia and Stephen Ventimiglia are brothers. *** Jonathan W. Ventimiglia is Bruce E. Ventimiglia’s son. The Fund’s Statement of Additional Information (“SAI”) includes additional information about the Trustees and is available free of charge, upon request, by calling toll-free at 1-800-807-FUND.
63

Rev July 2011
WHAT DOES THE SARATOGA ADVANTAGE TRUST DO WITH YOUR PERSONAL INFORMATION?
Financial companies choose how they share your personal information. Federal law gives consumers the right to limit some but not all sharing. Federal law also requires us to tell you how we collect, share, and protect your personal information. Please read this notice carefully to understand what we do. The types of personal information we collect and share depend on the product or service you have with us. This information can include:
• Social Security number and wire transfer instructions • account transactions and transaction history • investment experience and purchase history
When you are no longer our customer, we continue to share your information as described in this notice.
All financial companies need to share customers’ personal information to run their everyday business. In the section below, we list the reasons financial companies can share their customers’ personal information; the reasons The Saratoga Advantage Trust (“The Trust”) choose to share; and whether you can limit this sharing.
Reasons we can share your personal information Does The Trust share? Can you limit this
sharing?
For our everyday business purposes— such as to process your transactions, maintain your account(s), respond to court orders and legal investigations, or report to credit bureaus
Yes No
For our marketing purposes— to offer our products and services to you Yes No
For joint marketing with other financial companies No We don’t share
For our affiliates’ everyday business purposes— information about your transactions and experiences Yes No
For our affiliates’ everyday business purposes— information about your creditworthiness No We don’t share
For our affiliates to market to you No We don't share
For nonaffiliates to market to you No We don't share
Questions? Call 1-800-807-FUND
64

Who we are
Who is providing this notice? The Saratoga Advantage Trust
What we do
How does The Trust protect my To protect your personal information from unauthorized access personal information? and use, we use security measures that comply with federal law. These
measures include computer safeguards and secured files and buildings. We restrict access to nonpublic personal information about you to those employees who need to know that information to provide products or services to you.
How does The Trust collect my personal information?
We collect your personal information, for example, when you
• open an account or deposit money • direct us to buy securities or direct us to sell your securities • seek information about your investments
We also collect your personal information from others, such as credit bureaus, affiliates, or other companies.
Why can’t I limit all sharing? Federal law gives you the right to limit only
• sharing for affiliates’ everyday business purposes—information about your creditworthiness
• affiliates from using your information to market to you • sharing for non-affiliates to market to you • State laws and individual companies may give you additional rights
to limit sharing.
Definitions Affiliates Companies related by common ownership or control. They can be financial
and nonfinancial companies.
• Our affiliates include financial companies such as Saratoga Capital Management, LLC.
Nonaffiliates Companies not related by common ownership or control. They can be financial and nonfinancial companies.
• The Trust does not share your personal information with nonaffiliates so they can market you.
Joint marketing A formal agreement between nonaffiliated financial companies that together market financial products or services to you.
• The Trust does not jointly market.
65

How to Obtain Proxy Voting Information Information regarding how the Portfolios voted proxies relating to portfolio securities during the most recent twelve month period ended June 30 as well as a description of the policies and procedures that the Portfolios use to determine how to vote proxies is available without charge, upon request, by calling 1-888-672-4839 or by referring to the Securities and Exchange Commission’s (“SEC”) website at http://www.sec.gov. How to Obtain 1st and 3rd Fiscal Quarter Portfolio Holdings Each Portfolio files its complete schedule of portfolio holdings with the SEC for the first and third quarters of each fiscal year on Form N-Q. Form N-Q is available on the SEC’s website at http://www.sec.gov and may be reviewed and copied at the SEC’s Public Reference Room in Washington, DC (1-800-SEC-0330). The information on Form N-Q is available without charge, upon request, by calling 1-888-672-4839.