Embed Size (px)
Citation preview

1
Author: Syverson, Kaila K Title: An Evaluation Report: Improving the 2010 Healthcare Business
Intelligence Summit and its Evaluation Instrument The accompanying research report is submitted to the University of Wisconsin-Stout,
Graduate School in partial completion of the requirements for the
Graduate Degree/ Major: MS Applied Psychology
Research Adviser: Susan Staggs, Ph.D.
Submission Term/Year: Fall, 2011
Number of Pages: 26
Style Manual Used: American Psychological Association, 6th edition
I understand that this research report must be officially approved by the Graduate School and that an electronic copy of the approved version will be made available through the University Library website
I attest that the research report is my original work (that any copyrightable materials have been used with the permission of the original authors), and as such, it is automatically protected by the laws, rules, and regulations of the U.S. Copyright Office.
STUDENT’S NAME: Kaila Syverson DATE: 12/5/2011
ADVISER’S NAME: Susan Staggs, PH.D. DATE: 12/5/2011
This section to be completed by the Graduate School This final research report has been approved by the Graduate School.
______________________________________________________________________
(Director, Office of Graduate Studies) (Date)

2
Syverson, Kaila K. An Evaluation Report: Improving the 2010 Healthcare Business
Intelligence Summit and its Evaluation Instrument.
Abstract
The 2010 Healthcare Business Intelligence Summit was a day-long event for non-technical
managers and employees of healthcare companies to learn how business intelligence can affect
their daily processes. The researcher used 53 returned summit evaluation surveys to determine
what worked well and what did not at the 2010 Summit. The survey results showed that most of
the attendees’ main objective was to learn and understand business intelligence and for most, this
objective was met. The Taste of Technology provided a chance to explore and compare the latest
in healthcare technologies, solutions, and services and was overall rated good. The researcher
also made recommendations on which speakers or topics should be utilized in the future based
on positive and negative feedback. Supporting literature was used to identify learner needs and
make recommendations for improving the summit evaluation survey.

3
Acknowledgements
I would like to thank my advisor, Dr. Susan Staggs for all of her help and guidance in
completing my thesis. I also would like to thank my family for believing in my abilities and
always supporting my efforts.

4
Table of Contents
……………………………………………………………………………………………………….…Page
Abstract……………………………………………………………………………………………….…...2
List of Tables………………..……………………………….…………………………………….……...6
List of Figures……………………………………………………………………………………………..7
Chapter I: Background………..………………………….………………………...……….…………..8
Summit Agenda...………………………….……...………………………………..…………….9
Goal of the Evaluation Survey……………………...…………………….………..………….10
Chapter II: Literature Review…………………….……………………...…………….………...……11
Identifying Learner Needs…………………………………….……………………………….11
Identifying Program Evaluation Needs………………………………………………12
Inputs……………………………………..……………………………………………..12
Processes…………………………………………..……………………………………12
Outcomes……………………………………………………………………………….13
Goal of Training and Training Design………………….…………………………………….14
Evaluation Instrument…………………………………………………………………15
Chapter III: Methodology………………………….…………………………………...............……...16
Chapter IV: Results……………………………………………………………...…………...…………17
Data Collected……...………………………...…………………………………………....……17
Summit Information Source……………………………………………………………..…….17
Main Objective for Attending……………………...……………………….…………..……..19
Future Attendance………………………………………………...…………………………….20
Rating of the Venue…………………………………………………...………………………..20
Rating of the Taste of Technology……………………………………...…………….............21

5
Rating of the Speaker’s Content…………………………………….………..…....………….22
Rating of the Speaker’s Relevance……………………….…………………...…...…………23
Rating of the Speaker’s Delivery..…………….…………………………….…………...…...24
Chapter V: Recommendations……………………………..……….………………...…….....………26
References…………………………………………………………………………………...……….......28
Appendix A: 2010 Midwest Healthcare Business Intelligence Summit Evaluation....……..…...29

6
List of Tables
Table 1: A Learning Contract.……………………………………………..…………………………...13
Table 2: Rating of the Speaker’s Content……………………………………………………………..23
Table 3: Rating of the Speaker’s Relevance………………………………………………………….24
Table 4: Rating of the Speaker’s Delivery………………………………………...………………….25

7
List of Figures
Figure 1: Summit Information Source………………………………………………………………...18
Figure 2: Main Objective for Attending………………………………………………………………20
Figure 3: Rating of the Venue…………………………………………………………….………..…..21
Figure 4: Rating of the Taste of Technology………………………………………………...……….22

8
Chapter I: Background
The 2010 Healthcare Business Intelligence Summit was for non-technical leaders of
healthcare management companies (e.g., health insurance, medical device, third party payers,
hospitals, and pharmacies) to learn how business intelligence can affect daily processes. Business
intelligence is developing smart business solutions to facilitate better business decisions in areas
such as finance, process improvement, and client service.
The 2010 Healthcare Business Intelligence Summit took place on October 19th from
0730hours to 1640hours. There were ten speakers, each were given fifty minutes to present on
their topic. The keynote speaker started the day by presenting on enabling business success with
best practices, which was followed by sessions covering implementing business intelligence with
realistic resource availability, and initial implementation of an enterprise. The remaining six
speakers were divided evenly among two tracks. Track one had 118 attendees total. The
attendees were given the option to go to a session focusing on agile data warehousing (27
attendees), dealing with exploding data volumes, skyrocketing demands, and shrinking staff
while delivering continuous improvement in outcomes (60 attendees), or adding clinical
analytics to a mature financial data warehouse (31 attendees). After the session was completed,
attendees went to track two. Track two had 104 attendees total. Attendees were given the option
to go to a session focusing on implementing data governance and stewardship (31 attendees),
getting ready for ICD-10 (14 attendees), or achieving healthcare quality with business
intelligence technology (59 attendees). The Taste of Technology was next and lasted about an
hour. The Taste of Technology gave attendees the opportunity to see the latest in healthcare
business intelligence technology from industry-leading solution providers. Attendees were able

9
to see demos of leading-edge products and service, as well as network with other professionals.
The Taste of Technology had a 73% participation rate. The keynote speaker ended the day with a
presentation on transformational change in health services’ performance through business
intelligence.
2010 Summit Agenda
All participants went by the following schedule:
7:30am - 8:15am Registration & Breakfast
8:20am - 8:30am Welcome & Introductions
8:30am - 9:20am Darren Taylor, Blue Cross Blue Shield of Kansas City - Keynote Speaker - Enabling Business Success With Best Practices Data Management (2010 TDWI Best Practices Winner-Enterprise Data Warehousing)
9:25am - 10:15am Panel - Vision vs. Reality - Implementing BI with Realistic Resource Availability Featuring: Alan V. Abramson, Ph.D, CIO, HealthPartners Rajesh Shetye, MS, CIO, LHC Group Darren Taylor, MBA, BCBS of Kansas City
10:15am - 10:30am Break
10:30am - 11:20am Samuel Van Norman, MBA, CPHQ, Hennepin County Medical Center Initial Implementation of an Enterprise - Wide Dashboard Tool: Lessons Learned
11:25am - 12:25pm Lunch
12:30pm - 1:20pm TRACK ONE Select One Presentation
Jeff Rutherford, WhiteCloud Analytics The Future of Chaos: Dealing with Exploding Data Volumes, Skyrocketing Demands, and Shrinking Staff While Delivering Continuous Improvement in Outcomes
HealthEast Informatics Department, Clinical Analytics Team Adding Clinical Analytics to a Mature Financial Data Warehouse
Larissa Moss, Method Focus

10
Agile Data Warehousing: Radical Idea or Practical Concept? (With brief case study by Laura Madsen, Lancet Healthcare Practice Leader)
1:25pm - 2:15pm TRACK TWO Select One Presentation
Gina Sanvik, RHIA, QuadraMed Corp Getting Ready for ICD-10
Priscilla Nuwash, Poudre Valley Health Systems Achieving Healthcare Quality With Business Intelligence Technology
Eric Landis, Prime Therapeutics Implementing Data Governance and Stewardship: Lessons Learned and Learning
2:20pm - 3:15pm Taste of Technology Explore and Compare the Latest in Healthcare Technologies, Solutions & Services
3:20pm - 4:30pm Dr. Richard Migliori, UnitedHealth Group - Keynote Speaker Transformational Change in Health Services' Performance Through Business Intelligence
4:30pm - 4:40pm Closing Remarks & iPad Drawing Must be present at drawing to win
There were 151 total registrants for the 2010 Summit. Of those registrants there were 10
attendees from 7 different states. Nineteen participants attended last year, 61 were new leads, 3
were new contacts, and 14 were existing leads or contacts. Seven of the existing leads or
contacts were from purchased lists. The summit had 17 cancellations, 45 no-shows, and 2 or 3
walk-ins. Total attrition was down 9% from the 2009 summit’s cancellations and no-shows. The
evaluation instrument used to assess the effectiveness of the summit was a survey.
Goal of the Healthcare Business Intelligence Summit Evaluation Survey
The goal of the evaluation survey was to determine what worked well and what did not at
the 2010 Healthcare Business Intelligence Summit. The feedback from the surveys established
what recommendations were made for improvements to future summits.

11
Chapter II: Literature Review
This section will provide an overview on the issues of identifying learner needs and the
elements of an effective evaluation survey. Appendix A contains the survey used at the 2010
Summit.
Identifying Learner Needs
Employees do not know everything about their jobs when they first enter the
organization, so training is useful for new hires. But training is not just for new employees
because it can help operational problems be resolved (Farahbakhsh, 2010). Adults will learn
things with more intensity and retain it for a longer period of time if they learn by their own
initiative, but when the learning enhances their professional knowledge, the needs of their
organization, profession, or society must be considered (Knowles, 1995). The learner needs to
understand the importance and usefulness of the training before hand to be motivated in gaining
the desired knowledge (Ibrahim, 2004). Healthcare employee’s ability to continuously improve
their skills is extremely important with helping in the organization’s success (Spath, 2002).
Through healthcare training, employees can move forward in their careers because our economy
depends on ongoing employee development. This is due to constant technology changes and
shortened hospital stays. It is imperative that employees feel like they know what is expected and
know various technologies used for patient care. The organization’s strategic goals should be the
focal point of staff education. Training will advance efficiency and productivity, which will
preserve skills, get employees ready for duties of higher levels, and improve their knowledge,
behavior, and attitude (Farahbakhsh, 2010).

12
Identifying Program Evaluation Needs
There are close comparisons between student and program assessments, but there are
some variations (Mehrotra, Hollister & Mcgahey, 2001). Program inputs, learning process, and
student outcomes are necessary for a program evaluation to be conclusive. Inputs look at the
characteristics of the learner and delivery. Processes are what actually get done during the
training by the learner. Outcomes look at what the learner did and their impacts.
Inputs
The facilitator should initiate the learning process by getting a learner to participate and
then giving them room to learn (Meier, 2000). Weaver et al. (2010) found that skill development,
practice, and feedback can be accelerated through simulation-based training. This is training that
takes place in replicated real world clinical environments. Trainees can practice what they learn
with a wide range of difficulties and complexities, as well as give and receive valuable feedback.
Processes
Integration of training delivery methods combines multiple modes of instruction.
Simulation-based team training aims at improving non-technical teamwork skills, situational
awareness, supportive structures, and cooperation (Weaver, Salas, Lyons, Lazzara, Rosen,
DiazGranados, et al. 2010). A popular training strategy is Crew Resource Management, which is
designed to boost team reliability and reduce the number of errors through teamwork and
utilization of all resources. High reliability is achieved through showing people what their
limitations and abilities really are. This is important because unless highly skilled healthcare
workers know how to work together, their skills will be underutilized.

13
A learning contract can be used to link the external needs and expectations with the
learner’s internal needs and interests (Knowles, 1995). Table 1 is a modified learning contract
that asks what the learner wants to know, how they are going to learn it, how to apply it to their
job, and how it will benefit their organization, profession, or society.
Table 1
A Learning Contract
Attending the BI Summit Questions for Potential Attendees
Learning Objectives What do you want to learn?
Resources and Strategies What will help you best learn it?
Evidence of Objectives Met
Validating Evidence
How are you going to apply what you learned?
How will you benefit your business, profession, or society?
Outcomes
There are six employee characteristics that affect training outcomes according to Tziner,
Fisher, Senior, and Weisberg (2007). Conscientiousness affects training outcomes because
employees with this are more dependable, organized, and motivated to do well professionally.
Another characteristic that affects training outcomes is motivation to learn because motivated
employees invest a high amount of consistent effort into the training. Learning goal orientation is
another characteristic affecting training outcome because those who seek challenging tasks give
more attention to training because they know it will help them. Performance goal orientation
affects training outcomes because employees with a high amount of this want to demonstrate
competence and look good to others. Self-efficacy is another characteristic because the employee
thinks they can meet all training requirements and master all of the content. Lastly,

14
instrumentality of training is an employee characteristic that has affects on training outcomes
because the employee believes that finishing the training will lead to valuable outcomes,
accomplishment, increased chances of promotion, or monetary rewards. Each characteristic
affects training outcomes, however the amount and reasons differ.
Goal of Training and Training Design
In order for an evaluation survey to be effective, the goal of the training must first be
defined. The survey should directly focus on measuring how well the goal was met to determine
the training’s success. The goal of training is to instill the knowledge, skills, and abilities
employees need to be effective at their job (Ford & Wroten, 1984). To determine who to train,
what to train, and the best training delivery, a training needs analysis should be completed
(Weaver et al. 2010). A training needs analysis consists of three dimensions: organizational
analysis, task analysis, and person analysis. Organizational analysis focuses on organizational
goals or areas for improvement and growth. Task analysis focuses on the tasks and knowledge,
skills, and abilities that are necessary for effective job performance. Person analysis focuses on
one’s current level of performance, knowledge, skills, and abilities.
Ford and Wroten (1984) found that once training was complete, a matching technique can
be used to determine whether training was effective or not. The matching technique shows the
relationship between training needs reassessment information/training emphasis with program
revision/training needs. There are training “hits” and “misses.” Training hits are areas where
emphasis on knowledge, skills, and abilities received in training adequately met training needs.
Training misses are in the form of deficiencies and excesses. Deficiencies occur when high
training needs are not met with a high emphasis. Excesses occur when low training needs are met

15
with an excessive amount of emphasis. The more deficiencies and excesses that are found within
the training, the more changes need to be made to the program.
Training design consists of a needs assessment, design, development, delivery, and
evaluation according to Hung (2010). Kirkpatrick’s 1998 model is often used to gage the value
of training (Spath 2002). He proposed four levels: reaction, learning, behavior, and results. The
reaction phase looks at how the participant felt in the training. The learning phase measures how
much the participant changed their attitudes, increased knowledge, or skills. The behavior phase
measures how much the participant changed their behavior on-the-job. The last phase is results,
which looks at different factors like increased sales, increased production numbers, decreased
turnover, and increased profits
Evaluation Instrument
Training evaluation plays a large role in determining program quality for making future
training programs better (Spitzer, 1999). For training to foster positive change in the organization
and the employee, an evaluation can be a useful resource. Valuable feedback can help designers
set goals, keep track of the process toward the goals, and determine when the goals have been
reached (Hung, 2010). An understanding of the participants’ satisfaction needs to be determined
because trainees typically will not apply what they learned in an unsatisfying training. Once it is
determined whether the learning objectives were met, more training, alternative instructional
techniques, or more effective instructors might be necessary (Spath, 2002).

16
Chapter III: Methodology
The purpose of this study was to determine what worked well and what did not at the
2010 Healthcare Business Intelligence Summit. This was based on the qualitative and
quantitative data provided by the survey, as well as an assessment of how the evaluation survey
could be improved.
All attendees of the 2010 Healthcare Business Intelligence Summit were given the
opportunity to complete a survey. A copy of this survey is provided as Appendix A to this report.
The first two questions on the survey: How did you hear about the summit; what was your main
objective for attending the summit and was it met, provided qualitative data that was analyzed
through identifying common themes throughout the responses. The remaining questions
provided quantitative data that was analyzed in an Excel spreadsheet. Ten speakers were rated on
content, relevance, and delivery. Each item was measured on a four point scale as poor [1], fair
[2], good [3], or excellent [4]. The average score for each category provided a measure for
overall attendee reaction to each speaker.

17
Chapter IV: Results
This study’s purpose was to establish which elements of the 2010 Healthcare Business
Intelligence Summit worked well and which ones did not based on the collected survey data.
Data Collected
Data collected in association with the Healthcare Business Intelligence Summit include:
Summit information source
Main objective for attending
Future attendance
Rating of the venue
Rating of the Taste of Technology
Rating of each speaker’s content
Rating of each speaker’s relevance
Rating of each speaker’s delivery
A copy of this survey is provided as Appendix A to this report. As there was no compulsion for
attendees to complete this survey, not all attendees completed it.
Summit Information Source
Here the participants wrote in a response to the question: How did you hear about the
summit? There were 51 responses. This data was analyzed by identifying common themes
throughout the responses. Six themes emerged: Heard about the summit from a co-worker or
business, received an email invitation, previous attendee or part of this year’s summit, listed a
specific person not defined as a co-worker, internet use, or source unknown. As shown in Figure

18
1, the most common theme, identified by almost half of the respondents, was that attendees heard
about the summit from a co-worker or business. The second most common theme, which almost
30% of respondents reported, was that they received an email invitation. This was followed by
about 15% stating that they attended last year’s summit or are part of this year’s summit. The
fourth most common theme, representing about 5%, of the responses was listing a specific
person, not defined as a co-worker. The two least common themes were internet use and the
source being unknown.
45%
29%
16%
6%
2% 2%
Co-worker or business
Email invitation
Previous attendees or part of this year's summit
Listed a specific person, not defined as co-worker
Source unknown
Internet use
Figure 1: Summit Information Source. This figure illustrates how the survey respondents heard about the Summit.
19
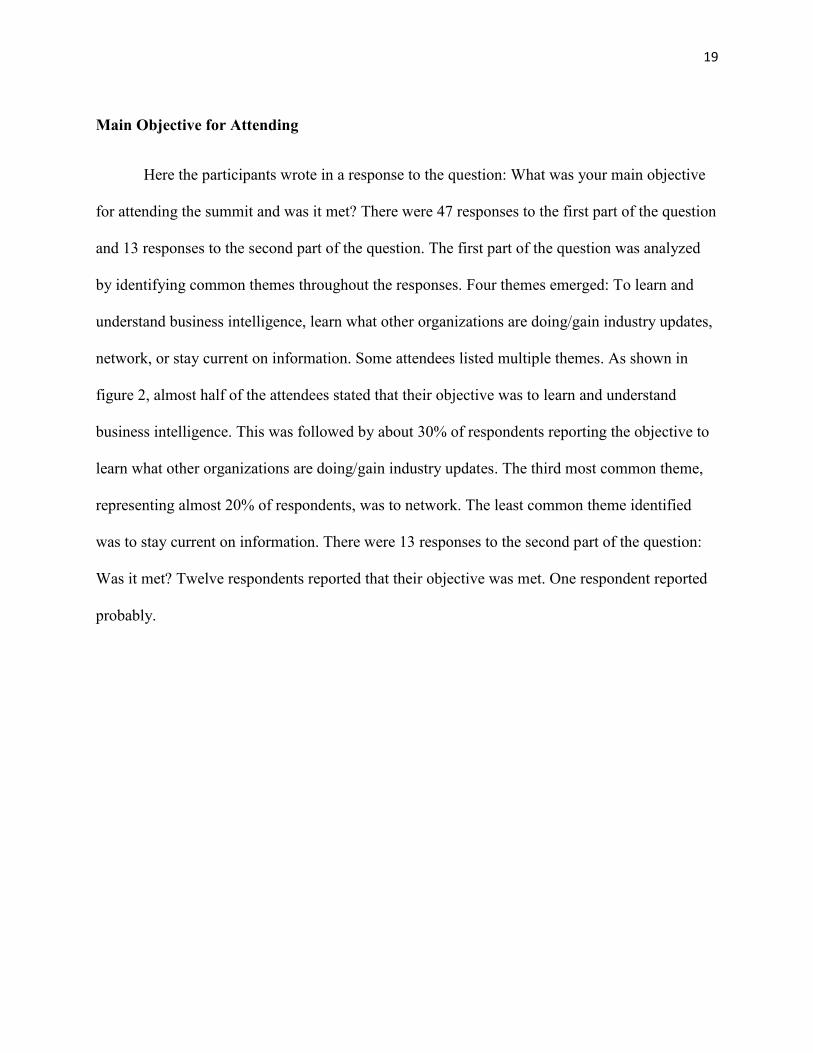
Main Objective for Attending
Here the participants wrote in a response to the question: What was your main objective
for attending the summit and was it met? There were 47 responses to the first part of the question
and 13 responses to the second part of the question. The first part of the question was analyzed
by identifying common themes throughout the responses. Four themes emerged: To learn and
understand business intelligence, learn what other organizations are doing/gain industry updates,
network, or stay current on information. Some attendees listed multiple themes. As shown in
figure 2, almost half of the attendees stated that their objective was to learn and understand
business intelligence. This was followed by about 30% of respondents reporting the objective to
learn what other organizations are doing/gain industry updates. The third most common theme,
representing almost 20% of respondents, was to network. The least common theme identified
was to stay current on information. There were 13 responses to the second part of the question:
Was it met? Twelve respondents reported that their objective was met. One respondent reported
probably.

20
46%
31%
19%
4%
Learn and understand business intelligence
Learn what other organizations are doing/gainindustry updates
Network
Stay current on information
Figure 2: Main Objective for Attending. This figure illustrates what the survey respondent’s main objective for attending was.
Future Attendance
Here the participants chose between yes or no to the question: Would you attend this
event next year. There were 50 responses. Fifty attendees responded yes.
Rating of the Venue
Here the participants were asked to please rate the venue as poor, fair, good, or excellent.
There were 51 responses. As shown in figure 3, almost half of the attendees responded excellent.
This was followed by good, which about 40% of respondents reported and 10% fair. No
attendees responded poor.

21
49%
41%
10%0%
Excellent
Good
Fair
Poor
Figure 3: Rating of the Venue. This figure illustrates how well the survey respondents liked the venue.
Rating of the Taste of Technology
Here the participants were asked to please rate the value of the Taste of Technology as
poor, fair, good, or excellent. There were 45 responses. As shown in figure 4, over half of the
attendees responded good. This was followed by fair, which about 30% of respondents reported
and 16% excellent. No attendees responded poor.

22
53%
31%
16%
0%
Good
Fair
Excellent
Poor
Figure 4: Rating of the Taste of Technology. This figure illustrates how well the survey respondents liked the Taste of Technology. Rating of the Speaker’s Content
Here the participants rated the speaker’s content as P (poor) [1], F (fair) [2], G (good) [3],
E (excellent) [4]. As shown in table 2, the speakers with the highest overall content rating were
Dr. Richard Migliori and Gina Sanvik. The speakers with the lowest overall content rating were
the Vision vs. Reality Panel and the HealthEast Informatics Department.

23
Table 2
Rating of the Speaker’s Content
Speaker Average Rating
Topic
Dr. Richard Migliori 3.87 Transformational change in health services
Gina Sanvik 3.67 Getting ready for ICD-10
Priscilla Nuwash
Larissa Moss
Eric Landis
Samuel Van Norman
Darren Taylor
Jeff Rutherford
Vision vs. Reality Panel
HealthEast Informatics
Department
3.65
3.63
3.50
3.50
3.43
3.38
3.17
2.83
Achieving healthcare quality with BI
Agile data warehousing
Implementing data governance and stewardship
Initial implementation of an enterprise
Enabling business success with best practices
Data volumes, demands, and shrinking staff
BI with realistic resource availability
Adding clinical analytics to mature financial
data warehouse
Rating of the Speaker’s Relevance
Here the participants rated the speaker’s relevance as P (poor) [1], F (fair) [2], G (good)
[3], E (excellent) [4]. As shown in table 3, the speakers with the highest overall relevance rating
were Dr. Richard Migliori and Gina Sanvik. The speakers with the lowest overall relevance
rating were the Vision vs. Reality Panel and the HealthEast Informatics Department.

24
Table 3
Rating of the Speaker’s Relevance
Speaker Average Rating
Topic
Dr. Richard Migliori 3.82 Transformational change in health services
Gina Sanvik 3.78 Getting ready for ICD-10
Eric Landis
Larissa Moss
Samuel Van Norman
Jeff Rutherford
Darren Taylor
Priscilla Nuwash
Vision vs. Reality Panel
HealthEast Informatics
Department
3.67
3.50
3.48
3.46
3.46
3.45
3.33
3.00
Implementing data governance and stewardship
Agile data warehousing
Initial implementation of an enterprise
Data volumes, demands, and shrinking staff
Enabling business success with best practices
Achieving healthcare quality with BI
BI with realistic resource availability
Adding clinical analytics to mature financial
data warehouse
Rating of the Speaker’s Delivery
Here the participants rated the speaker’s delivery as P (poor) [1], F (fair) [2], G (good)
[3], E (excellent) [4]. As shown in table 4, the speakers with the highest overall delivery rating
were Dr. Richard Migliori and Jeff Rutherford. The speakers with the lowest overall delivery
rating were the Vision vs. Reality Panel and the HealthEast Informatics Department.

25
Table 4
Rating of the Speaker’s Delivery
Speaker Average Rating
Topic
Dr. Richard Migliori 3.86 Transformational change in health services
Jeff Rutherford 3.67 Data volumes, demands, and shrinking staff
Eric Landis
Priscilla Nuwash
Gina Sanvik
Samuel Van Norman
Larissa Moss
Darren Taylor
Vision vs. Reality Panel
HealthEast Informatics
Department
3.59
3.50
3.50
3.41
3.37
3.36
3.16
2.82
Implementing data governance and stewardship
Achieving healthcare quality with BI
Getting ready for ICD-10
Initial implementation of an enterprise
Agile data warehousing
Enabling business success with best practices
BI with realistic resource availability
Adding clinical analytics to mature financial
data warehouse

26
Chapter V: Recommendations
Based on the results, it is recommended that other methods of getting the word out about
the summit are used in addition to email invitations. More speaker topics should focus on what
business intelligence is and how organizations and the industry are using it because that is what
most attendee’s main objective was for participating. It is also recommended that the same venue
or similar be used in the future because attendees rated it highly. The Taste of Technology was
overall rated good, therefore it should consist of similar elements in the future. Another
recommendation is to invite Dr. Richard Migliori and Gina Sanvik back to present in future
Healthcare Business Intelligence Summits or other speakers with similar backgrounds or topics
to transformational change in health services’ performance through business intelligence and
getting ready for ICD-10. Due to the negative feedback on the speakers for HealthEast
Informatics Department and Vision vs. Reality Panel it is not recommended that they present in
the future on the same topics discussed in 2010: Implementing business intelligence with
realistic resource availability and adding clinical analytics to a mature financial data warehouse.
Based on the literature a needs assessment or learning contract could be implemented to
potential attendees before the summit begins to see what the potential participants want to learn
or topics that would be the most beneficial to their job performance. Based on the gathered
results, experts in those areas could be selected to present. It is important to understand which
learning style was the most beneficial to the attendees: interactive technologies, power point
lecture, small group exercises, etc. It is recommended to include a multiple choice survey
question on delivery mode for planning of future summits. The likert scale for rating each
speaker needs to be defined on the survey, P = Poor, F = Fair, G = Good, E = Excellent. Given

27
that the goal of training is to improve one’s knowledge, skills, and abilities associated with job
performance it would be beneficial to include questions like, “Will the information you learned
today help you improve your job performance?” and “What topics were not covered today that
you feel would benefit your job performance?” Future summits will be the most beneficial to
participants whom the topics apply directly to.

28
References
Farahbakhsh, S. (2010). Study of short-time training’s effectiveness of managers and staff in the
public organizations. Australian Journal of Basic and Applied Sciences, 4(10), 4888.
Ford, K.J., & Wroten, S.P. (1984). Introducing new methods for conducting training evaluation
and for linking training evaluation to program redesign. Personnel Psychology, 37, 658.
Hung, T. (2010). An empirical study of the training evaluation decision-making model to
measure training outcome. Social Behavior and Personality, 38(1), 89.
Ibrahim, M.E. (2004). Measuring training effectiveness. Journal of Management Research, 4(3),
154.
Knowles, M.S. (1995). Designs for adult learning. Alexandria, VA: American Society for
Training and Development.
Mehrotra, C.M., Hollister, C., Mcgahey, L. (2001). Distance learning. Thousand Oaks, CA:
Sage Publications, Inc.
Meier, D. (2000). The accelerated learning handbook. New York, NY: McGraw-Hill
Companies, Inc.
Spath, P.L. (2002). Guide to effective staff development in healthcare organizations. San
Francisco, CA: John Wiley & Sons, Inc.
Spitzer, D.R. (1999). Embracing evaluation. Training, 36(6), 42-47.
Tziner, A., Fisher, M., Senior, T., Weisberg, J. (2007). Effects of trainee characteristics on
training effectiveness. International Journal of Selection and Assessment, 15(2), 168.
Weaver, S.J., Salas, E., Lyons, R., Lazzara, E.H., Rosen, M.A., DiazGranados, D., Grim, J.G.,
Augenstein, J.S., Birnback, D.J., King, H. (2010). Simulation-based team training at the
sharp end: A qualitative study of simulation based team training design, implementation,
and evaluation in healthcare. Journal of Emergencies, Trauma, and Shock, 3(4), 370-375.

29
Appendix A: 2010 Midwest Healthcare Business Intelligence Summit Evaluation
Midwest Healthcare Business Intelligence Summit SURVEY
HO\VO:IDYOUHEAAABOIJflHESUMMn? _ _ _ ___________ ______________ _
WHAl WAS YOUR MAIN OIUEC'OVE FOR ATTENDING THE SUMMirAND WAS rr Mffi'------------------
WOULD YOU A 1TEND n-IlS EVENT NEXT V'EAA? ves NO
PLEASE RATE fH E VEmJE!
Poot- Falr Good
Pt.EASE RAtE THE VAWE'OF lliE TAm OFlECHNOLOGY:
Poor
D YOU MAY OUO'll: ME FOR SUMMIT PUBUOTY
SP£AK£A £VAWAOONS COffTUIT fiREVANCE OEliVatY p F G • p ' G E • F G '
OARRENTAYlOR 1 2 • 4 1 , • • • 2 3 • vtSION VS. R£At.ITY .. PANF.I. 1 2 • • 1 2 • 4 I 2 3 • SWUU. V/414 ~RMAN 1 2 3 4 t l 3 • 1 2 3 4
~Ff RIJTHEfORO 1 2 3 4 1 2 3 • ' , 3 •
HEA11H£AST INFORMATICS I)£Pf, 1 2 3 4 1 2 3 • ' 2 3 • LARISSA MOSS 1 2 ' • ' 2 3 • l 2 3 • GINASANVIK l 2 3 • 1 2 3 4 1 2 ' • PRISOUA NUWASU 1 2 3 • 1 2 3 • 1 2 3 4
EEUCLA!'fOIS 1 2 3 4 1 2 3 4 l 2 3 • DR. RICHARD MJGUORI 1 ~ ' • 1 1 3 • 1 2 3 •
THANK YOU!
(PlEASE WRITE ANY GfNERA.t COMMENTS ON TilE BACt)