Embed Size (px)
Citation preview

1
Mastermind-like 3 controls proliferation and differentiation in neuroblastoma
Guus J.J.E. Heynen1,2, Ekaterina Nevedomskaya1,3, Sander Palit1,2, Noorjahan Jagalur Basheer4, Cor
Lieftink1,2, Andreas Schlicker1,2, Wilbert Zwart3, Rene Bernards1,2* and Prashanth Kumar Bajpe1,2*
1Division of Molecular Carcinogenesis, 2Cancer Genomics Center Netherlands, 3Division of Molecular
Pathology, The Netherlands Cancer Institute, Plesmanlaan 121, 1066 CX Amsterdam, The
Netherlands
4Department of Pediatric Oncology, Erasmus Medical Center/Sophia Children’s Hospital,
Wytemaweg 80, 3015 CN Rotterdam, The Netherlands
Running title: The role of MAML3 in neuroblastoma
Keywords: IGF1R / MAML3 / neuroblastoma / resistance / retinoic acid
Financial support: This work was supported by a grant from the Dutch Cancer Society (KWF) and
the cancer genomics Netherlands consortium (CGC.NL).
*Corresponding Authors:
Rene Bernards; email [email protected] ; tel. +31-20 5126973
Prashanth Kumar Bajpe; email [email protected]
Disclosure of Potential Conflicts of Interest: No potential conflicts of interest were disclosed.
Word count: 5,324
Number of figures and tables: 6
on June 4, 2018. © 2016 American Association for Cancer Research. mcr.aacrjournals.org Downloaded from
Author manuscripts have been peer reviewed and accepted for publication but have not yet been edited. Author Manuscript Published OnlineFirst on January 19, 2016; DOI: 10.1158/1541-7786.MCR-15-0291-T
2
Abstract
Neuroblastoma cell lines can differentiate upon treatment with retinoic acid (RA), a finding that
provided the basis for the clinical use of RA to treat neuroblastoma. However, resistance to RA is
often observed, which limits its clinical utility. Using a gain-of-function genetic screen we identified
an unexpected link between RA signaling and Mastermind-like 3 (MAML3), a known transcriptional
coactivator for NOTCH. Our findings indicate that MAML3 expression leads to loss of activation of a
subset of RA target genes, which hampers RA-induced differentiation and promotes resistance to RA.
The regulatory DNA elements of this subset of RA target genes show overlap in binding of MAML3
and the retinoic acid receptor, suggesting a direct role for MAML3 in the regulation of these genes.
Additionally, MAML3 has RA-independent functions, including the activation of IGF1R and
downstream AKT signaling via upregulation of IGF2, resulting in increased proliferation. These
results demonstrate an important mechanistic role for MAML3 in proliferation and RA-mediated
differentiation.
Implications: MAML3 coordinates transcription regulation with Receptor Tyrosine Kinase pathway
activation, shedding new light on why this gene is mutated in multiple cancers.
on June 4, 2018. © 2016 American Association for Cancer Research. mcr.aacrjournals.org Downloaded from
Author manuscripts have been peer reviewed and accepted for publication but have not yet been edited. Author Manuscript Published OnlineFirst on January 19, 2016; DOI: 10.1158/1541-7786.MCR-15-0291-T

3
Introduction
Neuroblastoma is the most common extra cranial solid pediatric cancer and is most prevalent in early
childhood (1). It affects the peripheral nervous system and often develops in the adrenal glands, but is
also found in other peripheral nerve tissues. It is a heterogeneous disease with diverse clinical
manifestations, ranging from spontaneously regressing tumors to very aggressive tumors with poor
prognosis. Several genetic aberrations have been linked to neuroblastoma, most notably MYCN
amplification in 20% of neuroblastomas (2), ALK mutations (6-10%) (3, 4) as well as loss of the 1p36
and 11q23 chromosomal regions (5, 6). Treatment options for neuroblastoma patients include surgery,
radiation, bone marrow transplantation, chemotherapy and retinoic acid for high risk patients, but
options to treat late-stage metastatic disease are very limited and urgently need improvement.
The vitamin A metabolite retinoic acid (RA) plays an important role during embryonic development,
including development of the nervous system (7). The physiological functions of retinoic acid is
exerted through the nuclear receptors Retinoic Acid Receptor (RAR) and Retinoid X Receptor (RXR),
which form a heterodimer that binds to DNA elements known as Retinoic Acid Response Elements
(RAREs) (8). In the absence of retinoic acid, RAR/RXR is in complex with corepressors like NCoR,
SMRT and HDACs that repress transcription of retinoic acid target genes (9, 10). Binding of retinoic
acid to RAR results in a conformational change of RAR, which leads to an exchange of repressor
proteins for transcriptional coactivator proteins like CBP/p300, PCAF, CTBP2 and p160 enabling the
transcription of retinoic acid target genes (11-13).
The observation that retinoids drive neuronal differentiation in neuroblastoma cell lines has led to
incorporation of 13-cis-RA in the treatment regimen for high risk neuroblastoma (14). However,
treatment of high-risk neuroblastoma patients with 13-cis-RA after intensive chemotherapy showed
only a modest increase in event-free survival (15, 16). This is caused in part by the fact that both
intrinsic and acquired resistance to retinoid therapy are observed frequently in neuroblastoma patients.
Understanding mechanisms of resistance to retinoids is crucial to improve treatment with this class of
drugs and to attain a long-lasting effect. Several mechanisms of resistance to RA have been described
to date, including mutations in the ligand-binding domain of PML-RARα in APL patients (17) and the
epigenetic silencing of the RARβ receptor (18, 19), which leads to the inability of RA to activate the
on June 4, 2018. © 2016 American Association for Cancer Research. mcr.aacrjournals.org Downloaded from
Author manuscripts have been peer reviewed and accepted for publication but have not yet been edited. Author Manuscript Published OnlineFirst on January 19, 2016; DOI: 10.1158/1541-7786.MCR-15-0291-T
4
pathway and hence to RA resistance. CTBP2, generally a corepressor protein, was identified as a
positive cofactor of RAR-RXR in mouse F9 cells and its suppression conferred resistance to RA (13).
Using loss-of-function genetic screens Huang et al. showed that knockdown of the zinc-finger protein
ZNF423 leads to the loss of activation of RA target genes. ZNF423 binds to the RAR/RXR complex
and acts as a transcriptional coactivator (20). In another study, loss of the tumor suppressor NF1 was
shown to determine responsiveness to RA. Loss of NF1 activates RAS signaling, which in turn
represses ZNF423 expression leading to RA resistance. Low expression levels of ZNF423 and/or NF1
in neuroblastoma patients predict poor outcome (21).
In this study, we use the validation based insertional mutagenesis (VBIM) system (22) to perform a
gain-of-function genetic screen to identify determinants of RA responsiveness in the SK-N-SH
neuroblastoma cell line. We identify here an unexpected link between the coactivator MAML3 and
RA signaling, which had hitherto only been implicated in NOTCH signaling.
on June 4, 2018. © 2016 American Association for Cancer Research. mcr.aacrjournals.org Downloaded from
Author manuscripts have been peer reviewed and accepted for publication but have not yet been edited. Author Manuscript Published OnlineFirst on January 19, 2016; DOI: 10.1158/1541-7786.MCR-15-0291-T
5
Material and Methods
Reagents and Antibodies
All-trans retinoic acid (R2625) was purchased from Sigma. OSI-906 (S1091) was purchased from
Selleckchem. Phosphatase inhibitor cocktail 2 (P-5726), and Phosphatase inhibitor cocktail 3 (P0044)
were purchased from Sigma-Aldrich. Dynabeads Protein A (10002D) was purchased from Life
Technologies. MAML1 (A300-673A), MAML2 (A300-682A) and MAML3 (A300-684A) antibodies
were purchased from Bethyl Laboratories. AKT (2920), pAKT (4060), IGF1R (3027) and pIGF1R
(3024) antibodies were purchased from Cell Signaling. HSP90 (sc-7947), SNAP25 (sc-7539), GAP43
(sc-7457) and normal rabbit IgG (sc-2027) antibodies were purchased from Santa Cruz
Biotechnologies. V5 (R960-25) antibody was purchased from Invitrogen.
Plasmids
pLX-GFP, pLX-MAML3 and pLX-MAML2 vectors were part of the Broad Institute ORF library
(Sigma). pBabe puro (pBp) and pHAGE-MAML1 vectors were purchased from AddGene.
MAML3-ΔExon1 DNA was cloned into pBp vector by PCR amplifying MAML3 with primers
spanning from exon 2 to exon 5 (Forward:
GCAGGATCCAGATGCTACAAGAGACTGTGAAAAGGAAGTTGG, Reverse:
CGTGTCGACTGTTAGGGGTTACCAAACAATTCATCAAGCTCC). Full-length cDNA clone
which was used as a template was purchased from Source Bioscience, clone #IRCBp5005D2310Q.
The PCR amplified MAML3 DNA was cloned into pBp using BamHI and SalI restriction sites. Short
hairpins against MAML3 (TRCN0000236445) and IGF2 (TRCN0000062429, TRCN0000062431 and
TRCN0000062432) were part of the MISSION TRC short hairpin library (Sigma).
Cell culture and retroviral/lentiviral transductions
SK-N-SH, SH-SY5Y and N206 cells were from the laboratory collections of Dr. Rene Bernards. SK-
N-BE cell were kindly provided by Prof. Rogier Versteeg. Details of the cell culture and viral
transduction methods are given in the supplementary document.
on June 4, 2018. © 2016 American Association for Cancer Research. mcr.aacrjournals.org Downloaded from
Author manuscripts have been peer reviewed and accepted for publication but have not yet been edited. Author Manuscript Published OnlineFirst on January 19, 2016; DOI: 10.1158/1541-7786.MCR-15-0291-T
6
Long-term cell proliferation assays
Cells were seeded in 6-well plates (20-40x104 cells per well for SK-N-SH and SH-SY5Y, 1*105 for
N206 and SK-N-BE) and cultured in absence or presence of drugs as indicated. 1 μM RA was used in
each proliferation assay, unless otherwise indicated. For each cell line, cells cultured in different
conditions were simultaneously fixed in 3.7% paraformaldehyde and subsequently stained with 0.1%
crystal violet and subsequently photographed.
Proliferation assays using IncuCyte
Cells were plated in triplicates in 96-well plate at 1500 cells/well and treated as indicated. The plate
was incubated in the IncuCyte (Essen BioScience) and cells were allowed to grow to confluency. The
IncuCyte measured and recorded confluency every 4 hours. This data was subsequently converted into
growth curves.
Protein lysate preparation and western blotting
Cells were lysed in RIPA buffer containing 150 mM NaCl, 50 mM Tris pH 8.0, 1% NP-40, 0.5%
sodium deoxycholate and 0.1% SDS supplemented with protease inhibitors (Complete, Roche) and
phosphatase inhibitor cocktails II and III (Sigma). 10x reducing agent and 4x sample preparation
buffer (NuPage) was added. Subsequently, the samples were boiled for 5 minutes and centrifuged at
14,000 rpm for 5 minutes. Equal amounts of protein were subjected to SDS gel electrophoresis using
NuPage precast gels and MOPS buffer, followed by western blotting.
Human Phospho-RTK Array
Human Phospho-RTK Array Kit was purchased from R&D systems (Cat nr. ARY001B). Lysate
preparation and RTK array development of SK-N-SH parental and SD3.23 cells were performed
according to manufacturers protocol.
on June 4, 2018. © 2016 American Association for Cancer Research. mcr.aacrjournals.org Downloaded from
Author manuscripts have been peer reviewed and accepted for publication but have not yet been edited. Author Manuscript Published OnlineFirst on January 19, 2016; DOI: 10.1158/1541-7786.MCR-15-0291-T

7
Inverse PCR
Genomic DNA was prepared from cells using DNAzol. gDNA was used for subsequent nested PCR
reaction. Primers for nested PCR reaction are provided in the supplementary document.
qRT-PCR
RNA was isolated from cell lines using ZymoResearch Quick-RNA MiniPrep (Cat. Nr. R1055). qRT-
PCR assays were performed using 7500 Fast Real-Time PCR system (Applied Biosystems). Relative
mRNA levels of genes shown were normalized to the mRNA level of GAPDH (housekeeping gene).
The details of the primer sequences are provided in the supplementary document.
Coimmunoprecipitation
For endogenous MAML3, RAR and RXR coimmunoprecipitations, total cell lysates were prepared by
lysing the cells in a buffer containing 0.25 M NaCl, 0.1% NP-40, 50 mM Hepes-KOH (pH-7.3).
Protease and Phosphatase inhibitors were added just before the lysis step. For each
immunoprecipitation, 1 ml of the total cell lysate (1mg total protein) was used. 2 μg of each antibody
was used to coat the protein A Dynabeads. Antibody coated protein A Dynabeads were added to the
lysates and incubated for 3 hours at 4oC. Antibody immune complexes were recovered using magnetic
separation and washed 4 times using binding buffer. After the final wash, the beads containing
immune complexes were suspended in 2X sample buffer and analysed by western blotting.
Genome-wide expression analysis (RNA-sequencing)
Details of RNA-sequencing are provided in the supplementary document. Briefly, libraries were
prepared as previously described (23) and sequenced on Illumina HiSeq 2000. Reads were aligned to
hg19; HTseq-count data was processed using limma package (24) in R.
Chromatin immunoprecipitation, solexa sequencing and bioinformatics
on June 4, 2018. © 2016 American Association for Cancer Research. mcr.aacrjournals.org Downloaded from
Author manuscripts have been peer reviewed and accepted for publication but have not yet been edited. Author Manuscript Published OnlineFirst on January 19, 2016; DOI: 10.1158/1541-7786.MCR-15-0291-T

8
Chromatin Immunoprecipitations were performed as described before (25). Detailed methods can be
found in the supplementary document.
on June 4, 2018. © 2016 American Association for Cancer Research. mcr.aacrjournals.org Downloaded from
Author manuscripts have been peer reviewed and accepted for publication but have not yet been edited. Author Manuscript Published OnlineFirst on January 19, 2016; DOI: 10.1158/1541-7786.MCR-15-0291-T

9
Results
A gain-of-function genetic screen identifies MAML3 as a gene that confers RA resistance
To identify novel genes that interfere with RA-mediated differentiation in neuroblastoma, we
performed a gain-of-function screen with the VBIM lentiviral insertional mutagenesis system.
Random insertion of this vector can place a GFP marker gene and a strong promoter into nearly all
genomic loci (22). SK-N-SH neuroblastoma cells were used to perform this screen because of their
high sensitivity to RA, leading to proliferation arrest and visible morphological changes. We infected
three pools of each 3x10⁶ SK-N-SH cells with one of three VBIM virus vectors (SD1, SD2 and SD3),
enabling insertional activation of cellular genes in all three possible reading frames. After infection,
each pool was plated at low density in 1 μM RA containing medium. As a control, uninfected parental
SK-N-SH cells were plated in 1 μM RA containing medium. The cells were selected for 3 weeks to
allow RA resistant colonies to form (Figure S1A).
Uninfected control cells ceased to proliferate and differentiated into cells with a neuronal morphology.
Of the three pools, RA-resistant colonies formed only in the SD3-infected pool. Subsequently, the
viral integration sites were retrieved by inverse PCR. One of the RA resistant clones, SD3.23, had a
viral integration site in the Mastermind-like 3 (MAML3) gene locus between exon 1 and 2 (Figure
S1B). This potentially leads to an overexpressed transcript that lacks exon 1 (which encodes the first
156 amino acids of the MAML3 protein). To test this, we performed qPCR-using primer set 1 with
sequences in exon 1 and primer set 2 with sequences in exon 2 of MAML3, to compare MAML3
expression between parental SK-N-SH and SD3.23 cells. With primer set 1, SD3.23 had reduced
expression of MAML3, consistent with inactivation of one allele of the gene by viral insertion.
However, MAML3 was found to be 9-fold upregulated in SD3.23 cells using primer set 2, consistent
with increased expression of a truncated protein lacking exon 1 (Figure 1A). We also measured
MAML3 protein using western blotting with MAML3 antibodies. In SD3.23, a faster migrating band
at 120 kDa was present just below the full-length MAML3. This is in line with our prediction of an
overexpressed truncated MAML3 protein in the SD3.23 clone, lacking the first 156 of the 1133 (full-
length MAML3) amino acids (Figure 1B).
on June 4, 2018. © 2016 American Association for Cancer Research. mcr.aacrjournals.org Downloaded from
Author manuscripts have been peer reviewed and accepted for publication but have not yet been edited. Author Manuscript Published OnlineFirst on January 19, 2016; DOI: 10.1158/1541-7786.MCR-15-0291-T
10
The RA resistant phenotype of SD3.23 was confirmed by growing the cells in the presence and
absence of RA in a long-term colony formation assay. SD3.23 cells conferred potent resistance to RA
compared to the parental SK-N-SH cells (Figure 1C). We also investigated whether MAML3
overexpression confers a more general drug resistant phenotype. To this end, we treated SK-N-SH
parental and SD3.23 cells with cisplatin. Figure S1C shows that both cell lines are equally sensitive to
this cytotoxic agent, indicating that MAML3 overexpression does not lead to a general drug resistance
of SK-N-SH cells. To evaluate the RA resistant phenotype of SD3.23 cells quantitatively, we
measured plate confluency in real time using an IncuCyte device. Parental SK-N-SH cells ceased to
proliferate in 1 μM RA, whereas SD3.23 cells proliferated significantly faster than parental cells,
which was virtually unaffected by RA treatment (Figure 1D). The SK-N-SH cell line consists of two
morphologically distinct cell types, ‘N’ (Neuroblastic) and ‘S’ (Substrate adherent)-type. An ‘I’
(Intermediate) type also exists, which shares characteristics of both N and S groups (26). To evaluate
the subtype characteristics of SD3.23, we determined the expression of Vimentin and β-III Tubulin in
SK-N-SH and SD3.23 cells by immunofluorescence. SD3.23 is I-type since they express high levels of
Vimentin (marker of S type) and Tyrosine Hydroxylase and Dopamine β hydroxylase, markers of N
type (Figure S1D and data not shown).
To further prove that the RA resistance phenotype of SD3.23 is due to MAML3 overexpression, we
used an shRNA vector targeting MAML3 to suppress the elevated levels of MAML3 in SD3.23 cells.
Knockdown of MAML3 resensitized SD3.23 cells to RA (Figure 1E, F). Additionally, SD3.23 cells
with MAML3 knockdown displayed a characteristic neurite outgrowth phenotype in the presence of
RA, suggesting that these cells underwent differentiation. However, neurite outgrowth was clearly
absent in the cells with control knockdown vector (Figure S2A).
RA-induced neuroblastoma cells differentiation is accompanied by the induction of proteins expressed
in neuronal cells. To assess if MAML3-mediated RA resistance blocks the induction of such proteins,
we evaluated the expression after RA treatment of two bona fide neuronal proteins as markers of
neuronal differentiation, SNAP25 and GAP43 (27, 28). Basal levels of GAP43 and SNAP25 are
higher in SD3.23-MAML3 knockdown cells compared to control SD3.23 cells and increased slightly
on June 4, 2018. © 2016 American Association for Cancer Research. mcr.aacrjournals.org Downloaded from
Author manuscripts have been peer reviewed and accepted for publication but have not yet been edited. Author Manuscript Published OnlineFirst on January 19, 2016; DOI: 10.1158/1541-7786.MCR-15-0291-T

11
after RA treatment (Figure S2B). In contrast, the levels of these two proteins remained low in
SD3.23-pLKO control cells, suggesting an undifferentiated state. Taken together, these experiments
further support that the RA resistant phenotype of SD3.23 cells is indeed due to overexpressed
MAML3.
Overexpression of MAML3 confers resistance to RA in multiple neuroblastoma cell lines
To validate the effect of MAML3 expression, we PCR amplified a partial MAML3 cDNA that lacked
exon 1 and cloned it into the pBabepuro vector (pBp-MAML3-ΔE1). Overexpression of MAML3-ΔE1
after retroviral infection and puromycin selection of SK-N-SH cells conferred resistance to RA
similarly to SD3.23 (Figure 2A). Western blot of the MAML3-ΔE1 lysate confirmed overexpression
(Figure 2D). More importantly, V5 epitope-tagged full length MAML3-expressed using the lentiviral
vector pLX-also conferred resistance to RA (Figure 2B), overexpression shown by western blot in
Figure 2E). SH-SY5Y cells, a derivative of SK-N-SH, also became resistant to RA treatment when
infected with pLX-MAML3 (Figure 2C), overexpression shown by western blot in Figure 2F).
Overexpression of MAML3 also conferred resistance to RA in two additional neuroblastoma cell
lines: N206 and SK-N-BE cells (Figure 2G and 2H, quantification of the colony formation in Figure
S2G and S2H). It is noteworthy that N206 and SK-N-BE are MYCN amplified neuroblastoma cell
lines (in contrast to SK-N-SH and SH-SY5Y), indicating that overexpression of MAML3 can confer
resistance to RA in neuroblastoma cells irrespective of MYCN amplification status.
MAML1 and MAML2 also belong to the Mastermind-like family of coactivators. These two proteins
are structurally and functionally related to MAML3 (29, 30). However, MAML1 and MAML2
expression in SK-N-SH and SH-SY5Y cells did not mediate resistance to RA (Figures S2C and S2E,
overexpression shown by western blot in Figure S2D and S2F. In summary, these data indicate that
full-length MAML3 is able to confer resistance to RA in neuroblastoma cells by conferring a
proliferation advantage to these cells, whereas the related MAML1 and MAML2 proteins do not
mediate RA resistance.
on June 4, 2018. © 2016 American Association for Cancer Research. mcr.aacrjournals.org Downloaded from
Author manuscripts have been peer reviewed and accepted for publication but have not yet been edited. Author Manuscript Published OnlineFirst on January 19, 2016; DOI: 10.1158/1541-7786.MCR-15-0291-T
12
MAML3 overexpressing cells do not experience a cell cycle block or differentiation after RA
treatment
We performed cell cycle analysis in parental SK-N-SH and SD3.23 cells by EdU incorporation
followed by Fluorescence activated cell sorting (FACS) analysis to investigate the differences in cell
cycle progression. A clear block in G1 phase occurred in the parental SK-N-SH cells after 72 hours of
RA treatment, but not in SD3.23 cells (Figure 3A and 3B). Further, we assessed the induction of the
neuronal markers GAP43 and SNAP25 after RA treatment. As expected, SK-N-SH parental cells
treated with RA showed induction of these proteins. However, in SD3.23 cells there was negligible
induction of these genes. Additionally, the basal expression of these markers is lower in MAML3
overexpressing cells (Figure 3D). Similar results were seen with full-length MAML3 expression
(Figure S3). These results imply that MAML3 overexpression leads to an abrogation of RA-induced
cell cycle arrest and also lack of differentiation.
MAML3 overexpression leads to loss of activation of a subset of RA target genes
Since MAML3 is a known transcriptional regulator, we asked whether MAML3 binds the RAR/RXR
complex. Co-immunoprecipitation experiments in SK-N-SH cells suggested that MAML3 binds to
RXR, but not to RARα (Figure S4 and data not shown). This interaction indicates that MAML3 could
play a role in the regulation of the RA signaling pathway. Next, we performed chromatin
immunoprecipitation followed by sequencing (ChIP-seq) using MAML3 and RARα antibodies in SK-
N-SH cells to determine chromatin binding regions of these proteins in a genome-wide context, both
in absence and presence of RA. We identified 6902 and 8816 binding regions of MAML3 in the
absence and presence of RA, respectively. We also identified 1346 and 1537 RARα bound regions in
the absence and presence of RA, respectively. MAML3 and RARα binding sites strongly overlapped,
irrespective of RA treatment (Figure 4A). MAML3 has more binding sites throughout the genome as
compared to RARαindicating additional roles for MAML3 apart from RA signaling. For both
MAML3 and RARα, the number of binding regions increases slightly following RA treatment. Most
MAML3 binding sites are found either in gene introns or in the distal intergenic regions, suggesting
that MAML3 may be enhancer-bound in these cells. To investigate whether MAML3 binding sites
on June 4, 2018. © 2016 American Association for Cancer Research. mcr.aacrjournals.org Downloaded from
Author manuscripts have been peer reviewed and accepted for publication but have not yet been edited. Author Manuscript Published OnlineFirst on January 19, 2016; DOI: 10.1158/1541-7786.MCR-15-0291-T

13
overlap with known marks of enhancers, we used publicly available ChIP-seq data of H3K4me1 and
p300 in SK-N-SH cells and H3K27ac ChIP-seq data from the closely related SH-SY5Y cell line
(Table S5). MAML3 binding regions are enriched for active enhancer marks such as H3K27ac and
H3K4me1. Chromatin binding patterns of p300, another mark of active enhancers, also showed strong
overlap with MAML3 binding, suggesting that MAML3 could be part of an activation complex
assembled on enhancers (Figure 4B).
To gain a better understanding of the transcriptional changes that take place upon MAML3
overexpression, we performed RNA sequencing analysis of SK-N-SH parental cells versus SD3.23
cells, in the absence and presence of RA. A heat map was generated representing hierarchical
clustering of the most differentially expressed genes (Figure 4C). In the absence of RA, MAML3
overexpression led to increased expression of 502 genes (log2FC > 1.5 and adjusted p-value < 0.05),
while 326 genes were downregulated (log2FC < -1.5 and adjusted p -value< 0.05). Using the same
criteria, MAML3 overexpression led to increased expression of 582 genes and downregulation of 369
genes in the presence of RA (Table S1).
One way cells can become resistant to RA-induced differentiation is by loss of RA target gene
expression (20, 21). To determine if ectopic MAML3 expression leads to loss of RA responsive gene
expression, we integrated our ChIP-seq and transcriptome data. First, we defined RA target genes
using two criteria: (1) Having a RARα binding site within 20 kb upstream of the transcription start site
or within the gene body (N=819). (2) Log-fold change in expression above 1.5 (with an adjusted p <
0.05) after RA treatment (N=216). Applying these criteria yielded a list of 53 genes (p < 10-18), among
which are a number of well-established RA target genes, including RARβ, CYP26A1, RBP1 and
CRABP2 (Table S2). Of these 53 genes, 24 had a loss of RA responsiveness in the cells
overexpressing MAML3 (log2FC below 1) (Figure 4D and Table S3). Strikingly, 21 out of 24 of
these genes also had a proximal MAML3 binding site, found within 20 kb of the transcription start site
or in the gene body (Table S3). This suggests that MAML3 overexpression interferes with activation
of a subset of RA target genes upon RA treatment, disrupting RA signaling and resulting in RA
resistance.
on June 4, 2018. © 2016 American Association for Cancer Research. mcr.aacrjournals.org Downloaded from
Author manuscripts have been peer reviewed and accepted for publication but have not yet been edited. Author Manuscript Published OnlineFirst on January 19, 2016; DOI: 10.1158/1541-7786.MCR-15-0291-T

14
Further analysis of the ChIP-seq and transcriptome data indicated that 311 genes had proximal
MAML3 binding sites and a log-fold change of at least 1.5 in expression upon MAML3
overexpression (Figure 4E). Because of the proximal MAML3 binding sites, these genes are
potentially under direct control of MAML3. Of these genes, 80 were RA-responsive (i.e. log2FC > 1.5
upon RA treatment) and 231 were RA-unresponsive. This latter finding implies that MAML3 controls
additional processes apart from retinoic acid signaling, in line with the previously-mentioned MAML3
unique binding sites that are devoid of RARα (Figure 4A).
Taken together, we show that MAML3 and RARα largely overlap in their genomic binding regions
and that MAML3 interacts with RXR. MAML3 overexpression leads to transcriptional changes and
loss of activation of a subset of RA target genes. This is accompanied with a block in the induction of
neuronal differentiation marker proteins upon RA treatment.
Ectopic MAML3 expression activates IGF1R signaling via upregulation of IGF2
In addition to resistance to RA, we noticed that cells that overexpress MAML3 also had an increased
proliferation rate in the untreated condition (Figure 1D). To identify signaling pathways that could
contribute to this hyper proliferative phenotype, we made use of receptor tyrosine kinase (RTK)
antibody arrays, which allows a global survey of activated RTKs in a cell lysate. We subjected the
total cell lysates of SK-N-SH parental and SD3.23 cells treated with and without RA to RTK array
analysis. Interestingly, we found that SD3.23 cells had a marked increase in phosphorylated
(activated) Insulin-like Growth Factor 1 Receptor (IGF1R) and to a much lesser extent of Insulin
Receptor (INSR) (Figure 5A). To validate this, the lysates used on the RTK arrays were also
subjected to western blot analysis to measure IGF1R phosphorylation. We found that both IGF1R and
its downstream kinase AKT were significantly activated as judged by their phosphorylation on the
activating sites (Figure 5B). Strikingly, one of the genes that showed the highest differential
expression in MAML3 overexpressing cells versus parental cells was the IGF1R ligand IGF2 (Figure
4C). This was independently validated by qRT-PCR (Figure 5C). IGF2 was also highly upregulated
in SK-N-SH and SH-SY5Y cells overexpressing full-length MAML3 (Figure S5A), which was
accompanied by phosphorylation of IGF1R and pAKT in these cells (Figure S5B).
on June 4, 2018. © 2016 American Association for Cancer Research. mcr.aacrjournals.org Downloaded from
Author manuscripts have been peer reviewed and accepted for publication but have not yet been edited. Author Manuscript Published OnlineFirst on January 19, 2016; DOI: 10.1158/1541-7786.MCR-15-0291-T

15
If activation of IGF1R signaling by IGF2 is causally involved in the hyper proliferative phenotype,
knockdown of IGF2 should impact proliferation of MAML3 overexpressing cells. To test this, we
infected SD3.23 cells with three lentiviral shRNA vectors targeting the IGF2 gene. Two out of three
hairpins (sh1 and sh4) gave good knockdown of IGF2 expression, whereas one hairpin (sh3) did not
give any knockdown (Figure 5E). Indeed, IGF2 knockdown in SD3.23 cells reduced proliferation
approximately to the rate of SK-N-SH parental cells infected with empty vector. IGF2 shRNA3, which
did not knockdown IGF2, also did not affect proliferation (Figure 5D). Total cell lysates from empty
vector and IGF2 knockdown cells were subjected to biochemical analysis. Phosphorylation of IGF1R
and AKT dramatically decreased upon knockdown of IGF2, confirming that IGF2 is the factor that
activates IGF1R signaling in MAML3 overexpressing cells (Figure 5F).
We asked if IGF2 alone could mediate resistance to RA. Addition of up to 400ng/ml recombinant
IGF2 to the growth medium of parental SK-N-SH cells did not confer resistance to RA, even though
cells clearly have a proliferation advantage (Figure 5G). Western blot analysis of the lysates showed
increase in both pIGF1R and pAKT (Figure 5H). Of note, RA by itself activates AKT signaling. Qiao
et al. found that RA induces PI3K/AKT signaling leading to cellular differentiation (31). However, we
show that in the absence of RA, AKT activation by IGF2 leads to increased proliferation. We
hypothesize that upon MAML3 overexpression, upregulation of AKT signaling by IGF2 also gives
these cells a proliferation advantage in the presence of RA due to the differentiation block in these
cells. A similar observation was made in SH-SY5Y cells (Figure S5C and S5D). These results show
that IGF2 activates IGF1R and AKT signaling in MAML3 overexpressing cells, which results in hyper
proliferation. However, IGF2 alone cannot mediate resistance to RA.
Pharmacological inhibition of IGF1R synergizes with RA in SK-N-SH and MAML3
overexpressing cells
IGF2 and concomitant IGF1R signaling is important for cancer growth and has been implicated in a
variety of cancers, including neuroblastoma (32, 33). To translate our findings of IGF2-induced
IGF1R signaling in MAML3 overexpressing cells to a clinically useful strategy to inhibit proliferation
of these cells, we made use of a small molecule inhibitor of IGF1R/INSR, OSI-906. First, we
on June 4, 2018. © 2016 American Association for Cancer Research. mcr.aacrjournals.org Downloaded from
Author manuscripts have been peer reviewed and accepted for publication but have not yet been edited. Author Manuscript Published OnlineFirst on January 19, 2016; DOI: 10.1158/1541-7786.MCR-15-0291-T

16
determined IC50 values for RA and OSI-906 in both SK-N-SH parental and SD3.23 cells (Figures
S6A and S6B). It is noteworthy that the IC50 for RA in MAML3 overexpressing cells was 10 fold
higher than the parental SK-N-SH cells (~1µM in SK-N-SH cells and >10 µM in SD3.23 cells). On
the other hand the IC50 for OSI-906 in MAML3 overexpressing cells was 4 fold lower than SK-N-SH
cells (~0.4µM in SK-N-SH cells and ~0.1µM in SD3.23 cells).
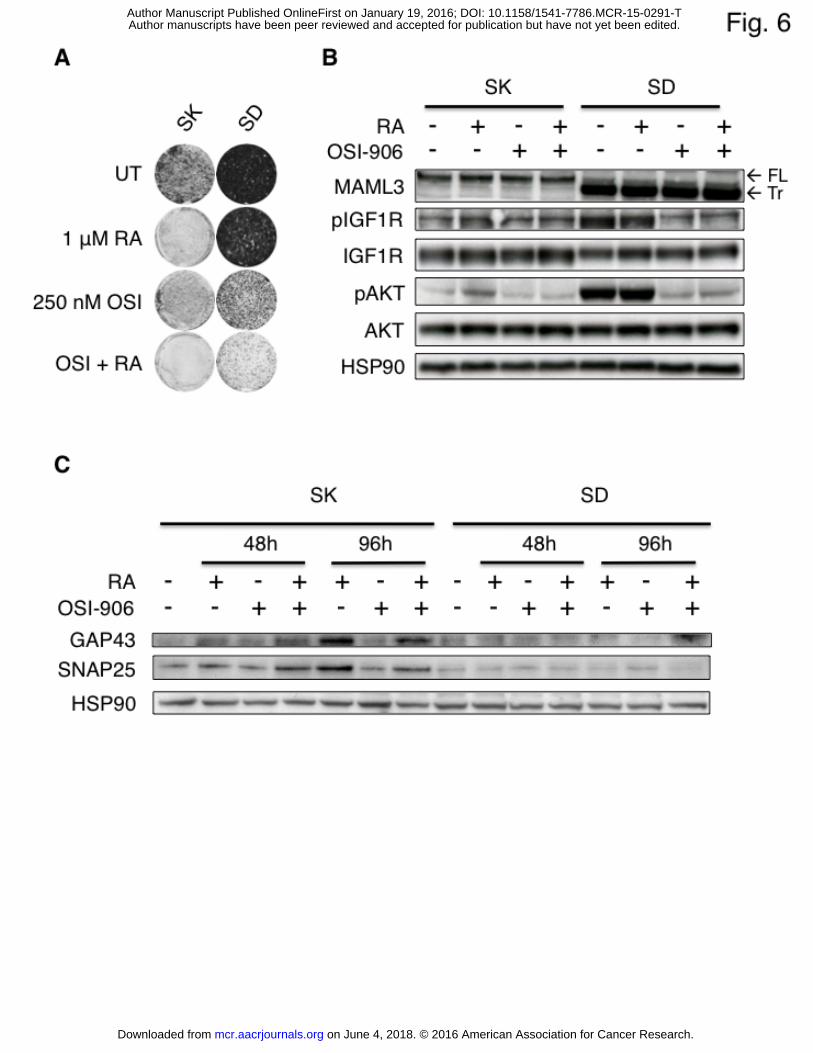
Subsequently, we evaluated the effects of IGF1R/INSR inhibition in colony formation assays. Single
drug treatment of OSI-906 had modest effect in SK-N-SH parental cells but had strong effect on
proliferation of MAML3 overexpressing cells. However, single drug treatment of RA had strong effect
on SK-N-SH cells and no effect on MAML3 overexpressing cells. Dual inhibition by RA and OSI-906
was synergistic in both SK-N-SH and SD3.23 cells (Figure 6A). To determine the level of synergy,
we calculated the combination indices. Combined treatment of OSI-906 and RA resulted in a
combination index of 0.52 (synergistic) for MAML3 overexpressing SD3.23 cells and 0.19 (highly
synergistic) for SK-N-SH parental cells (Figure S6C and S6D). Both these indices represent synergy
between the two drugs(34). Interestingly, the parental cells showed stronger synergy for these two
drugs. One reason for this is that in SK-N-SH cells, RA can induce pAKT just prior to differentiation,
most likely through IGF1R activation. OSI-906 can reverse this activation of pAKT by RA (Figure
6B).
Western blotting with lysates of OSI-906 and RA treated cells revealed that both phosphorylation of
IGF1R and AKT were nearly completely inhibited (Figure. 6B), providing a biochemical explanation
for the phenotype. However, combination treatment did not lead to a differentiated phenotype as
judged by the induction of the neuronal markers SNAP25 and GAP43, indicating that the effect of
OSI-906 was mainly on proliferation and not on differentiation (Figure 6C).
on June 4, 2018. © 2016 American Association for Cancer Research. mcr.aacrjournals.org Downloaded from
Author manuscripts have been peer reviewed and accepted for publication but have not yet been edited. Author Manuscript Published OnlineFirst on January 19, 2016; DOI: 10.1158/1541-7786.MCR-15-0291-T

17
Discussion
Using a gain-of-function genetic screen, we identify here MAML3 as a novel gene whose ectopic
expression confers resistance to RA-induced differentiation in neuroblastoma. MAML3 is a known
transcriptional coactivator of Notch signaling along with its related family members, MAML1 and
MAML2 (29, 30). MAML proteins act as scaffolding proteins and assemble the coactivation complex
on NOTCH target genes. It is therefore not surprising that this attribute of MAML proteins can be
turned into potent fusion oncoproteins in cancer. MAML3 forms a fusion protein with PAX3 in
biphenotypic sinonasal sarcoma. This PAX3-MAML3 fusion protein is a potent transcriptional
activator of PAX3 response elements (35). MAML2 is well-documented to form a fusion protein with
CRTC1 following a t(11;19) translocation, aberrantly activating cAMP/CREB signaling (36-38). This
translocation has been recurrently found in salivary gland tumors, mucoepidermoid carcinoma,
Warthin’s tumor and clear cell hidradenoma of the skin. In AML and MDS patients, MLL-MAML2
fusions have been described (39). This fusion disrupts NOTCH signaling and that possibly contributes
to carcinogenesis in these malignancies. MAML1 has been found to be a co-activator for p53 mediated
transcription (40) as well as for MEF2C mediated transcription in muscle differentiation (41). In
addition, MAML1 is known to modulate NF-κB signaling (42) and was shown to have a role in bone
development by enhancing RUNX2 mediated transcription (43).
In this study, we provide evidence that MAML3 mediates resistance to RA and promotes hyper
proliferation in neuroblastoma. We demonstrate that MAML3 expression, but not MAML1 or
MAML2, can block the response to RA in neuroblastoma, indicating that MAML3 has a unique role in
this disease. MAML3 overexpression interfered with two important consequences of RA treatment
namely, cell cycle arrest and differentiation. RA restricts the cells from entering the S phase, which
was not seen in MAML3-expressing cells (Figure 3A & 3B). Additionally, MAML3 expression
resulted in a failure to induce the neuronal markers GAP43 and SNAP25 after RA treatment (Figure
3D).
We observed that MAML3 overexpression results in loss of activation of a subset of RA target genes,
including a number of bona fide RA target genes, such as TGM2, HOXD4 and NTRK2 (Figure 4D).
on June 4, 2018. © 2016 American Association for Cancer Research. mcr.aacrjournals.org Downloaded from
Author manuscripts have been peer reviewed and accepted for publication but have not yet been edited. Author Manuscript Published OnlineFirst on January 19, 2016; DOI: 10.1158/1541-7786.MCR-15-0291-T
18
Other studies have shown that loss of activation of RA target genes blocks RA induced differentiation
(20, 21). It is therefore likely that the loss of activation of a subset of RA target genes contributes to
RA resistance in MAML3 overexpressing cells. ChIP-seq analyses of MAML3 and RARα revealed
that over 80% of endogenous RARα binding regions overlap with endogenous MAML3 binding
regions, suggesting the involvement of MAML3 in co-regulating these genes (Figure 4A). We also
demonstrate that MAML3 physically binds RXR, further reinforcing the notion of a role for MAML3
in RA signaling (Figure S4A). Although MAML3 is known as a transcriptional coactivator, we
hypothesize that overexpression of MAML3 interferes with proper transcriptional activation of a
subset of RA target genes upon RA treatment, leading to loss of activation of these genes.
In addition, we found that MAML3 overexpression upregulates IGF2 transcription, leading to
activation of IGF1R and downstream AKT signaling (Figure 5A and 5B). The IGF1R pathway drives
increased proliferation of MAML3 overexpressing cells. However, activation of IGF1R signaling
alone does not lead to resistance to RA (Figure 5G and S5C), indicating that MAML3 controls
response to RA and proliferation via distinct mechanisms and pointing at the importance of MAML3
in neuroblastoma oncogenesis. We show that knockdown of IGF2 as well as administration of the
small molecule inhibitor OSI-906, which targets IGF1R and INSR, inhibits proliferation of MAML3
expressing neuroblastoma cells (Figure 5D, 6A). When OSI-906 is combined with RA, we observed a
modest synergy in inhibition of cell proliferation (Figure S6D). It is noteworthy that the parental cells
showed stronger synergy for these two drugs. We consistently observed an increase in pAKT soon
after RA treatment. OSI-906 reversed pAKT activation, suggesting that this signal could be in fact
coming from IGF1R-INSR receptors and providing a potential explanation for the synergy between
the two drugs. This combination treatment could therefore be a potential clinical strategy in MAML3
mutated as well as MAML3 wild type neuroblastomas.
Interestingly, MAML3 mutations have been found in neuroblastoma patients. Molenaar et al.
performed whole-genome sequencing on 87 neuroblastoma patient samples and found MAML3 gene
mutations in two samples (44). Although we yet do not know the impact on neuroblastoma cells of
these MAML3 mutations, they indicate that the MAML3 gene is affected in neuroblastoma and this
merits future study. In the online The Cancer Genome Atlas (TCGA) collection of tumor data,
on June 4, 2018. © 2016 American Association for Cancer Research. mcr.aacrjournals.org Downloaded from
Author manuscripts have been peer reviewed and accepted for publication but have not yet been edited. Author Manuscript Published OnlineFirst on January 19, 2016; DOI: 10.1158/1541-7786.MCR-15-0291-T

19
MAML3 is a gene that is mutated in 19 out of 90 cases (21%) in a cohort of pancreatic cancer patients
and it is also mutated and/or amplified at a lower frequency in a range of other cancers. The relevance
of these aberrations of MAML3 in these cancers remains to be elucidated, but it could point towards a
role of MAML3 in malignancies beyond neuroblastoma, which would be in line with the marked
increase in proliferation rate we observe here for cells that over-express MAML3. In summary, our
work links MAML3 functionally to differentiation and proliferation, which may explain why this gene
is mutated in cancer.
Acknowledgments
We thank the George Stark laboratory for providing us with the plasmids and protocols of the VBIM
system. We thank NKI genomics core facility for support. We thank Rogier Versteeg for useful
discussions and for providing us with the SK-N-BE cell line. This work was supported by a grant from
the Dutch Cancer Society (KWF) and the cancer genomics Netherlands consortium (CGC.NL).
on June 4, 2018. © 2016 American Association for Cancer Research. mcr.aacrjournals.org Downloaded from
Author manuscripts have been peer reviewed and accepted for publication but have not yet been edited. Author Manuscript Published OnlineFirst on January 19, 2016; DOI: 10.1158/1541-7786.MCR-15-0291-T
20
References 1. Maris JM, Hogarty MD, Bagatell R, Cohn SL. Neuroblastoma. Lancet. 2007;369:2106-20.
2. Seeger RC, Brodeur GM, Sather H, Dalton A, Siegel SE, Wong KY, et al. Association of
multiple copies of the N-myc oncogene with rapid progression of neuroblastomas. The New England
journal of medicine. 1985;313:1111-6.
3. Janoueix-Lerosey I, Lequin D, Brugieres L, Ribeiro A, de Pontual L, Combaret V, et al.
Somatic and germline activating mutations of the ALK kinase receptor in neuroblastoma. Nature.
2008;455:967-70.
4. Mosse YP, Laudenslager M, Longo L, Cole KA, Wood A, Attiyeh EF, et al. Identification of
ALK as a major familial neuroblastoma predisposition gene. Nature. 2008;455:930-5.
5. Attiyeh EF, London WB, Mosse YP, Wang Q, Winter C, Khazi D, et al. Chromosome 1p and
11q deletions and outcome in neuroblastoma. The New England journal of medicine. 2005;353:2243-
53.
6. Caron H, van Sluis P, de Kraker J, Bokkerink J, Egeler M, Laureys G, et al. Allelic loss of
chromosome 1p as a predictor of unfavorable outcome in patients with neuroblastoma. The New
England journal of medicine. 1996;334:225-30.
7. Maden M. Retinoic acid in the development, regeneration and maintenance of the nervous
system. Nat Rev Neurosci. 2007;8:755-65.
8. Rastinejad F, Wagner T, Zhao Q, Khorasanizadeh S. Structure of the RXR-RAR DNA-
binding complex on the retinoic acid response element DR1. EMBO J. 2000;19:1045-54.
9. Chen JD, Evans RM. A transcriptional co-repressor that interacts with nuclear hormone
receptors. Nature. 1995;377:454-7.
10. Horlein AJ, Naar AM, Heinzel T, Torchia J, Gloss B, Kurokawa R, et al. Ligand-independent
repression by the thyroid hormone receptor mediated by a nuclear receptor co-repressor. Nature.
1995;377:397-404.
11. Fernandes I, Bastien Y, Wai T, Nygard K, Lin R, Cormier O, et al. Ligand-dependent nuclear
receptor corepressor LCoR functions by histone deacetylase-dependent and -independent mechanisms.
Molecular cell. 2003;11:139-50.
12. Rochette-Egly C, Germain P. Dynamic and combinatorial control of gene expression by
nuclear retinoic acid receptors (RARs). Nuclear receptor signaling. 2009;7:e005.
13. Bajpe PK, Heynen GJ, Mittempergher L, Grernrum W, de Rink IA, Nijkamp W, et al. The
corepressor CTBP2 is a coactivator of retinoic acid receptor/retinoid X receptor in retinoic acid
signaling. Molecular and cellular biology. 2013;33:3343-53.
14. Sidell N, Altman A, Haussler MR, Seeger RC. Effects of retinoic acid (RA) on the growth and
phenotypic expression of several human neuroblastoma cell lines. Experimental cell research.
1983;148:21-30.
on June 4, 2018. © 2016 American Association for Cancer Research. mcr.aacrjournals.org Downloaded from
Author manuscripts have been peer reviewed and accepted for publication but have not yet been edited. Author Manuscript Published OnlineFirst on January 19, 2016; DOI: 10.1158/1541-7786.MCR-15-0291-T

21
15. Mueller S, Matthay KK. Neuroblastoma: biology and staging. Current oncology reports.
2009;11:431-8.
16. Matthay KK, Villablanca JG, Seeger RC, Stram DO, Harris RE, Ramsay NK, et al. Treatment
of high-risk neuroblastoma with intensive chemotherapy, radiotherapy, autologous bone marrow
transplantation, and 13-cis-retinoic acid. Children's Cancer Group. The New England journal of
medicine. 1999;341:1165-73.
17. Cote S, Zhou D, Bianchini A, Nervi C, Gallagher RE, Miller WH, Jr. Altered ligand binding
and transcriptional regulation by mutations in the PML/RARalpha ligand-binding domain arising in
retinoic acid-resistant patients with acute promyelocytic leukemia. Blood. 2000;96:3200-8.
18. Hoffman AD, Engelstein D, Bogenrieder T, Papandreou CN, Steckelman E, Dave A, et al.
Expression of retinoic acid receptor beta in human renal cell carcinomas correlates with sensitivity to
the antiproliferative effects of 13-cis-retinoic acid. Clin Cancer Res. 1996;2:1077-82.
19. Ren M, Pozzi S, Bistulfi G, Somenzi G, Rossetti S, Sacchi N. Impaired retinoic acid (RA)
signal leads to RARbeta2 epigenetic silencing and RA resistance. Molecular and cellular biology.
2005;25:10591-603.
20. Huang S, Laoukili J, Epping MT, Koster J, Holzel M, Westerman BA, et al. ZNF423 is
critically required for retinoic acid-induced differentiation and is a marker of neuroblastoma outcome.
Cancer cell. 2009;15:328-40.
21. Holzel M, Huang S, Koster J, Ora I, Lakeman A, Caron H, et al. NF1 is a tumor suppressor in
neuroblastoma that determines retinoic acid response and disease outcome. Cell. 2010;142:218-29.
22. Lu T, Jackson MW, Singhi AD, Kandel ES, Yang M, Zhang Y, et al. Validation-based
insertional mutagenesis identifies lysine demethylase FBXL11 as a negative regulator of NFkappaB.
Proceedings of the National Academy of Sciences of the United States of America. 2009;106:16339-
44.
23. Huang S, Holzel M, Knijnenburg T, Schlicker A, Roepman P, McDermott U, et al. MED12
controls the response to multiple cancer drugs through regulation of TGF-beta receptor signaling. Cell.
2012;151:937-50.
24. Ritchie ME, Phipson B, Wu D, Hu Y, Law CW, Shi W, et al. limma powers differential
expression analyses for RNA-sequencing and microarray studies. Nucleic Acids Res. 2015;43:e47.
25. Zwart W, Theodorou V, Kok M, Canisius S, Linn S, Carroll JS. Oestrogen receptor-co-factor-
chromatin specificity in the transcriptional regulation of breast cancer. The EMBO journal.
2011;30:4764-76.
26. Ciccarone V, Spengler BA, Meyers MB, Biedler JL, Ross RA. Phenotypic diversification in
human neuroblastoma cells: expression of distinct neural crest lineages. Cancer Res. 1989;49:219-25.
27. Oyler GA, Higgins GA, Hart RA, Battenberg E, Billingsley M, Bloom FE, et al. The
identification of a novel synaptosomal-associated protein, SNAP-25, differentially expressed by
neuronal subpopulations. J Cell Biol. 1989;109:3039-52.
on June 4, 2018. © 2016 American Association for Cancer Research. mcr.aacrjournals.org Downloaded from
Author manuscripts have been peer reviewed and accepted for publication but have not yet been edited. Author Manuscript Published OnlineFirst on January 19, 2016; DOI: 10.1158/1541-7786.MCR-15-0291-T

22
28. Kanazir S, Ruzdijic S, Vukosavic S, Ivkovic S, Milosevic A, Zecevic N, et al. GAP-43 mRNA
expression in early development of human nervous system. Brain Res Mol Brain Res. 1996;38:145-55.
29. Wu L, Sun T, Kobayashi K, Gao P, Griffin JD. Identification of a family of mastermind-like
transcriptional coactivators for mammalian notch receptors. Mol Cell Biol. 2002;22:7688-700.
30. Lin SE, Oyama T, Nagase T, Harigaya K, Kitagawa M. Identification of new human
mastermind proteins defines a family that consists of positive regulators for notch signaling. J Biol
Chem. 2002;277:50612-20.
31. Qiao J, Paul P, Lee S, Qiao L, Josifi E, Tiao JR, et al. PI3K/AKT and ERK regulate retinoic
acid-induced neuroblastoma cellular differentiation. Biochemical and biophysical research
communications. 2012;424:421-6.
32. el-Badry OM. Insulin-like growth factor II gene expression in human neuroblastoma. Prog
Clin Biol Res. 1991;366:249-56.
33. Kim SY, Toretsky JA, Scher D, Helman LJ. The role of IGF-1R in pediatric malignancies.
Oncologist. 2009;14:83-91.
34. Irene V. Bijnsdorp EG, and Godefridus J. Peters. Analysis of Drug Interactions: Humana
Press; 2011.
35. Wang X, Bledsoe KL, Graham RP, Asmann YW, Viswanatha DS, Lewis JE, et al. Recurrent
PAX3-MAML3 fusion in biphenotypic sinonasal sarcoma. Nature genetics. 2014;46:666-8.
36. Coxon A, Rozenblum E, Park YS, Joshi N, Tsurutani J, Dennis PA, et al. Mect1-Maml2
fusion oncogene linked to the aberrant activation of cyclic AMP/CREB regulated genes. Cancer Res.
2005;65:7137-44.
37. Winnes M, Molne L, Suurkula M, Andren Y, Persson F, Enlund F, et al. Frequent fusion of
the CRTC1 and MAML2 genes in clear cell variants of cutaneous hidradenomas. Genes Chromosomes
Cancer. 2007;46:559-63.
38. Tirado Y, Williams MD, Hanna EY, Kaye FJ, Batsakis JG, El-Naggar AK. CRTC1/MAML2
fusion transcript in high grade mucoepidermoid carcinomas of salivary and thyroid glands and
Warthin's tumors: implications for histogenesis and biologic behavior. Genes, chromosomes & cancer.
2007;46:708-15.
39. Nemoto N, Suzukawa K, Shimizu S, Shinagawa A, Takei N, Taki T, et al. Identification of a
novel fusion gene MLL-MAML2 in secondary acute myelogenous leukemia and myelodysplastic
syndrome with inv(11)(q21q23). Genes, chromosomes & cancer. 2007;46:813-9.
40. Zhao Y, Katzman RB, Delmolino LM, Bhat I, Zhang Y, Gurumurthy CB, et al. The notch
regulator MAML1 interacts with p53 and functions as a coactivator. The Journal of biological
chemistry. 2007;282:11969-81.
41. Shen H, McElhinny AS, Cao Y, Gao P, Liu J, Bronson R, et al. The Notch coactivator,
MAML1, functions as a novel coactivator for MEF2C-mediated transcription and is required for
normal myogenesis. Genes & development. 2006;20:675-88.
on June 4, 2018. © 2016 American Association for Cancer Research. mcr.aacrjournals.org Downloaded from
Author manuscripts have been peer reviewed and accepted for publication but have not yet been edited. Author Manuscript Published OnlineFirst on January 19, 2016; DOI: 10.1158/1541-7786.MCR-15-0291-T

23
42. Jin B, Shen H, Lin S, Li JL, Chen Z, Griffin JD, et al. The mastermind-like 1 (MAML1) co-
activator regulates constitutive NF-kappaB signaling and cell survival. The Journal of biological
chemistry. 2010;285:14356-65.
43. Watanabe T, Oyama T, Asada M, Harada D, Ito Y, Inagawa M, et al. MAML1 enhances the
transcriptional activity of Runx2 and plays a role in bone development. PLoS Genet.
2013;9:e1003132.
44. Molenaar JJ, Koster J, Zwijnenburg DA, van Sluis P, Valentijn LJ, van der Ploeg I, et al.
Sequencing of neuroblastoma identifies chromothripsis and defects in neuritogenesis genes. Nature.
2012;483:589-93.
on June 4, 2018. © 2016 American Association for Cancer Research. mcr.aacrjournals.org Downloaded from
Author manuscripts have been peer reviewed and accepted for publication but have not yet been edited. Author Manuscript Published OnlineFirst on January 19, 2016; DOI: 10.1158/1541-7786.MCR-15-0291-T
24
Figure legends
Figure 1 - A genetic gain-of-function screen identifies MAML3 as a factor that confers resistance
to RA in SK-N-SH neuroblastoma cells.
A. Relative mRNA expression of MAML3 in SK-N-SH parental cells (SK) and SD3.23 cells
(SD). Exon1 and Exon 2 indicate complementary primer sets in exon 1 and exon 2 of
MAML3, respectively.
B. Western blot analysis of MAML3 protein levels in SK-N-SH parental cells and SD3.23 cells.
FL: full-length MAML3. Tr: truncated MAML3. HSP90 serves as loading control.
C. Long term colony formation assay in the presence of 1 μM RA. SD3.23 cells continued to
proliferate in the presence of RA whereas the parental SK-N-SH cells ceased to proliferate.
D. Quantitative IncuCyte measurements of confluency in time of SK-N-SH (SK) and SD3.23
(SD) cells untreated (UT) or treated with 1 μM RA (RA).
E. Knockdown of MAML3 resensitizes SD3.23 cells (SD-shM3) to 1 μM RA to a similar degree
as SK-N-SH parental cells (SK). Control SD3.23 cells infected with empty vector (SD-EV)
remain RA resistant.
F. Western blot analysis of MAML3 protein levels in SK-N-SH parental (SK), empty vector
infected SD3.23 (SD-EV) and MAML3 short hairpin infected (SD-shM3) cells. HSP90 serves
as loading control.
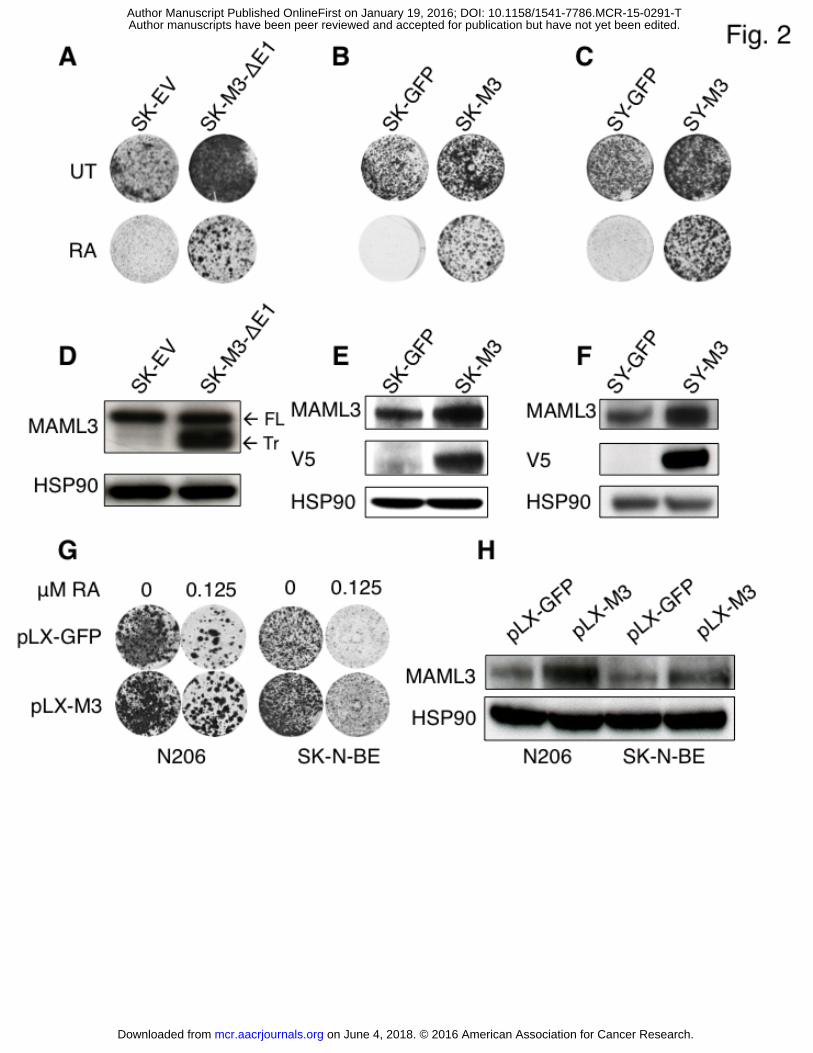
Figure 2 - Full-length MAML3 overexpression confers RA resistance in SK-N-SH cells.
A. Overexpression of truncated MAML3 (SK-M3-Δ1) in SK-N-SH cells confers resistance to 1
μM RA. SK-N-SH cells infected with empty vector (SK) are RA sensitive.
B. Overexpression of full-length MAML3 (SY-M3) in SY5Y cells confers resistance to 1 μM
RA. GFP control vector infected SK-N-SH cells (SK-GFP) are RA sensitive.
C. Overexpression of full-length MAML3 (SK-M3) in SH-SY5Y cells confers resistance to 1 μM
RA. GFP control vector infected SH-SY5Y cells (SY-GFP) are RA sensitive.
on June 4, 2018. © 2016 American Association for Cancer Research. mcr.aacrjournals.org Downloaded from
Author manuscripts have been peer reviewed and accepted for publication but have not yet been edited. Author Manuscript Published OnlineFirst on January 19, 2016; DOI: 10.1158/1541-7786.MCR-15-0291-T

25
D. Western blot analysis of MAML3 protein levels in empty vector infected SK-N-SH parental
cells (SK-EV) and truncated MAML3 overexpressing cells (SK-M3-Δ1). FL: full-length
MAML3. Tr: truncated MAML3. HSP90 serves as loading control.
E. Western blot analysis of MAML3 protein levels in GFP infected SK-N-SH cells and full
length MAML3 overexpressing cells (SK-M3). Western blots were also probed with V5
antibody to specifically detect the V5-tagged overexpressed MAML3.
F. Western blot analysis of MAML3 protein levels in GFP infected SH-SY5Y cells and full
length MAML3 overexpressing cells (SY-M3). Western blots were also probed with V5
antibody to specifically detect the V5-tagged overexpressed MAML3.
G. Long-term colony formation assay of N-MYC amplified N206 and SK-N-BE neuroblastoma
cells expressing GFP or MAML3 in the absence or presence of 125 nM RA. After culturing
for 2 weeks, the cells were fixed, stained with crystal violet and photographed.
H. Western blot analysis of lysates from N-MYC amplified N206 and SK-N-BE neuroblastoma
cells expressing GFP or MAML3 probed with MAML3. HSP90 served as loading control.
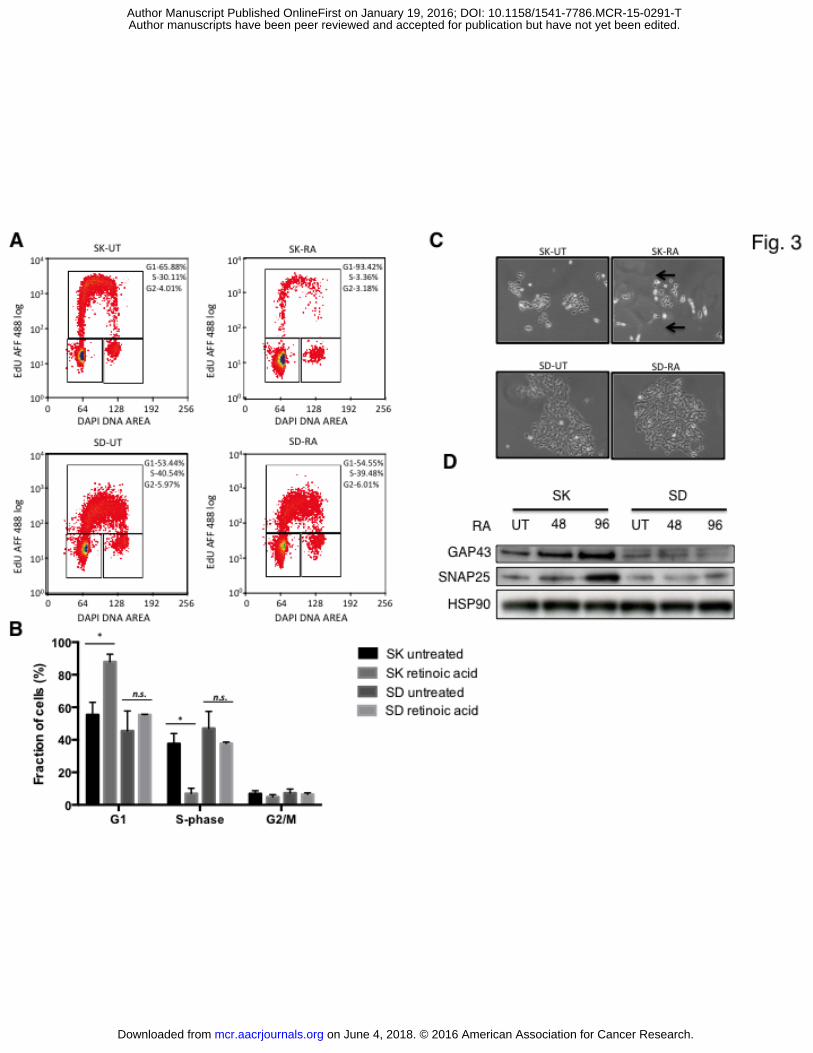
Figure 3 – Cell cycle analysis of MAML3 overexpressing cells.
A. SK-N-SH parental cells (SK) and MAML3 overexpressing SD3.23 cells (SD) were treated
with 1μM RA for 72 hours (SK-RA and SD-RA) and subsequently the cells were labeled with
10μM EdU. Labelled cells were analyzed by CyAn ADP (Beckman Coulter) using 488nm
excitation. Percentages of different cell cycle stages are indicated.
B. Bar plot representation of cell cycle distribution of SK-N-SH parental and MAML3
overexpressing SD3.23 cells treated with 1μM RA for 72 hours. P Values are indicated with
*P <0.05.
C. Phase contrast images of parental SK-N-SH and SD3.23 cells treated with 1μM RA for 72
hours. Untreated cells served as controls. Black arrows indicate the neurite extensions in SK-
N-SH cells in the presence of RA.
on June 4, 2018. © 2016 American Association for Cancer Research. mcr.aacrjournals.org Downloaded from
Author manuscripts have been peer reviewed and accepted for publication but have not yet been edited. Author Manuscript Published OnlineFirst on January 19, 2016; DOI: 10.1158/1541-7786.MCR-15-0291-T
26
D. Western blot showing neuronal differentiation markers GAP43 and SNAP25 in SK-N-SH
parental cells (SK) and SD3.23 cells (SD) in untreated condition and after 48 and 96 hours of
treatment with 1 μM RA. HSP90 serves as loading control.
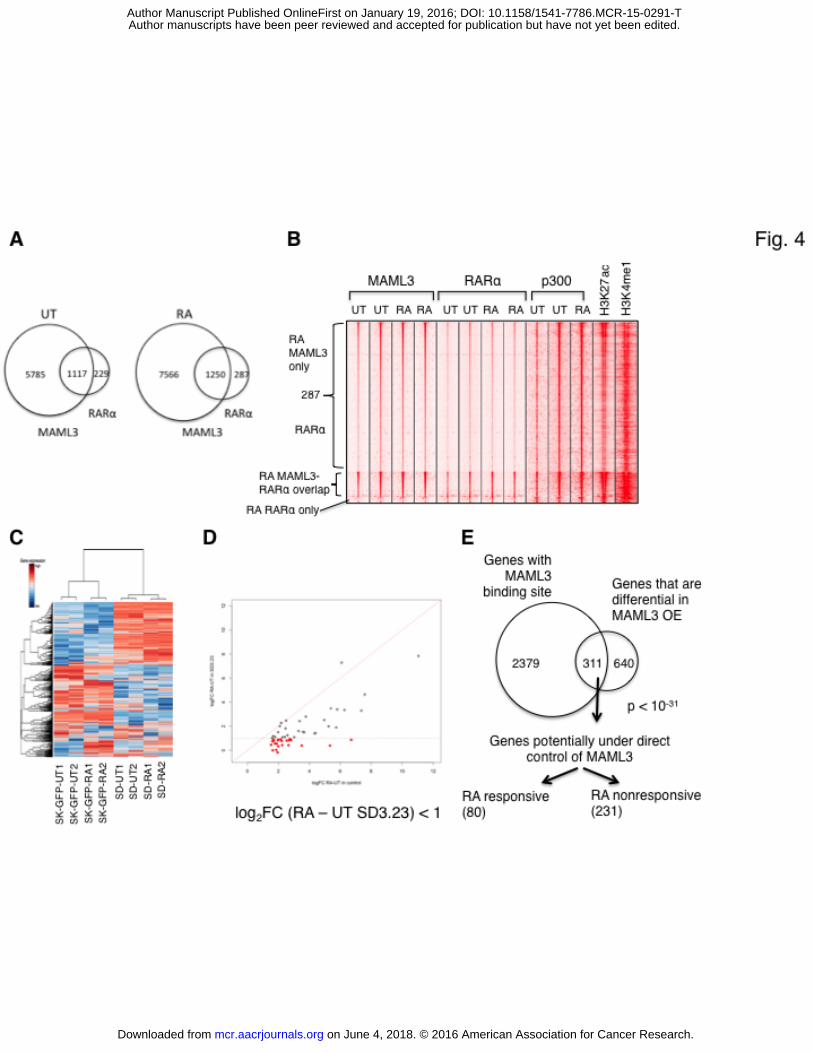
Figure 4. Effects of MAML3 on gene expression in relation to resistance to RA.
A. Venn diagram representing the number of MAML3 and RARα binding regions in the absence
or presence of RA.
B. Heat map representation of the MAML3, RARα, p300, H3K27ac and H3K4me1 ChIP-seq
data in a 5KB window centered around MAML3 peaks in the absence and presence of RA.
C. Heat map of the expression of the most variable genes in RNA-seq of SK-N-SH control (SK-
GFP) and SD3.23 (SD) cells, either untreated (UT) or treated with 1 μM RA (RA). For each
sample, two replicates were used.
D. Diagram showing customly defined RA target genes with loss of activation (indicated in red)
upon MAML3 overexpression. Genes that have no difference in expression upon MAML3
overexpression are colored in grey.
E. Venn diagram representing the genes that have MAML3 binding and the genes that are
differentially regulated upon MAML3 overexpression. The overlapping genes are further
separated for RA (un)responsiveness.
Figure 5 - Overexpression of MAML3 activates IGF1R and AKT signaling via upregulation of
IGF2, resulting in hyperproliferation.
A. Receptor tyrosine kinase array with cell lysates of SK-N-SH parental cells (SK) or SD3.23
cells (SD), either untreated (UT) or treated with 1 μM RA (RA). Boxed spots in duplicates are
IGF1R and INSR, which are both phosphorylated to a higher extent in SD3.23 cells.
B. Western blot showing the validation of the RTK array. Phosphorylated IGF1R is elevated in
SD3.23 cells (SD) compared to SK-N-SH parental cells (SK). Downstream phosphorylated
AKT is also significantly increased.
C. Relative mRNA levels of IGF2 in SK-N-SH control (SK) and SD3.23 (SD) cells.
on June 4, 2018. © 2016 American Association for Cancer Research. mcr.aacrjournals.org Downloaded from
Author manuscripts have been peer reviewed and accepted for publication but have not yet been edited. Author Manuscript Published OnlineFirst on January 19, 2016; DOI: 10.1158/1541-7786.MCR-15-0291-T

27
D. Long term colony formations of knockdown of IGF2 with three independent shRNAs in
SD3.23 cells (SD-shIGF2-1, shIGF2-3 and SD-shIGF2-4).
E. Quantitative real-time PCR showing relative mRNA expression of IGF2. Short hairpins 1 and
4 give excellent knockdown of IGF2 in SD3.23 cells, whereas short hairpin 3 does not give
knockdown compared to empty vector infected SD3.23 cells (SD-EV). SK-N-SH control cells
(SK-EV) have relatively low levels of IGF2.
F. Western blot analysis of MAML3, pIGF1R, IGF1R, p-AKT, AKT and HSP90 in SD3.23 cells
with IGF2 knockdown (SD-shIGF2-1, SD-shIGF2-3 and SD-shIGF2-4). shIGF2-3 did not
give any knock down of IGF2 and consequently did not affect phosphorylation status of
IGF1R and AKT compared to SD3.23 control cells (SD-EV). FL: full-length MAML3. Tr:
truncated MAML3. HSP90 served as loading control.
G. Stimulation of SK-N-SH cells with recombinant IGF2 (rIGF2) up to 400 ng/ml did not make
them resistant to 1 μM RA, but hyperproliferation was observed.
H. Western blot analysis of rIGF2 (200 ng/ml) stimulation of SK-N-SH cells, in presence or
absence of 1 μM RA. Phosphorylation of IGF1R and AKT upon rIGF2 stimulation was
observed. Induction of neuronal differentiation markers GAP43 and SNAP25 was seen upon
RA treatment, irrespective of rIGF2 stimulation. HSP90 serves as loading control.
Figure 6- Co-application of RA and OSI-906 in MAML3 overexpressing cells has a strong effect
on the RA resistant phenotype.
A. Long term colony formation assay of SK-N-SH parental (SK) and SD3.23 (SD) cells treated
with RA, OSI-906 and the RA/OSI-906 combination.
B. Western blot analysis of 6 hour long RA (1 μM), OSI-906 (125 nM) and RA/OSI-906
combination treated SK-N-SH (SK) and SD3.23 (SD) cell lysates probed with MAML3,
pIGF1R, IGF1R, p-AKT, AKT and HSP90 antibodies. Phosphorylation of IGF1R and AKT is
diminished upon treatment with OSI-906, confirming the inhibition of IGF1R signaling.
HSP90 serves as loading control.
on June 4, 2018. © 2016 American Association for Cancer Research. mcr.aacrjournals.org Downloaded from
Author manuscripts have been peer reviewed and accepted for publication but have not yet been edited. Author Manuscript Published OnlineFirst on January 19, 2016; DOI: 10.1158/1541-7786.MCR-15-0291-T
28
C. Western blot analysis showing the long-term effects of RA (1 μM), OSI-906 (125 nM) and
RA/OSI-906 combination treatment. Where RA and RA/OSI-906 combination treatment
induced expression of the neuronal markers GAP43 and SNAP25 after 48 and 96 hours in SK-
N-SH parental cells (SK), there was no induction of these markers in SD3.23 cells (SD),
indicating a block in differentiation in these cells.
on June 4, 2018. © 2016 American Association for Cancer Research. mcr.aacrjournals.org Downloaded from
Author manuscripts have been peer reviewed and accepted for publication but have not yet been edited. Author Manuscript Published OnlineFirst on January 19, 2016; DOI: 10.1158/1541-7786.MCR-15-0291-T
Published OnlineFirst January 19, 2016.Mol Cancer Res Guus J.J.E. Heynen, Ekaterina Nevedomskaya, Sander Palit, et al. neuroblastomaMastermind-like 3 controls proliferation and differentiation in
Updated version
10.1158/1541-7786.MCR-15-0291-Tdoi:
Access the most recent version of this article at:
Material
Supplementary
http://mcr.aacrjournals.org/content/suppl/2016/01/23/1541-7786.MCR-15-0291-T.DC1
Access the most recent supplemental material at:
Manuscript
Authoredited. Author manuscripts have been peer reviewed and accepted for publication but have not yet been
E-mail alerts related to this article or journal.Sign up to receive free email-alerts
Subscriptions
Reprints and
To order reprints of this article or to subscribe to the journal, contact the AACR Publications
Permissions
Rightslink site. Click on "Request Permissions" which will take you to the Copyright Clearance Center's (CCC)
.http://mcr.aacrjournals.org/content/early/2016/01/19/1541-7786.MCR-15-0291-TTo request permission to re-use all or part of this article, use this link
on June 4, 2018. © 2016 American Association for Cancer Research. mcr.aacrjournals.org Downloaded from
Author manuscripts have been peer reviewed and accepted for publication but have not yet been edited. Author Manuscript Published OnlineFirst on January 19, 2016; DOI: 10.1158/1541-7786.MCR-15-0291-T