Embed Size (px)
Citation preview

1
A New Role for ERα: Silencing via DNA methylation of Basal, Stem Cell, and EMT Genes
Eric A. Ariazi1*, John C. Taylor1, Michael A. Black2, Emmanuelle Nicolas1, Michael J. Slifker1,
Diana J. Azzam3, and Jeff Boyd1,3*
1Fox Chase Cancer Center, Temple University Health System, Philadelphia, Pennsylvania
2Department of Biochemistry, University of Otago, Dunedin, New Zealand
3Department of Human and Molecular Genetics, Herbert Wertheim College of Medicine, Florida
International University, Miami, Florida
Running Title: ERα-dependent Gene Silencing via DNA Methylation
Keywords: estrogen, estrogen receptor α, gene silencing, methylation, breast cancer
*Corresponding Authors: Eric A. Ariazi, Freenome, Inc., 201 Gateway Blvd., South San
Francisco, CA 94080. Phone: 650-446-6630; E-mail: [email protected]
Jeff Boyd, Department of Human and Molecular Genetics, Herbert Wertheim College of
Medicine, Florida International University, 11200 SW 8th Street, AHC2 – 693, Miami, FL
33199. Phone: 305-348-0646; E-mail: [email protected].
Disclosure of Potential Conflicts of Interest:
The authors declare no conflicts of interest.
on September 9, 2018. © 2016 American Association for Cancer Research. mcr.aacrjournals.org Downloaded from
Author manuscripts have been peer reviewed and accepted for publication but have not yet been edited. Author Manuscript Published OnlineFirst on November 15, 2016; DOI: 10.1158/1541-7786.MCR-16-0283

2
Abstract
Resistance to hormonal therapies is a major clinical problem in the treatment of estrogen
receptor-α (ERα) positive breast cancers. Epigenetic marks namely DNA methylation of cytosine
at specific CpG sites (5mCpG) are frequently associated with ERα-positive status in human
breast cancers. Therefore, ERα may regulate gene expression in part via DNA methylation. This
hypothesis was evaluated using a panel of breast cancer cell line models of anti-estrogen
resistance. Microarray gene expression profiling was used to identify genes normally silenced in
ERα-positive cells but de-repressed upon exposure to the demethylating agent decitabine, de-
repressed upon long-term loss of ERα expression, and re-suppressed by gain of ERα
activity/expression. ERα-dependent DNA methylation targets (n=39) were enriched for ERα-
binding sites, basal-up/luminal-down markers, cancer stem cell (CSC), epithelial-mesenchymal
transition (EMT), inflammatory and tumor suppressor genes (TSG). Kaplan-Meier survival curve
and Cox proportional hazard regression analyses indicated these targets predicted poor distant
metastasis-free survival among a large cohort of breast cancer patients. The basal breast cancer
subtype markers LCN2 and IFI27 showed the greatest inverse relationship with ERα
expression/activity and contain ERα-binding sites. Thus, genes that are methylated in an ERα-
dependent manner may serve as predictive biomarkers in breast cancer.
Implications: ERα directs DNA methylation-mediated silencing of specific genes that have
biomarker potential in breast cancer subtypes.
on September 9, 2018. © 2016 American Association for Cancer Research. mcr.aacrjournals.org Downloaded from
Author manuscripts have been peer reviewed and accepted for publication but have not yet been edited. Author Manuscript Published OnlineFirst on November 15, 2016; DOI: 10.1158/1541-7786.MCR-16-0283
3
Introduction
Estrogen receptor α (ERα, ESR1) has proven to be the single most important target in
breast cancer (BC). Approximately 70-80% of BCs are ERα positive, for which routine testing is
used to predict response to antihormonal therapy (1). As demonstrated by genome-wide studies,
ERα is a global regulator of gene transcription in BC that orchestrates well integrated hormonal
responses that promote proliferation, survival and inhibit apoptosis (2-5).
As a result of regulating expression of thousands of genes, the presence of ERα
drives the luminal classification of BC. There are five intrinsic tumor subtypes, luminal A,
luminal B, HER2-enriched, claudin-low and basal-like, as well as a normal breast-like group.
Patients with either luminal B, HER2-enriched, basal-like or claudin-low tumors experience
worse clinical outcome than patients with luminal A tumors (6-8).
ERα has been shown to negatively regulate gene expression but not much is currently
known on how it can achieve this. Epigenetic marks namely DNA methylation of cytosine at
specific CpG sites (5mCpG) are frequently associated with ERα-positive status in human breast
cancers. ERα may play a role in directing DNA methylation to target genes since specific
5mCpG marks associate with ERα status in human BC and predict risk of tumor recurrence (9-
12).
Methylation of cytosine at CpG dinucleotide sites (5mCpG) by DNA methyltransferases
(DNMTs) in transcriptional regulatory regions mediates stable epigenetic gene silencing. In
cancer cells, DNA methylation is highly correlated with repressive chromatin marks such as
trimethylated H3K27 (H3K27me3) (13). H3K27 trimethylation is catalyzed by EZH2, the
histone methyltransferase enzymatic subunit of the Polycomb repressor complex 2 (PRC2) (14).
Together, EZH2 and PRC2 then recruit DNMTs (13, 15). Methylated CpG sites near
on September 9, 2018. © 2016 American Association for Cancer Research. mcr.aacrjournals.org Downloaded from
Author manuscripts have been peer reviewed and accepted for publication but have not yet been edited. Author Manuscript Published OnlineFirst on November 15, 2016; DOI: 10.1158/1541-7786.MCR-16-0283

4
transcriptional start sites (TSSs) can silence gene expression by interacting with effectors such as
methyl-CpG-binding domain proteins (MBPs) that impede binding of transcription factors, block
transcriptional initiation, and recruit histone deacetylases (HDACs) to promote chromatin
compaction (16).
The relationship between ERα and DNA methylation patterning in breast cancer has been
reported. In a comprehensive bioinformatics study, methylation of CpG sites near ERα-binding
regions tended to be lower in ERα-positive tumors than ERα-negative tumors. This indicated a
passive role for ERα in preventing gene silencing. The methylation status of DNA sequences at
ERα binding sites is tightly coupled with ERα activity (12). Differentially methylated genes have
also been identified in antihormone-resistant versus wild-type MCF-7 cells (17, 18), and in ERα
RNAi-depleted versus non-depleted MCF-7 cells (19). Consistent with this notion, loss of ERα
activity leads to silencing of estrogen responsive genes such as PgR (18, 19). Yet, ERα may also
play an active role in promoting silencing. A functional link between ERα and DNA
hypermethylation has been demonstrated at the CYP1A1 locus, whose gene product converts
17β-estradiol (E2) into a metabolite that inhibits proliferation; ERα silenced CYP1A1 by
recruiting DNMT3B (20).
We sought to identify ERα targets for CpG methylation-mediated silencing by selecting
the intersection of: i) genes up-regulated (i.e., de-repressed) by the demethylating agent
decitabine (DAC), ii) genes up-regulated by loss of ERα expression in a series of antihormone-
resistant T47D and MCF7 cell lines, and iii) genes down-regulated by E2 re-exposure or
increased ERα expression in antihormone-resistant T47D and MCF7 cells. Additional
experiments verified the functional dependence on ERα for silencing and DNA methylation of
the basal BC subtype markers LCN2 and IFI27 in wild-type and antihormone-resistant T47D-
on September 9, 2018. © 2016 American Association for Cancer Research. mcr.aacrjournals.org Downloaded from
Author manuscripts have been peer reviewed and accepted for publication but have not yet been edited. Author Manuscript Published OnlineFirst on November 15, 2016; DOI: 10.1158/1541-7786.MCR-16-0283

5
based cell lines. Therefore, we show that ERα targets genes for DNA methylation-mediated
silencing that may potentially be predictive biomarkers of breast cancer subtypes.
Materials and Methods
Cell lines
Sources and culture conditions of cell lines generated in this study are provided in
Supplementary Materials and Methods. A schema representing the derivation of antihormone-
resistant cells is shown in Supplementary Fig. S1. The fulvestrant (FUL) -resistant cell lines
(T47D/FUL, MCF7/FUL) and the estrogen deprivation (ED) -resistant cell lines (T47D/ED1,
T47D/ED2) were generated by continuous culture (8 weeks to > 1 year) of wild-type T47D and
MCF-7 cells in estrogenized media (RPMI 1640 plus 10% whole FBS) supplemented with 100
nmol/L FUL or in estrogen-free media (phenol red-free RPMI 1640 plus 10% dextran-coated
charcoal-stripped FBS), as appropriate. Antihormone-resistant cells were maintained as
polyclonal populations. All cell lines were authenticated by gene expression microarrays,
morphology and by verifying ERα, PgR, HER2, LCN2 and IFI27 levels and cell line growth
responses to estrogen, estrogen deprivation and FUL.
The lentiviral cell lines, T47D/ED1/VC, T47D/ED1/VC+E2, T47D/ED1/ERα,
T47D/ED1/ERα+E2 were generated by infecting ERα-negative T47D/ED1 cells with an ERα-
expressing lentivirus or an empty vector control (VC) lentivirus, as appropriate. Infected cells
were maintained in estrogen-free or in 1 nmol/L E2 –supplemented medium for 12 weeks. After
initial recovery from infection and again 4 weeks later, infected cells were sorted for the
lentiviral ZsGreen fluorescent marker using a Becton Dickinson FACS-VantageSE/DiVa cell
sorter. To produce the lentiviral vectors, ERα’s coding region was excised from pHEGO using
on September 9, 2018. © 2016 American Association for Cancer Research. mcr.aacrjournals.org Downloaded from
Author manuscripts have been peer reviewed and accepted for publication but have not yet been edited. Author Manuscript Published OnlineFirst on November 15, 2016; DOI: 10.1158/1541-7786.MCR-16-0283
6
EcoRI and inserted into the EcoRI site of the lentiviral vector pLVX-EF1α-IRES-ZsGreen1
(Clontech Laboratories).
RNA isolation
RNA was purified using Qiagen’s RNeasy Plus kits. RNA samples were required to
exhibit an RNA integrity number of 9.8-10.0 on an Agilent 2100 Bioanalyzer.
Reverse-transcriptase quantitative PCR assays (RT-qPCR)
RT-qPCR assays were carried out as previously described (21) but using AMV First-
Strand cDNA kit, predesigned TaqMan assays, TaqMan Universal PCR Master Mix and a
7900HT Fast Real-Time PCR system (Thermo Fisher Scientific). Data were analyzed by
comparison to a serial dilution series of cDNA. All qPCR data represent the mean and SDs of 3
independent biological replicates and 2 technical replicates per biological replicate.
Agilent gene expression microarrays
Genome-wide RNA profiling was carried out by the Genomics Facility at Fox Chase
Cancer Center using Agilent’s Human Gene Expression 4×44K v2 oligonucleotide microarrays.
RNA labeling (one-color cyanine 3-CTP), hybridization to the arrays, and quality assessment of
hybridizations were performed according to the manufacturer.
Immunoblot analyses
Immunoblots were done as previously described (21) but using RIPA buffer and 40 µg
protein per lane. Antibodies used are listed in Supplementary Materials and Methods. Blots were
visualized using the Odyssey Infrared Imaging System (Li-Cor Biosciences).
DNA methylation analysis by pyrosequencing
on September 9, 2018. © 2016 American Association for Cancer Research. mcr.aacrjournals.org Downloaded from
Author manuscripts have been peer reviewed and accepted for publication but have not yet been edited. Author Manuscript Published OnlineFirst on November 15, 2016; DOI: 10.1158/1541-7786.MCR-16-0283

7
Genomic DNA was isolated using the DNeasy Blood and Tissue Kit (Qiagen) and treated
with bisulfite (EpiTect Bisulfite Conversion kit (Qiagen)) to change unmethylated cytosine
nucleotides to thymines. Pyrosequencing reactions were carried out at EpigenDx as a service
using their pre-designed assays. In pyrograms, the ratio of methylated cytosines to thymines
(which represent unmethylated cytosines) are internally normalized values. All pyrosequencing
data represent the mean and SD of 4 replicates.
Human BC cohorts
Breast cancer data from The Cancer Genome Atlas (TCGA) project were downloaded via
the International Cancer Genome Consortium (ICGC) data portal
(https://dcc.icgc.org/releases/release_18/Projects/BRCA-US). Methylation data was retrieved for
1013 patients, 967 of whom also had ERα status available. CpG differential methylation by ERα
status was assessed as described in Supplementary Materials and Methods.
The gene expression microarray cohort comprising 2,116 BCs was previously
constructed in (22) from publicly available data sets and is described in Supplementary Materials
and Methods. BC instrinsic subtypes were previously classified as described (22).
Metagenes
To analyze the composite expression level of gene sets in a tumor, gene sets were
represented as metagenes and metagene scores, or single number summary values, were
determined across the expression array BC cohort. These scores represent a linear combination
of expression values of each gene in the gene set in individual tumors. Metagene scores were
generated by determining the first “principle component” or “eigenvector” of each gene set in
each tumor using singular value decomposition (SVD). The eigenvector produced by SVD was
rescaled to a rank-based score between zero and one, with zero relating to the lowest composite
on September 9, 2018. © 2016 American Association for Cancer Research. mcr.aacrjournals.org Downloaded from
Author manuscripts have been peer reviewed and accepted for publication but have not yet been edited. Author Manuscript Published OnlineFirst on November 15, 2016; DOI: 10.1158/1541-7786.MCR-16-0283

8
expression value for a gene set, and 1 relating to the highest. Thus metagene scores capture the
majority of variation in gene expression that is common to the majority of genes in a gene set
across a population of samples.
To construct the ERα DNA methylation metagene, Entrez gene identifiers were used to
match the Agilent probes from the expression microarrays used in this study to the Affymetrix
probe sets used in the combined BC cohort. This resulted in matching 34 of 39 ERα DNA
methylation genes (Supplementary Table S1). The ERα status-associated metagene consists of
the 100 most differentially expressed genes between ER-positive and ERα-negative tumors in the
2,116 BC cohort as determined using the “limma” package (23) for R software (www.r-
project.org). The specific genes comprising each metagene are provided in Supplementary Excel
File S1.
Accession Numbers
Microarray data are deposited in the NCBI GEO repository with accession number GSE85536
Statistical analyses
Expression array data were log2 transformed for all comparisons. Differentially expressed
genes were identified by serial pairwise comparisons using SAM (24) at an FDR < 5% and a 2-
fold cutoff, except a 1.5 fold cutoff was used when comparing T47D/ED2/E2 versus T47D/ED2
cells because the ERα levels in these cells were < 5% that of wild-type T47D cells (Fig. 1A).
Gene enrichment in Supplementary Excel Files 4, 5, and 10 was assessed by one-way Fisher’s
exact tests using the R software application. Associations between ERα DNA methylation
metagene scores and distant metastasis-free patient survival (DMFS) were evaluated by Kaplan-
Meier analysis and log-rank tests, and by univariate and multivariable Cox proportional hazards
(CoxPH) regression models as described previously (22). The additional covariates used were:
on September 9, 2018. © 2016 American Association for Cancer Research. mcr.aacrjournals.org Downloaded from
Author manuscripts have been peer reviewed and accepted for publication but have not yet been edited. Author Manuscript Published OnlineFirst on November 15, 2016; DOI: 10.1158/1541-7786.MCR-16-0283

9
age at diagnosis, intrinsic subtype, ERα status, tumor size, and tumor grade. Statistical tests used
in Figs. 5-6 are specified in figure legends and were carried out using Prism v4.03 (Graph Pad
Software). Where specified, one-way tests were employed because gene expression and CpG
methylation was assumed a priori to be inversely related.
on September 9, 2018. © 2016 American Association for Cancer Research. mcr.aacrjournals.org Downloaded from
Author manuscripts have been peer reviewed and accepted for publication but have not yet been edited. Author Manuscript Published OnlineFirst on November 15, 2016; DOI: 10.1158/1541-7786.MCR-16-0283

10
Results
Identification of genes inversely correlated with ERα expression/activity
To identify ERα targets for DNA methylation-mediated silencing, we sought to find the
intersection of genes that fulfilled three conditions: i) those genes de-repressed by loss of ERα
expression, ii) those genes re-silenced by increased ERα activity or expression, and iii) those
genes de-repressed by loss of DNA methylation.
To begin, BC cell line models were developed that exhibited loss of ERα to enable
subsequent identification of genes which inversely correlated with ERα expression/activity. We
elected not to use RNAi based methods as acute depletion of ERα in estrogen-dependent cells
leads to widespread cell death (unpublished observation). Therefore, starting with wild-type
ERα-positive T47D and MCF-7 luminal BC cells, a panel of ERα-low/negative T47D and MCF7
BC cells were derived by long-term selection of cells in 100 nmol/L FUL or in estrogen-free
media for 8 weeks to greater than 1 year (schema in Supplementary Fig. S1). Thus FUL-resistant
(T47D/FUL, MCF7/FUL) and estrogen deprivation-resistant (T47D/ED1, T47D/ED2) cell lines
were derived. ERα mRNA levels were measured by RT-qPCR (Fig. 1A). T47D/ED1 cells lost
99.9%, T47D/FUL and T47D/ED2 cells lost ≥ 95%, and MCF7/FUL cells (at week 8 of
derivation) lost 90% of ERα mRNA compared to respective wild-type parental cells.
Immunoblotting also demonstrated similar ERα protein losses (Fig. 4).
To determine global changes in gene expression which correlated with loss of ERα
expression, transcriptional profiling was performed using Agilent 4×44K v2 oligonucleotide
microarrays. ERα-low/negative cell lines, T47D/FUL, ED1, ED2 and MCF7/FUL (week 8),
were compared against their respective wild-type parental T47D or MCF-7 cell line (4 separate
pairwise comparisons). Supplementary Excel Files S2 and S3 list the 324 and 153 significantly
on September 9, 2018. © 2016 American Association for Cancer Research. mcr.aacrjournals.org Downloaded from
Author manuscripts have been peer reviewed and accepted for publication but have not yet been edited. Author Manuscript Published OnlineFirst on November 15, 2016; DOI: 10.1158/1541-7786.MCR-16-0283

11
up- and down-regulated genes, respectively. These differentially regulated genes were examined
for enrichment of functional gene groups consistent with acquired antihormone resistance using
one-way Fisher’s exact tests (tables and P-values in Supplementary Excel Files S4-S5,
Supplementary Fig. S2). As expected, genes with ERα-binding sites were overrepresented. ERE-
regulated genes were taken from previously published datasets (See Supplementary Figure S3
and Legend for list of genes and references). Importantly, basal markers were very significantly
enriched among the up-regulated genes, whereas luminal markers were very significantly
enriched among the down-regulated genes. Also observed was enrichment of CSC, EMT, and
tumor suppressor genes (TSGs) (See legend of Supplementary Figure S3 for references used).
Examples of key genes in these functional groups are shown in Supplementary Fig. S3. This
indicates that the antihormone-resistant ERα-low/negative T47D and MCF-7 cells transitioned to
a differentiation state similar to the basal-like and claudin-low BC subtype. Such a change in
differentiation has previously been observed in T47D tumors in vivo following antiestrogen
treatment or estrogen withdrawal and termed “luminobasal” (25).
To further refine the list of ERα inversely correlated genes, T47D/ED2 cells were re-
exposed to E2 for 38 weeks resulting in T47D/ED2/E2 cells. Interestingly, ERα RNA (Fig. 1)
and protein levels (Fig. 4) never rebounded, indicating permanent ERα silencing as observed
elsewhere (26). In fact, ERα RNA levels actually decreased ~50% more; this likely reflected a
known E2-ERα negative-feedback regulatory loop indicative of ERα transcriptional activity (27).
MCF/FUL cells were also further selected. These cells at week 8 of derivation showed 90% loss
of ERα, but after 13 weeks of additional exposure to FUL (total 21 weeks), ERα levels
rebounded to wild-type cell levels (Fig. 1A and Fig. 4E). Transcriptional profiling showed
increased expression of well-known E2-stimulated genes in T47D/ED2/E2 versus T47D/ED2
on September 9, 2018. © 2016 American Association for Cancer Research. mcr.aacrjournals.org Downloaded from
Author manuscripts have been peer reviewed and accepted for publication but have not yet been edited. Author Manuscript Published OnlineFirst on November 15, 2016; DOI: 10.1158/1541-7786.MCR-16-0283

12
cells (e.g., PGR, CA12, ERBB4) and in MCF7/FUL week 21 versus week 8 cells (e.g., CXCL12,
GREB1, ERBB4), as well as decreased expression of E2-repressed genes (e.g., OASL, C3; both
cell lines). Further, the expression pattern of many (but not all) basal and luminal, CSC, EMT,
and tumor suppressor genes reversed upon E2 re-exposure in T47D/ED2/E2 or increased ERα
expression in MCF7/FUL (week 21) cells compared to respective parental cells (Supplementary
Fig. S3).
Taking into account all cell line transcriptional profiles, 161 genes were identified that
consistently inversely-related with ERα expression/activity while only 9 genes were directly
related (Supplementary Excel Files S6 and S7, respectively).
Candidate ERα DNA methylation targets
Since ERα inversely-related genes whose expression was regulated by DNA methylation
were sought, genes up-regulated by the DNA demethylating agent DAC were identified. Wild-
type T47D cells were treated with 1 µmol/L DAC or control (CON) –treated for 96 h, and then
transcriptionally profiled. This resulted in the identification of 1,049 genes (Supplementary
Excel File S8).
Subsequently, the intersection of ERα inversely-related genes and DAC-induced genes
was determined. This intersection represented the set of genes that fulfilled the following criteria:
i) genes induced by DAC versus CON-treated wild-type T47D cells, ii) genes up-regulated in
each of the ERα-low/negative cell lines, i.e., T47D/FUL, T47D/ED1, and T47D/ED2 cells,
versus wild-type T47D cells, iii) genes down-regulated by E2 in T47D/ED2/E2 versus
T47D/ED2 cells, iv) genes up-regulated in ERα-low MCF7/FUL week 8 versus wild-type MCF-
7 cells, and v) genes down-regulated in ERα-positive MCF-7/FUL week 21 versus ERα-low
on September 9, 2018. © 2016 American Association for Cancer Research. mcr.aacrjournals.org Downloaded from
Author manuscripts have been peer reviewed and accepted for publication but have not yet been edited. Author Manuscript Published OnlineFirst on November 15, 2016; DOI: 10.1158/1541-7786.MCR-16-0283

13
MCF-7/FUL week 8 cells. These selection criteria pinpointed 39 high-value candidates for ERα-
mediated silencing via DNA methylation (Fig. 1B, Supplementary Excel File S9).
Initially, these 39 candidate genes were evaluated for methylation in human BC
(Supplementary Table S1). Using TCGA processed BC methylation data, a set of 1,996 CpG’s
associated with these genes was identified. These CpG sites were assessed for differential
methylation between ERα-positive and ERα-negative BCs using one-sided Wilcoxon rank sum
tests adjusted for FDR. Using a permutation analysis to determine if similar results could be
achieved using 1,000 sets of 39 random genes, it was concluded that the candidate ERα DNA
methylation targets tended to display higher methylation levels in ERα-positive compared to
ERα-negative tumors than would be expected for an identically-sized set of randomly selected
genes (permutation-based P-value = 0.011).
Next, the 39 candidate ERα DNA methylation targets were analyzed for enrichment of
the same gene groups as the ERα inversely-related genes (tables and P-values in Supplementary
Excel File S10, Supplementary Fig. S2). Similar to the earlier results, the candidate methylation
targets were enriched for genes with ERα-binding sites, basal markers, CSC up-regulated genes,
EMT up-regulated genes, and TSGs. The candidate methylation targets were also enriched for
EMT down-regulated genes, but there were almost twice as many EMT up-regulated genes than
down-regulated (13 versus 7, respectively).
Expression analysis of the candidate ERα DNA methylation gene set in BC
The candidate ERα DNA methylation target gene set was analyzed relative to other
important tumor-related gene sets and clinical variables in a cohort of 2,116 BCs. Gene sets were
represented as a composite entity termed an “expression metagene” and a single value summary
on September 9, 2018. © 2016 American Association for Cancer Research. mcr.aacrjournals.org Downloaded from
Author manuscripts have been peer reviewed and accepted for publication but have not yet been edited. Author Manuscript Published OnlineFirst on November 15, 2016; DOI: 10.1158/1541-7786.MCR-16-0283

14
of the gene set’s expression level in an individual tumor as a “metagene score”. To enable
evaluation of the distribution of gene set expression levels, metagene scores were used to divide
the BCs in the cohort into “tertiles” (lowest 33%, middle 33%, highest 33%).
ERα DNA methylation metagene scores were plotted versus ERα status, an ERα status-
associated metagene, BC intrinsic subtypes, luminobasal signature metagenes, EMT metagenes
and CD44+/CD24-/low CSC metagenes (Fig. 2). The ERα status-associated metagene encapsulated
the 100 most differentially expressed probe sets between ERα-positive and -negative tumors in
the 2,116 BC cohort. Congruent with the original selection criteria, the ERα DNA methylation
metagene showed a clear negative association with ERα status and 100 other ERα status-
associated genes, with ERα-positive tumors tending to have lower scores (and thus indicating
lower levels of gene expression) (Fig. 2A). With regard to intrinsic subtype, luminal A and B
subtypes displayed the lowest ERα DNA methylation metagene scores, while the basal-like
subtype exhibited the highest scores (Fig. 2B). This was consistent with enrichment of basal-
up/luminal-down genes as previously noted. Further, the ERα DNA methylation metagene
clearly directly related to the luminobasal signature metagenes (Fig. 2C), suggesting the ERα
DNA methylation targets program this type of change in differentiation. Again as expected from
the enrichment analysis, ERα DNA methylation metagene scores were associated with
CD44+/CD24-/low metagenes (Fig. 2D) and selectively with the EMT up-regulated metagene (Fig.
2E). This helps explain why the ERα DNA methylation metagene scores also associated with the
claudin-low BC subtype (Fig. 2B).
The ERα DNA methylation metagene was next evaluated for predicting DMFS in the BC
cohort by Kaplan-Meier survival curves (Fig. 2F) and CoxPH regression models (Supplementary
Table S4). In each analysis patients were separated into two groups according to metagene scores
on September 9, 2018. © 2016 American Association for Cancer Research. mcr.aacrjournals.org Downloaded from
Author manuscripts have been peer reviewed and accepted for publication but have not yet been edited. Author Manuscript Published OnlineFirst on November 15, 2016; DOI: 10.1158/1541-7786.MCR-16-0283

15
split at the 10th, 50th or 90th percentiles, and then the proportion of patients exhibiting DMFS in
each group was plotted against time. Patients with metagene scores in the bottom 10th or top 90th
percentile experienced significantly decreased DMFS. Likewise, univariate CoxPH regression
analysis demonstrated that metagene scores split at the 10th and 90th percentiles associated with
DMFS (P-values = 0.00003 and 0.035, respectively). ERα DNA methylation metagene scores
split at the 10th percentile remained significantly associated with DMFS in a multivariable
CoxPH regression model (P-value = 0.026), but not when split at the 90th percentile. These
results suggested that some genes in the ERα DNA methylation metagene when expressed at low
levels promoted poor DMFS, while others did so when expressed at high levels.
To determine which of the genes of the candidate ERα DNA methylation metagene when
expressed at low or high levels may promote poor DMFS, Kaplain-Meier survival curves and
univariate CoxPH regression analysis was conducted for each gene. Based on these analyses, the
candidate ERα methylation targets were separated into low- and high-expression metagenes
(defined in Supplementary Excel File S11). The low- and high expression metagenes poorly
correlated with each other, indicating they indeed likely represented different biological
processes (Supplementary Table S5). Patients were then divided according to their tumor’s low-
and high-expression metagene scores split at the 50th percentile and evaluated for DMFS as
before (Fig. 3A). The Kaplan-Meier plots showed clear separations of survival curves in which
patients in the low expression metagene’s bottom 50% group and patients in the high expression
metagene’s top 50% group displayed poor DMFS.
Low- (Fig 3B) and high-expression ERα DNA methylation metagenes (Fig. 3C) were
next assessed for associations with various tumor-related metagenes in the BC cohort. These
results indicated that the low-expression metagene associated with tumor suppressor and focal
on September 9, 2018. © 2016 American Association for Cancer Research. mcr.aacrjournals.org Downloaded from
Author manuscripts have been peer reviewed and accepted for publication but have not yet been edited. Author Manuscript Published OnlineFirst on November 15, 2016; DOI: 10.1158/1541-7786.MCR-16-0283

16
adhesion gene expression in BCs. Accordingly, low levels of these types of genes would be
predicted to promote metastasis. Conversely, the high expression metagene associated with high
grade tumors, as well as proliferation and pro-inflammatory Th1 immune response gene
expression in BCs; this would also promote poor DMFS. Supplementary Excel File S11 contains
references which help provide a rationale for the segregation of genes into either the low- or
high-expression metagenes.
Inverse Relationship between LCN2 and IFI27 expression and ERα
IFI27 and LCN2 were the top two genes inversely related to ERα expression/activity in
the T47D-based cell lines (Fig. 1B). Both LCN2 (5) and IFI27 (2) contain ERα-binding sites.
Also, both are basal markers (7, 28, 29) and promote EMT (30, 31). Hence, LCN2 and IFI27
were selected for validation of ERα-dependent changes in expression and 5mCpG levels.
LCN2 mRNA and protein levels dramatically increased in a time-dependent manner after
precipitous drops in ERα levels across all antihormone resistant models (Fig. 4A-C, 4E). Further,
LCN2 expression decreased in a time-dependent manner after extended E2 re-exposure in
T47D/ED2/E2 cells (Fig. 4D) and once ERα expression rebounded in MCF/FUL cells (Fig. 4E).
LCN2 has previously been reported to up-regulate the key EMT transcription factor slug
(SNAI2) (30), therefore slug expression was examined. Across all antihormone-resistant models,
changes in slug expression followed similar changes in LCN2, although in MCF7/FUL cells,
slug induction was delayed until after LCN2 was up-regulated from 8-12 weeks and silenced
again due to ERα re-expression (Fig. 4B-E). Together, these results are consistent with LCN2
regulating slug expression and demonstrates that LCN2 may have promoted EMT via slug.
on September 9, 2018. © 2016 American Association for Cancer Research. mcr.aacrjournals.org Downloaded from
Author manuscripts have been peer reviewed and accepted for publication but have not yet been edited. Author Manuscript Published OnlineFirst on November 15, 2016; DOI: 10.1158/1541-7786.MCR-16-0283

17
Like LCN2, IFI27 mRNA expression was strikingly up-regulated 270-1,900-fold across
the ERα-low/negative T47D-based antihormone-resistant compared to wild-type cell lines, and
was dramatically repressed again upon E2 re-exposure in T47D/ED2/E2 versus T47D/ED2 cells
(Fig. 4F).
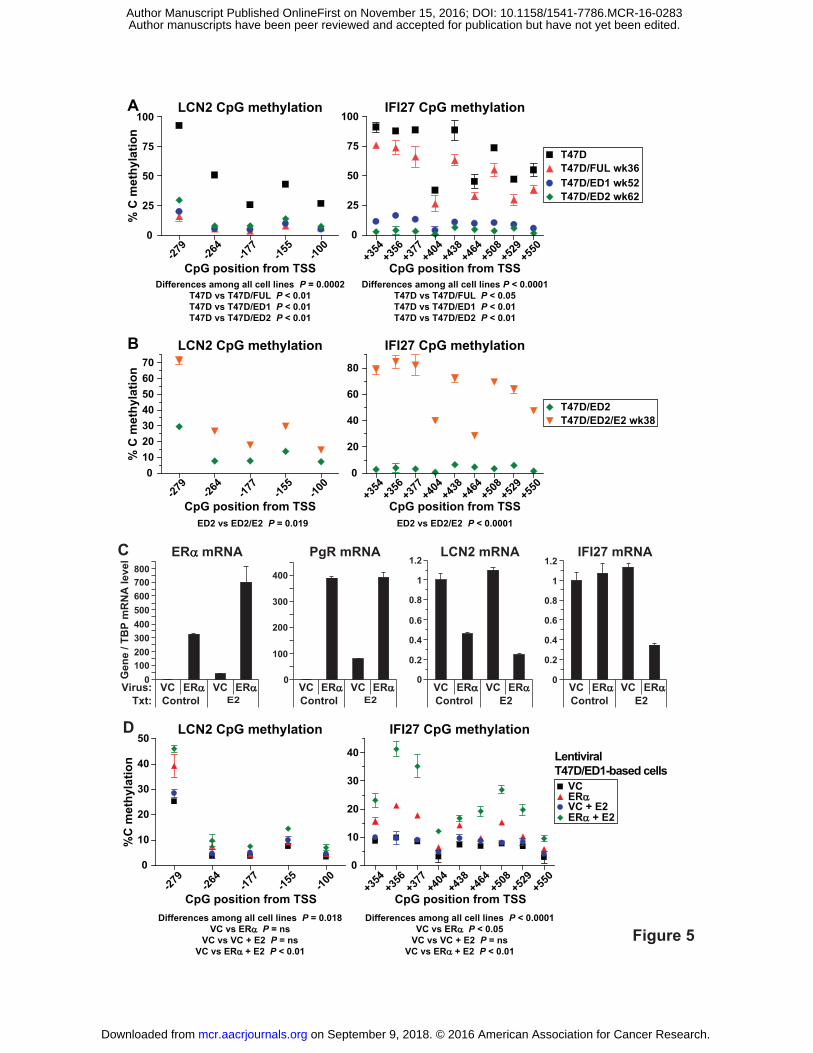
Direct Relationship between methylation of LCN2 and IFI27 and ERα
Levels of selected 5mCpG sites near the TSSs of LCN2 and IFI27 were quantitated
across the T47D-based models by pyrosequencing of bisulfite-treated gDNA. This analysis
found LCN2 and IFI27 CpG sites to be significantly hypomethylated in ERα-low/negative
T47D/FUL, T47D/ED1 and T47D/ED2 cells versus wild-type ERα-positive T47D cells (Fig.
5A), and significantly hypermethylated upon E2 re-exposure in T47D/ED2/E2 cells compared to
parental T47D/ED2 cells (Fig. 5B). Therefore, LCN2 and IFI27 CpG methylation levels directly
associated with ERα expression/activity.
Next, a causal relationship between ERα expression and CpG methylation of LCN2 and
IFI27 was tested. ERα-negative T47D/ED1 cells were infected with an ERα-expressing
lentivirus or an empty vector control (VC) lentivirus generating T47D/ED1/ERα and
T47D/ED1/VC cells, respectively. These infected cells were maintained with and without E2 for
12 weeks and subjected to two rounds of cell sorting for the lentiviral ZsGreen fluorescent
marker. Characterization of these lentiviral cells lines demonstrated functional ERα signaling
since ERα and PgR mRNAs were expressed at high levels in ERα-infected cells. Also, LCN2
and IFI27 mRNA levels were down-regulated in an ERα-dependent manner (plus E2 for IFI27).
(Fig. 5C). Next, LCN2 and IFI27 CpG methylation levels were quantitated by pyrosequencing
and found to be significantly increased in lentiviral ERα plus E2 (LCN2) or just ERα (IFI27)
on September 9, 2018. © 2016 American Association for Cancer Research. mcr.aacrjournals.org Downloaded from
Author manuscripts have been peer reviewed and accepted for publication but have not yet been edited. Author Manuscript Published OnlineFirst on November 15, 2016; DOI: 10.1158/1541-7786.MCR-16-0283

18
compared to VC cells. (Fig. 5D). Therefore, increased CpG methylation of LCN2 and IFI27 was
dependent on ERα plus E2 stimulation. In the case of IFI27, repression of its expression did not
occur until its CpG methylation levels were maximally increased by the presence of E2,
indicating that perhaps a methylation threshold was needed to cause its repression.
LCN2 and IFI27 expression and CpG methylation in BC cell lines
LCN2 and IFI27 were examined in a panel of 11 BC cell lines. Initial characterization
showed 4 cell lines were ERα-positive and 4 were HER2-positive, where only BT-474 cells were
positive for both prognosticators (Fig. 6A). Then LCN2 protein (Fig. 6B) and IFI27 mRNA
levels (Fig. 6C) were measured and found to be significantly lower in ERα-positive compared to
ERα-negative cells. Next, methylation levels of CpG sites near the TSSs of LCN2 and IFI27
were quantitated by pyrosequencing of bisulfite-treated gDNA. Correlations between expression
and 5mCpG levels were determined by Spearman's rho (Fig. 6D). Methylation of all 5 of LCN2's
tested CpG sites and 4 out of IFI27's 9 tested sites (CpG sites +404, +438, +508 and +550)
significantly correlated with each respective gene's expression levels. Lastly, an association
between CpG methylation levels and ERα status was evaluated. While all 5 of LCN2’s CpGs
were evaluated, only those 4 CpGs of IFI27 that significantly correlated with expression were
considered. This analysis showed for both LCN2 and IFI27, that 5mCpG levels were
significantly higher in ERα-positive than ERα-negative cells (Fig. 6E).
LCN2 and IFI27 expression as predictors of DMFS in human BC
LCN2 and IFI27 RNA expression levels were examined in the BC cohort with respect to
DMFS by CoxPH regression analysis (Supplementary Table S6). In univariate models, LCN and
on September 9, 2018. © 2016 American Association for Cancer Research. mcr.aacrjournals.org Downloaded from
Author manuscripts have been peer reviewed and accepted for publication but have not yet been edited. Author Manuscript Published OnlineFirst on November 15, 2016; DOI: 10.1158/1541-7786.MCR-16-0283

19
IFI27 both significantly associated with DMFS (P-values = 0.040 and 0.0023, respectively), but
this did not hold in multivariable models.
on September 9, 2018. © 2016 American Association for Cancer Research. mcr.aacrjournals.org Downloaded from
Author manuscripts have been peer reviewed and accepted for publication but have not yet been edited. Author Manuscript Published OnlineFirst on November 15, 2016; DOI: 10.1158/1541-7786.MCR-16-0283

20
Discussion
We hypothesized that ERα may regulate gene expression in part via DNA methylation
since methylation of specific CpG sites associates with ERα-positive status in human BC. This
hypothesis was tested by identifying genes normally silenced in ERα-positive BC cell lines but
which were de-repressed upon exposure to the demethylating agent DAC, de-repressed upon
long-term loss of ERα expression, and re-suppressed by gain of ERα activity/expression. Based
on these criteria, 39 candidate ERα DNA methylation targets were found. These 39 targets were
used to construct an ERα DNA methylation metagene that inversely associated with ERα status
in human BCs and directly associated with expression signatures of basal-like and claudin-low
BC subtypes (25). Congruent with these associations, the candidate ERα DNA methylation
targets were enriched for basal markers, CSC and EMT genes.
LCN2 and IFI27 were the top two ERα inversely related genes identified and were
selected for validation. Both LCN2 (5) and IFI27 contain ERα-binding sites (2), are basal
markers (7, 28, 29) and involved in EMT (30, 31). First, LCN2 and IFI27 were originally
silenced in wild-type T47D and MCF-7 cells, but their expression dramatically increased upon
loss of ERα, while their 5mCpG levels significantly decreased in all antihormone-resistant T47D
cell lines. Second, LCN2 and IFI27 were re-silenced upon E2 re-exposure in T47D/ED2 cells
while their 5mCpG levels increased. Third, lentiviral ERα plus E2 in T47D/ED1 cells also
repressed LCN2 and IFI27 expression while increasing their 5mCpG levels. Fourth, LCN2’s and
IFI27’s 5mCpG levels positively associated with ERα status but inversely correlated with
expression in a panel of 11 BC cell lines. Together these results provide correlative and
functional evidence that ERα directed DNA methylation-mediated silencing of LCN2 and IFI27.
on September 9, 2018. © 2016 American Association for Cancer Research. mcr.aacrjournals.org Downloaded from
Author manuscripts have been peer reviewed and accepted for publication but have not yet been edited. Author Manuscript Published OnlineFirst on November 15, 2016; DOI: 10.1158/1541-7786.MCR-16-0283
21
Since ERα plays such a pivotal role in a more favorable outcome in BC, genes targeted
by ERα for DNA methylation-mediated silencing likely play important roles in disease
progression. In addition to the CSC and EMT genes, Kaplan-Meier survival curve analyses
indicated that the candidate ERα DNA methylation targets consisted of two classes of genes that
predicted poor DMFS, one when expressed at low levels and a second when expressed at high
levels. The low expression class associated with tumor suppressor and focal adhesion gene
expression in BC. Conversely, the high expression class associated with proliferation and
inflammatory response gene expression in BC. Additionally, the two validated targets for
methylation, LCN2 and IFI27, predicted DMFS in univariate CoxPH models. Thus, genes
methylated and silenced in an ERα dependent manner may be good targets for therapeutic
intervention in ERα-negative BC where they are expressed.
How might ERα direct DNA methylation to specific genes? We propose it may
begin with transcriptional repression. E2 actually represses transcription of more genes than it
stimulates (3, 4). Studies on E2-dependent transcriptional repression have demonstrated that ERα
recruits coregulators (corepressors (32-36) and coactivators that act as corepressors (36, 37). The
coregulators serve as scaffolds to interact with HDACs and a host of additional co-factors (32,
33, 38, 39), such as EZH2 (34, 40), that together remove activating histone marks, add repressive
marks and restructure chromatin structure (38, 39, 41-43). We hypothesize that not only does
ERα direct epigenetic silencing via histone modification, but also via cytosine methylation at
CpG sites.
Genome-wide kinetics of DAC-induced DNA demethylation and subsequent
remethylation after drug withdrawal in breast cancer cells showed that CpGs differ in both their
susceptibility to demethylation and propensity for remethylation after drug removal (44).
on September 9, 2018. © 2016 American Association for Cancer Research. mcr.aacrjournals.org Downloaded from
Author manuscripts have been peer reviewed and accepted for publication but have not yet been edited. Author Manuscript Published OnlineFirst on November 15, 2016; DOI: 10.1158/1541-7786.MCR-16-0283

22
This is also plausible since EZH2 recruits DNMTs directly and indirectly through PRC2 (13, 15).
Other protein-protein interactions exist as well that could support formation of a multi-
component complex containing ERα and DNMTs such as those between ERα and EZH2 (45,
46), between HDACs and DNMTs (47-49), and between corepressors and DNMTs (40, 49).
Evidence for such a complex exists at least at the CYP1A1 promoter where it was demonstrated
that ERα and DNMT3B interacted (20). Thus, it is possible that ERα could silence targeted
genes via DNA methylation by directly and indirectly recruiting corepressors, HDACs, EZH2 in
PRC2, and DNMTs (model shown in Fig. 7).
Taken together, our data indicate that ERα can silence genes via DNA methylation such
as LCN2 and IFI27. Moreover, ERα may direct DNA methylation-mediated silencing of a
subpopulation of basal markers, CSC and EMT genes that may potentially enforce luminal
differentiation of BC cells.
on September 9, 2018. © 2016 American Association for Cancer Research. mcr.aacrjournals.org Downloaded from
Author manuscripts have been peer reviewed and accepted for publication but have not yet been edited. Author Manuscript Published OnlineFirst on November 15, 2016; DOI: 10.1158/1541-7786.MCR-16-0283

23
Authors' Contributions
Conception and design: E.A. Ariazi, J. Boyd
Development of methodology: E.A. Ariazi
Acquisition of data (provided animals, acquired and managed patients, provided facilities, etc.):
E.A. Ariazi, J. Boyd
Analysis and interpretation of data (e.g., statistical analysis, biostatistics, computational
analysis): E.A. Ariazi, M.A. Black, M. Slifker
Writing, review, and/or revision of the manuscript: E.A. Ariazi, M.A. Black, D. Azzam,
J. Boyd, M.Slifker
Administrative, technical, or material support (i.e., reporting or organizing data, constructing
data sets): E.A. Ariazi, J.C. Taylor, E. Nicolas, M.A. Black, M. Slifker
Study supervision: E.A. Ariazi, J. Boyd
Acknowledgments
The authors thank Dennis DeSimone and Trung Nguyen, clinical fellows in the lab for
technical support. The authors also thank the Expression Microarray facility, the Genotyping and
Real-Time PCR facility, and the Flow Cytometry facility at Fox Chase Cancer Center for
technical support.
Grant support
Commonwealth Universal Research Enhancement (CURE) Program Award from the
Pennsylvania Department of Health (J. Boyd), NIH P30 CA006927 (Fox Chase Cancer Center
Core Grant).
on September 9, 2018. © 2016 American Association for Cancer Research. mcr.aacrjournals.org Downloaded from
Author manuscripts have been peer reviewed and accepted for publication but have not yet been edited. Author Manuscript Published OnlineFirst on November 15, 2016; DOI: 10.1158/1541-7786.MCR-16-0283

24
References
1. Ariazi EA, Jordan VC. Estrogen receptors as therapeutic targets in breast cancer. In: Ottow E, Weinmann H, editors. Nuclear Receptors as Drug Targets. Methods and Principles in Medicinal Chemistry. 39. Mörlenbach: Wiley-VCH; 2008. p. 127-99. 2. Fullwood MJ, Liu MH, Pan YF, Liu J, Xu H, Mohamed YB, et al. An oestrogen-receptor-alpha-bound human chromatin interactome. Nature. 2009;462(7269):58-64. doi: 10.1038/nature08497. PubMed PMID: 19890323; PubMed Central PMCID: PMC2774924. 3. Lin CY, Vega VB, Thomsen JS, Zhang T, Kong SL, Xie M, et al. Whole-genome cartography of estrogen receptor alpha binding sites. PLoS Genet. 2007;3(6):e87. PubMed PMID: 17542648. 4. Frasor J, Danes JM, Komm B, Chang KC, Lyttle CR, Katzenellenbogen BS. Profiling of estrogen up- and down-regulated gene expression in human breast cancer cells: insights into gene networks and pathways underlying estrogenic control of proliferation and cell phenotype. Endocrinology. 2003;144(10):4562-74. PubMed PMID: 12959972. 5. Seth P, Porter D, Lahti-Domenici J, Geng Y, Richardson A, Polyak K. Cellular and molecular targets of estrogen in normal human breast tissue. Cancer Res. 2002;62(16):4540-4. Epub 2002/08/17. PubMed PMID: 12183401. 6. Perou CM, Borresen-Dale AL. Systems biology and genomics of breast cancer. Cold Spring Harb Perspect Biol. 2011;3(2). doi: 10.1101/cshperspect.a003293. PubMed PMID: 21047916; PubMed Central PMCID: PMC3039533. 7. Prat A, Parker JS, Karginova O, Fan C, Livasy C, Herschkowitz JI, et al. Phenotypic and molecular characterization of the claudin-low intrinsic subtype of breast cancer. Breast Cancer Res. 2010;12(5):R68. Epub 2010/09/04. doi: 10.1186/bcr2635. PubMed PMID: 20813035; PubMed Central PMCID: PMC3096954. 8. Prat A, Perou CM. Deconstructing the molecular portraits of breast cancer. Mol Oncol. 2011;5(1):5-23. Epub 2010/12/15. doi: 10.1016/j.molonc.2010.11.003. PubMed PMID: 21147047. 9. Ronneberg JA, Fleischer T, Solvang HK, Nordgard SH, Edvardsen H, Potapenko I, et al. Methylation profiling with a panel of cancer related genes: association with estrogen receptor, TP53 mutation status and expression subtypes in sporadic breast cancer. Mol Oncol. 2011;5(1):61-76. Epub 2011/01/08. doi: 10.1016/j.molonc.2010.11.004. PubMed PMID: 21212030. 10. Fackler MJ, Umbricht CB, Williams D, Argani P, Cruz LA, Merino VF, et al. Genome-wide methylation analysis identifies genes specific to breast cancer hormone receptor status and risk of recurrence. Cancer Res. 2011;71(19):6195-207. Epub 2011/08/10. doi: 10.1158/0008-5472.CAN-11-1630. PubMed PMID: 21825015. 11. Hill VK, Ricketts C, Bieche I, Vacher S, Gentle D, Lewis C, et al. Genome-wide DNA methylation profiling of CpG islands in breast cancer identifies novel genes associated with tumorigenicity. Cancer Res. 2011;71(8):2988-99. Epub 2011/03/03. doi: 10.1158/0008-5472.CAN-10-4026. PubMed PMID: 21363912. 12. Ung M, Ma X, Johnson KC, Christensen BC, Cheng C. Effect of estrogen receptor alpha binding on functional DNA methylation in breast cancer. Epigenetics. 2014;9(4):523-32. Epub 2014/01/18. doi: 10.4161/epi.27688. PubMed PMID: 24434785; PubMed Central PMCID: PMC4121363.
on September 9, 2018. © 2016 American Association for Cancer Research. mcr.aacrjournals.org Downloaded from
Author manuscripts have been peer reviewed and accepted for publication but have not yet been edited. Author Manuscript Published OnlineFirst on November 15, 2016; DOI: 10.1158/1541-7786.MCR-16-0283

25
13. Schlesinger Y, Straussman R, Keshet I, Farkash S, Hecht M, Zimmerman J, et al. Polycomb-mediated methylation on Lys27 of histone H3 pre-marks genes for de novo methylation in cancer. Nat Genet. 2007;39(2):232-6. Epub 2007/01/04. doi: 10.1038/ng1950. PubMed PMID: 17200670. 14. Kim KH, Roberts CW. Targeting EZH2 in cancer. Nat Med. 2016;22(2):128-34. doi: 10.1038/nm.4036. PubMed PMID: 26845405. 15. Vire E, Brenner C, Deplus R, Blanchon L, Fraga M, Didelot C, et al. The Polycomb group protein EZH2 directly controls DNA methylation. Nature. 2006;439(7078):871-4. Epub 2005/12/17. doi: 10.1038/nature04431. PubMed PMID: 16357870. 16. Kulis M, Esteller M. DNA methylation and cancer. Adv Genet. 2010;70:27-56. Epub 2010/10/06. doi: 10.1016/B978-0-12-380866-0.60002-2. PubMed PMID: 20920744. 17. Fan M, Yan PS, Hartman-Frey C, Chen L, Paik H, Oyer SL, et al. Diverse gene expression and DNA methylation profiles correlate with differential adaptation of breast cancer cells to the antiestrogens tamoxifen and fulvestrant. Cancer Res. 2006;66(24):11954-66. Epub 2006/12/21. doi: 10.1158/0008-5472.CAN-06-1666. PubMed PMID: 17178894. 18. Stone A, Valdes-Mora F, Gee JM, Farrow L, McClelland RA, Fiegl H, et al. Tamoxifen-induced epigenetic silencing of oestrogen-regulated genes in anti-hormone resistant breast cancer. PLoS One. 2012;7(7):e40466. Epub 2012/07/19. doi: 10.1371/journal.pone.0040466. PubMed PMID: 22808167; PubMed Central PMCID: PMC3393679. 19. Leu YW, Yan PS, Fan M, Jin VX, Liu JC, Curran EM, et al. Loss of estrogen receptor signaling triggers epigenetic silencing of downstream targets in breast cancer. Cancer Res. 2004;64(22):8184-92. Epub 2004/11/19. doi: 10.1158/0008-5472.CAN-04-2045. PubMed PMID: 15548683. 20. Marques M, Laflamme L, Gaudreau L. Estrogen receptor alpha can selectively repress dioxin receptor-mediated gene expression by targeting DNA methylation. Nucleic Acids Res. 2013;41(17):8094-106. Epub 2013/07/06. doi: 10.1093/nar/gkt595. PubMed PMID: 23828038; PubMed Central PMCID: PMC3783176. 21. Ariazi EA, Kraus RJ, Farrell ML, Jordan VC, Mertz JE. Estrogen-related receptor alpha1 transcriptional activities are regulated in part via the ErbB2/HER2 signaling pathway. Mol Cancer Res. 2007;5(1):71-85. PubMed PMID: 17259347. 22. Nagalla S, Chou JW, Willingham MC, Ruiz J, Vaughn JP, Dubey P, et al. Interactions between immunity, proliferation and molecular subtype in breast cancer prognosis. Genome Biol. 2013;14(4):R34. Epub 2013/04/27. doi: 10.1186/gb-2013-14-4-r34. PubMed PMID: 23618380; PubMed Central PMCID: PMC3798758. 23. Ritchie ME, Phipson B, Wu D, Hu Y, Law CW, Shi W, et al. limma powers differential expression analyses for RNA-sequencing and microarray studies. Nucleic Acids Res. 2015;43(7):e47. doi: 10.1093/nar/gkv007. PubMed PMID: 25605792; PubMed Central PMCID: PMC4402510. 24. Tusher VG, Tibshirani R, Chu G. Significance analysis of microarrays applied to the ionizing radiation response. Proc Natl Acad Sci U S A. 2001;98(9):5116-21. Epub 2001/04/20. doi: 10.1073/pnas.091062498. PubMed PMID: 11309499; PubMed Central PMCID: PMC33173. 25. Haughian JM, Pinto MP, Harrell JC, Bliesner BS, Joensuu KM, Dye WW, et al. Maintenance of hormone responsiveness in luminal breast cancers by suppression of Notch. Proc Natl Acad Sci U S A. 2012;109(8):2742-7. doi: 10.1073/pnas.1106509108.
on September 9, 2018. © 2016 American Association for Cancer Research. mcr.aacrjournals.org Downloaded from
Author manuscripts have been peer reviewed and accepted for publication but have not yet been edited. Author Manuscript Published OnlineFirst on November 15, 2016; DOI: 10.1158/1541-7786.MCR-16-0283

26
26. Pink JJ, Bilimoria MM, Assikis J, Jordan VC. Irreversible loss of the oestrogen receptor in T47D breast cancer cells following prolonged oestrogen deprivation. Br J Cancer. 1996;74(8):1227-36. PubMed PMID: 8883409. 27. Ellison-Zelski SJ, Solodin NM, Alarid ET. Repression of ESR1 through actions of estrogen receptor alpha and Sin3A at the proximal promoter. Mol Cell Biol. 2009;29(18):4949-58. Epub 2009/07/22. doi: 10.1128/MCB.00383-09. PubMed PMID: 19620290; PubMed Central PMCID: PMC2738295. 28. Neve RM, Chin K, Fridlyand J, Yeh J, Baehner FL, Fevr T, et al. A collection of breast cancer cell lines for the study of functionally distinct cancer subtypes. Cancer Cell. 2006;10(6):515-27. Epub 2006/12/13. doi: 10.1016/j.ccr.2006.10.008. PubMed PMID: 17157791; PubMed Central PMCID: PMC2730521. 29. Charafe-Jauffret E, Ginestier C, Monville F, Finetti P, Adelaide J, Cervera N, et al. Gene expression profiling of breast cell lines identifies potential new basal markers. Oncogene. 2006;25(15):2273-84. Epub 2005/11/17. doi: 10.1038/sj.onc.1209254. PubMed PMID: 16288205. 30. Yang J, Bielenberg DR, Rodig SJ, Doiron R, Clifton MC, Kung AL, et al. Lipocalin 2 promotes breast cancer progression. Proc Natl Acad Sci U S A. 2009;106(10):3913-8. Epub 2009/02/25. doi: 0810617106 [pii] 10.1073/pnas.0810617106. PubMed PMID: 19237579. 31. Li S, Xie Y, Zhang W, Gao J, Wang M, Zheng G, et al. Interferon alpha-inducible protein 27 promotes epithelial-mesenchymal transition and induces ovarian tumorigenicity and stemness. J Surg Res. 2015;193(1):255-64. Epub 2014/08/12. doi: 10.1016/j.jss.2014.06.055. PubMed PMID: 25103640. 32. Augereau P, Badia E, Balaguer P, Carascossa S, Castet A, Jalaguier S, et al. Negative regulation of hormone signaling by RIP140. J Steroid Biochem Mol Biol. 2006;102(1-5):51-9. PubMed PMID: 17056252. 33. Gurevich I, Flores AM, Aneskievich BJ. Corepressors of agonist-bound nuclear receptors. Toxicol Appl Pharmacol. 2007;223(3):288-98. Epub 2007/07/14. doi: 10.1016/j.taap.2007.05.019. PubMed PMID: 17628626; PubMed Central PMCID: PMC2148130. 34. Hwang C, Giri VN, Wilkinson JC, Wright CW, Wilkinson AS, Cooney KA, et al. EZH2 regulates the transcription of estrogen-responsive genes through association with REA, an estrogen receptor corepressor. Breast Cancer Res Treat. 2008;107(2):235-42. Epub 2007/04/25. doi: 10.1007/s10549-007-9542-7. PubMed PMID: 17453341. 35. Ye Y, Xiao Y, Wang W, Yearsley K, Gao JX, Barsky SH. ERalpha suppresses slug expression directly by transcriptional repression. Biochem J. 2008;416(2):179-87. Epub 2008/07/01. doi: 10.1042/BJ20080328. PubMed PMID: 18588516; PubMed Central PMCID: PMC2584332. 36. Stossi F, Madak-Erdogan Z, Katzenellenbogen BS. Estrogen receptor alpha represses transcription of early target genes via p300 and CtBP1. Mol Cell Biol. 2009;29(7):1749-59. Epub 2009/02/04. doi: 10.1128/MCB.01476-08. PubMed PMID: 19188451; PubMed Central PMCID: PMC2655624. 37. Cvoro A, Tzagarakis-Foster C, Tatomer D, Paruthiyil S, Fox MS, Leitman DC. Distinct roles of unliganded and liganded estrogen receptors in transcriptional repression. Mol Cell. 2006;21(4):555-64. Epub 2006/02/18. doi: 10.1016/j.molcel.2006.01.014. PubMed PMID: 16483936.
on September 9, 2018. © 2016 American Association for Cancer Research. mcr.aacrjournals.org Downloaded from
Author manuscripts have been peer reviewed and accepted for publication but have not yet been edited. Author Manuscript Published OnlineFirst on November 15, 2016; DOI: 10.1158/1541-7786.MCR-16-0283

27
38. Green KA, Carroll JS. Oestrogen-receptor-mediated transcription and the influence of co-factors and chromatin state. Nat Rev Cancer. 2007;7(9):713-22. Epub 2007/08/28. doi: 10.1038/nrc2211. PubMed PMID: 17721435. 39. Manavathi B, Dey O, Gajulapalli VN, Bhatia RS, Bugide S, Kumar R. Derailed estrogen signaling and breast cancer: an authentic couple. Endocr Rev. 2013;34(1):1-32. doi: 10.1210/er.2011-1057. PubMed PMID: 22947396; PubMed Central PMCID: PMC3565105. 40. Kiskinis E, Hallberg M, Christian M, Olofsson M, Dilworth SM, White R, et al. RIP140 directs histone and DNA methylation to silence Ucp1 expression in white adipocytes. EMBO J. 2007;26(23):4831-40. Epub 2007/11/02. doi: 10.1038/sj.emboj.7601908. PubMed PMID: 17972916; PubMed Central PMCID: PMC2099470. 41. Mann M, Cortez V, Vadlamudi RK. Epigenetics of Estrogen Receptor Signaling: Role in Hormonal Cancer Progression and Therapy. Cancers (Basel). 2011;3(3):1691-707. Epub 2011/08/05. doi: 10.3390/cancers3021691. PubMed PMID: 21814622; PubMed Central PMCID: PMC3147309. 42. Magnani L, Lupien M. Chromatin and epigenetic determinants of estrogen receptor alpha (ESR1) signaling. Mol Cell Endocrinol. 2014;382(1):633-41. doi: 10.1016/j.mce.2013.04.026. PubMed PMID: 23684889. 43. Osmanbeyoglu HU, Lu KN, Oesterreich S, Day RS, Benos PV, Coronnello C, et al. Estrogen represses gene expression through reconfiguring chromatin structures. Nucleic Acids Res. 2013;41(17):8061-71. doi: 10.1093/nar/gkt586. PubMed PMID: 23821662; PubMed Central PMCID: PMC3783169. 44. Bell JS, Kagey JD, Barwick BG, Dwivedi B, McCabe MT, Kowalski J, et al. Factors affecting the persistence of drug-induced reprogramming of the cancer methylome. Epigenetics. 2016;11(4):273-87. doi: 10.1080/15592294.2016.1158364. PubMed PMID: 27082926; PubMed Central PMCID: PMCPMC4889262. 45. Shi B, Liang J, Yang X, Wang Y, Zhao Y, Wu H, et al. Integration of estrogen and Wnt signaling circuits by the polycomb group protein EZH2 in breast cancer cells. Mol Cell Biol. 2007;27(14):5105-19. Epub 2007/05/16. doi: 10.1128/MCB.00162-07. PubMed PMID: 17502350; PubMed Central PMCID: PMC1951944. 46. Lee ST, Li Z, Wu Z, Aau M, Guan P, Karuturi RK, et al. Context-specific regulation of NF-kappaB target gene expression by EZH2 in breast cancers. Mol Cell. 2011;43(5):798-810. Epub 2011/09/03. doi: 10.1016/j.molcel.2011.08.011. PubMed PMID: 21884980. 47. Fuks F, Burgers WA, Brehm A, Hughes-Davies L, Kouzarides T. DNA methyltransferase Dnmt1 associates with histone deacetylase activity. Nat Genet. 2000;24(1):88-91. doi: 10.1038/71750. PubMed PMID: 10615135. 48. Fuks F, Burgers WA, Godin N, Kasai M, Kouzarides T. Dnmt3a binds deacetylases and is recruited by a sequence-specific repressor to silence transcription. EMBO J. 2001;20(10):2536-44. doi: 10.1093/emboj/20.10.2536. PubMed PMID: 11350943; PubMed Central PMCID: PMC125250. 49. Cai Y, Geutjes EJ, de Lint K, Roepman P, Bruurs L, Yu LR, et al. The NuRD complex cooperates with DNMTs to maintain silencing of key colorectal tumor suppressor genes. Oncogene. 2014;33(17):2157-68. doi: 10.1038/onc.2013.178. PubMed PMID: 23708667; PubMed Central PMCID: PMC3883927.
on September 9, 2018. © 2016 American Association for Cancer Research. mcr.aacrjournals.org Downloaded from
Author manuscripts have been peer reviewed and accepted for publication but have not yet been edited. Author Manuscript Published OnlineFirst on November 15, 2016; DOI: 10.1158/1541-7786.MCR-16-0283

28
FIGURE LEGENDS
Figure 1. Candidate ERα targets for DNA methylation and ERα mRNA levels in the cell lines
used to identify the targets. A, ERα mRNA levels in matched wild-type (wt) fulvestrant (FUL) -
resistant, estrogen deprivation (ED) -resistant, and ED-resistant re-exposed to E2 (ED/E2) cell
line models at the indicated weeks (wk) of derivation. The selection process schema is shown in
Supplementary Fig. S1. ERα mRNA levels normalized to TBP mRNA were measured by RT-
qPCR. B, The 39 candidate ERα DNA methylation targets. Cell lines were transcriptionally
profiled using Agilent Human Gene Expression 4×44K v2 microarrays. Shown is the intersection
of DAC-regulated genes and genes whose expression consistently showed an inverse relationship
to ERα expression/activity across all wild-type and antihormone-resistant cell lines. Genes are
ranked by their average fold-increase in expression in T47D/FUL, T47D/ED1, and T47D/ED2
versus wild-type T47D cells. Note, profiles of T47D/ED2/E2 week 38 and not week 24 cells
were compared against T47D/ED2 cells for significantly differentially expressed genes. Basal-
up/luminal-down genes were established according to references in Supplementary Excel File
S10.
Figure 2. Evaluation of the ERα DNA methylation target metagene in a 2,116 sample BC
cohort. A, ERα status and ERα status-associated metagene scores, B, intrinsic subtype, C,
luminobasal metagene scores, D, CD44+/CD24-/low metagene scores and E, EMT metagene
scores were plotted against ERα DNA methylation target metagene scores in the 2,116 sample
BC cohort. Metagene scores were used to divide the BC samples into low, medium and high
tertiles. F, Kaplan-Meier survival curves of ERα DNA methylation metagene scores versus
DMFS. Patients were grouped based on metagene scores split at the 10th, 50th and 90th percentile.
on September 9, 2018. © 2016 American Association for Cancer Research. mcr.aacrjournals.org Downloaded from
Author manuscripts have been peer reviewed and accepted for publication but have not yet been edited. Author Manuscript Published OnlineFirst on November 15, 2016; DOI: 10.1158/1541-7786.MCR-16-0283

29
Significance was assessed by log-rank tests. The number of patients in each group are shown in
the legends; numbers of patients are less than the total cohort size of 2,116 due to missing
survival data.
Figure 3. Evaluation of the low- and high-expression ERα DNA methylation target metagenes
in the combined BC cohort. A, Kaplan-Meier survival curves of the low and high-expression
ERα DNA methylation metagenes. Genes were parsed into the low versus high metagene
according to how each gene’s expression level tended to associate with poor DMFS. In the
survival curves, patients were grouped based on metagene scores split at the 50th percentile. The
log-rank test P-value and the number of patients in each group are shown in the legends. B, Low-
expression, and C, high-expression ERα DNA methylation metagene scores plotted against
tumor grade as well as proliferation, tumor suppressor, focal adhesion and Th1 immune response
metagene tertiles in the BC cohort.
Figure 4. LCN2 and IFI27 expression inversely relates to ERα expression/activity. A-E, Effect
of long-term estrogen deprivation, FUL, and E2 re-exposure on ERα, LCN2 and slug expression.
In T47D-based cell lines, both estrogen deprivation and FUL led to silencing of ERα mRNA (A)
and protein levels (B-C), followed by dramatic induction of LCN2 mRNA (A) and protein (B-C).
In T47D/ED2/E2 versus T47D/ED2 cells, long-term E2 re-exposure repressed LCN2 (D). In
MCF7-based cell lines, FUL exposure up to 12 weeks repressed ERα and induced LCN2
expression, but by 16 weeks of FUL, ERα rebounded and LCN2 was again silenced (E). Slug
protein levels increased or decreased after similar changes were seen in LCN2 expression (B-E).
F, Effect of long term estrogen deprivation and FUL on IFI27 expression. IFI27 RNA was
on September 9, 2018. © 2016 American Association for Cancer Research. mcr.aacrjournals.org Downloaded from
Author manuscripts have been peer reviewed and accepted for publication but have not yet been edited. Author Manuscript Published OnlineFirst on November 15, 2016; DOI: 10.1158/1541-7786.MCR-16-0283

30
silenced in ERα-positive wild-type T47D cells, highly up-regulated in ERα-low/negative
T47D/FUL and T47D/ED cells, and again silenced by re-exposure to E2 in T47D/ED/E2 cells.
RNA levels were measured by RT-qPCR and proteins levels by immunoblotting.
Figure 5. LCN2 and IFI27 CpG methylation levels are directly related to ERα
expression/activity. A, Decreased LCN2 and IFI27 CpG methylation in ERα-low/negative cell
lines compared to wild-type T47D cells. B, Increased LCN2 and IFI27 CpG methylation in E2 re-
exposed T47D/ED2/E2 compared to T47D/ED2 cells. C, ERα, PgR, LCN2 and IFI27 mRNA
expression in lentiviral vector control (VC) and ERα infected cells. ERα and the ERα-responsive
gene PgR were substantially up-regulated while LCN2 and IFI27 were down-regulated in cells
expressing lentiviral ERα and maintained in E2. RNA levels normalized to TBP were measured
by RT-qPCR. D, Increased CpG methylation levels of LCN2 and IFI27 in lentiviral ERα
compared to VC cells. (A, C) Significance was assessed by repeated measures 1-way ANOVA
followed by Dunnett's multiple comparison tests for subgroup analysis. (B) Significance was
assessed by one-tailed paired t tests. Genomic DNA was bisulfite treated and methylation was
quantitated by pyrosequencing. TSS, transcriptional start site.
Figure 6. LCN2 and IFI27 expression inversely associates while CpG methylation directly
associates with ERα status in BC cell lines. A, Characterization of HER2 and ERα protein
expression. B, LCN2 protein and C, IFI27 RNA expression levels. For both LCN2 and IFI27,
expression levels were scaled relative to their median value (ZR751 cells for LCN2, and T47D
cells for IFI27). LCN2 and IFI27 expression inversely associated with ERα-positive status. For
both genes, expression values were log2 transformed because their variances were significantly
on September 9, 2018. © 2016 American Association for Cancer Research. mcr.aacrjournals.org Downloaded from
Author manuscripts have been peer reviewed and accepted for publication but have not yet been edited. Author Manuscript Published OnlineFirst on November 15, 2016; DOI: 10.1158/1541-7786.MCR-16-0283

31
different between ERα-positive and ERα-negative cell lines (both P-values < 0.0001, F test).
Significance was assessed using two-tailed unpaired t tests. HER2, ERα and LCN2 protein levels
were measured by immunoblotting and IFI27 mRNA levels by RT-qPCR. D, Correlation
between CpG methylation and expression in BC cell lines. Correlations were determined using
Spearman's rho coefficient and a one-tailed P-value. E, LCN2 and IFI27 CpG methylation levels
positively associated with ERα status. Only those CpG sites which showed a significant inverse
correlation between methylation and gene expression by Spearman's rho were evaluated for an
association with ERα status. Significance was assessed considering all tested CpG sites together
using two-tailed paired t tests in which CpG methylation levels were paired by site location.
Individual CpG sites are presented to show pairings. The line in the ERα-positive and -negative
subgroups represents the mean methylation value. Methylation levels were quantitated by
pyrosequencing of bisulfite-treated gDNA.
Figure 7. Model of ERα-mediated silencing via DNA methylation. ERα initially represses
transcription by recruiting corepressors (CoRs) and HDACs that in turn recruit EZH2 to modify
histones with repressive H3K27me3 marks. EZH2, a component of PRC2, then tethers DNMTs
to catalyze C methylation in CpG dinucleotides to maintain long-term silencing. Gene silencing
of basal markers, CSC and EMT genes may in part program ERα BCs as the luminal subtype.
See Discussion for additional details.
on September 9, 2018. © 2016 American Association for Cancer Research. mcr.aacrjournals.org Downloaded from
Author manuscripts have been peer reviewed and accepted for publication but have not yet been edited. Author Manuscript Published OnlineFirst on November 15, 2016; DOI: 10.1158/1541-7786.MCR-16-0283

C
β-actin-
ERα-
LCN2-
Slug-
B
wt
T47D
24
h
1 3 6 10 16 20 28 36
T47D/ED1 cells
Estrogen deprivation
weeks
ERα-
LCN2-
Slug-
β-actin-
F
0
500
1000
1500
2000
FULwk36
ED1wk52
ED2wk62
ED2/E2wk38
IFI2
7 / T
BP
mR
NA
level
Wild-type
T47D-basedcells
wt
T47D
T47D/FUL cells
1 8 12 16 21 2324
h weeks
100 nmol/L FUL exposure
D
wt
T47D
T47D
/ED
2 T47D/ED2/E2 cells
642 8 10 12 14 16 20 241
weeks
ERα-
LCN2-
Slug-
β-actin-
1 nmol/L E2 exposure
E
β-actin-
ERα-
LCN2-
Slug-
wt
MC
F-7
MCF7/FUL cells
1 8 12 16 21 2324
h weeks
100 nmol/L FUL exposure
A
0
0.2
0.4
0.6
0.8
1
0
25
50
75
100
125
150
175
200
225T47D/ED2 cells
LCN2 ERα
10 15 20 25 30 35 40 450 5
ERα
/PU
M1 m
RN
A l
evel
LC
N2/P
UM
1 m
RN
A l
evel
Weeks of estrogen deprivation
4on September 9, 2018. © 2016 American Association for Cancer Research. mcr.aacrjournals.org Downloaded from
Author manuscripts have been peer reviewed and accepted for publication but have not yet been edited. Author Manuscript Published OnlineFirst on November 15, 2016; DOI: 10.1158/1541-7786.MCR-16-0283
on September 9, 2018. © 2016 American Association for Cancer Research. mcr.aacrjournals.org Downloaded from
Author manuscripts have been peer reviewed and accepted for publication but have not yet been edited. Author Manuscript Published OnlineFirst on November 15, 2016; DOI: 10.1158/1541-7786.MCR-16-0283

Published OnlineFirst November 15, 2016.Mol Cancer Res Eric A Ariazi, John C. Taylor, Michael A Black, et al. Basal, Stem Cell, and EMT GenesA New Role for ERalpha: Silencing via DNA methylation of
Updated version
10.1158/1541-7786.MCR-16-0283doi:
Access the most recent version of this article at:
Material
Supplementary
http://mcr.aacrjournals.org/content/suppl/2017/01/20/1541-7786.MCR-16-0283.DC1
Access the most recent supplemental material at:
Manuscript
Authoredited. Author manuscripts have been peer reviewed and accepted for publication but have not yet been
E-mail alerts related to this article or journal.Sign up to receive free email-alerts
Subscriptions
Reprints and
To order reprints of this article or to subscribe to the journal, contact the AACR Publications
Permissions
Rightslink site. Click on "Request Permissions" which will take you to the Copyright Clearance Center's (CCC)
.http://mcr.aacrjournals.org/content/early/2016/11/15/1541-7786.MCR-16-0283To request permission to re-use all or part of this article, use this link
on September 9, 2018. © 2016 American Association for Cancer Research. mcr.aacrjournals.org Downloaded from
Author manuscripts have been peer reviewed and accepted for publication but have not yet been edited. Author Manuscript Published OnlineFirst on November 15, 2016; DOI: 10.1158/1541-7786.MCR-16-0283
![[ 1 ] · [ 2 ] Community Service-Learning in Canadian Higher Education Alison Taylor1, Shauna Butterwick1, Milosh Raykov2 Stephanie Glick1, Nasim Peikazadi1, Shadi Mehrabi3 1University](https://img.pdfslide.us/doc/110x75/5f0c33bd7e708231d4343e64/-1-2-community-service-learning-in-canadian-higher-education-alison-taylor1.jpg)


![[ 1 ] - University of Alberta · PDF filein Canadian Higher Education Alison Taylor1, ... literature on the role, benefits, ... and cultural backgrounds](https://img.pdfslide.us/doc/110x75/5aa952127f8b9a9a188cb799/-1-university-of-alberta-canadian-higher-education-alison-taylor1-literature.jpg)
![Validation of the (anti-) ERα CALUX bioassay ERa Calux...validation of the ERα CALUX bioassay (agonistic and antagonistic mode) according to the OECD guidelines for validation [2]](https://img.pdfslide.us/doc/110x75/5e63fa0741abdf46ef13e550/validation-of-the-anti-er-calux-bioassay-era-calux-validation-of-the-er.jpg)