Embed Size (px)
Citation preview

SCHEDULING MANUFACTURING SYSTEMS IN AN AGILE ENVIRONMENT
Author: David He, Astghik Babayan, Andrew Kusiak
By: Carl Haehl
Date: 11/18/09
Introduction
Many companies want to produce a low cost customized product in a short period of time.
In order to do this “machining-driven” or an “assembly-driven” strategy can be used.
“machine-driven” is complex machining and simple assembly
“assembly-driven” is simple machining and complex assembly
This paper is written specifically for “assembly-driven” strategies geared towards agile manufacturing
The end result is to obtain heuristics for effectively solving the scheduling problems
Problems, Models and Design Principles
Problem: To assign parts, assemblies, and subassemblies to the machines and determine the most efficient order to minimize maximum completion time (Cmax).
Models: A digraph is used to layout the assembly process. Three types of assembly processes are considered. Single product with simple assembly sequence (Gs) Single product with complex assembly sequence (Gc) Multiple products (N)
Most processes are concerned with multiple products and that is the most important model but the first two must be understood in order to create a simplified model of multiple products.
Review of Similar Problems
Many have done similar research on assembly-driven strategies, and have created accurate models to minimize time to completion. (Information on these is listed in section 3)
Nobody has created a strategy that uses simple and complex digraphs
The authors consider digraphs to be the best structural information of the products
What is a Digraph?
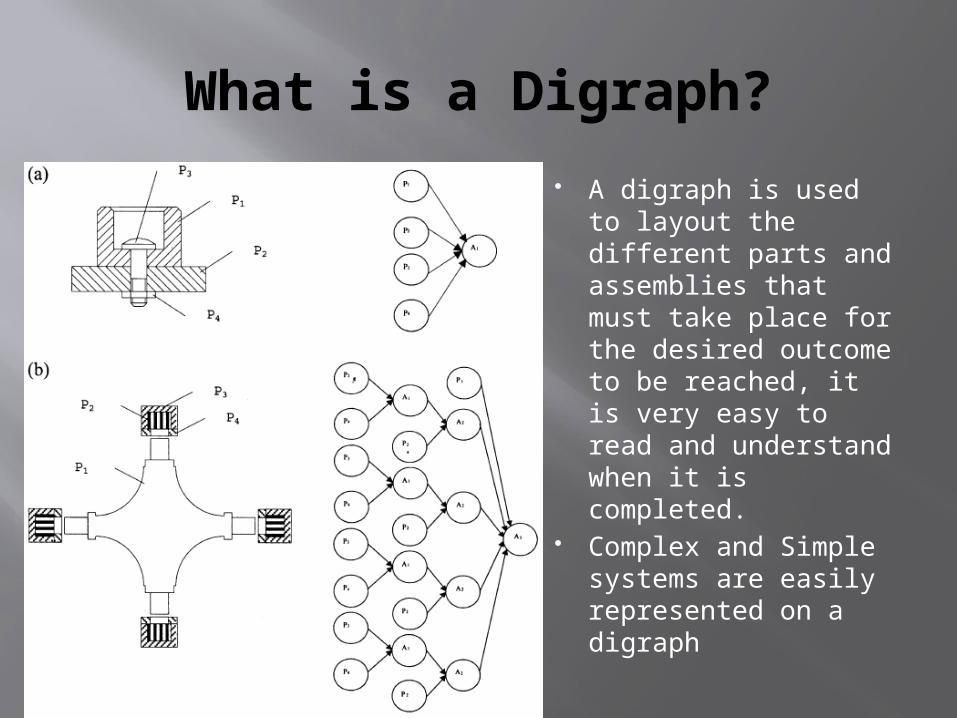
A digraph is used to layout the different parts and assemblies that must take place for the desired outcome to be reached, it is very easy to read and understand when it is completed.
Complex and Simple systems are easily represented on a digraph

No Scheduling Problems Solved in this Paper?
In reading over this technical paper you will notice they never solve a scheduling problem with the proposed method
The reasoning is that the problems considered are similar to “Flow Shop and Parallel Machine Shop” (FSPM) scheduling problems, which there is already ample resources for solving
Only the setup to be solved is considered
The objective
Minimize the maximum completion time Total machining time of all parts cannot
be greater than the maximum completion time
Ensure a part can be assigned to one machine only
An assembly or subassembly cannot begin until all required parts are completed

Method for Solving
Two parts to solving a scheduling problem in in agile manufacturing Develop an effective solution method for
solving the problem Develop methods for evaluating the
effectiveness of the solution obtained
Solution Method for Gc (Heuristic Algorithm 1)
Obtain an optimal aggregate schedule S(Gc) for complex digraph Gc using Theorem 2 from Kusaik [1]
Construct a simple digraph Gs From S(Gc) Solve models

Solution Method for N-Products(Heuristic Algorithm 2)
Construct a complex digraph by connecting the assembly nodes of N-Products to a dummy final assembly node (Ad) where the time for Ad is zero
Apply Heuristic Algorithm 1 to solve the Gc scheduling problem for the complex digraph constructed in previous step
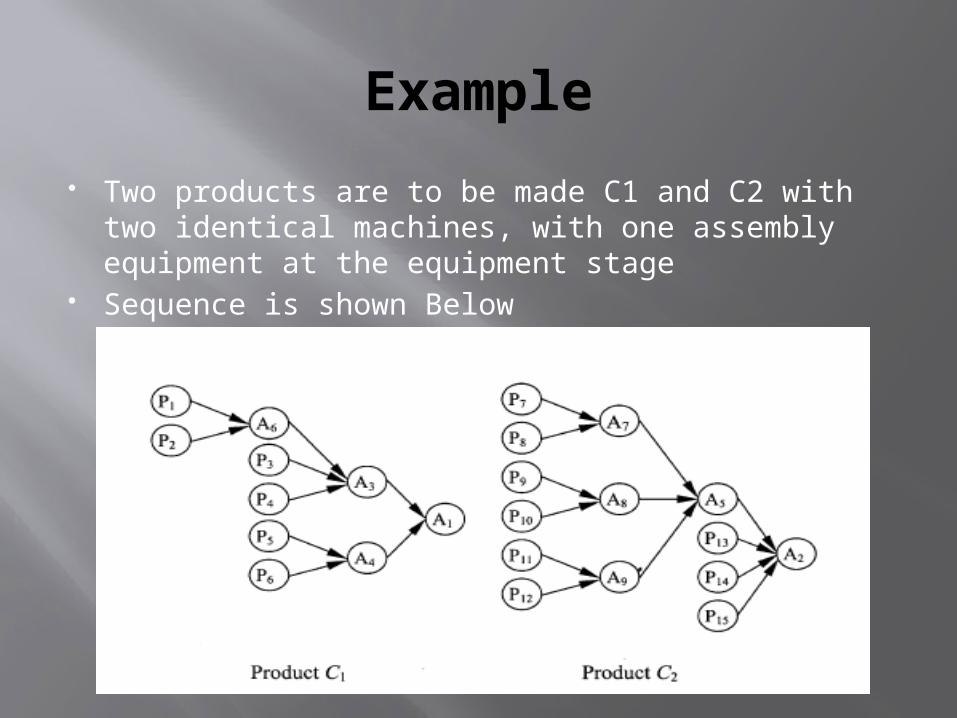
Example
Two products are to be made C1 and C2 with two identical machines, with one assembly equipment at the equipment stage
Sequence is shown Below
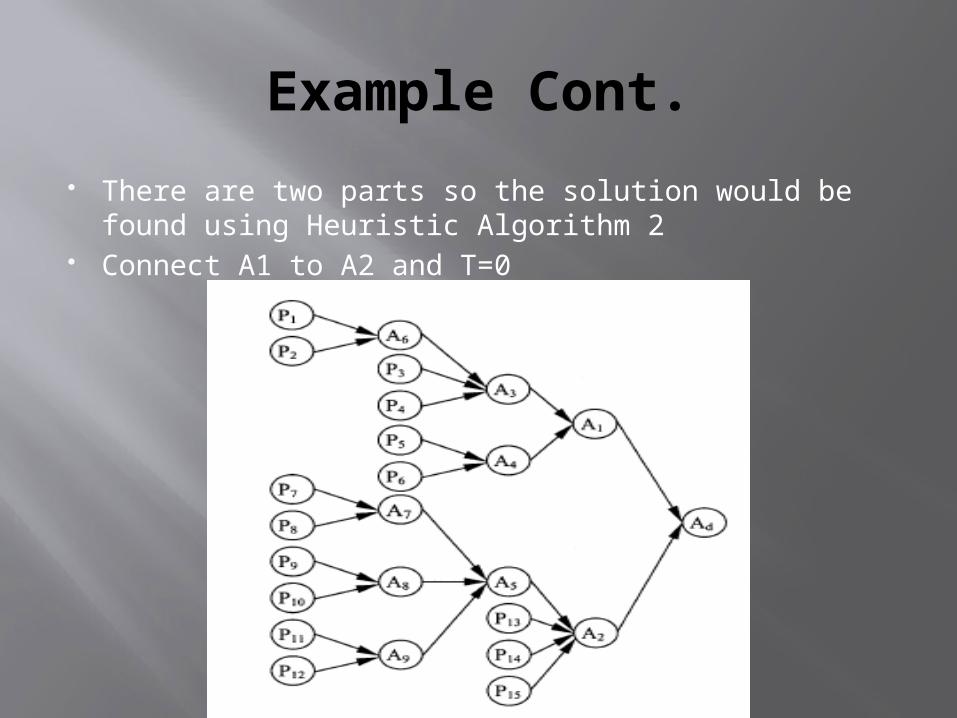
Example Cont.
There are two parts so the solution would be found using Heuristic Algorithm 2
Connect A1 to A2 and T=0
Example Cont.
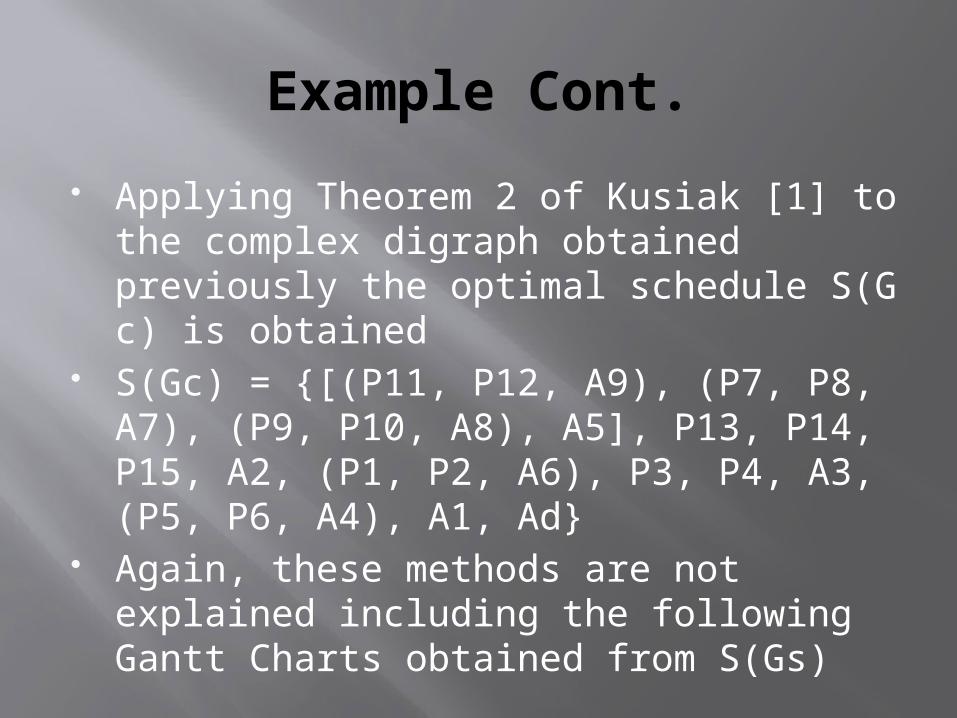
Applying Theorem 2 of Kusiak [1] to the complex digraph obtained previously the optimal schedule S(G c) is obtained
S(Gc) = {[(P11, P12, A9), (P7, P8, A7), (P9, P10, A8), A5], P13, P14, P15, A2, (P1, P2, A6), P3, P4, A3, (P5, P6, A4), A1, Ad}
Again, these methods are not explained including the following Gantt Charts obtained from S(Gs)
Example Cont.
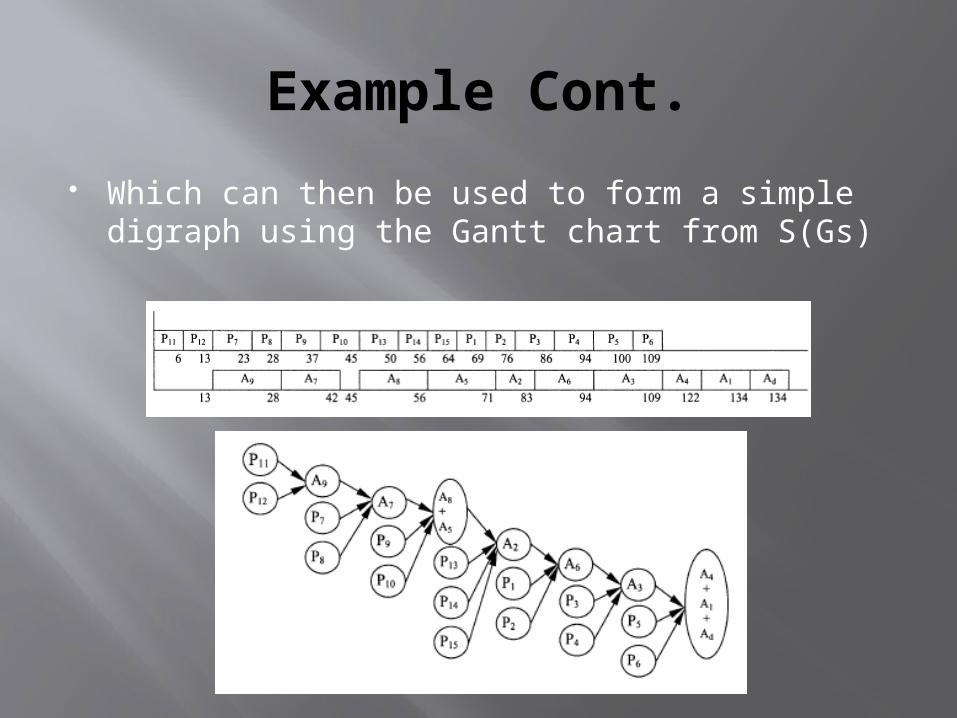
Which can then be used to form a simple digraph using the Gantt chart from S(Gs)

Testing of Methods
A standard method of testing the effectiveness of a heuristic is to compare it against a lower on the optimal solution
A lower bound can be obtained by the fact that assembly work cannot take place until all the previous parts needed are complete
This is computed by :
Notation
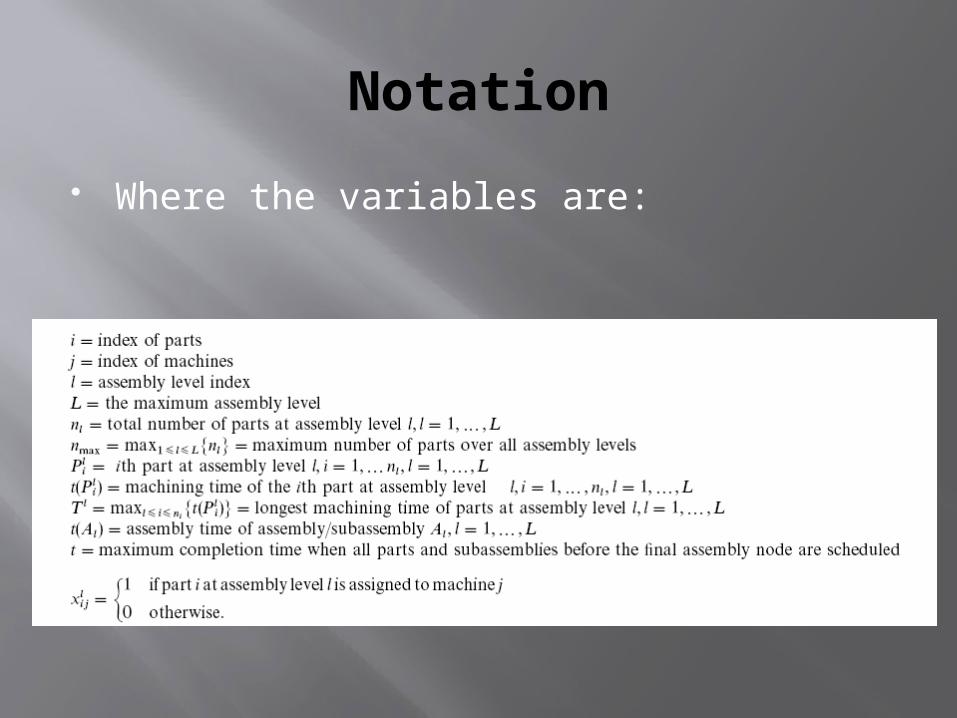
Where the variables are:
Results
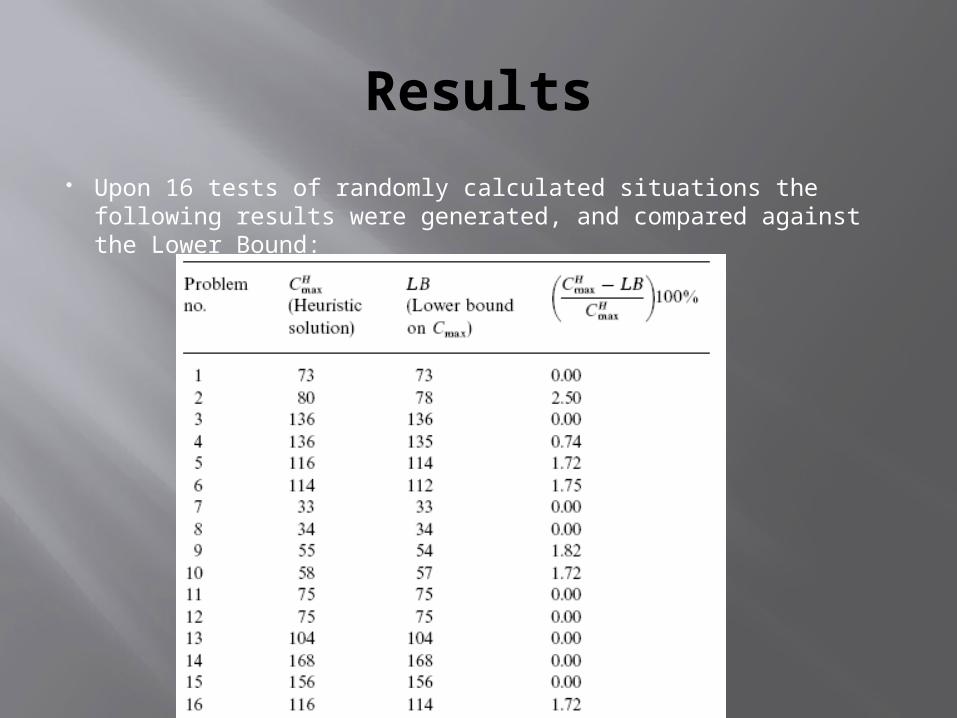
Upon 16 tests of randomly calculated situations the following results were generated, and compared against the Lower Bound:
Conclusion
If producing customized products in a short time frame with an assembly-driven process, then this method appears to be very helpful
From the test runs, it can be seen that on the high end an error from ideal is 2.5% and on the low end it was able to reach 0% in several situations
However, the no problems were solved in the paper, only the formulating of the problems in the context of agile manufacturing to develop optimal or near optimal operating processes
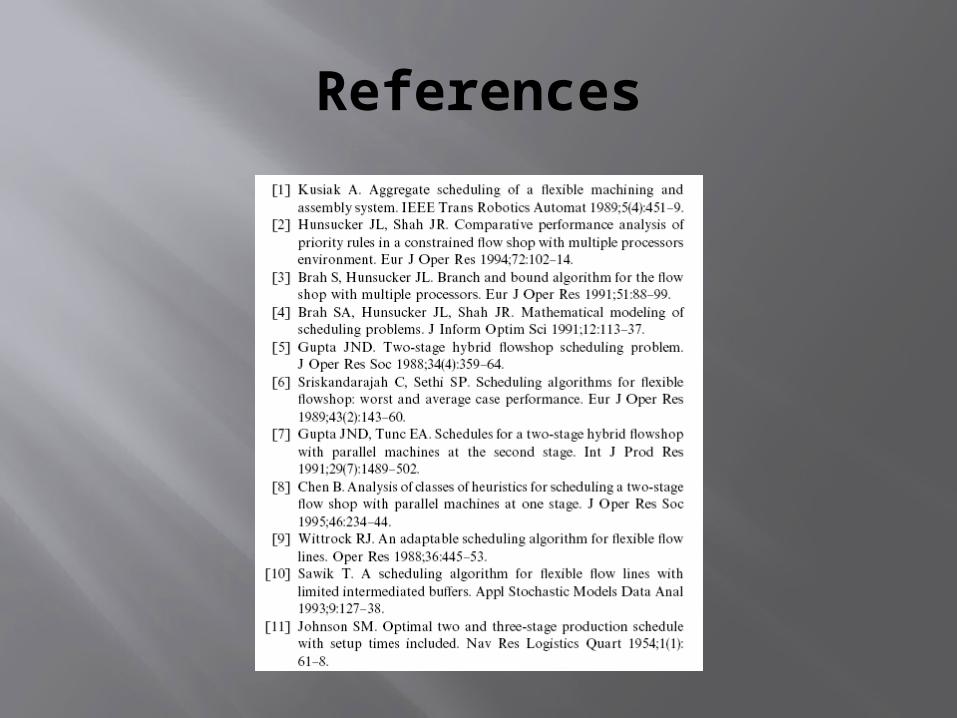
References
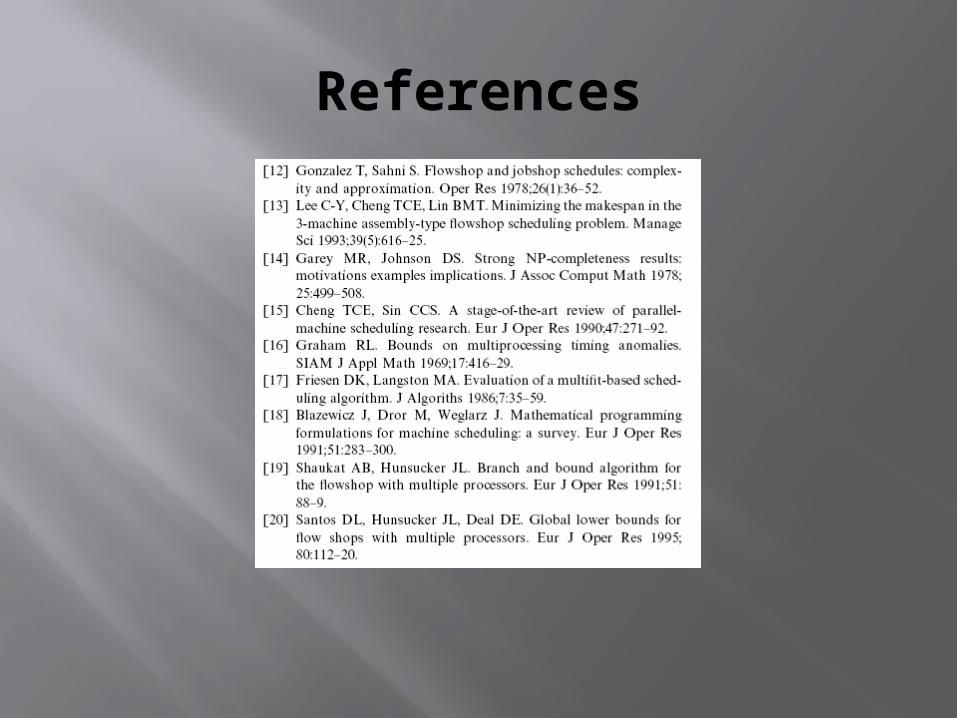
References
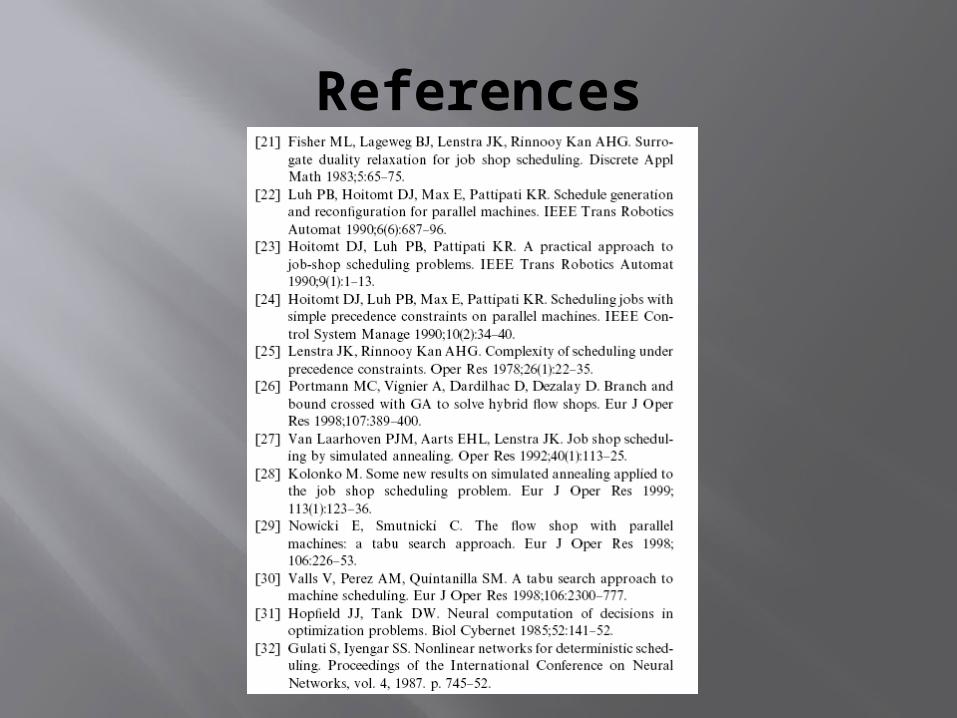
References
References
References