Embed Size (px)
Citation preview
Author : Chengwei Wang, Vanish Talwar*, Karsten Schwan, Parthasarathy Ranganathan*Conference: IEEE 2010 Network Operations and Management Symposium (NOMS)Advisor: Yuh-Jye LeeReporter: Yi-Hsiang YangEmail: [email protected]
12011/06/09
OutlineIntroductionProblem DescriptionEbAT OverviewEntropy Time SeriesEvaluation With Distributed Online
ServiceDiscussion: Using Hadoop ApplicationsConclusions And Future Work
22011/06/09
Introduction
• The online detection of anomalies • Detection must operate automatically• No need for prior knowledge about normal or
anomalous behaviors• Apply to multiple levels of abstraction and
subsystems and in large-scale systems
32011/06/09
Introduction • EbAT-Entropy-based Anomaly Testing• EbAT analyzes metric distributions rather
than individual metric thresholds• Use entropy as a measurement
2011/06/09 4
Introduction Use online tools
Spike Detecting (visually or using time series analysis)Signal Processing Subspace Method – to identify anomalies in entropy
time series in generalDetect anomalies
Not well understood (i.e., no prior models) Have not been experienced previously
2011/06/09 5
ContributionsA novel metric distribution-based method for anomaly
detection using entropyA hierarchical aggregation of entropy time series via
multiple analytical methodsAn evaluation with two typical utility cloud scenarios
Outperforms threshold-based methods on average 57.4% in F1 score
59.3% on average in false alarm rate with a ’near-optimum’ threshold-based method
2011/06/09 6
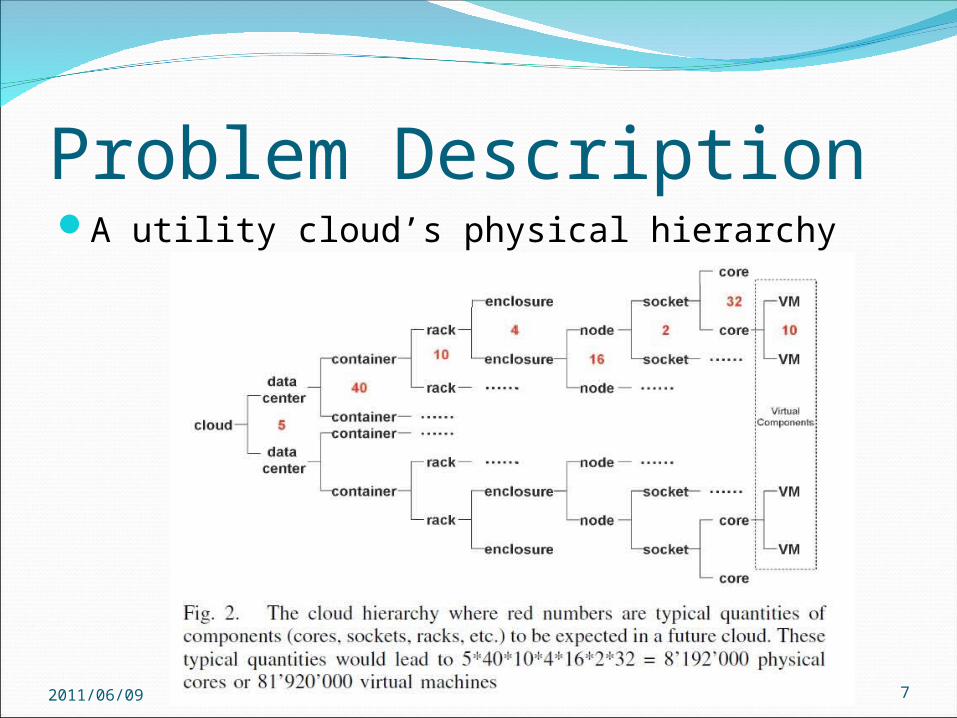
Problem DescriptionA utility cloud’s physical hierarchy
2011/06/09 7
Problem Description- Utility cloud’s Exascale
10M physical cores, there may be up to 10 virtual machines per node (or per core)
DynamismUtility clouds serve as a general computing facilityHeterogeneous applications includedApplications tend to have different workload patternsOnline management of virtual machines make a utility
cloud more dynamic
2011/06/09 8
State of the ArtThreshold-Based Approaches
Firstly set up upper/lower bounds for each metricAny of the metric observation violates a threshold limit
An alarm of anomaly is triggeredWidely used with advantages of simplicity and ease of
visual presentationIntrinsic shortcomings
Incremental False Alarm Rate (FAR)n metrics: m1, m2 ... mn for each mi the FAR is ri
overall FAR50 metrics with FAR 1/250 each (1 false alarm every
250 samples), there will be 50/250 = 1/5
2011/06/09 9
State of the Art Detection after the Fact
Consider 100 Web Application Servers (WAS)Memory use is slowly increasing
When one of the WASes raises an alarm because it crosses the thresholdAll other 99 WASes raise
Poor ScalabilityNo longer efficient to monitor metrics individually
Statistical MethodsCan’t deal with scale of cloud computing systems
With high computing overheads Require prior knowledge about application SLOs
2011/06/09 10
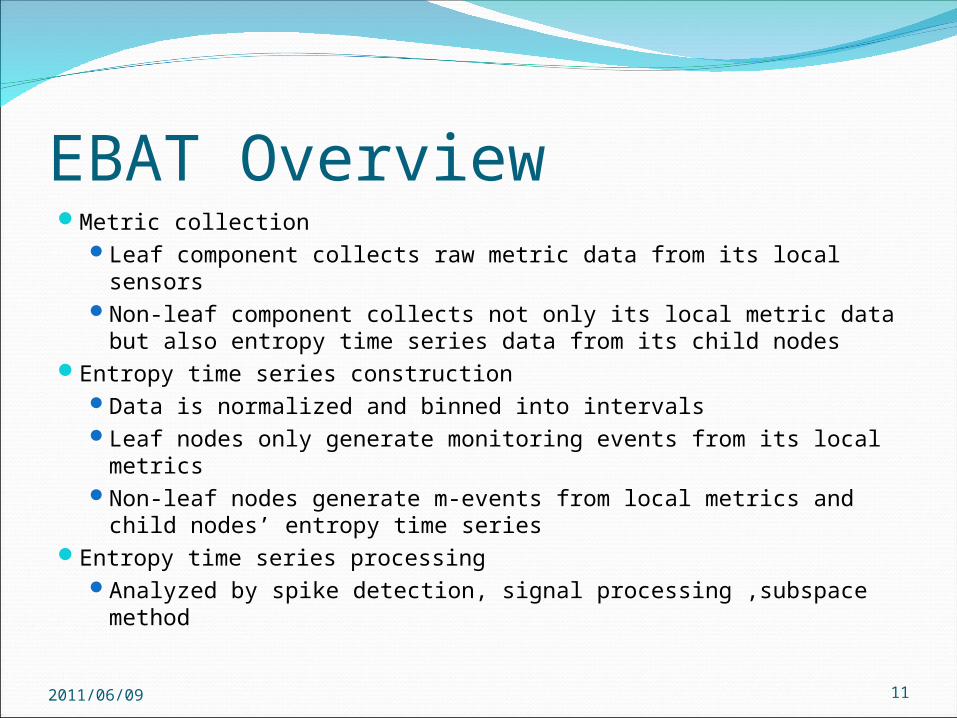
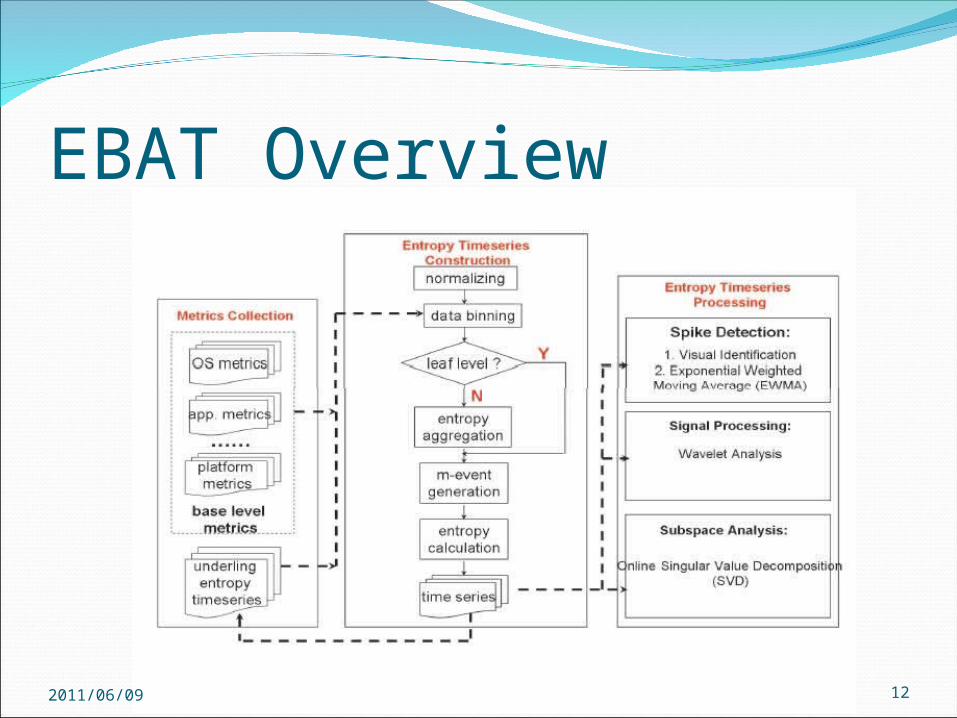
EBAT OverviewMetric collection
Leaf component collects raw metric data from its local sensorsNon-leaf component collects not only its local metric data but
also entropy time series data from its child nodesEntropy time series construction
Data is normalized and binned into intervalsLeaf nodes only generate monitoring events from its local metricsNon-leaf nodes generate m-events from local metrics and child
nodes’ entropy time seriesEntropy time series processing
Analyzed by spike detection, signal processing ,subspace method
2011/06/09 11
EBAT Overview
2011/06/09 12
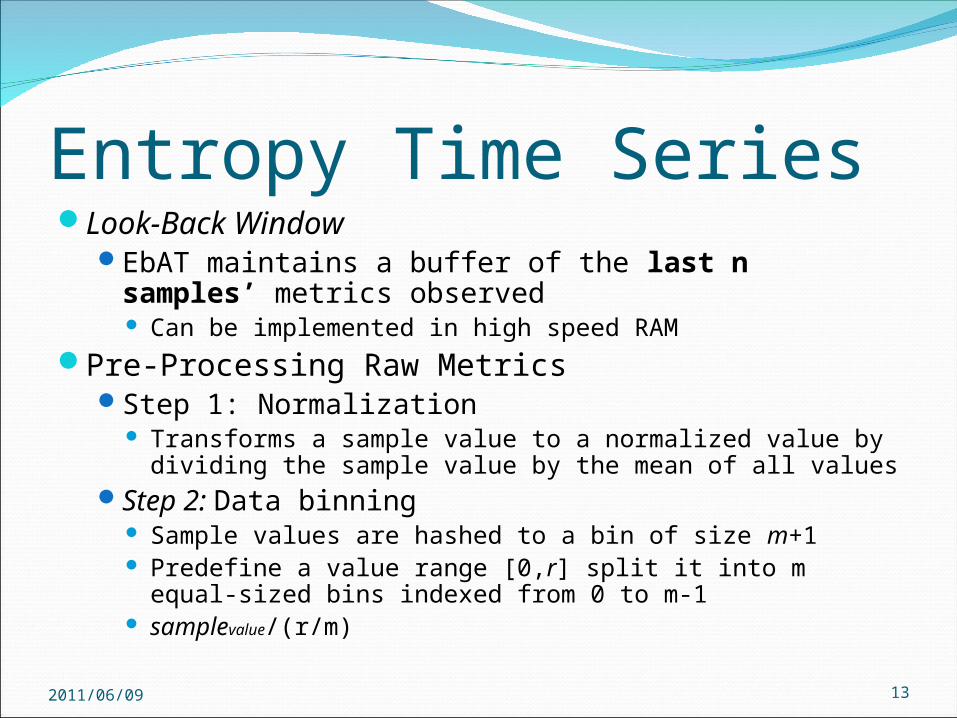
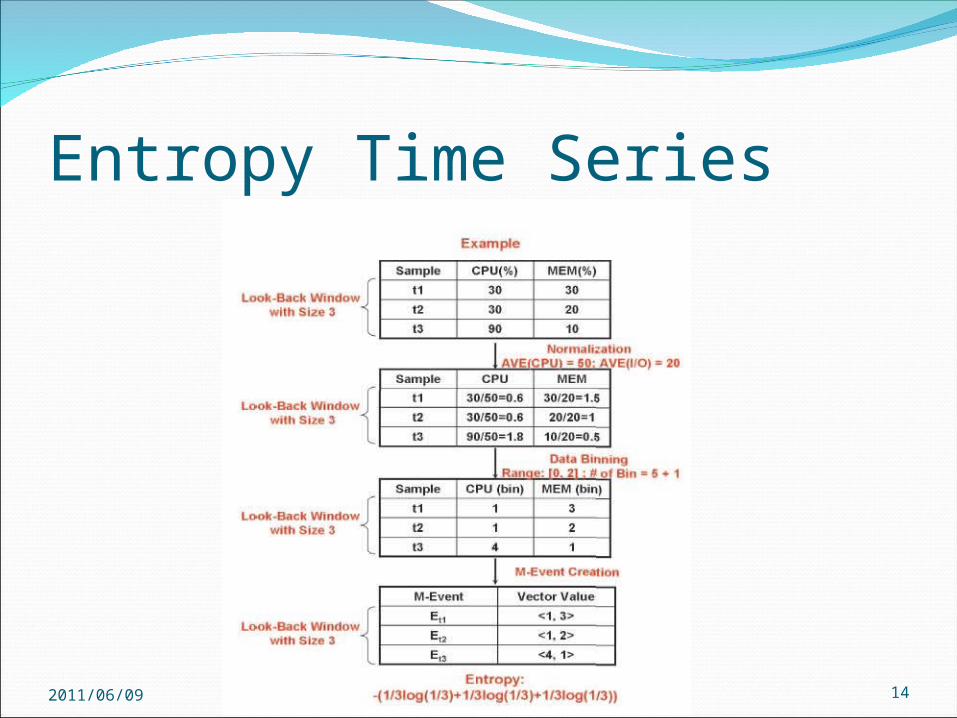
Entropy Time SeriesLook-Back Window
EbAT maintains a buffer of the last n samples’ metrics observed Can be implemented in high speed RAM
Pre-Processing Raw MetricsStep 1: Normalization
Transforms a sample value to a normalized value by dividing the sample value by the mean of all values
Step 2: Data binning Sample values are hashed to a bin of size m+1 Predefine a value range [0,r] split it into m equal-sized bins indexed from
0 to m-1 samplevalue/(r/m)
2011/06/09 13
Entropy Time Series
2011/06/09 14
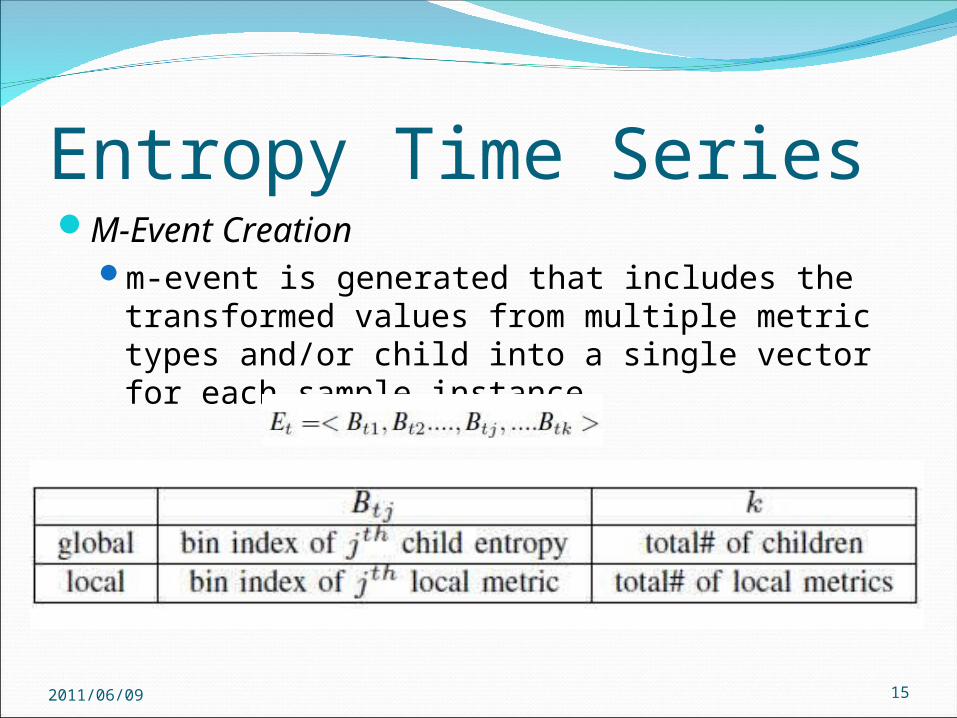
Entropy Time SeriesM-Event Creation
m-event is generated that includes the transformed values from multiple metric types and/or child into a single vector for each sample instance
2011/06/09 15
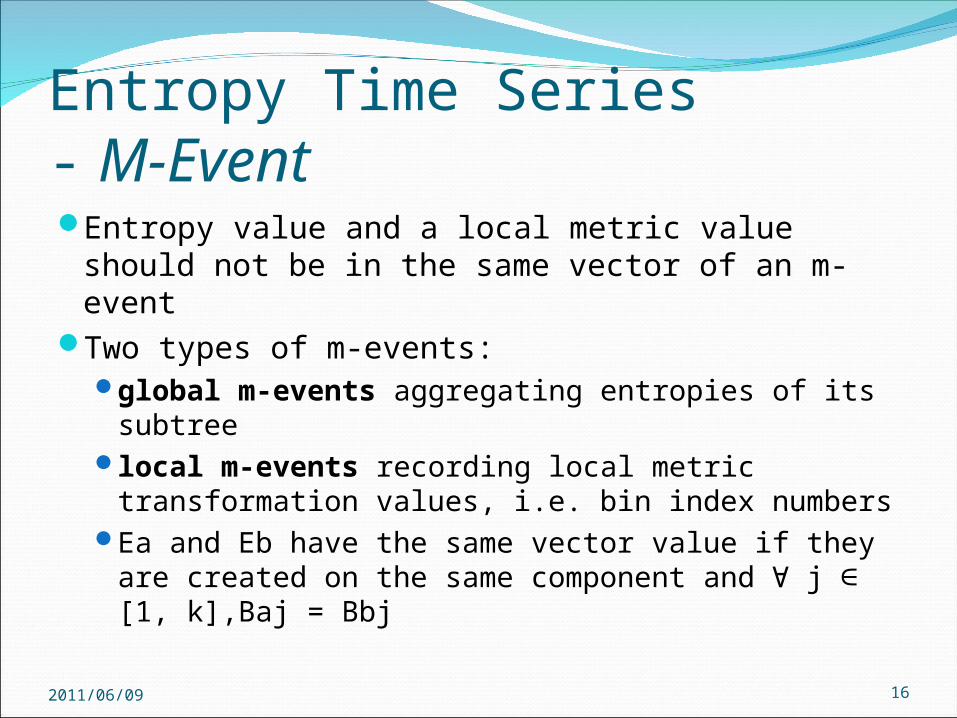
Entropy Time Series- M-EventEntropy value and a local metric value should not be in
the same vector of an m-eventTwo types of m-events:
global m-events aggregating entropies of its subtreelocal m-events recording local metric transformation
values, i.e. bin index numbersEa and Eb have the same vector value if they are created on
the same component and j [1, k],Baj = Bbj∀ ∈
2011/06/09 16
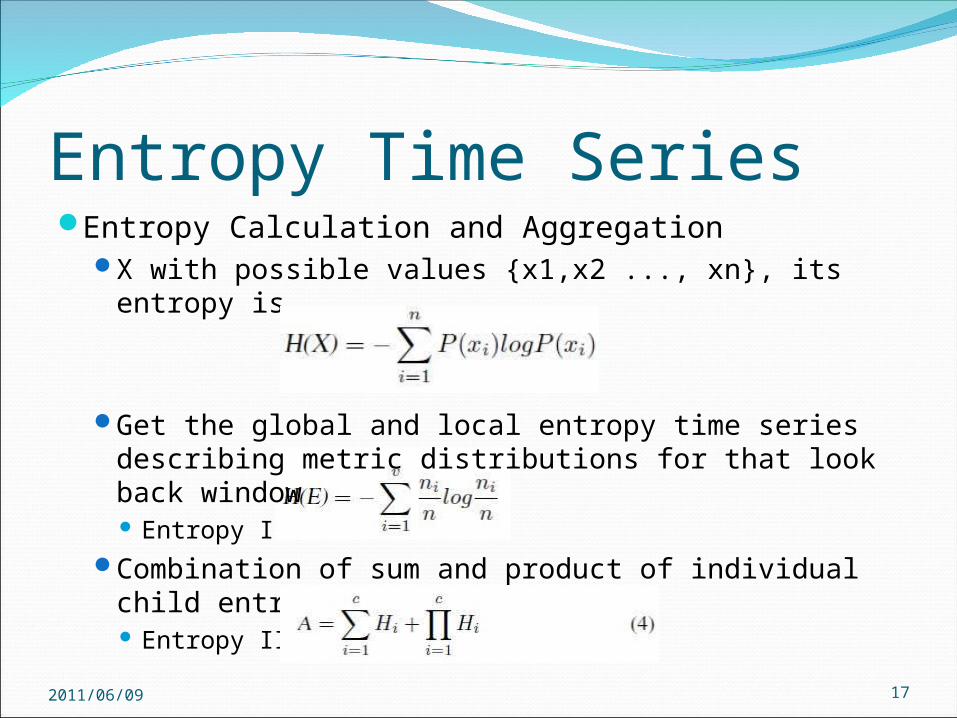
Entropy Time SeriesEntropy Calculation and Aggregation
X with possible values {x1,x2 ..., xn}, its entropy is
Get the global and local entropy time series describing metric distributions for that look back window Entropy I
Combination of sum and product of individual child entropies Entropy II
2011/06/09 17
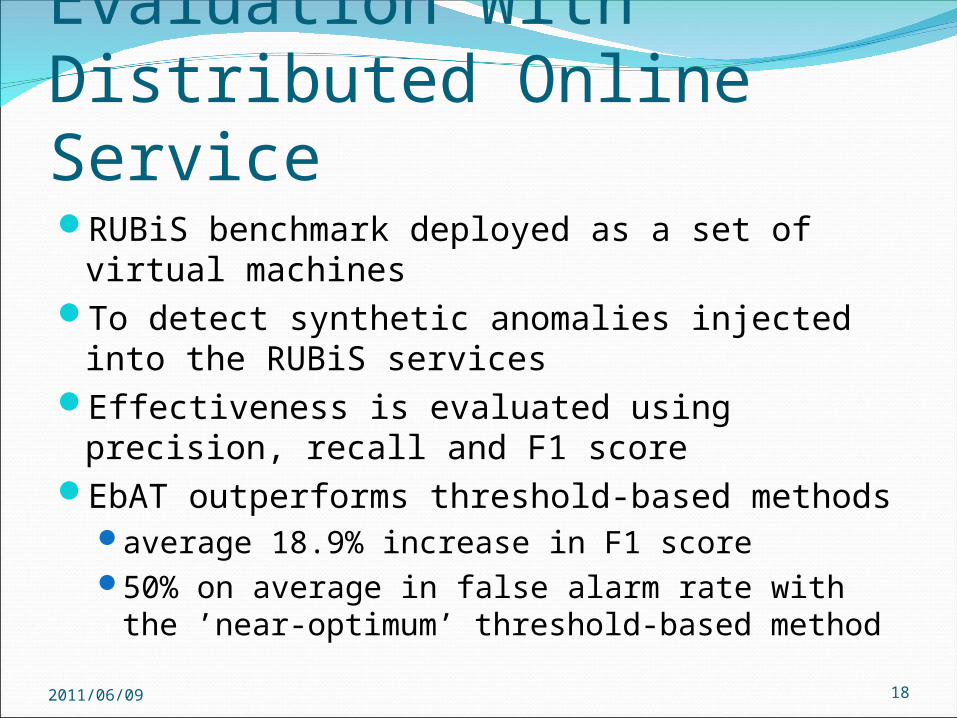
Evaluation With Distributed Online ServiceRUBiS benchmark deployed as a set of virtual machinesTo detect synthetic anomalies injected into the RUBiS
servicesEffectiveness is evaluated using precision, recall and F1
scoreEbAT outperforms threshold-based methods
average 18.9% increase in F1 score50% on average in false alarm rate with the ’near-optimum’
threshold-based method
2011/06/09 18
Evaluation With Distributed Online ServiceExperiment Setup
The testbed uses 5 virtual machines (VM1 to VM5) on Xen platform hosted on two Dell PowerEdge 1950 servers (Host1 and Host2). VM1, VM2, and VM3 are created on Host1
Load generator and an anomaly injector are running on two virtual machines VM4 and VM5 in Host2 The generator creates 10 hours’ worth of service request load for
Host1 Anomaly injector injects 50 anomalies into the RUBiS online
service in Host1
2011/06/09 19
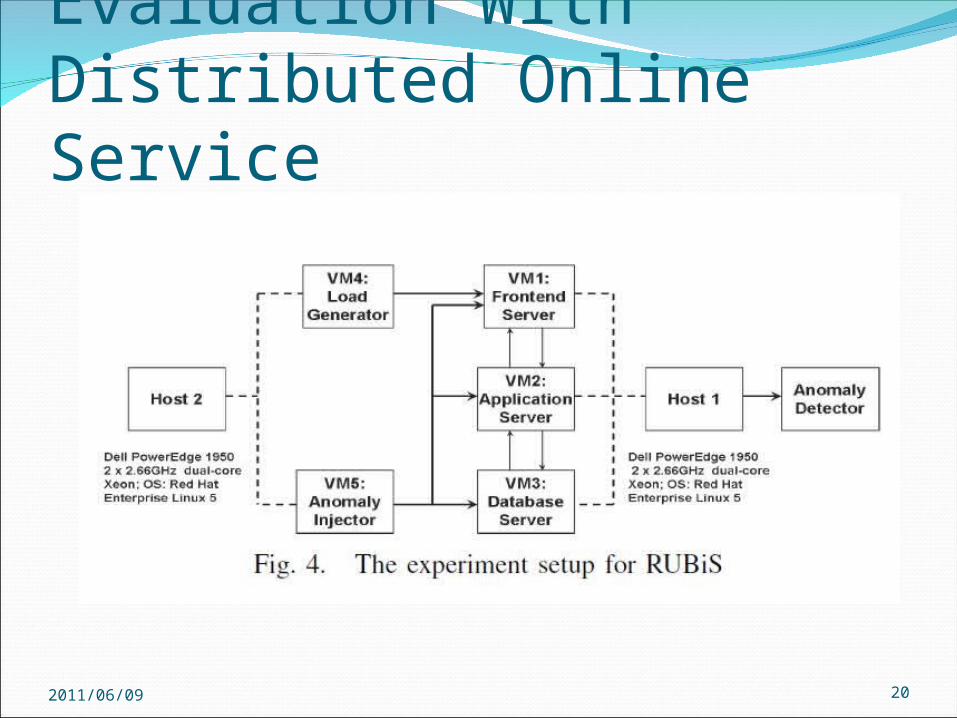
Evaluation With Distributed Online Service
2011/06/09 20
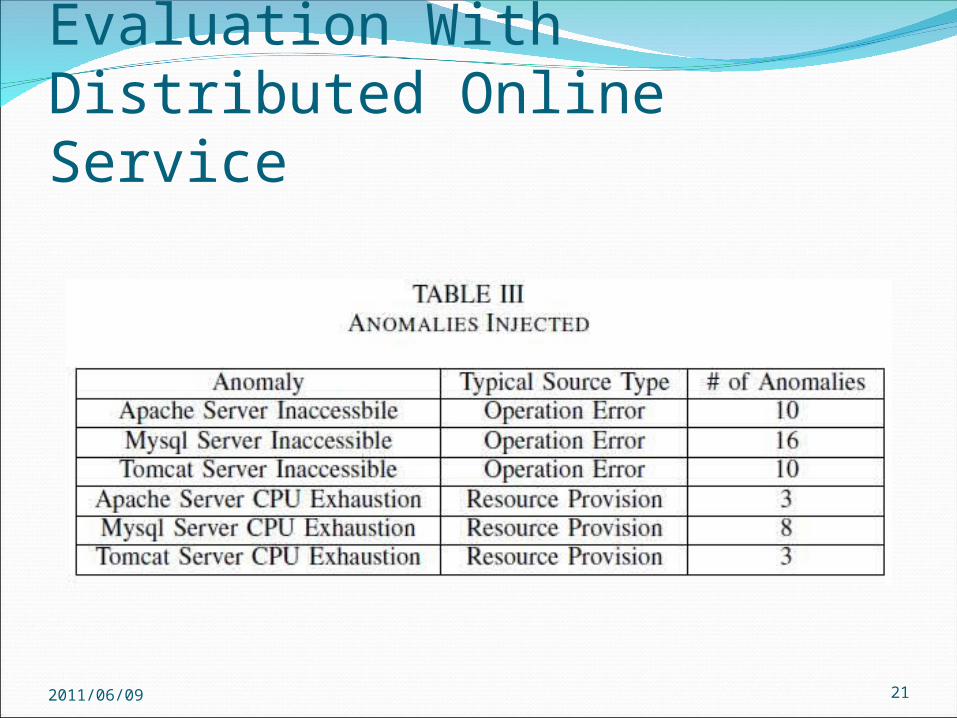
Evaluation With Distributed Online Service
2011/06/09 21
Evaluation With Distributed Online ServiceBaseline Methods – Threshold-Based Detection
Observed CPU utilization with a lower bound and higher bound threshold
Two separate values of the thresholds near-optimum threshold value set by an ’oracle’-based method statically set threshold value that is not optimum
2011/06/09 22
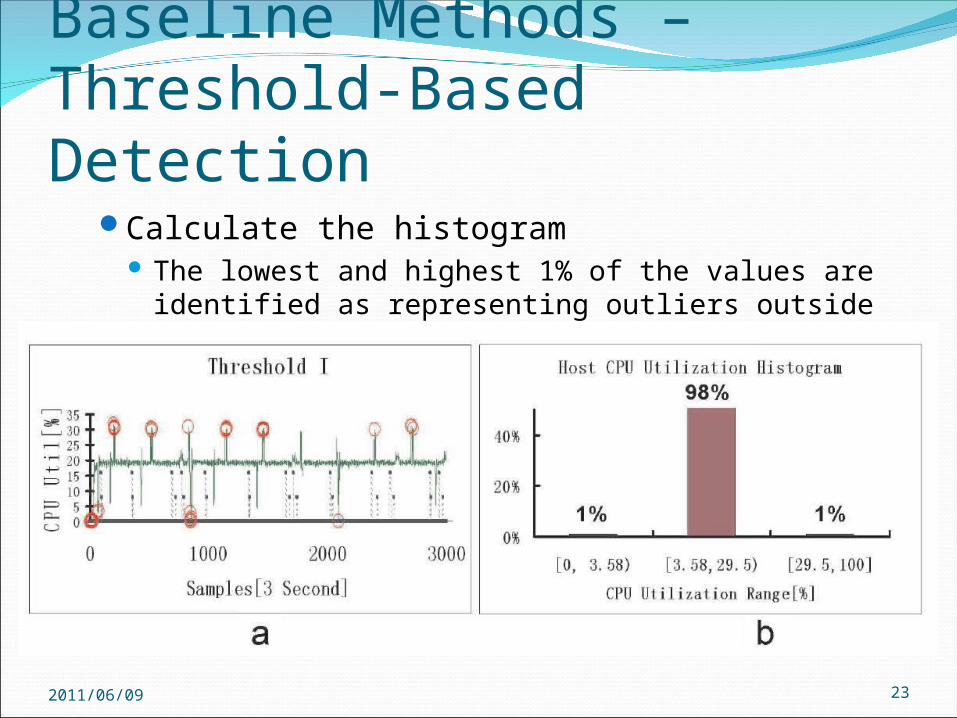
Baseline Methods – Threshold-Based Detection
Calculate the histogram The lowest and highest 1% of the values are identified as
representing outliers outside an acceptable operating range
2011/06/09 23
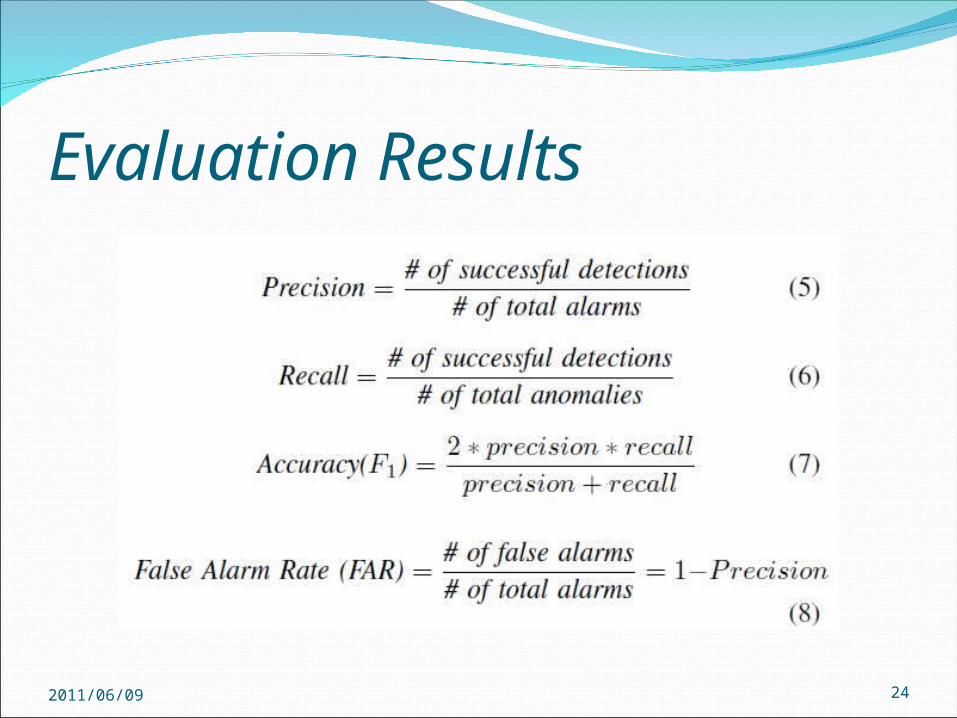
Evaluation Results
2011/06/09 24
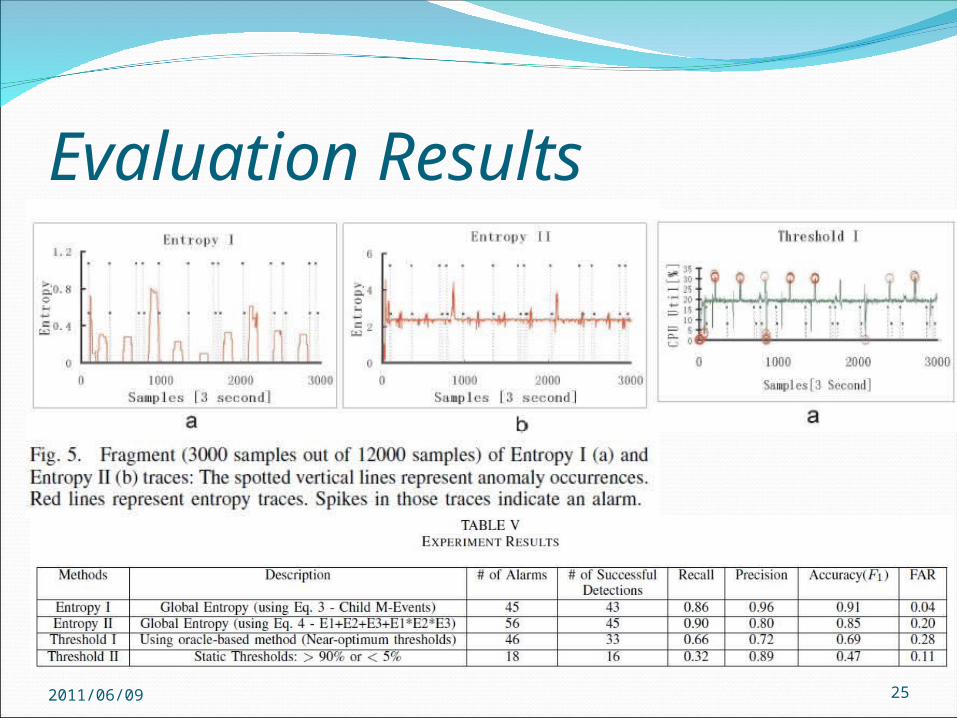
Evaluation Results
2011/06/09 25
Evaluation ResultsEbAT methods outperform threshold-based methods in
accuracy and almost all precision and recall measurementsThreshold II only detects 16 anomalies out of total 50The comparison between Entropy I and Threshold I
EbAT’s metric distribution-based detection aggregating metrics across multiple vertical levels has advantages over solely looking at host level
2011/06/09 26
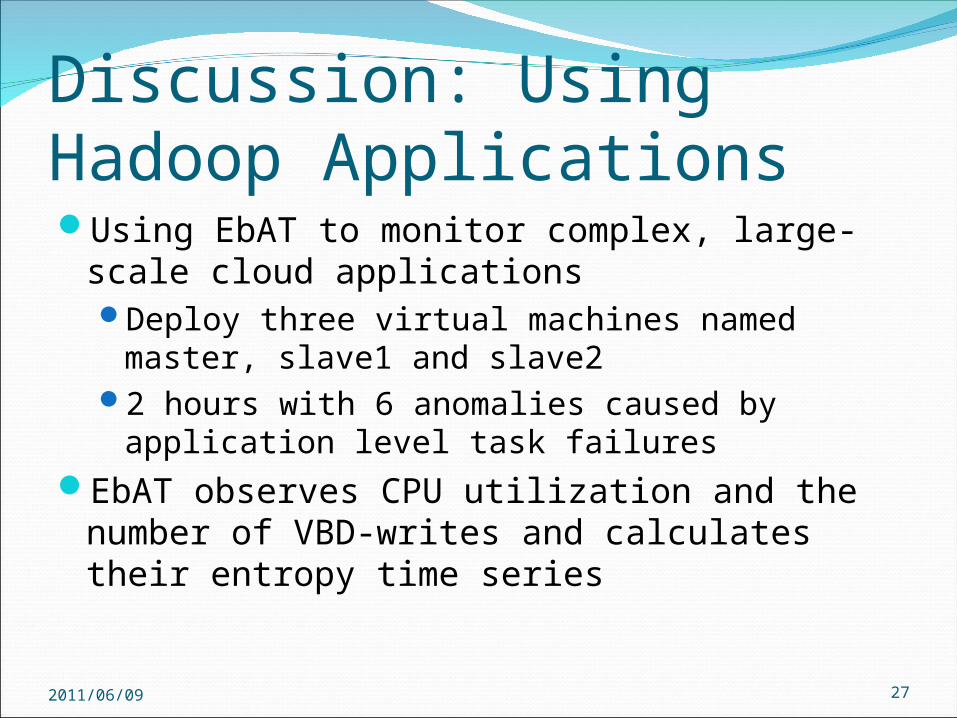
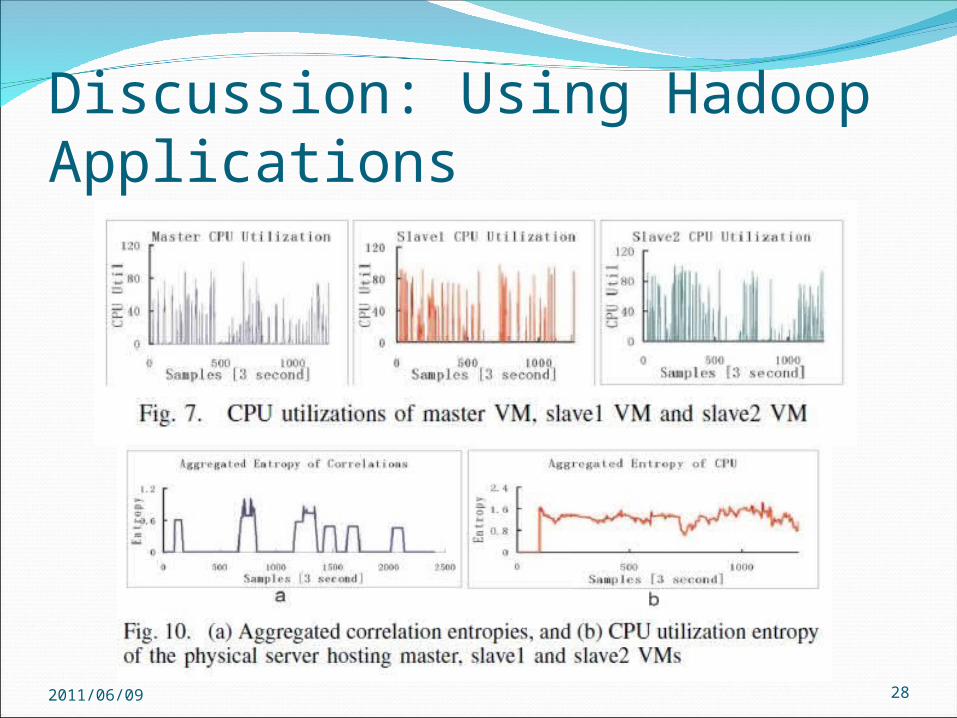
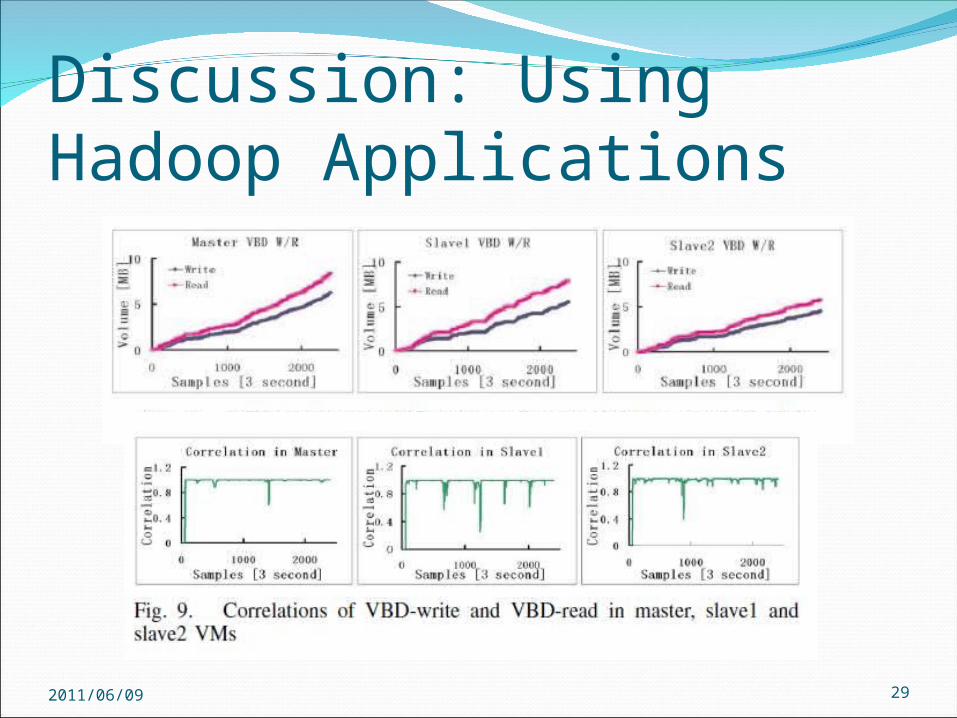
Discussion: Using Hadoop ApplicationsUsing EbAT to monitor complex, large-scale cloud
applicationsDeploy three virtual machines named master, slave1 and
slave22 hours with 6 anomalies caused by application level task
failuresEbAT observes CPU utilization and the number of VBD-
writes and calculates their entropy time series
2011/06/09 27
Discussion: Using Hadoop Applications
2011/06/09 28
Discussion: Using Hadoop Applications
2011/06/09 29
Conclusions And Future WorkEbAT is an automated online detection framework for anomaly
identification and tracking in data center systemsDoes not require human intervention or use predefined
anomaly models/rulesFuture work concerning EbAT includes
Zoom in detection to focus on possible areas of causes, Extending and evaluating the methods for cross-stack (multiple)
metricsEvaluating scalability with large volumes of data and numbers of
machinesContinued evaluation with representative cloud workloads such
as Hadoop
2011/06/09 30

Thanks for listening!
Q&A
2011/06/09 31