Embed Size (px)
Citation preview
Austria’s Informative
Inventory Report (IIR) 2017
Transboundary Air Pollution and Directive (EU) 2016/2284
Submission under the UNECE Convention on Long-range

REPORT REP-0609
Vienna 2017
AUSTRIA’S INFORMATIVE INVENTORY REPORT (IIR) 2017
Submission under the UNECE Convention on Long-range Transboundary Air Pollution and Directive (EU) 2016/2284 on the reduction of
national emissions of certain atmospheric pollutants
Since 23 December 2005, the Umweltbundesamt is accredited as Inspection Body for emission inventories, Type A (Id.No. 241), in accordance with EN ISO/IEC 17020 and the Austrian Accreditation Law (AkkG), by decree of Accreditation Austria/Federal Ministry of Science, Research and Economy (No. BMWA-92.715/0036-I/12/2005, issued on 19 January 2006)
The information covered refers to the following accreditation scope of the IBE: EMEP/CORINAIR Emission Inventory Guidebook 2009, EMEP 2013 and EMEP 2016 (www.bmwfw.gv.at/akkreditierung)
Project management
Simone Haider
Authors Michael Anderl, Christine Brendle, Johannes Burgstaller, Simone Haider, Traute Köther, Christoph Lampert, Lorenz Moosmann, Katja Pazdernik, Daniela Perl, Marion Pinterits, Stephan Poupa, Maria Purzner, Günther Schmidt, Barbara Schodl, Gudrun Stranner, Michaela Titz, Robert Wankmüller, Andreas Zechmeister
Reviewed and approved by
Klaus Radunsky
Layout and typesetting Elisabeth Riss
Title photograph © Ute Kutschera
The authors of this report want to express their thanks to all experts at the Umweltbundesamt as well as experts from other institutions involved in the preparation of the Austrian Air Emission Inventory for their contribution to the continuous improvement of the inventory.
Reporting entity Contracting entity
Inspektionsstelle Emissionsbilanzen (Inspection Body for Emission Inventories) at the Umweltbundesamt GmbH Spittelauer Lände 5, 1090 Vienna/Austria
BMLFUW (Federal Ministry of Agriculture, Forestry, Environment and Water Management) Stubenring 1, 1012 Vienna/Austria
Date of submission
27.04.2017
Responsible for the content of this report
Dr. Klaus Radunsky (Head of the inspection body)
Total number of pages
438 Pages
This report replaces the one designated as DRAFT submitted under the UNECE Convention on Long-range Transboundary Air Pollution and Directive (EU) 2016/2284 on the reduction of national emissions of certain at-mospheric pollutants on 15th of March 2017.
This report is compiled and published as an inspection report in accordance with the Accreditation Law and the in-ternational standard ISO/IEC 17020, in fulfilment of and in compliance with the EMEP/EEA air pollutant emission inventory guidebook (scope of accreditation regarding air pollutants) as well as the CLRTAP Reporting Guide-lines.
This report is an official document, it may not be changed in any form or any means, and no parts may be repro-duced or transmitted without prior written permission from the publisher.
For further information about the publications of the Umweltbundesamt please go to: http://www.umweltbundesamt.at/
Imprint
Owner and Editor: Umweltbundesamt GmbH Spittelauer Lände 5, 1090 Vienna/Austria
The Environment Agency Austria prints its publications on climate-friendly paper.
© Umweltbundesamt GmbH, Vienna, 2017 All rights reserved ISBN 978-3-99004-423-0
Austria’s Informative Inventory Report (IIR) 2017 – Preface
Umweltbundesamt REP-0609, Vienna 2017 3
PREFACE
The report “Austria’s Informative Inventory Report (IIR) 2017” provides a complete and compre-hensive description of the methodologies used for the compilation of the Austrian Air Emission In-ventory (“Österreichische Luftschadstoff-Inventur – OLI”) as presented in Austria’s 2017 submis-sion under the Convention on Long-range Transboundary Air Pollution of the United Nations Economic Commission for Europe (UNECE/LRTAP) and under the Directive (EU) 2016/2284 on the reduction of national emissions of certain atmospheric pollutants (NEC Directive).
Austria is required to annually report data on emissions of air pollutants covered under the UNECE/LRTAP Convention and its Protocols as well as under the NEC Directive for the main pollutants NOx, SO2, NMVOC, NH3 and CO, Particulate Matter (PM), Persistent Organic Pollu-tants (POPs) and Heavy Metals (HM).
To be able to meet these reporting requirements, Austria compiles an Air Emission Inventory („Österreichische Luftschadstoff-Inventur – OLI”) which is updated annually.
This report follows the regulations under the UNECE/LRTAP Convention and its Protocols that define standards for national emission inventories. In 2008 the Executive Body adopted the Guidelines for Reporting Emission Data under the Convention on Long-Range Transboundary Air Pollution (LRTAP) (ECE/EB.AIR/97)1/2 for estimating and reporting of emission data. They are necessary to ensure transparency, accuracy, consistency, comparability and completeness (TACCC) of the reported emissions. In 2014 the Reporting Guidelines were revised (ECE/EB.AIR.125)3 and were adopted for application in 2015 and subsequent years.
The emission data presented in this report were compiled according to these guidelines for es-timating and reporting emission data, which also define the new format of reporting emission da-ta (Nomenclature for Reporting – NFR (latest version of the templates ‘NFR14’4 dated 17.4.2014)) as well as standards for providing supporting documentation which should ensure the transparency of the inventory.
The complete set of tables in the new NFR format, including sectoral reports, sectoral back-ground tables and footnotes to the NFR tables, are submitted separately in digital form only. A summary of emission data is presented in the Appendix of this report.
The IIR 2017 at hand complements the reported emission data by providing background infor-mation. It follows the template5 of the “Informative Inventory Report – IIR” as elaborated by the LRTAP Convention’s “Task Force on Emission Inventories and Projections – TFEIP”. The struc-ture of this report follows closely the structure of Austria’s National Inventory Report (NIR) sub-mitted annually under the United Nations Framework Convention on Climate Change (UNFCCC) which includes a complete and comprehensive description of methodologies used for compila-tion of Austria’s greenhouse gas inventory (UMWELTBUNDESAMT 2017a).
1 http://www.ceip.at/fileadmin/inhalte/emep/reporting_2009/Rep_Guidelines_ECE_EB_AIR_97_e.pdf 2 At its twenty-sixth session (15–18 December 2008), the Executive Body approved the revised Guidelines
(ECE/EB.AIR/2008/4) as amended at the session and requested the secretariat to circulate a final amended ver-sion.
3 http://www.ceip.at/fileadmin/inhalte/emep/2014_Guidelines/ece.eb.air.125_ADVANCE_VERSION_ reporting_guidelines_2013.pdf
4 NFR14 – http://www.ceip.at/ms/ceip_home1/ceip_home/reporting_instructions/ 5 http://www.ceip.at/fileadmin/inhalte/emep/doc/AnnexVI_IIR_300909.doc
Austria’s Informative Inventory Report (IIR) 2017 – Preface
4 Umweltbundesamt REP-0609, Vienna 2017
The aim of this report is to document the methodology in order to facilitate understanding of the calculation of the Austrian air emission data. The more interested reader is kindly referred to the background literature cited in this document.
Elisabeth Rigler in her function as head of the Department Climate Change Mitigation & Emis-sion Inventories of the Umweltbundesamt is responsible for the preparation and review of Aus-tria’s Air Emission Inventory as well as for the preparation of the IIR.
Klaus Radunsky in his function as head of the Inspection Body for Emission Inventories and Mi-chael Anderl in his function as deputy are responsible for the content of this report and for the quality management system of the Austrian Air Emission Inventory.
The preparation and review of Austria’s National Air Emission Inventory are the responsibility of the Department “Climate Change Mitigation & Emission Inventories” of the Umweltbundesamt.
Project leader for the preparation of the Austrian Air Emission Inventory is Stephan Poupa.
Specific responsibilities for the preparation of the Austrian Air Emission Inventory are: Data Management .......................................... Stephan Poupa Fuel combustion stationary ............................. Stephan Poupa (‘Sector Lead’) Fuel combustion mobile .................................. Gudrun Stranner (‘Sector Lead’) Fugitive emissions ......................................... Marion Pinterits (‘Sector Lead’) Industrial processes ........................................ Michaela Titz (‘Sector Lead’) Solvent Use ..................................................... Maria Purzner (‘Sector Lead’) Agriculture ....................................................... Michael Anderl (‘Sector Lead’) Waste .............................................................. Katja Pazdernik (‘Sector Lead’) Inventory Support ............................................ Andreas Zechmeister Key Category Analysis .................................... Andreas Zechmeister Uncertainty Analysis ....................................... Andreas Zechmeister
Project leader for the preparation of the IIR 2017 is Simone Haider.
Specific responsibilities for the IIR 2017 have been as follows: Executive Summary ....................................... Simone Haider Chapter 1 Introduction .................................... Simone Haider, Katja Pazdernik Chapter 2 Trends ........................................... Simone Haider, Daniela Perl Chapter 3 Energy ........................................... Stephan Poupa, Günther Schmidt Chapter 3 Transport ....................................... Gudrun Stanner, Barbara Schodl Chapter 3 Fugitive emission ........................... Marion Pinterits, Katja Pazdernik Chapter 4 Industrial Processes and
Product Use………………………………... ..... Maria Purzner, Michaela Titz Chapter 5 Agriculture ..................................... Michael Anderl, Simone Haider Chapter 6 Waste ............................................ Katja Pazdernik, Christoph Lampert Chapter 7 Recalculations & Improvements…. ............................................ Simone Haider Chapter 8 Projections ..................................... Andreas Zechmeister Chapter 9 Reporting of gridded
emissions and LPS ................................... Simone Haider, Günther Schmidt Appendix ........................................................ Simone Haider
Austria’s Informative Inventory Report (IIR) 2017 – Content
Umweltbundesamt REP-0609, Vienna 2017 5
CONTENT
PREFACE .................................................................................................................................... 3
EXECUTIVE SUMMARY ........................................................................................................ 10 ES.1 Reporting obligations under UNECE/LRTAP and Directive (EU) 2016/2284
(NEC Directive) ............................................................................................................. 10 ES.2 Differences with other reporting obligations ................................................................. 11 ES.3 Overview of emission trends .......................................................................................... 11 ES.4 Key categories .................................................................................................................. 13 ES.5 Main differences in the inventory since the last submission ...................................... 13 ES.6 Improvement Process ...................................................................................................... 14
1 INTRODUCTION ......................................................................................................... 15 1.1 National inventory background .................................................................................. 15 1.2 Institutional, legal and procedural arrangements .................................................... 15 1.2.1 National Inventory System Austria (NISA) ..................................................................... 19 1.2.2 Austria’s Obligations ...................................................................................................... 21 1.3 Inventory Preparation Process ................................................................................... 26 1.4 Methodologies and Data Sources Used .................................................................... 28 1.4.1 EU Emissions Trading System (EU ETS) ...................................................................... 30 1.4.2 Electronic Data Management (EDM) ............................................................................. 31 1.4.3 Other data (E-PRTR) ..................................................................................................... 32 1.4.4 Literature ........................................................................................................................ 32 1.4.5 Summary of methodologies applied for estimating emissions ....................................... 33 1.5 Key Category Analysis ................................................................................................ 36 1.6 Quality Assurance, Quality Control and verification ................................................ 58 1.6.1 Requirements of the ISO compared to the IPCC 2006 GL as well as the
EMEP/EEA air pollutant emission inventory guidebook 2016 ....................................... 58 1.6.2 Quality policy and objectives .......................................................................................... 59 1.6.3 Design of the Austrian QMS .......................................................................................... 61 1.6.4 QA/QC Plan ................................................................................................................... 62 1.6.5 QC Activities ................................................................................................................... 63 1.6.6 QA Activities ................................................................................................................... 63 1.6.7 Error correction and continuous improvement ............................................................... 65 1.6.8 Archiving and documentation ......................................................................................... 65 1.6.9 Treatment of confidentiality issues ................................................................................. 66 1.6.10 QMS activities and improvements 2016 ........................................................................ 67 1.7 Uncertainty Assessment ............................................................................................. 68 1.7.1 Method used .................................................................................................................. 68 1.7.2 Data source .................................................................................................................... 68 1.7.3 Results of uncertainty estimation ................................................................................... 69 1.8 Completeness ............................................................................................................... 78
Austria’s Informative Inventory Report (IIR) 2017 – Content
6 Umweltbundesamt REP-0609, Vienna 2017
2 EXPLANATIONS OF KEY TRENDS ....................................................................... 81 2.1 Emission Trends for Air Pollutants covered by the Multi-Effect Protocol
as well as CO ................................................................................................................ 82 2.1.1 SO2 Emissions ............................................................................................................... 83 2.1.2 NOx Emissions ............................................................................................................... 86 2.1.3 NMVOC Emissions ........................................................................................................ 90 2.1.4 NH3 Emissions ............................................................................................................... 93 2.1.5 Carbon monoxide (CO) Emissions ................................................................................ 96 2.2 Emission Trends for Particulate matter (PM) ............................................................ 99 2.3 Emission Trends for Heavy Metals .......................................................................... 109 2.3.1 Cadmium (Cd) Emissions ............................................................................................ 110 2.3.2 Mercury (Hg) Emissions ............................................................................................... 114 2.3.3 Lead (Pb) Emissions .................................................................................................... 117 2.4 Emission Trends for POPs ........................................................................................ 120 2.4.1 Polycyclic Aromatic Hydrocarbons (PAH) Emissions .................................................. 122 2.4.2 Dioxins and Furan (PCDD/F) ....................................................................................... 125 2.4.3 Hexachlorobenzene (HCB) Emissions......................................................................... 128 2.4.4 Polychlorinated biphenyl (PCB) Emissions .................................................................. 131 2.5 National emission total calculated on the basis of fuels used ............................. 134
3 ENERGY (NFR SECTOR 1).................................................................................... 138 3.1 NFR 1.A Stationary Fuel Combustion Activities ..................................................... 138 3.1.1 General description ...................................................................................................... 138 3.1.2 Methodological issues .................................................................................................. 143 3.1.3 NFR 1.A.1 Energy Industries ....................................................................................... 145 3.1.4 NFR 1.A.2 Manufacturing Industry and Combustion ................................................... 160 3.1.5 NFR 1.A.3.e.1 Pipeline compressors (SNAP 010506) ................................................ 188 3.1.6 NFR 1.A.4 Other Sectors ............................................................................................. 189 3.1.7 NFR 1.A.4.c.2 Off-road Vehicles and Other Machinery – soil abrasion ...................... 205 3.1.8 Quality Assurance and Quality Control (QA/QC) ......................................................... 206 3.1.9 Planned improvements ................................................................................................ 207 3.1.10 Recalculations .............................................................................................................. 207 3.2 NFR 1.A Mobile Fuel Combustion Activities ........................................................... 208 3.2.1 General description ...................................................................................................... 208 3.2.2 Key Categories ............................................................................................................. 210 3.2.3 Uncertainty Assessment .............................................................................................. 210 3.2.4 NFR 1.A.3.a Civil Aviation – LTO ................................................................................. 211 3.2.5 NFR Memo Item 1.A.3.a Civil Aviation – Cruise .......................................................... 218 3.2.6 NFR 1.A.3.b Road Transport ....................................................................................... 221 3.2.7 Other mobile sources – Off Road ................................................................................ 231 3.2.8 Emission factors for heavy metals, POPs and PM used in NFR 1.A.3
Transport ...................................................................................................................... 244 3.3 NFR 1.B Fugitive Emissions ..................................................................................... 251 3.3.1 Completeness .............................................................................................................. 251 3.3.2 NFR 1.B.1.a Coal mining and handling – Methodological issues ................................ 252 3.3.3 NFR 1.B.2.a Oil – Methodological issues .................................................................... 253 3.3.4 NFR 1.B.2.b Natural Gas – Methodological issues ..................................................... 254
Austria’s Informative Inventory Report (IIR) 2017 – Content
Umweltbundesamt REP-0609, Vienna 2017 7
3.3.5 Category-specific QA/QC ............................................................................................. 255 3.3.6 Uncertainty Assessment .............................................................................................. 255 3.3.7 Category-specific Recalculations ................................................................................. 256 3.3.8 Planned Improvements ................................................................................................ 256
4 INDUSTRIAL PROCESSES AND PRODUCT USE (NFR SECTOR 2) ................................................................................................................ 257
4.1 Sector overview .......................................................................................................... 257 4.2 General description ................................................................................................... 257 4.2.1 Key Categories ............................................................................................................. 259 4.2.2 Methodology ................................................................................................................. 260 4.2.3 Uncertainty Assessment .............................................................................................. 260 4.2.4 Quality Assurance and Quality Control (QA/QC) ......................................................... 261 4.2.5 Planned Improvements ................................................................................................ 261 4.3 NFR 2.A.1-2.A.3 Mineral Products ............................................................................ 262 4.3.1 Fugitive Particulate Matter emissions .......................................................................... 262 4.3.2 NFR 2.A.5 Mining, Construction/Demolition ................................................................ 264 4.3.3 Category-specific Recalculations ................................................................................. 265 4.4 NFR 2.B Chemical Products ..................................................................................... 265 4.4.1 NFR 2.B.1 Ammonia and 2.B.2 Nitric Acid Production ................................................ 265 4.4.2 NFR 2.B.10 Other Chemical Industry .......................................................................... 268 4.4.3 Category-specific Recalculations ................................................................................. 272 4.5 NFR 2.C Metal Production ......................................................................................... 272 4.5.1 NFR 2.C.1 Iron and Steel Production .......................................................................... 272 4.5.2 NFR 2.C.2 – 2.C.6 Non-ferrous Metals ........................................................................ 276 4.5.3 Category-specific Recalculations ................................................................................. 277 4.6 NFR 2.D.3-2.G Solvents and other Product use ...................................................... 278 4.6.1 Emission Trends .......................................................................................................... 278 4.6.2 NMVOC Emissions from Solvent and other product use (Category 2.D.3.a-i) .............. 280 4.6.3 Emissions of Particulate Matter (PM) from Other Product Manufacture and
Use (Category 2.G) ...................................................................................................... 290 4.6.4 Category-specific Recalculations ................................................................................. 291 4.7 NFR 2.H Other processes .......................................................................................... 291 4.7.1 NFR 2.H.1 Pulp and Paper Industry ............................................................................ 291 4.7.2 NFR 2.H.2 Food and Beverages Industry .................................................................... 292 4.7.3 Category-specific Recalculations ................................................................................. 293 4.8 NFR 2.I Wood Processing ......................................................................................... 293 4.8.1 Source Category Description ....................................................................................... 293 4.8.2 Methodological Issues ................................................................................................. 293 4.8.3 Category-specific Recalculations ................................................................................. 294
5 AGRICULTURE (NFR SECTOR 3) ....................................................................... 295 5.1 Sector Overview ......................................................................................................... 295 5.2 General description ................................................................................................... 295 5.2.1 Completeness .............................................................................................................. 295 5.2.2 Key Categories ............................................................................................................. 297 5.2.3 Methodology ................................................................................................................. 297 5.2.4 Uncertainty Assessment .............................................................................................. 298
Austria’s Informative Inventory Report (IIR) 2017 – Content
8 Umweltbundesamt REP-0609, Vienna 2017
5.2.5 Quality Assurance and Quality Control (QA/QC) ......................................................... 299 5.2.6 Planned Improvements ................................................................................................ 300 5.3 NFR 3.B Manure Management .................................................................................. 300 5.3.1 Methodological Issues ................................................................................................. 300 5.3.2 NH3 emissions from cattle (3.B.1) and swine (3.B.3) .................................................. 305 5.3.3 NH3 emissions from sheep (3.B.2), goats (3.B.4.d), horses (3.B.4.e), poultry
(3.B.4.g) and other animals (3.B.4.h) ........................................................................... 315 5.3.4 NOx emissions from manure management (3.B) ......................................................... 317 5.3.5 Category-specific Recalculations ................................................................................. 317 5.4 NFR 3.B Particle Emissions from Manure Management ........................................ 318 5.4.1 Methodological Issues ................................................................................................. 318 5.4.2 Category-specific Recalculations ................................................................................. 319 5.5 NFR 3.D Agricultural Soils ........................................................................................ 319 5.5.1 Methodological Issues ................................................................................................. 319 5.5.2 Inorganic N-fertilizers (NFR 3.D.a.1)............................................................................ 320 5.5.3 Organic N-fertilizers applied to soils (NFR 3.D.a.2.a) .................................................. 321 5.5.4 Urine and dung deposited by grazing animals (NFR 3.D.a.3) ..................................... 329 5.5.5 Cultivated crops (3.D.e) ............................................................................................... 329 5.5.6 Category-specific Recalculations ................................................................................. 330 5.6 NFR 3.D Particle Emissions from Agricultural Soils .............................................. 332 5.6.1 Methodological Issues ................................................................................................. 332 5.7 NFR 3.F Field Burning of Agricultural Residues .................................................... 334 5.7.1 Methodological Issues ................................................................................................. 335 5.7.2 Category-specific Recalculations ................................................................................. 337
6 WASTE (NFR SECTOR 5) ...................................................................................... 338 6.1 Sector Overview ......................................................................................................... 338 6.2 General description ................................................................................................... 341 6.2.1 Completeness .............................................................................................................. 341 6.2.2 Key Categories ............................................................................................................. 341 6.2.3 Methodology ................................................................................................................. 341 6.2.4 Uncertainty Assessment .............................................................................................. 341 6.2.5 Quality Assurance and Quality Control (QA/QC) ......................................................... 342 6.2.6 Planned Improvements ................................................................................................ 342 6.3 NFR 5.A Waste Disposal on Land ............................................................................ 343 6.3.1 NMVOC, NH3, CO and heavy metals emissions ......................................................... 343 6.3.2 PM emissions ............................................................................................................... 353 6.4 NFR 5.B Composting ................................................................................................. 355 6.4.1 Source Category Description ....................................................................................... 355 6.4.2 Methodological Issues ................................................................................................. 355 6.4.3 Category-specific Recalculations ................................................................................. 357 6.5 NFR 5.C Incineration and open burning of waste ................................................... 358 6.5.1 Source Description ....................................................................................................... 358 6.5.2 Methodology ................................................................................................................. 358 6.5.3 Category-specific Recalculations ................................................................................. 361 6.6 NFR 5.D Wastewater handling .................................................................................. 362 6.6.1 Source Category Description ....................................................................................... 362
Austria’s Informative Inventory Report (IIR) 2017 – Content
Umweltbundesamt REP-0609, Vienna 2017 9
6.6.2 Methodological Issues ................................................................................................. 362 6.6.3 Category-specific Recalculations ................................................................................. 363
7 RECALCULATIONS AND IMPROVEMENTS ..................................................... 364 7.1 Relation to data reported earlier ............................................................................... 364 7.2 Explanations and Justifications for Recalculations, including in
response to the review process ............................................................................... 364 7.2.1 Energy (NFR sector 1) ................................................................................................. 365 7.2.2 Industrial Processes and Product Use (NFR sector 2) ................................................ 367 7.2.3 Agriculture (NFR sector 3) ........................................................................................... 367 7.2.4 Waste (NFR sector 5) .................................................................................................. 370 7.3 Recalculations per Pollutant ..................................................................................... 371 7.4 Planned improvements, including in response to the review process,
and planned improvements to the inventory .......................................................... 376
8 PROJECTIONS ......................................................................................................... 386
9 REPORTING OF GRIDDED EMISSIONS AND LPS .......................................... 388 9.1 Gridded Emissions .................................................................................................... 388 9.1.1 Background Information ............................................................................................... 388 9.1.2 Emissions according to the GNFR-Code ..................................................................... 388 9.1.3 Allocation of emissions ................................................................................................ 389 9.1.4 Results of gridded data ................................................................................................ 393 9.2 Large Point Sources (LPS) ........................................................................................ 397 9.2.1 Activity Data ................................................................................................................. 397 9.2.2 Methodological Issues ................................................................................................. 398 9.3 Recalculations ............................................................................................................ 398 9.4 Planned Improvements ............................................................................................. 398
10 REFERENCES .......................................................................................................... 399
11 ABBREVIATIONS .................................................................................................... 415
12 APPENDIX ................................................................................................................. 418 12.1 Emission Trends per Sector – Submission under UNECE/LRTAP ....................... 418 12.2 National emission total for SO2, NOx, NMVOC, NH3 and PM2.5 calculated
on the basis of fuels used ......................................................................................... 433
Austria’s Informative Inventory Report (IIR) 2017 – Executive Summary
10 Umweltbundesamt REP-0609, Vienna 2017
EXECUTIVE SUMMARY
ES.1 Reporting obligations under UNECE/LRTAP and Directive (EU) 2016/2284 (NEC Directive)
Austria’s Informative Inventory Report (IIR) and the complete set of NFR tables (the latter are submitted in digital format only) represent Austria’s official submission under the United Nations Economic Commission for Europe (UNECE) Convention on Long-rage Transboundary Air Pollu-tion (LRTAP) and under Directive (EU) 2016/2284 (NEC Directive). The Umweltbundesamt in its role as single national entity regarding emission inventories compiles Austria’s annual delivery, and the Austrian Ministry of Agriculture, Forestry, Environment and Water Management submits it officially to the Executive Secretary of UNECE as well as to the European Commission.
As a party to the UNECE/LRTAP Convention and under the NEC Directive, Austria is required to annually report data on emissions of air pollutants covered in the Convention and its Proto-cols: main pollutants: nitrogen oxides (NOx), non-methane volatile organic compounds (NMVOC),
sulphur oxides (SOx), ammonia (NH3) and carbon monoxide (CO); particulate matter (PM): primary PM (fine particulate matter (PM2.5) and coarse particulate
matter (PM10)6; priority heavy metals (HMs): lead (Pb), cadmium (Cd) and mercury (Hg); persistent organic pollutants (POPs): polychlorinated dibenzodioxins/dibenzofurans (PCDD/Fs),
polycyclic aromatic hydrocarbons (PAHs), hexachlorobenzene (HCB) and polychlorinated bi-phenyls (PCBs).
In order to fulfil these reporting requirements, Austria compiles an Air Emission Inventory (“Österreichische Luftschadstoff-Inventur – OLI”), which is updated annually. The IIR contains information on Austria’s inventories of air pollutants for all years from 1990 to 2015 for the main pollutants, for POPs and HMs and for the years 1990, 1995 and from 2000 onwards for PM.
From submission 2015 onwards, Austria reports all pollutants in the NFR14 reporting format from 1990 to the latest inventory year. Emissions of the years before 1990 were last updated and published in submission 2014.7
In addition, the report includes both detailed descriptions of methods, data sources and uncer-tainties and information on quality assurance and quality control (QA/QC) activities as well as analyses of emission trends.
The emission data presented in this report were compiled according to the revised 2014 Report-ing Guidelines (ECE/EB.AIR.125) that were approved by the Executive Body for the UNECE/LRTAP Convention at its 36th session.
The Austrian inventory is complete with regard to reported gases, reported years and reported emissions from all sources, and also complete in terms of geographic coverage.
6 According to the CLRTAP Reporting GL the reporting of Total suspended particules (TSPs) is not mandatory, but
reported by Austria. 7 Austria´s submission 2014 under the Convention on Long-range Transboundary Air Pollution covering the years
1980–2012: http://www.ceip.at/ms/ceip_home1/ceip_home/status_reporting/2014_submissions/
Austria’s Informative Inventory Report (IIR) 2017 – Executive Summary
Umweltbundesamt REP-0609, Vienna 2017 11
ES.2 Differences with other reporting obligations
NEC Directive (EU) 2016/2284 sets out national emission reduction commitments for the pollu-tants SO2, NOx, VOC, NH3 and PM2.5. Austria uses the national emission totals calculated on the basis of fuel used (thus excluding emissions from fuel exports in the vehicle tank) for com-pliance assessment under the NEC Directive.
The annual greenhouse gas reporting under the UNFCCC and the Kyoto Protocoll also requires the reporting of indirect GHGs (NOx, CO, NMVOC) and SO2 emissions based on fuel sold. In contrast to UNFCCC requirements, emissions from aviation under the NEC Directive and the LRTAP Convention include domestic LTO and cruise. Furthermore, international navigation of inland waterways is covered under NEC and CLRTAP.
ES.3 Overview of emission trends
Main Pollutants
In 1990, national total SO2 emissions amounted to 75 kt. Since then emissions have decreased quite steadily. In the year 2015, emissions were reduced by 80% compared to 1990 and amounted to 15 kt, which was mainly due to lower emissions from residential heating, combus-tion in industries and in energy industries. The sharp decrease from 2008 onwards is due to a further reduction of the sulfur content of gasoil to 10ppm. From 2014 to 2015 emissions slightly increased by 0.8% mainly due to higher emissions from NFR sectors 1.A.2 Manufacturing In-dustries and 1.A.4 Other Sectors. Emissions from manufacturing industries rose due to an in-creased coal and residual fuel use. Emissions from the residential sector increased due to the increased heating demand (more coal and biomass used) as a result of the colder winter.
In 1990, national total NOx emissions amounted to 221 kt. After an all-time high of emissions between 2003 and 2005 emissions are decreasing continuously, which is mainly due to lower emissions from heavy duty vehicles influenced by declined fuel sales, fleet renewal and well-functioning NOx exhaust after treatment systems. In 2015, NOx emissions amounted to 149 kt and were about 32% lower than in 1990. From 2014 to 2015 emissions decreased by 2.6%, again mainly due to decreasing emissions of road transportation, in particular from heavy duty vehicles. In 2015 49% of the total nitrogen oxides emissions originate from road transport (in-cluding fuel exports). Austria is a landlocked country and fuel prices vary significantly between neighbouring countries. So Austria has experienced a considerable amount of ‘fuel export’ in the last few years and the share of NOx emissions caused by fuel sold in Austria but used abroad is notable. Emissions for 2015 based on fuel used amount to 132 kt and are about 17 kt lower than based on fuel sold; the decrease between 1990 and 2015 is also slightly stronger.
In 1990, national total NMVOC emissions amounted to 281 kt. Emissions have decreased steadily since then and in the year 2015 emissions had been reduced by 60% to 113 kt com-pared to 1990. From 2014 to 2015 emissions increased by 2.4%. This was mainly due to higher fuel demand for residential heating as a consequence of the low winter temperatures in 2015 (higher biomasse consumption).
In 1990, national total NH3 emissions amounted to 66.1 kt; emissions have been quite stable over the period from 1990 to 2015. In 2015, emissions were 1.1% above 1990 levels and amounted to 66.9 kt. Compared to the previous year, emissions in 2015 remained nearly at the same level (+0.4%). NH3 in Austria is almost exclusively emitted in the agricultural sector; emis-sions from agricultural soils, mainly resulting from organic and inorganic fertilization, have the highest contribution to national total NH3 emissions.
Austria’s Informative Inventory Report (IIR) 2017 – Executive Summary
12 Umweltbundesamt REP-0609, Vienna 2017
In 1990, national total CO emissions amounted to 1 287 kt. Emissions considerably decreased from 1990 to 2015. In 2015, emissions were 56% below 1990 levels and amounted to 567 kt. This reduction was mainly due to decreasing emissions from road transport (catalytic convert-ers). The emissions increased between 2014 and 2015 by 5.3%, mainly due to higher emis-sions from iron and steel plants and an increased use of biomass in residential heatings.
Particulate Matter Particulate matter emissions in Austria mainly arise from industrial processes, road transport, agriculture and small heating installations.
Particulate matter (PM) emissions show a decreasing trend over the period 1990 to 2015: TSP emissions decreased by 11%, PM10 emissions were about 22% below the level of 1990, and PM2.5 emissions dropped by about 34%. Between 2014 and 2015 PM emissions increased by 1.0% (TSP), 1.3% (PM10) and 2.1% (PM2.5) mainly because of higher biomass consumption of the residential sector due to lower winter temperatures in 2015, which has been partly compensated by decreasing emissions from road transport. Apart from industry and road transport, private households and the agricultural sector (soil cultivation and harvesting) are the main contributors to PM emissions. Where for TSP the most important sources are transport and industrial processes, small heating installations have the highest share in PM2.5 emissions.
Heavy Metals Emissions of all three priority heavy metals (Cd, Pb and Hg) have decreased since 1990.
The overall Cd emissions reduction of 25% from 1990 to 2015 is mainly due to a decline in the in-dustrial processes and energy sector, which is due to lower use of heavy fuel oil and lower emis-sions from iron and steel production. The increase of 2.0% between 2014 and 2015 mainly results from higher biomass consumption of households.
The overall reduction of Hg of about 55% for the period 1990 to 2015 was due to decreasing emis-sions from cement industries and the industrial processes sector as well as due to reduced use of coal for residential heating. Several bans in different industrial sub-sectors and in the agricul-ture sector are behind these developments in Austria.
The overall reduction trend of Pb emissions was minus 93% for the period 1990 to 2015, which is mainly a result of the ban of lead in gasoline. However, abatement techniques and product substi-tutions also contributed to the emission reduction.
Persistent Organic Pollutants (POPs) Emissions of all POPs decreased remarkably from 1990 to 2015 (HCB, PAH and PCDD/F by about 60 to 80%), where the highest achievement was made until 1995. The significant in-crease of HCB emissions in the years 2012, 2013 and 2014 was due to unintentional releases of HCB by an Austrian cement plant.
In 2015 the emissions from HCB and PCB decreased compared to the previous year. The short term trend of HCB is influenced by the accidental release, as already mentioned, which is the reason for the decrease of 74% between 2014 and 2015. The slight decrease (-1.8%) of PCB between 2014 and 2015 is dependent on production activities in secondary lead production.
PAH and PCDD/F increased by 11% and by 7.4% respectively between 2014 and 2015.
Austria’s Informative Inventory Report (IIR) 2017 – Executive Summary
Umweltbundesamt REP-0609, Vienna 2017 13
The most important source for PAH, PCDD/F and HCB emissions in Austria is residential heat-ing. In the 80s industry and waste incineration were still important sources regarding POP emis-sions. Due to legal regulations concerning air quality emissions from industry and waste incin-eration decreased remarkably from 1990 to 1993. PCB emissions are almost exclusively emit-ted in NFR sector 2 Industrial Processes and Product Use (Metal Production).
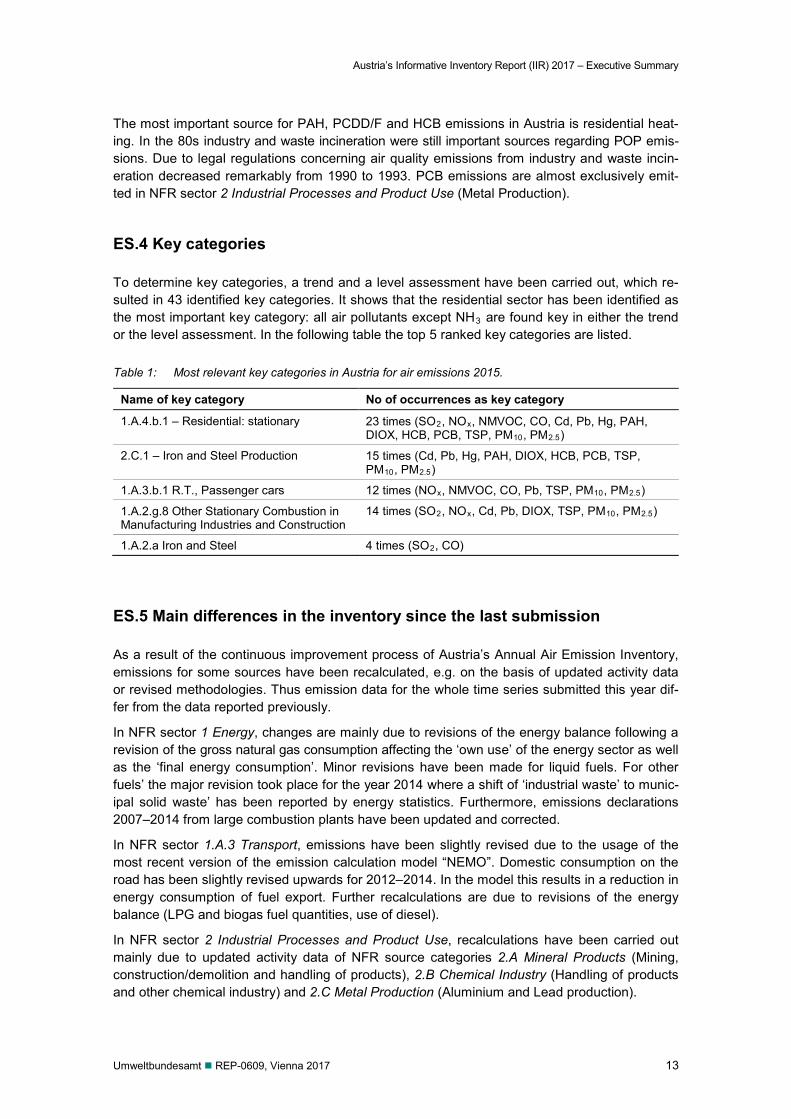
ES.4 Key categories
To determine key categories, a trend and a level assessment have been carried out, which re-sulted in 43 identified key categories. It shows that the residential sector has been identified as the most important key category: all air pollutants except NH3 are found key in either the trend or the level assessment. In the following table the top 5 ranked key categories are listed.
Table 1: Most relevant key categories in Austria for air emissions 2015.
Name of key category No of occurrences as key category
1.A.4.b.1 – Residential: stationary 23 times (SO2, NOx, NMVOC, CO, Cd, Pb, Hg, PAH, DIOX, HCB, PCB, TSP, PM10, PM2.5)
2.C.1 – Iron and Steel Production 15 times (Cd, Pb, Hg, PAH, DIOX, HCB, PCB, TSP, PM10, PM2.5)
1.A.3.b.1 R.T., Passenger cars 12 times (NOx, NMVOC, CO, Pb, TSP, PM10, PM2.5)
1.A.2.g.8 Other Stationary Combustion in Manufacturing Industries and Construction
14 times (SO2, NOx, Cd, Pb, DIOX, TSP, PM10, PM2.5)
1.A.2.a Iron and Steel 4 times (SO2, CO)
ES.5 Main differences in the inventory since the last submission
As a result of the continuous improvement process of Austria’s Annual Air Emission Inventory, emissions for some sources have been recalculated, e.g. on the basis of updated activity data or revised methodologies. Thus emission data for the whole time series submitted this year dif-fer from the data reported previously.
In NFR sector 1 Energy, changes are mainly due to revisions of the energy balance following a revision of the gross natural gas consumption affecting the ‘own use’ of the energy sector as well as the ‘final energy consumption’. Minor revisions have been made for liquid fuels. For other fuels’ the major revision took place for the year 2014 where a shift of ‘industrial waste’ to munic-ipal solid waste’ has been reported by energy statistics. Furthermore, emissions declarations 2007–2014 from large combustion plants have been updated and corrected.
In NFR sector 1.A.3 Transport, emissions have been slightly revised due to the usage of the most recent version of the emission calculation model “NEMO”. Domestic consumption on the road has been slightly revised upwards for 2012–2014. In the model this results in a reduction in energy consumption of fuel export. Further recalculations are due to revisions of the energy balance (LPG and biogas fuel quantities, use of diesel).
In NFR sector 2 Industrial Processes and Product Use, recalculations have been carried out mainly due to updated activity data of NFR source categories 2.A Mineral Products (Mining, construction/demolition and handling of products), 2.B Chemical Industry (Handling of products and other chemical industry) and 2.C Metal Production (Aluminium and Lead production).
Austria’s Informative Inventory Report (IIR) 2017 – Executive Summary
14 Umweltbundesamt REP-0609, Vienna 2017
For NFR sector 3 Agriculture, revisions were on the one hand due to methodological improve-ments like the update of NH3 and NOx emission factors according to the EMEP/EEA Emission Inventory Guidebook 2016 in the sectors manure management and agricultural soils. On the other hand, recalculations have been carried out due to updated activity data (livestock data for horses, compost and land use data).
In NFR sector 5 Waste, recalculations have been carried out because Austria has adapted its DOC of residual waste for the historical years 1950–1989. This has affected the amount of land-fill gas generated and thus also the emission values for NMVOC and NH3. Further, amounts of deposited construction waste and tar paper for the year 2010 have been corrected slightly. NMVOC emissions from 5.D Wastewater Treatment and Discharge were estimated and report-ed for the first time in this years’ submission.
For more detailed information see Chapter 7 – Recalculations and Improvements.
ES.6 Improvement Process
The Austrian Air Emission Inventory is subject to a continuous improvement programme result-ing in annual recalculations (see Chapter ES.5 above). Furthermore, the regularly conducted CLRTAP stage 3 reviews trigger improvements. The last in-depth review of the Austrian Inven-tory took place in 2010 (UNITED NATIONS 2010). The findings were commented in Table 280. The next stage 3 review will take place in 2017. In addition to the CLRTAP review, from 2017 onwards the national emission inventory data will be also checked by the European Commis-sion as set out in Article 10 of Directive 2016/2284. The inventories will be checked to verify the transparency, accuracy, consistency, comparability and completeness of information submitted and to identify possible inconsistencies with the requirements set out under international law, in particular under the LRTAP Convention.
Recalculations and improvements are summarized in Chapter 7 – Recalculations and Improve-ments and described in detail in the sector-specific chapters of this report.
Austria’s Informative Inventory Report (IIR) 2017 – Introduction
Umweltbundesamt REP-0609, Vienna 2017 15
1 INTRODUCTION
1.1 National inventory background
The Federal Ministry of Agriculture, Forestry, Environment and Water Management (BMLFUW)8 administrates Austria’s reporting obligations to the Convention on Long-range Transboundary Air Pollution (LRTAP)9 of the United Nations Eco-
nomic Commission for Europe (UNECE),10 United Nations Framework Convention on Climate Change (UNFCCC),11 European Commission (EC),12 and the European Environment Agency (EEA).13
The Environmental Control Act (“Umweltkontrollgesetz”; Federal Law Gazette 152/1998)14 that entered into force on the 1st of January 1999 regulates responsibilities of environmental control in Austria and lists the tasks of the Umweltbundesamt. The Umweltbundesamt is designated as single national entity with overall responsibility for inventory preparation.
Furthermore, the Environmental Control Act incorporates the Umweltbundesamt as a private lim-ited company. To ensure that the Umweltbundesamt has the resources required to fulfil all listed tasks, the financing is set up as a fixed amount of money annually allocated to the Umweltbun-desamt. The Umweltbundesamt is free to manage this so called “basic funding”, provided that the tasks are fulfilled. Projects beyond the scope of the Environmental Control Act are financed on project basis by the contracting entity, which may be national or EC authorities as well as private entities.
One task is the preparation of technical expertise and the data basis for fulfilment of the obliga-tions under the UNFCCC, UNECE and EC. Thus the Umweltbundesamt prepares and annually updates the Austrian Air Emissions Inventory (“Österreichische Luftschadstoff-Inventur OLI”), which covers greenhouse gases and emissions of other air pollutants as stipulated in the report-ing obligations further explained in Chapter 1.2.2.
For the Umweltbundesamt, a national air emission inventory that identifies and quantifies the sources of pollutants in a consistent manner is of a high priority. Such an inventory provides a common means for comparing the relative contribution of different emission sources and hence can serve as an important basis for policies to reduce emissions.
1.2 Institutional, legal and procedural arrangements
The Umweltbundesamt established an Inspection Body for Emission Inventories (IBE, hereinaf-ter also referred to as inspection body) which is entrusted with the preparation of emission in-ventories as assigned to the Umweltbundesamt as described above (refer to Chapter 1.1). So, since 23 December 2005, the Umweltbundesamt is accredited as Inspection Body for Emission
8 http://www.bmlfuw.gv.at/ 9 https://www.unece.org/env/lrtap/welcome.html 10 http://www.unece.org 11 http://unfccc.int/2860.php 12 http://ec.europa.eu/index_en.htm 13 http://www.eea.europa.eu/ 14 http://www.umweltbundesamt.at/fileadmin/site/umweltkontrolle/gesetze/ukg.pdf
Austria’s Informative Inventory Report (IIR) 2017 – Introduction
16 Umweltbundesamt REP-0609, Vienna 2017
Inventories, Type A (Id.No. 241), in accordance with EN ISO/IEC 17020 and the Austrian Ac-creditation Law (AkkG),15 by decree of Accreditation Austria/Federal Ministry of Economics, Family and Youth (No. BMWA-92.715/0036-I/12/2005), issued on 19 January 2006.
The accreditation comprises the emission inventory for all GHGs and air pollutants as reported under the UNFCCC and the Kyoto Protocol, the EC Monitoring Mechanism as well as the UNECE and NEC (see Chapter 1.6).
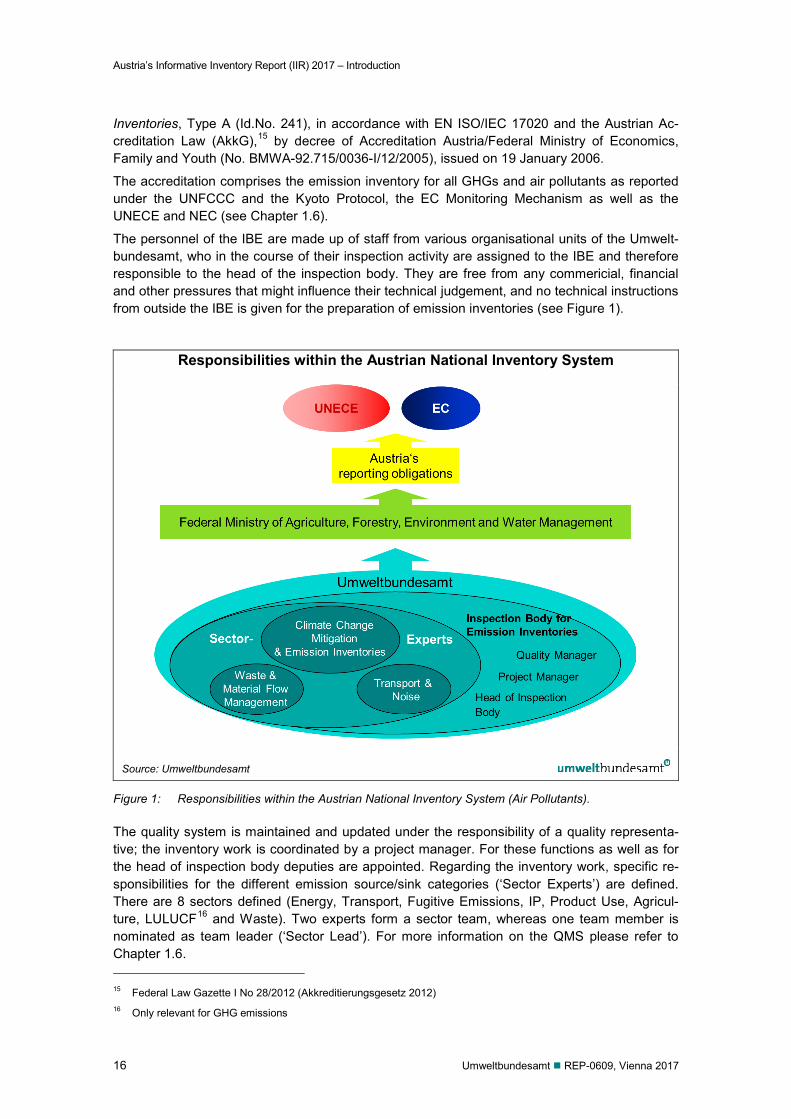
The personnel of the IBE are made up of staff from various organisational units of the Umwelt-bundesamt, who in the course of their inspection activity are assigned to the IBE and therefore responsible to the head of the inspection body. They are free from any commericial, financial and other pressures that might influence their technical judgement, and no technical instructions from outside the IBE is given for the preparation of emission inventories (see Figure 1).
Responsibilities within the Austrian National Inventory System
Figure 1: Responsibilities within the Austrian National Inventory System (Air Pollutants).
The quality system is maintained and updated under the responsibility of a quality representa-tive; the inventory work is coordinated by a project manager. For these functions as well as for the head of inspection body deputies are appointed. Regarding the inventory work, specific re-sponsibilities for the different emission source/sink categories (‘Sector Experts’) are defined. There are 8 sectors defined (Energy, Transport, Fugitive Emissions, IP, Product Use, Agricul-ture, LULUCF16 and Waste). Two experts form a sector team, whereas one team member is nominated as team leader (‘Sector Lead’). For more information on the QMS please refer to Chapter 1.6. 15 Federal Law Gazette I No 28/2012 (Akkreditierungsgesetz 2012) 16 Only relevant for GHG emissions
Source: Umweltbundesamt
Austria’s Informative Inventory Report (IIR) 2017 – Introduction
Umweltbundesamt REP-0609, Vienna 2017 17
In addition, the Austrian emissions trading registry is managed by the Umweltbundesamt on be-half of the Federal Ministry of Agriculture, Forestry, Environment and Water Management. This mandate was given to the Umweltbundesamt in the Registry Ordinance (Registerstellenver-ordnung) Federal Law Gazette II no. 208/2012. Umweltbundesamt is responsible for the opera-tional management of the registry and serves as a contact point for national and international authorities.
The Austrian emissions trading registry has been operational since 2005 and serves both as registry for the EU Emissions Trading scheme and as the national registry for Austria as a party of the Kyoto Protocol.
Besides the Environmental Control Act there are some other legal and institutional arrange-ments in place as the main basis for the national system: Ordinance regarding Monitoring and Reporting of Greenhouse Gas Emissions17 This ordinance pertains to the Austrian Emissions Certificate Trading Act18 that regulates
monitoring and reporting in the context of the EU Emissions Trading scheme (ETS) in Austria. Paragraph 15 of this ordinance is designed to ensure consistency of emission trading data
with the national inventory. It states that the Umweltbundesamt has to incorporate, as far as necessary, the emission reports of the emissions trading scheme into the national greenhouse gas inventory in order to comply with requirements of the EU Monitoring Mechanism and the UNFCCC. This is not only important for emissions from combustion of fuels, where more de-tailed information than provided in the national energy balance is available, but also for emis-sions from industrial processes, where the ordinance ensures data availability for most key categories (see Chapter 4 for details). First data from the EU ETS were available for the year 2005; since then ETS data were considered in the submissions.
The Austrian statistical office (Statistik Austria) is required by contract with the Federal Minis-try of Agriculture, Forestry, Environment and Water Management (BMLFUW) and with the Federal Ministry of Science, Research and Economy (BMWFW) to annually prepare the na-tional energy balance (the contracts also cover some quality aspects). The energy balance is prepared in line with the methodology of the Organisation for Economic Co-operation and De-velopment (OECD) and is submitted annually to the International Energy Agency (IEA) (IEA/EUROSTAT Joint Questionnaire (JQ) Submission). The national energy balance is the most important data basis for the Austrian Air Emissions Inventory.
According to national legislation (Bundesstatistikgesetz19), the Austrian statistical office has to prepare annual import/export statistics, production statistics and statistics on agricultural issues (livestock counts etc.), providing an important data basis for calculating emissions from the sectors Industrial Processes and Product Use and Agriculture.
In order to comply with the reporting obligations, the Umweltbundesamt has the possibility to obtain confidential data from the national statistical institute (of course these data have to be treated confidentially). The legal basis for this data exchange is the „Bundesstatistikgesetz” (federal statistics law), which allows the national statistical office to provide confidential data to authorities that have a legal obligation for the processing of these data.
According to para 17 (1) of the (EG-K)20 each licencee of an operating boiler with a thermal capacity of 2 megawatts (MW) or more is obligated to report the emissions to the competent authority. The Umweltbundesamt can request copies of these emission declarations. These data are used to verify the data from the national energy balance for the Energy sector.
17 „Verordnung des Bundesministers für Land- und Forstwirtschaft, Umwelt und Wasserwirtschaft über die Überwa-
chung und Berichterstattung betreffend Emissionen von Treibhausgasen“; Federal Law Gazette II No. 458/2004 18 „Emissionszertifikate-Gesetz”; Federal Law Gazette I No. 46/2004 19 „Bundesstatistikgesetz”; Federal Law Gazette I No. 163/1999 20 „Emissionsschutzgesetz für Kesselanlagen“; Federal Law Gazette I No. 150/2004
Austria’s Informative Inventory Report (IIR) 2017 – Introduction
18 Umweltbundesamt REP-0609, Vienna 2017
According to the Landfill Ordinance (Deponieverordnung)21 the operators of landfill sites have to report type and amount of waste deposited annually. These reports (collected in a central database) provide the main basis for calculating emissions from the sector Waste.
Until 2008 the Umweltbundesamt has run a landfill database for solid waste disposals (Depo-niedatenbank), where the data (reports) provided by the landfill operators were incorporated.
However, since 2009 – starting with the deposited waste of the year 2008 – landfill operators are obliged to register their data electronically at the portal of http://edm.gv.at (Electronic Data Management).22 Responsible for data collection and analysis is the BMLFUW. The nec-essary data is requested by the Umweltbundesamt for the purpose of inventory preparation.
Since 2004 there is a reporting obligation to the BMLFUW under the Austrian Fluorinated Compounds (FC) Ordinance23 for users of FCs for the following applications: refrigeration and air-conditioning, foam blowing, semiconductor manufacture, electrical equipment, fire ex-tinguishers and aerosols. These data are notified via EDM and used for estimating emissions from the consumption of fluorinated compounds (IPCC sector 2.F).
More information on the National Inventory System in Austria (NISA) is provided in the following Chapter 1.2.1.
21 „Deponieverordnung“; Federal Law Gazette No 164/1996, last amended by by Federal Law Gazette II No 49/2004 22 „Deponieverordnung 2008“; Federal Law Gazette II No 39/2008 23 „Industriegas-Verordnung (HFKW-FKW-SF6-VO)“; Federal Law Gazette II No. 447/2002
Austria’s Informative Inventory Report (IIR) 2017 – Introduction
Umweltbundesamt REP-0609, Vienna 2017 19
1.2.1 National Inventory System Austria (NISA)
History of the National Inventory System Austria – NISA
Austria’s National Inventory System (NISA) has to be adapted to different obligations which are subject to continuous development. A brief history of the development and the activities of NISA is provided below:
Austria established estimates for SO2 under EMEP in 1978 (Cooperative Programme for Monitoring and Evaluation of the Long-range Transmission of Air Pollutants in Europe).24
As an EFTA25 country, Austria participated in CORINAIR 90,26/27 an air emission inventory for Europe. It was part of the CORINE (Coordination d’Information Environmentale) work plan set up by the European Council of Ministers in 1985. The aim of CORINAIR 90 was to pro-duce a complete, consistent and transparent emission inventory for the following pollutants: SOx as SO2, NOx as NO2, NMVOC, CH4, CO, CO2, N2O and NH3.
Austria signed the UNFCCC on June 8, 1992 and subsequently submitted its instrument of ratification on February 28, 1994.28 The Convention i.a. includes the commitment to prepare an emission inventory for GHG on a regular basis.
In 1994, the first so-called Austrian Air Emission Inventory (Österreichische Luftschadstoff-Inventur, OLI) was prepared.
In 1997, a consistent time series for the emission data from 1980 to 1995 was reported for the first time.
In 1998, also emissions of heavy metals (HM), persistent organic pollutants (POP) and fluori-nated compounds (FC) such as SF6, PFCs and HFCs were included in the inventory.
Austria signed the KYOTO PROTOCOL on April 4, 1998 and subsequently submitted its in-strument of ratification on May 31, 2002.
Inventory data for particulate matter (PM) were included in the inventory in 2001. The accreditation as Inspection Body for Emission Inventories according to ISO/IEC 17020
was awarded in 2005 and has been renewed in 2011 and 2015.
For more details on NISA, see the report “NISA – NATIONAL INVENTORY SYSTEM AUSTRIA – Implementation Report”29 which presents an overview of NISA and evaluates its compliance with the guidelines for national systems under Article 5, paragraph 1, of the Kyoto Protocol as specified under the Marrakesh Accord (decision 20/CP.7).30
Organisation of the National Inventory System Austria – NISA
Regulations under the UNECE/LRTAP Convention and its Protocols define and continuously improve standards for the preparation of and reporting on national emission inventories. In 2002, the Executive Body31 adopted new guidelines for estimating and reporting emission data to en- 24 http://www.emep.int/ 25 EFTA: European Free Trade Association; http://www.efta.int/ 26 The CORINAIR system has been integrated into the work programme of the European Environment Agency (EEA)
and the work is continuing through the Agency’s European Topic Centre on Air Emissions (ETC/ACC) (http://air-climate.eionet.europa.eu/).
27 http://www.eea.europa.eu/publications/topic_report_1996_21 28 http://unfccc.int/essential_background/convention/status_of_ratification/items/2631.php 29 http://www.umweltbundesamt.at/fileadmin/site/publikationen/REP0004.pdf 30 http://unfccc.int/resource/docs/cop7/13a03.pdf#page=2 31 http://www.unece.org/environmental-policy/conventions/envlrtapwelcome/convention-bodies/executive-
body.html
Austria’s Informative Inventory Report (IIR) 2017 – Introduction
20 Umweltbundesamt REP-0609, Vienna 2017
sure that the transparency, consistency, comparability, completeness and accuracy of reported emissions are adequate for current LRTAP Conventions needs (EB.AIR/GE.1/2002/732 and its supporting addendum).
The submission is in accordance with the revised Guidelines for Reporting Emission Data under the Convention on Long-range Transboundary Air Pollution (ECE/EB:AIR/125).
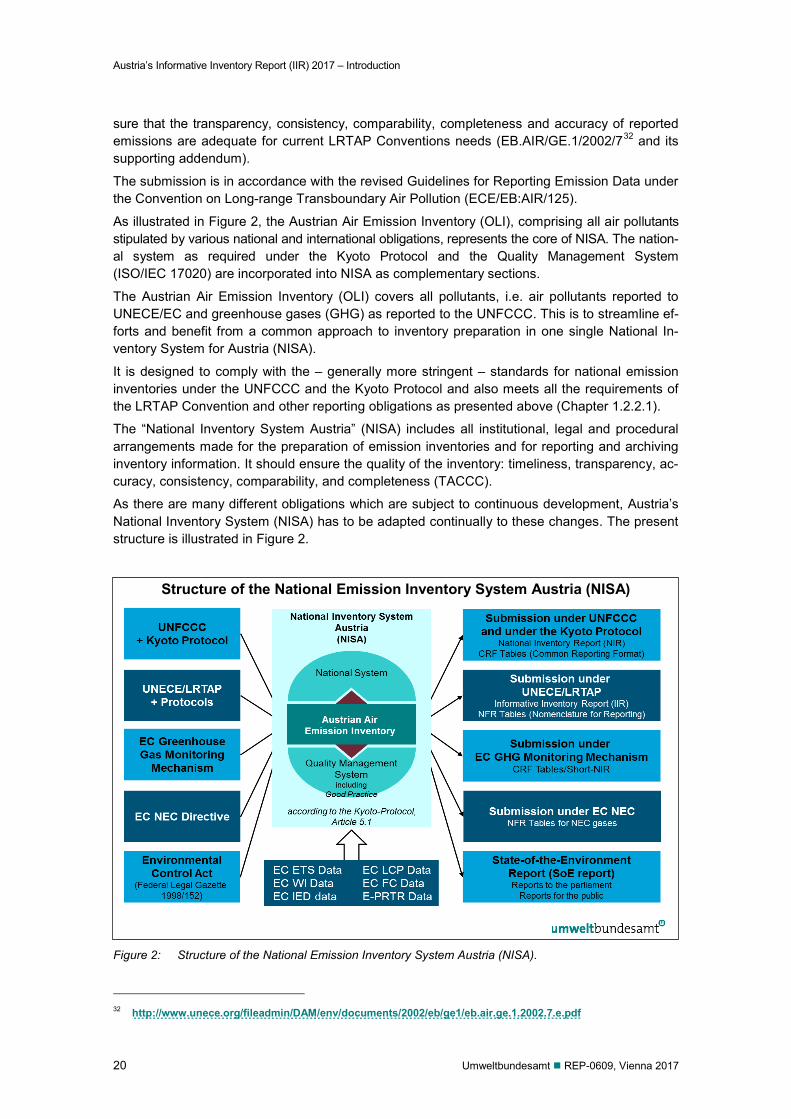
As illustrated in Figure 2, the Austrian Air Emission Inventory (OLI), comprising all air pollutants stipulated by various national and international obligations, represents the core of NISA. The nation-al system as required under the Kyoto Protocol and the Quality Management System (ISO/IEC 17020) are incorporated into NISA as complementary sections.
The Austrian Air Emission Inventory (OLI) covers all pollutants, i.e. air pollutants reported to UNECE/EC and greenhouse gases (GHG) as reported to the UNFCCC. This is to streamline ef-forts and benefit from a common approach to inventory preparation in one single National In-ventory System for Austria (NISA).
It is designed to comply with the – generally more stringent – standards for national emission inventories under the UNFCCC and the Kyoto Protocol and also meets all the requirements of the LRTAP Convention and other reporting obligations as presented above (Chapter 1.2.2.1).
The “National Inventory System Austria” (NISA) includes all institutional, legal and procedural arrangements made for the preparation of emission inventories and for reporting and archiving inventory information. It should ensure the quality of the inventory: timeliness, transparency, ac-curacy, consistency, comparability, and completeness (TACCC).
As there are many different obligations which are subject to continuous development, Austria’s National Inventory System (NISA) has to be adapted continually to these changes. The present structure is illustrated in Figure 2.
Structure of the National Emission Inventory System Austria (NISA)
Figure 2: Structure of the National Emission Inventory System Austria (NISA).
32 http://www.unece.org/fileadmin/DAM/env/documents/2002/eb/ge1/eb.air.ge.1.2002.7.e.pdf
Austria’s Informative Inventory Report (IIR) 2017 – Introduction
Umweltbundesamt REP-0609, Vienna 2017 21
1.2.2 Austria’s Obligations
Austria has to comply with the following air emission related obligations: UNECE Convention on Long-range Transboundary Air Pollution (LRTAP) and its Protocols
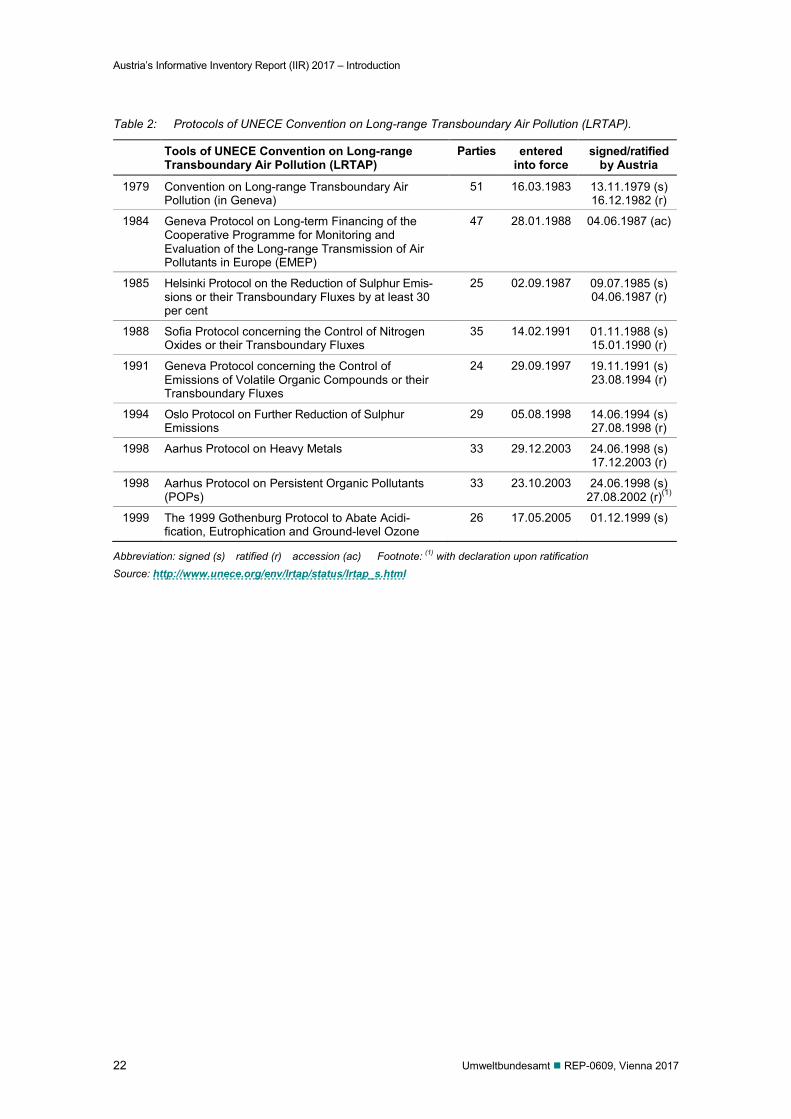
comprising the annual reporting of national emission data on SO2, NOx, NMVOCs, NH3, CO, TSP, PM10, and PM2.5 as well as on the heavy metals Pb, Cd and Hg and persistent organic hydrocarbons (PAHs), dioxins and furans (PCDD/F), hexachlorobenzene (HCB) and Poly-chlorinated biphenyls (PCBs). Austria signed the convention in 1979; since its entry into force in 1983, the Convention has been extended by eight protocols which identify specific obliga-tions or measures to be taken by Parties. These obligations as well as information regarding the status of ratification are listed in Table 2.
Directive (EU) 2016/228433 on the reduction of national emissions of certain atmospheric pol-lutants (NEC-Directive) of the European Parliament and of the Council of 14.12.2016, amend-ing Directive 2003/35/EC and repealing Directive 2001/81/EC34. The national air emission ceilings law35 transposes the NEC Directive into Austrian national legislation.
„United Nations Framework Convention on Climate Change” (UNFCCC) (1992)36 and the Kyoto Protocol (1997).37 European Council Decision 525/2013/EC38 “Monitoring Mechanism Regulation” on a mecha-
nism for monitoring and reporting greenhouse gas emissions and for reporting other infor-mation at national and Union level relevant to climate change.
Austrian “ambient air quality act”39 comprising the reporting of national emission data on SO2, NOx, NMVOC, CO, heavy metals (Pb, Cd, Hg), benzene and particulate matter (PM).
Industrial Emissions Directive 2010/75/EU40 which requires the reporting of air emissions from various industrial activities.
E-PRTR Regulation (EC) No 166/200641 concerning the establishment of a European Pollu-tant Release and Transfer Register. E-PRTR is associated with Article 6 of the Aarhus Con-vention (United Nations: Aarhus, 1998) which refers to the right of the public to access envi-ronmental information and to participate in the decision-making process on environmental is-sues.
33 http://eur-lex.europa.eu/legal-content/EN/TXT/PDF/?uri=CELEX:32016L2284&from=EN 34 http://www.umweltbundesamt.at/fileadmin/site/umweltthemen/luft/Richtlinie_2001.81.EG.pdf 35 Emissionshöchstmengengesetz-Luft EG-L (air emissions ceilings law)
https://www.ris.bka.gv.at/GeltendeFassung.wxe?Abfrage=Bundesnormen&Gesetzesnummer=20002763 36 http://unfccc.int/essential_background/convention/status_of_ratification/items/2631.php 37 http://unfccc.int/files/essential_background/kyoto_protocol/application/pdf/kpstats.pdf 38 http://eur-lex.europa.eu/LexUriServ/LexUriServ.do?uri=OJ:L:2013:165:0013:0040:EN:PDF
(repealing Decision 280/2004/EC) 39 Immissionsschutzgesetz-Luft IG-L (ambient air quality law)
https://www.ris.bka.gv.at/GeltendeFassung.wxe?Abfrage=Bundesnormen&Gesetzesnummer=10011027 40 http://eur-lex.europa.eu/LexUriServ/LexUriServ.do?uri=OJ:L:2010:334:0017:0119:en:PDF 41 http://eur-lex.europa.eu/LexUriServ/LexUriServ.do?uri=OJ:L:2006:033:0001:0017:EN:PDF
Austria’s Informative Inventory Report (IIR) 2017 – Introduction
22 Umweltbundesamt REP-0609, Vienna 2017
Table 2: Protocols of UNECE Convention on Long-range Transboundary Air Pollution (LRTAP).
Tools of UNECE Convention on Long-range Transboundary Air Pollution (LRTAP)
Parties entered into force
signed/ratified by Austria
1979 Convention on Long-range Transboundary Air Pollution (in Geneva)
51 16.03.1983 13.11.1979 (s) 16.12.1982 (r)
1984 Geneva Protocol on Long-term Financing of the Cooperative Programme for Monitoring and Evaluation of the Long-range Transmission of Air Pollutants in Europe (EMEP)
47 28.01.1988 04.06.1987 (ac)
1985 Helsinki Protocol on the Reduction of Sulphur Emis-sions or their Transboundary Fluxes by at least 30 per cent
25 02.09.1987 09.07.1985 (s) 04.06.1987 (r)
1988 Sofia Protocol concerning the Control of Nitrogen Oxides or their Transboundary Fluxes
35 14.02.1991 01.11.1988 (s) 15.01.1990 (r)
1991 Geneva Protocol concerning the Control of Emissions of Volatile Organic Compounds or their Transboundary Fluxes
24 29.09.1997 19.11.1991 (s) 23.08.1994 (r)
1994 Oslo Protocol on Further Reduction of Sulphur Emissions
29 05.08.1998 14.06.1994 (s) 27.08.1998 (r)
1998 Aarhus Protocol on Heavy Metals 33 29.12.2003 24.06.1998 (s) 17.12.2003 (r)
1998 Aarhus Protocol on Persistent Organic Pollutants (POPs)
33 23.10.2003 24.06.1998 (s) 27.08.2002 (r)(1)
1999 The 1999 Gothenburg Protocol to Abate Acidi-fication, Eutrophication and Ground-level Ozone
26 17.05.2005 01.12.1999 (s)
Abbreviation: signed (s) ratified (r) accession (ac) Footnote: (1) with declaration upon ratification Source: http://www.unece.org/env/lrtap/status/lrtap_s.html
Austria’s Informative Inventory Report (IIR) 2017 – Introduction
Umweltbundesamt REP-0609, Vienna 2017 23
1.2.2.1 Reporting obligation under the UNECE/LRTAP Convention and its Protocols
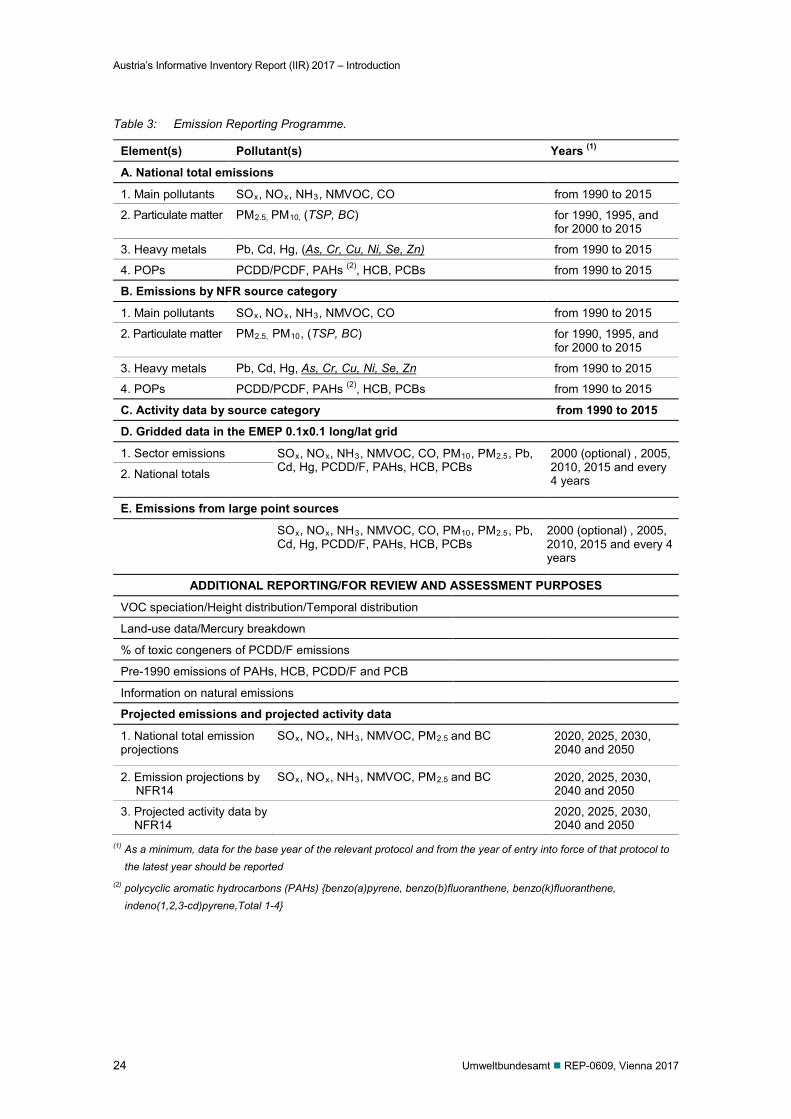
As a minimum requirement, each Party shall report on emissions of the substances relevant to the Protocol to which they are a Party, as required by that Protocol. Since Austria has ratified all protocols to the UNECE/LRTAP Convention (with the exception of the Gothenburg Protocol), the annual reporting obligation enfolds emission data of four groups: main pollutants, particulate matter (PM), heavy metals, and POPs. Table 3, taken from the Reporting Guidelines, gives the present set of components which have to be reported (minimum) and which should be reported voluntarily (additionally).
This report follows the regulations under the UNECE/LRTAP Convention and its Protocols that define standards for national emission inventories. In 2008, the Executive Body adopted the Guidelines for Reporting Emission Data under the Convention on Long-Range Transboundary Air Pollution (LRTAP) (ECE/EB.AIR/97)42/43 for estimating and reporting of emission data. They are necessary to ensure transparency, accuracy, consistency, comparability and completeness (TACCC) of the reported emissions. In 2014 the Reporting Guidelines were revised (ECE/EB.AIR.125)44 and were adopted for application in 2015 and subsequent years.
The data presented in this report were compiled according to the Reporting Guidelines for esti-mating and reporting emission data, which also define the new reporting format (Nomenclature for Reporting – NFR (latest version of the templates ‘NFR14’45 dated 17.4.2014)) as well as standards for providing supporting documentation which should ensure the transparency of the inventory.
42 http://www.ceip.at/fileadmin/inhalte/emep/reporting_2009/Rep_Guidelines_ECE_EB_AIR_97_e.pdf 43 At its twenty-sixth session (15–18 December 2008), the Executive Body approved the revised Guidelines
(ECE/EB.AIR/2008/4) as amended at the session and requested the secretariat to circulate a final amended ver-sion.
44 http://www.ceip.at/fileadmin/inhalte/emep/2014_Guidelines/ece.eb.air.125_ADVANCE_VERSION_reporting_ guidelines_2013.pdf
45 NFR14 – http://www.ceip.at/ms/ceip_home1/ceip_home/reporting_instructions/
Austria’s Informative Inventory Report (IIR) 2017 – Introduction
24 Umweltbundesamt REP-0609, Vienna 2017
Table 3: Emission Reporting Programme.
Element(s) Pollutant(s) Years (1)
A. National total emissions
1. Main pollutants SOx, NOx, NH3, NMVOC, CO from 1990 to 2015
2. Particulate matter PM2.5, PM10, (TSP, BC) for 1990, 1995, and for 2000 to 2015
3. Heavy metals Pb, Cd, Hg, (As, Cr, Cu, Ni, Se, Zn) from 1990 to 2015
4. POPs PCDD/PCDF, PAHs (2), HCB, PCBs from 1990 to 2015
B. Emissions by NFR source category
1. Main pollutants SOx, NOx, NH3, NMVOC, CO from 1990 to 2015
2. Particulate matter PM2.5, PM10, (TSP, BC) for 1990, 1995, and for 2000 to 2015
3. Heavy metals Pb, Cd, Hg, As, Cr, Cu, Ni, Se, Zn from 1990 to 2015
4. POPs PCDD/PCDF, PAHs (2), HCB, PCBs from 1990 to 2015
C. Activity data by source category from 1990 to 2015
D. Gridded data in the EMEP 0.1x0.1 long/lat grid
1. Sector emissions SOx, NOx, NH3, NMVOC, CO, PM10, PM2.5, Pb, Cd, Hg, PCDD/F, PAHs, HCB, PCBs
2000 (optional) , 2005, 2010, 2015 and every 4 years 2. National totals
E. Emissions from large point sources
SOx, NOx, NH3, NMVOC, CO, PM10, PM2.5, Pb, Cd, Hg, PCDD/F, PAHs, HCB, PCBs
2000 (optional) , 2005, 2010, 2015 and every 4 years
ADDITIONAL REPORTING/FOR REVIEW AND ASSESSMENT PURPOSES
VOC speciation/Height distribution/Temporal distribution
Land-use data/Mercury breakdown
% of toxic congeners of PCDD/F emissions
Pre-1990 emissions of PAHs, HCB, PCDD/F and PCB
Information on natural emissions
Projected emissions and projected activity data
1. National total emission projections
SOx, NOx, NH3, NMVOC, PM2.5 and BC
2020, 2025, 2030, 2040 and 2050
2. Emission projections by NFR14
SOx, NOx, NH3, NMVOC, PM2.5 and BC 2020, 2025, 2030, 2040 and 2050
3. Projected activity data by NFR14
2020, 2025, 2030, 2040 and 2050
(1) As a minimum, data for the base year of the relevant protocol and from the year of entry into force of that protocol to the latest year should be reported
(2) polycyclic aromatic hydrocarbons (PAHs) {benzo(a)pyrene, benzo(b)fluoranthene, benzo(k)fluoranthene, indeno(1,2,3-cd)pyrene,Total 1-4}
Austria’s Informative Inventory Report (IIR) 2017 – Introduction
Umweltbundesamt REP-0609, Vienna 2017 25
1.2.2.2 Reporting obligation under Directive (EU) 2016/2284 on the reduction of national emissions of certain atmospheric pollutants (NEC-Directive)
According to Article 8 of NEC Directive 2016/2284 and Annex I, Table A, Member States shall prepare and annually update national emission inventories for the pollutants SOx, NOx, NH3, NMVOC, CO, heavy metals (Cd, Hg, Pb), POPs (total PAHs, PCBs, HCB), PM2,5, PM10 and, if available, BC. Austria reports the national emission totals calculated on the basis of fuel used (thus excluding emissions from fuel exports in the vehicle tank) for compliance assessment un-der the NEC Directive.
Additionally, Member States shall prepare and update every four years spatially disaggregated national emission inventories and large point source inventories and, every two years, national emission projections for part of these pollutants as set out in the NEC Directive 2016/2284, An-nex I, Table C.
Member States’ submissions of national emission inventories and projections shall be accom-panied by an informative inventory report (this report). The report follows the regulations under the UNECE/LRTAP Convention and its Protocols that define standards for national emission in-ventories (see chapter 1.2.2.1).
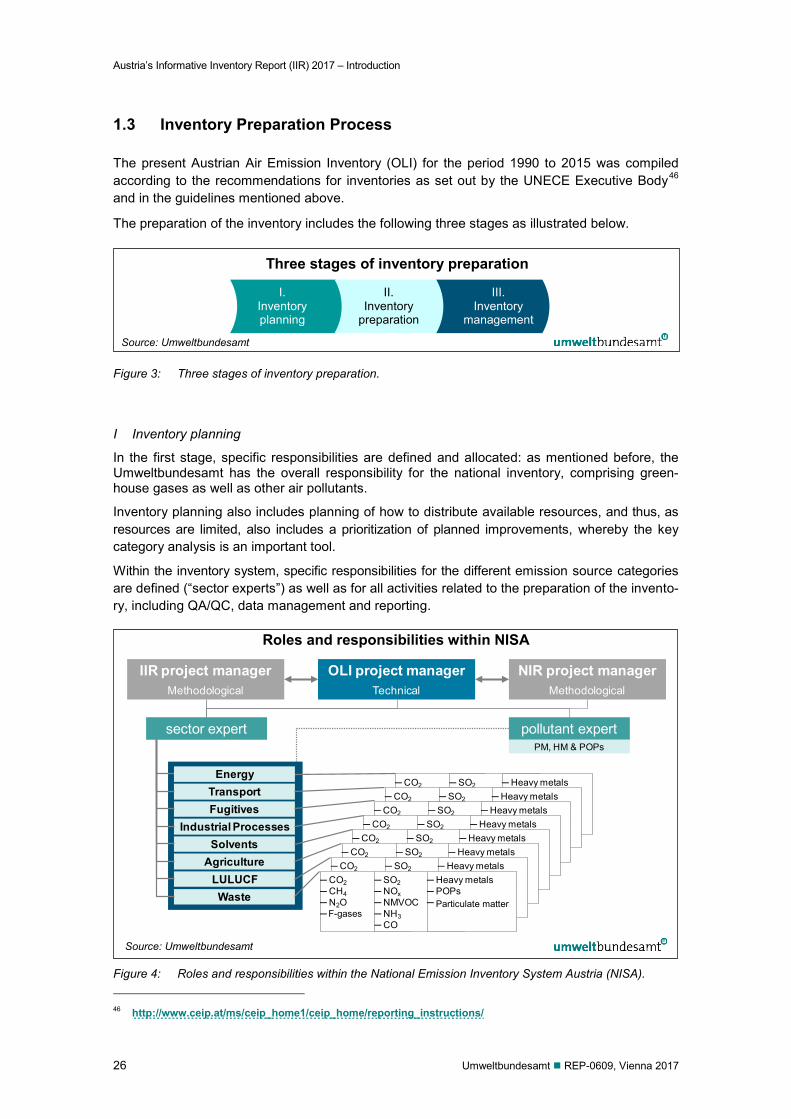
Austria’s Informative Inventory Report (IIR) 2017 – Introduction
26 Umweltbundesamt REP-0609, Vienna 2017
1.3 Inventory Preparation Process
The present Austrian Air Emission Inventory (OLI) for the period 1990 to 2015 was compiled according to the recommendations for inventories as set out by the UNECE Executive Body46 and in the guidelines mentioned above.
The preparation of the inventory includes the following three stages as illustrated below.
Figure 3: Three stages of inventory preparation.
I Inventory planning
In the first stage, specific responsibilities are defined and allocated: as mentioned before, the Umweltbundesamt has the overall responsibility for the national inventory, comprising green-house gases as well as other air pollutants.
Inventory planning also includes planning of how to distribute available resources, and thus, as resources are limited, also includes a prioritization of planned improvements, whereby the key category analysis is an important tool.
Within the inventory system, specific responsibilities for the different emission source categories are defined (“sector experts”) as well as for all activities related to the preparation of the invento-ry, including QA/QC, data management and reporting.
Roles and responsibilities within NISA
Figure 4: Roles and responsibilities within the National Emission Inventory System Austria (NISA). 46 http://www.ceip.at/ms/ceip_home1/ceip_home/reporting_instructions/
NIR project managerMethodological
IIR project managerMethodological
OLI project managerTechnical
pollutant expert
Transport
Industrial ProcessesSolvents
AgricultureLULUCFWaste
Fugitives
sector expert
─ CO2─ CH4─ N2O─ F-gasses
─ SO2─ NOx─ NMVOC─ NH3─ CO
─ Heavy metals─ POPs─ Particular matter
─ CO2─ CH4─ N2O─ F-gasses
─ SO2─ NOx─ NMVOC─ NH3─ CO
─ Heavy metals─ POPs─ Particular matter
─ CO2─ CH4─ N2O─ F-gasses
─ SO2─ NOx─ NMVOC─ NH3─ CO
─ Heavy metals─ POPs─ Particular matter
─ CO2─ CH4─ N2O─ F-gasses
─ SO2─ NOx─ NMVOC─ NH3─ CO
─ Heavy metals─ POPs─ Particular matter
─ CO2─ CH4─ N2O─ F-gasses
─ SO2─ NOx─ NMVOC─ NH3─ CO
─ Heavy metals─ POPs─ Particular matter
─ CO2─ CH4─ N2O─ F-gasses
─ SO2─ NOx─ NMVOC─ NH3─ CO
─ Heavy metals─ POPs─ Particular matter
─ CO2─ CH4─ N2O─ F-gasses
─ SO2─ NOx─ NMVOC─ NH3─ CO
─ Heavy metals─ POPs─ Particular matter
─ CO2─ CH4─ N2O─ F-gasses
─ SO2─ NOx─ NMVOC─ NH3─ CO
─ Heavy metals─ POPs─ Particular matter
PM, HM & POPs
Energy
I. Inventory planning
II. Inventory
preparation
III. Inventory
management
Source: Umweltbundesamt
Source: Umweltbundesamt
Particulate matter
Three stages of inventory preparation
F-gases
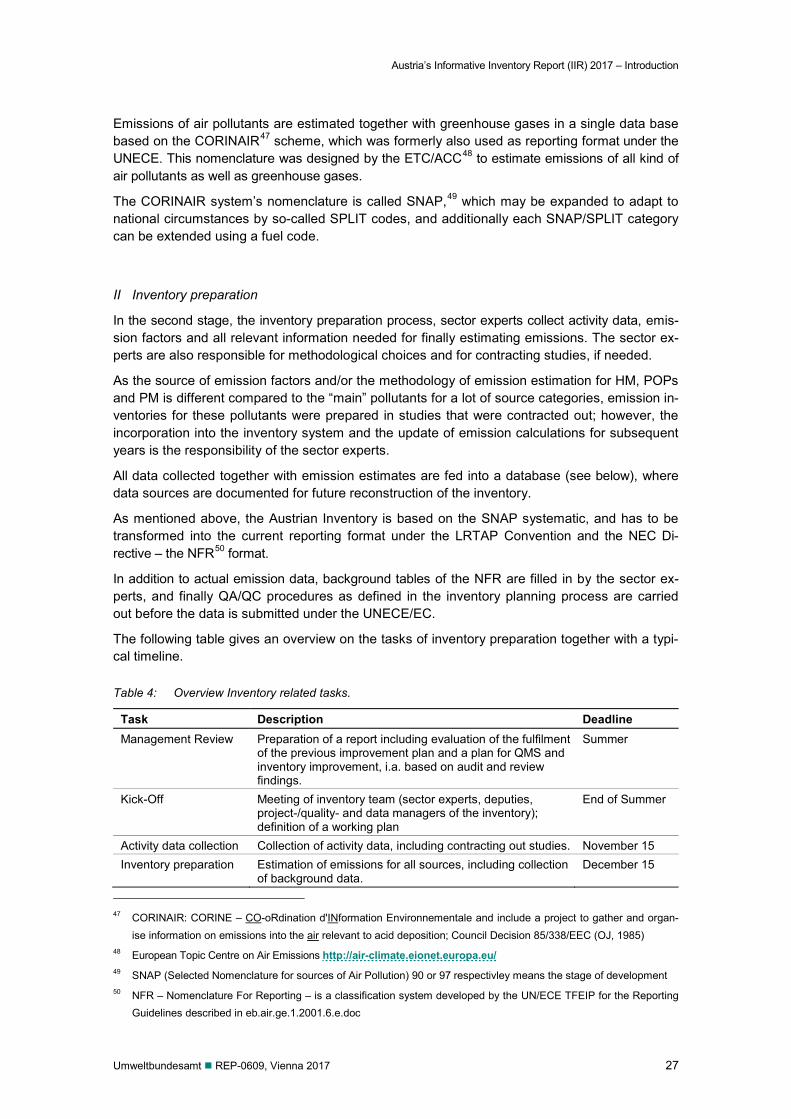
Austria’s Informative Inventory Report (IIR) 2017 – Introduction
Umweltbundesamt REP-0609, Vienna 2017 27
Emissions of air pollutants are estimated together with greenhouse gases in a single data base based on the CORINAIR47 scheme, which was formerly also used as reporting format under the UNECE. This nomenclature was designed by the ETC/ACC48 to estimate emissions of all kind of air pollutants as well as greenhouse gases.
The CORINAIR system’s nomenclature is called SNAP,49 which may be expanded to adapt to national circumstances by so-called SPLIT codes, and additionally each SNAP/SPLIT category can be extended using a fuel code.
II Inventory preparation
In the second stage, the inventory preparation process, sector experts collect activity data, emis-sion factors and all relevant information needed for finally estimating emissions. The sector ex-perts are also responsible for methodological choices and for contracting studies, if needed.
As the source of emission factors and/or the methodology of emission estimation for HM, POPs and PM is different compared to the “main” pollutants for a lot of source categories, emission in-ventories for these pollutants were prepared in studies that were contracted out; however, the incorporation into the inventory system and the update of emission calculations for subsequent years is the responsibility of the sector experts.
All data collected together with emission estimates are fed into a database (see below), where data sources are documented for future reconstruction of the inventory.
As mentioned above, the Austrian Inventory is based on the SNAP systematic, and has to be transformed into the current reporting format under the LRTAP Convention and the NEC Di-rective – the NFR50 format.
In addition to actual emission data, background tables of the NFR are filled in by the sector ex-perts, and finally QA/QC procedures as defined in the inventory planning process are carried out before the data is submitted under the UNECE/EC.
The following table gives an overview on the tasks of inventory preparation together with a typi-cal timeline.
Table 4: Overview Inventory related tasks.
Task Description Deadline Management Review Preparation of a report including evaluation of the fulfilment
of the previous improvement plan and a plan for QMS and inventory improvement, i.a. based on audit and review findings.
Summer
Kick-Off Meeting of inventory team (sector experts, deputies, project-/quality- and data managers of the inventory); definition of a working plan
End of Summer
Activity data collection Collection of activity data, including contracting out studies. November 15 Inventory preparation Estimation of emissions for all sources, including collection
of background data. December 15
47 CORINAIR: CORINE – CO-oRdination d'INformation Environnementale and include a project to gather and organ-
ise information on emissions into the air relevant to acid deposition; Council Decision 85/338/EEC (OJ, 1985) 48 European Topic Centre on Air Emissions http://air-climate.eionet.europa.eu/ 49 SNAP (Selected Nomenclature for sources of Air Pollution) 90 or 97 respectivley means the stage of development 50 NFR – Nomenclature For Reporting – is a classification system developed by the UN/ECE TFEIP for the Reporting
Guidelines described in eb.air.ge.1.2001.6.e.doc
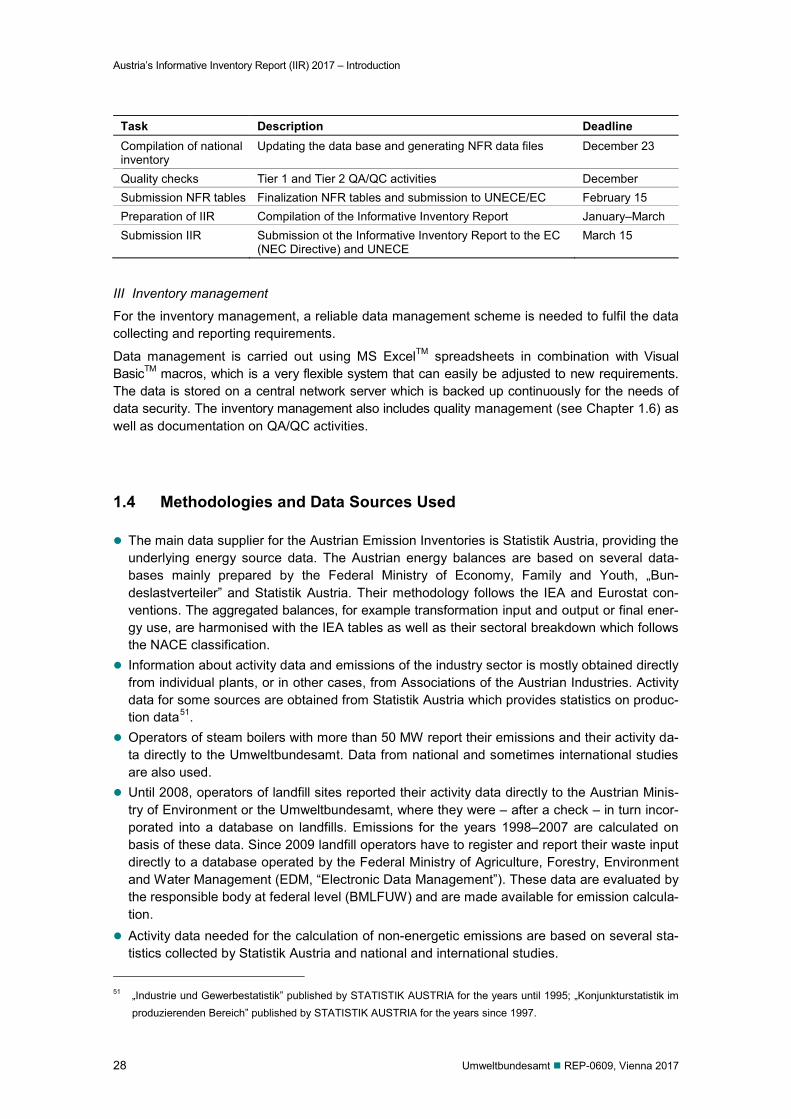
Austria’s Informative Inventory Report (IIR) 2017 – Introduction
28 Umweltbundesamt REP-0609, Vienna 2017
Task Description Deadline Compilation of national inventory
Updating the data base and generating NFR data files December 23
Quality checks Tier 1 and Tier 2 QA/QC activities December Submission NFR tables Finalization NFR tables and submission to UNECE/EC February 15 Preparation of IIR Compilation of the Informative Inventory Report January–March Submission IIR Submission ot the Informative Inventory Report to the EC
(NEC Directive) and UNECE March 15
III Inventory management
For the inventory management, a reliable data management scheme is needed to fulfil the data collecting and reporting requirements.
Data management is carried out using MS ExcelTM spreadsheets in combination with Visual BasicTM macros, which is a very flexible system that can easily be adjusted to new requirements. The data is stored on a central network server which is backed up continuously for the needs of data security. The inventory management also includes quality management (see Chapter 1.6) as well as documentation on QA/QC activities.
1.4 Methodologies and Data Sources Used
The main data supplier for the Austrian Emission Inventories is Statistik Austria, providing the underlying energy source data. The Austrian energy balances are based on several data-bases mainly prepared by the Federal Ministry of Economy, Family and Youth, „Bun-deslastverteiler” and Statistik Austria. Their methodology follows the IEA and Eurostat con-ventions. The aggregated balances, for example transformation input and output or final ener-gy use, are harmonised with the IEA tables as well as their sectoral breakdown which follows the NACE classification.
Information about activity data and emissions of the industry sector is mostly obtained directly from individual plants, or in other cases, from Associations of the Austrian Industries. Activity data for some sources are obtained from Statistik Austria which provides statistics on produc-tion data51.
Operators of steam boilers with more than 50 MW report their emissions and their activity da-ta directly to the Umweltbundesamt. Data from national and sometimes international studies are also used.
Until 2008, operators of landfill sites reported their activity data directly to the Austrian Minis-try of Environment or the Umweltbundesamt, where they were – after a check – in turn incor-porated into a database on landfills. Emissions for the years 1998–2007 are calculated on basis of these data. Since 2009 landfill operators have to register and report their waste input directly to a database operated by the Federal Ministry of Agriculture, Forestry, Environment and Water Management (EDM, “Electronic Data Management”). These data are evaluated by the responsible body at federal level (BMLFUW) and are made available for emission calcula-tion.
Activity data needed for the calculation of non-energetic emissions are based on several sta-tistics collected by Statistik Austria and national and international studies.
51 „Industrie und Gewerbestatistik” published by STATISTIK AUSTRIA for the years until 1995; „Konjunkturstatistik im
produzierenden Bereich” published by STATISTIK AUSTRIA for the years since 1997.
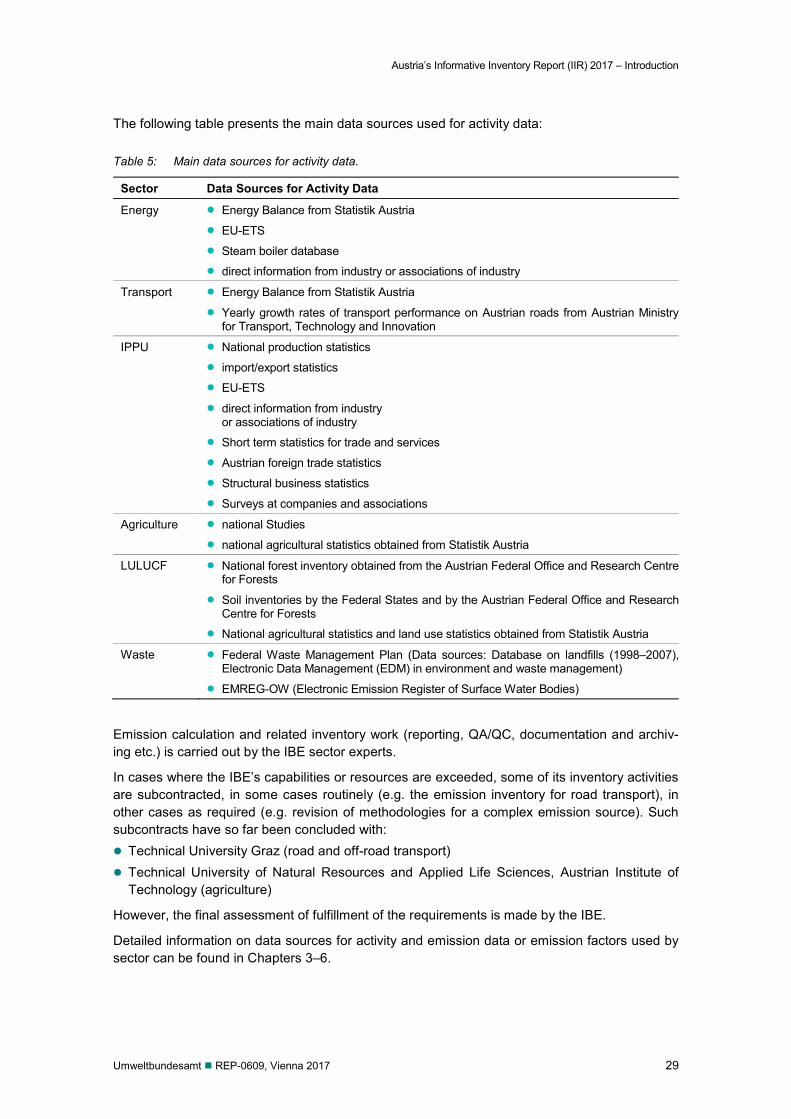
Austria’s Informative Inventory Report (IIR) 2017 – Introduction
Umweltbundesamt REP-0609, Vienna 2017 29
The following table presents the main data sources used for activity data:
Table 5: Main data sources for activity data.
Sector Data Sources for Activity Data
Energy Energy Balance from Statistik Austria EU-ETS Steam boiler database direct information from industry or associations of industry
Transport Energy Balance from Statistik Austria
Yearly growth rates of transport performance on Austrian roads from Austrian Ministry for Transport, Technology and Innovation
IPPU National production statistics import/export statistics EU-ETS
direct information from industry or associations of industry
Short term statistics for trade and services Austrian foreign trade statistics Structural business statistics Surveys at companies and associations
Agriculture national Studies national agricultural statistics obtained from Statistik Austria
LULUCF National forest inventory obtained from the Austrian Federal Office and Research Centre for Forests
Soil inventories by the Federal States and by the Austrian Federal Office and Research Centre for Forests
National agricultural statistics and land use statistics obtained from Statistik Austria Waste Federal Waste Management Plan (Data sources: Database on landfills (1998–2007),
Electronic Data Management (EDM) in environment and waste management) EMREG-OW (Electronic Emission Register of Surface Water Bodies)
Emission calculation and related inventory work (reporting, QA/QC, documentation and archiv-ing etc.) is carried out by the IBE sector experts.
In cases where the IBE’s capabilities or resources are exceeded, some of its inventory activities are subcontracted, in some cases routinely (e.g. the emission inventory for road transport), in other cases as required (e.g. revision of methodologies for a complex emission source). Such subcontracts have so far been concluded with: Technical University Graz (road and off-road transport) Technical University of Natural Resources and Applied Life Sciences, Austrian Institute of
Technology (agriculture)
However, the final assessment of fulfillment of the requirements is made by the IBE.
Detailed information on data sources for activity and emission data or emission factors used by sector can be found in Chapters 3–6.
Austria’s Informative Inventory Report (IIR) 2017 – Introduction
30 Umweltbundesamt REP-0609, Vienna 2017
For large point sources the Umweltbundesamt preferably uses – after careful assessment of plausibility of this data – emission data that are reported by the ‘operator’ of the source because these data usually reflect the actual emissions better than data calculated using general emission factors, as the operator has the best information about the actual circumstances.If such data is not available, and for area sources, national emission factors are used or, if there are no na-tional emission factors, international emission factors are used to estimate emissions. Where no applicable data is found, standard emission factors e.g. from the EMEP/EEA 2016 Guidebook are applied. The main sources for emission factors are: National studies for country specific emission factors as well as information on emissions
from large point sources (plant specific data) IPCC 2006 Guidelines for National Greenhouse Gas Inventories52 EMEP/EEA air pollutant emission inventory guidebook – 2009. Technical report No 9/200953 EMEP/EEA air pollutant emission inventory guidebook – 2013. Technical report No. 12/201354 EMEP/EEA air pollutant emission inventory guidebook – 2016. Technical report No. 21/201655
Table 6 presents the methods applied and the origin of emission factors used for the categories in the NFR format for the present Austrian inventory.
For key source categories (see chapter 1.5) the most accurate methods for the preparation of the air emission inventory should be used. Required methodological changes and planned im-provements are described in the corresponding sector analysis chapters (Chapters 3–6).
1.4.1 EU Emissions Trading System (EU ETS)
The European Union Emissions Trading Scheme has been established by Directive 2003/87/EC of the European Parliament and of the Counci56 and amended by Directive 2009/29/EC57. From 2013 onwards, it is known as the European Union Emissions Trading System (EU ETS). It in-cludes heavy energy-consuming installations in power generation and manufacturing. The activi-ties covered are energy activities, the production and processing of ferrous metals, the mineral industry and some other production activities. From 2012 onwards, CO2 emissions from aviation have also been included. For the trading period 2013–2020 the scope of the EU ETS has been further extended to include additional installations from the metal and chemical industry and compressor stations. For more detailed information on the included activities please refer to An-nex I of the above mentioned directive.
52 http://www.ipcc-nggip.iges.or.jp/public/2006gl/index.htm 53 http://www.eea.europa.eu/publications/emep-eea-emission-inventory-guidebook-2009 54 http://www.eea.europa.eu/publications/emep-eea-guidebook-2013 55 http://www.eea.europa.eu/publications/emep-eea-guidebook-2016 56 Directive 2003/87/EC of the European Parliament and of the Council of 13 October 2003 establishing a scheme for
greenhouse gas emission allowance trading within the Community and amending Council Directive 96/61/EC, OJ L 275/32
57 Directive 2009/29/EC of the European Parliament and of the Council of 23 April 2009 amending Directive 2003/87/EC so as to improve and extend the emission allowance trading scheme of the Community, OJ L 140/63
Austria’s Informative Inventory Report (IIR) 2017 – Introduction
Umweltbundesamt REP-0609, Vienna 2017 31
Greenhouse gases covered under the EU ETS are CO2 (since 2005), N2O (since 2010) and PFC (since 2013)58. About one third of total Austrian GHG emissions currently result from instal-lations under the EU-ETS (~28 Mt CO2 in 2015).
Plant operators have to report their activity data and emissions annually for the GHG as men-tioned above; for the first time they reported their emissions of 2005 in March 2006. The first trading period of the EU ETS ran from 2005–2007. The second trading period, which coincided with the 1st Kyoto commitment period, ran from 2008–2012. The third trading period, which co-incides with the 2nd Kyoto commitment period, runs from 2013 to 2020. Since 2012 aircraft op-erators have also been included into the scheme. They have to report their emissions concern-ing internal flights in the European Economic Area.
General rules for reporting and verification of emissions in the EU ETS are defined in EU Di-rective 2003/87/EC and specific rules can be found in Commission Regulation (EU) No 601/201259. In Austria, Member State specific regulations are defined in the Austrian Emissions Allowance Trading Act60 and the Austrian Monitoring, Reporting and Verification Ordinance61. This ordinance also specifies that the Umweltbundesamt has to incorporate, as far as neces-sary, the verified emissions of the emissions trading scheme into the national greenhouse gas inventory. For a detailed description of the sectors covered and the incorporation of these emis-sions into the national inventory please refer to the chapters 3 Energy (CRF Sector 1) and 4 In-dustrial Processes and Product Use (CRF Sector 2).
An important feature of the emissions reported under the EU-ETS is that these emissions have to pass independent verification by an accredited verifier. The Austrian Federal Ministry of Agri-culture, Forestry, Environment and Water Management is in charge of granting the licence to independent verifiers. In addition, the Ministry has to fulfil a quality control function, which is im-plemented by spot checks of emissions and verification reports that the Umweltbundesamt per-forms on behalf of the Ministry.
1.4.2 Electronic Data Management (EDM)
The electronic data management (EDM of the Austrian Federal Ministry of Agriculture, Forestry, Environment and Water Management (BMLFUW) is an electronic recording and notification sys-tem (information network), implemented as an integrated e-government application. It allows en-terprises and authorities to handle registration and notification obligations online in the areas of waste and environment (e.g. on Austrian Emissions Allowances, HFC or EMREG – Emission Register Surface Water). It provides main data for reporting in the sector Waste (e.g. landfilled and biologically treated amounts).
There are around 40 000 users registered, covering national and international waste owners (collectors, operators of treatment plants, waste producers) doing their reporting obligations ac-cording to national legislation, e.g. on landfilled amounts.
58 Austria unilaterally opted-in N2O as of 2010. Since 2013 N2O and PFCs have been included in the EU ETS at EU level. 59 Commission Regulation (EU) No 601/2012 of 21 June 2012 on the monitoring and reporting of greenhouse gas
emissions pursuant to Directive 2003/87/EC of the European Parliament and of the Council. 60 Emissionszertifikategesetz 2011, Federal Law Gazette I No. 118/2011, as amended 61 Überwachungs-, Berichterstattungs- und Prüfungs-Verordnung, Federal Law Gazette II No. 339/2007, as amended
Austria’s Informative Inventory Report (IIR) 2017 – Introduction
32 Umweltbundesamt REP-0609, Vienna 2017
1.4.3 Other data (E-PRTR)
The European Pollutant Release and Transfer Register (E-PRTR) which was established by the E-PRTR Regulation (EC) No 166/2006.
It covers 91 pollutants from nine activity groups, including all pollutants reported already under EPER. However, emissions only have to be reported if they exceed certain thresholds. In con-trast to EPER, E-PRTR also included data on releases into soil, accidental releases, waste transfers and diffuse emissions62. E-PRTR was preceded by the European Pollutant Emission Register (EPER), with reporting years 2001 or 2002 and 2004.
The Umweltbundesamt implemented E-PRTR in Austria using an electronic system enabling the facilities and the authorities to fulfil the requirements of the E-PRTR Regulation electronically via the internet. In 2008, installations reported for the first time releases and transfers of pollutants and waste transfers from 2007 under the E-PRTR, which is an annual reporting obligation. The plausibility of the reports is checked by the competent authorities and the Umweltbundesamt. The Umweltbundesamt also checks the data for consistency with the national inventory.
Data from E-PRTR or its predecessor has so far not been used as a data source for the national inventory, as the E-PRTR/EPER reports contain only very little information other than emission data. Concerning methodology the only information included is whether emissions are estimat-ed, measured or calculated. For activity data facilities report one value that is often not useful in the context of emissions and may be different between producers of the same product.
In addition, E-PRTR/EPER data is not complete for IPCC sectors and it is difficult to include this point source information because no background information (such as fuel consumption data) is available. Furthermore the reporting thresholds are relatively high, so that many of the relevant installations do not have to report.
Thus greenhouse gas emission data from the EU Emissions Trading System, combined with the top-down approach of the national inventory has been considered to be more reliable and data of EPER/E-PRTR has not been used as point source data for the national inventory, but for veri-fication purposes only where possible.
1.4.4 Literature
National and sometimes international studies are also used as data suppliers (references are given in the sector analysis chapters).
Studies on HM, POPs and PM emissions
Emissions of HM and some POPs have already been estimated in the course of CORINAIR 1990 and 1994, respectively.63 With these data and other Austrian publications as a basis, comprehensive emission inventories of HM, POPs and PM for different years were prepared by contractors of the Umweltbundesamt and incorporated into the inventory system afterwards. WINDSPERGER, A. et. al. (1999): Entwicklung der Schwermetallemissionen – Abschätzung der
Emissionen von Blei, Cadmium und Quecksilber für die Jahre 1985, 1990 und 1995 gemäß der CORINAIR-Systematik. Institut für Industrielle Ökologie und Österreichisches Forschungs-zentrum Seibersdorf. Wien. (Nicht veröffentlicht).
62 Data can be downloaded from: http://www.umweltbundesamt.at/prtr/ 63 ORTHOFER, R. (1996); HÜBNER, C. (1996); HÜBNER, C. & WURST, F. (1997); HÜBNER, C. (2000)
Austria’s Informative Inventory Report (IIR) 2017 – Introduction
Umweltbundesamt REP-0609, Vienna 2017 33
Development of Heavy Metal Emissions – Estimation of emissions of Lead, Cadmium and Mercury for the years 1985, 1990 and 1995 according to the CORINAIR-systematics. Depart-ment for industrial ecology and Austrian Research Centers Seibersdorf. Vienna. (Not pub-lished).
Österreichische Emissionsinventur für Cadmium, Quecksilber und Blei. Austrian emission inventory for Cd, Hg and Pb 1995–2000 prepared by FTU – Forschungs-
gesellschaft Technischer Umweltschutz GmbH. Vienna November 2001 (not published).
HÜBNER, C. (2001): Österreichische Emissionsinventur für POPs 1985–1999. FTU – Forschungs-gesellschaft Technischer Umweltschutz GmbH. Werkvertrag des Umweltbundesamt, IB-650. Wien. (Nicht veröffentlicht).
Austrian emission inventory for POPs 1985–1999. Prepared by FTU – Research Center Technical environment protection (Ltd.). Study commissioned by Umweltbundesamt IB-650. Vienna. (Not published).
WINIWARTER, W.; TRENKER, C.; HÖFLINGER, W. (2001): Österreichische Emissionsinventur für Staub. Österreichisches Forschungszentrum Seibersdorf. Wien.
Austrian emission inventory for PM. Austrian Research Centers Seibersdorf. Vienna.
WINIWARTER, W.; SCHMID-STEJSKAL, H. & WINDSPERGER, A. (2007): Aktualisierung und Ver-besserung der österreischen Luftschadstoffinventur für Schwebstaub. Systems research – Austrian Research Centers & Institut für Industrielle Ökologie. Wien.
Updating and Improvement of the Austrian Air Emission Inventory (OLI) for PM. Systems re-search – Austrian Research Centers & Department for industrial ecology. Vienna.
1.4.5 Summary of methodologies applied for estimating emissions
In Table 6 a summary of methodologies applied for estimating emissions is given. The following abbreviations are used: D DEFAULT L Literature CS COUNTRY SPECIFIC PS PLANT SPECIFIC
Dark shaded cells indicate that no such emissions arise from this source; light shaded cells in-dicate key sources.
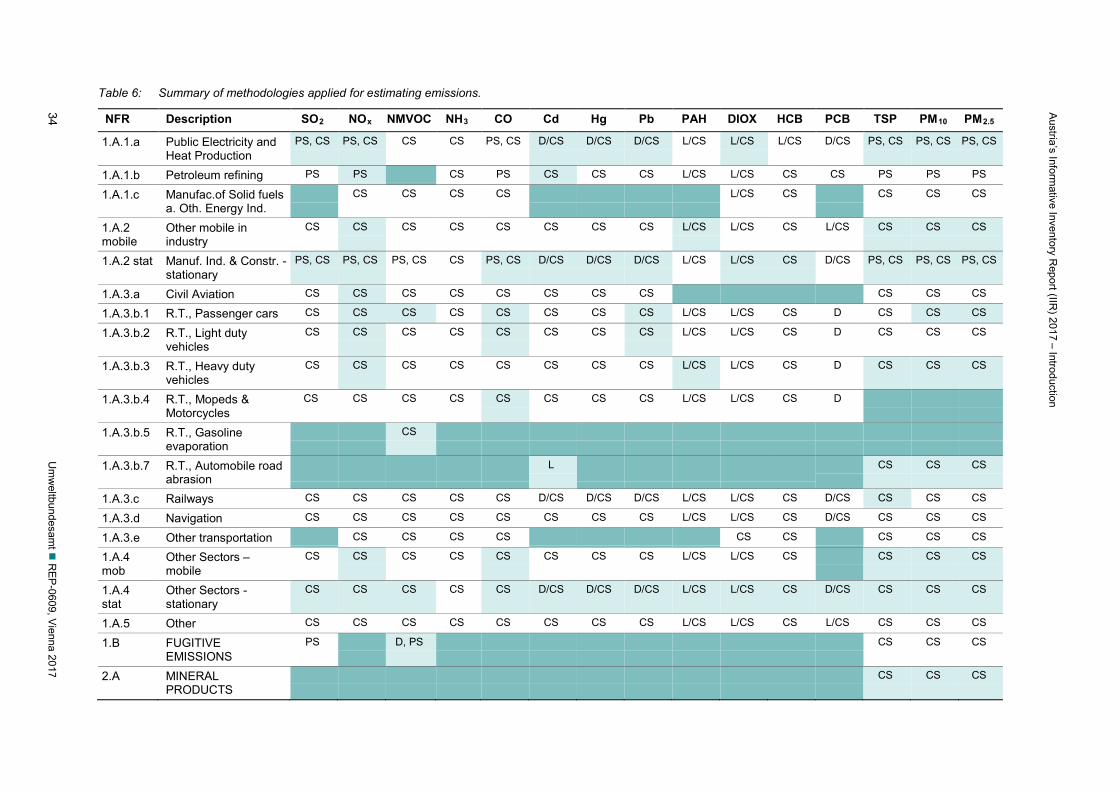
Austria’s Inform
ative Inventory Report (IIR
) 2017 – Introduction
34 U
mw
eltbundesamt
REP
-0609, Vienna 2017
Table 6: Summary of methodologies applied for estimating emissions.
NFR Description SO2 NOx NMVOC NH3 CO Cd Hg Pb PAH DIOX HCB PCB TSP PM10 PM2.5
1.A.1.a Public Electricity and Heat Production
PS, CS PS, CS CS CS PS, CS D/CS D/CS D/CS L/CS L/CS L/CS D/CS PS, CS PS, CS PS, CS
1.A.1.b Petroleum refining PS PS CS PS CS CS CS L/CS L/CS CS CS PS PS PS
1.A.1.c Manufac.of Solid fuels a. Oth. Energy Ind.
CS CS CS CS L/CS CS CS CS CS
1.A.2 mobile
Other mobile in industry
CS CS CS CS CS CS CS CS L/CS L/CS CS L/CS CS CS CS
1.A.2 stat Manuf. Ind. & Constr. -stationary
PS, CS PS, CS PS, CS CS PS, CS D/CS D/CS D/CS L/CS L/CS CS D/CS PS, CS PS, CS PS, CS
1.A.3.a Civil Aviation CS CS CS CS CS CS CS CS CS CS CS
1.A.3.b.1 R.T., Passenger cars CS CS CS CS CS CS CS CS L/CS L/CS CS D CS CS CS
1.A.3.b.2 R.T., Light duty vehicles
CS CS CS CS CS CS CS CS L/CS L/CS CS D CS CS CS
1.A.3.b.3 R.T., Heavy duty vehicles
CS CS CS CS CS CS CS CS L/CS L/CS CS D CS CS CS
1.A.3.b.4 R.T., Mopeds & Motorcycles
CS CS CS CS CS CS CS CS L/CS L/CS CS D
1.A.3.b.5 R.T., Gasoline evaporation
CS
1.A.3.b.7 R.T., Automobile road abrasion
L CS CS CS
1.A.3.c Railways CS CS CS CS CS D/CS D/CS D/CS L/CS L/CS CS D/CS CS CS CS
1.A.3.d Navigation CS CS CS CS CS CS CS CS L/CS L/CS CS D/CS CS CS CS
1.A.3.e Other transportation CS CS CS CS CS CS CS CS CS
1.A.4 mob
Other Sectors – mobile
CS CS CS CS CS CS CS CS L/CS L/CS CS CS CS CS
1.A.4 stat
Other Sectors -stationary
CS CS CS CS CS D/CS D/CS D/CS L/CS L/CS CS D/CS CS CS CS
1.A.5 Other CS CS CS CS CS CS CS CS L/CS L/CS CS L/CS CS CS CS
1.B FUGITIVE EMISSIONS
PS D, PS CS CS CS
2.A MINERAL PRODUCTS
CS CS CS
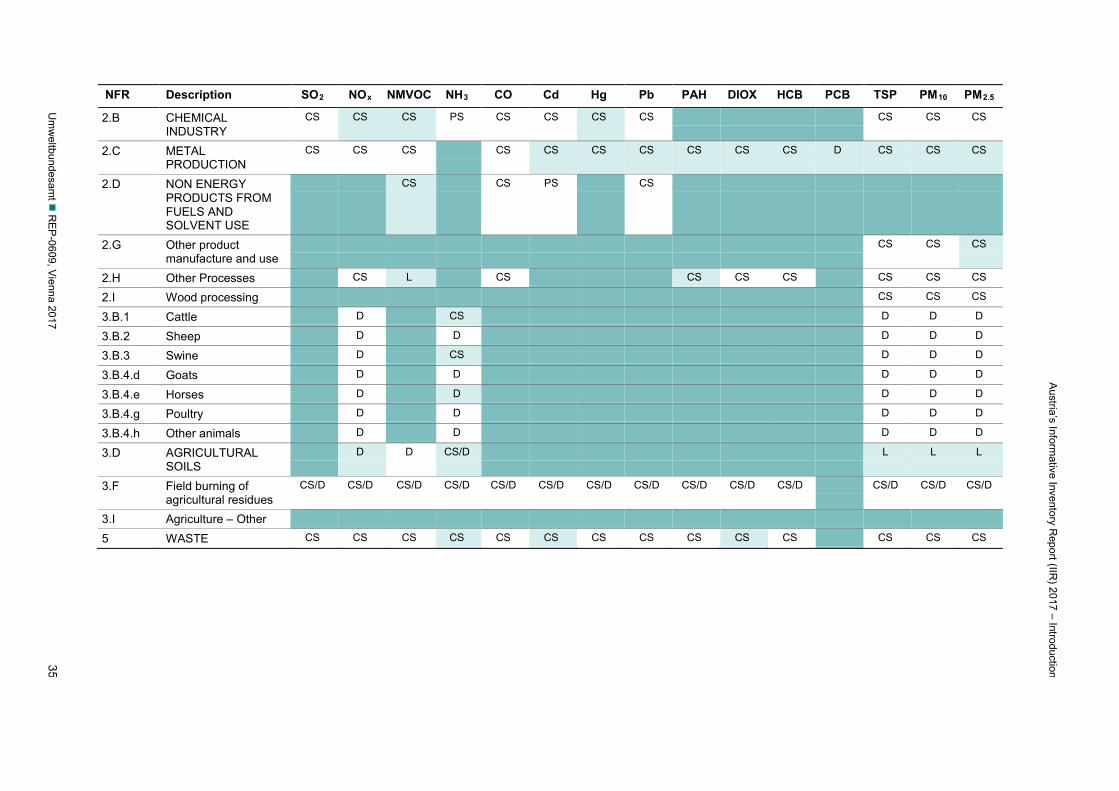
Austria’s Inform
ative Inventory Report (IIR
) 2017 – Introduction
Um
weltbundesam
t R
EP-0609, V
ienna 2017 35
NFR Description SO2 NOx NMVOC NH3 CO Cd Hg Pb PAH DIOX HCB PCB TSP PM10 PM2.5
2.B CHEMICAL INDUSTRY
CS CS CS PS CS CS CS CS CS CS CS
2.C METAL PRODUCTION
CS CS CS CS CS CS CS CS CS CS D CS CS CS
2.D NON ENERGY PRODUCTS FROM FUELS AND SOLVENT USE
CS CS PS CS
2.G Other product manufacture and use
CS CS CS
2.H Other Processes CS L CS CS CS CS CS CS CS
2.I Wood processing CS CS CS
3.B.1 Cattle D CS D D D
3.B.2 Sheep D D D D D
3.B.3 Swine D CS D D D
3.B.4.d Goats D D D D D
3.B.4.e Horses D D D D D
3.B.4.g Poultry D D D D D
3.B.4.h Other animals D D D D D
3.D AGRICULTURAL SOILS
D D CS/D L L L
3.F Field burning of agricultural residues
CS/D CS/D CS/D CS/D CS/D CS/D CS/D CS/D CS/D CS/D CS/D CS/D CS/D CS/D
3.I Agriculture – Other
5 WASTE CS CS CS CS CS CS CS CS CS CS CS CS CS CS
Austria’s Informative Inventory Report (IIR) 2017 – Introduction
36 Umweltbundesamt REP-0609, Vienna 2017
1.5 Key Category Analysis
The identification of key categories is described in the “EMEP/EEA air pollutant emission inven-tory guidebook 2016” (EEA 2016)”. It stipulates that a key category is one that is prioritised with-in the national inventory system because its is significantly important for one or a number of air pollutants in a country's national inventory of air pollutants in terms of the absolute level, the trend, or the uncertainty in emissions (EEA 2016). Furthermore, it is good practice to identify the national key categories in a systematic and objective manner. This can be
achieved by a quantitative analysis of the relationship between the magnitude of emission in any year (level) and the change in emission year to year (trend) of each category’s emissions compared to the total national emissions;
to focus the available resources for improvement in data and methods on categories indenti-fied as key. The identification of key categories in national inventories enables the limited re-sources available for preparing inventories to be prioritised; more detailed, higher tier meth-ods can the be slected for key categories. Invetory compilers should use the category specific methods presented in sectoral decision tress Iin the sectoral volumes;
that the analysis should be performed at the level of NFR categories or subcategoreis at which the guidebook methods and decision trees are provided in the sectoral volumes. Where possible, some categories should be disaggregated by main fuel types;
that each air pollutant emitted from each category should be considered separately; that for each key category, the inventory compiler should determine if certain subcategoreis
are particulary significant usually, for this purpose, the subcategories should be ranked ac-cording to their contribution to the aggregate key categories. Those subcategoreis that con-tribute together more than 60% to the key category should be treated as particularly signifi-cant. It may be appropriate to focus efforts towards methodological improvements of these most significant subcategories.
All notations, descriptions of identification and results for key categories included in this chapter are based on the latest Inventory Guidebook (EEA 2016).
The identification includes all NFR categories and all reported gases SO2, NOx, NMVOC, NH3, CO PM: TSP, PM10, PM2.5 HM: Cd, Hg, Pb POP: PAH, PCDD/F, HCB, PCB
Used methodology for identification of key categories: Approach 1
The methodology follows the IPCC approach to produce pollutant-specific key categories and covers for both level and trend assessment. In Approach 1, key categories are identified using a predetermined cumulative emissions threshold. Key categories are those which, when summed together in descending order of magnitude, cumulatively add up to 80% of the total level. The suggested aggregation level of analysis for Approach 1 provided in Table 2-1 of Chapter 2 of the EMEP/EEA emission inventory guidebook 2016 was used. No special considerations like disaggregation to main fuel types have been made. For reasons of transparency, the same level of aggregation for all pollutants was used.
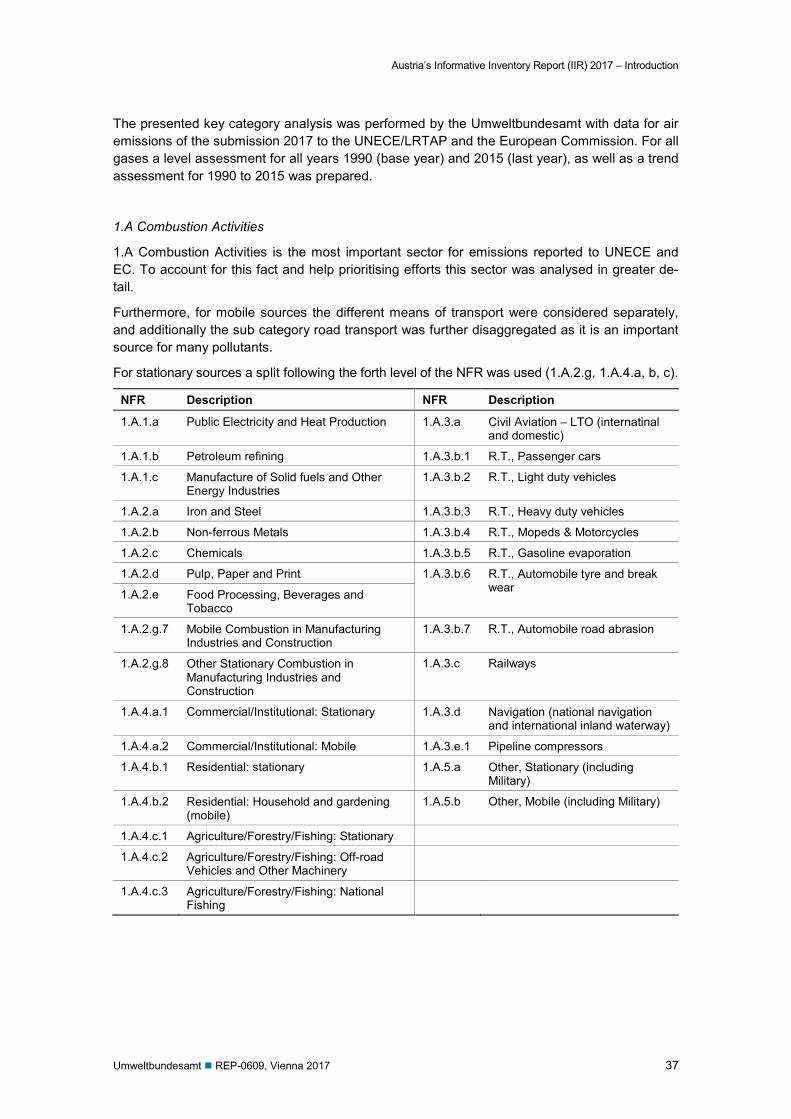
Austria’s Informative Inventory Report (IIR) 2017 – Introduction
Umweltbundesamt REP-0609, Vienna 2017 37
The presented key category analysis was performed by the Umweltbundesamt with data for air emissions of the submission 2017 to the UNECE/LRTAP and the European Commission. For all gases a level assessment for all years 1990 (base year) and 2015 (last year), as well as a trend assessment for 1990 to 2015 was prepared.
1.A Combustion Activities
1.A Combustion Activities is the most important sector for emissions reported to UNECE and EC. To account for this fact and help prioritising efforts this sector was analysed in greater de-tail.
Furthermore, for mobile sources the different means of transport were considered separately, and additionally the sub category road transport was further disaggregated as it is an important source for many pollutants.
For stationary sources a split following the forth level of the NFR was used (1.A.2.g, 1.A.4.a, b, c).
NFR Description NFR Description
1.A.1.a Public Electricity and Heat Production 1.A.3.a Civil Aviation – LTO (internatinal and domestic)
1.A.1.b Petroleum refining 1.A.3.b.1 R.T., Passenger cars
1.A.1.c Manufacture of Solid fuels and Other Energy Industries
1.A.3.b.2 R.T., Light duty vehicles
1.A.2.a Iron and Steel 1.A.3.b.3 R.T., Heavy duty vehicles
1.A.2.b Non-ferrous Metals 1.A.3.b.4 R.T., Mopeds & Motorcycles
1.A.2.c Chemicals 1.A.3.b.5 R.T., Gasoline evaporation
1.A.2.d Pulp, Paper and Print 1.A.3.b.6 R.T., Automobile tyre and break wear 1.A.2.e Food Processing, Beverages and
Tobacco
1.A.2.g.7 Mobile Combustion in Manufacturing Industries and Construction
1.A.3.b.7 R.T., Automobile road abrasion
1.A.2.g.8 Other Stationary Combustion in Manufacturing Industries and Construction
1.A.3.c Railways
1.A.4.a.1 Commercial/Institutional: Stationary 1.A.3.d Navigation (national navigation and international inland waterway)
1.A.4.a.2 Commercial/Institutional: Mobile 1.A.3.e.1 Pipeline compressors
1.A.4.b.1 Residential: stationary 1.A.5.a Other, Stationary (including Military)
1.A.4.b.2 Residential: Household and gardening (mobile)
1.A.5.b Other, Mobile (including Military)
1.A.4.c.1 Agriculture/Forestry/Fishing: Stationary
1.A.4.c.2 Agriculture/Forestry/Fishing: Off-road Vehicles and Other Machinery
1.A.4.c.3 Agriculture/Forestry/Fishing: National Fishing
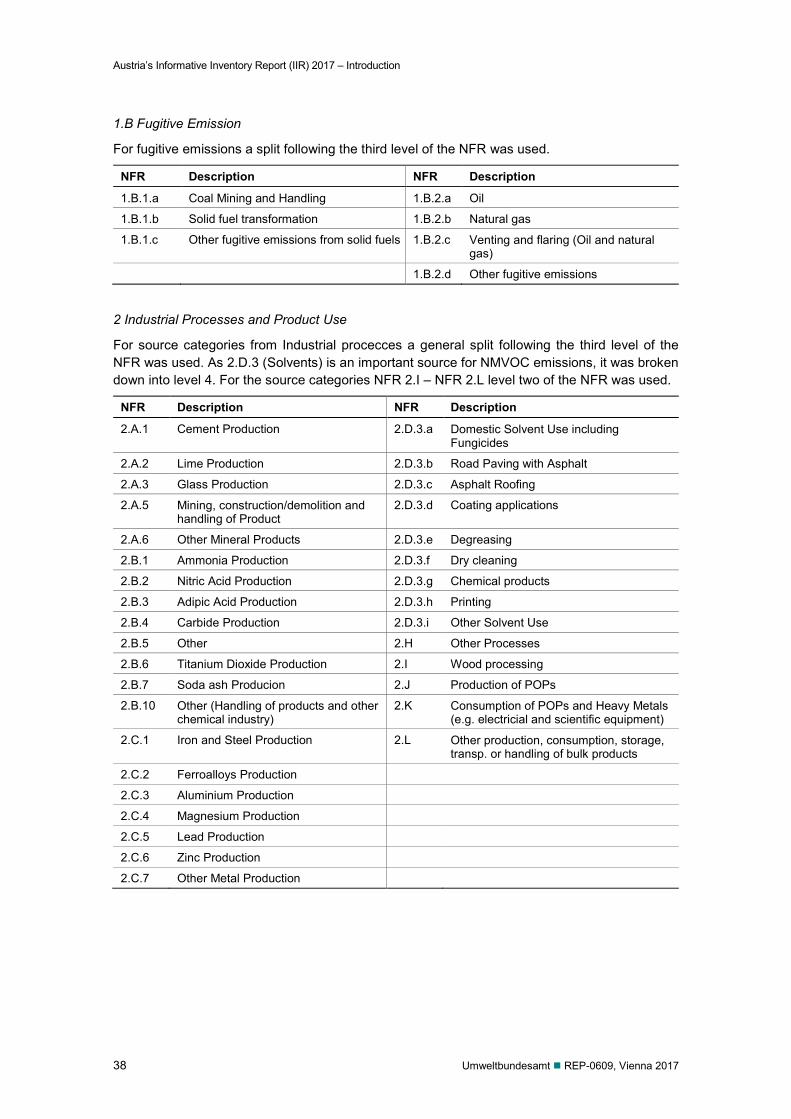
Austria’s Informative Inventory Report (IIR) 2017 – Introduction
38 Umweltbundesamt REP-0609, Vienna 2017
1.B Fugitive Emission
For fugitive emissions a split following the third level of the NFR was used.
NFR Description NFR Description
1.B.1.a Coal Mining and Handling 1.B.2.a Oil
1.B.1.b Solid fuel transformation 1.B.2.b Natural gas
1.B.1.c Other fugitive emissions from solid fuels 1.B.2.c Venting and flaring (Oil and natural gas)
1.B.2.d Other fugitive emissions
2 Industrial Processes and Product Use
For source categories from Industrial procecces a general split following the third level of the NFR was used. As 2.D.3 (Solvents) is an important source for NMVOC emissions, it was broken down into level 4. For the source categories NFR 2.I – NFR 2.L level two of the NFR was used.
NFR Description NFR Description
2.A.1 Cement Production 2.D.3.a Domestic Solvent Use including Fungicides
2.A.2 Lime Production 2.D.3.b Road Paving with Asphalt
2.A.3 Glass Production 2.D.3.c Asphalt Roofing
2.A.5 Mining, construction/demolition and handling of Product
2.D.3.d Coating applications
2.A.6 Other Mineral Products 2.D.3.e Degreasing
2.B.1 Ammonia Production 2.D.3.f Dry cleaning
2.B.2 Nitric Acid Production 2.D.3.g Chemical products
2.B.3 Adipic Acid Production 2.D.3.h Printing
2.B.4 Carbide Production 2.D.3.i Other Solvent Use
2.B.5 Other 2.H Other Processes
2.B.6 Titanium Dioxide Production 2.I Wood processing
2.B.7 Soda ash Producion 2.J Production of POPs
2.B.10 Other (Handling of products and other chemical industry)
2.K Consumption of POPs and Heavy Metals (e.g. electricial and scientific equipment)
2.C.1 Iron and Steel Production 2.L Other production, consumption, storage, transp. or handling of bulk products
2.C.2 Ferroalloys Production
2.C.3 Aluminium Production
2.C.4 Magnesium Production
2.C.5 Lead Production
2.C.6 Zinc Production
2.C.7 Other Metal Production
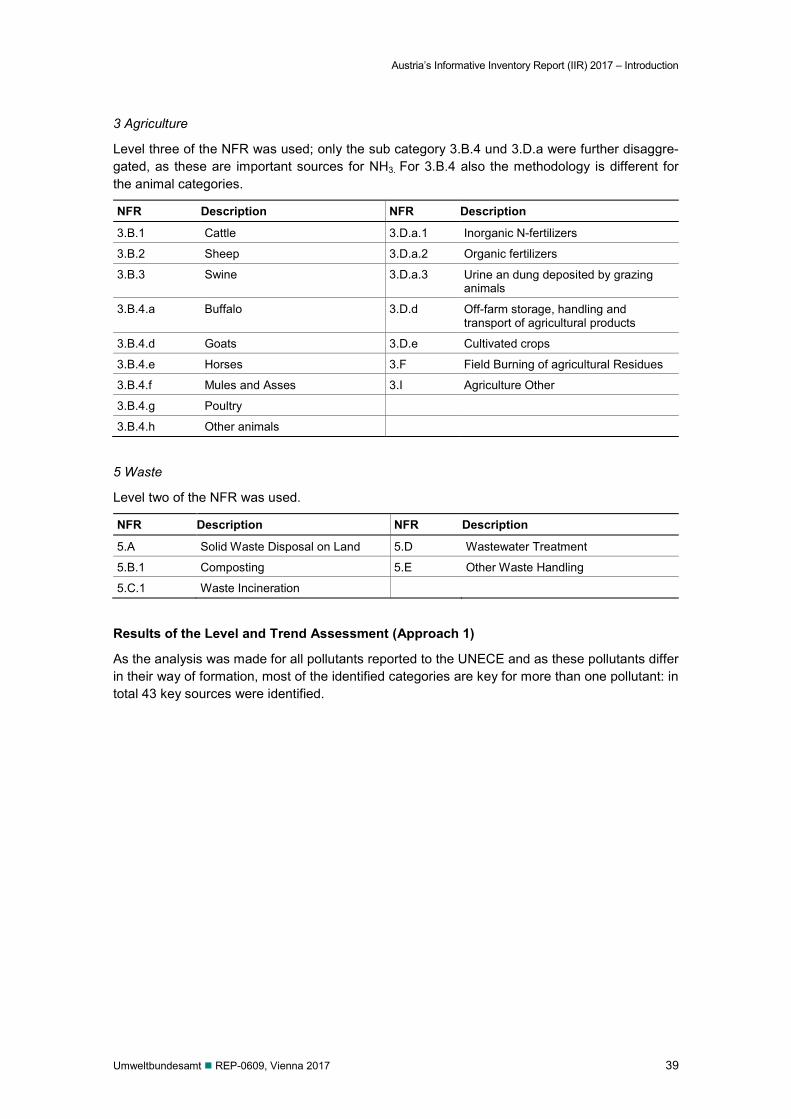
Austria’s Informative Inventory Report (IIR) 2017 – Introduction
Umweltbundesamt REP-0609, Vienna 2017 39
3 Agriculture
Level three of the NFR was used; only the sub category 3.B.4 und 3.D.a were further disaggre-gated, as these are important sources for NH3. For 3.B.4 also the methodology is different for the animal categories.
NFR Description NFR Description
3.B.1 Cattle 3.D.a.1 Inorganic N-fertilizers
3.B.2 Sheep 3.D.a.2 Organic fertilizers
3.B.3 Swine 3.D.a.3 Urine an dung deposited by grazing animals
3.B.4.a Buffalo 3.D.d Off-farm storage, handling and transport of agricultural products
3.B.4.d Goats 3.D.e Cultivated crops
3.B.4.e Horses 3.F Field Burning of agricultural Residues
3.B.4.f Mules and Asses 3.I Agriculture Other
3.B.4.g Poultry
3.B.4.h Other animals
5 Waste
Level two of the NFR was used.
NFR Description NFR Description
5.A Solid Waste Disposal on Land 5.D Wastewater Treatment
5.B.1 Composting 5.E Other Waste Handling
5.C.1 Waste Incineration
Results of the Level and Trend Assessment (Approach 1)
As the analysis was made for all pollutants reported to the UNECE and as these pollutants differ in their way of formation, most of the identified categories are key for more than one pollutant: in total 43 key sources were identified.
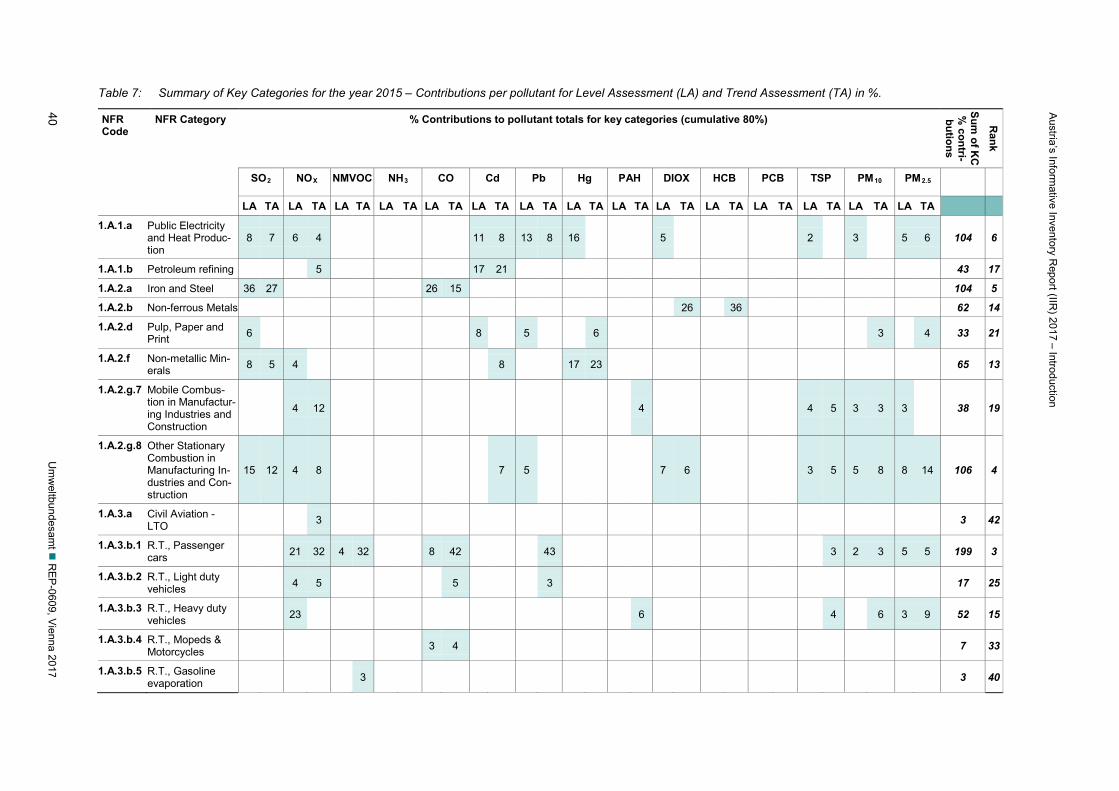
Austria’s Inform
ative Inventory Report (IIR
) 2017 – Introduction
40 U
mw
eltbundesamt
REP
-0609, Vienna 2017
Table 7: Summary of Key Categories for the year 2015 – Contributions per pollutant for Level Assessment (LA) and Trend Assessment (TA) in %.
NFR Code
NFR Category % Contributions to pollutant totals for key categories (cumulative 80%)
Sum of K
C
% contri-
butions
Rank
SO2 NOX NMVOC NH3 CO Cd Pb Hg PAH DIOX HCB PCB TSP PM10 PM2.5
LA TA LA TA LA TA LA TA LA TA LA TA LA TA LA TA LA TA LA TA LA TA LA TA LA TA LA TA LA TA
1.A.1.a Public Electricity and Heat Produc-tion
8 7 6 4
11 8 13 8 16
5
2
3
5 6 104 6
1.A.1.b Petroleum refining
5
17 21
43 17
1.A.2.a Iron and Steel 36 27
26 15
104 5
1.A.2.b Non-ferrous Metals
26
36
62 14
1.A.2.d Pulp, Paper and Print 6 8 5 6 3 4 33 21
1.A.2.f Non-metallic Min-erals 8 5 4 8 17 23 65 13
1.A.2.g.7 Mobile Combus-tion in Manufactur-ing Industries and Construction
4 12 4 4 5 3 3 3 38 19
1.A.2.g.8 Other Stationary Combustion in Manufacturing In-dustries and Con-struction
15 12 4 8
7 5
7 6
3 5 5 8 8 14 106 4
1.A.3.a Civil Aviation - LTO 3 3 42
1.A.3.b.1 R.T., Passenger cars
21 32 4 32
8 42
43
3 2 3 5 5 199 3
1.A.3.b.2 R.T., Light duty vehicles
4 5
5
3
17 25
1.A.3.b.3 R.T., Heavy duty vehicles
23
6
4
6 3 9 52 15
1.A.3.b.4 R.T., Mopeds & Motorcycles
3 4
7 33
1.A.3.b.5 R.T., Gasoline evaporation
3
3 40
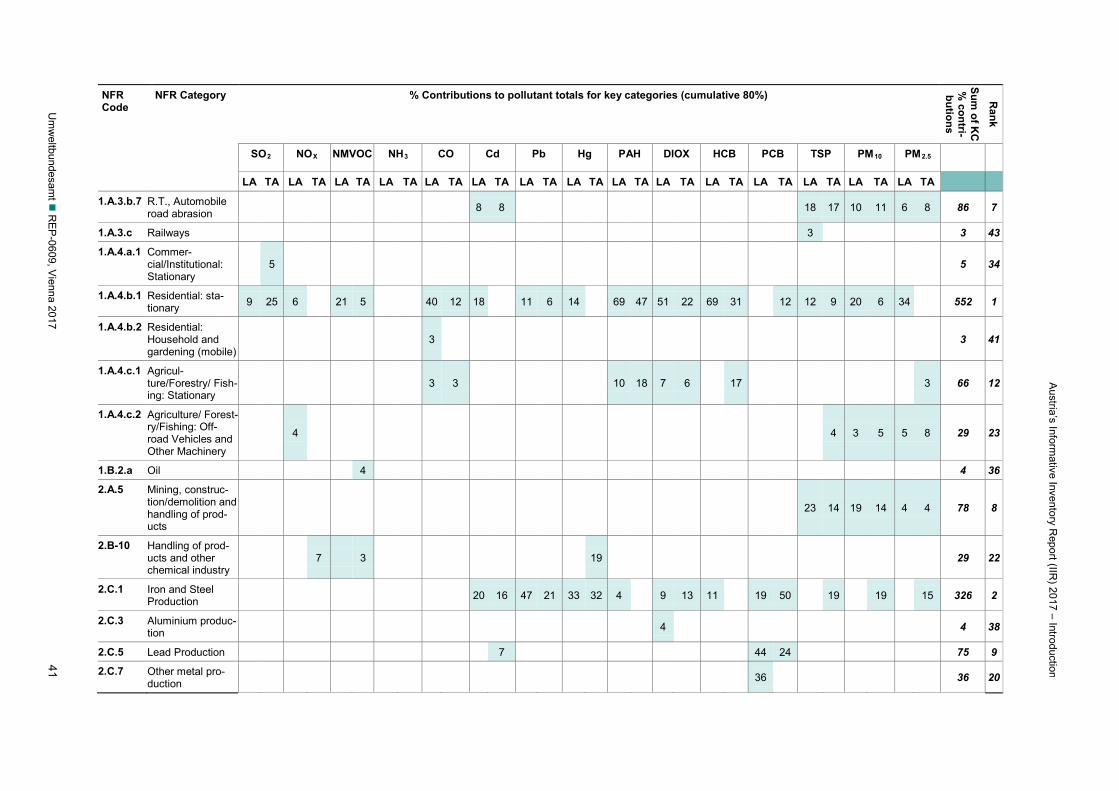
Austria’s Inform
ative Inventory Report (IIR
) 2017 – Introduction
Um
weltbundesam
t R
EP-0609, V
ienna 2017 41
NFR Code
NFR Category % Contributions to pollutant totals for key categories (cumulative 80%)
Sum of K
C
% contri-
butions
Rank
SO2 NOX NMVOC NH3 CO Cd Pb Hg PAH DIOX HCB PCB TSP PM10 PM2.5
LA TA LA TA LA TA LA TA LA TA LA TA LA TA LA TA LA TA LA TA LA TA LA TA LA TA LA TA LA TA
1.A.3.b.7 R.T., Automobile road abrasion
8 8
18 17 10 11 6 8 86 7
1.A.3.c Railways
3
3 43
1.A.4.a.1 Commer-cial/Institutional: Stationary
5
5 34
1.A.4.b.1 Residential: sta-tionary 9 25 6
21 5
40 12 18
11 6 14
69 47 51 22 69 31 12 12 9 20 6 34
552 1
1.A.4.b.2 Residential: Household and gardening (mobile)
3
3 41
1.A.4.c.1 Agricul-ture/Forestry/ Fish-ing: Stationary
3 3
10 18 7 6
17
3 66 12
1.A.4.c.2 Agriculture/ Forest-ry/Fishing: Off-road Vehicles and Other Machinery
4
4 3 5 5 8 29 23
1.B.2.a Oil
4
4 36
2.A.5 Mining, construc-tion/demolition and handling of prod-ucts
23 14 19 14 4 4 78 8
2.B-10 Handling of prod-ucts and other chemical industry
7 3 19 29 22
2.C.1 Iron and Steel Production
20 16 47 21 33 32 4
9 13 11
19 50
19
19
15 326 2
2.C.3 Aluminium produc-tion 4 4 38
2.C.5 Lead Production 7 44 24 75 9
2.C.7 Other metal pro-duction
36
36 20
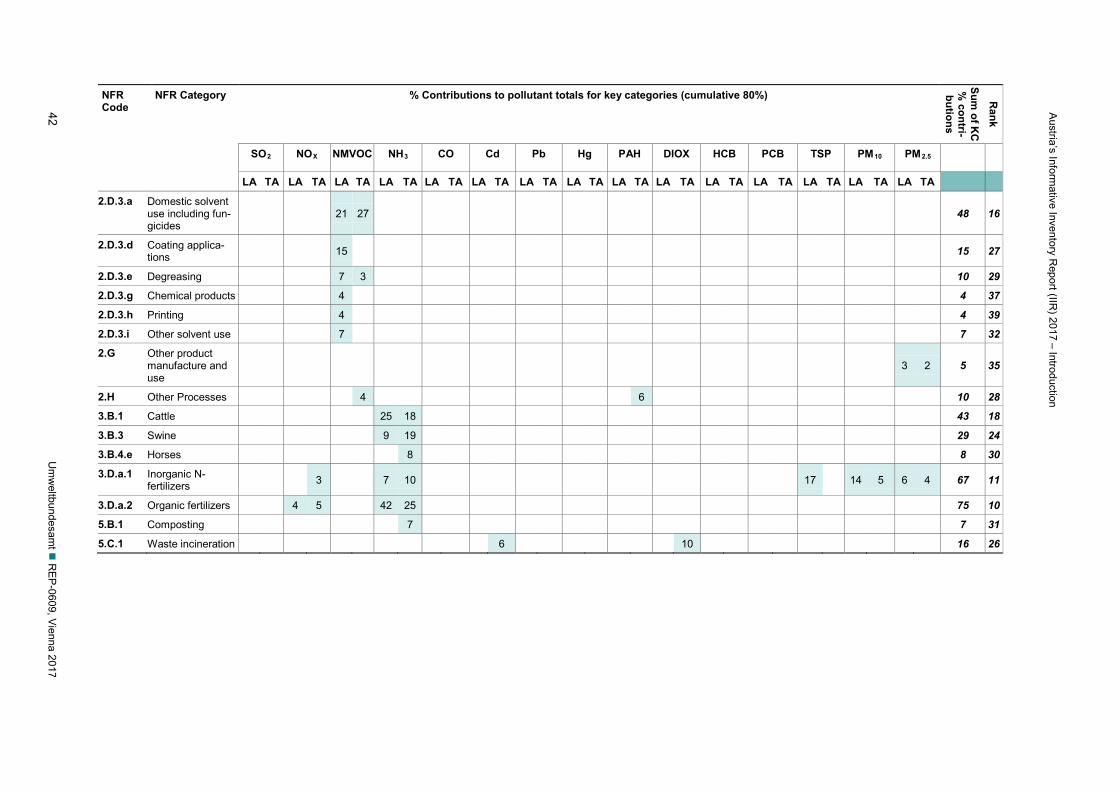
Austria’s Inform
ative Inventory Report (IIR
) 2017 – Introduction
42 U
mw
eltbundesamt
REP
-0609, Vienna 2017
NFR Code
NFR Category % Contributions to pollutant totals for key categories (cumulative 80%)
Sum of K
C
% contri-
butions
Rank
SO2 NOX NMVOC NH3 CO Cd Pb Hg PAH DIOX HCB PCB TSP PM10 PM2.5
LA TA LA TA LA TA LA TA LA TA LA TA LA TA LA TA LA TA LA TA LA TA LA TA LA TA LA TA LA TA
2.D.3.a Domestic solvent use including fun-gicides
21 27
48 16
2.D.3.d Coating applica-tions
15
15 27
2.D.3.e Degreasing
7 3
10 29
2.D.3.g Chemical products
4
4 37
2.D.3.h Printing 4 4 39
2.D.3.i Other solvent use
7
7 32
2.G Other product manufacture and use
3 2 5 35
2.H Other Processes 4 6 10 28
3.B.1 Cattle 25 18 43 18
3.B.3 Swine 9 19 29 24
3.B.4.e Horses
8
8 30
3.D.a.1 Inorganic N-fertilizers 3 7 10 17 14 5 6 4 67 11
3.D.a.2 Organic fertilizers 4 5 42 25 75 10
5.B.1 Composting 7 7 31
5.C.1 Waste incineration 6 10 16 26
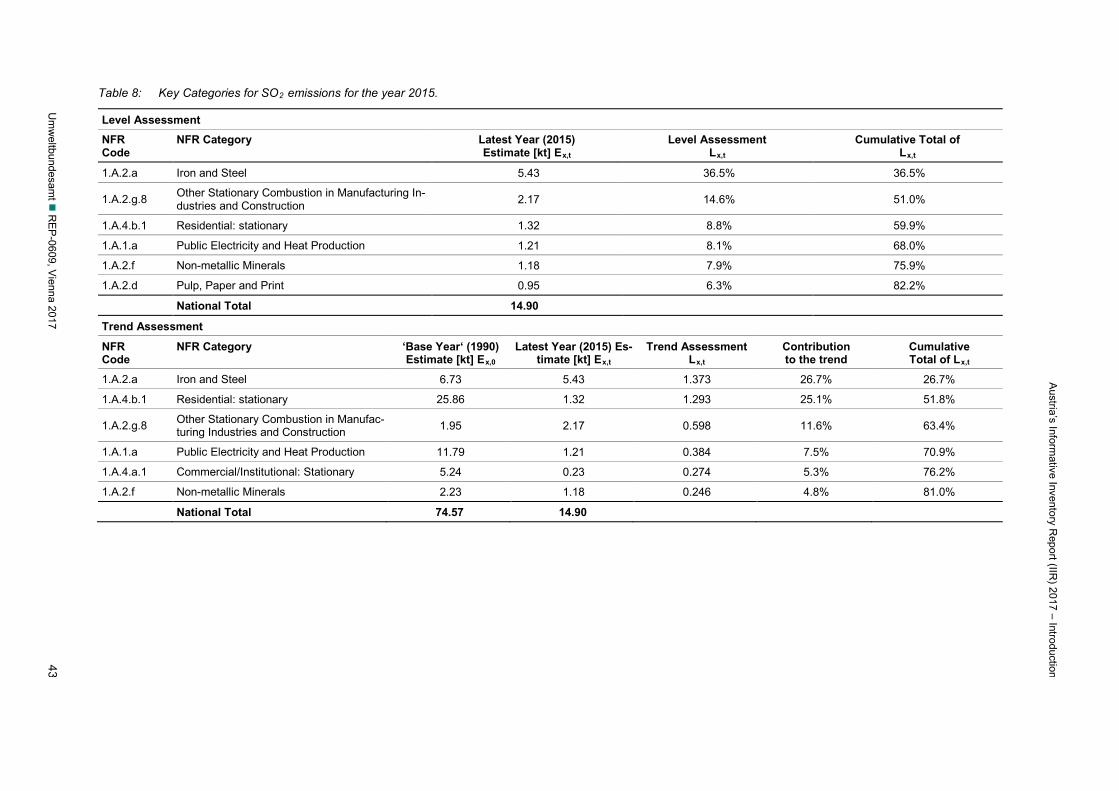
Austria’s Inform
ative Inventory Report (IIR
) 2017 – Introduction
Um
weltbundesam
t R
EP-0609, V
ienna 2017 43
Table 8: Key Categories for SO2 emissions for the year 2015.
Level Assessment NFR Code
NFR Category Latest Year (2015) Estimate [kt] Ex,t
Level Assessment Lx,t
Cumulative Total of Lx,t
1.A.2.a Iron and Steel 5.43 36.5% 36.5%
1.A.2.g.8 Other Stationary Combustion in Manufacturing In-dustries and Construction 2.17 14.6% 51.0%
1.A.4.b.1 Residential: stationary 1.32 8.8% 59.9%
1.A.1.a Public Electricity and Heat Production 1.21 8.1% 68.0%
1.A.2.f Non-metallic Minerals 1.18 7.9% 75.9%
1.A.2.d Pulp, Paper and Print 0.95 6.3% 82.2%
National Total 14.90
Trend Assessment
NFR Code
NFR Category ‘Base Year‘ (1990) Estimate [kt] Ex,0
Latest Year (2015) Es-timate [kt] Ex,t
Trend Assessment Lx,t
Contribution to the trend
Cumulative Total of Lx,t
1.A.2.a Iron and Steel 6.73 5.43 1.373 26.7% 26.7%
1.A.4.b.1 Residential: stationary 25.86 1.32 1.293 25.1% 51.8%
1.A.2.g.8 Other Stationary Combustion in Manufac-turing Industries and Construction 1.95 2.17 0.598 11.6% 63.4%
1.A.1.a Public Electricity and Heat Production 11.79 1.21 0.384 7.5% 70.9%
1.A.4.a.1 Commercial/Institutional: Stationary 5.24 0.23 0.274 5.3% 76.2%
1.A.2.f Non-metallic Minerals 2.23 1.18 0.246 4.8% 81.0%
National Total 74.57 14.90
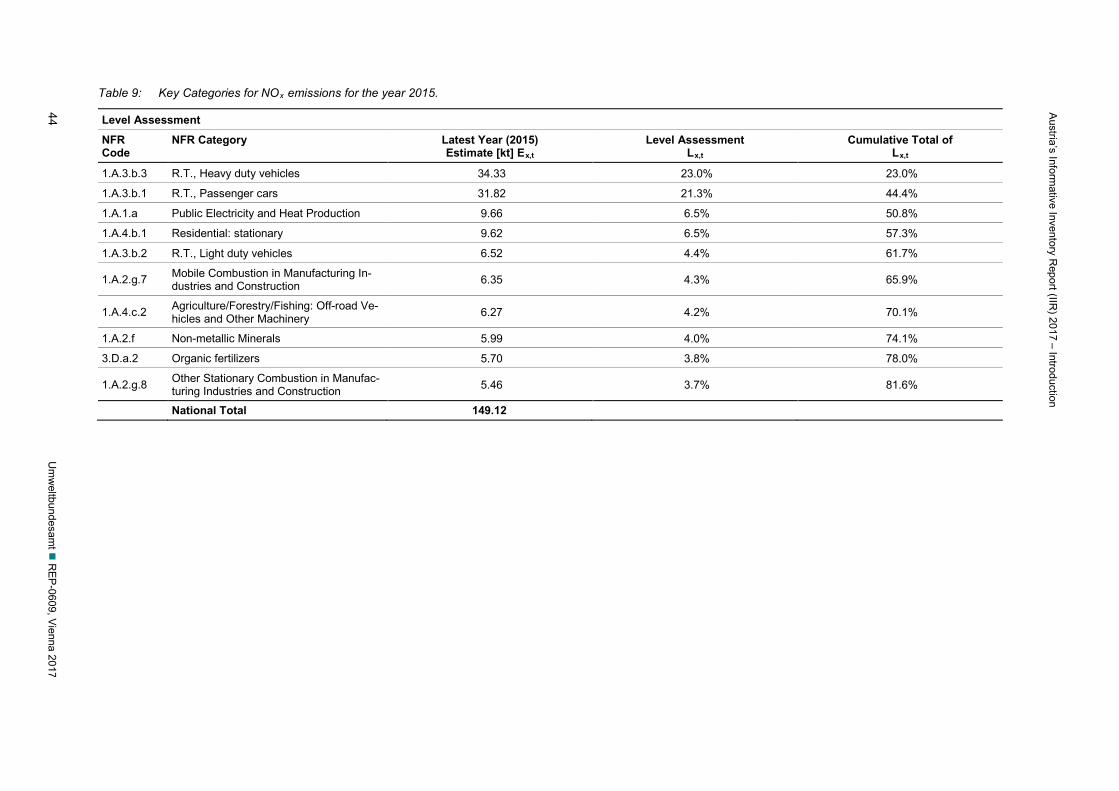
Austria’s Inform
ative Inventory Report (IIR
) 2017 – Introduction
44 U
mw
eltbundesamt
REP
-0609, Vienna 2017
Table 9: Key Categories for NOx emissions for the year 2015.
Level Assessment
NFR Code
NFR Category Latest Year (2015) Estimate [kt] Ex,t
Level Assessment Lx,t
Cumulative Total of Lx,t
1.A.3.b.3 R.T., Heavy duty vehicles 34.33 23.0% 23.0%
1.A.3.b.1 R.T., Passenger cars 31.82 21.3% 44.4%
1.A.1.a Public Electricity and Heat Production 9.66 6.5% 50.8%
1.A.4.b.1 Residential: stationary 9.62 6.5% 57.3%
1.A.3.b.2 R.T., Light duty vehicles 6.52 4.4% 61.7%
1.A.2.g.7 Mobile Combustion in Manufacturing In-dustries and Construction 6.35 4.3% 65.9%
1.A.4.c.2 Agriculture/Forestry/Fishing: Off-road Ve-hicles and Other Machinery 6.27 4.2% 70.1%
1.A.2.f Non-metallic Minerals 5.99 4.0% 74.1%
3.D.a.2 Organic fertilizers 5.70 3.8% 78.0%
1.A.2.g.8 Other Stationary Combustion in Manufac-turing Industries and Construction 5.46 3.7% 81.6%
National Total 149.12
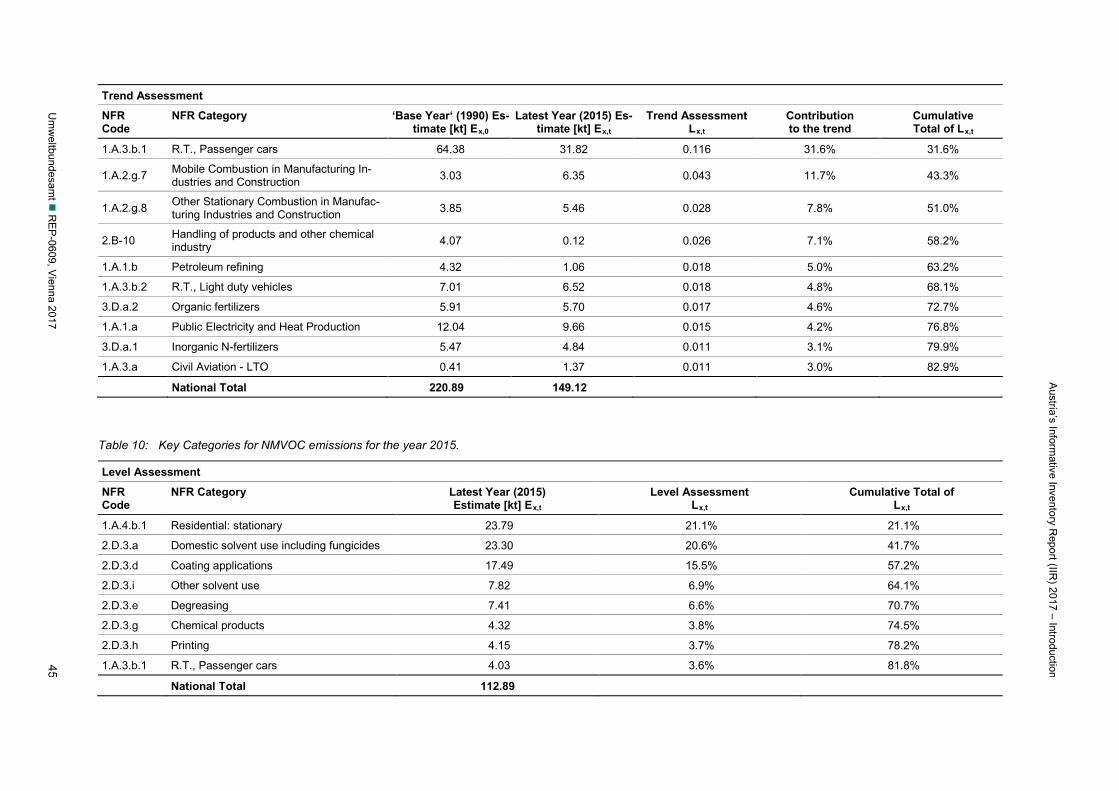
Austria’s Inform
ative Inventory Report (IIR
) 2017 – Introduction
Um
weltbundesam
t R
EP-0609, V
ienna 2017 45
Trend Assessment
NFR Code
NFR Category ‘Base Year‘ (1990) Es-timate [kt] Ex,0
Latest Year (2015) Es-timate [kt] Ex,t
Trend Assessment Lx,t
Contribution to the trend
Cumulative Total of Lx,t
1.A.3.b.1 R.T., Passenger cars 64.38 31.82 0.116 31.6% 31.6%
1.A.2.g.7 Mobile Combustion in Manufacturing In-dustries and Construction 3.03 6.35 0.043 11.7% 43.3%
1.A.2.g.8 Other Stationary Combustion in Manufac-turing Industries and Construction 3.85 5.46 0.028 7.8% 51.0%
2.B-10 Handling of products and other chemical industry 4.07 0.12 0.026 7.1% 58.2%
1.A.1.b Petroleum refining 4.32 1.06 0.018 5.0% 63.2%
1.A.3.b.2 R.T., Light duty vehicles 7.01 6.52 0.018 4.8% 68.1%
3.D.a.2 Organic fertilizers 5.91 5.70 0.017 4.6% 72.7%
1.A.1.a Public Electricity and Heat Production 12.04 9.66 0.015 4.2% 76.8%
3.D.a.1 Inorganic N-fertilizers 5.47 4.84 0.011 3.1% 79.9%
1.A.3.a Civil Aviation - LTO 0.41 1.37 0.011 3.0% 82.9%
National Total 220.89 149.12
Table 10: Key Categories for NMVOC emissions for the year 2015.
Level Assessment
NFR Code
NFR Category Latest Year (2015) Estimate [kt] Ex,t
Level Assessment Lx,t
Cumulative Total of Lx,t
1.A.4.b.1 Residential: stationary 23.79 21.1% 21.1%
2.D.3.a Domestic solvent use including fungicides 23.30 20.6% 41.7%
2.D.3.d Coating applications 17.49 15.5% 57.2%
2.D.3.i Other solvent use 7.82 6.9% 64.1%
2.D.3.e Degreasing 7.41 6.6% 70.7%
2.D.3.g Chemical products 4.32 3.8% 74.5%
2.D.3.h Printing 4.15 3.7% 78.2%
1.A.3.b.1 R.T., Passenger cars 4.03 3.6% 81.8%
National Total 112.89
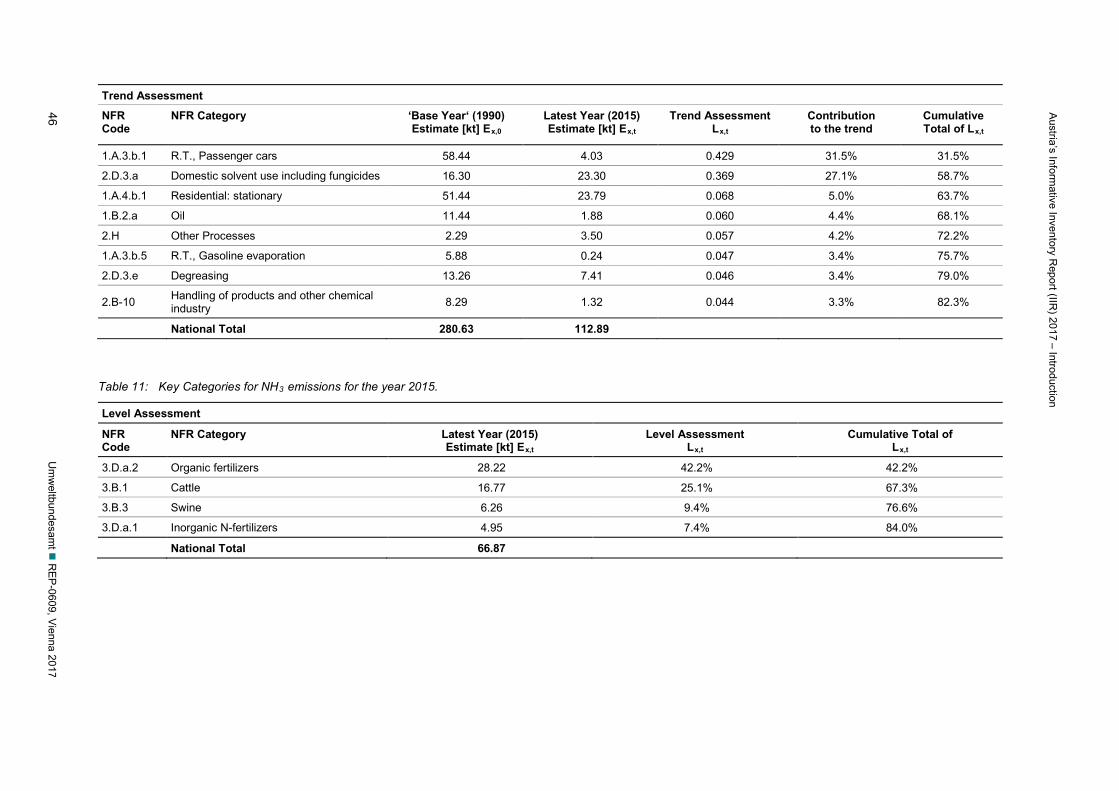
Austria’s Inform
ative Inventory Report (IIR
) 2017 – Introduction
46 U
mw
eltbundesamt
REP
-0609, Vienna 2017
Trend Assessment
NFR Code
NFR Category
‘Base Year‘ (1990) Estimate [kt] Ex,0
Latest Year (2015) Estimate [kt] Ex,t
Trend Assessment Lx,t
Contribution to the trend
Cumulative Total of Lx,t
1.A.3.b.1 R.T., Passenger cars 58.44 4.03 0.429 31.5% 31.5%
2.D.3.a Domestic solvent use including fungicides 16.30 23.30 0.369 27.1% 58.7%
1.A.4.b.1 Residential: stationary 51.44 23.79 0.068 5.0% 63.7%
1.B.2.a Oil 11.44 1.88 0.060 4.4% 68.1%
2.H Other Processes 2.29 3.50 0.057 4.2% 72.2%
1.A.3.b.5 R.T., Gasoline evaporation 5.88 0.24 0.047 3.4% 75.7%
2.D.3.e Degreasing 13.26 7.41 0.046 3.4% 79.0%
2.B-10 Handling of products and other chemical industry 8.29 1.32 0.044 3.3% 82.3%
National Total 280.63 112.89
Table 11: Key Categories for NH3 emissions for the year 2015.
Level Assessment
NFR Code
NFR Category Latest Year (2015) Estimate [kt] Ex,t
Level Assessment Lx,t
Cumulative Total of Lx,t
3.D.a.2 Organic fertilizers 28.22 42.2% 42.2%
3.B.1 Cattle 16.77 25.1% 67.3%
3.B.3 Swine 6.26 9.4% 76.6%
3.D.a.1 Inorganic N-fertilizers 4.95 7.4% 84.0%
National Total 66.87
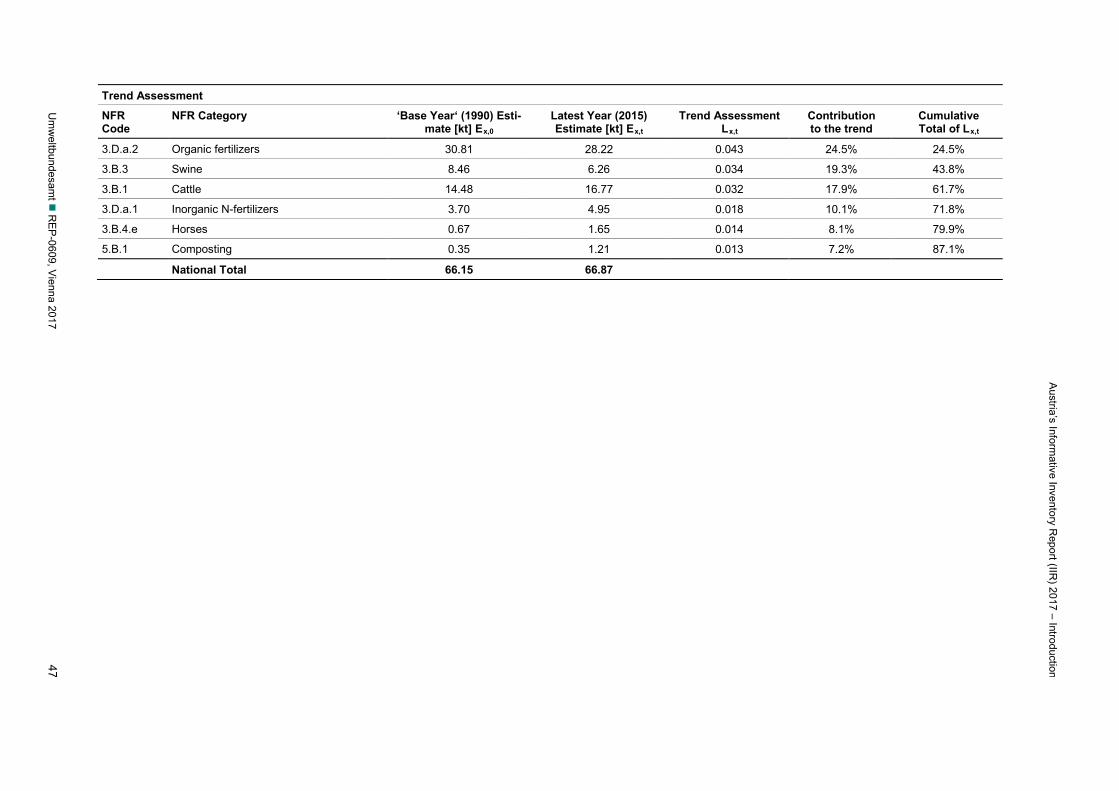
Austria’s Inform
ative Inventory Report (IIR
) 2017 – Introduction
Um
weltbundesam
t R
EP-0609, V
ienna 2017 47
Trend Assessment
NFR Code
NFR Category ‘Base Year‘ (1990) Esti-mate [kt] Ex,0
Latest Year (2015) Estimate [kt] Ex,t
Trend Assessment Lx,t
Contribution to the trend
Cumulative Total of Lx,t
3.D.a.2 Organic fertilizers 30.81 28.22 0.043 24.5% 24.5%
3.B.3 Swine 8.46 6.26 0.034 19.3% 43.8%
3.B.1 Cattle 14.48 16.77 0.032 17.9% 61.7%
3.D.a.1 Inorganic N-fertilizers 3.70 4.95 0.018 10.1% 71.8%
3.B.4.e Horses 0.67 1.65 0.014 8.1% 79.9%
5.B.1 Composting 0.35 1.21 0.013 7.2% 87.1%
National Total 66.15 66.87
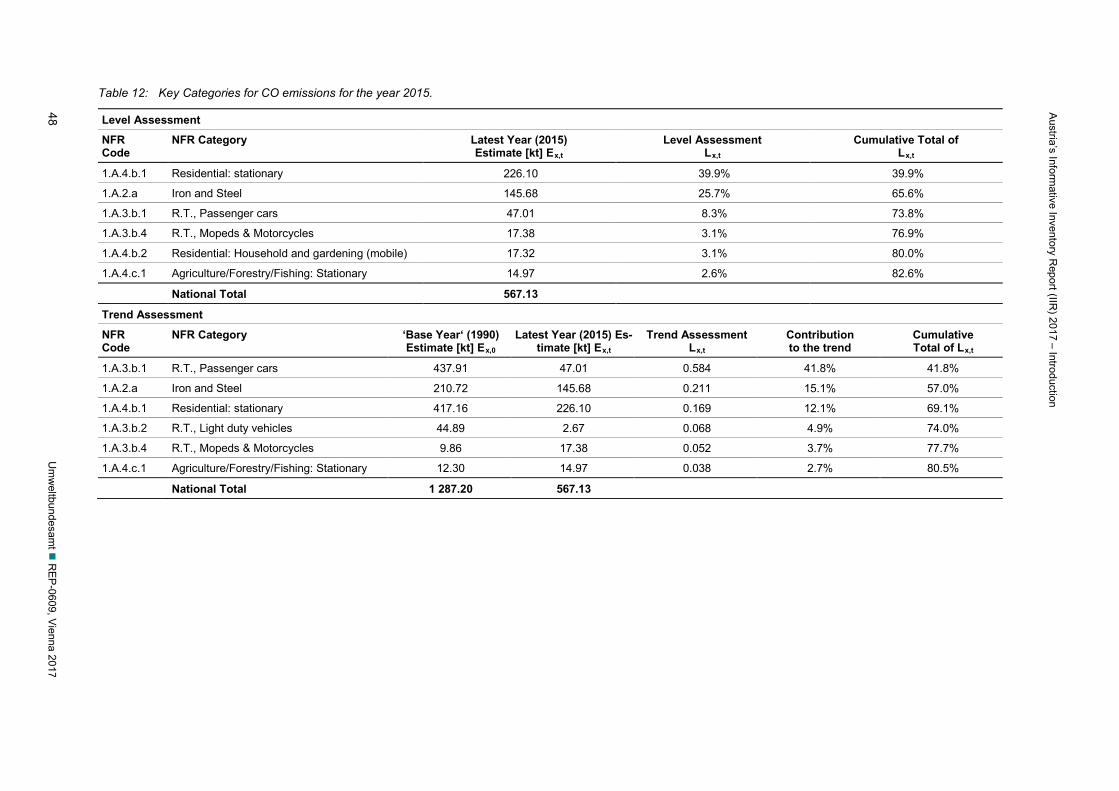
Austria’s Inform
ative Inventory Report (IIR
) 2017 – Introduction
48 U
mw
eltbundesamt
REP
-0609, Vienna 2017
Table 12: Key Categories for CO emissions for the year 2015.
Level Assessment
NFR Code
NFR Category Latest Year (2015) Estimate [kt] Ex,t
Level Assessment Lx,t
Cumulative Total of Lx,t
1.A.4.b.1 Residential: stationary 226.10 39.9% 39.9%
1.A.2.a Iron and Steel 145.68 25.7% 65.6%
1.A.3.b.1 R.T., Passenger cars 47.01 8.3% 73.8%
1.A.3.b.4 R.T., Mopeds & Motorcycles 17.38 3.1% 76.9%
1.A.4.b.2 Residential: Household and gardening (mobile) 17.32 3.1% 80.0%
1.A.4.c.1 Agriculture/Forestry/Fishing: Stationary 14.97 2.6% 82.6%
National Total 567.13
Trend Assessment
NFR Code
NFR Category ‘Base Year‘ (1990) Estimate [kt] Ex,0
Latest Year (2015) Es-timate [kt] Ex,t
Trend Assessment Lx,t
Contribution to the trend
Cumulative Total of Lx,t
1.A.3.b.1 R.T., Passenger cars 437.91 47.01 0.584 41.8% 41.8%
1.A.2.a Iron and Steel 210.72 145.68 0.211 15.1% 57.0%
1.A.4.b.1 Residential: stationary 417.16 226.10 0.169 12.1% 69.1%
1.A.3.b.2 R.T., Light duty vehicles 44.89 2.67 0.068 4.9% 74.0%
1.A.3.b.4 R.T., Mopeds & Motorcycles 9.86 17.38 0.052 3.7% 77.7%
1.A.4.c.1 Agriculture/Forestry/Fishing: Stationary 12.30 14.97 0.038 2.7% 80.5%
National Total 1 287.20 567.13
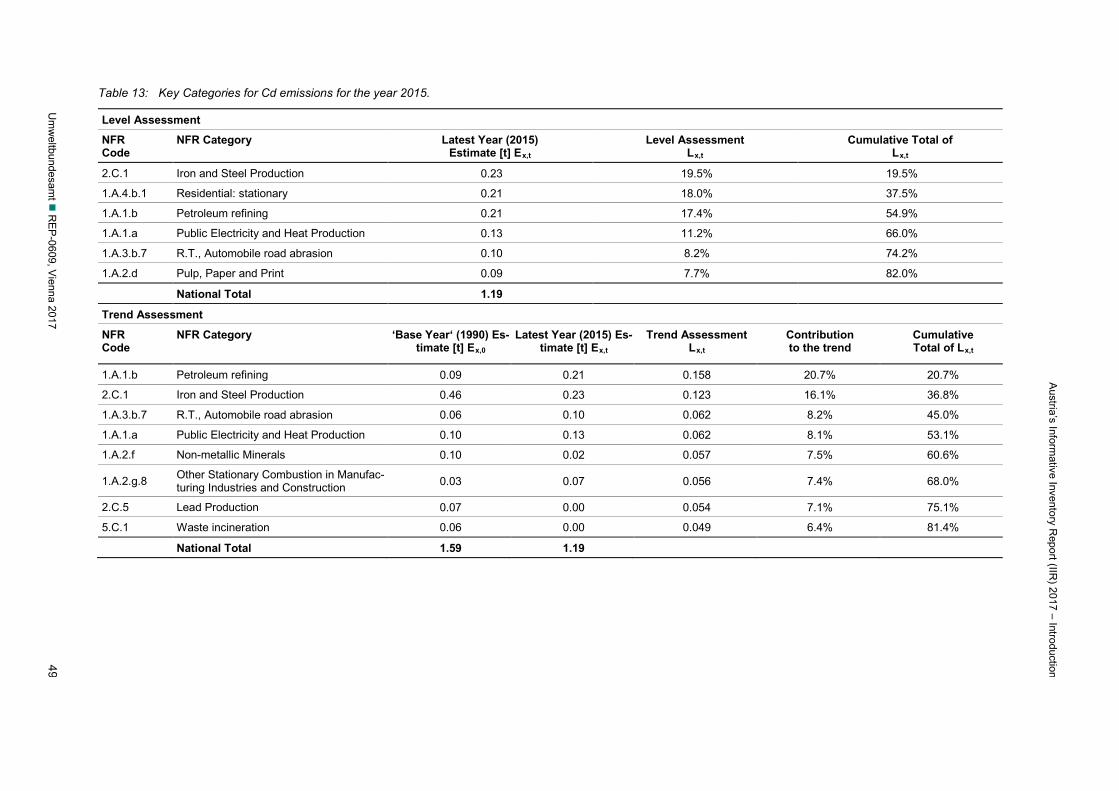
Austria’s Inform
ative Inventory Report (IIR
) 2017 – Introduction
Um
weltbundesam
t R
EP-0609, V
ienna 2017 49
Table 13: Key Categories for Cd emissions for the year 2015.
Level Assessment
NFR Code
NFR Category Latest Year (2015) Estimate [t] Ex,t
Level Assessment Lx,t
Cumulative Total of Lx,t
2.C.1 Iron and Steel Production 0.23 19.5% 19.5%
1.A.4.b.1 Residential: stationary 0.21 18.0% 37.5%
1.A.1.b Petroleum refining 0.21 17.4% 54.9%
1.A.1.a Public Electricity and Heat Production 0.13 11.2% 66.0%
1.A.3.b.7 R.T., Automobile road abrasion 0.10 8.2% 74.2%
1.A.2.d Pulp, Paper and Print 0.09 7.7% 82.0%
National Total 1.19
Trend Assessment
NFR Code
NFR Category
‘Base Year‘ (1990) Es-timate [t] Ex,0
Latest Year (2015) Es-timate [t] Ex,t
Trend Assessment Lx,t
Contribution to the trend
Cumulative Total of Lx,t
1.A.1.b Petroleum refining 0.09 0.21 0.158 20.7% 20.7%
2.C.1 Iron and Steel Production 0.46 0.23 0.123 16.1% 36.8%
1.A.3.b.7 R.T., Automobile road abrasion 0.06 0.10 0.062 8.2% 45.0%
1.A.1.a Public Electricity and Heat Production 0.10 0.13 0.062 8.1% 53.1%
1.A.2.f Non-metallic Minerals 0.10 0.02 0.057 7.5% 60.6%
1.A.2.g.8 Other Stationary Combustion in Manufac-turing Industries and Construction 0.03 0.07 0.056 7.4% 68.0%
2.C.5 Lead Production 0.07 0.00 0.054 7.1% 75.1%
5.C.1 Waste incineration 0.06 0.00 0.049 6.4% 81.4%
National Total 1.59 1.19
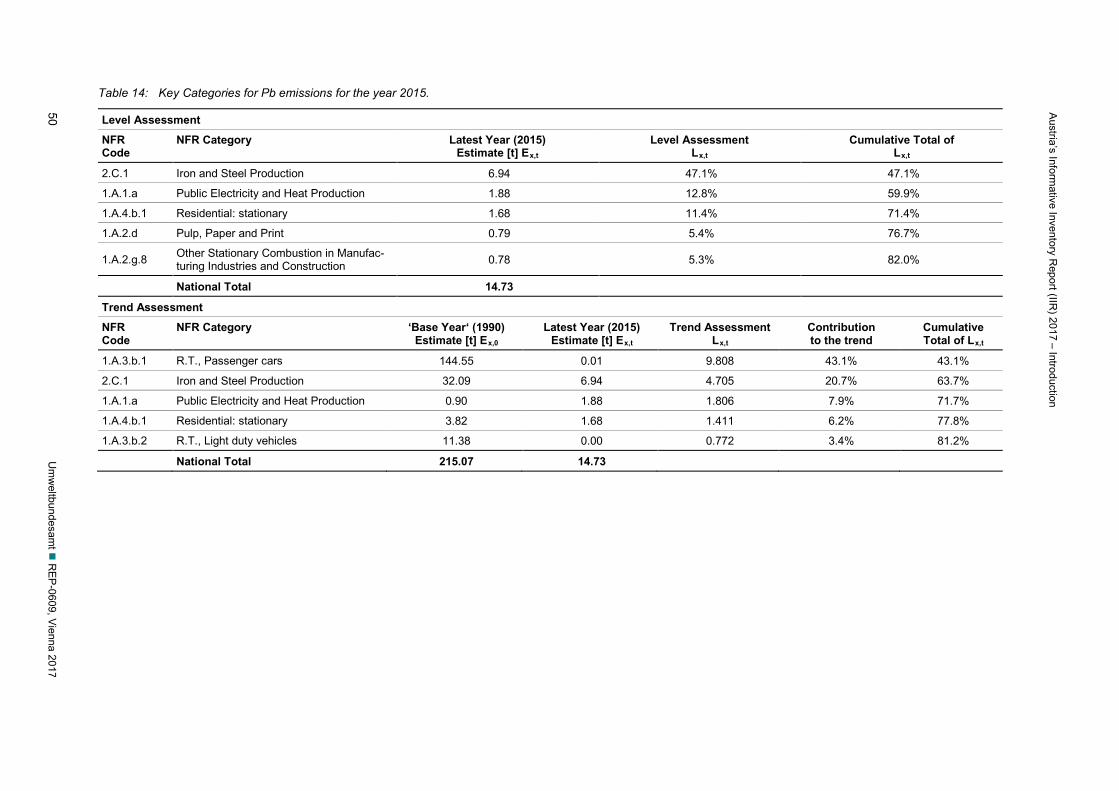
Austria’s Inform
ative Inventory Report (IIR
) 2017 – Introduction
50 U
mw
eltbundesamt
REP
-0609, Vienna 2017
Table 14: Key Categories for Pb emissions for the year 2015.
Level Assessment
NFR Code
NFR Category Latest Year (2015) Estimate [t] Ex,t
Level Assessment Lx,t
Cumulative Total of Lx,t
2.C.1 Iron and Steel Production 6.94 47.1% 47.1%
1.A.1.a Public Electricity and Heat Production 1.88 12.8% 59.9%
1.A.4.b.1 Residential: stationary 1.68 11.4% 71.4%
1.A.2.d Pulp, Paper and Print 0.79 5.4% 76.7%
1.A.2.g.8 Other Stationary Combustion in Manufac-turing Industries and Construction 0.78 5.3% 82.0%
National Total 14.73
Trend Assessment
NFR Code
NFR Category ‘Base Year‘ (1990) Estimate [t] Ex,0
Latest Year (2015) Estimate [t] Ex,t
Trend Assessment Lx,t
Contribution to the trend
Cumulative Total of Lx,t
1.A.3.b.1 R.T., Passenger cars 144.55 0.01 9.808 43.1% 43.1%
2.C.1 Iron and Steel Production 32.09 6.94 4.705 20.7% 63.7%
1.A.1.a Public Electricity and Heat Production 0.90 1.88 1.806 7.9% 71.7%
1.A.4.b.1 Residential: stationary 3.82 1.68 1.411 6.2% 77.8%
1.A.3.b.2 R.T., Light duty vehicles 11.38 0.00 0.772 3.4% 81.2%
National Total 215.07 14.73
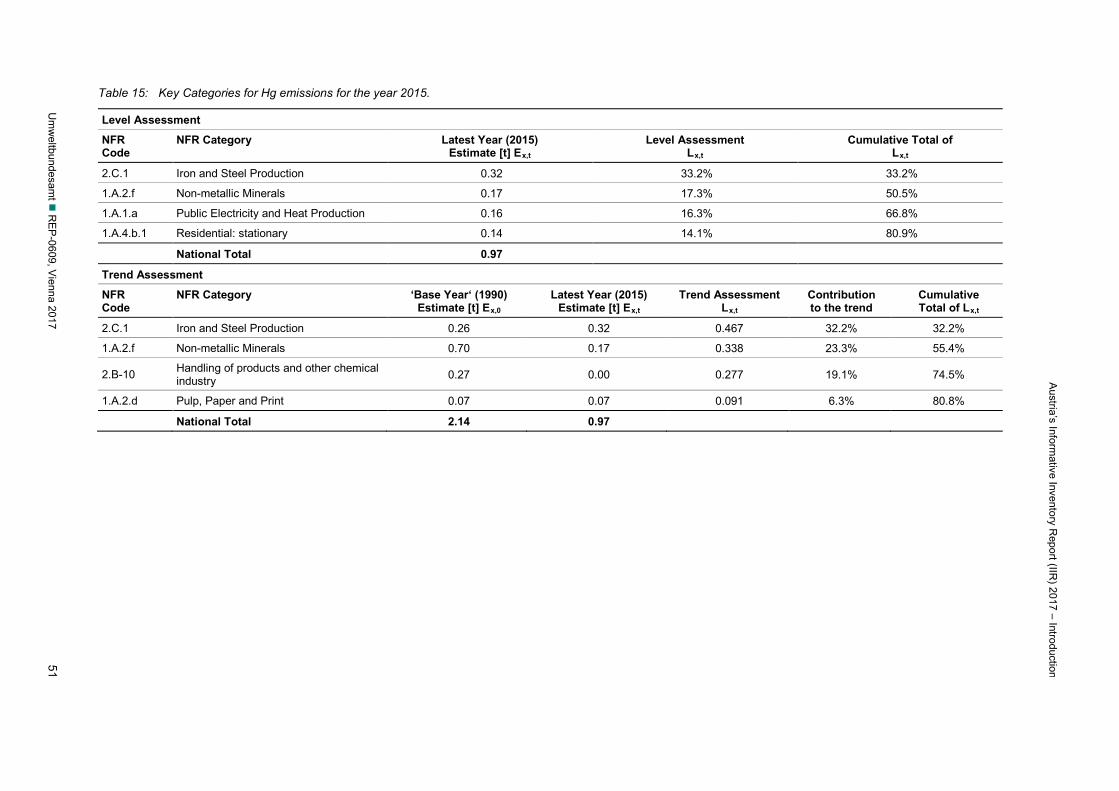
Austria’s Inform
ative Inventory Report (IIR
) 2017 – Introduction
Um
weltbundesam
t R
EP-0609, V
ienna 2017 51
Table 15: Key Categories for Hg emissions for the year 2015.
Level Assessment
NFR Code
NFR Category Latest Year (2015) Estimate [t] Ex,t
Level Assessment Lx,t
Cumulative Total of Lx,t
2.C.1 Iron and Steel Production 0.32 33.2% 33.2%
1.A.2.f Non-metallic Minerals 0.17 17.3% 50.5%
1.A.1.a Public Electricity and Heat Production 0.16 16.3% 66.8%
1.A.4.b.1 Residential: stationary 0.14 14.1% 80.9%
National Total 0.97
Trend Assessment
NFR Code
NFR Category ‘Base Year‘ (1990) Estimate [t] Ex,0
Latest Year (2015) Estimate [t] Ex,t
Trend Assessment Lx,t
Contribution to the trend
Cumulative Total of Lx,t
2.C.1 Iron and Steel Production 0.26 0.32 0.467 32.2% 32.2%
1.A.2.f Non-metallic Minerals 0.70 0.17 0.338 23.3% 55.4%
2.B-10 Handling of products and other chemical industry 0.27 0.00 0.277 19.1% 74.5%
1.A.2.d Pulp, Paper and Print 0.07 0.07 0.091 6.3% 80.8%
National Total 2.14 0.97
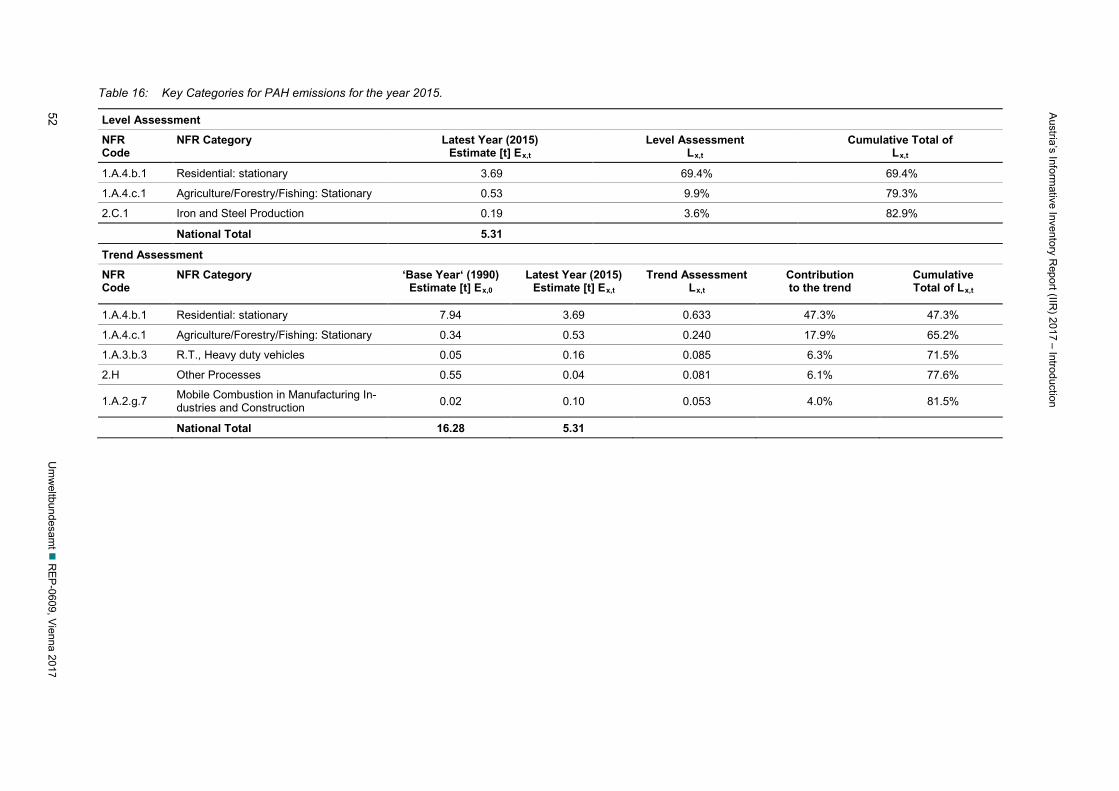
Austria’s Inform
ative Inventory Report (IIR
) 2017 – Introduction
52 U
mw
eltbundesamt
REP
-0609, Vienna 2017
Table 16: Key Categories for PAH emissions for the year 2015.
Level Assessment
NFR Code
NFR Category Latest Year (2015) Estimate [t] Ex,t
Level Assessment Lx,t
Cumulative Total of Lx,t
1.A.4.b.1 Residential: stationary 3.69 69.4% 69.4%
1.A.4.c.1 Agriculture/Forestry/Fishing: Stationary 0.53 9.9% 79.3%
2.C.1 Iron and Steel Production 0.19 3.6% 82.9%
National Total 5.31
Trend Assessment
NFR Code
NFR Category
‘Base Year‘ (1990) Estimate [t] Ex,0
Latest Year (2015) Estimate [t] Ex,t
Trend Assessment Lx,t
Contribution to the trend
Cumulative Total of Lx,t
1.A.4.b.1 Residential: stationary 7.94 3.69 0.633 47.3% 47.3%
1.A.4.c.1 Agriculture/Forestry/Fishing: Stationary 0.34 0.53 0.240 17.9% 65.2%
1.A.3.b.3 R.T., Heavy duty vehicles 0.05 0.16 0.085 6.3% 71.5%
2.H Other Processes 0.55 0.04 0.081 6.1% 77.6%
1.A.2.g.7 Mobile Combustion in Manufacturing In-dustries and Construction 0.02 0.10 0.053 4.0% 81.5%
National Total 16.28 5.31
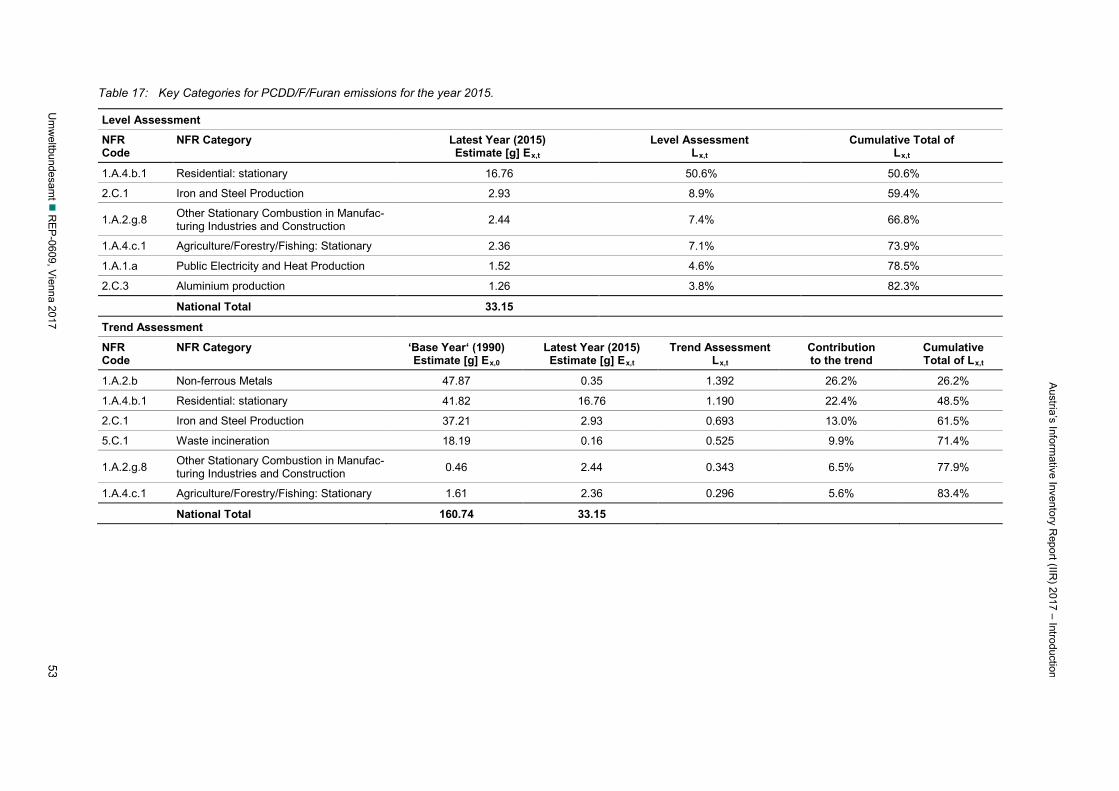
Austria’s Inform
ative Inventory Report (IIR
) 2017 – Introduction
Um
weltbundesam
t R
EP-0609, V
ienna 2017 53
Table 17: Key Categories for PCDD/F/Furan emissions for the year 2015.
Level Assessment
NFR Code
NFR Category Latest Year (2015) Estimate [g] Ex,t
Level Assessment Lx,t
Cumulative Total of Lx,t
1.A.4.b.1 Residential: stationary 16.76 50.6% 50.6%
2.C.1 Iron and Steel Production 2.93 8.9% 59.4%
1.A.2.g.8 Other Stationary Combustion in Manufac-turing Industries and Construction 2.44 7.4% 66.8%
1.A.4.c.1 Agriculture/Forestry/Fishing: Stationary 2.36 7.1% 73.9%
1.A.1.a Public Electricity and Heat Production 1.52 4.6% 78.5%
2.C.3 Aluminium production 1.26 3.8% 82.3%
National Total 33.15
Trend Assessment
NFR Code
NFR Category ‘Base Year‘ (1990) Estimate [g] Ex,0
Latest Year (2015) Estimate [g] Ex,t
Trend Assessment Lx,t
Contribution to the trend
Cumulative Total of Lx,t
1.A.2.b Non-ferrous Metals 47.87 0.35 1.392 26.2% 26.2%
1.A.4.b.1 Residential: stationary 41.82 16.76 1.190 22.4% 48.5%
2.C.1 Iron and Steel Production 37.21 2.93 0.693 13.0% 61.5%
5.C.1 Waste incineration 18.19 0.16 0.525 9.9% 71.4%
1.A.2.g.8 Other Stationary Combustion in Manufac-turing Industries and Construction 0.46 2.44 0.343 6.5% 77.9%
1.A.4.c.1 Agriculture/Forestry/Fishing: Stationary 1.61 2.36 0.296 5.6% 83.4%
National Total 160.74 33.15
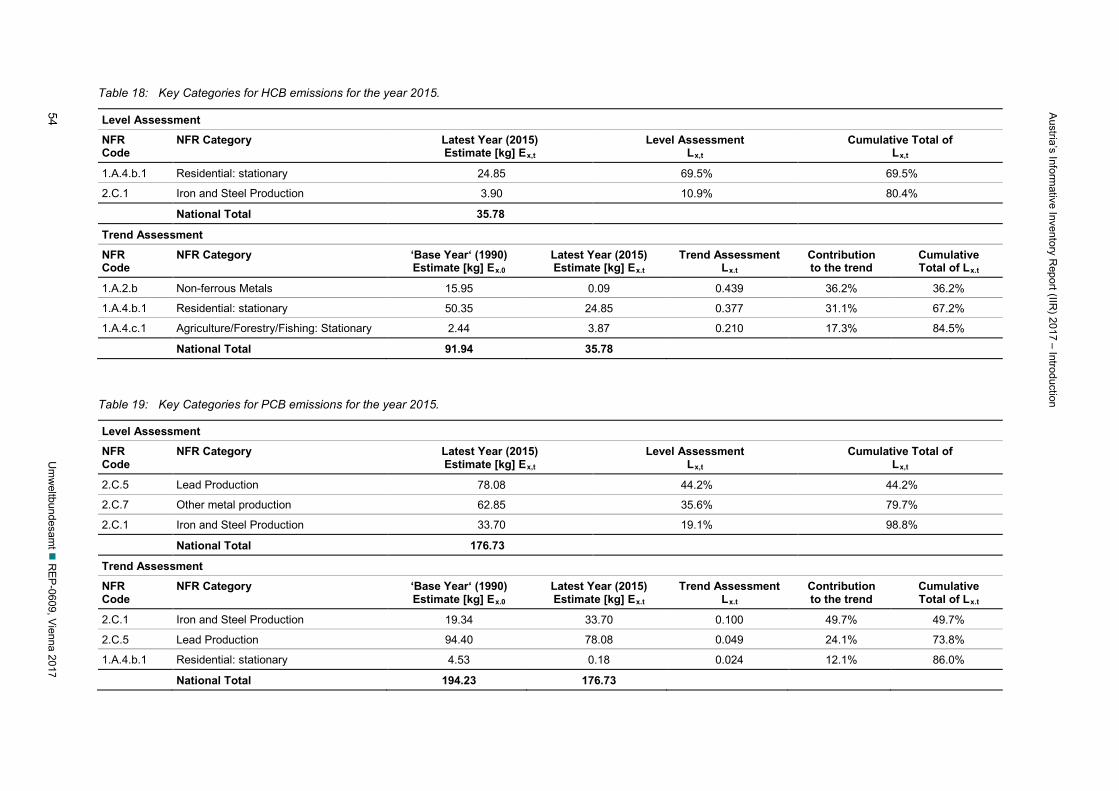
Austria’s Inform
ative Inventory Report (IIR
) 2017 – Introduction
54 U
mw
eltbundesamt
REP
-0609, Vienna 2017
Table 18: Key Categories for HCB emissions for the year 2015.
Level Assessment
NFR Code
NFR Category Latest Year (2015) Estimate [kg] Ex,t
Level Assessment Lx,t
Cumulative Total of Lx,t
1.A.4.b.1 Residential: stationary 24.85 69.5% 69.5%
2.C.1 Iron and Steel Production 3.90 10.9% 80.4%
National Total 35.78
Trend Assessment
NFR Code
NFR Category ‘Base Year‘ (1990) Estimate [kg] Ex.0
Latest Year (2015) Estimate [kg] Ex.t
Trend Assessment Lx.t
Contribution to the trend
Cumulative Total of Lx.t
1.A.2.b Non-ferrous Metals 15.95 0.09 0.439 36.2% 36.2%
1.A.4.b.1 Residential: stationary 50.35 24.85 0.377 31.1% 67.2%
1.A.4.c.1 Agriculture/Forestry/Fishing: Stationary 2.44 3.87 0.210 17.3% 84.5%
National Total 91.94 35.78
Table 19: Key Categories for PCB emissions for the year 2015.
Level Assessment
NFR Code
NFR Category Latest Year (2015) Estimate [kg] Ex,t
Level Assessment Lx,t
Cumulative Total of Lx,t
2.C.5 Lead Production 78.08 44.2% 44.2%
2.C.7 Other metal production 62.85 35.6% 79.7%
2.C.1 Iron and Steel Production 33.70 19.1% 98.8%
National Total 176.73
Trend Assessment
NFR Code
NFR Category ‘Base Year‘ (1990) Estimate [kg] Ex.0
Latest Year (2015) Estimate [kg] Ex.t
Trend Assessment Lx.t
Contribution to the trend
Cumulative Total of Lx.t
2.C.1 Iron and Steel Production 19.34 33.70 0.100 49.7% 49.7%
2.C.5 Lead Production 94.40 78.08 0.049 24.1% 73.8%
1.A.4.b.1 Residential: stationary 4.53 0.18 0.024 12.1% 86.0%
National Total 194.23 176.73
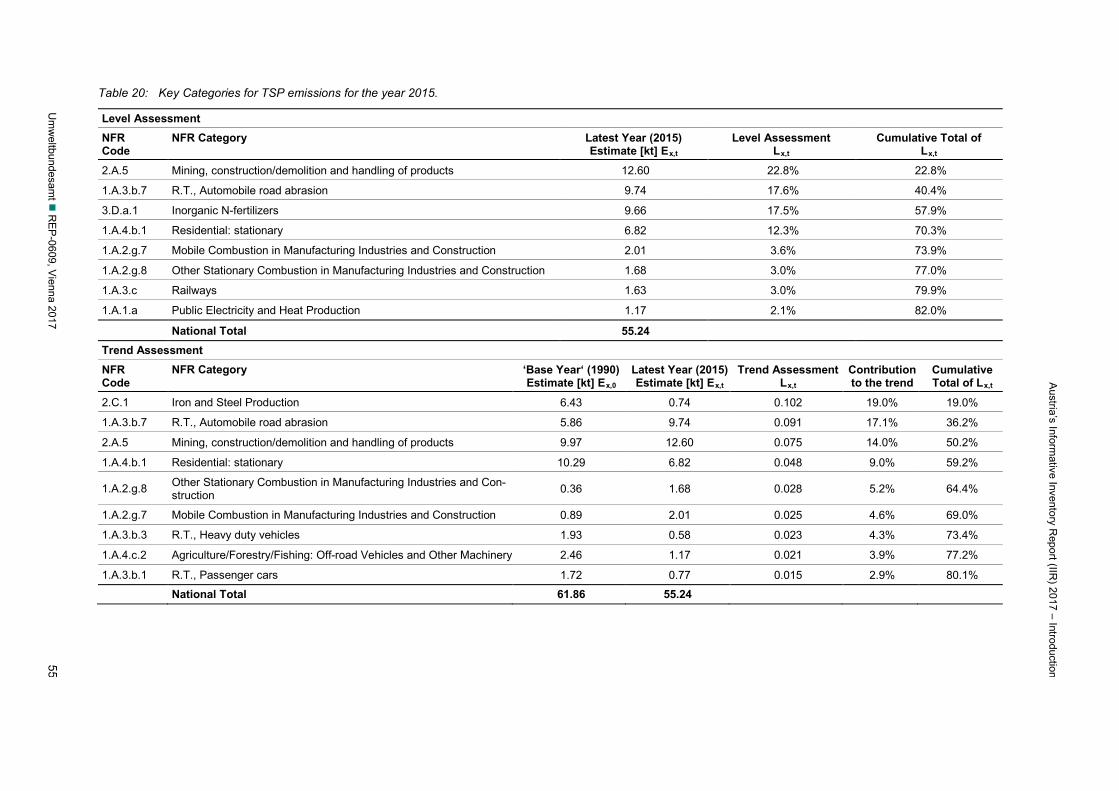
Austria’s Inform
ative Inventory Report (IIR
) 2017 – Introduction
Um
weltbundesam
t R
EP-0609, V
ienna 2017 55
Table 20: Key Categories for TSP emissions for the year 2015.
Level Assessment NFR Code
NFR Category Latest Year (2015) Estimate [kt] Ex,t
Level Assessment Lx,t
Cumulative Total of Lx,t
2.A.5 Mining, construction/demolition and handling of products 12.60 22.8% 22.8%
1.A.3.b.7 R.T., Automobile road abrasion 9.74 17.6% 40.4%
3.D.a.1 Inorganic N-fertilizers 9.66 17.5% 57.9%
1.A.4.b.1 Residential: stationary 6.82 12.3% 70.3%
1.A.2.g.7 Mobile Combustion in Manufacturing Industries and Construction 2.01 3.6% 73.9%
1.A.2.g.8 Other Stationary Combustion in Manufacturing Industries and Construction 1.68 3.0% 77.0%
1.A.3.c Railways 1.63 3.0% 79.9%
1.A.1.a Public Electricity and Heat Production 1.17 2.1% 82.0%
National Total 55.24
Trend Assessment NFR Code
NFR Category ‘Base Year‘ (1990) Estimate [kt] Ex,0
Latest Year (2015) Estimate [kt] Ex,t
Trend Assessment Lx,t
Contribution to the trend
Cumulative Total of Lx,t
2.C.1 Iron and Steel Production 6.43 0.74 0.102 19.0% 19.0%
1.A.3.b.7 R.T., Automobile road abrasion 5.86 9.74 0.091 17.1% 36.2%
2.A.5 Mining, construction/demolition and handling of products 9.97 12.60 0.075 14.0% 50.2%
1.A.4.b.1 Residential: stationary 10.29 6.82 0.048 9.0% 59.2%
1.A.2.g.8 Other Stationary Combustion in Manufacturing Industries and Con-struction 0.36 1.68 0.028 5.2% 64.4%
1.A.2.g.7 Mobile Combustion in Manufacturing Industries and Construction 0.89 2.01 0.025 4.6% 69.0%
1.A.3.b.3 R.T., Heavy duty vehicles 1.93 0.58 0.023 4.3% 73.4%
1.A.4.c.2 Agriculture/Forestry/Fishing: Off-road Vehicles and Other Machinery 2.46 1.17 0.021 3.9% 77.2%
1.A.3.b.1 R.T., Passenger cars 1.72 0.77 0.015 2.9% 80.1%
National Total 61.86 55.24
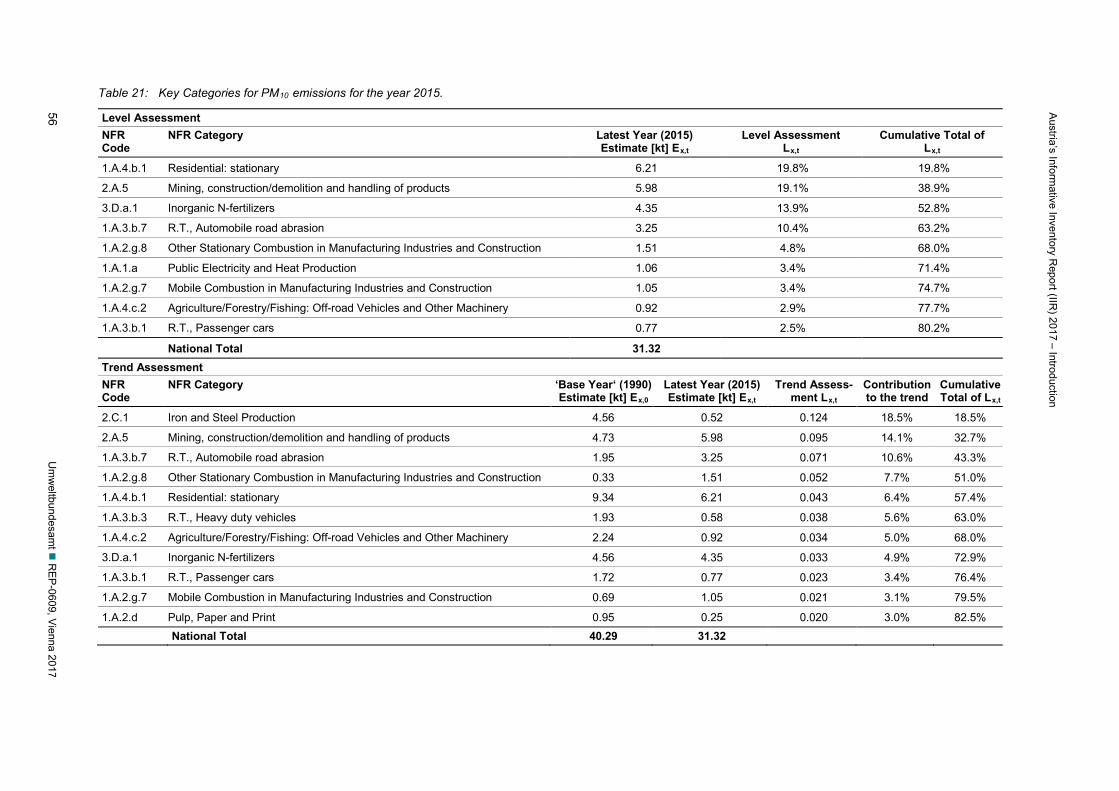
Austria’s Inform
ative Inventory Report (IIR
) 2017 – Introduction
56 U
mw
eltbundesamt
REP
-0609, Vienna 2017
Table 21: Key Categories for PM10 emissions for the year 2015.
Level Assessment NFR Code
NFR Category Latest Year (2015) Estimate [kt] Ex,t
Level Assessment Lx,t
Cumulative Total of Lx,t
1.A.4.b.1 Residential: stationary 6.21 19.8% 19.8%
2.A.5 Mining, construction/demolition and handling of products 5.98 19.1% 38.9%
3.D.a.1 Inorganic N-fertilizers 4.35 13.9% 52.8%
1.A.3.b.7 R.T., Automobile road abrasion 3.25 10.4% 63.2%
1.A.2.g.8 Other Stationary Combustion in Manufacturing Industries and Construction 1.51 4.8% 68.0%
1.A.1.a Public Electricity and Heat Production 1.06 3.4% 71.4%
1.A.2.g.7 Mobile Combustion in Manufacturing Industries and Construction 1.05 3.4% 74.7%
1.A.4.c.2 Agriculture/Forestry/Fishing: Off-road Vehicles and Other Machinery 0.92 2.9% 77.7%
1.A.3.b.1 R.T., Passenger cars 0.77 2.5% 80.2%
National Total 31.32 Trend Assessment NFR Code
NFR Category ‘Base Year‘ (1990) Estimate [kt] Ex,0
Latest Year (2015) Estimate [kt] Ex,t
Trend Assess-ment Lx,t
Contribution to the trend
Cumulative Total of Lx,t
2.C.1 Iron and Steel Production 4.56 0.52 0.124 18.5% 18.5%
2.A.5 Mining, construction/demolition and handling of products 4.73 5.98 0.095 14.1% 32.7%
1.A.3.b.7 R.T., Automobile road abrasion 1.95 3.25 0.071 10.6% 43.3%
1.A.2.g.8 Other Stationary Combustion in Manufacturing Industries and Construction 0.33 1.51 0.052 7.7% 51.0%
1.A.4.b.1 Residential: stationary 9.34 6.21 0.043 6.4% 57.4%
1.A.3.b.3 R.T., Heavy duty vehicles 1.93 0.58 0.038 5.6% 63.0%
1.A.4.c.2 Agriculture/Forestry/Fishing: Off-road Vehicles and Other Machinery 2.24 0.92 0.034 5.0% 68.0%
3.D.a.1 Inorganic N-fertilizers 4.56 4.35 0.033 4.9% 72.9%
1.A.3.b.1 R.T., Passenger cars 1.72 0.77 0.023 3.4% 76.4%
1.A.2.g.7 Mobile Combustion in Manufacturing Industries and Construction 0.69 1.05 0.021 3.1% 79.5%
1.A.2.d Pulp, Paper and Print 0.95 0.25 0.020 3.0% 82.5% National Total 40.29 31.32
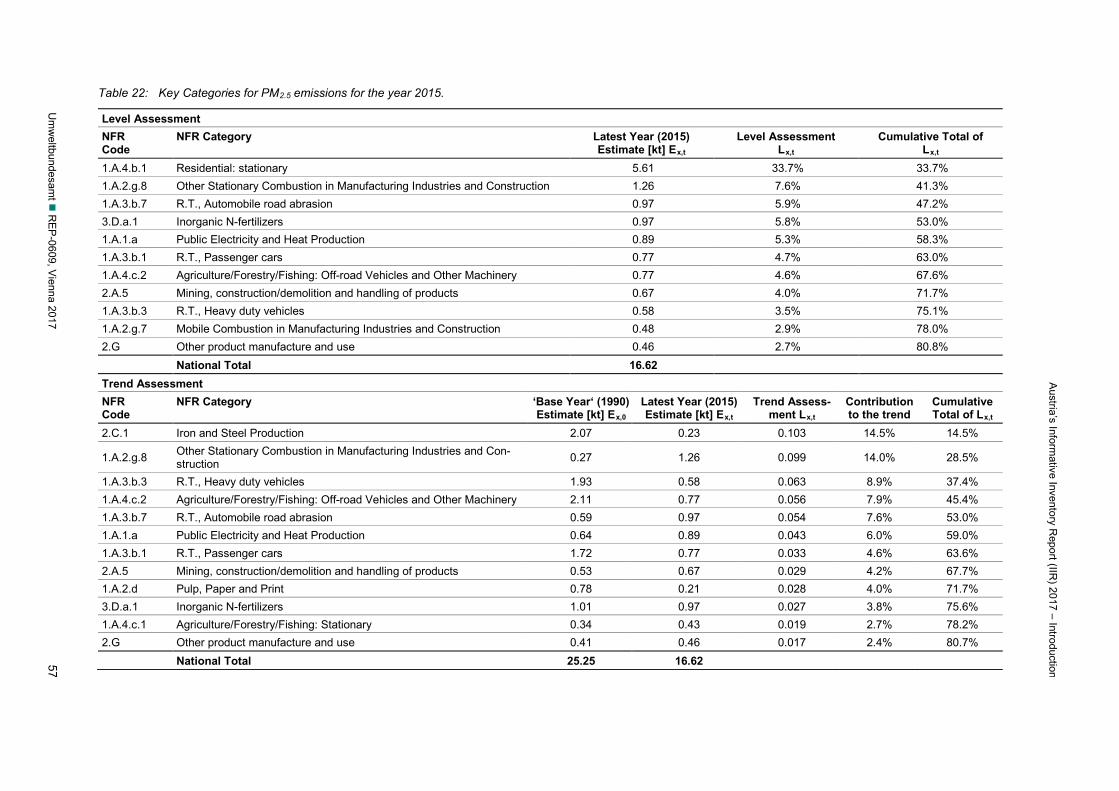
Austria’s Inform
ative Inventory Report (IIR
) 2017 – Introduction
Um
weltbundesam
t R
EP-0609, V
ienna 2017 57
Table 22: Key Categories for PM2.5 emissions for the year 2015.
Level Assessment NFR Code
NFR Category Latest Year (2015) Estimate [kt] Ex,t
Level Assessment Lx,t
Cumulative Total of Lx,t
1.A.4.b.1 Residential: stationary 5.61 33.7% 33.7% 1.A.2.g.8 Other Stationary Combustion in Manufacturing Industries and Construction 1.26 7.6% 41.3% 1.A.3.b.7 R.T., Automobile road abrasion 0.97 5.9% 47.2% 3.D.a.1 Inorganic N-fertilizers 0.97 5.8% 53.0% 1.A.1.a Public Electricity and Heat Production 0.89 5.3% 58.3% 1.A.3.b.1 R.T., Passenger cars 0.77 4.7% 63.0% 1.A.4.c.2 Agriculture/Forestry/Fishing: Off-road Vehicles and Other Machinery 0.77 4.6% 67.6% 2.A.5 Mining, construction/demolition and handling of products 0.67 4.0% 71.7% 1.A.3.b.3 R.T., Heavy duty vehicles 0.58 3.5% 75.1% 1.A.2.g.7 Mobile Combustion in Manufacturing Industries and Construction 0.48 2.9% 78.0% 2.G Other product manufacture and use 0.46 2.7% 80.8% National Total 16.62 Trend Assessment NFR Code
NFR Category ‘Base Year‘ (1990) Estimate [kt] Ex,0
Latest Year (2015) Estimate [kt] Ex,t
Trend Assess-ment Lx,t
Contribution to the trend
Cumulative Total of Lx,t
2.C.1 Iron and Steel Production 2.07 0.23 0.103 14.5% 14.5%
1.A.2.g.8 Other Stationary Combustion in Manufacturing Industries and Con-struction 0.27 1.26 0.099 14.0% 28.5%
1.A.3.b.3 R.T., Heavy duty vehicles 1.93 0.58 0.063 8.9% 37.4% 1.A.4.c.2 Agriculture/Forestry/Fishing: Off-road Vehicles and Other Machinery 2.11 0.77 0.056 7.9% 45.4% 1.A.3.b.7 R.T., Automobile road abrasion 0.59 0.97 0.054 7.6% 53.0% 1.A.1.a Public Electricity and Heat Production 0.64 0.89 0.043 6.0% 59.0% 1.A.3.b.1 R.T., Passenger cars 1.72 0.77 0.033 4.6% 63.6% 2.A.5 Mining, construction/demolition and handling of products 0.53 0.67 0.029 4.2% 67.7% 1.A.2.d Pulp, Paper and Print 0.78 0.21 0.028 4.0% 71.7% 3.D.a.1 Inorganic N-fertilizers 1.01 0.97 0.027 3.8% 75.6% 1.A.4.c.1 Agriculture/Forestry/Fishing: Stationary 0.34 0.43 0.019 2.7% 78.2% 2.G Other product manufacture and use 0.41 0.46 0.017 2.4% 80.7% National Total 25.25 16.62
Austria’s Informative Inventory Report (IIR) 2017 – Introduction
58 Umweltbundesamt REP-0609, Vienna 2017
1.6 Quality Assurance, Quality Control and verification
For fulfillment of the reporting obligations the department Climate Change Mitigation & Emission Inventories at the Umweltbundesamt, in particular the Inspection Body for Emission Inventories, operates a QMS based on the International Standard EN ISO/IEC 17020 General Criteria for the operation of various types of bodies performing inspections. Since 23 December 2005, the IBE is accredited64 as a Type A inspection body (Id.No. 241), in accordance with EN ISO/IEC 17020 and the Austrian Accreditation Law (AkkG)65, by decree of Accreditation Austria/Federal Ministry of Economics, Family and Youth (No. BMWA-92.715/0036-I/12/2005, issued on 19 January 2006.
In addition to the elements of a QMS as described in the ISO 9000 series, the EN ISO/IEC 17020 focusses on the competence of the personnel, and ensures strict independence, impartiality and integrity. The implementation is audited by the Austrian Accreditation Body regularly every 15 months; every five years the accreditation has to be renewed in a more comprehensive au-dit. The accreditation of the IBE has been awarded for the first time in 2005 and has been re-newed in 2011 and 2016 so far. In 2017 the IBE again has undergone and successfully passed an external audit by a quality expert appointed by Accreditation Austria.
Major element of the QMS is the Quality Manual of the IBE and its quality and technical proce-dures (“Austrian QA/QC Plan”).
1.6.1 Requirements of the ISO compared to the IPCC 2006 GL as well as the EMEP/EEA air pollutant emission inventory guidebook 2016
The implementation of QA/QC procedures as required by the IPCC 2006 GL and the EMEP/EEA air pollutant emission inventory guidebook 2016 support the development of national air emis-sions inventories that can be readily assessed in terms of quality and completeness. The QMS as implemented in the Austrian inventory includes all elements of the QA/QC system outlined in the 2006 IPCC GL Chapter 6 „Quality Assurance and Quality Control” and the EMEP/EEA air pollutant emission inventory guidebook 2016 Chapter 6 “Inventory management, improvement and QA/QC“ (see Table below), and goes beyond. It also comprises supporting and management processes in addition to the QA/QC procedures in inventory compilation and thus ensures agreed standards not only within (i) the inventory compilation process and (ii) supporting pro-cesses (e.g. archiving), but also for (iii) management processes (e.g. annual management re-views, internal audits, regular training of personnel, definition of procedures for external com-munication).
64 For more information on the accreditation please refer to Annex 6. 65 Federal Law Gazette I No 28/2012 (Akkreditierungsgesetz 2012)
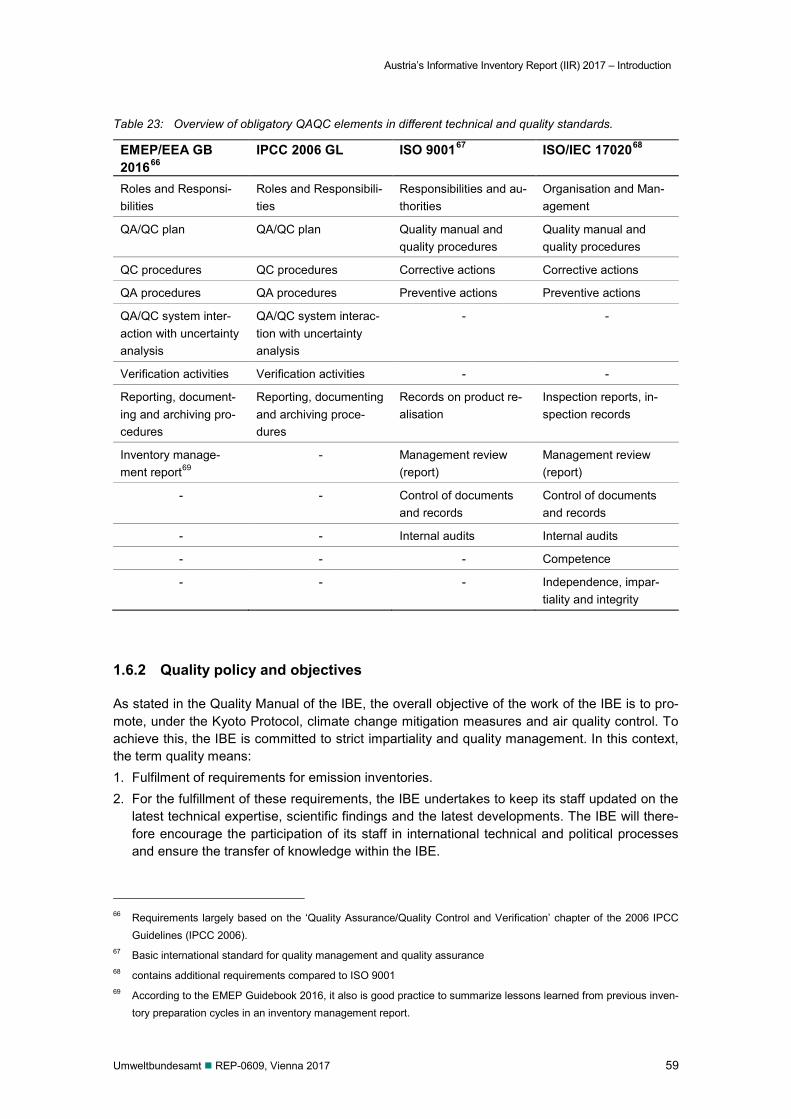
Austria’s Informative Inventory Report (IIR) 2017 – Introduction
Umweltbundesamt REP-0609, Vienna 2017 59
Table 23: Overview of obligatory QAQC elements in different technical and quality standards.
EMEP/EEA GB 201666
IPCC 2006 GL ISO 900167 ISO/IEC 1702068
Roles and Responsi-bilities
Roles and Responsibili-ties
Responsibilities and au-thorities
Organisation and Man-agement
QA/QC plan QA/QC plan Quality manual and quality procedures
Quality manual and quality procedures
QC procedures QC procedures Corrective actions Corrective actions
QA procedures QA procedures Preventive actions Preventive actions
QA/QC system inter-action with uncertainty analysis
QA/QC system interac-tion with uncertainty analysis
- -
Verification activities Verification activities - -
Reporting, document-ing and archiving pro-cedures
Reporting, documenting and archiving proce-dures
Records on product re-alisation
Inspection reports, in-spection records
Inventory manage-ment report69
- Management review (report)
Management review (report)
- - Control of documents and records
Control of documents and records
- - Internal audits Internal audits
- - - Competence
- - - Independence, impar-tiality and integrity
1.6.2 Quality policy and objectives
As stated in the Quality Manual of the IBE, the overall objective of the work of the IBE is to pro-mote, under the Kyoto Protocol, climate change mitigation measures and air quality control. To achieve this, the IBE is committed to strict impartiality and quality management. In this context, the term quality means: 1. Fulfilment of requirements for emission inventories. 2. For the fulfillment of these requirements, the IBE undertakes to keep its staff updated on the
latest technical expertise, scientific findings and the latest developments. The IBE will there-fore encourage the participation of its staff in international technical and political processes and ensure the transfer of knowledge within the IBE.
66 Requirements largely based on the ‘Quality Assurance/Quality Control and Verification’ chapter of the 2006 IPCC
Guidelines (IPCC 2006). 67 Basic international standard for quality management and quality assurance 68 contains additional requirements compared to ISO 9001 69 According to the EMEP Guidebook 2016, it also is good practice to summarize lessons learned from previous inven-
tory preparation cycles in an inventory management report.
Austria’s Informative Inventory Report (IIR) 2017 – Introduction
60 Umweltbundesamt REP-0609, Vienna 2017
3. Compliance with the EN ISO/IEC 17020 standard by ensuring the implementation and con-tinuous improvement of a QMS as described in this manual by the IBE and its personnel. The QMS procedures are designed to facilitate the preparation of the emission inventories in a professional and timly manner, particularly to enhance the transparency to allow full repro-duction, and the correctness via quality checks and validation activities. One of the key man-agerial functions is raising the personnel’s quality awareness.
Aim of the IBE is to provide a very good example by setting a high quality standard – even higher than specified in the requirements – so as to improve the quality of air emission reporting in the long term, and to encourage other countries to set up similar systems.
The quality objectives for emission inventories are above all to fulfil all relevant requirements in terms of content and format: ‘TACCC’: transparency, accuracy, completeness, comparability, consistency (as defined in the IPCC 2006 GL), and timeliness.
The QMS was primarily developed to meet the requirement of reporting greenhouse gas emis-sions under the Kyoto Protocol. For this reason the emphasis was originally placed on green-house gases, but by now all main air pollutants are covered by the QMS.
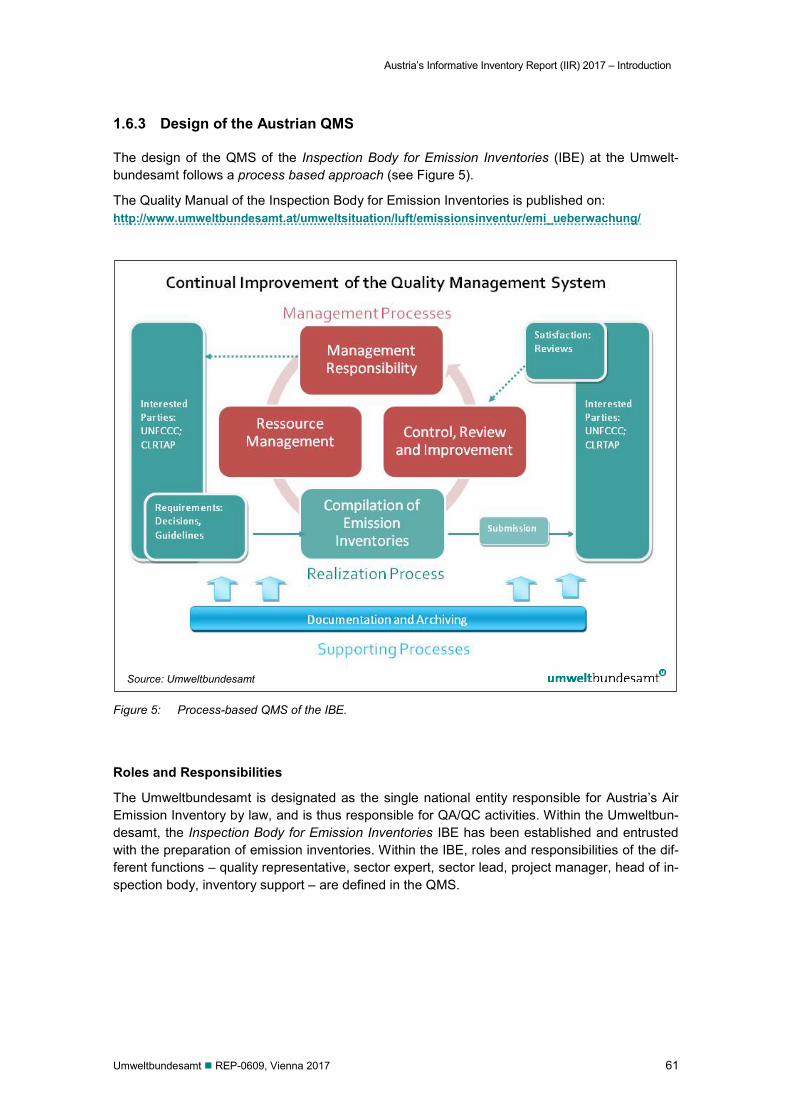
Austria’s Informative Inventory Report (IIR) 2017 – Introduction
Umweltbundesamt REP-0609, Vienna 2017 61
1.6.3 Design of the Austrian QMS
The design of the QMS of the Inspection Body for Emission Inventories (IBE) at the Umwelt-bundesamt follows a process based approach (see Figure 5).
The Quality Manual of the Inspection Body for Emission Inventories is published on: http://www.umweltbundesamt.at/umweltsituation/luft/emissionsinventur/emi_ueberwachung/
Figure 5: Process-based QMS of the IBE.
Roles and Responsibilities
The Umweltbundesamt is designated as the single national entity responsible for Austria’s Air Emission Inventory by law, and is thus responsible for QA/QC activities. Within the Umweltbun-desamt, the Inspection Body for Emission Inventories IBE has been established and entrusted with the preparation of emission inventories. Within the IBE, roles and responsibilities of the dif-ferent functions – quality representative, sector expert, sector lead, project manager, head of in-spection body, inventory support – are defined in the QMS.
Source: Umweltbundesamt
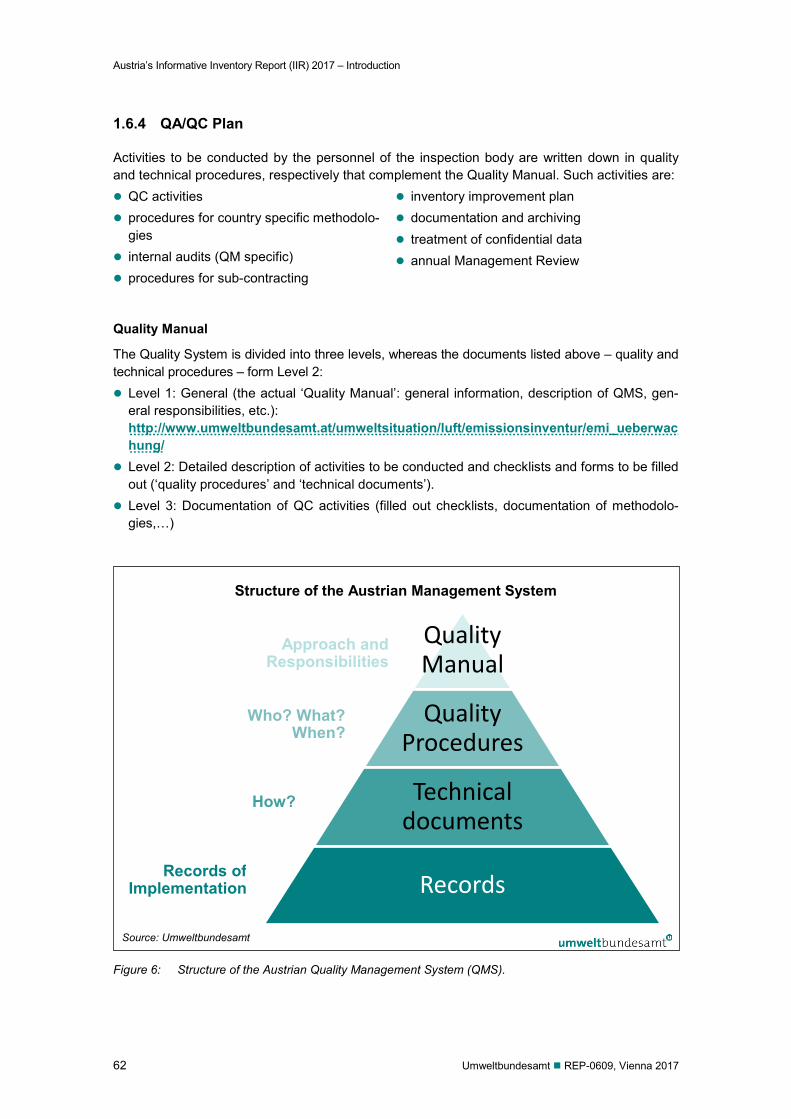
Austria’s Informative Inventory Report (IIR) 2017 – Introduction
62 Umweltbundesamt REP-0609, Vienna 2017
1.6.4 QA/QC Plan
Activities to be conducted by the personnel of the inspection body are written down in quality and technical procedures, respectively that complement the Quality Manual. Such activities are: QC activities procedures for country specific methodolo-
gies internal audits (QM specific) procedures for sub-contracting
inventory improvement plan documentation and archiving treatment of confidential data annual Management Review
Quality Manual
The Quality System is divided into three levels, whereas the documents listed above – quality and technical procedures – form Level 2: Level 1: General (the actual ‘Quality Manual’: general information, description of QMS, gen-
eral responsibilities, etc.): http://www.umweltbundesamt.at/umweltsituation/luft/emissionsinventur/emi_ueberwachung/
Level 2: Detailed description of activities to be conducted and checklists and forms to be filled out (‘quality procedures’ and ‘technical documents’).
Level 3: Documentation of QC activities (filled out checklists, documentation of methodolo-gies,…)
Structure of the Austrian Management System
Figure 6: Structure of the Austrian Quality Management System (QMS).
Quality Manual
Quality Procedures
Technical documents
Records
Source: Umweltbundesamt
Approach and Responsibilities
Who? What? When?
How?
Records of Implementation
Austria’s Informative Inventory Report (IIR) 2017 – Introduction
Umweltbundesamt REP-0609, Vienna 2017 63
1.6.5 QC Activities
The following four quality-check-steps are performed before finalization of the data submission: 1. Tier 2/category specific: by the sector expert in the course of the inventory preparation 2. Tier 1/general Step 1: QC by the sector expert after emissions have been estimated 3. Tier 1/general Step 2: QC by the data manager in the course of the preparation of the overall
inventory (electronic checks e.g. check for completeness and comparison with last years’ in-ventory)
4. Tier 1/general Step 3: QC of final submission by the sector expert Where possible the above checks are conducted by the sector expert that has not predominant-ly prepared the sectoral inventory in the particular year.
QC activities are conducted following QC checklists, covering issues like: documentation of assumptions documentation of expert judgements clear explanation of recalculations including of references plausibility of data consistency of data
completeness correct transformation/transcription into CFR
information on background tables consistency of data and information with in-
formation in inspection reports treatment of confidential data
Additionally, in the course of preparation of the IIR, the following four QC steps are performed: 5. Tier 2/category specific Step 1: check of methodologies, assumptions and explanations by
sector expert in the course of report preparation 6. Tier 2/category specific Step 2: check of methodologies, assumptions and explanations by
the head of inspection body 7. Tier 1/ general Step 1: final report check by sector experts 8. Tier 1/ general Step 2: final check of consistency of figures in reporting format and report by
a member of the IBE team
1.6.6 QA Activities
The following QA activities are performed:
Validation of methodologies and calculation
Before methodologies are applied the methodology is defined as a SOP (standard operating procedure) together with a template for calculating emissions, where needed. The SOP is checked for applicability and completeness of information needed and finally approved by the head of the inspection body. New and changed calculation files are validated before use.
Annual second party audits for every sector
Once a year the documentation of one emission source per sector is checked throughout the whole emission estimation and reporting process (from archiving of underlying information, emission calculation, input into the data management system, documentation, information in the
Austria’s Informative Inventory Report (IIR) 2017 – Introduction
64 Umweltbundesamt REP-0609, Vienna 2017
IIR etc.) for transparency, reproducibility, clearness and completeness. This tool proved to be very helpful in order to further improve the documentation and the implementation of (new) QA/QC routines.
Second party audits for work performed by sub-contractors The sector experts at the Umweltbundesamt are responsible for incorporation of results in the inventory database and additional QA/QC (works as second party audit).
Accreditation audits (third party audits) In the course of the accreditation process, conformity of the QMS with ISO/IEC 17020 is regula-ry monitored: audits are performed every 15 months by the accreditation body (one day audit), and every fifth year the accreditation has to be renewed (two day audit). The audits aim to as-sess the QM system with regard to compliance with the underlying standard ISO/IEC 17020, to check its implementation in practice and to assure that measures and recommendations as set out in previous audits have been implemented accordingly. In 2005: accreditation according to EN ISO/IEC 17020 as Inspection Body for Emission In-
ventories. Periodic external audits by “Accreditation Austria” in 2006, 2008 and 2009 In 2011: first re-accreditation according to EN ISO/IEC 17020 Periodic external audits by “Accreditation Austria” in 2012, 2013 and 2014 In 2015: second re-accreditation according to EN ISO/IEC 17020 Periodic external audit by “Accreditation Austria “ in 2017
Audits of data suppliers Suppliers of annual activity data, that do not have in place a (certified) QMS or whose data are not independently verified, are audited in a so called ‘input data audit’. The aim of the audits is to assess: (1) whether the requirements regarding independence and integrity are fulfilled (2) the long term availability of the data (3) the data collection and management process (4) whether the QC requirements of the data processing are fulfilled
When indicated, recommendations for improvements are made and implementation of these measures is assessed. These input data audits have proven a good basis for the cooperation with the data supplier.
Since 2007 all main data suppliers have been audited: Statistik Austria regarding energy balance in 2007 agricultural statistical data in 2009 import/export and production statistics in 2016
the administrator of the landfill database in 2009 the administrator of the electronic data management for landfills (EDM) in 2014 the Institute for Industrial Ecology in 2016 the national forest inventory at the Austrian Federal Office and Research Centre for Forests
(BFW) in 2016
It is planned to conduct a follow-up audit at these institutions only when substancial changes become apparent.
Austria’s Informative Inventory Report (IIR) 2017 – Introduction
Umweltbundesamt REP-0609, Vienna 2017 65
1.6.7 Error correction and continuous improvement
All issues regarding transparency, accuracy, completeness, consistency or comparability identi-fied by experts from different backgrounds are incorporated in the inventory improvement plan. Sources of these findings are: UNECE/LRTAP Review: The last In-depth review (stage 3) took place in 2010; the findings
are summarized in Chapter 7.4, Table 280. The stage 1 review (initial check of submissions for timeliness, completeness and formats) and stage 2 review (check of consistency, compa-rability, KCA, trends and IEFs) are carried out annually.
NEC Review: From 2017 onwards the national emission inventory data will be also checked by the European Commission as set out in Article 10 of Directive 2016/2284 (NEC Directive).
external experts (e.g. experts from federal provinces: some of them who prepare a partly in-dependent emission inventory for their federal province compare their results with the dis-aggregated national inventory),
stakeholders (e.g. industrial facilities or association of industries: the NIR is communicated to every data supplier and Austrian experts involved in emission inventorying after submission),
personnel of the inspection body (head of inspection body, sector experts etc.). These findings are documented including a plan to improve the inventory, a timeline and re-sponsibilities. The improvement plan and fulfilment of planned improvements is monitored by the head of inspection body. Improvements that are relevant in terms of resources are present-ed in the annual Management Review to the managing director, and if additional resources are needed are notified to the Federal Ministry of Agriculture, Forestry, Environment and Water Management.
1.6.8 Archiving and documentation
For each sector the documentation includes: Documentation of the methodology: description (source/sink category, emissions, key source, completeness, uncertainty), methodology, template for emission estimation, documentation of validation. Documentation of actual emission calculation: methodology, „logbook” (who did what and when), calculation file, references for activity data, emission factors and/or emissions, respectively, documentation of assumptions, sources of data and information, expert judgments etc. to al-
low full reproduction and understanding of choices, recalculations, planned improvements, QC activities.
Austria’s Informative Inventory Report (IIR) 2017 – Introduction
66 Umweltbundesamt REP-0609, Vienna 2017
Documentation of expert judgements in line with the IPCC 2006 GL and the EMEP/EEA GB 2016: name of the expert and institution/department, date, basis of judgement (references to relevant studies etc.), underlying assumptions.
Relevant literature has to be archived and references to be stated in the internal documentation as well as in the IIR. 1.6.9 Treatment of confidentiality issues
The IBE ensures confidential treatment of sensitive information obtained in the course of its in-spection activities. Information or data is declared as confidential when it could directly or indi-rectly identify an individual person, business or organisation. For this reason some emissions are reported at a higher, aggregated level so that confidentiality is no longer an issue, e.g. for f-gases. Compliance with confidentiality provisions is organized and documented in the QM man-ual, which contains specific quality system procedures. Staff of the inspection body is obliged to issue a written commitment stating their full compliance with all provisions. Confidentiality of statistics
The strict confidentiality provisions concerning handling of sensitive data relating to individu-als and organisations are regulated by the Austrian Federal Statistics Act 200070.
Security of data Confidentiality of sensitive data used to calculate the emissions is a legal obligation: Ensuring confidentiality through technical and organisational measures (e.g. final QC whether confi-dential information is not visible in the CRF tables) is obligatory for the Umweltbundesamt and consequently also for the Inspection Body.
Trust of respondents Individuals, associations and organizations providing information to the Inspection Body can be sure that the provided data are used exclusively for purposes of inspection activities. Data – either of official, private or of another nature – are treated confidentially and will not be passed on to third parties.
Also in case of voluntary reviews an absolute confidential treatment of data exchanged is en-sured by strictly adhering to the rules of the QM System of the Inspection Body.
70 Federal Act on Federal Statistics (Federal Statistics Act 2000) no. 163/1999, as amended by BGBL. I, no. 136/2001,
by BGBl. I, no. 71/2003, by BGBl. I, no. 92/2007 and by BGBl. I, no. 125/2009.
Austria’s Informative Inventory Report (IIR) 2017 – Introduction
Umweltbundesamt REP-0609, Vienna 2017 67
1.6.10 QMS activities and improvements 2016
Several changes of the Quality Manual and its quality and technical procedures were made in 2016, e.g. regarding treatment of confidential data, access (rights) to the internal OLI folders, judgement of reliability of input data (emission factors), risk analysis, scope of internal audits or planned participation of sector experts in the international review process. Moreover, the IBE-team was slightly re-arranged, overall increasing the number of experts involved in inventory work. To strengthen the technical competence of the IBE 11 IBE sector experts participated in the basic training course for reviewers, established by the UNFCCC secretariat and passed the exam in December 2016. Moreover, the following QA/QC activities were done in 2016: An input data audit was conducted at the Austrian Federal Research and Training Centre for
Forests, Natural Hazards and Landscape (BFW) to gain background information on quality and procedural arrangements of the main data supplier of LULUCF data
An input data audit was performed by IBE experts on national production statistics and im-port/export statistics – sources for solvent emissions – to get insight into the process of data collection and compilation.
An emergency exercise on data management, i.e. compilation of emission data tables and preparing the submission, was successfully conducted by the deputy of the data manager of the IBE, with the aim of training the expert and testing the quality of the internal documenta-tion on this issue. It is planned to conduct such a dummy inventory compilation as a training every two years to keep the deputy up-to-date and fit for a submission in case of an un-planned absence of the data manager.
The cooperation (mutual review) with New Zealand (started 2014) was continued in 2016, with focus on QA/QC processes and tools, experiences with the review 2016 and basic ex-change on benefits of ISO standards and preparation/certification process.
Two further experts join the IBE as “inventory support” for the sector LULUCF.
Moreover, in 2017 a periodic review took place, conducted as a one-day QM audit by a compe-tent external auditors appointed by Accreditation Austria. Improvement measures set during the Re-Accreditation 2015 were checked and further questions on the Quality Management System of the IBE and its implementation in practice raised. The audit proved continuous improvement of the system and compliance with the underlying standard ISO/IEC 17020.
Austria’s Informative Inventory Report (IIR) 2017 – Introduction
68 Umweltbundesamt REP-0609, Vienna 2017
1.7 Uncertainty Assessment
In submission 2017 a qualitative uncertainty assessment and additionally a quantitative uncer-tainty analysis for the main pollutants (SO2, NOx, NMVOC, NH3 and PM2.5) has been carried out. Information on methodology and data sources used is provided in the following sections.
1.7.1 Method used
The method used for the assessment of uncertainty is described in the “EMEP/EEA air pollutant emission inventory guidebook 2016” (EEA 2016)”.
In the Austrian uncertainty analysis the Tier 1 method was applied for the following pollutants: SO2, NOx, NMVOC, NH3 and PM2.5. By using the error propagation method, the uncertainties for a specific source category can be estimated and by combining these uncertainties an overall uncertainty can be calculated. For the remaining other pollutants a qualitative indication of the uncertainty is presented.
The Tier 2 method (Monte Carlo Simulation) was not included in this assessment as the less comprehensive Tier 1 method already gives a clear reference point of the general uncertainty per pollutant.
1.7.2 Data source
In order to estimate the overall uncertainty, the uncertainty of activity data and emission factor, respectively, has to be quantified. The uncertainties of activity data on sectoral level are based on the GHG uncertainty analysis (for more information see UMWELTBUNDESAMT 2017a).
Uncertainties of emission factors of the relevant pollutants are based on the qualitative ratings published in the Austrian IIR 2016 (UMWELTBUNDESAMT 2016b) following the EMEP/EEA air pol-lutant emission inventory guidebook 2016 2016 (EEA 2016). Therefore the arithmetic mean val-ue of the proposed upper and lower emission factor uncertainty was calculated and used for the calculation of the overall combined uncertainty.
The quality of estimates for all relevant pollutants has been rated using qualitative indicators as suggested in Chapter 5 of the EMEP/EEA air pollutant emission inventory guidebook 2016 2016 (EEA 2016). The definition of the ratings is given in Table 24, the ratings for the emission esti-mates are presented in Table 25.
Table 24: Rating definitions.
Rating Definition Typical Error Range A An estimate based on a large number of measurements made at a
large number of facilities that fully represent the sector 10 to 30%
B An estimate based on a large number of measurements made at a large number of facilities that represent a large part of the sector
20 to 60%
C An estimate based on a number of measurements made at a small number of representative facilities, or an engineering judgement based on a number of relevant facts
50 to 200%
D An estimate based on single measurements, or an engineering calculation derived from a number of relevant facts
100 to 300%
E An estimate based on an engineering calculation derived from assumptions only
order of magnitude
Source: Table 3-2 Rating definitions, Chapter 5 of the EMEP/EEA emission inventory guidebook 2016.
Austria’s Informative Inventory Report (IIR) 2017 – Introduction
Umweltbundesamt REP-0609, Vienna 2017 69
1.7.3 Results of uncertainty estimation
1.7.3.1 Qualitative assessment for all pollutants
A qualitative assessment was performed on sectoral level for all pollutants. The relevant sectors of each pollutant were classified in different quality groups from A to E (see Table 25) following the EMEP/EEA air pollutant emission inventory guidebook 2016 (EEA 2016). Table 24 presents a definition and default error ranges for each quality group.
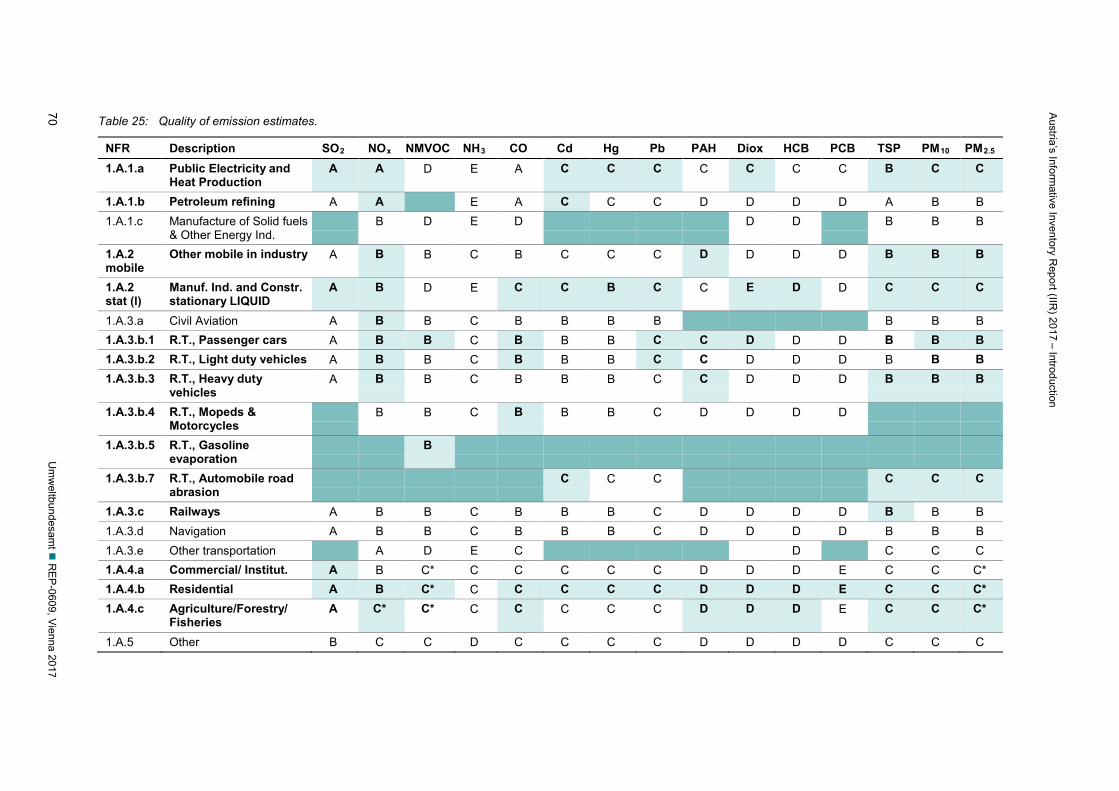
Austria’s Inform
ative Inventory Report (IIR
) 2017 – Introduction
70 U
mw
eltbundesamt
REP
-0609, Vienna 2017
Table 25: Quality of emission estimates.
NFR Description SO2 NOx NMVOC NH3 CO Cd Hg Pb PAH Diox HCB PCB TSP PM10 PM2.5 1.A.1.a Public Electricity and
Heat Production A A D E A C C C C C C C B C C
1.A.1.b Petroleum refining A A E A C C C D D D D A B B 1.A.1.c Manufacture of Solid fuels
& Other Energy Ind. B D E D D D B B B
1.A.2 mobile
Other mobile in industry A B B C B C C C D D D D B B B
1.A.2 stat (l)
Manuf. Ind. and Constr. stationary LIQUID
A B D E C C B C C E D D C C C
1.A.3.a Civil Aviation A B B C B B B B B B B 1.A.3.b.1 R.T., Passenger cars A B B C B B B C C D D D B B B 1.A.3.b.2 R.T., Light duty vehicles A B B C B B B C C D D D B B B 1.A.3.b.3 R.T., Heavy duty
vehicles A B B C B B B C C D D D B B B
1.A.3.b.4 R.T., Mopeds & Motorcycles
B B C B B B C D D D D
1.A.3.b.5 R.T., Gasoline evaporation
B
1.A.3.b.7 R.T., Automobile road abrasion
C C C C C C
1.A.3.c Railways A B B C B B B C D D D D B B B 1.A.3.d Navigation A B B C B B B C D D D D B B B 1.A.3.e Other transportation A D E C D C C C 1.A.4.a Commercial/ Institut. A B C* C C C C C D D D E C C C* 1.A.4.b Residential A B C* C C C C C D D D E C C C* 1.A.4.c Agriculture/Forestry/
Fisheries A C* C* C C C C C D D D E C C C*
1.A.5 Other B C C D C C C C D D D D C C C
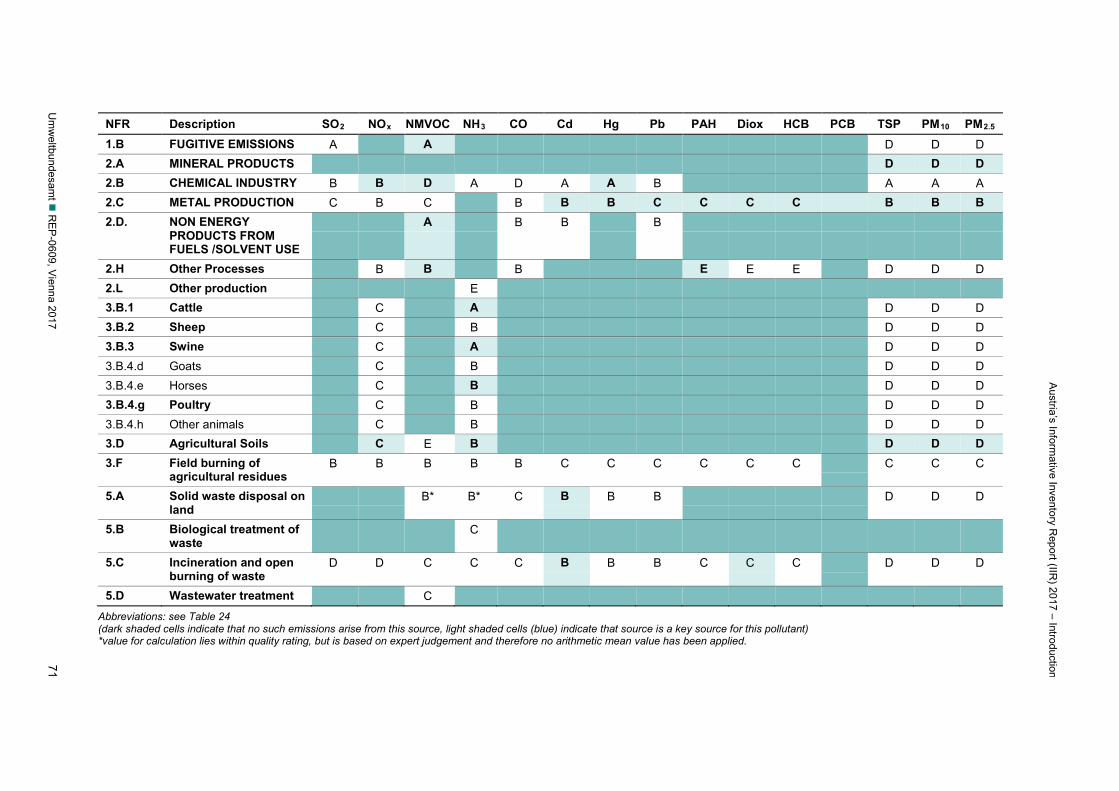
Austria’s Inform
ative Inventory Report (IIR
) 2017 – Introduction
Um
weltbundesam
t R
EP-0609, V
ienna 2017 71
NFR Description SO2 NOx NMVOC NH3 CO Cd Hg Pb PAH Diox HCB PCB TSP PM10 PM2.5 1.B FUGITIVE EMISSIONS A A D D D 2.A MINERAL PRODUCTS D D D 2.B CHEMICAL INDUSTRY B B D A D A A B A A A 2.C METAL PRODUCTION C B C B B B C C C C B B B 2.D. NON ENERGY
PRODUCTS FROM FUELS /SOLVENT USE
A B B B
2.H Other Processes B B B E E E D D D 2.L Other production E 3.B.1 Cattle C A D D D 3.B.2 Sheep C B D D D 3.B.3 Swine C A D D D 3.B.4.d Goats C B D D D 3.B.4.e Horses C B D D D 3.B.4.g Poultry C B D D D 3.B.4.h Other animals C B D D D 3.D Agricultural Soils C E B D D D 3.F Field burning of
agricultural residues B B B B B C C C C C C C C C
5.A Solid waste disposal on land
B* B* C B B B D D D
5.B Biological treatment of waste
C
5.C Incineration and open burning of waste
D D C C C B B B C C C D D D
5.D Wastewater treatment C
Abbreviations: see Table 24 (dark shaded cells indicate that no such emissions arise from this source, light shaded cells (blue) indicate that source is a key source for this pollutant) *value for calculation lies within quality rating, but is based on expert judgement and therefore no arithmetic mean value has been applied.
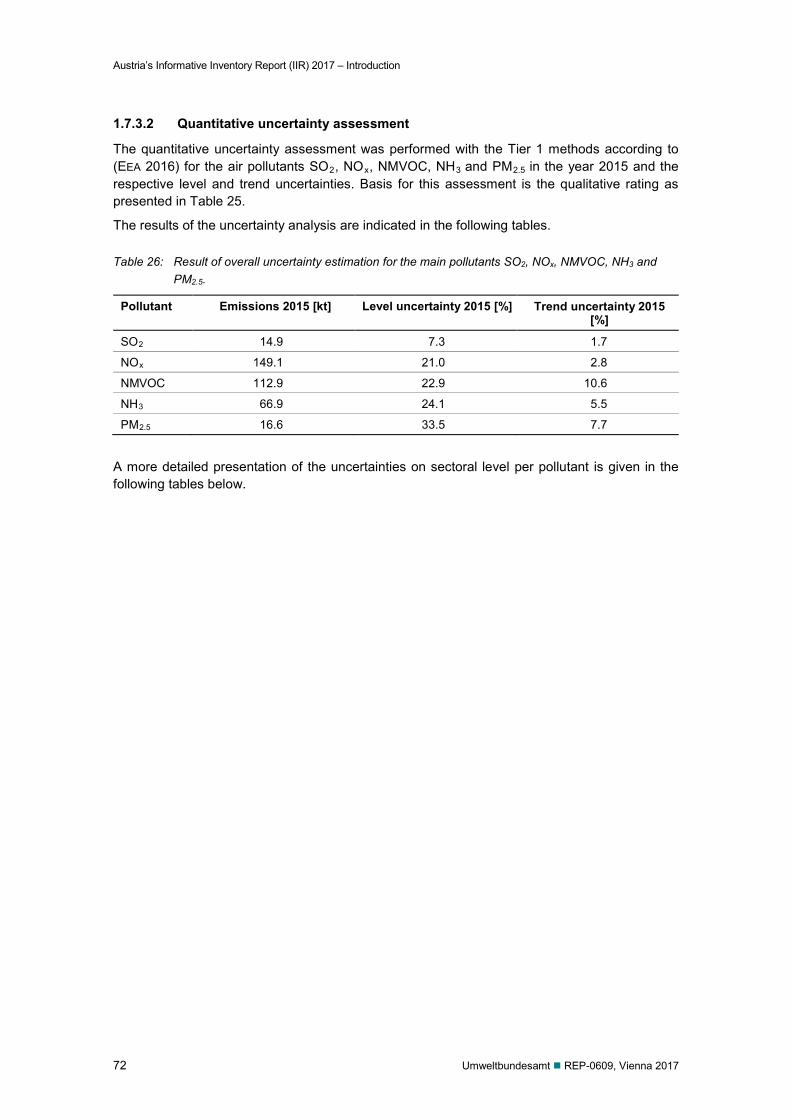
Austria’s Informative Inventory Report (IIR) 2017 – Introduction
72 Umweltbundesamt REP-0609, Vienna 2017
1.7.3.2 Quantitative uncertainty assessment
The quantitative uncertainty assessment was performed with the Tier 1 methods according to (EEA 2016) for the air pollutants SO2, NOx, NMVOC, NH3 and PM2.5 in the year 2015 and the respective level and trend uncertainties. Basis for this assessment is the qualitative rating as presented in Table 25.
The results of the uncertainty analysis are indicated in the following tables.
Table 26: Result of overall uncertainty estimation for the main pollutants SO2, NOx, NMVOC, NH3 and PM2.5.
Pollutant Emissions 2015 [kt] Level uncertainty 2015 [%] Trend uncertainty 2015 [%]
SO2 14.9 7.3 1.7
NOx 149.1 21.0 2.8
NMVOC 112.9 22.9 10.6
NH3 66.9 24.1 5.5
PM2.5 16.6 33.5 7.7
A more detailed presentation of the uncertainties on sectoral level per pollutant is given in the following tables below.
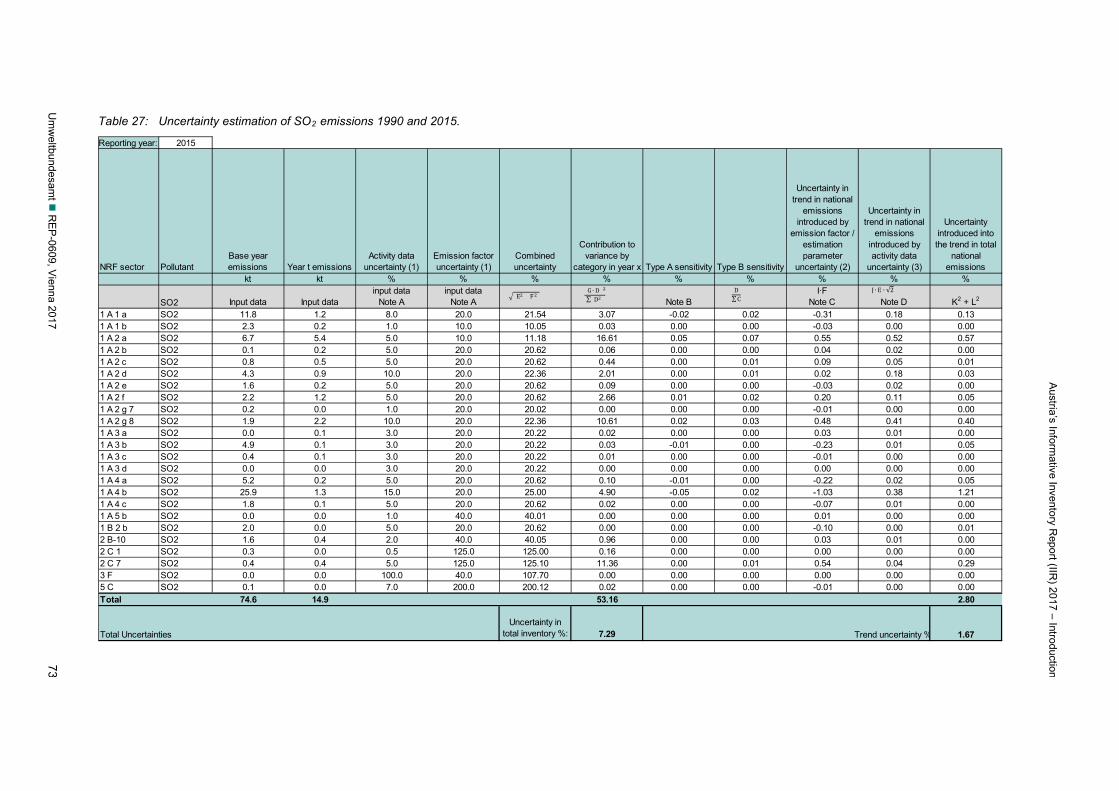
Austria’s Inform
ative Inventory Report (IIR
) 2017 – Introduction
Um
weltbundesam
t R
EP-0609, V
ienna 2017 73
Table 27: Uncertainty estimation of SO2 emissions 1990 and 2015.
Reporting year: 2015
NRF sector PollutantBase year emissions Year t emissions
Activity data uncertainty (1)
Emission factor uncertainty (1)
Combined uncertainty
Contribution to variance by
category in year x Type A sensitivity Type B sensitivity
Uncertainty in trend in national
emissions introduced by
emission factor / estimation parameter
uncertainty (2)
Uncertainty in trend in national
emissions introduced by activity data
uncertainty (3)
Uncertainty introduced into the trend in total
national emissions
kt kt % % % % % % % % %
SO2 Input data Input datainput data
Note Ainput data
Note A Note BI·F
Note C Note D K2 + L2
1 A 1 a SO2 11.8 1.2 8.0 20.0 21.54 3.07 -0.02 0.02 -0.31 0.18 0.131 A 1 b SO2 2.3 0.2 1.0 10.0 10.05 0.03 0.00 0.00 -0.03 0.00 0.001 A 2 a SO2 6.7 5.4 5.0 10.0 11.18 16.61 0.05 0.07 0.55 0.52 0.571 A 2 b SO2 0.1 0.2 5.0 20.0 20.62 0.06 0.00 0.00 0.04 0.02 0.001 A 2 c SO2 0.8 0.5 5.0 20.0 20.62 0.44 0.00 0.01 0.09 0.05 0.011 A 2 d SO2 4.3 0.9 10.0 20.0 22.36 2.01 0.00 0.01 0.02 0.18 0.031 A 2 e SO2 1.6 0.2 5.0 20.0 20.62 0.09 0.00 0.00 -0.03 0.02 0.001 A 2 f SO2 2.2 1.2 5.0 20.0 20.62 2.66 0.01 0.02 0.20 0.11 0.051 A 2 g 7 SO2 0.2 0.0 1.0 20.0 20.02 0.00 0.00 0.00 -0.01 0.00 0.001 A 2 g 8 SO2 1.9 2.2 10.0 20.0 22.36 10.61 0.02 0.03 0.48 0.41 0.401 A 3 a SO2 0.0 0.1 3.0 20.0 20.22 0.02 0.00 0.00 0.03 0.01 0.001 A 3 b SO2 4.9 0.1 3.0 20.0 20.22 0.03 -0.01 0.00 -0.23 0.01 0.051 A 3 c SO2 0.4 0.1 3.0 20.0 20.22 0.01 0.00 0.00 -0.01 0.00 0.001 A 3 d SO2 0.0 0.0 3.0 20.0 20.22 0.00 0.00 0.00 0.00 0.00 0.001 A 4 a SO2 5.2 0.2 5.0 20.0 20.62 0.10 -0.01 0.00 -0.22 0.02 0.051 A 4 b SO2 25.9 1.3 15.0 20.0 25.00 4.90 -0.05 0.02 -1.03 0.38 1.211 A 4 c SO2 1.8 0.1 5.0 20.0 20.62 0.02 0.00 0.00 -0.07 0.01 0.001 A 5 b SO2 0.0 0.0 1.0 40.0 40.01 0.00 0.00 0.00 0.01 0.00 0.001 B 2 b SO2 2.0 0.0 5.0 20.0 20.62 0.00 0.00 0.00 -0.10 0.00 0.012 B-10 SO2 1.6 0.4 2.0 40.0 40.05 0.96 0.00 0.00 0.03 0.01 0.002 C 1 SO2 0.3 0.0 0.5 125.0 125.00 0.16 0.00 0.00 0.00 0.00 0.002 C 7 SO2 0.4 0.4 5.0 125.0 125.10 11.36 0.00 0.01 0.54 0.04 0.293 F SO2 0.0 0.0 100.0 40.0 107.70 0.00 0.00 0.00 0.00 0.00 0.005 C SO2 0.1 0.0 7.0 200.0 200.12 0.02 0.00 0.00 -0.01 0.00 0.00Total 74.6 14.9 53.16 2.80
Total UncertaintiesUncertainty in
total inventory %: 7.29 Trend uncertainty % 1.67
(E2 + F2)(G ∙ D)2∑(D2)
D∑C
J ∙ E ∙ 2
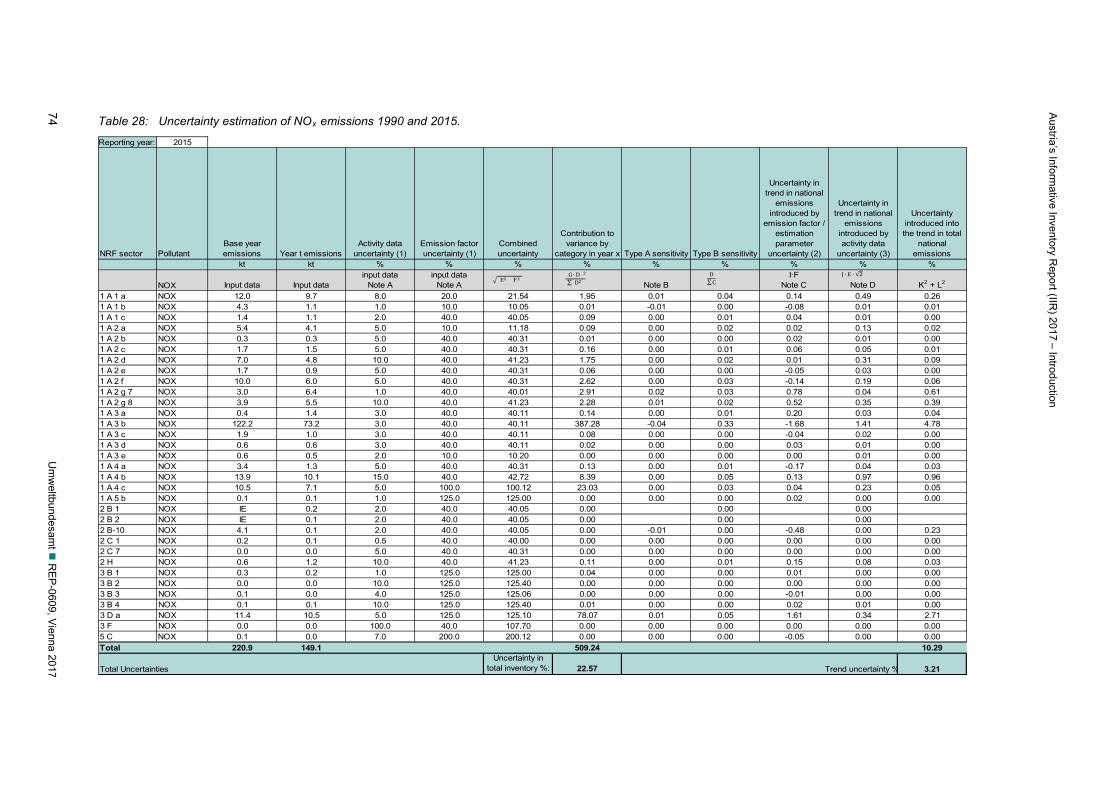
Austria’s Inform
ative Inventory Report (IIR
) 2017 – Introduction
74 U
mw
eltbundesamt
REP
-0609, Vienna 2017
Table 28: Uncertainty estimation of NOx emissions 1990 and 2015.
Reporting year: 2015
NRF sector PollutantBase year emissions Year t emissions
Activity data uncertainty (1)
Emission factor uncertainty (1)
Combined uncertainty
Contribution to variance by
category in year x Type A sensitivity Type B sensitivity
Uncertainty in trend in national
emissions introduced by
emission factor / estimation parameter
uncertainty (2)
Uncertainty in trend in national
emissions introduced by activity data
uncertainty (3)
Uncertainty introduced into the trend in total
national emissions
kt kt % % % % % % % % %
NOX Input data Input datainput data
Note Ainput data
Note A Note BI·F
Note C Note D K2 + L2
1 A 1 a NOX 12.0 9.7 8.0 20.0 21.54 1.95 0.01 0.04 0.14 0.49 0.261 A 1 b NOX 4.3 1.1 1.0 10.0 10.05 0.01 -0.01 0.00 -0.08 0.01 0.011 A 1 c NOX 1.4 1.1 2.0 40.0 40.05 0.09 0.00 0.01 0.04 0.01 0.001 A 2 a NOX 5.4 4.1 5.0 10.0 11.18 0.09 0.00 0.02 0.02 0.13 0.021 A 2 b NOX 0.3 0.3 5.0 40.0 40.31 0.01 0.00 0.00 0.02 0.01 0.001 A 2 c NOX 1.7 1.5 5.0 40.0 40.31 0.16 0.00 0.01 0.06 0.05 0.011 A 2 d NOX 7.0 4.8 10.0 40.0 41.23 1.75 0.00 0.02 0.01 0.31 0.091 A 2 e NOX 1.7 0.9 5.0 40.0 40.31 0.06 0.00 0.00 -0.05 0.03 0.001 A 2 f NOX 10.0 6.0 5.0 40.0 40.31 2.62 0.00 0.03 -0.14 0.19 0.061 A 2 g 7 NOX 3.0 6.4 1.0 40.0 40.01 2.91 0.02 0.03 0.78 0.04 0.611 A 2 g 8 NOX 3.9 5.5 10.0 40.0 41.23 2.28 0.01 0.02 0.52 0.35 0.391 A 3 a NOX 0.4 1.4 3.0 40.0 40.11 0.14 0.00 0.01 0.20 0.03 0.041 A 3 b NOX 122.2 73.2 3.0 40.0 40.11 387.28 -0.04 0.33 -1.68 1.41 4.781 A 3 c NOX 1.9 1.0 3.0 40.0 40.11 0.08 0.00 0.00 -0.04 0.02 0.001 A 3 d NOX 0.6 0.6 3.0 40.0 40.11 0.02 0.00 0.00 0.03 0.01 0.001 A 3 e NOX 0.6 0.5 2.0 10.0 10.20 0.00 0.00 0.00 0.00 0.01 0.001 A 4 a NOX 3.4 1.3 5.0 40.0 40.31 0.13 0.00 0.01 -0.17 0.04 0.031 A 4 b NOX 13.9 10.1 15.0 40.0 42.72 8.39 0.00 0.05 0.13 0.97 0.961 A 4 c NOX 10.5 7.1 5.0 100.0 100.12 23.03 0.00 0.03 0.04 0.23 0.051 A 5 b NOX 0.1 0.1 1.0 125.0 125.00 0.00 0.00 0.00 0.02 0.00 0.002 B 1 NOX IE 0.2 2.0 40.0 40.05 0.00 0.00 0.002 B 2 NOX IE 0.1 2.0 40.0 40.05 0.00 0.00 0.002 B-10 NOX 4.1 0.1 2.0 40.0 40.05 0.00 -0.01 0.00 -0.48 0.00 0.232 C 1 NOX 0.2 0.1 0.5 40.0 40.00 0.00 0.00 0.00 0.00 0.00 0.002 C 7 NOX 0.0 0.0 5.0 40.0 40.31 0.00 0.00 0.00 0.00 0.00 0.002 H NOX 0.6 1.2 10.0 40.0 41.23 0.11 0.00 0.01 0.15 0.08 0.033 B 1 NOX 0.3 0.2 1.0 125.0 125.00 0.04 0.00 0.00 0.01 0.00 0.003 B 2 NOX 0.0 0.0 10.0 125.0 125.40 0.00 0.00 0.00 0.00 0.00 0.003 B 3 NOX 0.1 0.0 4.0 125.0 125.06 0.00 0.00 0.00 -0.01 0.00 0.003 B 4 NOX 0.1 0.1 10.0 125.0 125.40 0.01 0.00 0.00 0.02 0.01 0.003 D a NOX 11.4 10.5 5.0 125.0 125.10 78.07 0.01 0.05 1.61 0.34 2.713 F NOX 0.0 0.0 100.0 40.0 107.70 0.00 0.00 0.00 0.00 0.00 0.005 C NOX 0.1 0.0 7.0 200.0 200.12 0.00 0.00 0.00 -0.05 0.00 0.00Total 220.9 149.1 509.24 10.29
Total UncertaintiesUncertainty in
total inventory %: 22.57 Trend uncertainty % 3.21
(E2 + F2)(G ∙ D)2∑(D2)
D∑C
J ∙ E ∙ 2
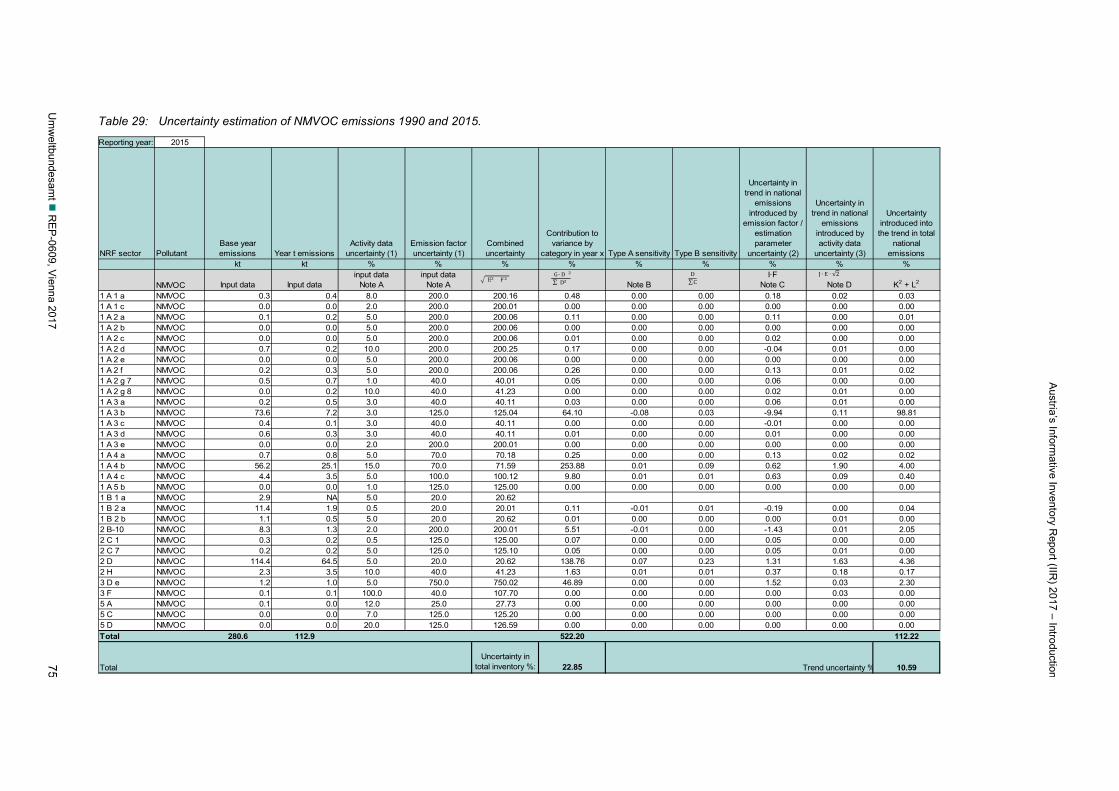
Austria’s Inform
ative Inventory Report (IIR
) 2017 – Introduction
Um
weltbundesam
t R
EP-0609, V
ienna 2017 75
Table 29: Uncertainty estimation of NMVOC emissions 1990 and 2015.
Reporting year: 2015
NRF sector PollutantBase year emissions Year t emissions
Activity data uncertainty (1)
Emission factor uncertainty (1)
Combined uncertainty
Contribution to variance by
category in year x Type A sensitivity Type B sensitivity
Uncertainty in trend in national
emissions introduced by
emission factor / estimation parameter
uncertainty (2)
Uncertainty in trend in national
emissions introduced by activity data
uncertainty (3)
Uncertainty introduced into the trend in total
national emissions
kt kt % % % % % % % % %
NMVOC Input data Input datainput data
Note Ainput data
Note A Note BI·F
Note C Note D K2 + L2
1 A 1 a NMVOC 0.3 0.4 8.0 200.0 200.16 0.48 0.00 0.00 0.18 0.02 0.031 A 1 c NMVOC 0.0 0.0 2.0 200.0 200.01 0.00 0.00 0.00 0.00 0.00 0.001 A 2 a NMVOC 0.1 0.2 5.0 200.0 200.06 0.11 0.00 0.00 0.11 0.00 0.011 A 2 b NMVOC 0.0 0.0 5.0 200.0 200.06 0.00 0.00 0.00 0.00 0.00 0.001 A 2 c NMVOC 0.0 0.0 5.0 200.0 200.06 0.01 0.00 0.00 0.02 0.00 0.001 A 2 d NMVOC 0.7 0.2 10.0 200.0 200.25 0.17 0.00 0.00 -0.04 0.01 0.001 A 2 e NMVOC 0.0 0.0 5.0 200.0 200.06 0.00 0.00 0.00 0.00 0.00 0.001 A 2 f NMVOC 0.2 0.3 5.0 200.0 200.06 0.26 0.00 0.00 0.13 0.01 0.021 A 2 g 7 NMVOC 0.5 0.7 1.0 40.0 40.01 0.05 0.00 0.00 0.06 0.00 0.001 A 2 g 8 NMVOC 0.0 0.2 10.0 40.0 41.23 0.00 0.00 0.00 0.02 0.01 0.001 A 3 a NMVOC 0.2 0.5 3.0 40.0 40.11 0.03 0.00 0.00 0.06 0.01 0.001 A 3 b NMVOC 73.6 7.2 3.0 125.0 125.04 64.10 -0.08 0.03 -9.94 0.11 98.811 A 3 c NMVOC 0.4 0.1 3.0 40.0 40.11 0.00 0.00 0.00 -0.01 0.00 0.001 A 3 d NMVOC 0.6 0.3 3.0 40.0 40.11 0.01 0.00 0.00 0.01 0.00 0.001 A 3 e NMVOC 0.0 0.0 2.0 200.0 200.01 0.00 0.00 0.00 0.00 0.00 0.001 A 4 a NMVOC 0.7 0.8 5.0 70.0 70.18 0.25 0.00 0.00 0.13 0.02 0.021 A 4 b NMVOC 56.2 25.1 15.0 70.0 71.59 253.88 0.01 0.09 0.62 1.90 4.001 A 4 c NMVOC 4.4 3.5 5.0 100.0 100.12 9.80 0.01 0.01 0.63 0.09 0.401 A 5 b NMVOC 0.0 0.0 1.0 125.0 125.00 0.00 0.00 0.00 0.00 0.00 0.001 B 1 a NMVOC 2.9 NA 5.0 20.0 20.621 B 2 a NMVOC 11.4 1.9 0.5 20.0 20.01 0.11 -0.01 0.01 -0.19 0.00 0.041 B 2 b NMVOC 1.1 0.5 5.0 20.0 20.62 0.01 0.00 0.00 0.00 0.01 0.002 B-10 NMVOC 8.3 1.3 2.0 200.0 200.01 5.51 -0.01 0.00 -1.43 0.01 2.052 C 1 NMVOC 0.3 0.2 0.5 125.0 125.00 0.07 0.00 0.00 0.05 0.00 0.002 C 7 NMVOC 0.2 0.2 5.0 125.0 125.10 0.05 0.00 0.00 0.05 0.01 0.002 D NMVOC 114.4 64.5 5.0 20.0 20.62 138.76 0.07 0.23 1.31 1.63 4.362 H NMVOC 2.3 3.5 10.0 40.0 41.23 1.63 0.01 0.01 0.37 0.18 0.173 D e NMVOC 1.2 1.0 5.0 750.0 750.02 46.89 0.00 0.00 1.52 0.03 2.303 F NMVOC 0.1 0.1 100.0 40.0 107.70 0.00 0.00 0.00 0.00 0.03 0.005 A NMVOC 0.1 0.0 12.0 25.0 27.73 0.00 0.00 0.00 0.00 0.00 0.005 C NMVOC 0.0 0.0 7.0 125.0 125.20 0.00 0.00 0.00 0.00 0.00 0.005 D NMVOC 0.0 0.0 20.0 125.0 126.59 0.00 0.00 0.00 0.00 0.00 0.00Total 280.6 112.9 522.20 112.22
TotalUncertainty in
total inventory %: 22.85 Trend uncertainty % 10.59
(E2 + F2)(G ∙ D)2∑(D2)
D∑C
J ∙ E ∙ 2
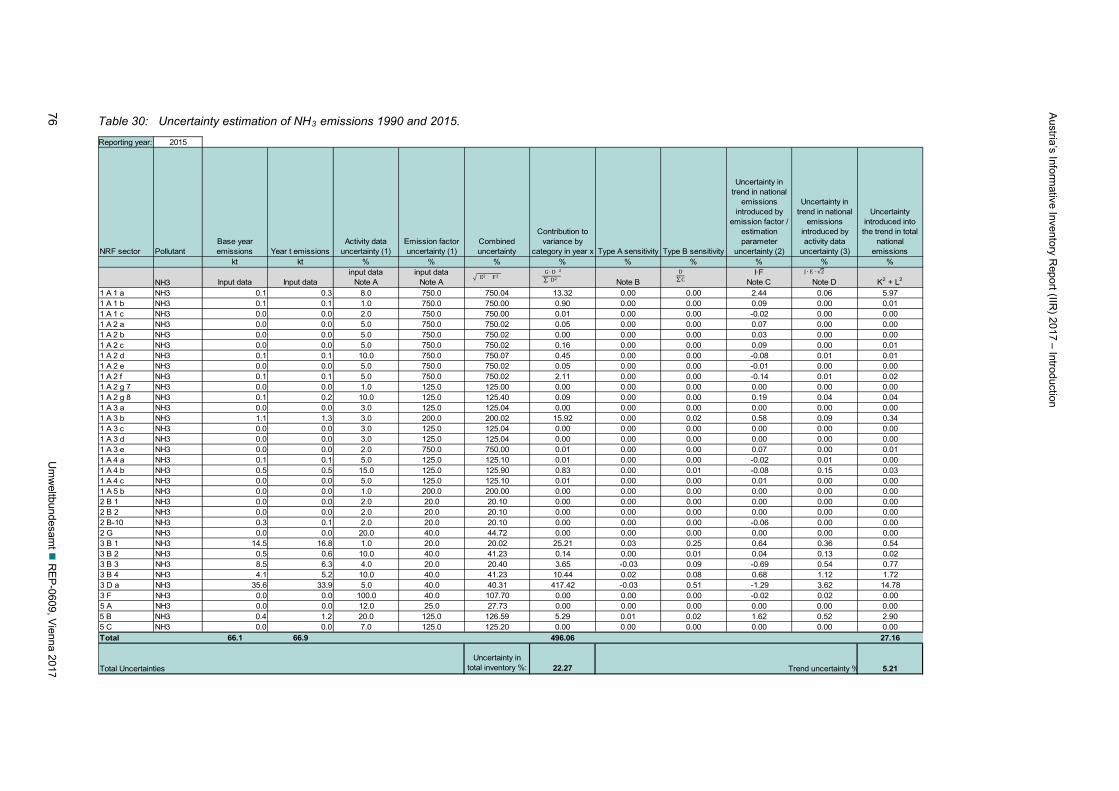
Austria’s Inform
ative Inventory Report (IIR
) 2017 – Introduction
76 U
mw
eltbundesamt
REP
-0609, Vienna 2017
Table 30: Uncertainty estimation of NH3 emissions 1990 and 2015.
Reporting year: 2015
NRF sector PollutantBase year emissions Year t emissions
Activity data uncertainty (1)
Emission factor uncertainty (1)
Combined uncertainty
Contribution to variance by
category in year x Type A sensitivity Type B sensitivity
Uncertainty in trend in national
emissions introduced by
emission factor / estimation parameter
uncertainty (2)
Uncertainty in trend in national
emissions introduced by activity data
uncertainty (3)
Uncertainty introduced into the trend in total
national emissions
kt kt % % % % % % % % %
NH3 Input data Input datainput data
Note Ainput data
Note A Note BI·F
Note C Note D K2 + L2
1 A 1 a NH3 0.1 0.3 8.0 750.0 750.04 13.32 0.00 0.00 2.44 0.06 5.971 A 1 b NH3 0.1 0.1 1.0 750.0 750.00 0.90 0.00 0.00 0.09 0.00 0.011 A 1 c NH3 0.0 0.0 2.0 750.0 750.00 0.01 0.00 0.00 -0.02 0.00 0.001 A 2 a NH3 0.0 0.0 5.0 750.0 750.02 0.05 0.00 0.00 0.07 0.00 0.001 A 2 b NH3 0.0 0.0 5.0 750.0 750.02 0.00 0.00 0.00 0.03 0.00 0.001 A 2 c NH3 0.0 0.0 5.0 750.0 750.02 0.16 0.00 0.00 0.09 0.00 0.011 A 2 d NH3 0.1 0.1 10.0 750.0 750.07 0.45 0.00 0.00 -0.08 0.01 0.011 A 2 e NH3 0.0 0.0 5.0 750.0 750.02 0.05 0.00 0.00 -0.01 0.00 0.001 A 2 f NH3 0.1 0.1 5.0 750.0 750.02 2.11 0.00 0.00 -0.14 0.01 0.021 A 2 g 7 NH3 0.0 0.0 1.0 125.0 125.00 0.00 0.00 0.00 0.00 0.00 0.001 A 2 g 8 NH3 0.1 0.2 10.0 125.0 125.40 0.09 0.00 0.00 0.19 0.04 0.041 A 3 a NH3 0.0 0.0 3.0 125.0 125.04 0.00 0.00 0.00 0.00 0.00 0.001 A 3 b NH3 1.1 1.3 3.0 200.0 200.02 15.92 0.00 0.02 0.58 0.09 0.341 A 3 c NH3 0.0 0.0 3.0 125.0 125.04 0.00 0.00 0.00 0.00 0.00 0.001 A 3 d NH3 0.0 0.0 3.0 125.0 125.04 0.00 0.00 0.00 0.00 0.00 0.001 A 3 e NH3 0.0 0.0 2.0 750.0 750.00 0.01 0.00 0.00 0.07 0.00 0.011 A 4 a NH3 0.1 0.1 5.0 125.0 125.10 0.01 0.00 0.00 -0.02 0.01 0.001 A 4 b NH3 0.5 0.5 15.0 125.0 125.90 0.83 0.00 0.01 -0.08 0.15 0.031 A 4 c NH3 0.0 0.0 5.0 125.0 125.10 0.01 0.00 0.00 0.01 0.00 0.001 A 5 b NH3 0.0 0.0 1.0 200.0 200.00 0.00 0.00 0.00 0.00 0.00 0.002 B 1 NH3 0.0 0.0 2.0 20.0 20.10 0.00 0.00 0.00 0.00 0.00 0.002 B 2 NH3 0.0 0.0 2.0 20.0 20.10 0.00 0.00 0.00 0.00 0.00 0.002 B-10 NH3 0.3 0.1 2.0 20.0 20.10 0.00 0.00 0.00 -0.06 0.00 0.002 G NH3 0.0 0.0 20.0 40.0 44.72 0.00 0.00 0.00 0.00 0.00 0.003 B 1 NH3 14.5 16.8 1.0 20.0 20.02 25.21 0.03 0.25 0.64 0.36 0.543 B 2 NH3 0.5 0.6 10.0 40.0 41.23 0.14 0.00 0.01 0.04 0.13 0.023 B 3 NH3 8.5 6.3 4.0 20.0 20.40 3.65 -0.03 0.09 -0.69 0.54 0.773 B 4 NH3 4.1 5.2 10.0 40.0 41.23 10.44 0.02 0.08 0.68 1.12 1.723 D a NH3 35.6 33.9 5.0 40.0 40.31 417.42 -0.03 0.51 -1.29 3.62 14.783 F NH3 0.0 0.0 100.0 40.0 107.70 0.00 0.00 0.00 -0.02 0.02 0.005 A NH3 0.0 0.0 12.0 25.0 27.73 0.00 0.00 0.00 0.00 0.00 0.005 B NH3 0.4 1.2 20.0 125.0 126.59 5.29 0.01 0.02 1.62 0.52 2.905 C NH3 0.0 0.0 7.0 125.0 125.20 0.00 0.00 0.00 0.00 0.00 0.00Total 66.1 66.9 496.06 27.16
Total UncertaintiesUncertainty in
total inventory %: 22.27 Trend uncertainty % 5.21
(E2 + F2)(G ∙ D)2∑(D2)
D∑C
J ∙ E ∙ 2
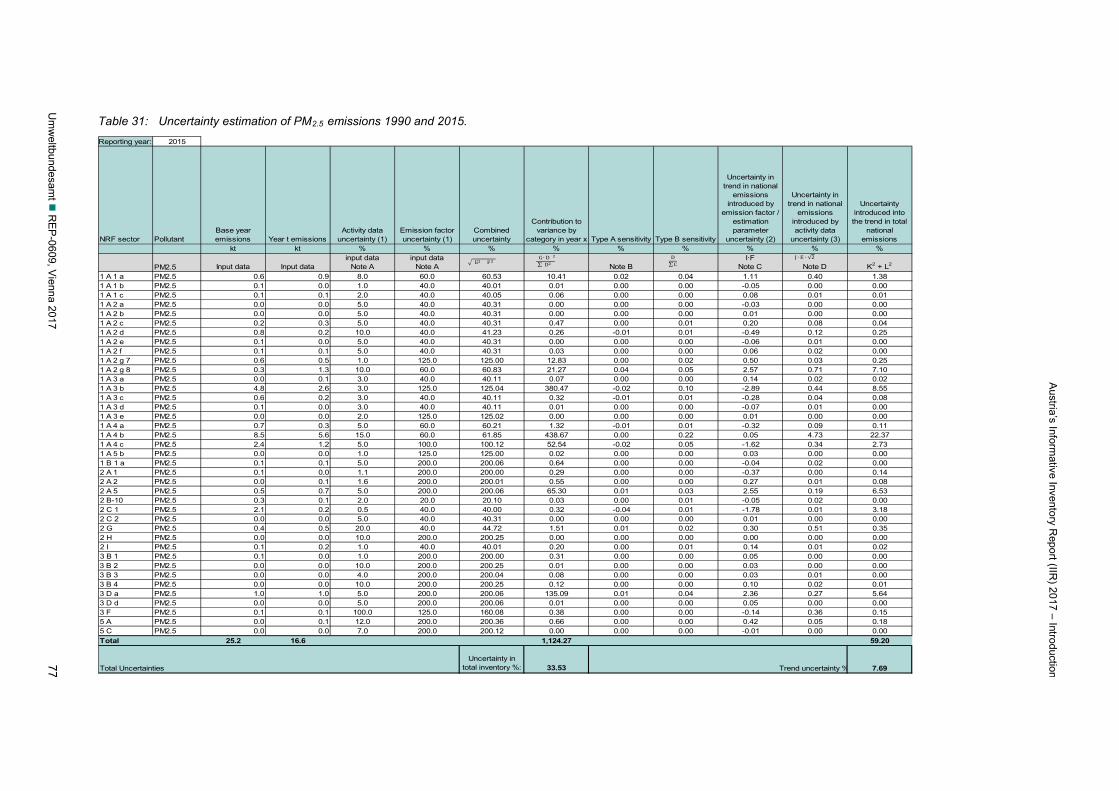
Austria’s Inform
ative Inventory Report (IIR
) 2017 – Introduction
Um
weltbundesam
t R
EP-0609, V
ienna 2017 77
Table 31: Uncertainty estimation of PM2.5 emissions 1990 and 2015.
Reporting year: 2015
NRF sector PollutantBase year emissions Year t emissions
Activity data uncertainty (1)
Emission factor uncertainty (1)
Combined uncertainty
Contribution to variance by
category in year x Type A sensitivity Type B sensitivity
Uncertainty in trend in national
emissions introduced by
emission factor / estimation parameter
uncertainty (2)
Uncertainty in trend in national
emissions introduced by activity data
uncertainty (3)
Uncertainty introduced into the trend in total
national emissions
kt kt % % % % % % % % %
PM2.5 Input data Input datainput data
Note Ainput data
Note A Note BI·F
Note C Note D K2 + L2
1 A 1 a PM2.5 0.6 0.9 8.0 60.0 60.53 10.41 0.02 0.04 1.11 0.40 1.381 A 1 b PM2.5 0.1 0.0 1.0 40.0 40.01 0.01 0.00 0.00 -0.05 0.00 0.001 A 1 c PM2.5 0.1 0.1 2.0 40.0 40.05 0.06 0.00 0.00 0.08 0.01 0.011 A 2 a PM2.5 0.0 0.0 5.0 40.0 40.31 0.00 0.00 0.00 -0.03 0.00 0.001 A 2 b PM2.5 0.0 0.0 5.0 40.0 40.31 0.00 0.00 0.00 0.01 0.00 0.001 A 2 c PM2.5 0.2 0.3 5.0 40.0 40.31 0.47 0.00 0.01 0.20 0.08 0.041 A 2 d PM2.5 0.8 0.2 10.0 40.0 41.23 0.26 -0.01 0.01 -0.49 0.12 0.251 A 2 e PM2.5 0.1 0.0 5.0 40.0 40.31 0.00 0.00 0.00 -0.06 0.01 0.001 A 2 f PM2.5 0.1 0.1 5.0 40.0 40.31 0.03 0.00 0.00 0.06 0.02 0.001 A 2 g 7 PM2.5 0.6 0.5 1.0 125.0 125.00 12.83 0.00 0.02 0.50 0.03 0.251 A 2 g 8 PM2.5 0.3 1.3 10.0 60.0 60.83 21.27 0.04 0.05 2.57 0.71 7.101 A 3 a PM2.5 0.0 0.1 3.0 40.0 40.11 0.07 0.00 0.00 0.14 0.02 0.021 A 3 b PM2.5 4.8 2.6 3.0 125.0 125.04 380.47 -0.02 0.10 -2.89 0.44 8.551 A 3 c PM2.5 0.6 0.2 3.0 40.0 40.11 0.32 -0.01 0.01 -0.28 0.04 0.081 A 3 d PM2.5 0.1 0.0 3.0 40.0 40.11 0.01 0.00 0.00 -0.07 0.01 0.001 A 3 e PM2.5 0.0 0.0 2.0 125.0 125.02 0.00 0.00 0.00 0.01 0.00 0.001 A 4 a PM2.5 0.7 0.3 5.0 60.0 60.21 1.32 -0.01 0.01 -0.32 0.09 0.111 A 4 b PM2.5 8.5 5.6 15.0 60.0 61.85 438.67 0.00 0.22 0.05 4.73 22.371 A 4 c PM2.5 2.4 1.2 5.0 100.0 100.12 52.54 -0.02 0.05 -1.62 0.34 2.731 A 5 b PM2.5 0.0 0.0 1.0 125.0 125.00 0.02 0.00 0.00 0.03 0.00 0.001 B 1 a PM2.5 0.1 0.1 5.0 200.0 200.06 0.64 0.00 0.00 -0.04 0.02 0.002 A 1 PM2.5 0.1 0.0 1.1 200.0 200.00 0.29 0.00 0.00 -0.37 0.00 0.142 A 2 PM2.5 0.0 0.1 1.6 200.0 200.01 0.55 0.00 0.00 0.27 0.01 0.082 A 5 PM2.5 0.5 0.7 5.0 200.0 200.06 65.30 0.01 0.03 2.55 0.19 6.532 B-10 PM2.5 0.3 0.1 2.0 20.0 20.10 0.03 0.00 0.01 -0.05 0.02 0.002 C 1 PM2.5 2.1 0.2 0.5 40.0 40.00 0.32 -0.04 0.01 -1.78 0.01 3.182 C 2 PM2.5 0.0 0.0 5.0 40.0 40.31 0.00 0.00 0.00 0.01 0.00 0.002 G PM2.5 0.4 0.5 20.0 40.0 44.72 1.51 0.01 0.02 0.30 0.51 0.352 H PM2.5 0.0 0.0 10.0 200.0 200.25 0.00 0.00 0.00 0.00 0.00 0.002 I PM2.5 0.1 0.2 1.0 40.0 40.01 0.20 0.00 0.01 0.14 0.01 0.023 B 1 PM2.5 0.1 0.0 1.0 200.0 200.00 0.31 0.00 0.00 0.05 0.00 0.003 B 2 PM2.5 0.0 0.0 10.0 200.0 200.25 0.01 0.00 0.00 0.03 0.00 0.003 B 3 PM2.5 0.0 0.0 4.0 200.0 200.04 0.08 0.00 0.00 0.03 0.01 0.003 B 4 PM2.5 0.0 0.0 10.0 200.0 200.25 0.12 0.00 0.00 0.10 0.02 0.013 D a PM2.5 1.0 1.0 5.0 200.0 200.06 135.09 0.01 0.04 2.36 0.27 5.643 D d PM2.5 0.0 0.0 5.0 200.0 200.06 0.01 0.00 0.00 0.05 0.00 0.003 F PM2.5 0.1 0.1 100.0 125.0 160.08 0.38 0.00 0.00 -0.14 0.36 0.155 A PM2.5 0.0 0.1 12.0 200.0 200.36 0.66 0.00 0.00 0.42 0.05 0.185 C PM2.5 0.0 0.0 7.0 200.0 200.12 0.00 0.00 0.00 -0.01 0.00 0.00Total 25.2 16.6 1,124.27 59.20
Total UncertaintiesUncertainty in
total inventory %: 33.53 Trend uncertainty % 7.69
(E2 + F2)(G ∙ D)2∑(D2)
D∑C
J ∙ E ∙ 2
Austria’s Informative Inventory Report (IIR) 2017 – Introduction
78 Umweltbundesamt REP-0609, Vienna 2017
1.8 Completeness
The emission data presented in this report were compiled according to the revised 2014 Report-ing Guidelines (ECE/EB.AIR.125) approved by the Executive Body for the UNECE/LRTAP Con-vention at its 36th session.
The inventory is complete with regard to reported gases, reported years and reported emissions from all sources, and also complete in terms of geographic coverage.
Geographic Coverage
The geographic coverage is complete. There is no territory in Austria not covered by the inventory.
However, if fuel prices vary considerably in neighbouring countries, fuel sold within the territory of a Party is used outside its territory (so-called ‘fuel export’). Austria has experienced a consid-erable amount of ‘fuel export’ in the last few years (see also Chapter 2.5).
According to the revised 2014 Reporting Guidelines (ECE/EB.AIR.125), Parties within the EMEP region should calculate and report emissions, consistent with national energy balances reported to Eurostat or the International Energy Agency (IEA). Emissions from road vehicle transport should therefore be calculated and reported on the basis of the fuel sold. In addition, Parties may voluntarily report emissions from road vehicles based on fuel used in the geograph-ic area of the Party.
Emissions of the Austrian road transport sector are therefore generally reported on the basis of fuel sold. With respect to compliance under Directive (EU) 2016/2284 on the reduction of na-tional emissions of certain atmospheric pollutants, emissions are accounted on the basis of ‘fuel used’. The Austrian NEC Totals therefore differ from the LRTAP Totals presented in this report (see Appendix, Chapter 12.2).
Gases, Reporting Years
In accordance with the Austrian obligation, all relevant pollutants mentioned in Table 3 (mini-mum reporting programme), are covered by the Austrian inventory and are reported for the years 1990–2015 for the main pollutants, from 1990 onwards for POPs and HMs and for the years 1990, 1995 and from 2000 onwards for PM.
From submission 2015 onwards Austria reports all pollutants in the NFR14 reporting format from 1990 to the latest inventory year. Emissions of the years before 1990 were last updated and published in submission 201471.
Notation Keys
Notation keys are used according to the revised 2014 Reporting Guidelines (ECE/EB.AIR.125) (see Table 32) to indicate where emissions are not occurring in Austria, where emissions have not been estimated or have been included elsewhere as suggested by EMEP/EEA Emission In-ventory Guidebook 2016.
71 Austria´s submission 2014 under the Convention on Long-range Transboundary Air Pollution covering the years
1980–2012: http://www.ceip.at/ms/ceip_home1/ceip_home/status_reporting/2014_submissions/
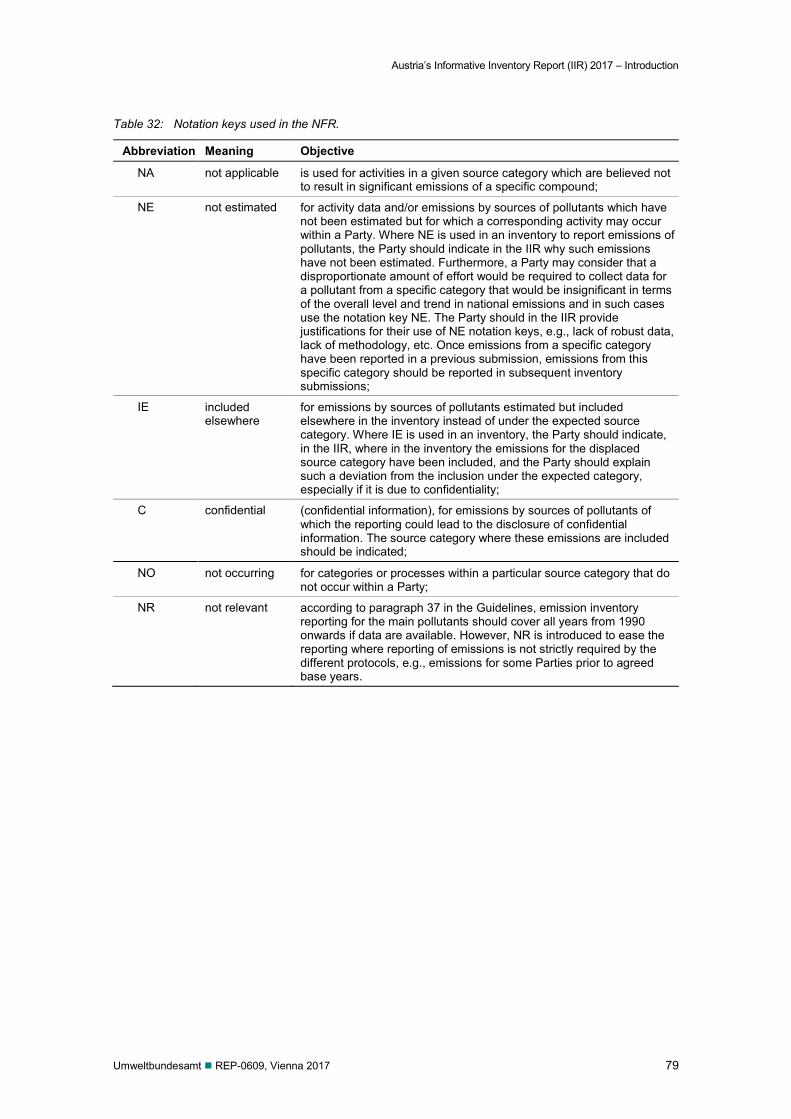
Austria’s Informative Inventory Report (IIR) 2017 – Introduction
Umweltbundesamt REP-0609, Vienna 2017 79
Table 32: Notation keys used in the NFR.
Abbreviation Meaning Objective
NA not applicable is used for activities in a given source category which are believed not to result in significant emissions of a specific compound;
NE not estimated for activity data and/or emissions by sources of pollutants which have not been estimated but for which a corresponding activity may occur within a Party. Where NE is used in an inventory to report emissions of pollutants, the Party should indicate in the IIR why such emissions have not been estimated. Furthermore, a Party may consider that a disproportionate amount of effort would be required to collect data for a pollutant from a specific category that would be insignificant in terms of the overall level and trend in national emissions and in such cases use the notation key NE. The Party should in the IIR provide justifications for their use of NE notation keys, e.g., lack of robust data, lack of methodology, etc. Once emissions from a specific category have been reported in a previous submission, emissions from this specific category should be reported in subsequent inventory submissions;
IE included elsewhere
for emissions by sources of pollutants estimated but included elsewhere in the inventory instead of under the expected source category. Where IE is used in an inventory, the Party should indicate, in the IIR, where in the inventory the emissions for the displaced source category have been included, and the Party should explain such a deviation from the inclusion under the expected category, especially if it is due to confidentiality;
C confidential (confidential information), for emissions by sources of pollutants of which the reporting could lead to the disclosure of confidential information. The source category where these emissions are included should be indicated;
NO not occurring for categories or processes within a particular source category that do not occur within a Party;
NR not relevant according to paragraph 37 in the Guidelines, emission inventory reporting for the main pollutants should cover all years from 1990 onwards if data are available. However, NR is introduced to ease the reporting where reporting of emissions is not strictly required by the different protocols, e.g., emissions for some Parties prior to agreed base years.
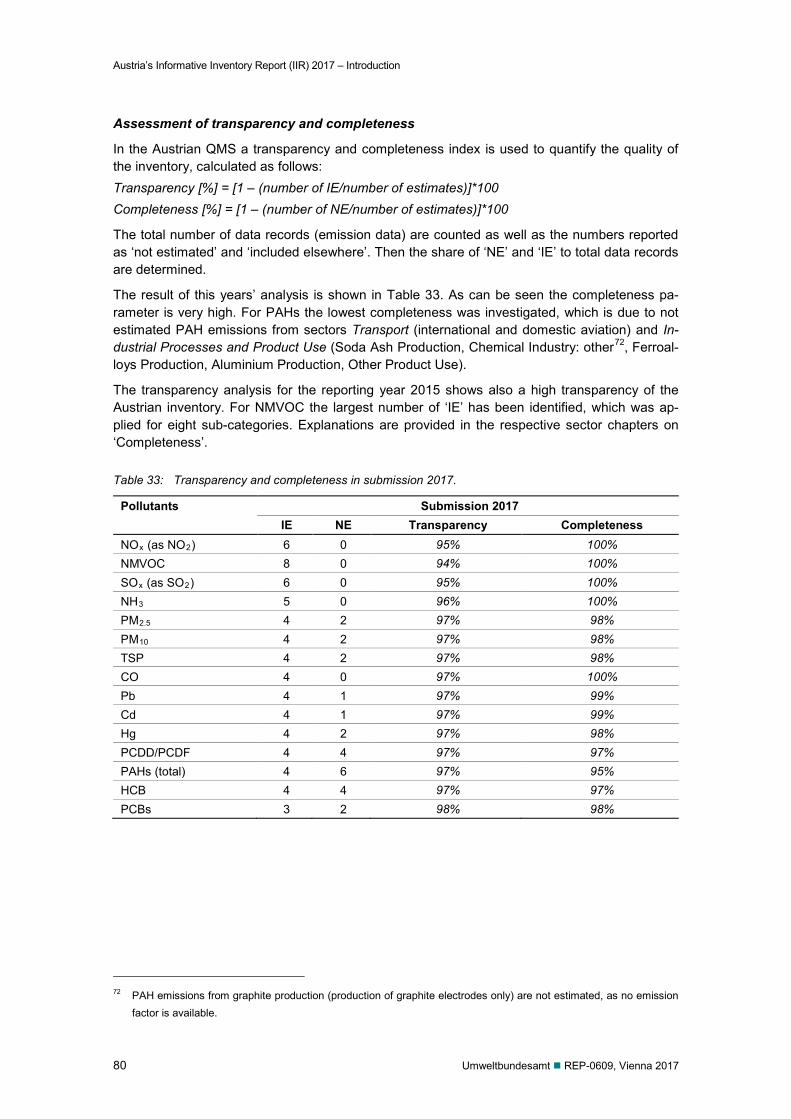
Austria’s Informative Inventory Report (IIR) 2017 – Introduction
80 Umweltbundesamt REP-0609, Vienna 2017
Assessment of transparency and completeness
In the Austrian QMS a transparency and completeness index is used to quantify the quality of the inventory, calculated as follows: Transparency [%] = [1 – (number of IE/number of estimates)]*100 Completeness [%] = [1 – (number of NE/number of estimates)]*100
The total number of data records (emission data) are counted as well as the numbers reported as ‘not estimated’ and ‘included elsewhere’. Then the share of ‘NE’ and ‘IE’ to total data records are determined.
The result of this years’ analysis is shown in Table 33. As can be seen the completeness pa-rameter is very high. For PAHs the lowest completeness was investigated, which is due to not estimated PAH emissions from sectors Transport (international and domestic aviation) and In-dustrial Processes and Product Use (Soda Ash Production, Chemical Industry: other72, Ferroal-loys Production, Aluminium Production, Other Product Use).
The transparency analysis for the reporting year 2015 shows also a high transparency of the Austrian inventory. For NMVOC the largest number of ‘IE’ has been identified, which was ap-plied for eight sub-categories. Explanations are provided in the respective sector chapters on ‘Completeness’.
Table 33: Transparency and completeness in submission 2017.
Pollutants Submission 2017 IE NE Transparency Completeness NOx (as NO2) 6 0 95% 100% NMVOC 8 0 94% 100% SOx (as SO2) 6 0 95% 100% NH3 5 0 96% 100% PM2.5 4 2 97% 98% PM10 4 2 97% 98% TSP 4 2 97% 98% CO 4 0 97% 100% Pb 4 1 97% 99% Cd 4 1 97% 99% Hg 4 2 97% 98% PCDD/PCDF 4 4 97% 97% PAHs (total) 4 6 97% 95% HCB 4 4 97% 97% PCBs 3 2 98% 98%
72 PAH emissions from graphite production (production of graphite electrodes only) are not estimated, as no emission
factor is available.
Austria’s Informative Inventory Report (IIR) 2017 – Explanations of Key Trends
Umweltbundesamt REP-0609, Vienna 2017 81
2 EXPLANATIONS OF KEY TRENDS
This chapter describes the trends and the drivers of air pollutant emissions which Austria is obliged to report based on the following listed protocols. Additionally the trends of SO2, NOx, NH3, NMVOC and PM2.5 emissions not including fuel exports (fuel used) as reported under Di-rective (EU) 2016/2284 on the reduction of national emissions of certain atmospheric pollutants are described in chapter 2.5. From submission 2015 onwards Austria reports all mandatory pollutants in the NFR14 reporting format from 1990 to the latest inventory year. Emissions of the years before 1990 were last up-dated and published in submission 201473.
1985 Helsinki Protocol on the Reduction of Sulphur Emissions or their Transboundary Fluxes: This protocol requires parties to reduce their sulphur emissions by at least 30%. All par-ties achieved this reduction target by the target year 1993. In 2015, Austria’s SO2 emissions were 80% lower than in 1990. 1988 Sofia Protocol concerning the Control of Emissions of Nitrogen Oxides or their Transboundary Fluxes: This Protocol requires as a first step, to freeze emissions of nitrogen oxides or their transboundary fluxes. The general reference year is 1987. The second step to the NOx Protocol requires the application of an effects-based approach to further reduce emissions of nitrogen compounds. Nineteen of the 25 Parties to the 1988 NOx Protocol have reached the target and stabilized emissions at 198774 levels or reduced emissions below that level according to the latest emission data reported. Austria was successful in fulfilling the stabilisation target set out in the Protocol. Since 2003–2005, when emissions reached an all-time high due to a considerable increase of fuel export and the failure of European provisions for the reduction of vehicle emissions, NOx emissions are decreasing.
1991 Geneva Protocol concerning the Control of Emissions of Volatile Organic Com-pounds or their Transboundary Fluxes. This Protocol specifies three options for emission re-duction targets that have to be chosen upon signature or upon ratification. Austria chose the op-tion which requires a 30% reduction of VOCs by 1999 using a base year between 1984 and 1990 and chose 1988 as base year. Austria met the reduction target.
1998 Aarhus Protocol on Heavy Metals: It targets three particularly harmful metals: cadmium, lead and mercury. According to one of the basic obligations, Parties have to reduce their emis-sions for these three metals below their levels in the reference year. Austria has chosen 1985 as the reference year and current emissions are well below the level of the reference year.
1998 Aarhus Protocol on Persistent Organic Pollutants (POPs): The protocol focuses on a list of 16 substances that were singled out according to agreed risk criteria. These substances comprise eleven pesticides, two industrial chemicals and three by-products/contaminants. The ultimate objective is to eliminate any discharges, emissions and losses of POPs. Parties have to reduce their emissions for PAHs, Dioxins/Furans and HCB below their levels in the reference year. Austria has chosen 1985 as the reference year and current emissions are well below the level of the reference year. 1999 Gothenburg Protocol to Abate Acidification, Eutrophication and Ground-level Ozone “Multi-Effect Protocol”. The Protocol sets emission ceilings for 2010 for four pollutants: sulphur, NOx, VOCs and ammonia. In May 2012 the protocol was amended to include national emission reduction commitments to be achieved in 2020 and beyond. Austria has not ratified the Protocol and is not Party to the Protocol, but reports the concerned emissions. 73 Austria´s submission 2014 under the Convention on Long-range Transboundary Air Pollution covering the years
1980–2012: http://www.ceip.at/ms/ceip_home1/ceip_home/status_reporting/2014_submissions/ 74 or in the case of the United States 1978
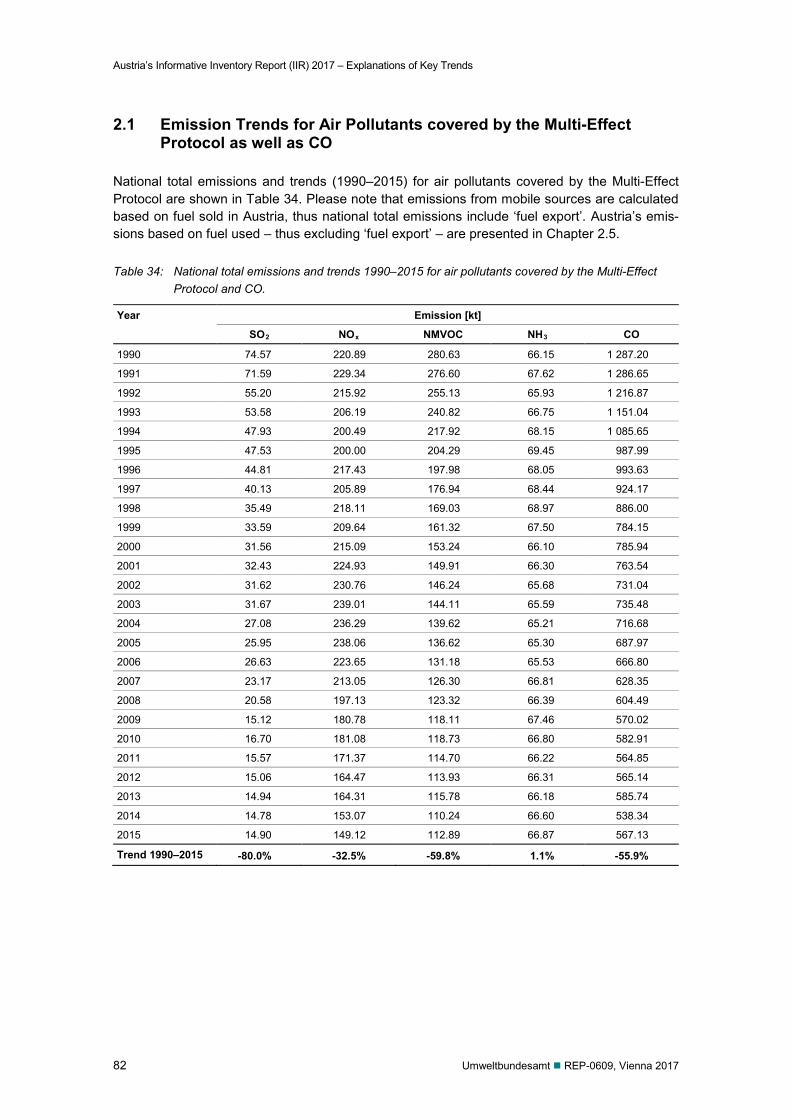
Austria’s Informative Inventory Report (IIR) 2017 – Explanations of Key Trends
82 Umweltbundesamt REP-0609, Vienna 2017
2.1 Emission Trends for Air Pollutants covered by the Multi-Effect Protocol as well as CO
National total emissions and trends (1990–2015) for air pollutants covered by the Multi-Effect Protocol are shown in Table 34. Please note that emissions from mobile sources are calculated based on fuel sold in Austria, thus national total emissions include ‘fuel export’. Austria’s emis-sions based on fuel used – thus excluding ‘fuel export’ – are presented in Chapter 2.5.
Table 34: National total emissions and trends 1990–2015 for air pollutants covered by the Multi-Effect Protocol and CO.
Year Emission [kt]
SO2 NOx NMVOC NH3 CO
1990 74.57 220.89 280.63 66.15 1 287.20
1991 71.59 229.34 276.60 67.62 1 286.65
1992 55.20 215.92 255.13 65.93 1 216.87
1993 53.58 206.19 240.82 66.75 1 151.04
1994 47.93 200.49 217.92 68.15 1 085.65
1995 47.53 200.00 204.29 69.45 987.99
1996 44.81 217.43 197.98 68.05 993.63
1997 40.13 205.89 176.94 68.44 924.17
1998 35.49 218.11 169.03 68.97 886.00
1999 33.59 209.64 161.32 67.50 784.15
2000 31.56 215.09 153.24 66.10 785.94
2001 32.43 224.93 149.91 66.30 763.54
2002 31.62 230.76 146.24 65.68 731.04
2003 31.67 239.01 144.11 65.59 735.48
2004 27.08 236.29 139.62 65.21 716.68
2005 25.95 238.06 136.62 65.30 687.97
2006 26.63 223.65 131.18 65.53 666.80
2007 23.17 213.05 126.30 66.81 628.35
2008 20.58 197.13 123.32 66.39 604.49
2009 15.12 180.78 118.11 67.46 570.02
2010 16.70 181.08 118.73 66.80 582.91
2011 15.57 171.37 114.70 66.22 564.85
2012 15.06 164.47 113.93 66.31 565.14
2013 14.94 164.31 115.78 66.18 585.74
2014 14.78 153.07 110.24 66.60 538.34
2015 14.90 149.12 112.89 66.87 567.13
Trend 1990–2015 -80.0% -32.5% -59.8% 1.1% -55.9%
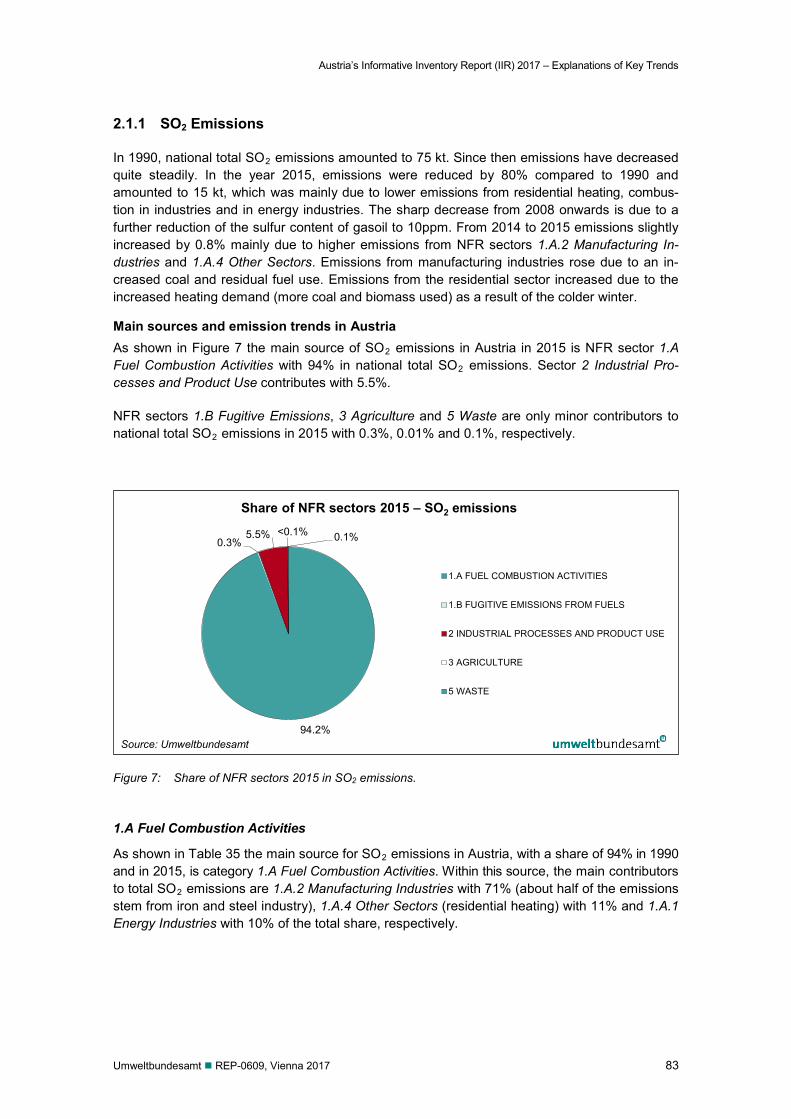
Austria’s Informative Inventory Report (IIR) 2017 – Explanations of Key Trends
Umweltbundesamt REP-0609, Vienna 2017 83
2.1.1 SO2 Emissions
In 1990, national total SO2 emissions amounted to 75 kt. Since then emissions have decreased quite steadily. In the year 2015, emissions were reduced by 80% compared to 1990 and amounted to 15 kt, which was mainly due to lower emissions from residential heating, combus-tion in industries and in energy industries. The sharp decrease from 2008 onwards is due to a further reduction of the sulfur content of gasoil to 10ppm. From 2014 to 2015 emissions slightly increased by 0.8% mainly due to higher emissions from NFR sectors 1.A.2 Manufacturing In-dustries and 1.A.4 Other Sectors. Emissions from manufacturing industries rose due to an in-creased coal and residual fuel use. Emissions from the residential sector increased due to the increased heating demand (more coal and biomass used) as a result of the colder winter.
Main sources and emission trends in Austria As shown in Figure 7 the main source of SO2 emissions in Austria in 2015 is NFR sector 1.A Fuel Combustion Activities with 94% in national total SO2 emissions. Sector 2 Industrial Pro-cesses and Product Use contributes with 5.5%.
NFR sectors 1.B Fugitive Emissions, 3 Agriculture and 5 Waste are only minor contributors to national total SO2 emissions in 2015 with 0.3%, 0.01% and 0.1%, respectively.
Figure 7: Share of NFR sectors 2015 in SO2 emissions.
1.A Fuel Combustion Activities
As shown in Table 35 the main source for SO2 emissions in Austria, with a share of 94% in 1990 and in 2015, is category 1.A Fuel Combustion Activities. Within this source, the main contributors to total SO2 emissions are 1.A.2 Manufacturing Industries with 71% (about half of the emissions stem from iron and steel industry), 1.A.4 Other Sectors (residential heating) with 11% and 1.A.1 Energy Industries with 10% of the total share, respectively.
94.2%
0.3% 5.5% <0.1% 0.1%
Share of NFR sectors 2015 – SO2 emissions
1.A FUEL COMBUSTION ACTIVITIES
1.B FUGITIVE EMISSIONS FROM FUELS
2 INDUSTRIAL PROCESSES AND PRODUCT USE
3 AGRICULTURE
5 WASTE
Source: Umweltbundesamt
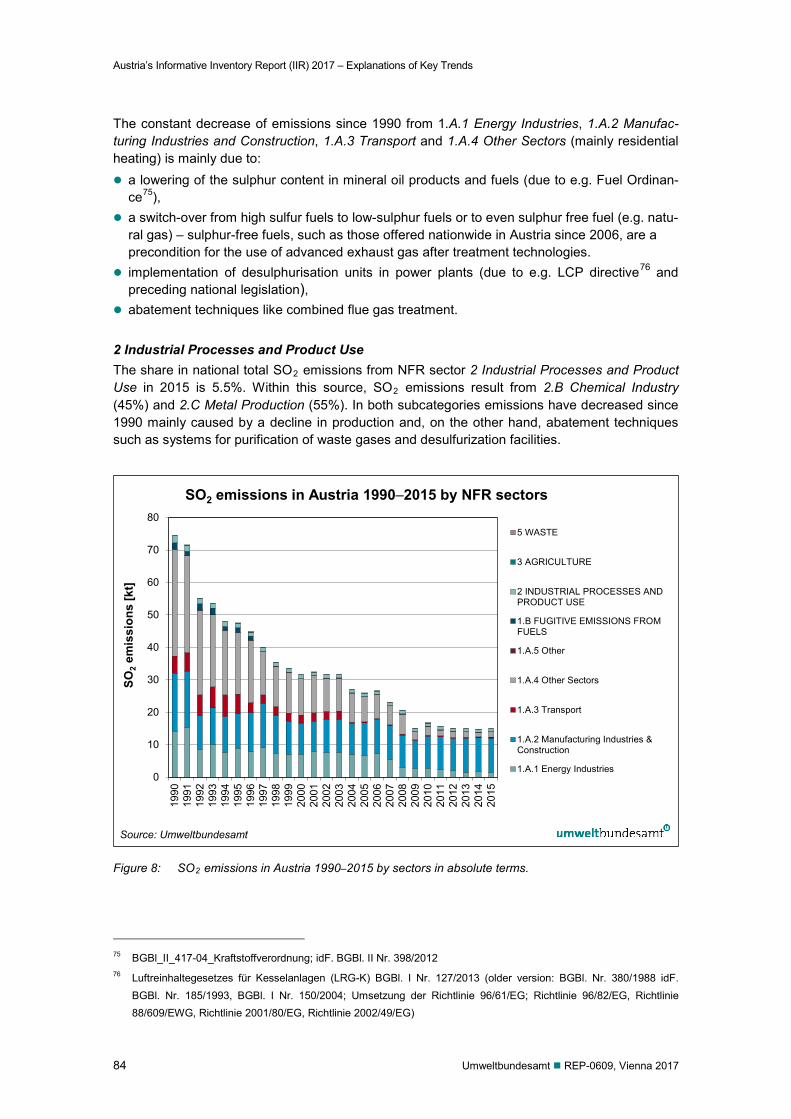
Austria’s Informative Inventory Report (IIR) 2017 – Explanations of Key Trends
84 Umweltbundesamt REP-0609, Vienna 2017
The constant decrease of emissions since 1990 from 1.A.1 Energy Industries, 1.A.2 Manufac-turing Industries and Construction, 1.A.3 Transport and 1.A.4 Other Sectors (mainly residential heating) is mainly due to: a lowering of the sulphur content in mineral oil products and fuels (due to e.g. Fuel Ordinan-
ce75), a switch-over from high sulfur fuels to low-sulphur fuels or to even sulphur free fuel (e.g. natu-
ral gas) – sulphur-free fuels, such as those offered nationwide in Austria since 2006, are a precondition for the use of advanced exhaust gas after treatment technologies.
implementation of desulphurisation units in power plants (due to e.g. LCP directive76 and preceding national legislation),
abatement techniques like combined flue gas treatment. 2 Industrial Processes and Product Use The share in national total SO2 emissions from NFR sector 2 Industrial Processes and Product Use in 2015 is 5.5%. Within this source, SO2 emissions result from 2.B Chemical Industry (45%) and 2.C Metal Production (55%). In both subcategories emissions have decreased since 1990 mainly caused by a decline in production and, on the other hand, abatement techniques such as systems for purification of waste gases and desulfurization facilities.
Figure 8: SO2 emissions in Austria 1990–2015 by sectors in absolute terms.
75 BGBl_II_417-04_Kraftstoffverordnung; idF. BGBl. II Nr. 398/2012 76 Luftreinhaltegesetzes für Kesselanlagen (LRG-K) BGBl. I Nr. 127/2013 (older version: BGBl. Nr. 380/1988 idF.
BGBl. Nr. 185/1993, BGBl. I Nr. 150/2004; Umsetzung der Richtlinie 96/61/EG; Richtlinie 96/82/EG, Richtlinie 88/609/EWG, Richtlinie 2001/80/EG, Richtlinie 2002/49/EG)
0
10
20
30
40
50
60
70
80
1990
1991
1992
1993
1994
1995
1996
1997
1998
1999
2000
2001
2002
2003
2004
2005
2006
2007
2008
2009
2010
2011
2012
2013
2014
2015
SO2 e
mis
sion
s [k
t]
SO2 emissions in Austria 1990–2015 by NFR sectors
5 WASTE
3 AGRICULTURE
2 INDUSTRIAL PROCESSES ANDPRODUCT USE
1.B FUGITIVE EMISSIONS FROMFUELS
1.A.5 Other
1.A.4 Other Sectors
1.A.3 Transport
1.A.2 Manufacturing Industries &Construction
1.A.1 Energy Industries
Source: Umweltbundesamt
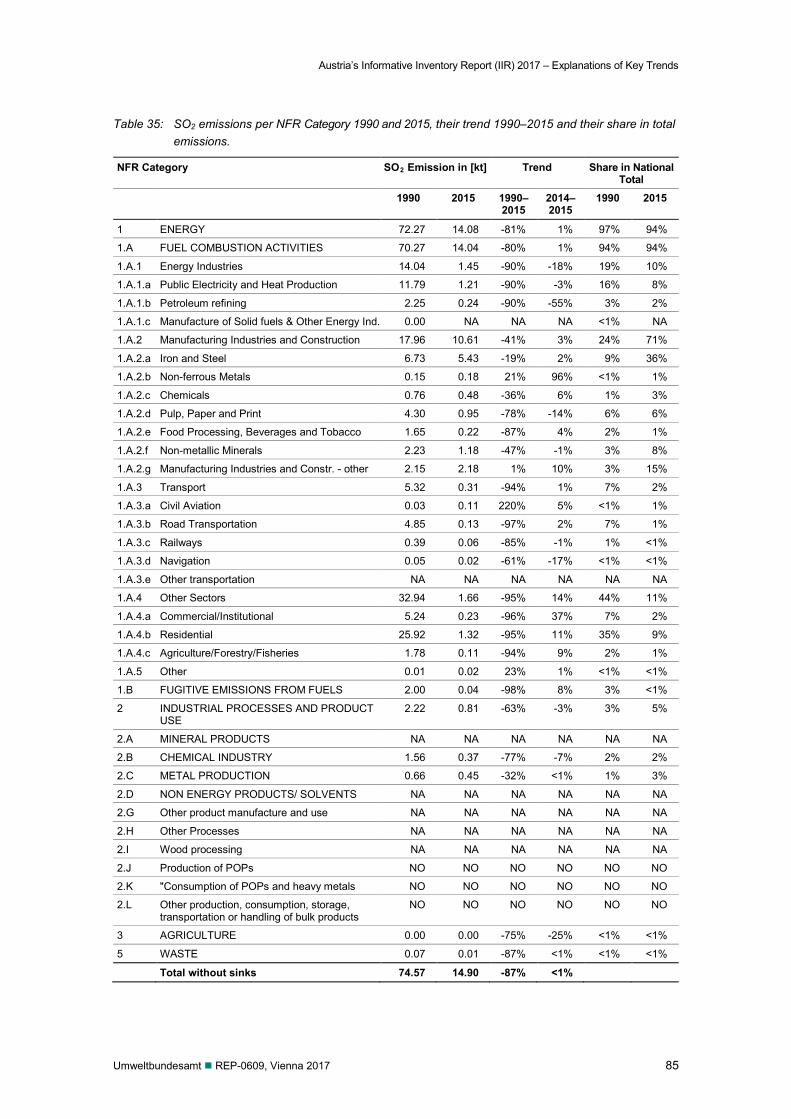
Austria’s Informative Inventory Report (IIR) 2017 – Explanations of Key Trends
Umweltbundesamt REP-0609, Vienna 2017 85
Table 35: SO2 emissions per NFR Category 1990 and 2015, their trend 1990–2015 and their share in total emissions.
NFR Category SO2 Emission in [kt] Trend Share in National Total
1990 2015 1990–2015
2014–2015
1990 2015
1 ENERGY 72.27 14.08 -81% 1% 97% 94%
1.A FUEL COMBUSTION ACTIVITIES 70.27 14.04 -80% 1% 94% 94%
1.A.1 Energy Industries 14.04 1.45 -90% -18% 19% 10%
1.A.1.a Public Electricity and Heat Production 11.79 1.21 -90% -3% 16% 8%
1.A.1.b Petroleum refining 2.25 0.24 -90% -55% 3% 2%
1.A.1.c Manufacture of Solid fuels & Other Energy Ind. 0.00 NA NA NA <1% NA
1.A.2 Manufacturing Industries and Construction 17.96 10.61 -41% 3% 24% 71%
1.A.2.a Iron and Steel 6.73 5.43 -19% 2% 9% 36%
1.A.2.b Non-ferrous Metals 0.15 0.18 21% 96% <1% 1%
1.A.2.c Chemicals 0.76 0.48 -36% 6% 1% 3%
1.A.2.d Pulp, Paper and Print 4.30 0.95 -78% -14% 6% 6%
1.A.2.e Food Processing, Beverages and Tobacco 1.65 0.22 -87% 4% 2% 1%
1.A.2.f Non-metallic Minerals 2.23 1.18 -47% -1% 3% 8%
1.A.2.g Manufacturing Industries and Constr. - other 2.15 2.18 1% 10% 3% 15%
1.A.3 Transport 5.32 0.31 -94% 1% 7% 2%
1.A.3.a Civil Aviation 0.03 0.11 220% 5% <1% 1%
1.A.3.b Road Transportation 4.85 0.13 -97% 2% 7% 1%
1.A.3.c Railways 0.39 0.06 -85% -1% 1% <1%
1.A.3.d Navigation 0.05 0.02 -61% -17% <1% <1%
1.A.3.e Other transportation NA NA NA NA NA NA
1.A.4 Other Sectors 32.94 1.66 -95% 14% 44% 11%
1.A.4.a Commercial/Institutional 5.24 0.23 -96% 37% 7% 2%
1.A.4.b Residential 25.92 1.32 -95% 11% 35% 9%
1.A.4.c Agriculture/Forestry/Fisheries 1.78 0.11 -94% 9% 2% 1%
1.A.5 Other 0.01 0.02 23% 1% <1% <1%
1.B FUGITIVE EMISSIONS FROM FUELS 2.00 0.04 -98% 8% 3% <1%
2 INDUSTRIAL PROCESSES AND PRODUCT USE
2.22 0.81 -63% -3% 3% 5%
2.A MINERAL PRODUCTS NA NA NA NA NA NA
2.B CHEMICAL INDUSTRY 1.56 0.37 -77% -7% 2% 2%
2.C METAL PRODUCTION 0.66 0.45 -32% <1% 1% 3%
2.D NON ENERGY PRODUCTS/ SOLVENTS NA NA NA NA NA NA
2.G Other product manufacture and use NA NA NA NA NA NA
2.H Other Processes NA NA NA NA NA NA
2.I Wood processing NA NA NA NA NA NA
2.J Production of POPs NO NO NO NO NO NO
2.K "Consumption of POPs and heavy metals NO NO NO NO NO NO
2.L Other production, consumption, storage, transportation or handling of bulk products
NO NO NO NO NO NO
3 AGRICULTURE 0.00 0.00 -75% -25% <1% <1%
5 WASTE 0.07 0.01 -87% <1% <1% <1%
Total without sinks 74.57 14.90 -87% <1%
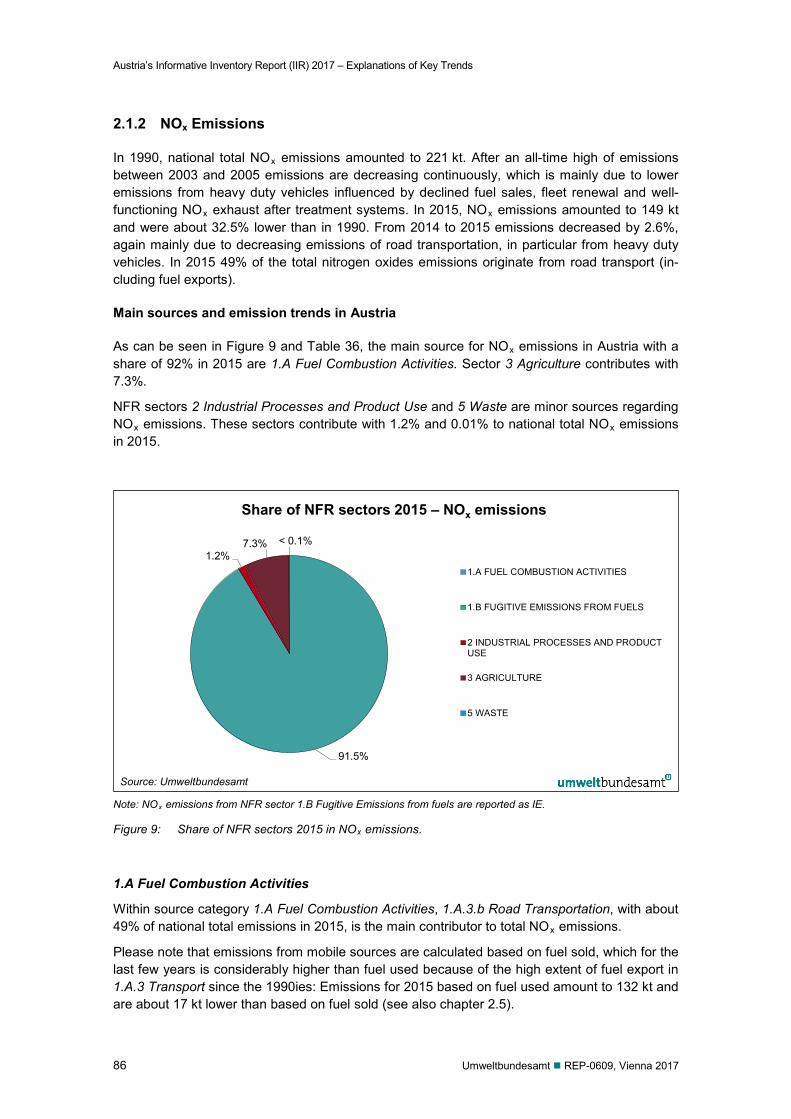
Austria’s Informative Inventory Report (IIR) 2017 – Explanations of Key Trends
86 Umweltbundesamt REP-0609, Vienna 2017
2.1.2 NOx Emissions
In 1990, national total NOx emissions amounted to 221 kt. After an all-time high of emissions between 2003 and 2005 emissions are decreasing continuously, which is mainly due to lower emissions from heavy duty vehicles influenced by declined fuel sales, fleet renewal and well-functioning NOx exhaust after treatment systems. In 2015, NOx emissions amounted to 149 kt and were about 32.5% lower than in 1990. From 2014 to 2015 emissions decreased by 2.6%, again mainly due to decreasing emissions of road transportation, in particular from heavy duty vehicles. In 2015 49% of the total nitrogen oxides emissions originate from road transport (in-cluding fuel exports).
Main sources and emission trends in Austria
As can be seen in Figure 9 and Table 36, the main source for NOx emissions in Austria with a share of 92% in 2015 are 1.A Fuel Combustion Activities. Sector 3 Agriculture contributes with 7.3%.
NFR sectors 2 Industrial Processes and Product Use and 5 Waste are minor sources regarding NOx emissions. These sectors contribute with 1.2% and 0.01% to national total NOx emissions in 2015.
Note: NOx emissions from NFR sector 1.B Fugitive Emissions from fuels are reported as IE.
Figure 9: Share of NFR sectors 2015 in NOx emissions.
1.A Fuel Combustion Activities
Within source category 1.A Fuel Combustion Activities, 1.A.3.b Road Transportation, with about 49% of national total emissions in 2015, is the main contributor to total NOx emissions.
Please note that emissions from mobile sources are calculated based on fuel sold, which for the last few years is considerably higher than fuel used because of the high extent of fuel export in 1.A.3 Transport since the 1990ies: Emissions for 2015 based on fuel used amount to 132 kt and are about 17 kt lower than based on fuel sold (see also chapter 2.5).
91.5%
1.2% 7.3% < 0.1%
Share of NFR sectors 2015 – NOx emissions
1.A FUEL COMBUSTION ACTIVITIES
1.B FUGITIVE EMISSIONS FROM FUELS
2 INDUSTRIAL PROCESSES AND PRODUCTUSE
3 AGRICULTURE
5 WASTE
Source: Umweltbundesamt
Austria’s Informative Inventory Report (IIR) 2017 – Explanations of Key Trends
Umweltbundesamt REP-0609, Vienna 2017 87
The most important NOx sources within NFR 1.A Fuel Combustion Activities are: NFR 1.A.3 Transport – in particular diesel-powered passenger cars and heavy duty traffic. In
passenger transport the number of diesel vehicles has rapidly increased since the 1990ies. Also mileage has increased in passenger and freight transport. While NMVOC and CO emis-sions from road transport have been reduced significantly since 1990 due to well-functioning after-treatment devices, NOx emissions increased up to 2003. Since then NOx emissions have shown a decreasing trend, which is due to a combination of several facts. First of all, NOx emissions from gasoline passenger cars are declining and are negligible now; second, NOx emissions from heavy duty vehicles have decreased significantly due to the above men-tioned well-functioning after-treatment devices (SCR, EGR). Additionally, NOx emissions from fuel export show a decreasing trend because of the rapid renewal rate of the transit fleet. Specific NOx emissions (NOx/km) from newly registered diesel passenger cars do not show the desired reduction rates though. A substantial reduction will only be realised with the intro-duction of specific nitrogen oxide catalysts for diesel vehicles.
NFR 1.A.2 Manufacturing Industries and Construction: NOx emissions have decreased com-pared to 1990 (-11.0%) mainly caused by increased efficiency, implementation/installation of denitrification installations (DENOX plant) and/or low-NOx burners, introduction of modern fuel technology, gas-fired equipments and furnaces. This is counterbalanced by a significant increase in energy consumption (also the use of biomass).
NFR 1.A.4 Other Sectors (mainly residential heating): NOx emissions decreased steadily be-tween 1990 and 2015 (-33%) mainly due to increased efficiency and modern fuel technology. From 2014 to 2015 NOX emissions from residential heating increased by 0.46 kt (+2.5%) due to an increased use of biomass.
3 Agriculture
Besides the main NOx emitter NFR sector 1.A Fuel Combustion Activities, sector 3 Agriculture is also a source of NOx emissions in Austria, although to a much lesser extent. It is responsible for 7.3% of national total NOx emissions in Austria in 2015. Within the Agriculture sector, source category 3.D Agricultural Soils is the biggest contributor with 97% in 2015. Emissions mainly re-sult from the application of N-fertilizers and organic waste (largely animal manure) on agricultur-al soils.
Since 1990 the agricultural NOx emissions decreased by 8.3%, mainly influenced by livestock numbers and N-fertilizer consumption. Compared to the previous year 2014 emissions slightly increased by 3.6%, which was due to higher mineral fertilizer consumption.
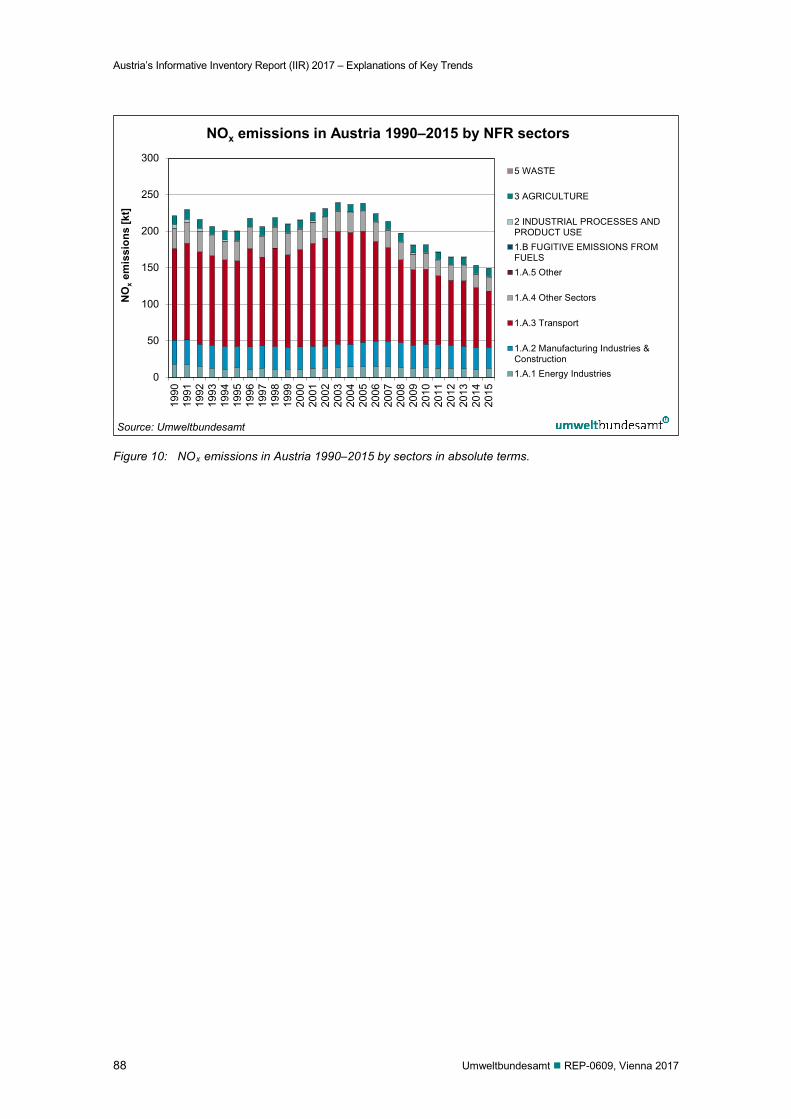
Austria’s Informative Inventory Report (IIR) 2017 – Explanations of Key Trends
88 Umweltbundesamt REP-0609, Vienna 2017
Figure 10: NOx emissions in Austria 1990–2015 by sectors in absolute terms.
0
50
100
150
200
250
30019
9019
9119
9219
9319
9419
9519
9619
9719
9819
9920
0020
0120
0220
0320
0420
0520
0620
0720
0820
0920
1020
1120
1220
1320
1420
15
NO
x em
issi
ons
[kt]
NOx emissions in Austria 1990–2015 by NFR sectors
5 WASTE
3 AGRICULTURE
2 INDUSTRIAL PROCESSES ANDPRODUCT USE1.B FUGITIVE EMISSIONS FROMFUELS1.A.5 Other
1.A.4 Other Sectors
1.A.3 Transport
1.A.2 Manufacturing Industries &Construction1.A.1 Energy Industries
Source: Umweltbundesamt
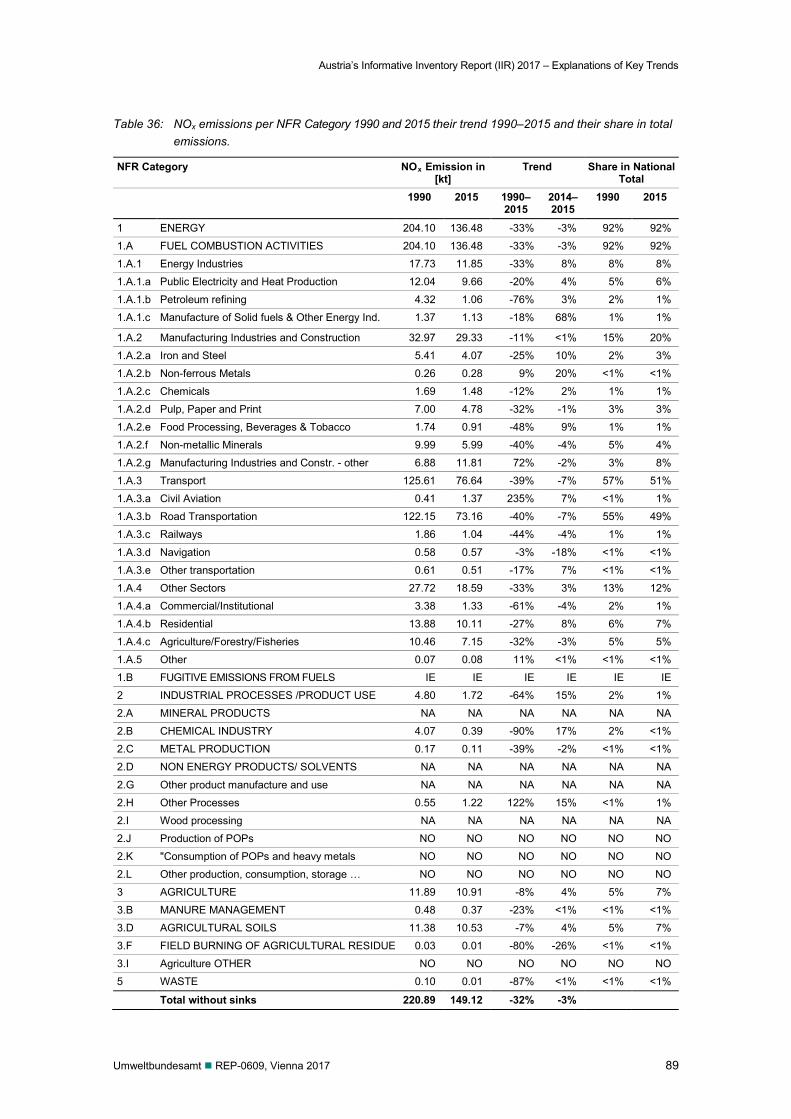
Austria’s Informative Inventory Report (IIR) 2017 – Explanations of Key Trends
Umweltbundesamt REP-0609, Vienna 2017 89
Table 36: NOx emissions per NFR Category 1990 and 2015 their trend 1990–2015 and their share in total emissions.
NFR Category NOx Emission in [kt]
Trend Share in National Total
1990 2015 1990–2015
2014–2015
1990 2015
1 ENERGY 204.10 136.48 -33% -3% 92% 92%
1.A FUEL COMBUSTION ACTIVITIES 204.10 136.48 -33% -3% 92% 92%
1.A.1 Energy Industries 17.73 11.85 -33% 8% 8% 8%
1.A.1.a Public Electricity and Heat Production 12.04 9.66 -20% 4% 5% 6%
1.A.1.b Petroleum refining 4.32 1.06 -76% 3% 2% 1%
1.A.1.c Manufacture of Solid fuels & Other Energy Ind. 1.37 1.13 -18% 68% 1% 1%
1.A.2 Manufacturing Industries and Construction 32.97 29.33 -11% <1% 15% 20%
1.A.2.a Iron and Steel 5.41 4.07 -25% 10% 2% 3%
1.A.2.b Non-ferrous Metals 0.26 0.28 9% 20% <1% <1%
1.A.2.c Chemicals 1.69 1.48 -12% 2% 1% 1%
1.A.2.d Pulp, Paper and Print 7.00 4.78 -32% -1% 3% 3%
1.A.2.e Food Processing, Beverages & Tobacco 1.74 0.91 -48% 9% 1% 1%
1.A.2.f Non-metallic Minerals 9.99 5.99 -40% -4% 5% 4%
1.A.2.g Manufacturing Industries and Constr. - other 6.88 11.81 72% -2% 3% 8%
1.A.3 Transport 125.61 76.64 -39% -7% 57% 51%
1.A.3.a Civil Aviation 0.41 1.37 235% 7% <1% 1%
1.A.3.b Road Transportation 122.15 73.16 -40% -7% 55% 49%
1.A.3.c Railways 1.86 1.04 -44% -4% 1% 1%
1.A.3.d Navigation 0.58 0.57 -3% -18% <1% <1%
1.A.3.e Other transportation 0.61 0.51 -17% 7% <1% <1%
1.A.4 Other Sectors 27.72 18.59 -33% 3% 13% 12%
1.A.4.a Commercial/Institutional 3.38 1.33 -61% -4% 2% 1%
1.A.4.b Residential 13.88 10.11 -27% 8% 6% 7%
1.A.4.c Agriculture/Forestry/Fisheries 10.46 7.15 -32% -3% 5% 5%
1.A.5 Other 0.07 0.08 11% <1% <1% <1%
1.B FUGITIVE EMISSIONS FROM FUELS IE IE IE IE IE IE
2 INDUSTRIAL PROCESSES /PRODUCT USE 4.80 1.72 -64% 15% 2% 1%
2.A MINERAL PRODUCTS NA NA NA NA NA NA
2.B CHEMICAL INDUSTRY 4.07 0.39 -90% 17% 2% <1%
2.C METAL PRODUCTION 0.17 0.11 -39% -2% <1% <1%
2.D NON ENERGY PRODUCTS/ SOLVENTS NA NA NA NA NA NA
2.G Other product manufacture and use NA NA NA NA NA NA
2.H Other Processes 0.55 1.22 122% 15% <1% 1%
2.I Wood processing NA NA NA NA NA NA
2.J Production of POPs NO NO NO NO NO NO
2.K "Consumption of POPs and heavy metals NO NO NO NO NO NO
2.L Other production, consumption, storage … NO NO NO NO NO NO
3 AGRICULTURE 11.89 10.91 -8% 4% 5% 7%
3.B MANURE MANAGEMENT 0.48 0.37 -23% <1% <1% <1%
3.D AGRICULTURAL SOILS 11.38 10.53 -7% 4% 5% 7%
3.F FIELD BURNING OF AGRICULTURAL RESIDUE 0.03 0.01 -80% -26% <1% <1%
3.I Agriculture OTHER NO NO NO NO NO NO
5 WASTE 0.10 0.01 -87% <1% <1% <1%
Total without sinks 220.89 149.12 -32% -3%
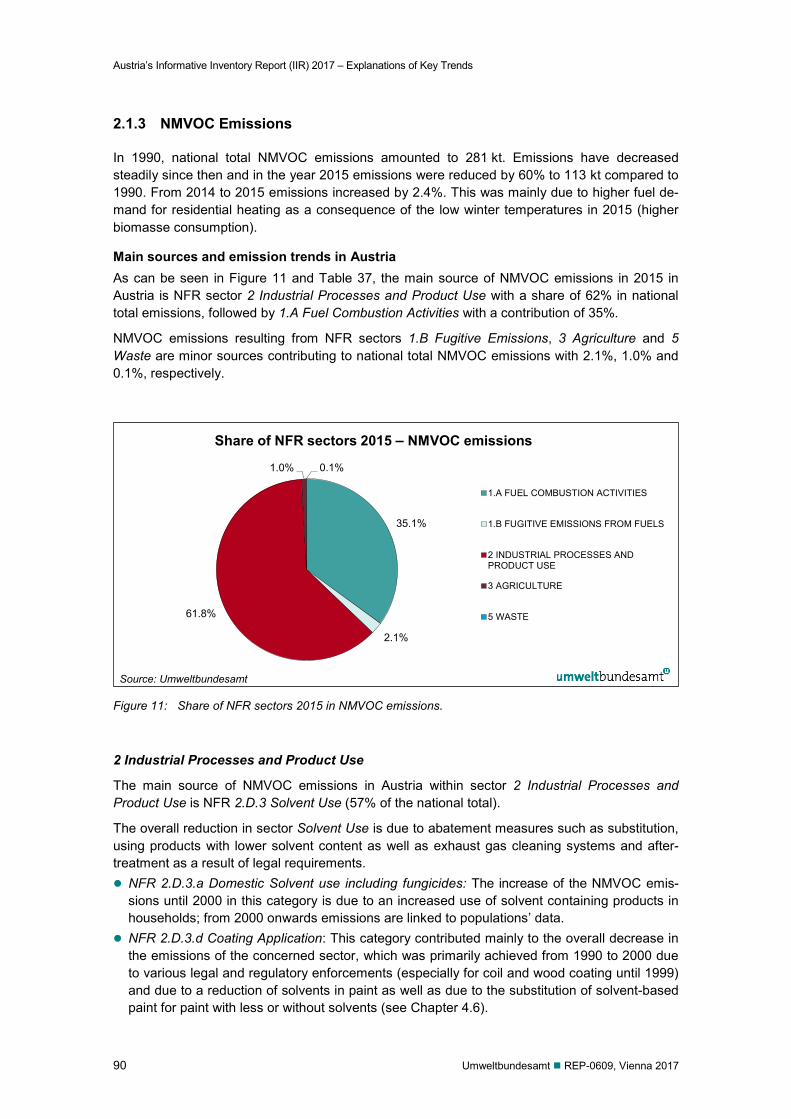
Austria’s Informative Inventory Report (IIR) 2017 – Explanations of Key Trends
90 Umweltbundesamt REP-0609, Vienna 2017
2.1.3 NMVOC Emissions
In 1990, national total NMVOC emissions amounted to 281 kt. Emissions have decreased steadily since then and in the year 2015 emissions were reduced by 60% to 113 kt compared to 1990. From 2014 to 2015 emissions increased by 2.4%. This was mainly due to higher fuel de-mand for residential heating as a consequence of the low winter temperatures in 2015 (higher biomasse consumption).
Main sources and emission trends in Austria As can be seen in Figure 11 and Table 37, the main source of NMVOC emissions in 2015 in Austria is NFR sector 2 Industrial Processes and Product Use with a share of 62% in national total emissions, followed by 1.A Fuel Combustion Activities with a contribution of 35%.
NMVOC emissions resulting from NFR sectors 1.B Fugitive Emissions, 3 Agriculture and 5 Waste are minor sources contributing to national total NMVOC emissions with 2.1%, 1.0% and 0.1%, respectively.
Figure 11: Share of NFR sectors 2015 in NMVOC emissions.
2 Industrial Processes and Product Use
The main source of NMVOC emissions in Austria within sector 2 Industrial Processes and Product Use is NFR 2.D.3 Solvent Use (57% of the national total).
The overall reduction in sector Solvent Use is due to abatement measures such as substitution, using products with lower solvent content as well as exhaust gas cleaning systems and after-treatment as a result of legal requirements. NFR 2.D.3.a Domestic Solvent use including fungicides: The increase of the NMVOC emis-
sions until 2000 in this category is due to an increased use of solvent containing products in households; from 2000 onwards emissions are linked to populations’ data.
NFR 2.D.3.d Coating Application: This category contributed mainly to the overall decrease in the emissions of the concerned sector, which was primarily achieved from 1990 to 2000 due to various legal and regulatory enforcements (especially for coil and wood coating until 1999) and due to a reduction of solvents in paint as well as due to the substitution of solvent-based paint for paint with less or without solvents (see Chapter 4.6).
35.1%
2.1%
61.8%
1.0% 0.1%
Share of NFR sectors 2015 – NMVOC emissions
1.A FUEL COMBUSTION ACTIVITIES
1.B FUGITIVE EMISSIONS FROM FUELS
2 INDUSTRIAL PROCESSES ANDPRODUCT USE
3 AGRICULTURE
5 WASTE
Source: Umweltbundesamt
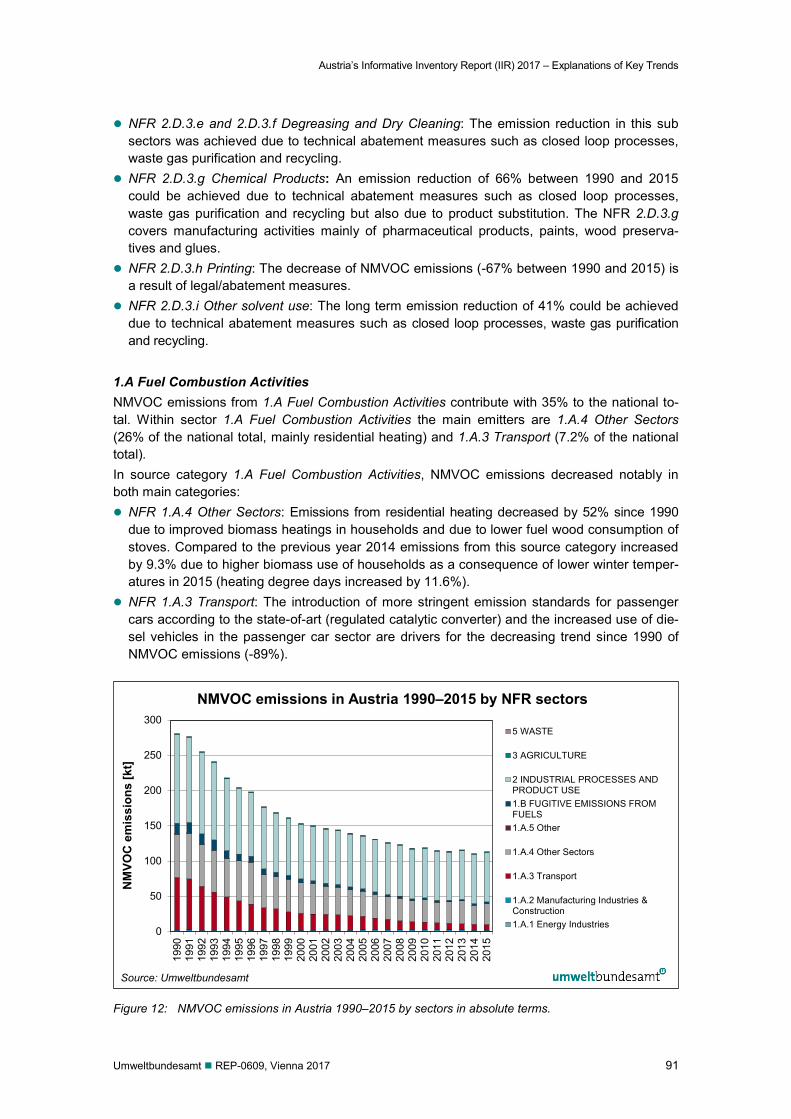
Austria’s Informative Inventory Report (IIR) 2017 – Explanations of Key Trends
Umweltbundesamt REP-0609, Vienna 2017 91
NFR 2.D.3.e and 2.D.3.f Degreasing and Dry Cleaning: The emission reduction in this sub sectors was achieved due to technical abatement measures such as closed loop processes, waste gas purification and recycling.
NFR 2.D.3.g Chemical Products: An emission reduction of 66% between 1990 and 2015 could be achieved due to technical abatement measures such as closed loop processes, waste gas purification and recycling but also due to product substitution. The NFR 2.D.3.g covers manufacturing activities mainly of pharmaceutical products, paints, wood preserva-tives and glues.
NFR 2.D.3.h Printing: The decrease of NMVOC emissions (-67% between 1990 and 2015) is a result of legal/abatement measures.
NFR 2.D.3.i Other solvent use: The long term emission reduction of 41% could be achieved due to technical abatement measures such as closed loop processes, waste gas purification and recycling.
1.A Fuel Combustion Activities NMVOC emissions from 1.A Fuel Combustion Activities contribute with 35% to the national to-tal. Within sector 1.A Fuel Combustion Activities the main emitters are 1.A.4 Other Sectors (26% of the national total, mainly residential heating) and 1.A.3 Transport (7.2% of the national total). In source category 1.A Fuel Combustion Activities, NMVOC emissions decreased notably in both main categories: NFR 1.A.4 Other Sectors: Emissions from residential heating decreased by 52% since 1990
due to improved biomass heatings in households and due to lower fuel wood consumption of stoves. Compared to the previous year 2014 emissions from this source category increased by 9.3% due to higher biomass use of households as a consequence of lower winter temper-atures in 2015 (heating degree days increased by 11.6%).
NFR 1.A.3 Transport: The introduction of more stringent emission standards for passenger cars according to the state-of-art (regulated catalytic converter) and the increased use of die-sel vehicles in the passenger car sector are drivers for the decreasing trend since 1990 of NMVOC emissions (-89%).
Figure 12: NMVOC emissions in Austria 1990–2015 by sectors in absolute terms.
0
50
100
150
200
250
300
1990
1991
1992
1993
1994
1995
1996
1997
1998
1999
2000
2001
2002
2003
2004
2005
2006
2007
2008
2009
2010
2011
2012
2013
2014
2015
NM
VOC
em
issi
ons
[kt]
NMVOC emissions in Austria 1990–2015 by NFR sectors
5 WASTE
3 AGRICULTURE
2 INDUSTRIAL PROCESSES ANDPRODUCT USE1.B FUGITIVE EMISSIONS FROMFUELS1.A.5 Other
1.A.4 Other Sectors
1.A.3 Transport
1.A.2 Manufacturing Industries &Construction1.A.1 Energy Industries
Source: Umweltbundesamt
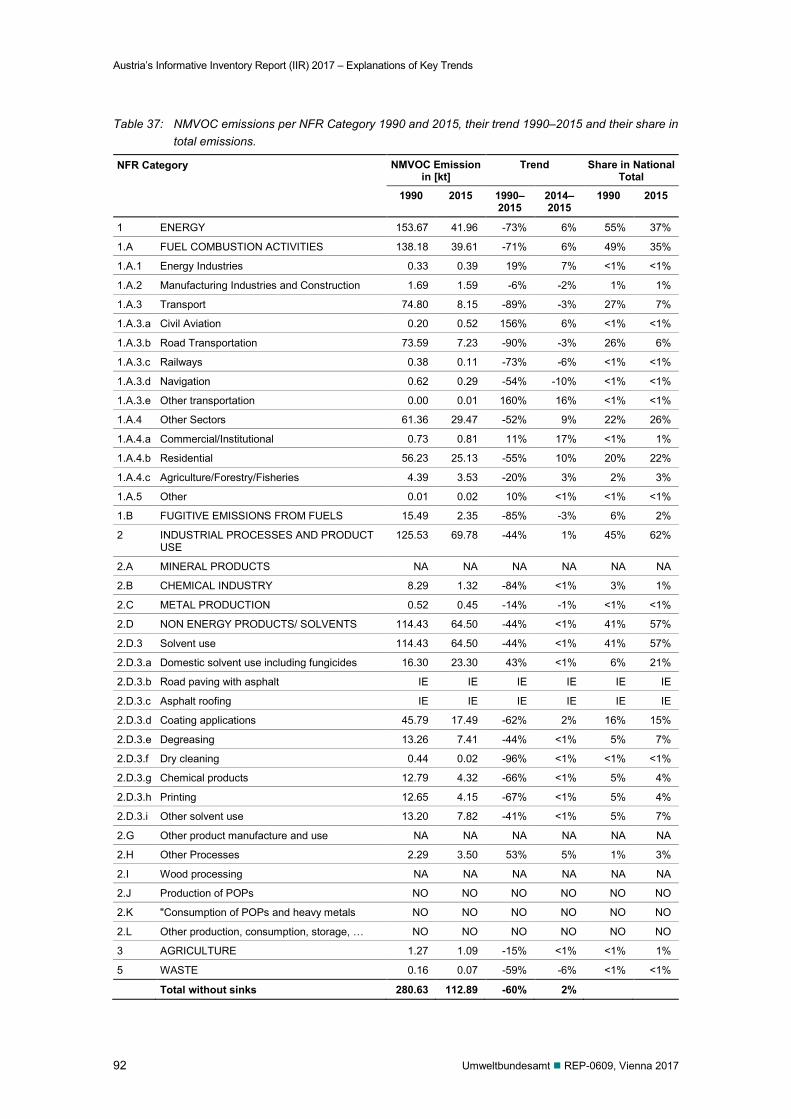
Austria’s Informative Inventory Report (IIR) 2017 – Explanations of Key Trends
92 Umweltbundesamt REP-0609, Vienna 2017
Table 37: NMVOC emissions per NFR Category 1990 and 2015, their trend 1990–2015 and their share in total emissions.
NFR Category NMVOC Emission in [kt]
Trend Share in National Total
1990 2015 1990–2015
2014–2015
1990 2015
1 ENERGY 153.67 41.96 -73% 6% 55% 37%
1.A FUEL COMBUSTION ACTIVITIES 138.18 39.61 -71% 6% 49% 35%
1.A.1 Energy Industries 0.33 0.39 19% 7% <1% <1%
1.A.2 Manufacturing Industries and Construction 1.69 1.59 -6% -2% 1% 1%
1.A.3 Transport 74.80 8.15 -89% -3% 27% 7%
1.A.3.a Civil Aviation 0.20 0.52 156% 6% <1% <1%
1.A.3.b Road Transportation 73.59 7.23 -90% -3% 26% 6%
1.A.3.c Railways 0.38 0.11 -73% -6% <1% <1%
1.A.3.d Navigation 0.62 0.29 -54% -10% <1% <1%
1.A.3.e Other transportation 0.00 0.01 160% 16% <1% <1%
1.A.4 Other Sectors 61.36 29.47 -52% 9% 22% 26%
1.A.4.a Commercial/Institutional 0.73 0.81 11% 17% <1% 1%
1.A.4.b Residential 56.23 25.13 -55% 10% 20% 22%
1.A.4.c Agriculture/Forestry/Fisheries 4.39 3.53 -20% 3% 2% 3%
1.A.5 Other 0.01 0.02 10% <1% <1% <1%
1.B FUGITIVE EMISSIONS FROM FUELS 15.49 2.35 -85% -3% 6% 2%
2 INDUSTRIAL PROCESSES AND PRODUCT USE
125.53 69.78 -44% 1% 45% 62%
2.A MINERAL PRODUCTS NA NA NA NA NA NA
2.B CHEMICAL INDUSTRY 8.29 1.32 -84% <1% 3% 1%
2.C METAL PRODUCTION 0.52 0.45 -14% -1% <1% <1%
2.D NON ENERGY PRODUCTS/ SOLVENTS 114.43 64.50 -44% <1% 41% 57%
2.D.3 Solvent use 114.43 64.50 -44% <1% 41% 57%
2.D.3.a Domestic solvent use including fungicides 16.30 23.30 43% <1% 6% 21%
2.D.3.b Road paving with asphalt IE IE IE IE IE IE
2.D.3.c Asphalt roofing IE IE IE IE IE IE
2.D.3.d Coating applications 45.79 17.49 -62% 2% 16% 15%
2.D.3.e Degreasing 13.26 7.41 -44% <1% 5% 7%
2.D.3.f Dry cleaning 0.44 0.02 -96% <1% <1% <1%
2.D.3.g Chemical products 12.79 4.32 -66% <1% 5% 4%
2.D.3.h Printing 12.65 4.15 -67% <1% 5% 4%
2.D.3.i Other solvent use 13.20 7.82 -41% <1% 5% 7%
2.G Other product manufacture and use NA NA NA NA NA NA
2.H Other Processes 2.29 3.50 53% 5% 1% 3%
2.I Wood processing NA NA NA NA NA NA
2.J Production of POPs NO NO NO NO NO NO
2.K "Consumption of POPs and heavy metals NO NO NO NO NO NO
2.L Other production, consumption, storage, … NO NO NO NO NO NO
3 AGRICULTURE 1.27 1.09 -15% <1% <1% 1%
5 WASTE 0.16 0.07 -59% -6% <1% <1%
Total without sinks 280.63 112.89 -60% 2%
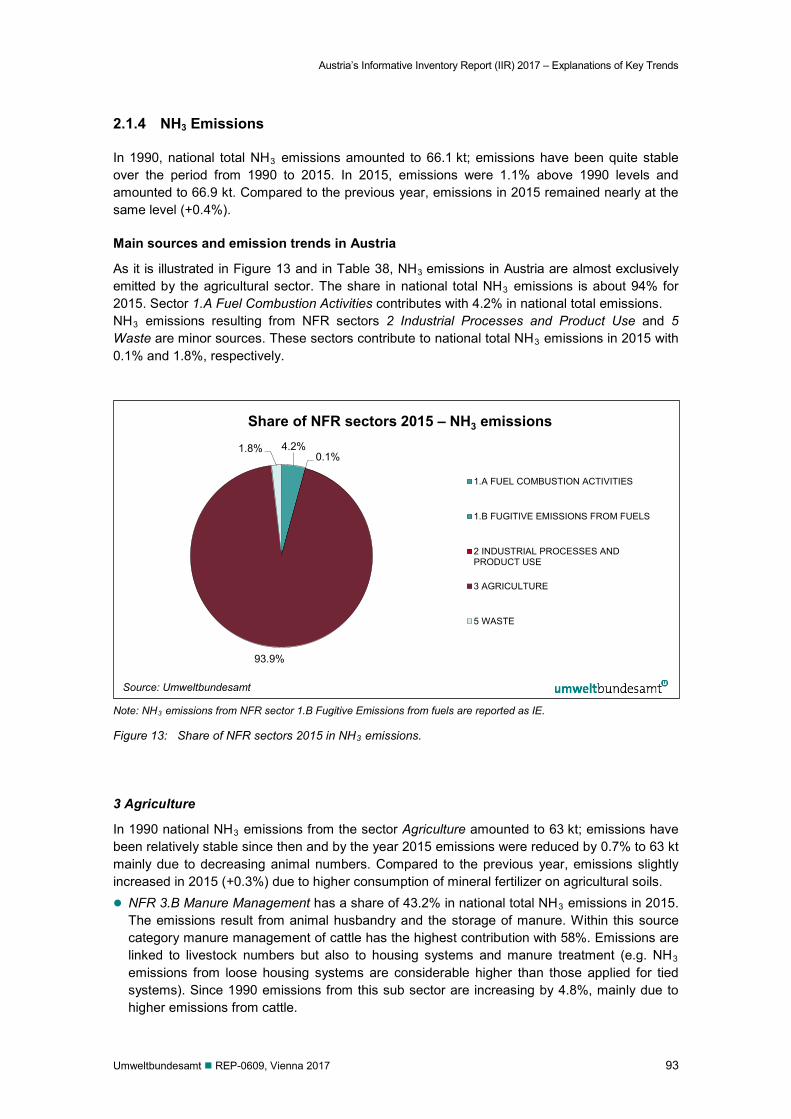
Austria’s Informative Inventory Report (IIR) 2017 – Explanations of Key Trends
Umweltbundesamt REP-0609, Vienna 2017 93
2.1.4 NH3 Emissions
In 1990, national total NH3 emissions amounted to 66.1 kt; emissions have been quite stable over the period from 1990 to 2015. In 2015, emissions were 1.1% above 1990 levels and amounted to 66.9 kt. Compared to the previous year, emissions in 2015 remained nearly at the same level (+0.4%).
Main sources and emission trends in Austria
As it is illustrated in Figure 13 and in Table 38, NH3 emissions in Austria are almost exclusively emitted by the agricultural sector. The share in national total NH3 emissions is about 94% for 2015. Sector 1.A Fuel Combustion Activities contributes with 4.2% in national total emissions. NH3 emissions resulting from NFR sectors 2 Industrial Processes and Product Use and 5 Waste are minor sources. These sectors contribute to national total NH3 emissions in 2015 with 0.1% and 1.8%, respectively.
Note: NH3 emissions from NFR sector 1.B Fugitive Emissions from fuels are reported as IE.
Figure 13: Share of NFR sectors 2015 in NH3 emissions.
3 Agriculture
In 1990 national NH3 emissions from the sector Agriculture amounted to 63 kt; emissions have been relatively stable since then and by the year 2015 emissions were reduced by 0.7% to 63 kt mainly due to decreasing animal numbers. Compared to the previous year, emissions slightly increased in 2015 (+0.3%) due to higher consumption of mineral fertilizer on agricultural soils. NFR 3.B Manure Management has a share of 43.2% in national total NH3 emissions in 2015.
The emissions result from animal husbandry and the storage of manure. Within this source category manure management of cattle has the highest contribution with 58%. Emissions are linked to livestock numbers but also to housing systems and manure treatment (e.g. NH3 emissions from loose housing systems are considerable higher than those applied for tied systems). Since 1990 emissions from this sub sector are increasing by 4.8%, mainly due to higher emissions from cattle.
4.2% 0.1%
93.9%
1.8%
Share of NFR sectors 2015 – NH3 emissions
1.A FUEL COMBUSTION ACTIVITIES
1.B FUGITIVE EMISSIONS FROM FUELS
2 INDUSTRIAL PROCESSES ANDPRODUCT USE
3 AGRICULTURE
5 WASTE
Source: Umweltbundesamt
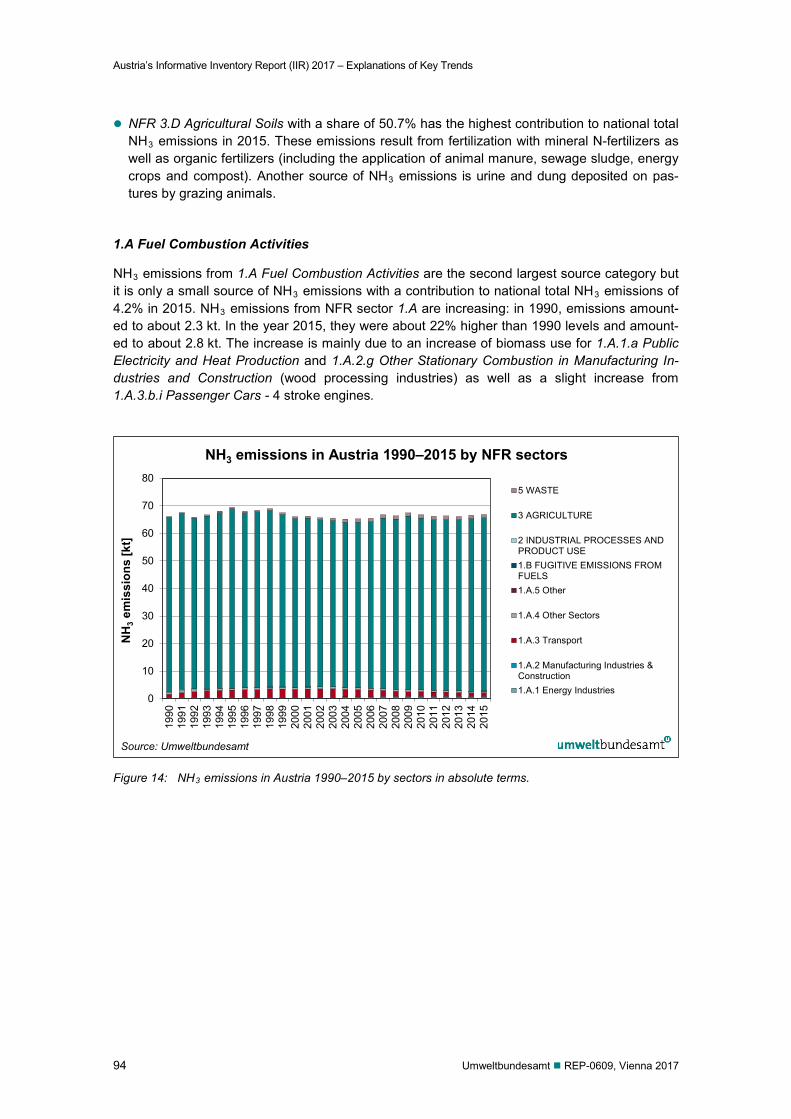
Austria’s Informative Inventory Report (IIR) 2017 – Explanations of Key Trends
94 Umweltbundesamt REP-0609, Vienna 2017
NFR 3.D Agricultural Soils with a share of 50.7% has the highest contribution to national total NH3 emissions in 2015. These emissions result from fertilization with mineral N-fertilizers as well as organic fertilizers (including the application of animal manure, sewage sludge, energy crops and compost). Another source of NH3 emissions is urine and dung deposited on pas-tures by grazing animals.
1.A Fuel Combustion Activities
NH3 emissions from 1.A Fuel Combustion Activities are the second largest source category but it is only a small source of NH3 emissions with a contribution to national total NH3 emissions of 4.2% in 2015. NH3 emissions from NFR sector 1.A are increasing: in 1990, emissions amount-ed to about 2.3 kt. In the year 2015, they were about 22% higher than 1990 levels and amount-ed to about 2.8 kt. The increase is mainly due to an increase of biomass use for 1.A.1.a Public Electricity and Heat Production and 1.A.2.g Other Stationary Combustion in Manufacturing In-dustries and Construction (wood processing industries) as well as a slight increase from 1.A.3.b.i Passenger Cars - 4 stroke engines.
Figure 14: NH3 emissions in Austria 1990–2015 by sectors in absolute terms.
0
10
20
30
40
50
60
70
80
1990
1991
1992
1993
1994
1995
1996
1997
1998
1999
2000
2001
2002
2003
2004
2005
2006
2007
2008
2009
2010
2011
2012
2013
2014
2015
NH
3 em
issi
ons
[kt]
NH3 emissions in Austria 1990–2015 by NFR sectors
5 WASTE
3 AGRICULTURE
2 INDUSTRIAL PROCESSES ANDPRODUCT USE1.B FUGITIVE EMISSIONS FROMFUELS1.A.5 Other
1.A.4 Other Sectors
1.A.3 Transport
1.A.2 Manufacturing Industries &Construction1.A.1 Energy Industries
Source: Umweltbundesamt
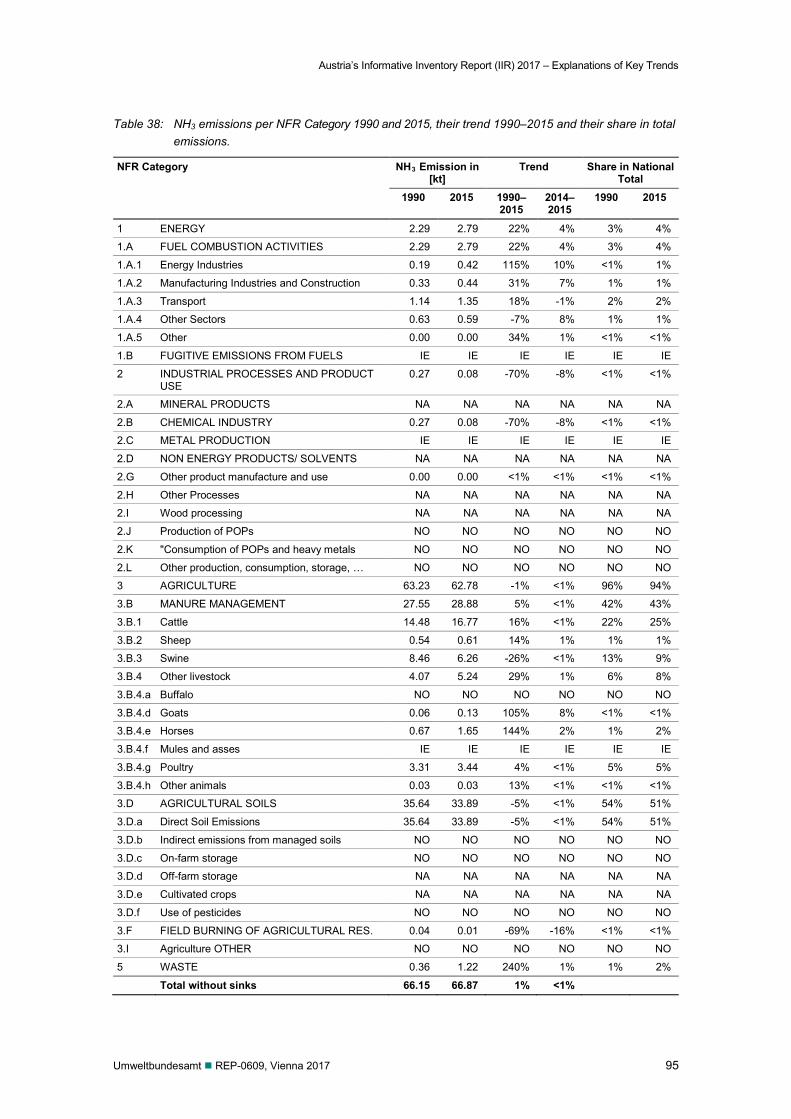
Austria’s Informative Inventory Report (IIR) 2017 – Explanations of Key Trends
Umweltbundesamt REP-0609, Vienna 2017 95
Table 38: NH3 emissions per NFR Category 1990 and 2015, their trend 1990–2015 and their share in total emissions.
NFR Category NH3 Emission in [kt]
Trend Share in National Total
1990 2015 1990–2015
2014–2015
1990 2015
1 ENERGY 2.29 2.79 22% 4% 3% 4%
1.A FUEL COMBUSTION ACTIVITIES 2.29 2.79 22% 4% 3% 4%
1.A.1 Energy Industries 0.19 0.42 115% 10% <1% 1%
1.A.2 Manufacturing Industries and Construction 0.33 0.44 31% 7% 1% 1%
1.A.3 Transport 1.14 1.35 18% -1% 2% 2%
1.A.4 Other Sectors 0.63 0.59 -7% 8% 1% 1%
1.A.5 Other 0.00 0.00 34% 1% <1% <1%
1.B FUGITIVE EMISSIONS FROM FUELS IE IE IE IE IE IE
2 INDUSTRIAL PROCESSES AND PRODUCT USE
0.27 0.08 -70% -8% <1% <1%
2.A MINERAL PRODUCTS NA NA NA NA NA NA
2.B CHEMICAL INDUSTRY 0.27 0.08 -70% -8% <1% <1%
2.C METAL PRODUCTION IE IE IE IE IE IE
2.D NON ENERGY PRODUCTS/ SOLVENTS NA NA NA NA NA NA
2.G Other product manufacture and use 0.00 0.00 <1% <1% <1% <1%
2.H Other Processes NA NA NA NA NA NA
2.I Wood processing NA NA NA NA NA NA
2.J Production of POPs NO NO NO NO NO NO
2.K "Consumption of POPs and heavy metals NO NO NO NO NO NO
2.L Other production, consumption, storage, … NO NO NO NO NO NO
3 AGRICULTURE 63.23 62.78 -1% <1% 96% 94%
3.B MANURE MANAGEMENT 27.55 28.88 5% <1% 42% 43%
3.B.1 Cattle 14.48 16.77 16% <1% 22% 25%
3.B.2 Sheep 0.54 0.61 14% 1% 1% 1%
3.B.3 Swine 8.46 6.26 -26% <1% 13% 9%
3.B.4 Other livestock 4.07 5.24 29% 1% 6% 8%
3.B.4.a Buffalo NO NO NO NO NO NO
3.B.4.d Goats 0.06 0.13 105% 8% <1% <1%
3.B.4.e Horses 0.67 1.65 144% 2% 1% 2%
3.B.4.f Mules and asses IE IE IE IE IE IE
3.B.4.g Poultry 3.31 3.44 4% <1% 5% 5%
3.B.4.h Other animals 0.03 0.03 13% <1% <1% <1%
3.D AGRICULTURAL SOILS 35.64 33.89 -5% <1% 54% 51%
3.D.a Direct Soil Emissions 35.64 33.89 -5% <1% 54% 51%
3.D.b Indirect emissions from managed soils NO NO NO NO NO NO
3.D.c On-farm storage NO NO NO NO NO NO
3.D.d Off-farm storage NA NA NA NA NA NA
3.D.e Cultivated crops NA NA NA NA NA NA
3.D.f Use of pesticides NO NO NO NO NO NO
3.F FIELD BURNING OF AGRICULTURAL RES. 0.04 0.01 -69% -16% <1% <1%
3.I Agriculture OTHER NO NO NO NO NO NO
5 WASTE 0.36 1.22 240% 1% 1% 2%
Total without sinks 66.15 66.87 1% <1%
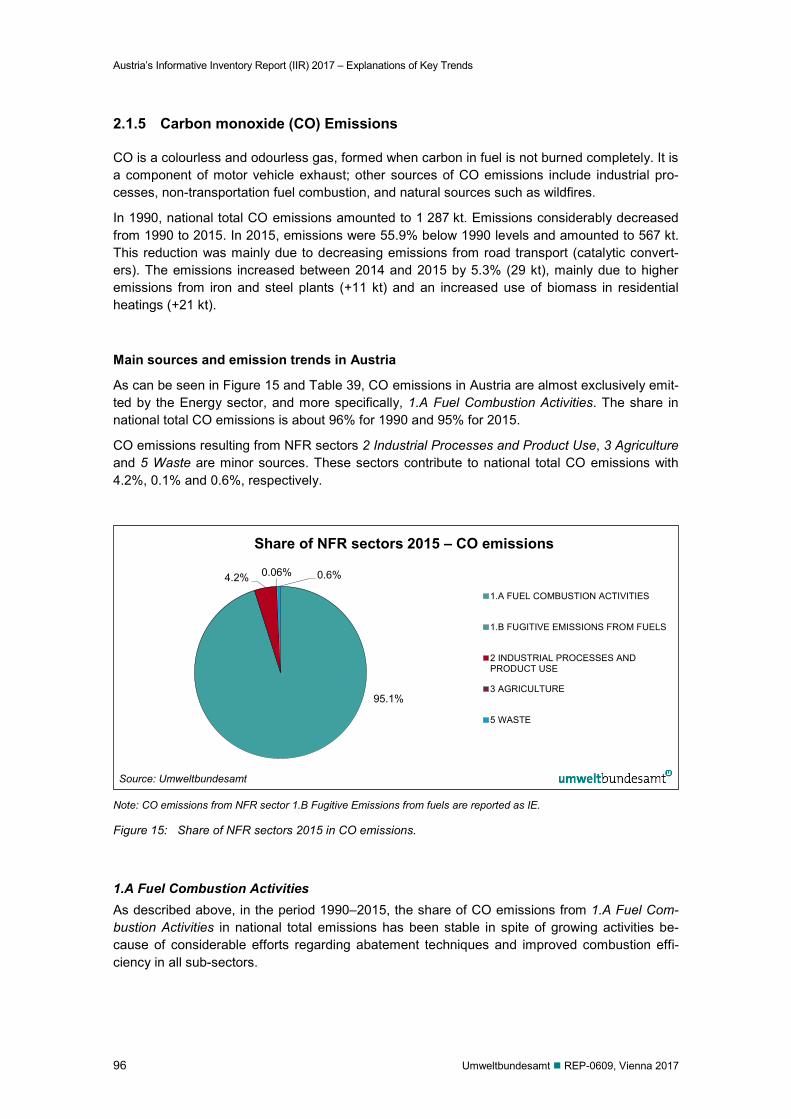
Austria’s Informative Inventory Report (IIR) 2017 – Explanations of Key Trends
96 Umweltbundesamt REP-0609, Vienna 2017
2.1.5 Carbon monoxide (CO) Emissions
CO is a colourless and odourless gas, formed when carbon in fuel is not burned completely. It is a component of motor vehicle exhaust; other sources of CO emissions include industrial pro-cesses, non-transportation fuel combustion, and natural sources such as wildfires.
In 1990, national total CO emissions amounted to 1 287 kt. Emissions considerably decreased from 1990 to 2015. In 2015, emissions were 55.9% below 1990 levels and amounted to 567 kt. This reduction was mainly due to decreasing emissions from road transport (catalytic convert-ers). The emissions increased between 2014 and 2015 by 5.3% (29 kt), mainly due to higher emissions from iron and steel plants (+11 kt) and an increased use of biomass in residential heatings (+21 kt).
Main sources and emission trends in Austria
As can be seen in Figure 15 and Table 39, CO emissions in Austria are almost exclusively emit-ted by the Energy sector, and more specifically, 1.A Fuel Combustion Activities. The share in national total CO emissions is about 96% for 1990 and 95% for 2015.
CO emissions resulting from NFR sectors 2 Industrial Processes and Product Use, 3 Agriculture and 5 Waste are minor sources. These sectors contribute to national total CO emissions with 4.2%, 0.1% and 0.6%, respectively.
Note: CO emissions from NFR sector 1.B Fugitive Emissions from fuels are reported as IE.
Figure 15: Share of NFR sectors 2015 in CO emissions.
1.A Fuel Combustion Activities As described above, in the period 1990–2015, the share of CO emissions from 1.A Fuel Com-bustion Activities in national total emissions has been stable in spite of growing activities be-cause of considerable efforts regarding abatement techniques and improved combustion effi-ciency in all sub-sectors.
95.1%
4.2% 0.06% 0.6%
Share of NFR sectors 2015 – CO emissions
1.A FUEL COMBUSTION ACTIVITIES
1.B FUGITIVE EMISSIONS FROM FUELS
2 INDUSTRIAL PROCESSES ANDPRODUCT USE
3 AGRICULTURE
5 WASTE
Source: Umweltbundesamt
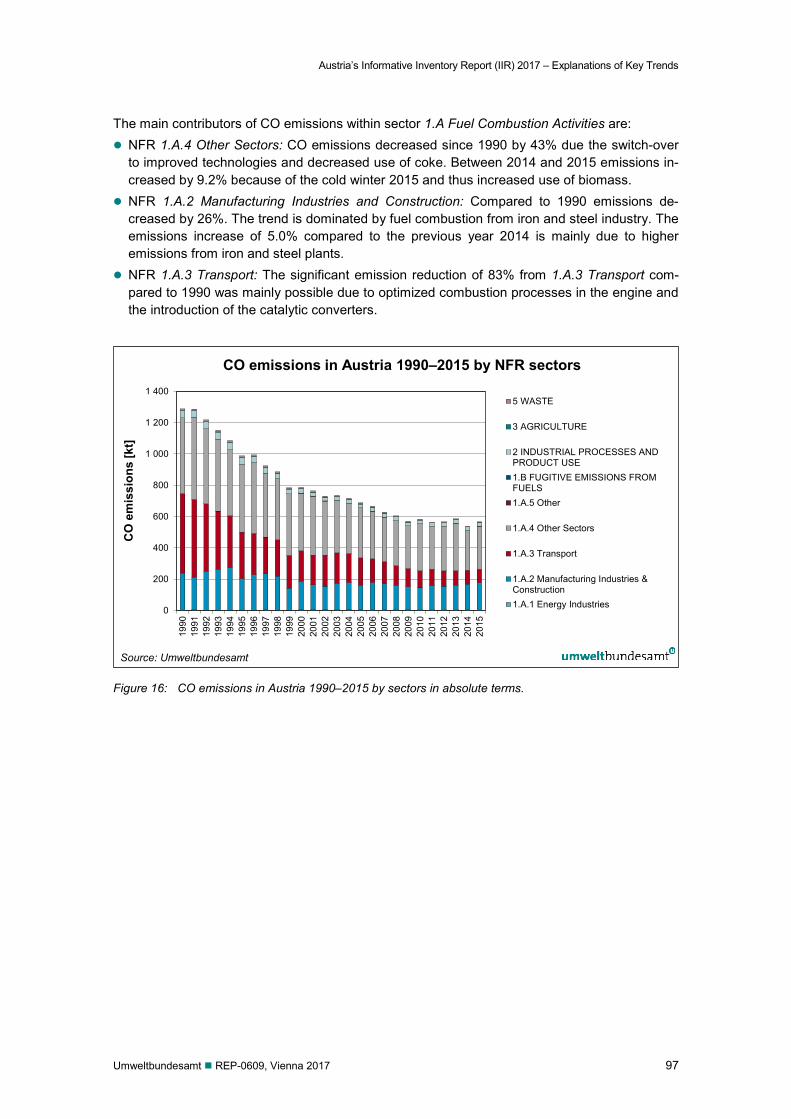
Austria’s Informative Inventory Report (IIR) 2017 – Explanations of Key Trends
Umweltbundesamt REP-0609, Vienna 2017 97
The main contributors of CO emissions within sector 1.A Fuel Combustion Activities are: NFR 1.A.4 Other Sectors: CO emissions decreased since 1990 by 43% due the switch-over
to improved technologies and decreased use of coke. Between 2014 and 2015 emissions in-creased by 9.2% because of the cold winter 2015 and thus increased use of biomass.
NFR 1.A.2 Manufacturing Industries and Construction: Compared to 1990 emissions de-creased by 26%. The trend is dominated by fuel combustion from iron and steel industry. The emissions increase of 5.0% compared to the previous year 2014 is mainly due to higher emissions from iron and steel plants.
NFR 1.A.3 Transport: The significant emission reduction of 83% from 1.A.3 Transport com-pared to 1990 was mainly possible due to optimized combustion processes in the engine and the introduction of the catalytic converters.
Figure 16: CO emissions in Austria 1990–2015 by sectors in absolute terms.
0
200
400
600
800
1 000
1 200
1 400
1990
1991
1992
1993
1994
1995
1996
1997
1998
1999
2000
2001
2002
2003
2004
2005
2006
2007
2008
2009
2010
2011
2012
2013
2014
2015
CO
em
issi
ons
[kt]
CO emissions in Austria 1990–2015 by NFR sectors
5 WASTE
3 AGRICULTURE
2 INDUSTRIAL PROCESSES ANDPRODUCT USE1.B FUGITIVE EMISSIONS FROMFUELS1.A.5 Other
1.A.4 Other Sectors
1.A.3 Transport
1.A.2 Manufacturing Industries &Construction1.A.1 Energy Industries
Source: Umweltbundesamt
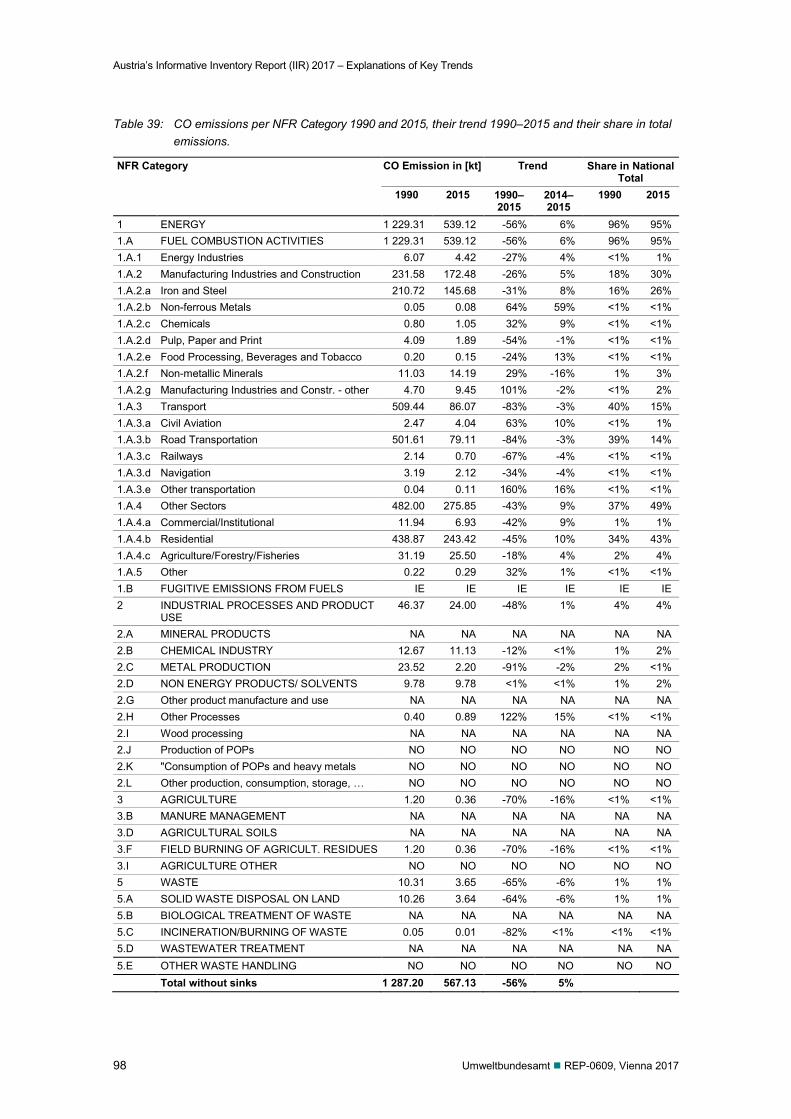
Austria’s Informative Inventory Report (IIR) 2017 – Explanations of Key Trends
98 Umweltbundesamt REP-0609, Vienna 2017
Table 39: CO emissions per NFR Category 1990 and 2015, their trend 1990–2015 and their share in total emissions.
NFR Category CO Emission in [kt] Trend Share in National Total
1990 2015 1990–2015
2014–2015
1990 2015
1 ENERGY 1 229.31 539.12 -56% 6% 96% 95% 1.A FUEL COMBUSTION ACTIVITIES 1 229.31 539.12 -56% 6% 96% 95% 1.A.1 Energy Industries 6.07 4.42 -27% 4% <1% 1% 1.A.2 Manufacturing Industries and Construction 231.58 172.48 -26% 5% 18% 30% 1.A.2.a Iron and Steel 210.72 145.68 -31% 8% 16% 26% 1.A.2.b Non-ferrous Metals 0.05 0.08 64% 59% <1% <1% 1.A.2.c Chemicals 0.80 1.05 32% 9% <1% <1% 1.A.2.d Pulp, Paper and Print 4.09 1.89 -54% -1% <1% <1% 1.A.2.e Food Processing, Beverages and Tobacco 0.20 0.15 -24% 13% <1% <1% 1.A.2.f Non-metallic Minerals 11.03 14.19 29% -16% 1% 3% 1.A.2.g Manufacturing Industries and Constr. - other 4.70 9.45 101% -2% <1% 2% 1.A.3 Transport 509.44 86.07 -83% -3% 40% 15% 1.A.3.a Civil Aviation 2.47 4.04 63% 10% <1% 1% 1.A.3.b Road Transportation 501.61 79.11 -84% -3% 39% 14% 1.A.3.c Railways 2.14 0.70 -67% -4% <1% <1% 1.A.3.d Navigation 3.19 2.12 -34% -4% <1% <1% 1.A.3.e Other transportation 0.04 0.11 160% 16% <1% <1% 1.A.4 Other Sectors 482.00 275.85 -43% 9% 37% 49% 1.A.4.a Commercial/Institutional 11.94 6.93 -42% 9% 1% 1% 1.A.4.b Residential 438.87 243.42 -45% 10% 34% 43% 1.A.4.c Agriculture/Forestry/Fisheries 31.19 25.50 -18% 4% 2% 4% 1.A.5 Other 0.22 0.29 32% 1% <1% <1% 1.B FUGITIVE EMISSIONS FROM FUELS IE IE IE IE IE IE 2 INDUSTRIAL PROCESSES AND PRODUCT
USE 46.37 24.00 -48% 1% 4% 4%
2.A MINERAL PRODUCTS NA NA NA NA NA NA 2.B CHEMICAL INDUSTRY 12.67 11.13 -12% <1% 1% 2% 2.C METAL PRODUCTION 23.52 2.20 -91% -2% 2% <1% 2.D NON ENERGY PRODUCTS/ SOLVENTS 9.78 9.78 <1% <1% 1% 2% 2.G Other product manufacture and use NA NA NA NA NA NA 2.H Other Processes 0.40 0.89 122% 15% <1% <1% 2.I Wood processing NA NA NA NA NA NA 2.J Production of POPs NO NO NO NO NO NO 2.K "Consumption of POPs and heavy metals NO NO NO NO NO NO 2.L Other production, consumption, storage, … NO NO NO NO NO NO 3 AGRICULTURE 1.20 0.36 -70% -16% <1% <1% 3.B MANURE MANAGEMENT NA NA NA NA NA NA 3.D AGRICULTURAL SOILS NA NA NA NA NA NA 3.F FIELD BURNING OF AGRICULT. RESIDUES 1.20 0.36 -70% -16% <1% <1% 3.I AGRICULTURE OTHER NO NO NO NO NO NO 5 WASTE 10.31 3.65 -65% -6% 1% 1% 5.A SOLID WASTE DISPOSAL ON LAND 10.26 3.64 -64% -6% 1% 1% 5.B BIOLOGICAL TREATMENT OF WASTE NA NA NA NA NA NA 5.C INCINERATION/BURNING OF WASTE 0.05 0.01 -82% <1% <1% <1% 5.D WASTEWATER TREATMENT NA NA NA NA NA NA 5.E OTHER WASTE HANDLING NO NO NO NO NO NO Total without sinks 1 287.20 567.13 -56% 5%
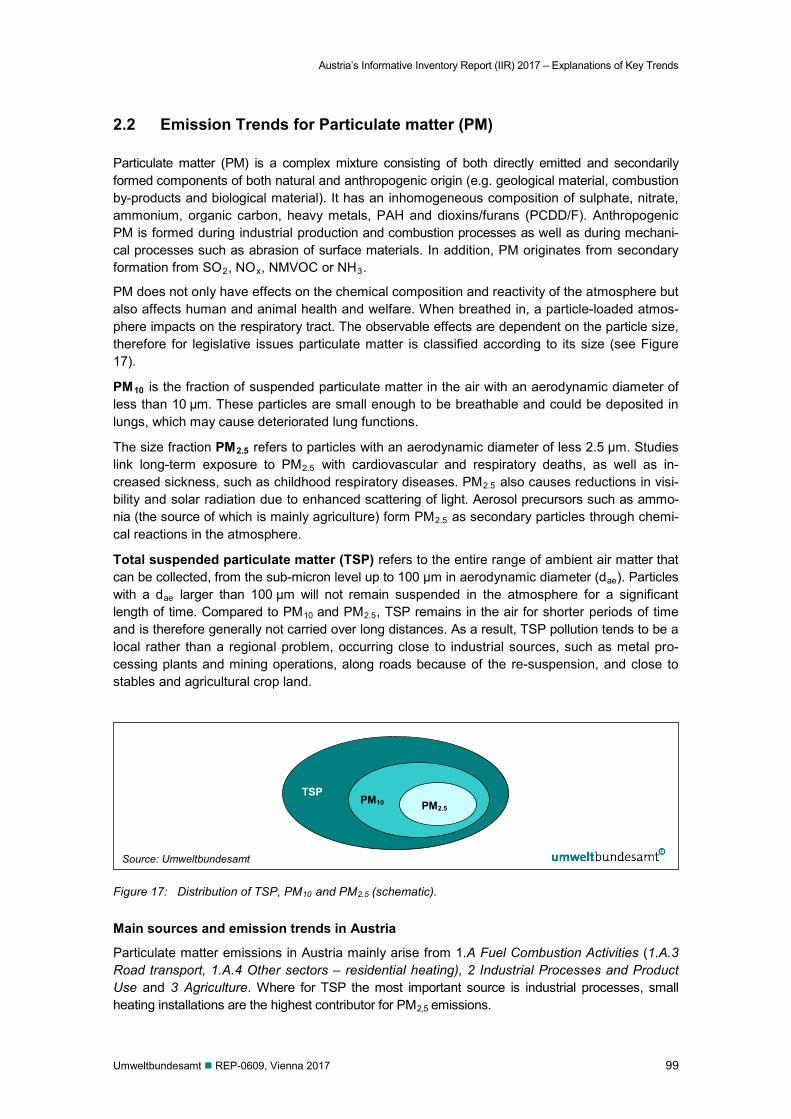
Austria’s Informative Inventory Report (IIR) 2017 – Explanations of Key Trends
Umweltbundesamt REP-0609, Vienna 2017 99
2.2 Emission Trends for Particulate matter (PM)
Particulate matter (PM) is a complex mixture consisting of both directly emitted and secondarily formed components of both natural and anthropogenic origin (e.g. geological material, combustion by-products and biological material). It has an inhomogeneous composition of sulphate, nitrate, ammonium, organic carbon, heavy metals, PAH and dioxins/furans (PCDD/F). Anthropogenic PM is formed during industrial production and combustion processes as well as during mechani-cal processes such as abrasion of surface materials. In addition, PM originates from secondary formation from SO2, NOx, NMVOC or NH3.
PM does not only have effects on the chemical composition and reactivity of the atmosphere but also affects human and animal health and welfare. When breathed in, a particle-loaded atmos-phere impacts on the respiratory tract. The observable effects are dependent on the particle size, therefore for legislative issues particulate matter is classified according to its size (see Figure 17).
PM10 is the fraction of suspended particulate matter in the air with an aerodynamic diameter of less than 10 μm. These particles are small enough to be breathable and could be deposited in lungs, which may cause deteriorated lung functions.
The size fraction PM2.5 refers to particles with an aerodynamic diameter of less 2.5 μm. Studies link long-term exposure to PM2.5 with cardiovascular and respiratory deaths, as well as in-creased sickness, such as childhood respiratory diseases. PM2.5 also causes reductions in visi-bility and solar radiation due to enhanced scattering of light. Aerosol precursors such as ammo-nia (the source of which is mainly agriculture) form PM2.5 as secondary particles through chemi-cal reactions in the atmosphere.
Total suspended particulate matter (TSP) refers to the entire range of ambient air matter that can be collected, from the sub-micron level up to 100 μm in aerodynamic diameter (dae). Particles with a dae larger than 100 μm will not remain suspended in the atmosphere for a significant length of time. Compared to PM10 and PM2.5, TSP remains in the air for shorter periods of time and is therefore generally not carried over long distances. As a result, TSP pollution tends to be a local rather than a regional problem, occurring close to industrial sources, such as metal pro-cessing plants and mining operations, along roads because of the re-suspension, and close to stables and agricultural crop land.
Figure 17: Distribution of TSP, PM10 and PM2.5 (schematic).
Main sources and emission trends in Austria
Particulate matter emissions in Austria mainly arise from 1.A Fuel Combustion Activities (1.A.3 Road transport, 1.A.4 Other sectors – residential heating), 2 Industrial Processes and Product Use and 3 Agriculture. Where for TSP the most important source is industrial processes, small heating installations are the highest contributor for PM2,5 emissions.
PM2.5 PM10 TSP
Source: Umweltbundesamt
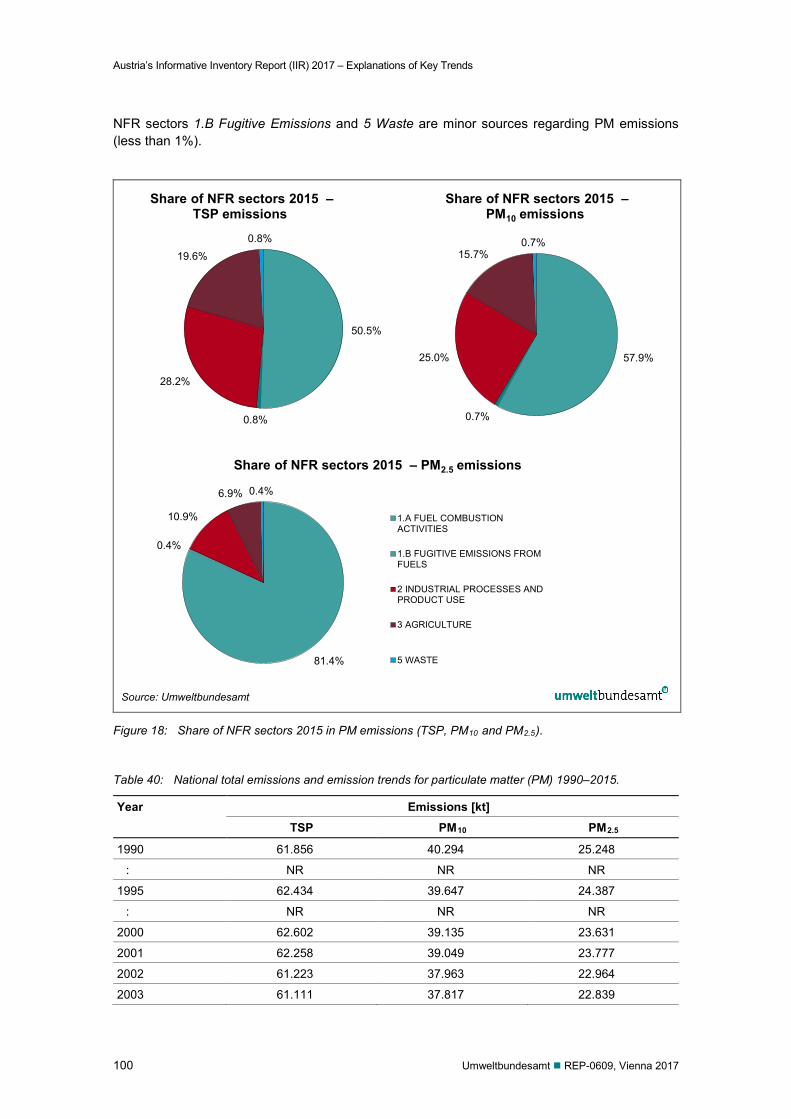
Austria’s Informative Inventory Report (IIR) 2017 – Explanations of Key Trends
100 Umweltbundesamt REP-0609, Vienna 2017
NFR sectors 1.B Fugitive Emissions and 5 Waste are minor sources regarding PM emissions (less than 1%).
Figure 18: Share of NFR sectors 2015 in PM emissions (TSP, PM10 and PM2.5).
Table 40: National total emissions and emission trends for particulate matter (PM) 1990–2015.
Year Emissions [kt] TSP PM10 PM2.5
1990 61.856 40.294 25.248
: NR NR NR
1995 62.434 39.647 24.387
: NR NR NR
2000 62.602 39.135 23.631
2001 62.258 39.049 23.777
2002 61.223 37.963 22.964
2003 61.111 37.817 22.839
50.5%
0.8%
28.2%
19.6% 0.8%
Share of NFR sectors 2015 – TSP emissions
57.9%
0.7%
25.0%
15.7% 0.7%
Share of NFR sectors 2015 – PM10 emissions
81.4%
0.4%
10.9%
6.9% 0.4%
Share of NFR sectors 2015 – PM2.5 emissions
1.A FUEL COMBUSTIONACTIVITIES
1.B FUGITIVE EMISSIONS FROMFUELS
2 INDUSTRIAL PROCESSES ANDPRODUCT USE
3 AGRICULTURE
5 WASTE
Source: Umweltbundesamt
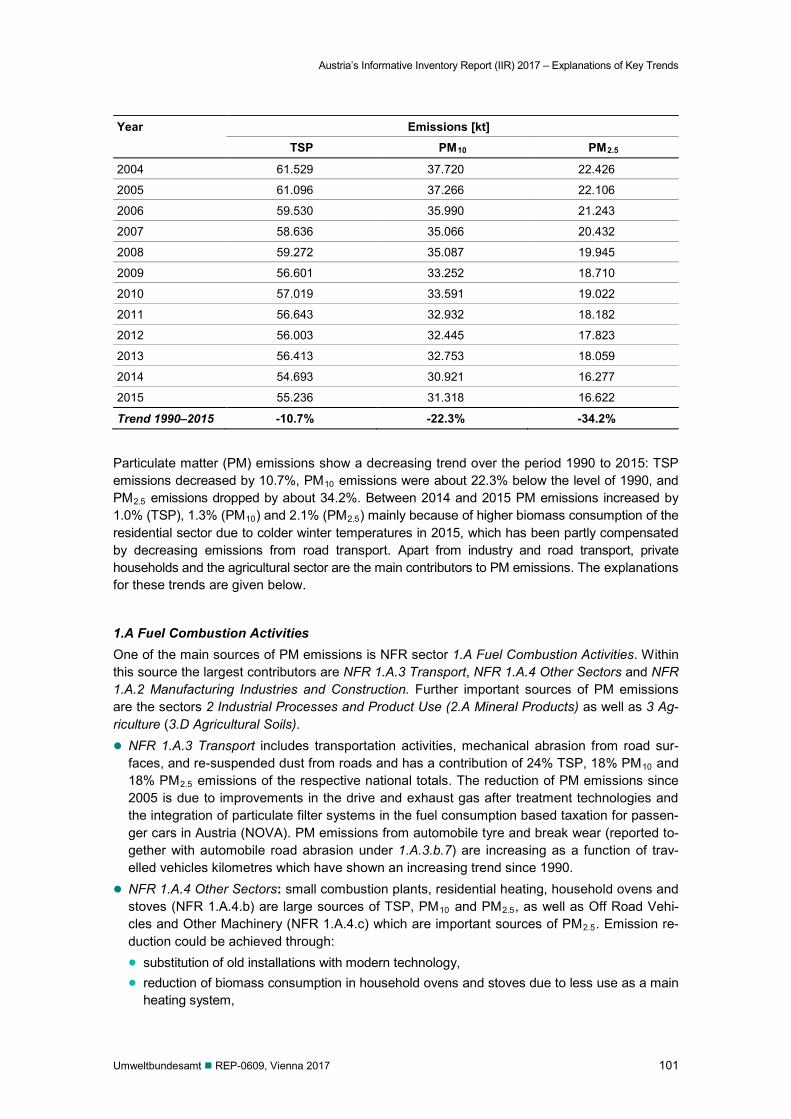
Austria’s Informative Inventory Report (IIR) 2017 – Explanations of Key Trends
Umweltbundesamt REP-0609, Vienna 2017 101
Year Emissions [kt] TSP PM10 PM2.5
2004 61.529 37.720 22.426
2005 61.096 37.266 22.106
2006 59.530 35.990 21.243
2007 58.636 35.066 20.432
2008 59.272 35.087 19.945
2009 56.601 33.252 18.710
2010 57.019 33.591 19.022
2011 56.643 32.932 18.182
2012 56.003 32.445 17.823
2013 56.413 32.753 18.059
2014 54.693 30.921 16.277
2015 55.236 31.318 16.622
Trend 1990–2015 -10.7% -22.3% -34.2%
Particulate matter (PM) emissions show a decreasing trend over the period 1990 to 2015: TSP emissions decreased by 10.7%, PM10 emissions were about 22.3% below the level of 1990, and PM2.5 emissions dropped by about 34.2%. Between 2014 and 2015 PM emissions increased by 1.0% (TSP), 1.3% (PM10) and 2.1% (PM2.5) mainly because of higher biomass consumption of the residential sector due to colder winter temperatures in 2015, which has been partly compensated by decreasing emissions from road transport. Apart from industry and road transport, private households and the agricultural sector are the main contributors to PM emissions. The explanations for these trends are given below.
1.A Fuel Combustion Activities One of the main sources of PM emissions is NFR sector 1.A Fuel Combustion Activities. Within this source the largest contributors are NFR 1.A.3 Transport, NFR 1.A.4 Other Sectors and NFR 1.A.2 Manufacturing Industries and Construction. Further important sources of PM emissions are the sectors 2 Industrial Processes and Product Use (2.A Mineral Products) as well as 3 Ag-riculture (3.D Agricultural Soils). NFR 1.A.3 Transport includes transportation activities, mechanical abrasion from road sur-
faces, and re-suspended dust from roads and has a contribution of 24% TSP, 18% PM10 and 18% PM2.5 emissions of the respective national totals. The reduction of PM emissions since 2005 is due to improvements in the drive and exhaust gas after treatment technologies and the integration of particulate filter systems in the fuel consumption based taxation for passen-ger cars in Austria (NOVA). PM emissions from automobile tyre and break wear (reported to-gether with automobile road abrasion under 1.A.3.b.7) are increasing as a function of trav-elled vehicles kilometres which have shown an increasing trend since 1990.
NFR 1.A.4 Other Sectors: small combustion plants, residential heating, household ovens and stoves (NFR 1.A.4.b) are large sources of TSP, PM10 and PM2.5, as well as Off Road Vehi-cles and Other Machinery (NFR 1.A.4.c) which are important sources of PM2.5. Emission re-duction could be achieved through: substitution of old installations with modern technology, reduction of biomass consumption in household ovens and stoves due to less use as a main
heating system,
Austria’s Informative Inventory Report (IIR) 2017 – Explanations of Key Trends
102 Umweltbundesamt REP-0609, Vienna 2017
installation of energy-saving boilers, connection to the district-heating networks or other public energy- and heating networks, substitution from high-emission fuels to low-emission (low-ash) fuels (wood pellets), raising awareness for energy saving.
This downward trend counteracted the application of CO2-neutral fuels such as biomass (wood, pellets etc.).
NFR 1.A.1 Energy Industries and NFR 1.A.2 Manufacturing Industries and Construction: NFR 1.A.2 Manufacturing Industries and Construction is responsible for 8.2% of the national total TSP emissions, 11% of PM10 emissions and 14% of PM2.5 emissions. 1.A.1 Energy Indus-tries contributes in 2015 with 2.4% of TSP, 3.9% of PM10 and 6.2% of PM2.5 to the respective national totals. Achievements for reducing emissions in both subcategories were made by sev-eral appropriate measures in this category: application of abatement techniques such as flue gas collection and flue gas cleaning sys-
tems (already in the 1980), installation of energy- and resource-saving production processes (already in the 1980), substitution from high-emission fuels to low-emission (low-ash) fuels (already in the 1980), raising awareness for environmental production. However, the measures are more than counterbalanced in the last decade by the enormous increase in energy consumption. Another reason for rising PM emissions in these source cat-egories is the increasing use of CO2-neutral fuels such as biomass (wood, pellets etc.) in dis-trict-heating plants. Even with modern combustion technology solid biomass causes consid-erable higher emissions than liquid or gaseous fuels.
2 Industrial Processes and Product Use
NFR 2.A Mineral Products: The handling of bulk materials like mineral products and the activ-ities in the field of civil engineering represent the majority of PM sources within sector 2 In-dustrial Processes and Product Use. The increase of PM emissions since 1990 of subcatego-ry NFR 2.A Mineral products is a result of increased activities due to manifold construction activities, whereas from 2008 to 2010 a significant decrease because of the economic crisis can be noted. Since 2011 the emission trend shows ups and downs. Between 2014 and 2015 a decrease can be observed.
NFR 2.C Metal Production, a decreasing trend of about 88% of all PM fractions can be noted for the period 1990 to 2015 because considerable efforts were made by introducing low-PM technologies, abatement techniques, flue gas collection and flue gas cleaning systems etc. In 2015 this sub category represents a minor source of PM emissions.
3 Agriculture NFR 3.D Agricultural Soils, which consider tillage operations and harvesting activities, is the
main source of PM emissions within sector Agriculture. The decrease in agricultural produc-tion (soil cultivation, harvesting etc.) is responsible for the decrease of about 11% of the total agricultural PM2.5 emissions. Total TSP and PM10 emissions from sector 3 Agriculture de-creased by 6.0% and 6.7% over the period 1990 to 2015.
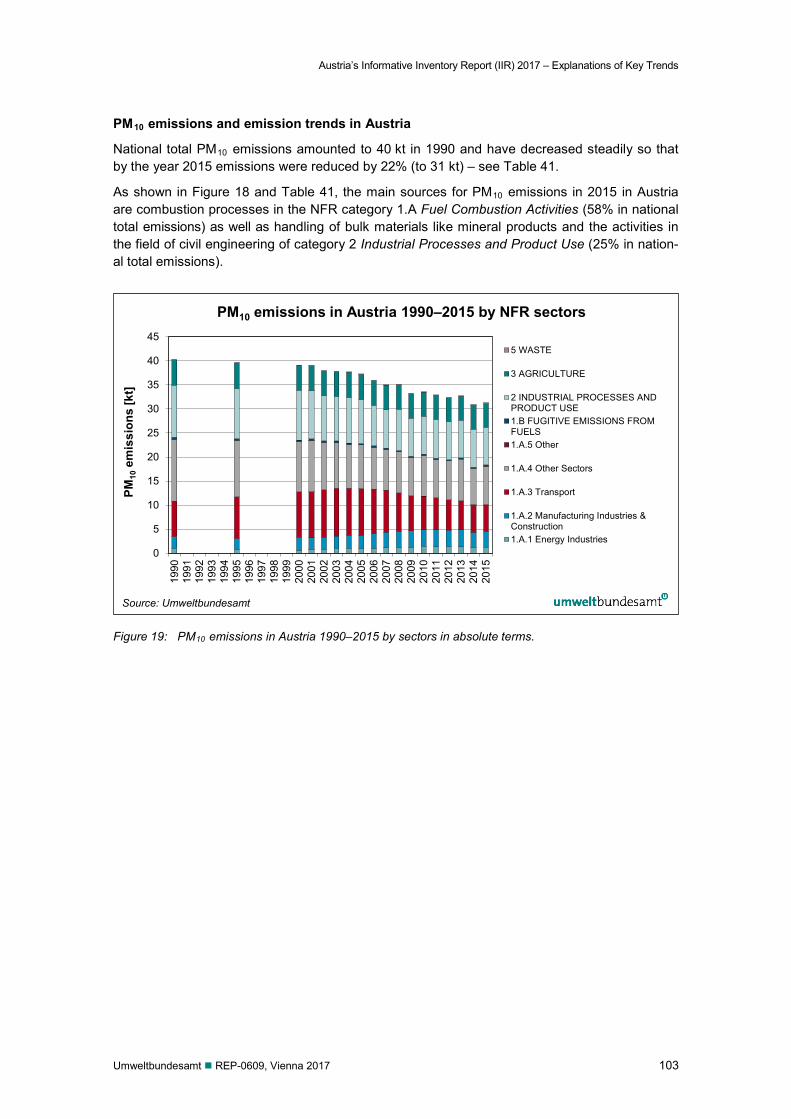
Austria’s Informative Inventory Report (IIR) 2017 – Explanations of Key Trends
Umweltbundesamt REP-0609, Vienna 2017 103
PM10 emissions and emission trends in Austria
National total PM10 emissions amounted to 40 kt in 1990 and have decreased steadily so that by the year 2015 emissions were reduced by 22% (to 31 kt) – see Table 41.
As shown in Figure 18 and Table 41, the main sources for PM10 emissions in 2015 in Austria are combustion processes in the NFR category 1.A Fuel Combustion Activities (58% in national total emissions) as well as handling of bulk materials like mineral products and the activities in the field of civil engineering of category 2 Industrial Processes and Product Use (25% in nation-al total emissions).
Figure 19: PM10 emissions in Austria 1990–2015 by sectors in absolute terms.
0
5
10
15
20
25
30
35
40
45
1990
1991
1992
1993
1994
1995
1996
1997
1998
1999
2000
2001
2002
2003
2004
2005
2006
2007
2008
2009
2010
2011
2012
2013
2014
2015
PM10
em
issi
ons
[kt]
PM10 emissions in Austria 1990–2015 by NFR sectors
5 WASTE
3 AGRICULTURE
2 INDUSTRIAL PROCESSES ANDPRODUCT USE1.B FUGITIVE EMISSIONS FROMFUELS1.A.5 Other
1.A.4 Other Sectors
1.A.3 Transport
1.A.2 Manufacturing Industries &Construction1.A.1 Energy Industries
Source: Umweltbundesamt
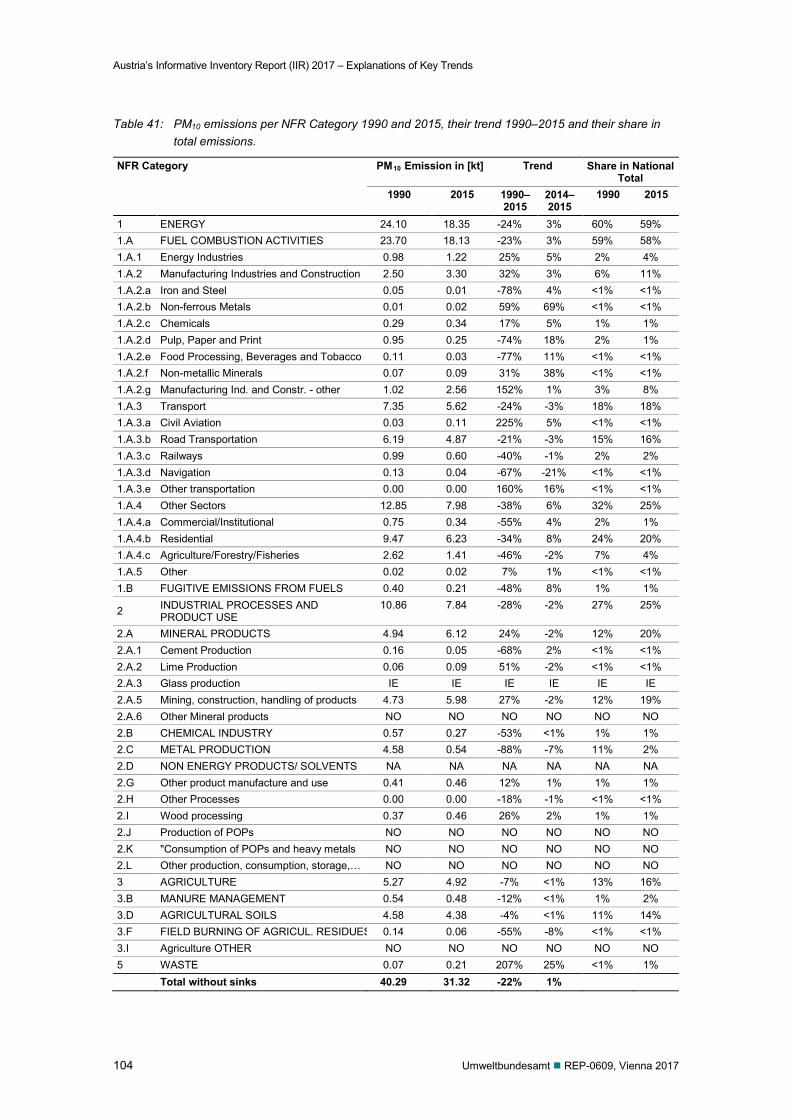
Austria’s Informative Inventory Report (IIR) 2017 – Explanations of Key Trends
104 Umweltbundesamt REP-0609, Vienna 2017
Table 41: PM10 emissions per NFR Category 1990 and 2015, their trend 1990–2015 and their share in total emissions.
NFR Category PM10 Emission in [kt] Trend Share in National Total
1990 2015 1990–2015
2014–2015
1990 2015
1 ENERGY 24.10 18.35 -24% 3% 60% 59% 1.A FUEL COMBUSTION ACTIVITIES 23.70 18.13 -23% 3% 59% 58% 1.A.1 Energy Industries 0.98 1.22 25% 5% 2% 4% 1.A.2 Manufacturing Industries and Construction 2.50 3.30 32% 3% 6% 11% 1.A.2.a Iron and Steel 0.05 0.01 -78% 4% <1% <1% 1.A.2.b Non-ferrous Metals 0.01 0.02 59% 69% <1% <1% 1.A.2.c Chemicals 0.29 0.34 17% 5% 1% 1% 1.A.2.d Pulp, Paper and Print 0.95 0.25 -74% 18% 2% 1% 1.A.2.e Food Processing, Beverages and Tobacco 0.11 0.03 -77% 11% <1% <1% 1.A.2.f Non-metallic Minerals 0.07 0.09 31% 38% <1% <1% 1.A.2.g Manufacturing Ind. and Constr. - other 1.02 2.56 152% 1% 3% 8% 1.A.3 Transport 7.35 5.62 -24% -3% 18% 18% 1.A.3.a Civil Aviation 0.03 0.11 225% 5% <1% <1% 1.A.3.b Road Transportation 6.19 4.87 -21% -3% 15% 16% 1.A.3.c Railways 0.99 0.60 -40% -1% 2% 2% 1.A.3.d Navigation 0.13 0.04 -67% -21% <1% <1% 1.A.3.e Other transportation 0.00 0.00 160% 16% <1% <1% 1.A.4 Other Sectors 12.85 7.98 -38% 6% 32% 25% 1.A.4.a Commercial/Institutional 0.75 0.34 -55% 4% 2% 1% 1.A.4.b Residential 9.47 6.23 -34% 8% 24% 20% 1.A.4.c Agriculture/Forestry/Fisheries 2.62 1.41 -46% -2% 7% 4% 1.A.5 Other 0.02 0.02 7% 1% <1% <1% 1.B FUGITIVE EMISSIONS FROM FUELS 0.40 0.21 -48% 8% 1% 1%
2 INDUSTRIAL PROCESSES AND PRODUCT USE
10.86 7.84 -28% -2% 27% 25%
2.A MINERAL PRODUCTS 4.94 6.12 24% -2% 12% 20% 2.A.1 Cement Production 0.16 0.05 -68% 2% <1% <1% 2.A.2 Lime Production 0.06 0.09 51% -2% <1% <1% 2.A.3 Glass production IE IE IE IE IE IE 2.A.5 Mining, construction, handling of products 4.73 5.98 27% -2% 12% 19% 2.A.6 Other Mineral products NO NO NO NO NO NO 2.B CHEMICAL INDUSTRY 0.57 0.27 -53% <1% 1% 1% 2.C METAL PRODUCTION 4.58 0.54 -88% -7% 11% 2% 2.D NON ENERGY PRODUCTS/ SOLVENTS NA NA NA NA NA NA 2.G Other product manufacture and use 0.41 0.46 12% 1% 1% 1% 2.H Other Processes 0.00 0.00 -18% -1% <1% <1% 2.I Wood processing 0.37 0.46 26% 2% 1% 1% 2.J Production of POPs NO NO NO NO NO NO 2.K "Consumption of POPs and heavy metals NO NO NO NO NO NO 2.L Other production, consumption, storage,… NO NO NO NO NO NO 3 AGRICULTURE 5.27 4.92 -7% <1% 13% 16% 3.B MANURE MANAGEMENT 0.54 0.48 -12% <1% 1% 2% 3.D AGRICULTURAL SOILS 4.58 4.38 -4% <1% 11% 14% 3.F FIELD BURNING OF AGRICUL. RESIDUES 0.14 0.06 -55% -8% <1% <1% 3.I Agriculture OTHER NO NO NO NO NO NO 5 WASTE 0.07 0.21 207% 25% <1% 1%
Total without sinks 40.29 31.32 -22% 1%
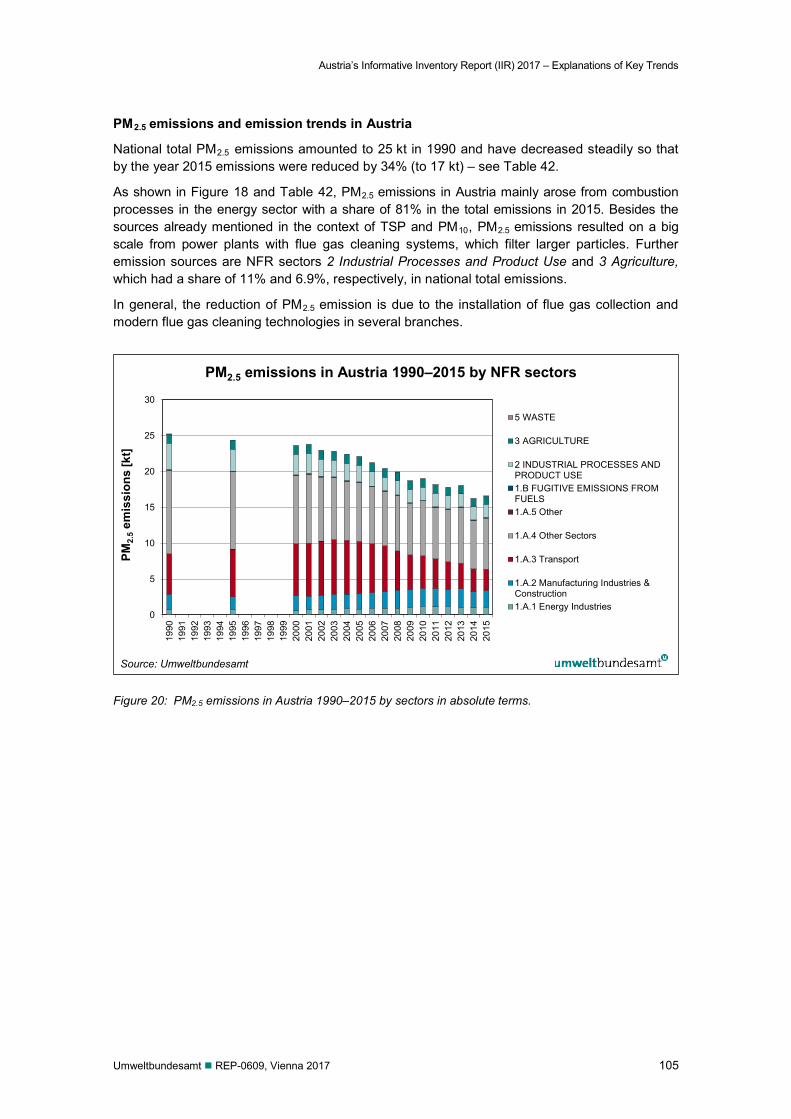
Austria’s Informative Inventory Report (IIR) 2017 – Explanations of Key Trends
Umweltbundesamt REP-0609, Vienna 2017 105
PM2.5 emissions and emission trends in Austria
National total PM2.5 emissions amounted to 25 kt in 1990 and have decreased steadily so that by the year 2015 emissions were reduced by 34% (to 17 kt) – see Table 42.
As shown in Figure 18 and Table 42, PM2.5 emissions in Austria mainly arose from combustion processes in the energy sector with a share of 81% in the total emissions in 2015. Besides the sources already mentioned in the context of TSP and PM10, PM2.5 emissions resulted on a big scale from power plants with flue gas cleaning systems, which filter larger particles. Further emission sources are NFR sectors 2 Industrial Processes and Product Use and 3 Agriculture, which had a share of 11% and 6.9%, respectively, in national total emissions.
In general, the reduction of PM2.5 emission is due to the installation of flue gas collection and modern flue gas cleaning technologies in several branches.
Figure 20: PM2.5 emissions in Austria 1990–2015 by sectors in absolute terms.
0
5
10
15
20
25
30
1990
1991
1992
1993
1994
1995
1996
1997
1998
1999
2000
2001
2002
2003
2004
2005
2006
2007
2008
2009
2010
2011
2012
2013
2014
2015
PM2.
5 em
issi
ons
[kt]
PM2.5 emissions in Austria 1990–2015 by NFR sectors
5 WASTE
3 AGRICULTURE
2 INDUSTRIAL PROCESSES ANDPRODUCT USE1.B FUGITIVE EMISSIONS FROMFUELS1.A.5 Other
1.A.4 Other Sectors
1.A.3 Transport
1.A.2 Manufacturing Industries &Construction1.A.1 Energy Industries
Source: Umweltbundesamt
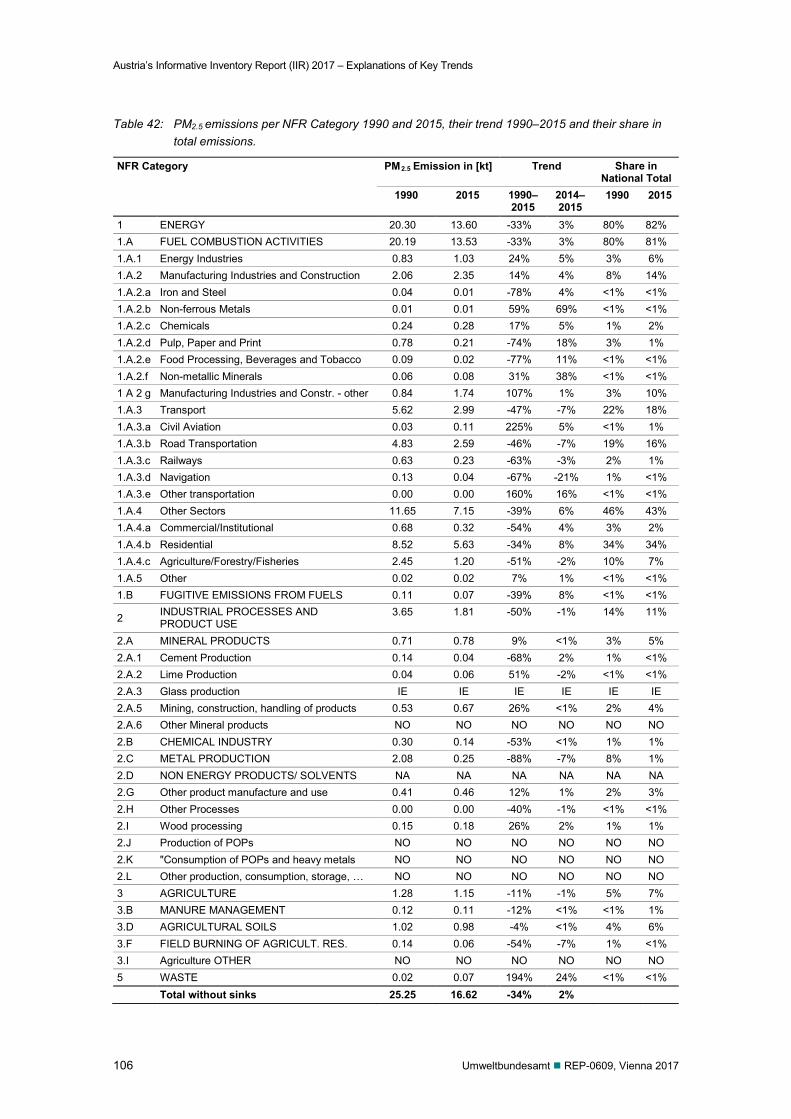
Austria’s Informative Inventory Report (IIR) 2017 – Explanations of Key Trends
106 Umweltbundesamt REP-0609, Vienna 2017
Table 42: PM2.5 emissions per NFR Category 1990 and 2015, their trend 1990–2015 and their share in total emissions.
NFR Category PM2.5 Emission in [kt] Trend Share in National Total
1990 2015 1990–2015
2014–2015
1990 2015
1 ENERGY 20.30 13.60 -33% 3% 80% 82% 1.A FUEL COMBUSTION ACTIVITIES 20.19 13.53 -33% 3% 80% 81% 1.A.1 Energy Industries 0.83 1.03 24% 5% 3% 6% 1.A.2 Manufacturing Industries and Construction 2.06 2.35 14% 4% 8% 14% 1.A.2.a Iron and Steel 0.04 0.01 -78% 4% <1% <1% 1.A.2.b Non-ferrous Metals 0.01 0.01 59% 69% <1% <1% 1.A.2.c Chemicals 0.24 0.28 17% 5% 1% 2% 1.A.2.d Pulp, Paper and Print 0.78 0.21 -74% 18% 3% 1% 1.A.2.e Food Processing, Beverages and Tobacco 0.09 0.02 -77% 11% <1% <1% 1.A.2.f Non-metallic Minerals 0.06 0.08 31% 38% <1% <1% 1 A 2 g Manufacturing Industries and Constr. - other 0.84 1.74 107% 1% 3% 10% 1.A.3 Transport 5.62 2.99 -47% -7% 22% 18% 1.A.3.a Civil Aviation 0.03 0.11 225% 5% <1% 1% 1.A.3.b Road Transportation 4.83 2.59 -46% -7% 19% 16% 1.A.3.c Railways 0.63 0.23 -63% -3% 2% 1% 1.A.3.d Navigation 0.13 0.04 -67% -21% 1% <1% 1.A.3.e Other transportation 0.00 0.00 160% 16% <1% <1% 1.A.4 Other Sectors 11.65 7.15 -39% 6% 46% 43% 1.A.4.a Commercial/Institutional 0.68 0.32 -54% 4% 3% 2% 1.A.4.b Residential 8.52 5.63 -34% 8% 34% 34% 1.A.4.c Agriculture/Forestry/Fisheries 2.45 1.20 -51% -2% 10% 7% 1.A.5 Other 0.02 0.02 7% 1% <1% <1% 1.B FUGITIVE EMISSIONS FROM FUELS 0.11 0.07 -39% 8% <1% <1%
2 INDUSTRIAL PROCESSES AND PRODUCT USE
3.65 1.81 -50% -1% 14% 11%
2.A MINERAL PRODUCTS 0.71 0.78 9% <1% 3% 5% 2.A.1 Cement Production 0.14 0.04 -68% 2% 1% <1% 2.A.2 Lime Production 0.04 0.06 51% -2% <1% <1% 2.A.3 Glass production IE IE IE IE IE IE 2.A.5 Mining, construction, handling of products 0.53 0.67 26% <1% 2% 4% 2.A.6 Other Mineral products NO NO NO NO NO NO 2.B CHEMICAL INDUSTRY 0.30 0.14 -53% <1% 1% 1% 2.C METAL PRODUCTION 2.08 0.25 -88% -7% 8% 1% 2.D NON ENERGY PRODUCTS/ SOLVENTS NA NA NA NA NA NA 2.G Other product manufacture and use 0.41 0.46 12% 1% 2% 3% 2.H Other Processes 0.00 0.00 -40% -1% <1% <1% 2.I Wood processing 0.15 0.18 26% 2% 1% 1% 2.J Production of POPs NO NO NO NO NO NO 2.K "Consumption of POPs and heavy metals NO NO NO NO NO NO 2.L Other production, consumption, storage, … NO NO NO NO NO NO 3 AGRICULTURE 1.28 1.15 -11% -1% 5% 7% 3.B MANURE MANAGEMENT 0.12 0.11 -12% <1% <1% 1% 3.D AGRICULTURAL SOILS 1.02 0.98 -4% <1% 4% 6% 3.F FIELD BURNING OF AGRICULT. RES. 0.14 0.06 -54% -7% 1% <1% 3.I Agriculture OTHER NO NO NO NO NO NO 5 WASTE 0.02 0.07 194% 24% <1% <1%
Total without sinks 25.25 16.62 -34% 2%
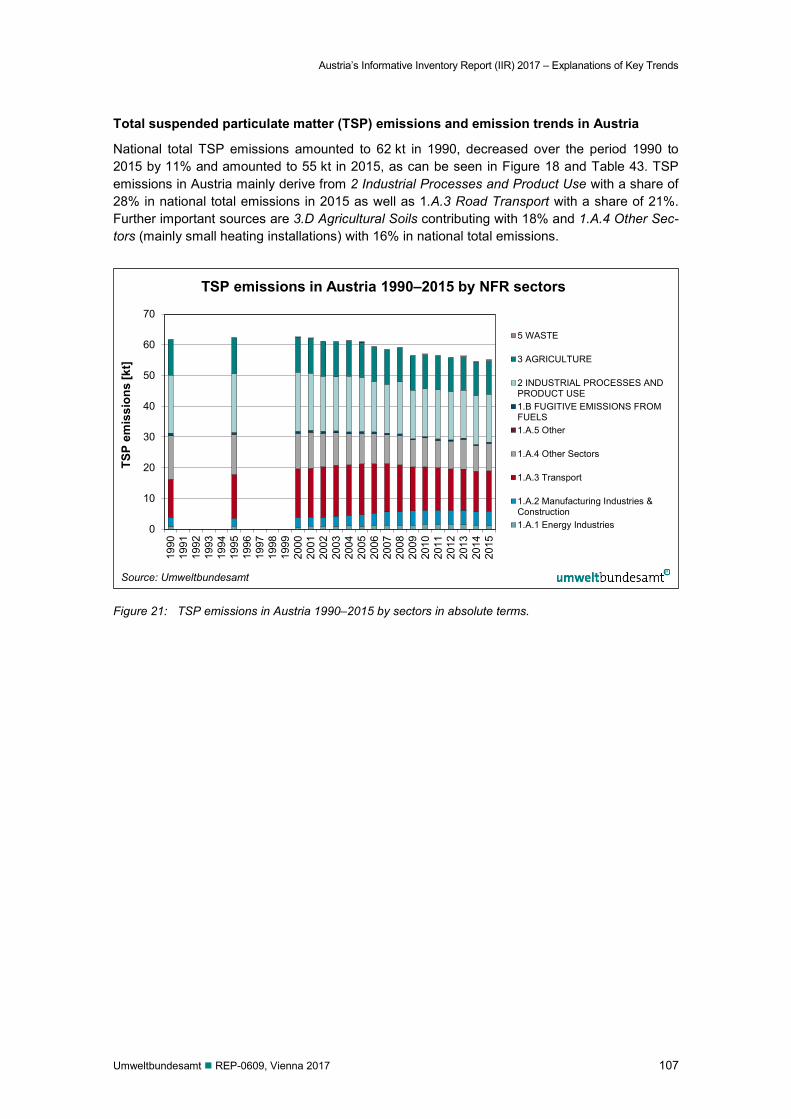
Austria’s Informative Inventory Report (IIR) 2017 – Explanations of Key Trends
Umweltbundesamt REP-0609, Vienna 2017 107
Total suspended particulate matter (TSP) emissions and emission trends in Austria
National total TSP emissions amounted to 62 kt in 1990, decreased over the period 1990 to 2015 by 11% and amounted to 55 kt in 2015, as can be seen in Figure 18 and Table 43. TSP emissions in Austria mainly derive from 2 Industrial Processes and Product Use with a share of 28% in national total emissions in 2015 as well as 1.A.3 Road Transport with a share of 21%. Further important sources are 3.D Agricultural Soils contributing with 18% and 1.A.4 Other Sec-tors (mainly small heating installations) with 16% in national total emissions.
Figure 21: TSP emissions in Austria 1990–2015 by sectors in absolute terms.
0
10
20
30
40
50
60
70
1990
1991
1992
1993
1994
1995
1996
1997
1998
1999
2000
2001
2002
2003
2004
2005
2006
2007
2008
2009
2010
2011
2012
2013
2014
2015
TSP
emis
sion
s [k
t]
TSP emissions in Austria 1990–2015 by NFR sectors
5 WASTE
3 AGRICULTURE
2 INDUSTRIAL PROCESSES ANDPRODUCT USE1.B FUGITIVE EMISSIONS FROMFUELS1.A.5 Other
1.A.4 Other Sectors
1.A.3 Transport
1.A.2 Manufacturing Industries &Construction1.A.1 Energy Industries
Source: Umweltbundesamt

Austria’s Informative Inventory Report (IIR) 2017 – Explanations of Key Trends
108 Umweltbundesamt REP-0609, Vienna 2017
Table 43: TSP emissions per NFR Category 1990 and 2015, their trend 1990–2015 and their share in total emissions.
NFR Category TSP Emission in [kt] Trend Share in National Total
1990 2015 1990–2015
2014–2015
1990 2015
1 ENERGY 31.23 28.36 -9% 3% 50% 51% 1.A FUEL COMBUSTION ACTIVITIES 30.38 27.92 -8% 3% 49% 51% 1.A.1 Energy Industries 1.03 1.33 29% 5% 2% 2% 1.A.2 Manufacturing Industries and Construction 2.90 4.50 55% 2% 5% 8% 1.A.2.a Iron and Steel 0.06 0.01 -78% 4% <1% <1% 1.A.2.b Non-ferrous Metals 0.01 0.02 59% 69% <1% <1% 1.A.2.c Chemicals 0.32 0.38 17% 5% 1% 1% 1.A.2.d Pulp, Paper and Print 1.06 0.28 -74% 18% 2% 1% 1.A.2.e Food Processing, Beverages and Tobacco 0.12 0.03 -77% 11% <1% <1% 1.A.2.f Non-metallic Minerals 0.08 0.10 31% 38% <1% <1% 1 A 2 g Manufacturing Industries and Constr. – other 1.25 3.69 194% <1% 2% 7% 1.A.3 Transport 12.30 13.16 7% <1% 20% 24% 1.A.3.a Civil Aviation 0.03 0.11 225% 5% <1% <1% 1.A.3.b Road Transportation 10.10 11.36 12% <1% 16% 21% 1.A.3.c Railways 2.03 1.63 -19% <1% 3% 3% 1.A.3.d Navigation 0.13 0.04 -67% -21% <1% <1% 1.A.3.e Other transportation 0.00 0.01 160% 16% <1% <1% 1.A.4 Other Sectors 14.13 8.90 -37% 6% 23% 16% 1.A.4.a Commercial/Institutional 0.82 0.36 -57% 5% 1% 1% 1.A.4.b Residential 10.43 6.84 -34% 9% 17% 12% 1.A.4.c Agriculture/Forestry/Fisheries 2.89 1.71 -41% -1% 5% 3% 1.A.5 Other 0.02 0.02 6% 1% <1% <1% 1.B FUGITIVE EMISSIONS FROM FUELS 0.85 0.45 -48% 8% 1% 1%
2 INDUSTRIAL PROCESSES AND PRODUCT USE
18.94 15.57 -18% -2% 31% 28%
2.A MINERAL PRODUCTS 10.21 12.75 25% -2% 17% 23% 2.A.1 Cement Production 0.17 0.06 -68% 2% <1% <1% 2.A.2 Lime Production 0.06 0.09 51% -2% <1% <1% 2.A.3 Glass production IE IE IE IE IE IE 2.A.5 Mining, construction, handling of products 9.97 12.60 26% -2% 16% 23% 2.A.6 Other Mineral products NO NO NO NO NO NO 2.B CHEMICAL INDUSTRY 0.96 0.46 -52% <1% 2% 1% 2.C METAL PRODUCTION 6.45 0.75 -88% -8% 10% 1% 2.D NON ENERGY PRODUCTS/ SOLVENTS NA NA NA NA NA NA 2.G Other product manufacture and use 0.41 0.46 12% 1% 1% 1% 2.H Other Processes 0.00 0.00 -13% -1% <1% <1% 2.I Wood processing 0.92 1.16 26% 2% 1% 2% 2.J Production of POPs NO NO NO NO NO NO 2.K "Consumption of POPs and heavy metals NO NO NO NO NO NO 2.L Other production, consumption, storage, … NO NO NO NO NO NO 3 AGRICULTURE 11.53 10.85 -6% <1% 19% 20% 3.B MANURE MANAGEMENT 1.21 1.06 -12% <1% 2% 2% 3.D AGRICULTURAL SOILS 10.18 9.72 -4% <1% 16% 18% 3.F FIELD BURNING OF AGRICULTURAL RES. 0.14 0.06 -55% -8% <1% <1% 3.I Agriculture OTHER NO NO NO NO NO NO 5 WASTE 0.15 0.45 211% 25% <1% 1%
Total without sinks 61.86 55.24 -11% 1%
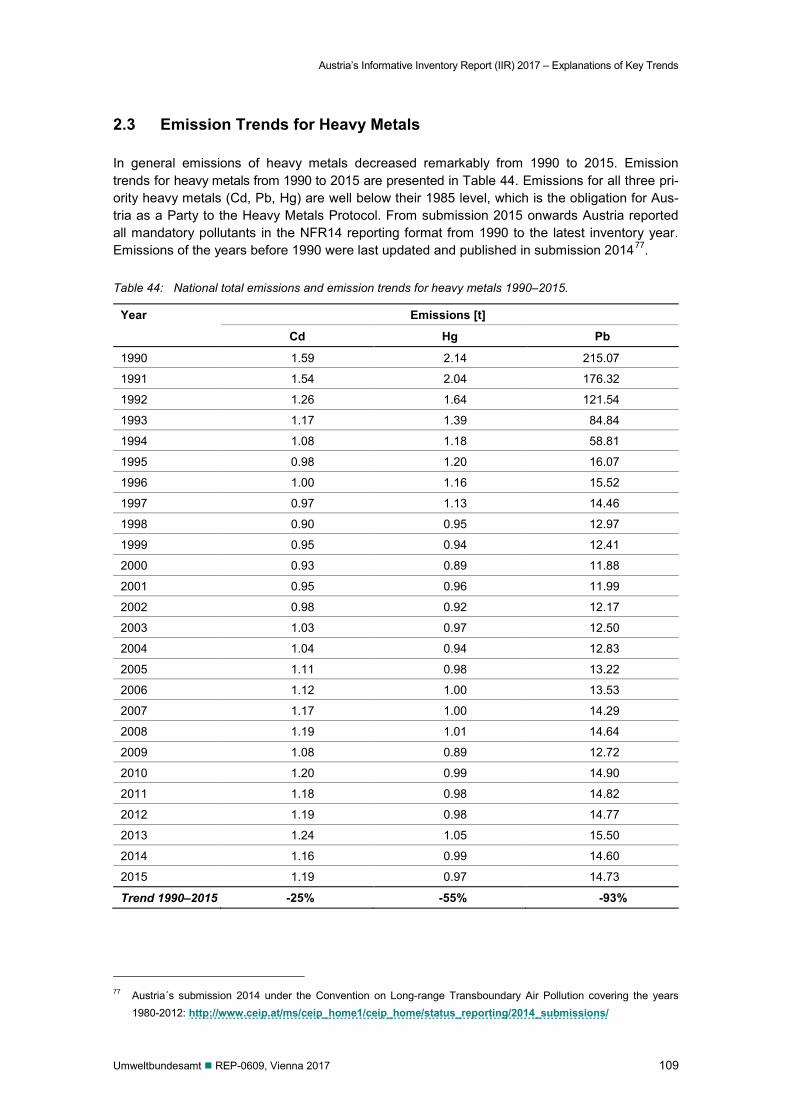
Austria’s Informative Inventory Report (IIR) 2017 – Explanations of Key Trends
Umweltbundesamt REP-0609, Vienna 2017 109
2.3 Emission Trends for Heavy Metals
In general emissions of heavy metals decreased remarkably from 1990 to 2015. Emission trends for heavy metals from 1990 to 2015 are presented in Table 44. Emissions for all three pri-ority heavy metals (Cd, Pb, Hg) are well below their 1985 level, which is the obligation for Aus-tria as a Party to the Heavy Metals Protocol. From submission 2015 onwards Austria reported all mandatory pollutants in the NFR14 reporting format from 1990 to the latest inventory year. Emissions of the years before 1990 were last updated and published in submission 201477.
Table 44: National total emissions and emission trends for heavy metals 1990–2015.
Year Emissions [t]
Cd Hg Pb
1990 1.59 2.14 215.07
1991 1.54 2.04 176.32
1992 1.26 1.64 121.54
1993 1.17 1.39 84.84
1994 1.08 1.18 58.81
1995 0.98 1.20 16.07
1996 1.00 1.16 15.52
1997 0.97 1.13 14.46
1998 0.90 0.95 12.97
1999 0.95 0.94 12.41
2000 0.93 0.89 11.88
2001 0.95 0.96 11.99
2002 0.98 0.92 12.17
2003 1.03 0.97 12.50
2004 1.04 0.94 12.83
2005 1.11 0.98 13.22
2006 1.12 1.00 13.53
2007 1.17 1.00 14.29
2008 1.19 1.01 14.64
2009 1.08 0.89 12.72
2010 1.20 0.99 14.90
2011 1.18 0.98 14.82
2012 1.19 0.98 14.77
2013 1.24 1.05 15.50
2014 1.16 0.99 14.60
2015 1.19 0.97 14.73
Trend 1990–2015 -25% -55% -93%
77 Austria´s submission 2014 under the Convention on Long-range Transboundary Air Pollution covering the years
1980-2012: http://www.ceip.at/ms/ceip_home1/ceip_home/status_reporting/2014_submissions/
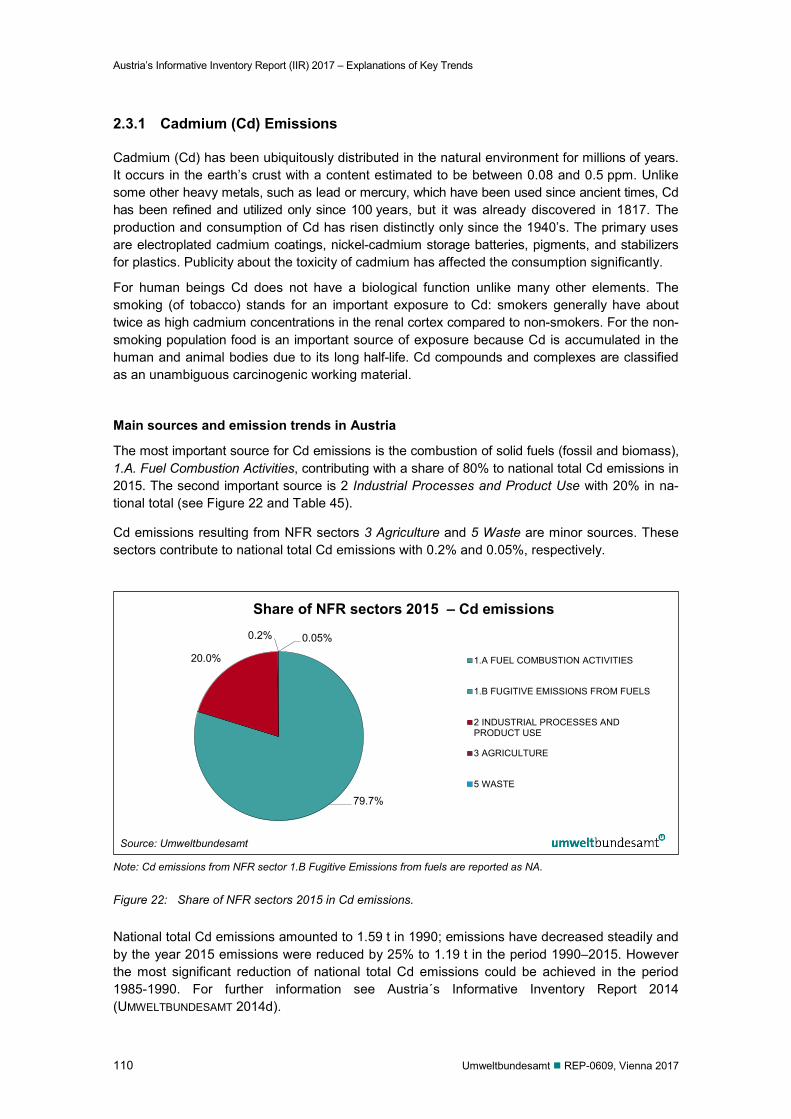
Austria’s Informative Inventory Report (IIR) 2017 – Explanations of Key Trends
110 Umweltbundesamt REP-0609, Vienna 2017
2.3.1 Cadmium (Cd) Emissions
Cadmium (Cd) has been ubiquitously distributed in the natural environment for millions of years. It occurs in the earth’s crust with a content estimated to be between 0.08 and 0.5 ppm. Unlike some other heavy metals, such as lead or mercury, which have been used since ancient times, Cd has been refined and utilized only since 100 years, but it was already discovered in 1817. The production and consumption of Cd has risen distinctly only since the 1940’s. The primary uses are electroplated cadmium coatings, nickel-cadmium storage batteries, pigments, and stabilizers for plastics. Publicity about the toxicity of cadmium has affected the consumption significantly.
For human beings Cd does not have a biological function unlike many other elements. The smoking (of tobacco) stands for an important exposure to Cd: smokers generally have about twice as high cadmium concentrations in the renal cortex compared to non-smokers. For the non-smoking population food is an important source of exposure because Cd is accumulated in the human and animal bodies due to its long half-life. Cd compounds and complexes are classified as an unambiguous carcinogenic working material.
Main sources and emission trends in Austria
The most important source for Cd emissions is the combustion of solid fuels (fossil and biomass), 1.A. Fuel Combustion Activities, contributing with a share of 80% to national total Cd emissions in 2015. The second important source is 2 Industrial Processes and Product Use with 20% in na-tional total (see Figure 22 and Table 45).
Cd emissions resulting from NFR sectors 3 Agriculture and 5 Waste are minor sources. These sectors contribute to national total Cd emissions with 0.2% and 0.05%, respectively.
Note: Cd emissions from NFR sector 1.B Fugitive Emissions from fuels are reported as NA.
Figure 22: Share of NFR sectors 2015 in Cd emissions.
National total Cd emissions amounted to 1.59 t in 1990; emissions have decreased steadily and by the year 2015 emissions were reduced by 25% to 1.19 t in the period 1990–2015. However the most significant reduction of national total Cd emissions could be achieved in the period 1985-1990. For further information see Austria´s Informative Inventory Report 2014 (UMWELTBUNDESAMT 2014d).
79.7%
20.0%
0.2% 0.05%
Share of NFR sectors 2015 – Cd emissions
1.A FUEL COMBUSTION ACTIVITIES
1.B FUGITIVE EMISSIONS FROM FUELS
2 INDUSTRIAL PROCESSES ANDPRODUCT USE
3 AGRICULTURE
5 WASTE
Source: Umweltbundesamt
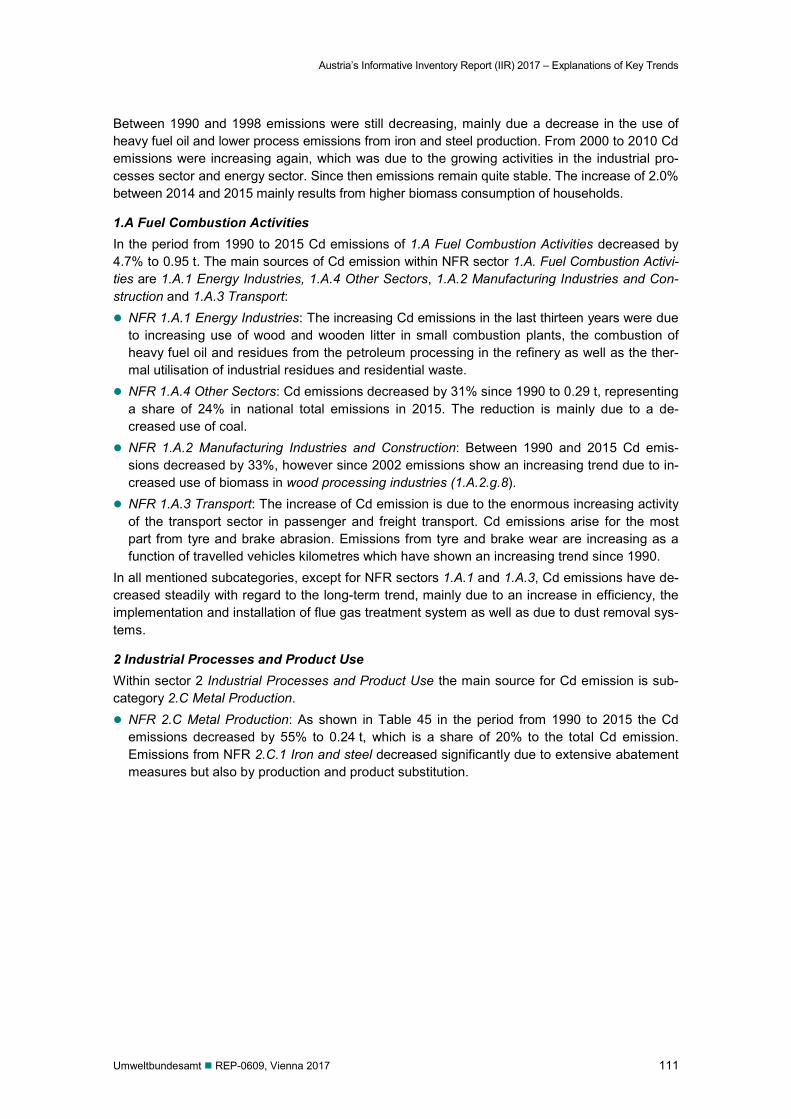
Austria’s Informative Inventory Report (IIR) 2017 – Explanations of Key Trends
Umweltbundesamt REP-0609, Vienna 2017 111
Between 1990 and 1998 emissions were still decreasing, mainly due a decrease in the use of heavy fuel oil and lower process emissions from iron and steel production. From 2000 to 2010 Cd emissions were increasing again, which was due to the growing activities in the industrial pro-cesses sector and energy sector. Since then emissions remain quite stable. The increase of 2.0% between 2014 and 2015 mainly results from higher biomass consumption of households.
1.A Fuel Combustion Activities In the period from 1990 to 2015 Cd emissions of 1.A Fuel Combustion Activities decreased by 4.7% to 0.95 t. The main sources of Cd emission within NFR sector 1.A. Fuel Combustion Activi-ties are 1.A.1 Energy Industries, 1.A.4 Other Sectors, 1.A.2 Manufacturing Industries and Con-struction and 1.A.3 Transport: NFR 1.A.1 Energy Industries: The increasing Cd emissions in the last thirteen years were due
to increasing use of wood and wooden litter in small combustion plants, the combustion of heavy fuel oil and residues from the petroleum processing in the refinery as well as the ther-mal utilisation of industrial residues and residential waste.
NFR 1.A.4 Other Sectors: Cd emissions decreased by 31% since 1990 to 0.29 t, representing a share of 24% in national total emissions in 2015. The reduction is mainly due to a de-creased use of coal.
NFR 1.A.2 Manufacturing Industries and Construction: Between 1990 and 2015 Cd emis-sions decreased by 33%, however since 2002 emissions show an increasing trend due to in-creased use of biomass in wood processing industries (1.A.2.g.8).
NFR 1.A.3 Transport: The increase of Cd emission is due to the enormous increasing activity of the transport sector in passenger and freight transport. Cd emissions arise for the most part from tyre and brake abrasion. Emissions from tyre and brake wear are increasing as a function of travelled vehicles kilometres which have shown an increasing trend since 1990.
In all mentioned subcategories, except for NFR sectors 1.A.1 and 1.A.3, Cd emissions have de-creased steadily with regard to the long-term trend, mainly due to an increase in efficiency, the implementation and installation of flue gas treatment system as well as due to dust removal sys-tems.
2 Industrial Processes and Product Use Within sector 2 Industrial Processes and Product Use the main source for Cd emission is sub-category 2.C Metal Production. NFR 2.C Metal Production: As shown in Table 45 in the period from 1990 to 2015 the Cd
emissions decreased by 55% to 0.24 t, which is a share of 20% to the total Cd emission. Emissions from NFR 2.C.1 Iron and steel decreased significantly due to extensive abatement measures but also by production and product substitution.
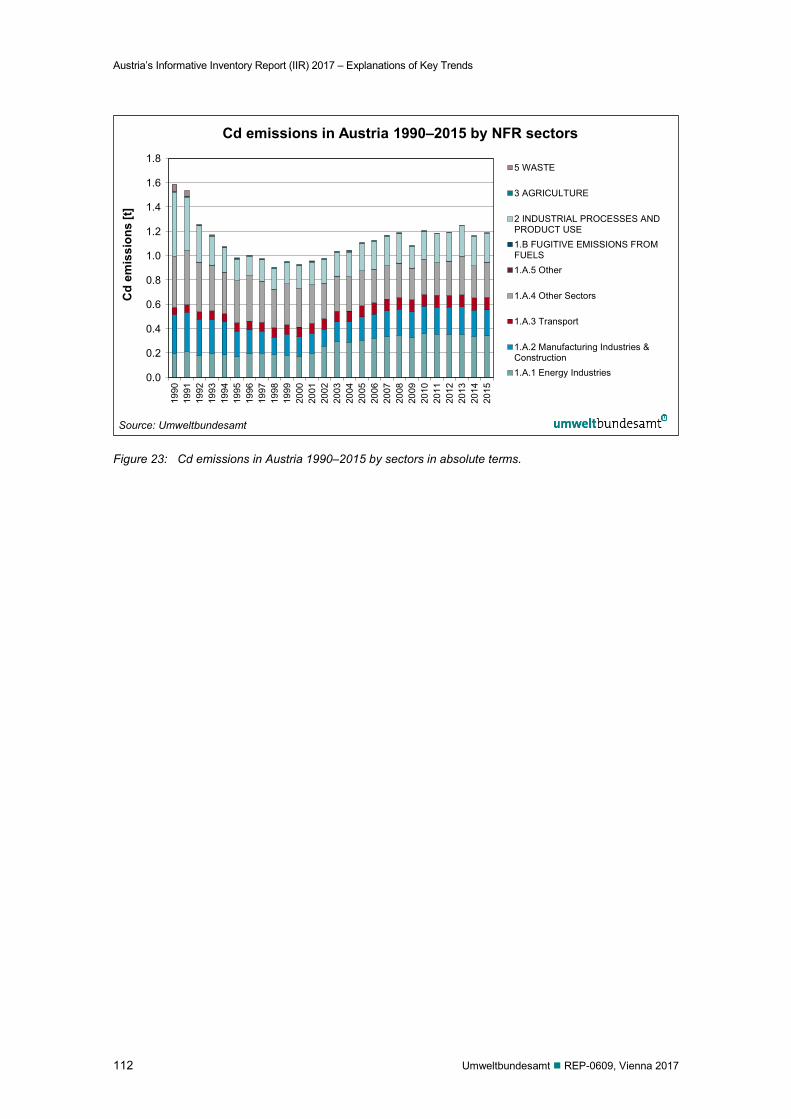
Austria’s Informative Inventory Report (IIR) 2017 – Explanations of Key Trends
112 Umweltbundesamt REP-0609, Vienna 2017
Figure 23: Cd emissions in Austria 1990–2015 by sectors in absolute terms.
0,0
0,2
0,4
0,6
0,8
1,0
1,2
1,4
1,6
1,819
9019
9119
9219
9319
9419
9519
9619
9719
9819
9920
0020
0120
0220
0320
0420
0520
0620
0720
0820
0920
1020
1120
1220
1320
1420
15
Cd
emis
sion
s [t]
Cd emissions in Austria 1990–2015 by NFR sectors
5 WASTE
3 AGRICULTURE
2 INDUSTRIAL PROCESSES ANDPRODUCT USE1.B FUGITIVE EMISSIONS FROMFUELS1.A.5 Other
1.A.4 Other Sectors
1.A.3 Transport
1.A.2 Manufacturing Industries &Construction1.A.1 Energy Industries
Source: Umweltbundesamt
1.8
1.6
1.4
1.2
1.0
0.8
0.6
0.4
0.2
0.0
Austria’s Informative Inventory Report (IIR) 2017 – Explanations of Key Trends
Umweltbundesamt REP-0609, Vienna 2017 113
Table 45: Cd emissions per NFR Category 1990 and 2015, their trend 1990–2015 and their share in total emissions.
NFR Category Cd Emission in [t] Trend Share in National Total
1990 2015 1990–2015
2014–2015
1990 2015
1 ENERGY 0.99 0.95 -5% 3% 63% 80%
1.A FUEL COMBUSTION ACTIVITIES 0.99 0.95 -5% 3% 63% 80%
1.A.1 Energy Industries 0.19 0.34 76% 2% 12% 29%
1.A.1.a Public Electricity and Heat Production 0.10 0.13 27% 6% 7% 11%
1.A.1.b Petroleum refining 0.09 0.21 133% -1% 6% 17%
1.A.1.c Manufacture of Solid fuels & Other Energy Ind. NA NA NA NA NA NA
1.A.2 Manufacturing Industries and Construction 0.32 0.21 -33% -2% 20% 18%
1.A.2.a Iron and Steel 0.01 0.00 -49% -6% <1% <1%
1.A.2.b Non-ferrous Metals 0.01 0.01 -12% <1% 1% 1%
1.A.2.c Chemicals 0.03 0.01 -53% 10% 2% 1%
1.A.2.d Pulp, Paper and Print 0.14 0.09 -36% -6% 9% 8%
1.A.2.e Food Processing, Beverages and Tobacco 0.00 0.00 -89% 5% <1% <1%
1.A.2.f Non-metallic Minerals 0.10 0.02 -78% -17% 6% 2%
1.A 2.g Manufacturing Industries and Constr. - other 0.03 0.07 141% 8% 2% 6%
1.A.3 Transport 0.06 0.10 71% 2% 4% 9%
1.A.3.a Civil Aviation 0.00 0.00 212% 5% <1% <1%
1.A.3.b Road Transportation 0.06 0.10 72% 2% 4% 9%
1.A.3.c Railways 0.00 0.00 -86% -1% <1% <1%
1.A.3.d Navigation 0.00 0.00 -1% -15% <1% <1%
1.A.3.e Other transportation NA NA NA NA NA NA
1.A.4 Other Sectors 0.42 0.29 -31% 10% 26% 24%
1.A.4.a Commercial/Institutional 0.07 0.02 -73% 13% 5% 2%
1.A.4.b Residential 0.31 0.21 -32% 10% 20% 18%
1.A.4.c Agriculture/Forestry/Fisheries 0.03 0.06 80% 9% 2% 5%
1.A.5 Other 0.00 0.00 40% 1% <1% <1%
1.B FUGITIVE EMISSIONS FROM FUELS NA NA NA NA NA NA
2 INDUSTRIAL PROCESSES AND PRODUCT USE
0.53 0.24 -55% -3% 33% 20%
2.A MINERAL PRODUCTS NA NA NA NA NA NA
2.B CHEMICAL INDUSTRY 0.00 0.00 -30% <1% <1% <1%
2.C METAL PRODUCTION 0.53 0.24 -55% -3% 33% 20% 2.D NON ENERGY PRODUCTS/ SOLVENTS 0.00 0.00 <1% <1% <1% <1% 2.G Other product manufacture and use NA NA NA NA NA NA 2.H Other Processes NA NA NA NA NA NA 2.I Wood processing NA NA NA NA NA NA 2.J Production of POPs NO NO NO NO NO NO 2.K "Consumption of POPs and heavy metals NO NO NO NO NO NO
2.L Other production, consumption, storage, … NO NO NO NO NO NO
3 AGRICULTURE 0.01 0.00 -73% -22% 1% <1%
5 WASTE 0.06 0.00 -99% -5% 4% <1%
Total without sinks 1.59 1.19 -25% 2%
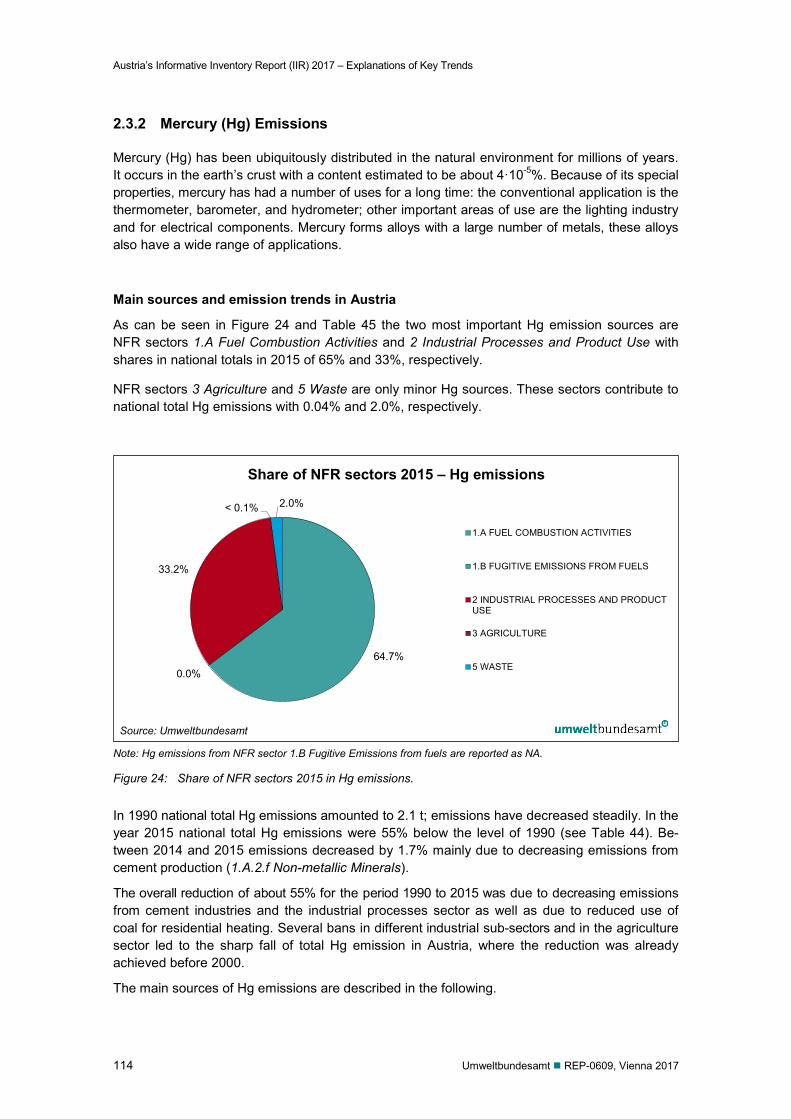
Austria’s Informative Inventory Report (IIR) 2017 – Explanations of Key Trends
114 Umweltbundesamt REP-0609, Vienna 2017
2.3.2 Mercury (Hg) Emissions
Mercury (Hg) has been ubiquitously distributed in the natural environment for millions of years. It occurs in the earth’s crust with a content estimated to be about 4·10-5%. Because of its special properties, mercury has had a number of uses for a long time: the conventional application is the thermometer, barometer, and hydrometer; other important areas of use are the lighting industry and for electrical components. Mercury forms alloys with a large number of metals, these alloys also have a wide range of applications.
Main sources and emission trends in Austria
As can be seen in Figure 24 and Table 45 the two most important Hg emission sources are NFR sectors 1.A Fuel Combustion Activities and 2 Industrial Processes and Product Use with shares in national totals in 2015 of 65% and 33%, respectively.
NFR sectors 3 Agriculture and 5 Waste are only minor Hg sources. These sectors contribute to national total Hg emissions with 0.04% and 2.0%, respectively.
Note: Hg emissions from NFR sector 1.B Fugitive Emissions from fuels are reported as NA.
Figure 24: Share of NFR sectors 2015 in Hg emissions.
In 1990 national total Hg emissions amounted to 2.1 t; emissions have decreased steadily. In the year 2015 national total Hg emissions were 55% below the level of 1990 (see Table 44). Be-tween 2014 and 2015 emissions decreased by 1.7% mainly due to decreasing emissions from cement production (1.A.2.f Non-metallic Minerals).
The overall reduction of about 55% for the period 1990 to 2015 was due to decreasing emissions from cement industries and the industrial processes sector as well as due to reduced use of coal for residential heating. Several bans in different industrial sub-sectors and in the agriculture sector led to the sharp fall of total Hg emission in Austria, where the reduction was already achieved before 2000.
The main sources of Hg emissions are described in the following.
64.7% 0.0%
33.2%
< 0.1% 2.0%
Share of NFR sectors 2015 – Hg emissions
1.A FUEL COMBUSTION ACTIVITIES
1.B FUGITIVE EMISSIONS FROM FUELS
2 INDUSTRIAL PROCESSES AND PRODUCTUSE
3 AGRICULTURE
5 WASTE
Source: Umweltbundesamt
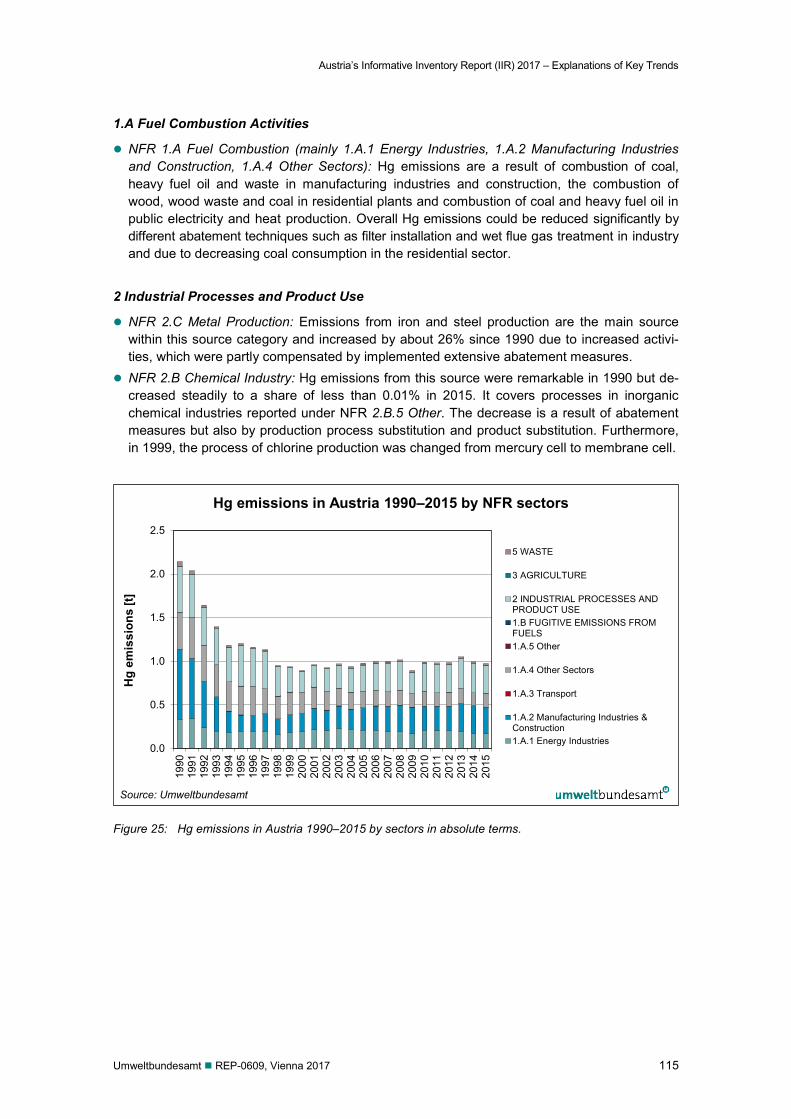
Austria’s Informative Inventory Report (IIR) 2017 – Explanations of Key Trends
Umweltbundesamt REP-0609, Vienna 2017 115
1.A Fuel Combustion Activities
NFR 1.A Fuel Combustion (mainly 1.A.1 Energy Industries, 1.A.2 Manufacturing Industries and Construction, 1.A.4 Other Sectors): Hg emissions are a result of combustion of coal, heavy fuel oil and waste in manufacturing industries and construction, the combustion of wood, wood waste and coal in residential plants and combustion of coal and heavy fuel oil in public electricity and heat production. Overall Hg emissions could be reduced significantly by different abatement techniques such as filter installation and wet flue gas treatment in industry and due to decreasing coal consumption in the residential sector.
2 Industrial Processes and Product Use
NFR 2.C Metal Production: Emissions from iron and steel production are the main source within this source category and increased by about 26% since 1990 due to increased activi-ties, which were partly compensated by implemented extensive abatement measures.
NFR 2.B Chemical Industry: Hg emissions from this source were remarkable in 1990 but de-creased steadily to a share of less than 0.01% in 2015. It covers processes in inorganic chemical industries reported under NFR 2.B.5 Other. The decrease is a result of abatement measures but also by production process substitution and product substitution. Furthermore, in 1999, the process of chlorine production was changed from mercury cell to membrane cell.
Figure 25: Hg emissions in Austria 1990–2015 by sectors in absolute terms.
0,0
0,5
1,0
1,5
2,0
2,5
1990
1991
1992
1993
1994
1995
1996
1997
1998
1999
2000
2001
2002
2003
2004
2005
2006
2007
2008
2009
2010
2011
2012
2013
2014
2015
Hg
emis
sion
s [t]
Hg emissions in Austria 1990–2015 by NFR sectors
5 WASTE
3 AGRICULTURE
2 INDUSTRIAL PROCESSES ANDPRODUCT USE1.B FUGITIVE EMISSIONS FROMFUELS1.A.5 Other
1.A.4 Other Sectors
1.A.3 Transport
1.A.2 Manufacturing Industries &Construction1.A.1 Energy Industries
Source: Umweltbundesamt
2.5
2.0
1.5
1.0
0.5
0.0
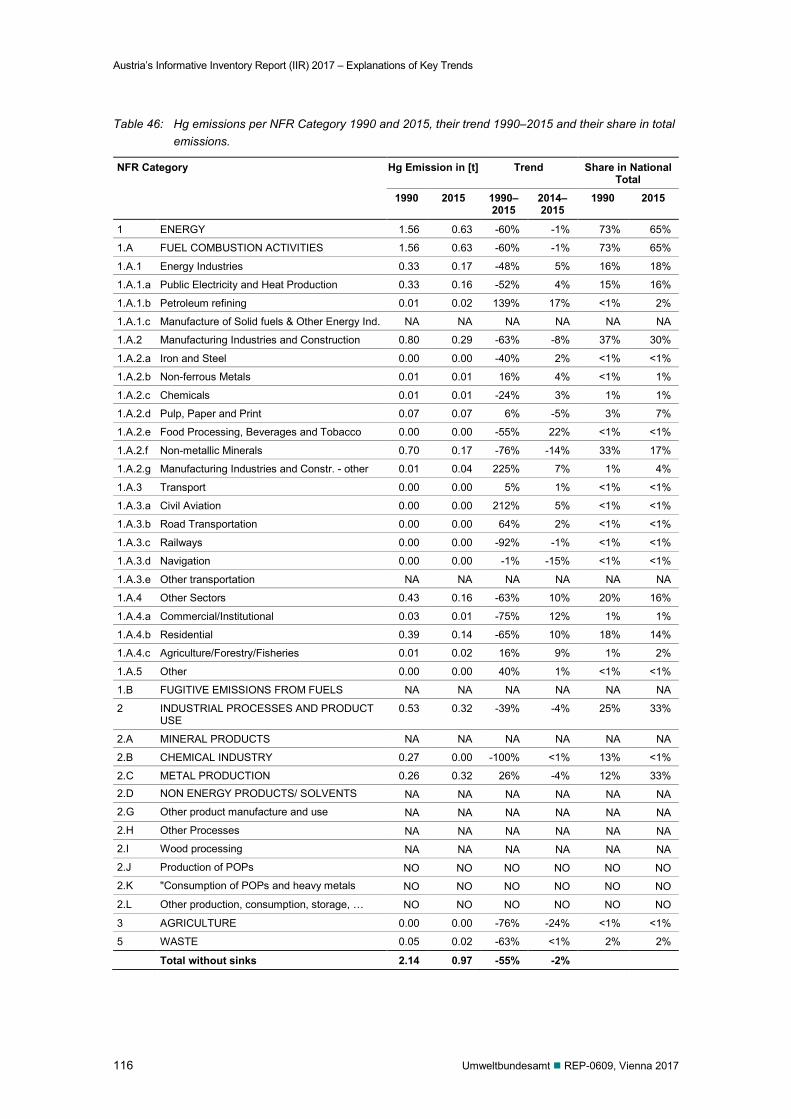
Austria’s Informative Inventory Report (IIR) 2017 – Explanations of Key Trends
116 Umweltbundesamt REP-0609, Vienna 2017
Table 46: Hg emissions per NFR Category 1990 and 2015, their trend 1990–2015 and their share in total emissions.
NFR Category Hg Emission in [t] Trend Share in National Total
1990 2015 1990–2015
2014–2015
1990 2015
1 ENERGY 1.56 0.63 -60% -1% 73% 65%
1.A FUEL COMBUSTION ACTIVITIES 1.56 0.63 -60% -1% 73% 65%
1.A.1 Energy Industries 0.33 0.17 -48% 5% 16% 18%
1.A.1.a Public Electricity and Heat Production 0.33 0.16 -52% 4% 15% 16%
1.A.1.b Petroleum refining 0.01 0.02 139% 17% <1% 2%
1.A.1.c Manufacture of Solid fuels & Other Energy Ind. NA NA NA NA NA NA
1.A.2 Manufacturing Industries and Construction 0.80 0.29 -63% -8% 37% 30%
1.A.2.a Iron and Steel 0.00 0.00 -40% 2% <1% <1%
1.A.2.b Non-ferrous Metals 0.01 0.01 16% 4% <1% 1%
1.A.2.c Chemicals 0.01 0.01 -24% 3% 1% 1%
1.A.2.d Pulp, Paper and Print 0.07 0.07 6% -5% 3% 7%
1.A.2.e Food Processing, Beverages and Tobacco 0.00 0.00 -55% 22% <1% <1%
1.A.2.f Non-metallic Minerals 0.70 0.17 -76% -14% 33% 17%
1.A.2.g Manufacturing Industries and Constr. - other 0.01 0.04 225% 7% 1% 4%
1.A.3 Transport 0.00 0.00 5% 1% <1% <1%
1.A.3.a Civil Aviation 0.00 0.00 212% 5% <1% <1%
1.A.3.b Road Transportation 0.00 0.00 64% 2% <1% <1%
1.A.3.c Railways 0.00 0.00 -92% -1% <1% <1%
1.A.3.d Navigation 0.00 0.00 -1% -15% <1% <1%
1.A.3.e Other transportation NA NA NA NA NA NA
1.A.4 Other Sectors 0.43 0.16 -63% 10% 20% 16%
1.A.4.a Commercial/Institutional 0.03 0.01 -75% 12% 1% 1%
1.A.4.b Residential 0.39 0.14 -65% 10% 18% 14%
1.A.4.c Agriculture/Forestry/Fisheries 0.01 0.02 16% 9% 1% 2%
1.A.5 Other 0.00 0.00 40% 1% <1% <1%
1.B FUGITIVE EMISSIONS FROM FUELS NA NA NA NA NA NA
2 INDUSTRIAL PROCESSES AND PRODUCT USE
0.53 0.32 -39% -4% 25% 33%
2.A MINERAL PRODUCTS NA NA NA NA NA NA
2.B CHEMICAL INDUSTRY 0.27 0.00 -100% <1% 13% <1%
2.C METAL PRODUCTION 0.26 0.32 26% -4% 12% 33% 2.D NON ENERGY PRODUCTS/ SOLVENTS NA NA NA NA NA NA 2.G Other product manufacture and use NA NA NA NA NA NA 2.H Other Processes NA NA NA NA NA NA 2.I Wood processing NA NA NA NA NA NA 2.J Production of POPs NO NO NO NO NO NO 2.K "Consumption of POPs and heavy metals NO NO NO NO NO NO
2.L Other production, consumption, storage, … NO NO NO NO NO NO
3 AGRICULTURE 0.00 0.00 -76% -24% <1% <1%
5 WASTE 0.05 0.02 -63% <1% 2% 2%
Total without sinks 2.14 0.97 -55% -2%
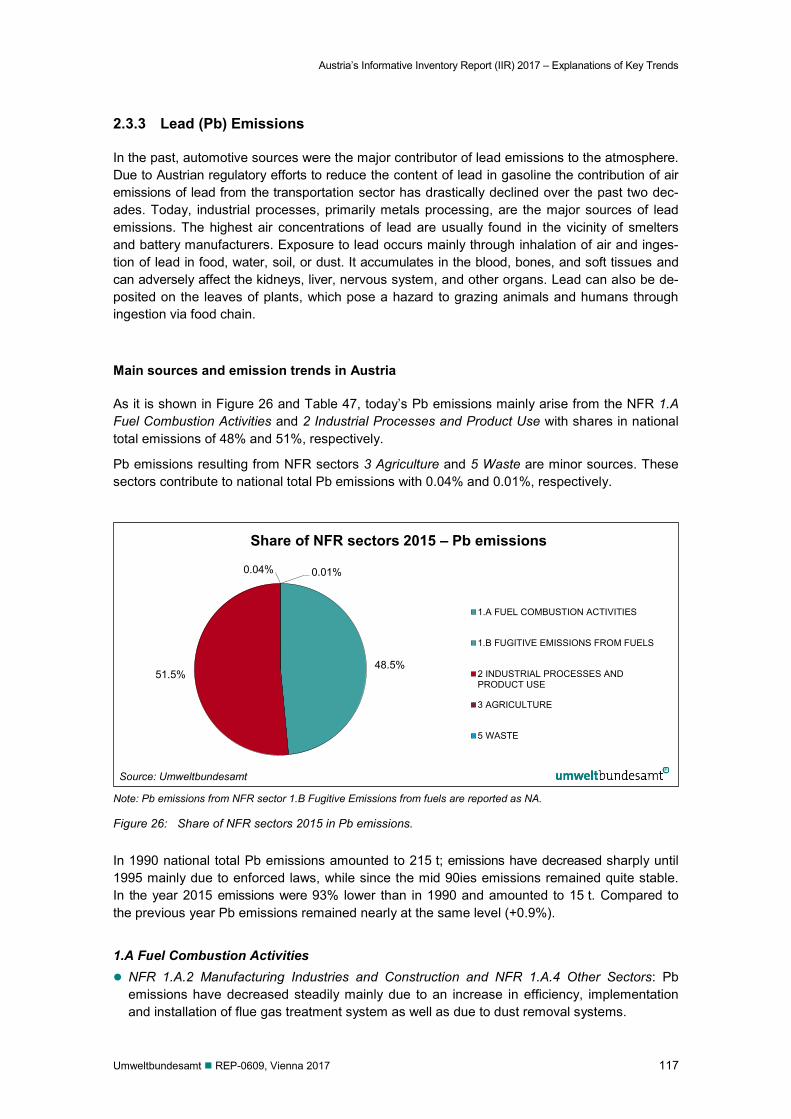
Austria’s Informative Inventory Report (IIR) 2017 – Explanations of Key Trends
Umweltbundesamt REP-0609, Vienna 2017 117
2.3.3 Lead (Pb) Emissions
In the past, automotive sources were the major contributor of lead emissions to the atmosphere. Due to Austrian regulatory efforts to reduce the content of lead in gasoline the contribution of air emissions of lead from the transportation sector has drastically declined over the past two dec-ades. Today, industrial processes, primarily metals processing, are the major sources of lead emissions. The highest air concentrations of lead are usually found in the vicinity of smelters and battery manufacturers. Exposure to lead occurs mainly through inhalation of air and inges-tion of lead in food, water, soil, or dust. It accumulates in the blood, bones, and soft tissues and can adversely affect the kidneys, liver, nervous system, and other organs. Lead can also be de-posited on the leaves of plants, which pose a hazard to grazing animals and humans through ingestion via food chain.
Main sources and emission trends in Austria
As it is shown in Figure 26 and Table 47, today’s Pb emissions mainly arise from the NFR 1.A Fuel Combustion Activities and 2 Industrial Processes and Product Use with shares in national total emissions of 48% and 51%, respectively.
Pb emissions resulting from NFR sectors 3 Agriculture and 5 Waste are minor sources. These sectors contribute to national total Pb emissions with 0.04% and 0.01%, respectively.
Note: Pb emissions from NFR sector 1.B Fugitive Emissions from fuels are reported as NA.
Figure 26: Share of NFR sectors 2015 in Pb emissions.
In 1990 national total Pb emissions amounted to 215 t; emissions have decreased sharply until 1995 mainly due to enforced laws, while since the mid 90ies emissions remained quite stable. In the year 2015 emissions were 93% lower than in 1990 and amounted to 15 t. Compared to the previous year Pb emissions remained nearly at the same level (+0.9%). 1.A Fuel Combustion Activities NFR 1.A.2 Manufacturing Industries and Construction and NFR 1.A.4 Other Sectors: Pb
emissions have decreased steadily mainly due to an increase in efficiency, implementation and installation of flue gas treatment system as well as due to dust removal systems.
48.5% 51.5%
0.04% 0.01%
Share of NFR sectors 2015 – Pb emissions
1.A FUEL COMBUSTION ACTIVITIES
1.B FUGITIVE EMISSIONS FROM FUELS
2 INDUSTRIAL PROCESSES ANDPRODUCT USE
3 AGRICULTURE
5 WASTE
Source: Umweltbundesamt
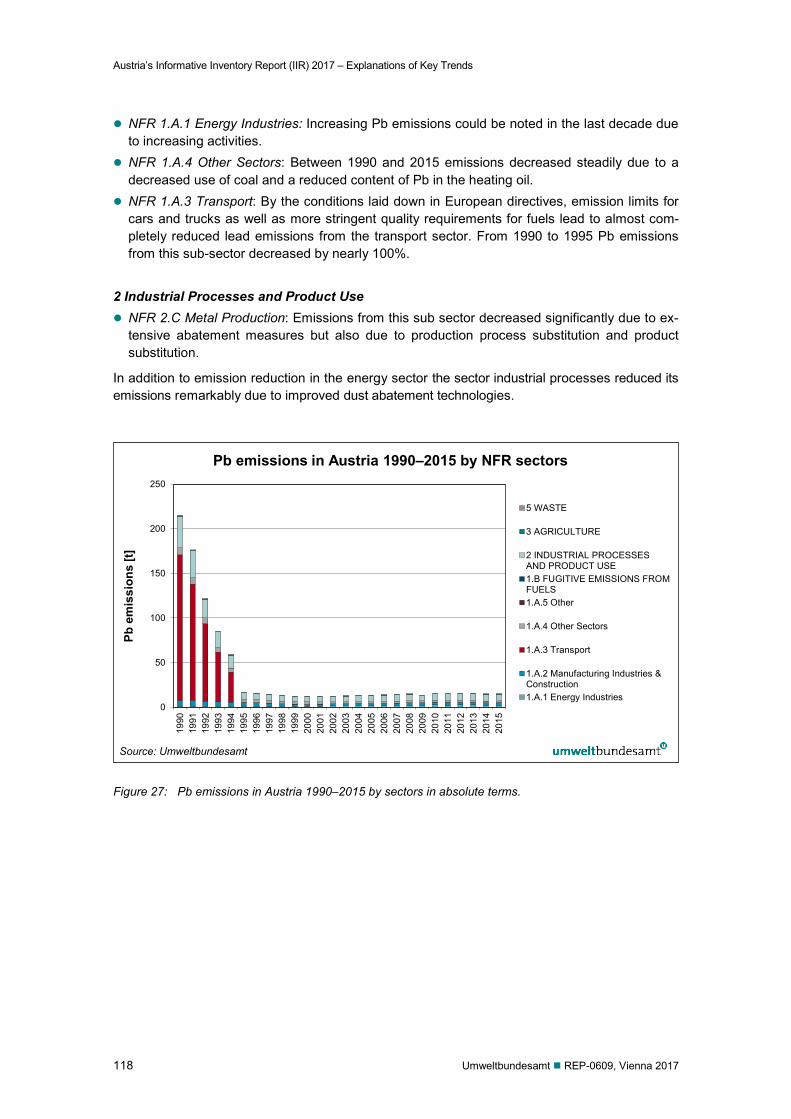
Austria’s Informative Inventory Report (IIR) 2017 – Explanations of Key Trends
118 Umweltbundesamt REP-0609, Vienna 2017
NFR 1.A.1 Energy Industries: Increasing Pb emissions could be noted in the last decade due to increasing activities.
NFR 1.A.4 Other Sectors: Between 1990 and 2015 emissions decreased steadily due to a decreased use of coal and a reduced content of Pb in the heating oil.
NFR 1.A.3 Transport: By the conditions laid down in European directives, emission limits for cars and trucks as well as more stringent quality requirements for fuels lead to almost com-pletely reduced lead emissions from the transport sector. From 1990 to 1995 Pb emissions from this sub-sector decreased by nearly 100%.
2 Industrial Processes and Product Use NFR 2.C Metal Production: Emissions from this sub sector decreased significantly due to ex-
tensive abatement measures but also due to production process substitution and product substitution.
In addition to emission reduction in the energy sector the sector industrial processes reduced its emissions remarkably due to improved dust abatement technologies.
Figure 27: Pb emissions in Austria 1990–2015 by sectors in absolute terms.
0
50
100
150
200
250
1990
1991
1992
1993
1994
1995
1996
1997
1998
1999
2000
2001
2002
2003
2004
2005
2006
2007
2008
2009
2010
2011
2012
2013
2014
2015
Pb e
mis
sion
s [t]
Pb emissions in Austria 1990–2015 by NFR sectors
5 WASTE
3 AGRICULTURE
2 INDUSTRIAL PROCESSESAND PRODUCT USE1.B FUGITIVE EMISSIONS FROMFUELS1.A.5 Other
1.A.4 Other Sectors
1.A.3 Transport
1.A.2 Manufacturing Industries &Construction1.A.1 Energy Industries
Source: Umweltbundesamt
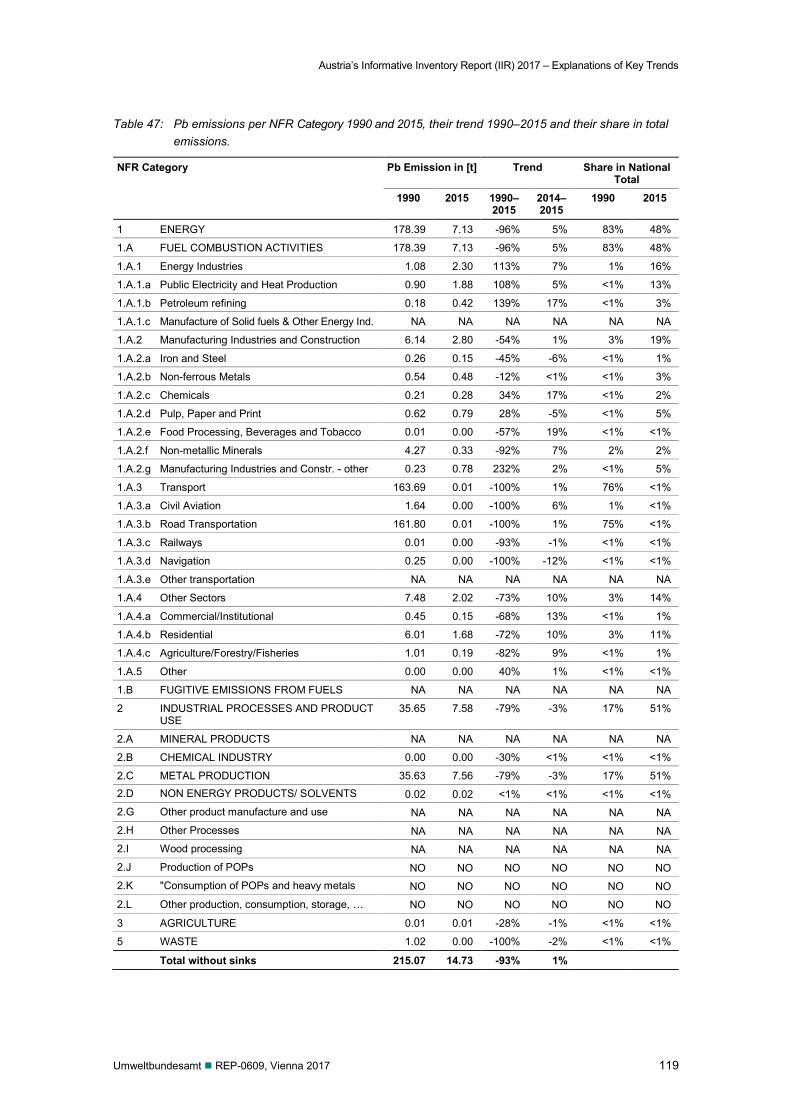
Austria’s Informative Inventory Report (IIR) 2017 – Explanations of Key Trends
Umweltbundesamt REP-0609, Vienna 2017 119
Table 47: Pb emissions per NFR Category 1990 and 2015, their trend 1990–2015 and their share in total emissions.
NFR Category Pb Emission in [t] Trend Share in National Total
1990 2015 1990–2015
2014–2015
1990 2015
1 ENERGY 178.39 7.13 -96% 5% 83% 48%
1.A FUEL COMBUSTION ACTIVITIES 178.39 7.13 -96% 5% 83% 48%
1.A.1 Energy Industries 1.08 2.30 113% 7% 1% 16%
1.A.1.a Public Electricity and Heat Production 0.90 1.88 108% 5% <1% 13%
1.A.1.b Petroleum refining 0.18 0.42 139% 17% <1% 3%
1.A.1.c Manufacture of Solid fuels & Other Energy Ind. NA NA NA NA NA NA
1.A.2 Manufacturing Industries and Construction 6.14 2.80 -54% 1% 3% 19%
1.A.2.a Iron and Steel 0.26 0.15 -45% -6% <1% 1%
1.A.2.b Non-ferrous Metals 0.54 0.48 -12% <1% <1% 3%
1.A.2.c Chemicals 0.21 0.28 34% 17% <1% 2%
1.A.2.d Pulp, Paper and Print 0.62 0.79 28% -5% <1% 5%
1.A.2.e Food Processing, Beverages and Tobacco 0.01 0.00 -57% 19% <1% <1%
1.A.2.f Non-metallic Minerals 4.27 0.33 -92% 7% 2% 2%
1.A.2.g Manufacturing Industries and Constr. - other 0.23 0.78 232% 2% <1% 5%
1.A.3 Transport 163.69 0.01 -100% 1% 76% <1%
1.A.3.a Civil Aviation 1.64 0.00 -100% 6% 1% <1%
1.A.3.b Road Transportation 161.80 0.01 -100% 1% 75% <1%
1.A.3.c Railways 0.01 0.00 -93% -1% <1% <1%
1.A.3.d Navigation 0.25 0.00 -100% -12% <1% <1%
1.A.3.e Other transportation NA NA NA NA NA NA
1.A.4 Other Sectors 7.48 2.02 -73% 10% 3% 14%
1.A.4.a Commercial/Institutional 0.45 0.15 -68% 13% <1% 1%
1.A.4.b Residential 6.01 1.68 -72% 10% 3% 11%
1.A.4.c Agriculture/Forestry/Fisheries 1.01 0.19 -82% 9% <1% 1%
1.A.5 Other 0.00 0.00 40% 1% <1% <1%
1.B FUGITIVE EMISSIONS FROM FUELS NA NA NA NA NA NA
2 INDUSTRIAL PROCESSES AND PRODUCT USE
35.65 7.58 -79% -3% 17% 51%
2.A MINERAL PRODUCTS NA NA NA NA NA NA
2.B CHEMICAL INDUSTRY 0.00 0.00 -30% <1% <1% <1%
2.C METAL PRODUCTION 35.63 7.56 -79% -3% 17% 51% 2.D NON ENERGY PRODUCTS/ SOLVENTS 0.02 0.02 <1% <1% <1% <1% 2.G Other product manufacture and use NA NA NA NA NA NA 2.H Other Processes NA NA NA NA NA NA 2.I Wood processing NA NA NA NA NA NA 2.J Production of POPs NO NO NO NO NO NO 2.K "Consumption of POPs and heavy metals NO NO NO NO NO NO
2.L Other production, consumption, storage, … NO NO NO NO NO NO
3 AGRICULTURE 0.01 0.01 -28% -1% <1% <1%
5 WASTE 1.02 0.00 -100% -2% <1% <1%
Total without sinks 215.07 14.73 -93% 1%
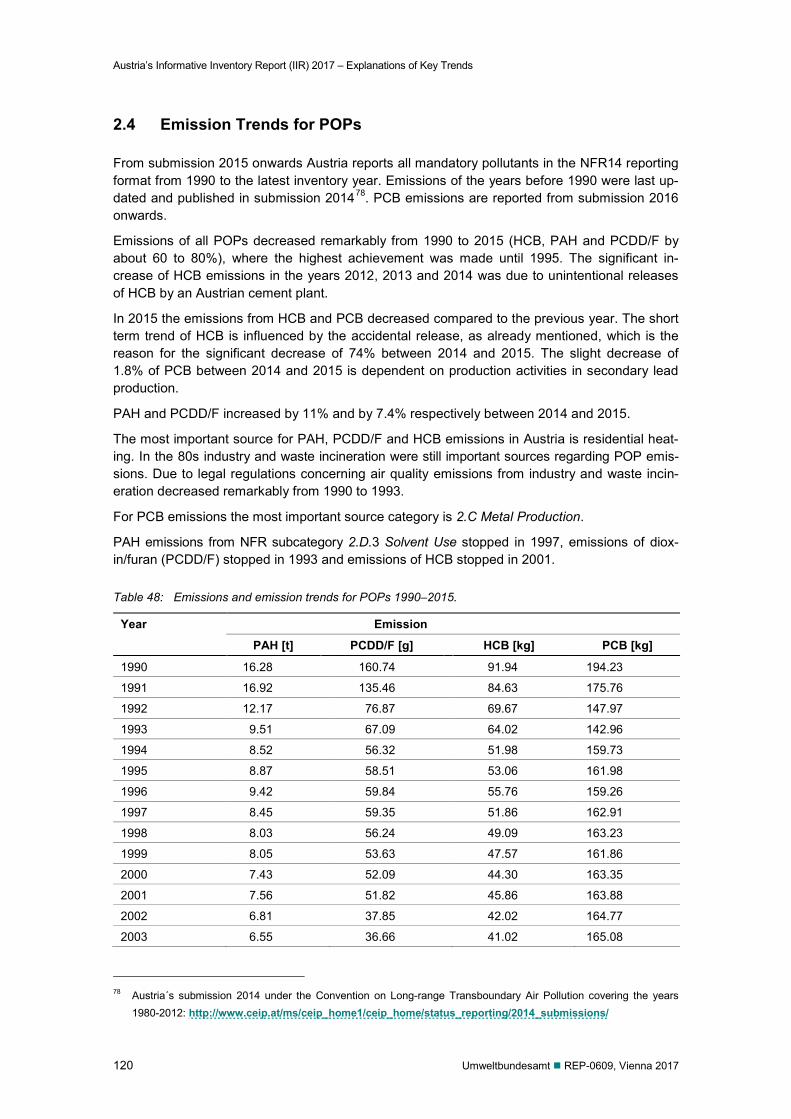
Austria’s Informative Inventory Report (IIR) 2017 – Explanations of Key Trends
120 Umweltbundesamt REP-0609, Vienna 2017
2.4 Emission Trends for POPs
From submission 2015 onwards Austria reports all mandatory pollutants in the NFR14 reporting format from 1990 to the latest inventory year. Emissions of the years before 1990 were last up-dated and published in submission 201478. PCB emissions are reported from submission 2016 onwards.
Emissions of all POPs decreased remarkably from 1990 to 2015 (HCB, PAH and PCDD/F by about 60 to 80%), where the highest achievement was made until 1995. The significant in-crease of HCB emissions in the years 2012, 2013 and 2014 was due to unintentional releases of HCB by an Austrian cement plant.
In 2015 the emissions from HCB and PCB decreased compared to the previous year. The short term trend of HCB is influenced by the accidental release, as already mentioned, which is the reason for the significant decrease of 74% between 2014 and 2015. The slight decrease of 1.8% of PCB between 2014 and 2015 is dependent on production activities in secondary lead production.
PAH and PCDD/F increased by 11% and by 7.4% respectively between 2014 and 2015.
The most important source for PAH, PCDD/F and HCB emissions in Austria is residential heat-ing. In the 80s industry and waste incineration were still important sources regarding POP emis-sions. Due to legal regulations concerning air quality emissions from industry and waste incin-eration decreased remarkably from 1990 to 1993.
For PCB emissions the most important source category is 2.C Metal Production.
PAH emissions from NFR subcategory 2.D.3 Solvent Use stopped in 1997, emissions of diox-in/furan (PCDD/F) stopped in 1993 and emissions of HCB stopped in 2001.
Table 48: Emissions and emission trends for POPs 1990–2015.
Year Emission
PAH [t] PCDD/F [g] HCB [kg] PCB [kg]
1990 16.28 160.74 91.94 194.23
1991 16.92 135.46 84.63 175.76
1992 12.17 76.87 69.67 147.97
1993 9.51 67.09 64.02 142.96
1994 8.52 56.32 51.98 159.73
1995 8.87 58.51 53.06 161.98
1996 9.42 59.84 55.76 159.26
1997 8.45 59.35 51.86 162.91
1998 8.03 56.24 49.09 163.23
1999 8.05 53.63 47.57 161.86
2000 7.43 52.09 44.30 163.35
2001 7.56 51.82 45.86 163.88
2002 6.81 37.85 42.02 164.77
2003 6.55 36.66 41.02 165.08
78 Austria´s submission 2014 under the Convention on Long-range Transboundary Air Pollution covering the years
1980-2012: http://www.ceip.at/ms/ceip_home1/ceip_home/status_reporting/2014_submissions/
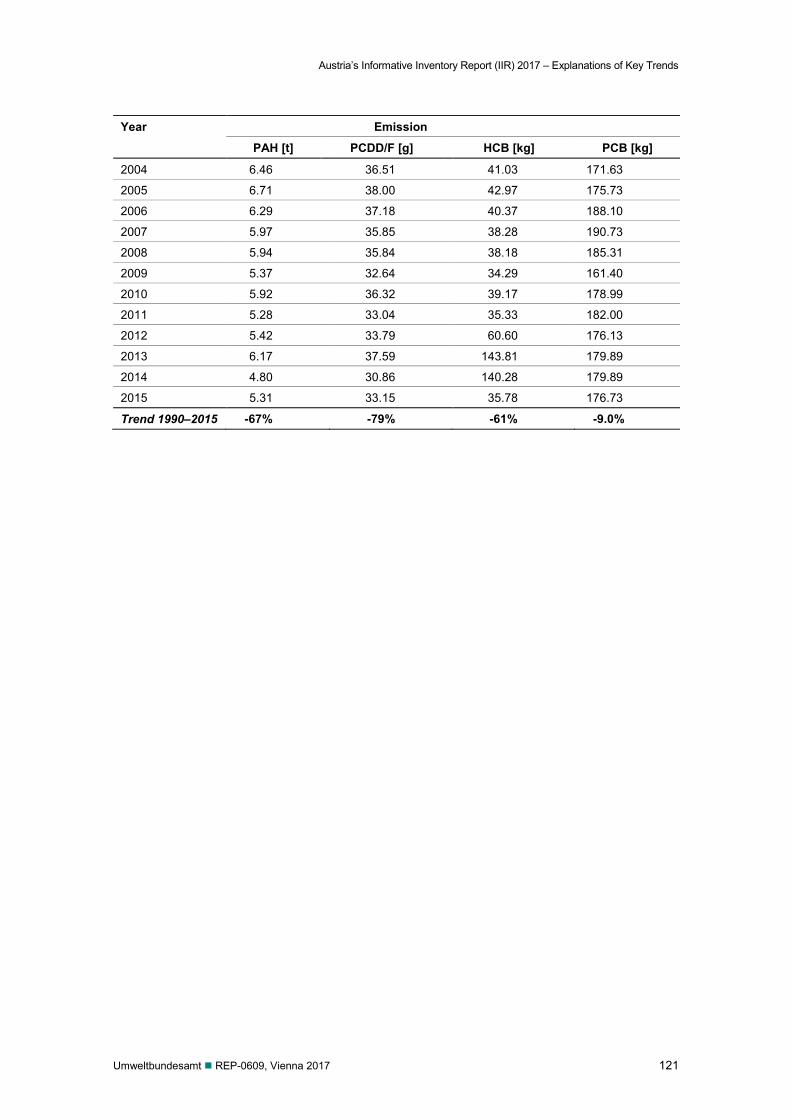
Austria’s Informative Inventory Report (IIR) 2017 – Explanations of Key Trends
Umweltbundesamt REP-0609, Vienna 2017 121
Year Emission
PAH [t] PCDD/F [g] HCB [kg] PCB [kg]
2004 6.46 36.51 41.03 171.63
2005 6.71 38.00 42.97 175.73
2006 6.29 37.18 40.37 188.10
2007 5.97 35.85 38.28 190.73
2008 5.94 35.84 38.18 185.31
2009 5.37 32.64 34.29 161.40
2010 5.92 36.32 39.17 178.99
2011 5.28 33.04 35.33 182.00
2012 5.42 33.79 60.60 176.13
2013 6.17 37.59 143.81 179.89
2014 4.80 30.86 140.28 179.89
2015 5.31 33.15 35.78 176.73
Trend 1990–2015 -67% -79% -61% -9.0%
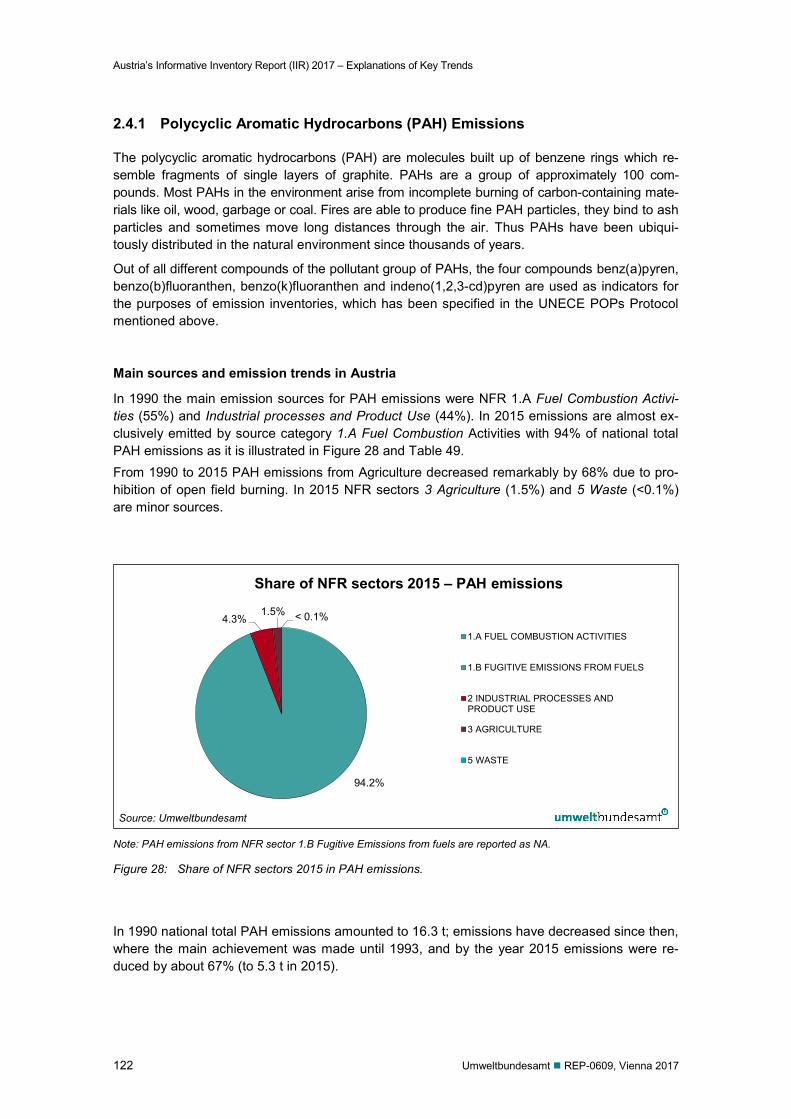
Austria’s Informative Inventory Report (IIR) 2017 – Explanations of Key Trends
122 Umweltbundesamt REP-0609, Vienna 2017
2.4.1 Polycyclic Aromatic Hydrocarbons (PAH) Emissions
The polycyclic aromatic hydrocarbons (PAH) are molecules built up of benzene rings which re-semble fragments of single layers of graphite. PAHs are a group of approximately 100 com-pounds. Most PAHs in the environment arise from incomplete burning of carbon-containing mate-rials like oil, wood, garbage or coal. Fires are able to produce fine PAH particles, they bind to ash particles and sometimes move long distances through the air. Thus PAHs have been ubiqui-tously distributed in the natural environment since thousands of years.
Out of all different compounds of the pollutant group of PAHs, the four compounds benz(a)pyren, benzo(b)fluoranthen, benzo(k)fluoranthen and indeno(1,2,3-cd)pyren are used as indicators for the purposes of emission inventories, which has been specified in the UNECE POPs Protocol mentioned above.
Main sources and emission trends in Austria
In 1990 the main emission sources for PAH emissions were NFR 1.A Fuel Combustion Activi-ties (55%) and Industrial processes and Product Use (44%). In 2015 emissions are almost ex-clusively emitted by source category 1.A Fuel Combustion Activities with 94% of national total PAH emissions as it is illustrated in Figure 28 and Table 49. From 1990 to 2015 PAH emissions from Agriculture decreased remarkably by 68% due to pro-hibition of open field burning. In 2015 NFR sectors 3 Agriculture (1.5%) and 5 Waste (<0.1%) are minor sources.
Note: PAH emissions from NFR sector 1.B Fugitive Emissions from fuels are reported as NA.
Figure 28: Share of NFR sectors 2015 in PAH emissions.
In 1990 national total PAH emissions amounted to 16.3 t; emissions have decreased since then, where the main achievement was made until 1993, and by the year 2015 emissions were re-duced by about 67% (to 5.3 t in 2015).
94.2%
4.3% 1.5% < 0.1%
Share of NFR sectors 2015 – PAH emissions
1.A FUEL COMBUSTION ACTIVITIES
1.B FUGITIVE EMISSIONS FROM FUELS
2 INDUSTRIAL PROCESSES ANDPRODUCT USE
3 AGRICULTURE
5 WASTE
Source: Umweltbundesamt
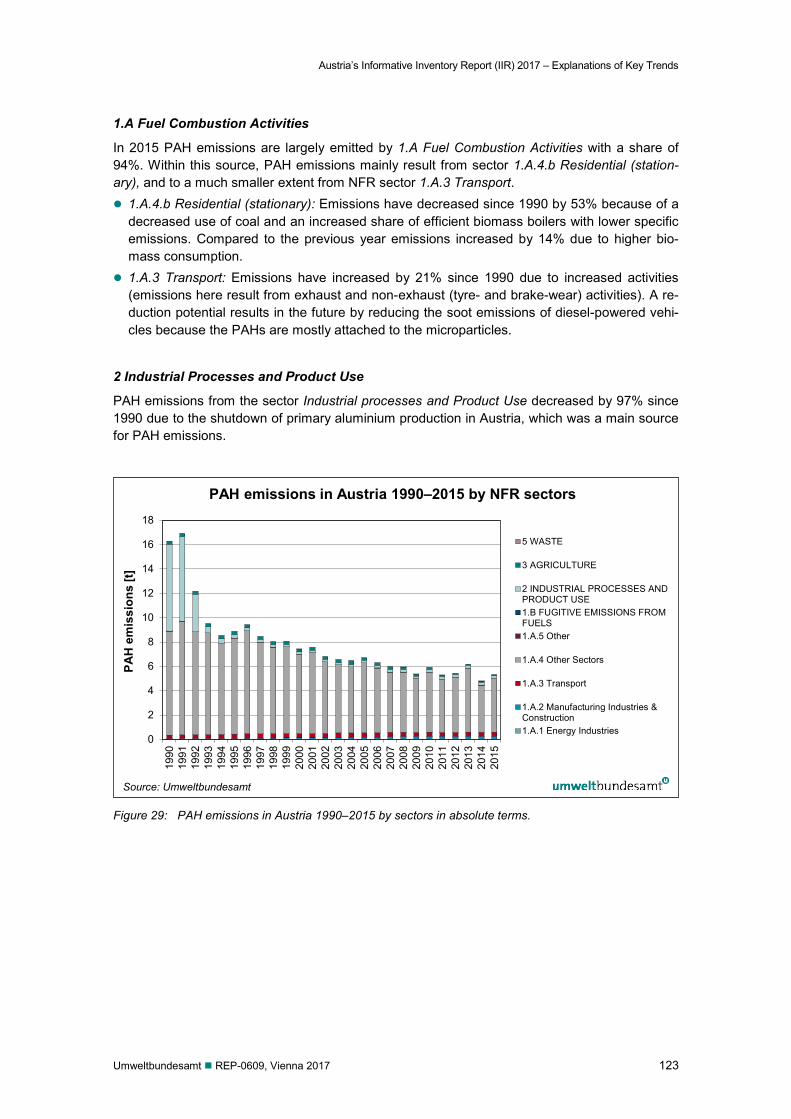
Austria’s Informative Inventory Report (IIR) 2017 – Explanations of Key Trends
Umweltbundesamt REP-0609, Vienna 2017 123
1.A Fuel Combustion Activities
In 2015 PAH emissions are largely emitted by 1.A Fuel Combustion Activities with a share of 94%. Within this source, PAH emissions mainly result from sector 1.A.4.b Residential (station-ary), and to a much smaller extent from NFR sector 1.A.3 Transport. 1.A.4.b Residential (stationary): Emissions have decreased since 1990 by 53% because of a
decreased use of coal and an increased share of efficient biomass boilers with lower specific emissions. Compared to the previous year emissions increased by 14% due to higher bio-mass consumption.
1.A.3 Transport: Emissions have increased by 21% since 1990 due to increased activities (emissions here result from exhaust and non-exhaust (tyre- and brake-wear) activities). A re-duction potential results in the future by reducing the soot emissions of diesel-powered vehi-cles because the PAHs are mostly attached to the microparticles.
2 Industrial Processes and Product Use
PAH emissions from the sector Industrial processes and Product Use decreased by 97% since 1990 due to the shutdown of primary aluminium production in Austria, which was a main source for PAH emissions.
Figure 29: PAH emissions in Austria 1990–2015 by sectors in absolute terms.
0
2
4
6
8
10
12
14
16
18
1990
1991
1992
1993
1994
1995
1996
1997
1998
1999
2000
2001
2002
2003
2004
2005
2006
2007
2008
2009
2010
2011
2012
2013
2014
2015
PAH
em
issi
ons
[t]
PAH emissions in Austria 1990–2015 by NFR sectors
5 WASTE
3 AGRICULTURE
2 INDUSTRIAL PROCESSES ANDPRODUCT USE1.B FUGITIVE EMISSIONS FROMFUELS1.A.5 Other
1.A.4 Other Sectors
1.A.3 Transport
1.A.2 Manufacturing Industries &Construction1.A.1 Energy Industries
Source: Umweltbundesamt
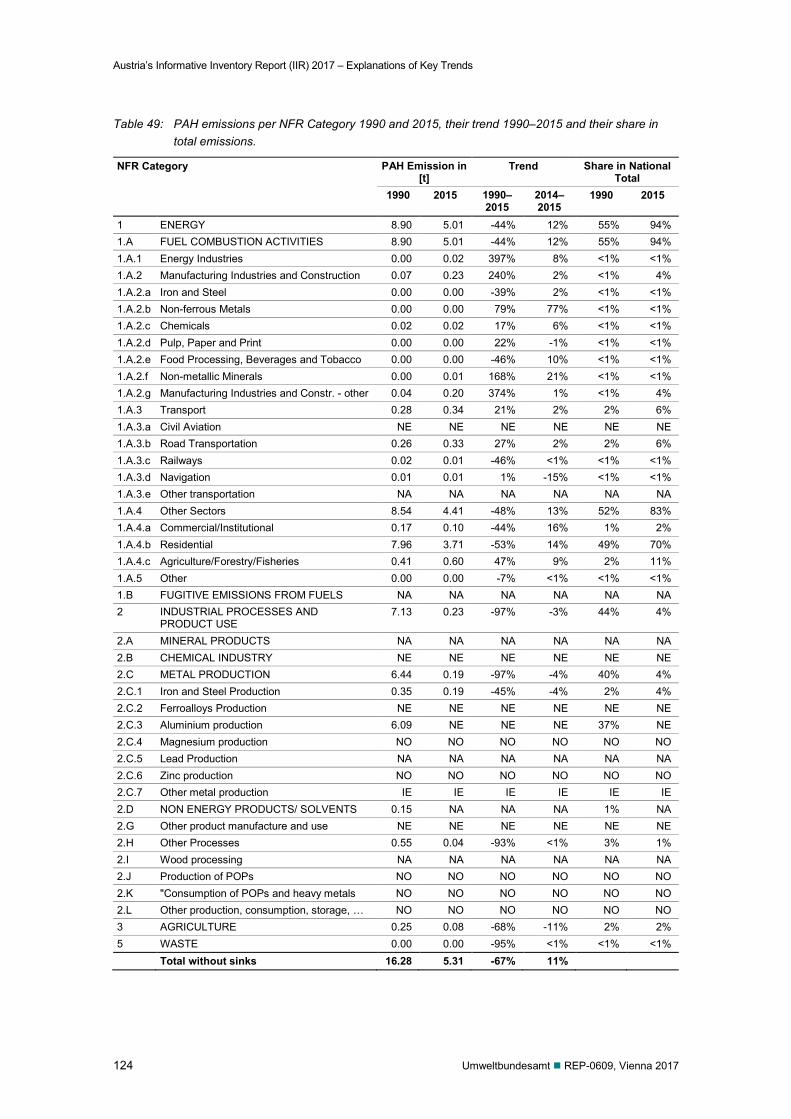
Austria’s Informative Inventory Report (IIR) 2017 – Explanations of Key Trends
124 Umweltbundesamt REP-0609, Vienna 2017
Table 49: PAH emissions per NFR Category 1990 and 2015, their trend 1990–2015 and their share in total emissions.
NFR Category PAH Emission in [t]
Trend Share in National Total
1990 2015 1990–2015
2014– 2015
1990 2015
1 ENERGY 8.90 5.01 -44% 12% 55% 94% 1.A FUEL COMBUSTION ACTIVITIES 8.90 5.01 -44% 12% 55% 94% 1.A.1 Energy Industries 0.00 0.02 397% 8% <1% <1% 1.A.2 Manufacturing Industries and Construction 0.07 0.23 240% 2% <1% 4% 1.A.2.a Iron and Steel 0.00 0.00 -39% 2% <1% <1% 1.A.2.b Non-ferrous Metals 0.00 0.00 79% 77% <1% <1% 1.A.2.c Chemicals 0.02 0.02 17% 6% <1% <1% 1.A.2.d Pulp, Paper and Print 0.00 0.00 22% -1% <1% <1% 1.A.2.e Food Processing, Beverages and Tobacco 0.00 0.00 -46% 10% <1% <1% 1.A.2.f Non-metallic Minerals 0.00 0.01 168% 21% <1% <1% 1.A.2.g Manufacturing Industries and Constr. - other 0.04 0.20 374% 1% <1% 4% 1.A.3 Transport 0.28 0.34 21% 2% 2% 6% 1.A.3.a Civil Aviation NE NE NE NE NE NE 1.A.3.b Road Transportation 0.26 0.33 27% 2% 2% 6% 1.A.3.c Railways 0.02 0.01 -46% <1% <1% <1% 1.A.3.d Navigation 0.01 0.01 1% -15% <1% <1% 1.A.3.e Other transportation NA NA NA NA NA NA 1.A.4 Other Sectors 8.54 4.41 -48% 13% 52% 83% 1.A.4.a Commercial/Institutional 0.17 0.10 -44% 16% 1% 2% 1.A.4.b Residential 7.96 3.71 -53% 14% 49% 70% 1.A.4.c Agriculture/Forestry/Fisheries 0.41 0.60 47% 9% 2% 11% 1.A.5 Other 0.00 0.00 -7% <1% <1% <1% 1.B FUGITIVE EMISSIONS FROM FUELS NA NA NA NA NA NA 2 INDUSTRIAL PROCESSES AND
PRODUCT USE 7.13 0.23 -97% -3% 44% 4%
2.A MINERAL PRODUCTS NA NA NA NA NA NA 2.B CHEMICAL INDUSTRY NE NE NE NE NE NE 2.C METAL PRODUCTION 6.44 0.19 -97% -4% 40% 4% 2.C.1 Iron and Steel Production 0.35 0.19 -45% -4% 2% 4% 2.C.2 Ferroalloys Production NE NE NE NE NE NE 2.C.3 Aluminium production 6.09 NE NE NE 37% NE 2.C.4 Magnesium production NO NO NO NO NO NO 2.C.5 Lead Production NA NA NA NA NA NA 2.C.6 Zinc production NO NO NO NO NO NO 2.C.7 Other metal production IE IE IE IE IE IE 2.D NON ENERGY PRODUCTS/ SOLVENTS 0.15 NA NA NA 1% NA 2.G Other product manufacture and use NE NE NE NE NE NE 2.H Other Processes 0.55 0.04 -93% <1% 3% 1% 2.I Wood processing NA NA NA NA NA NA 2.J Production of POPs NO NO NO NO NO NO 2.K "Consumption of POPs and heavy metals NO NO NO NO NO NO 2.L Other production, consumption, storage, … NO NO NO NO NO NO 3 AGRICULTURE 0.25 0.08 -68% -11% 2% 2% 5 WASTE 0.00 0.00 -95% <1% <1% <1% Total without sinks 16.28 5.31 -67% 11%
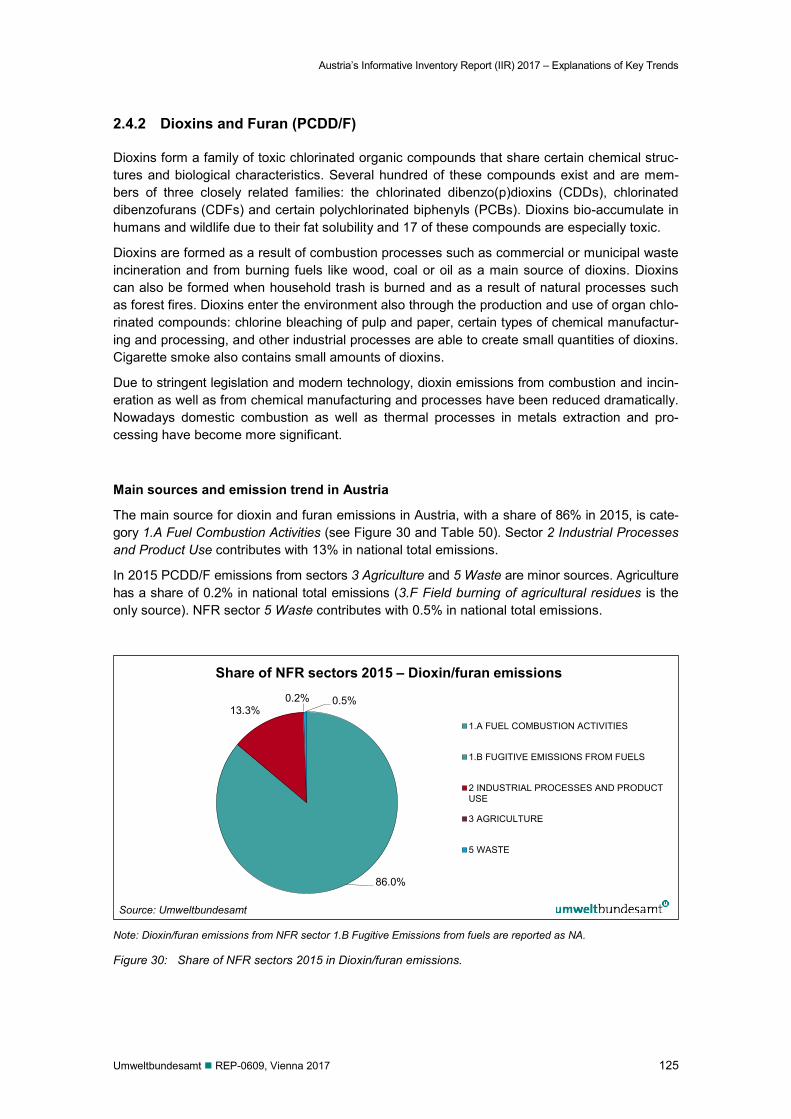
Austria’s Informative Inventory Report (IIR) 2017 – Explanations of Key Trends
Umweltbundesamt REP-0609, Vienna 2017 125
2.4.2 Dioxins and Furan (PCDD/F)
Dioxins form a family of toxic chlorinated organic compounds that share certain chemical struc-tures and biological characteristics. Several hundred of these compounds exist and are mem-bers of three closely related families: the chlorinated dibenzo(p)dioxins (CDDs), chlorinated dibenzofurans (CDFs) and certain polychlorinated biphenyls (PCBs). Dioxins bio-accumulate in humans and wildlife due to their fat solubility and 17 of these compounds are especially toxic.
Dioxins are formed as a result of combustion processes such as commercial or municipal waste incineration and from burning fuels like wood, coal or oil as a main source of dioxins. Dioxins can also be formed when household trash is burned and as a result of natural processes such as forest fires. Dioxins enter the environment also through the production and use of organ chlo-rinated compounds: chlorine bleaching of pulp and paper, certain types of chemical manufactur-ing and processing, and other industrial processes are able to create small quantities of dioxins. Cigarette smoke also contains small amounts of dioxins.
Due to stringent legislation and modern technology, dioxin emissions from combustion and incin-eration as well as from chemical manufacturing and processes have been reduced dramatically. Nowadays domestic combustion as well as thermal processes in metals extraction and pro-cessing have become more significant.
Main sources and emission trend in Austria
The main source for dioxin and furan emissions in Austria, with a share of 86% in 2015, is cate-gory 1.A Fuel Combustion Activities (see Figure 30 and Table 50). Sector 2 Industrial Processes and Product Use contributes with 13% in national total emissions.
In 2015 PCDD/F emissions from sectors 3 Agriculture and 5 Waste are minor sources. Agriculture has a share of 0.2% in national total emissions (3.F Field burning of agricultural residues is the only source). NFR sector 5 Waste contributes with 0.5% in national total emissions.
Note: Dioxin/furan emissions from NFR sector 1.B Fugitive Emissions from fuels are reported as NA.
Figure 30: Share of NFR sectors 2015 in Dioxin/furan emissions.
86.0%
13.3% 0.2% 0.5%
Share of NFR sectors 2015 – Dioxin/furan emissions
1.A FUEL COMBUSTION ACTIVITIES
1.B FUGITIVE EMISSIONS FROM FUELS
2 INDUSTRIAL PROCESSES AND PRODUCTUSE
3 AGRICULTURE
5 WASTE
Source: Umweltbundesamt
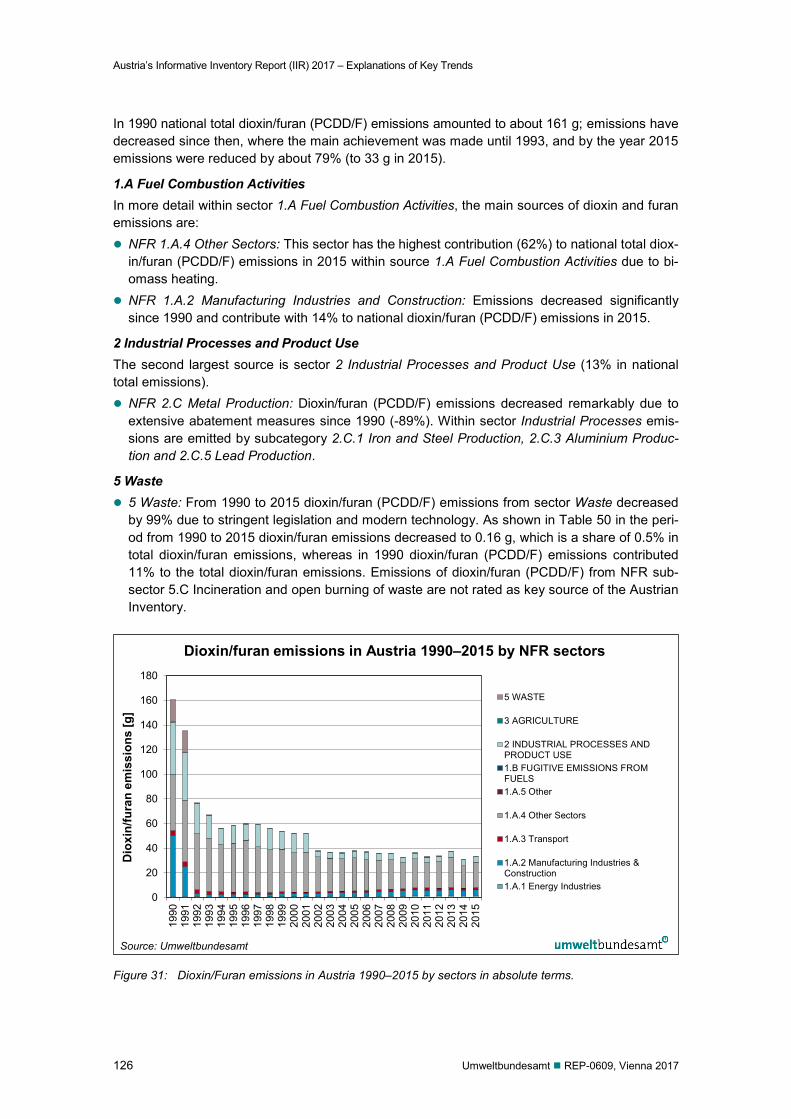
Austria’s Informative Inventory Report (IIR) 2017 – Explanations of Key Trends
126 Umweltbundesamt REP-0609, Vienna 2017
In 1990 national total dioxin/furan (PCDD/F) emissions amounted to about 161 g; emissions have decreased since then, where the main achievement was made until 1993, and by the year 2015 emissions were reduced by about 79% (to 33 g in 2015).
1.A Fuel Combustion Activities In more detail within sector 1.A Fuel Combustion Activities, the main sources of dioxin and furan emissions are: NFR 1.A.4 Other Sectors: This sector has the highest contribution (62%) to national total diox-
in/furan (PCDD/F) emissions in 2015 within source 1.A Fuel Combustion Activities due to bi-omass heating.
NFR 1.A.2 Manufacturing Industries and Construction: Emissions decreased significantly since 1990 and contribute with 14% to national dioxin/furan (PCDD/F) emissions in 2015.
2 Industrial Processes and Product Use The second largest source is sector 2 Industrial Processes and Product Use (13% in national total emissions). NFR 2.C Metal Production: Dioxin/furan (PCDD/F) emissions decreased remarkably due to
extensive abatement measures since 1990 (-89%). Within sector Industrial Processes emis-sions are emitted by subcategory 2.C.1 Iron and Steel Production, 2.C.3 Aluminium Produc-tion and 2.C.5 Lead Production.
5 Waste 5 Waste: From 1990 to 2015 dioxin/furan (PCDD/F) emissions from sector Waste decreased
by 99% due to stringent legislation and modern technology. As shown in Table 50 in the peri-od from 1990 to 2015 dioxin/furan emissions decreased to 0.16 g, which is a share of 0.5% in total dioxin/furan emissions, whereas in 1990 dioxin/furan (PCDD/F) emissions contributed 11% to the total dioxin/furan emissions. Emissions of dioxin/furan (PCDD/F) from NFR sub-sector 5.C Incineration and open burning of waste are not rated as key source of the Austrian Inventory.
Figure 31: Dioxin/Furan emissions in Austria 1990–2015 by sectors in absolute terms.
0
20
40
60
80
100
120
140
160
180
1990
1991
1992
1993
1994
1995
1996
1997
1998
1999
2000
2001
2002
2003
2004
2005
2006
2007
2008
2009
2010
2011
2012
2013
2014
2015
Dio
xin/
fura
n em
issi
ons
[g]
Dioxin/furan emissions in Austria 1990–2015 by NFR sectors
5 WASTE
3 AGRICULTURE
2 INDUSTRIAL PROCESSES ANDPRODUCT USE1.B FUGITIVE EMISSIONS FROMFUELS1.A.5 Other
1.A.4 Other Sectors
1.A.3 Transport
1.A.2 Manufacturing Industries &Construction1.A.1 Energy Industries
Source: Umweltbundesamt
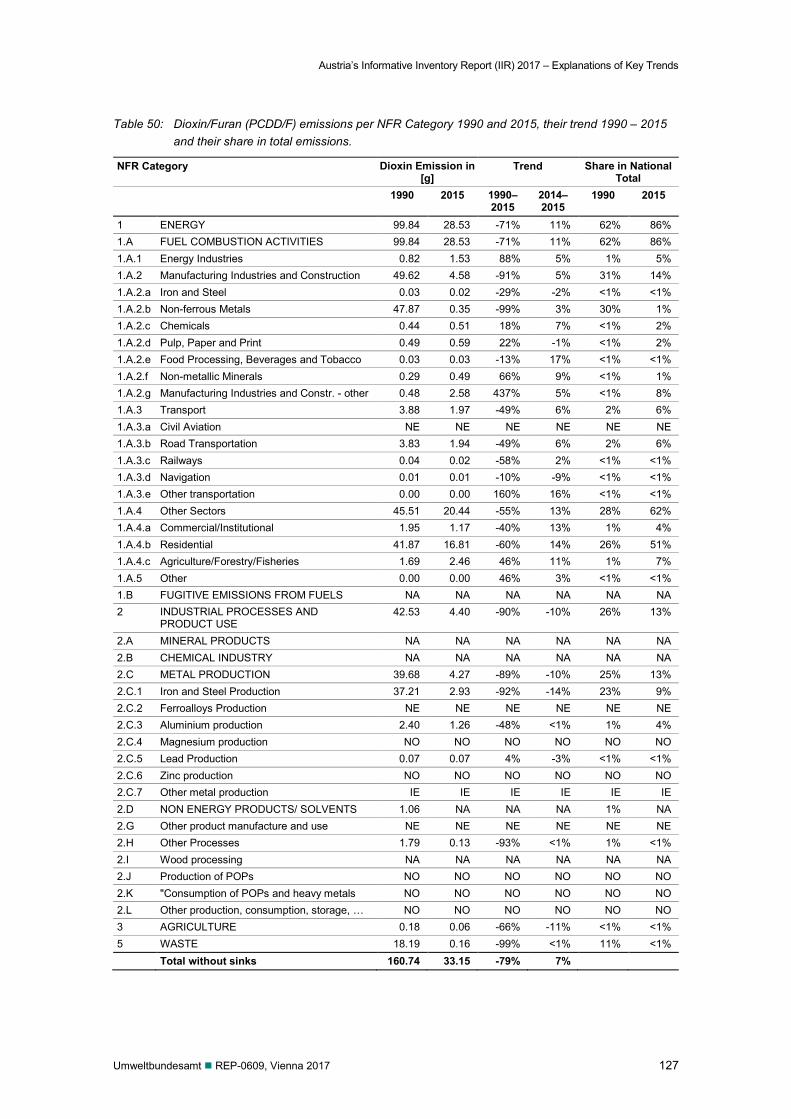
Austria’s Informative Inventory Report (IIR) 2017 – Explanations of Key Trends
Umweltbundesamt REP-0609, Vienna 2017 127
Table 50: Dioxin/Furan (PCDD/F) emissions per NFR Category 1990 and 2015, their trend 1990 – 2015 and their share in total emissions.
NFR Category Dioxin Emission in [g]
Trend Share in National Total
1990 2015 1990–2015
2014–2015
1990 2015
1 ENERGY 99.84 28.53 -71% 11% 62% 86% 1.A FUEL COMBUSTION ACTIVITIES 99.84 28.53 -71% 11% 62% 86% 1.A.1 Energy Industries 0.82 1.53 88% 5% 1% 5% 1.A.2 Manufacturing Industries and Construction 49.62 4.58 -91% 5% 31% 14% 1.A.2.a Iron and Steel 0.03 0.02 -29% -2% <1% <1% 1.A.2.b Non-ferrous Metals 47.87 0.35 -99% 3% 30% 1% 1.A.2.c Chemicals 0.44 0.51 18% 7% <1% 2% 1.A.2.d Pulp, Paper and Print 0.49 0.59 22% -1% <1% 2% 1.A.2.e Food Processing, Beverages and Tobacco 0.03 0.03 -13% 17% <1% <1% 1.A.2.f Non-metallic Minerals 0.29 0.49 66% 9% <1% 1% 1.A.2.g Manufacturing Industries and Constr. - other 0.48 2.58 437% 5% <1% 8% 1.A.3 Transport 3.88 1.97 -49% 6% 2% 6% 1.A.3.a Civil Aviation NE NE NE NE NE NE 1.A.3.b Road Transportation 3.83 1.94 -49% 6% 2% 6% 1.A.3.c Railways 0.04 0.02 -58% 2% <1% <1% 1.A.3.d Navigation 0.01 0.01 -10% -9% <1% <1% 1.A.3.e Other transportation 0.00 0.00 160% 16% <1% <1% 1.A.4 Other Sectors 45.51 20.44 -55% 13% 28% 62% 1.A.4.a Commercial/Institutional 1.95 1.17 -40% 13% 1% 4% 1.A.4.b Residential 41.87 16.81 -60% 14% 26% 51% 1.A.4.c Agriculture/Forestry/Fisheries 1.69 2.46 46% 11% 1% 7% 1.A.5 Other 0.00 0.00 46% 3% <1% <1% 1.B FUGITIVE EMISSIONS FROM FUELS NA NA NA NA NA NA 2 INDUSTRIAL PROCESSES AND
PRODUCT USE 42.53 4.40 -90% -10% 26% 13%
2.A MINERAL PRODUCTS NA NA NA NA NA NA 2.B CHEMICAL INDUSTRY NA NA NA NA NA NA 2.C METAL PRODUCTION 39.68 4.27 -89% -10% 25% 13% 2.C.1 Iron and Steel Production 37.21 2.93 -92% -14% 23% 9% 2.C.2 Ferroalloys Production NE NE NE NE NE NE 2.C.3 Aluminium production 2.40 1.26 -48% <1% 1% 4% 2.C.4 Magnesium production NO NO NO NO NO NO 2.C.5 Lead Production 0.07 0.07 4% -3% <1% <1% 2.C.6 Zinc production NO NO NO NO NO NO 2.C.7 Other metal production IE IE IE IE IE IE 2.D NON ENERGY PRODUCTS/ SOLVENTS 1.06 NA NA NA 1% NA 2.G Other product manufacture and use NE NE NE NE NE NE 2.H Other Processes 1.79 0.13 -93% <1% 1% <1% 2.I Wood processing NA NA NA NA NA NA 2.J Production of POPs NO NO NO NO NO NO 2.K "Consumption of POPs and heavy metals NO NO NO NO NO NO 2.L Other production, consumption, storage, … NO NO NO NO NO NO 3 AGRICULTURE 0.18 0.06 -66% -11% <1% <1% 5 WASTE 18.19 0.16 -99% <1% 11% <1% Total without sinks 160.74 33.15 -79% 7%
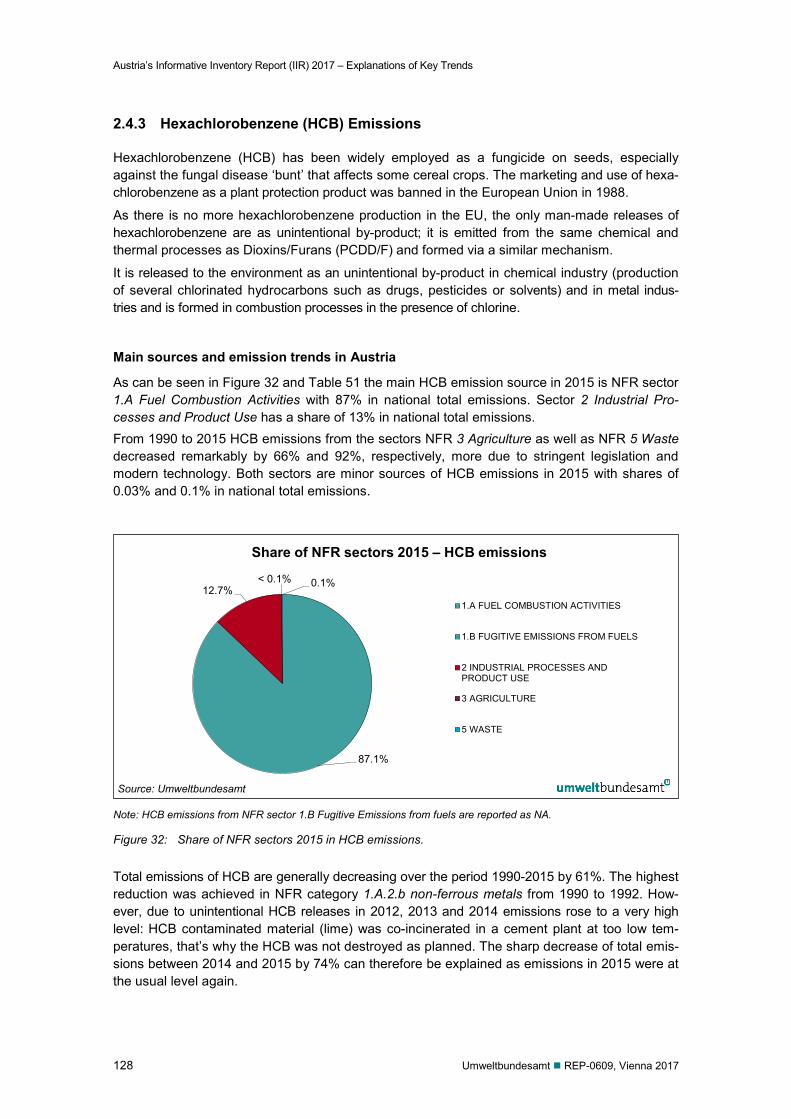
Austria’s Informative Inventory Report (IIR) 2017 – Explanations of Key Trends
128 Umweltbundesamt REP-0609, Vienna 2017
2.4.3 Hexachlorobenzene (HCB) Emissions
Hexachlorobenzene (HCB) has been widely employed as a fungicide on seeds, especially against the fungal disease ‘bunt’ that affects some cereal crops. The marketing and use of hexa-chlorobenzene as a plant protection product was banned in the European Union in 1988.
As there is no more hexachlorobenzene production in the EU, the only man-made releases of hexachlorobenzene are as unintentional by-product; it is emitted from the same chemical and thermal processes as Dioxins/Furans (PCDD/F) and formed via a similar mechanism.
It is released to the environment as an unintentional by-product in chemical industry (production of several chlorinated hydrocarbons such as drugs, pesticides or solvents) and in metal indus-tries and is formed in combustion processes in the presence of chlorine.
Main sources and emission trends in Austria
As can be seen in Figure 32 and Table 51 the main HCB emission source in 2015 is NFR sector 1.A Fuel Combustion Activities with 87% in national total emissions. Sector 2 Industrial Pro-cesses and Product Use has a share of 13% in national total emissions. From 1990 to 2015 HCB emissions from the sectors NFR 3 Agriculture as well as NFR 5 Waste decreased remarkably by 66% and 92%, respectively, more due to stringent legislation and modern technology. Both sectors are minor sources of HCB emissions in 2015 with shares of 0.03% and 0.1% in national total emissions.
Note: HCB emissions from NFR sector 1.B Fugitive Emissions from fuels are reported as NA.
Figure 32: Share of NFR sectors 2015 in HCB emissions.
Total emissions of HCB are generally decreasing over the period 1990-2015 by 61%. The highest reduction was achieved in NFR category 1.A.2.b non-ferrous metals from 1990 to 1992. How-ever, due to unintentional HCB releases in 2012, 2013 and 2014 emissions rose to a very high level: HCB contaminated material (lime) was co-incinerated in a cement plant at too low tem-peratures, that’s why the HCB was not destroyed as planned. The sharp decrease of total emis-sions between 2014 and 2015 by 74% can therefore be explained as emissions in 2015 were at the usual level again.
87.1%
12.7% < 0.1% 0.1%
Share of NFR sectors 2015 – HCB emissions
1.A FUEL COMBUSTION ACTIVITIES
1.B FUGITIVE EMISSIONS FROM FUELS
2 INDUSTRIAL PROCESSES ANDPRODUCT USE
3 AGRICULTURE
5 WASTE
Source: Umweltbundesamt
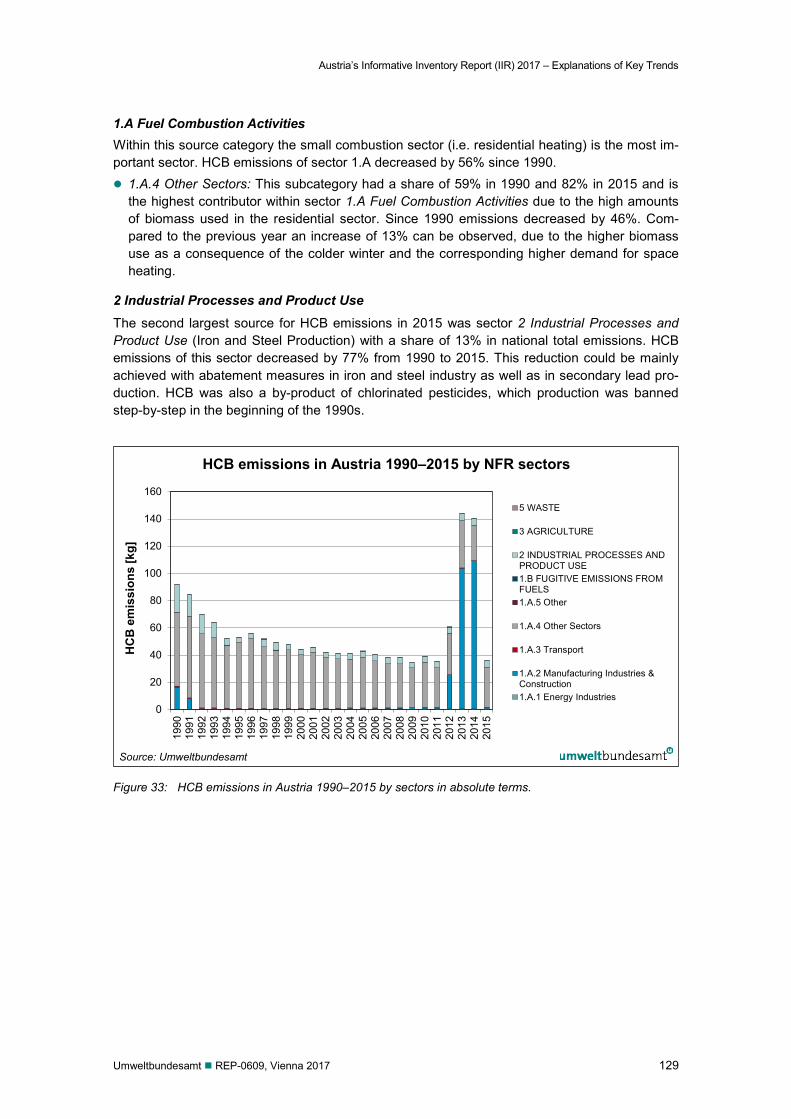
Austria’s Informative Inventory Report (IIR) 2017 – Explanations of Key Trends
Umweltbundesamt REP-0609, Vienna 2017 129
1.A Fuel Combustion Activities Within this source category the small combustion sector (i.e. residential heating) is the most im-portant sector. HCB emissions of sector 1.A decreased by 56% since 1990. 1.A.4 Other Sectors: This subcategory had a share of 59% in 1990 and 82% in 2015 and is
the highest contributor within sector 1.A Fuel Combustion Activities due to the high amounts of biomass used in the residential sector. Since 1990 emissions decreased by 46%. Com-pared to the previous year an increase of 13% can be observed, due to the higher biomass use as a consequence of the colder winter and the corresponding higher demand for space heating.
2 Industrial Processes and Product Use The second largest source for HCB emissions in 2015 was sector 2 Industrial Processes and Product Use (Iron and Steel Production) with a share of 13% in national total emissions. HCB emissions of this sector decreased by 77% from 1990 to 2015. This reduction could be mainly achieved with abatement measures in iron and steel industry as well as in secondary lead pro-duction. HCB was also a by-product of chlorinated pesticides, which production was banned step-by-step in the beginning of the 1990s.
Figure 33: HCB emissions in Austria 1990–2015 by sectors in absolute terms.
0
20
40
60
80
100
120
140
160
1990
1991
1992
1993
1994
1995
1996
1997
1998
1999
2000
2001
2002
2003
2004
2005
2006
2007
2008
2009
2010
2011
2012
2013
2014
2015
HC
B e
mis
sion
s [k
g]
HCB emissions in Austria 1990–2015 by NFR sectors
5 WASTE
3 AGRICULTURE
2 INDUSTRIAL PROCESSES ANDPRODUCT USE1.B FUGITIVE EMISSIONS FROMFUELS1.A.5 Other
1.A.4 Other Sectors
1.A.3 Transport
1.A.2 Manufacturing Industries &Construction1.A.1 Energy Industries
Source: Umweltbundesamt
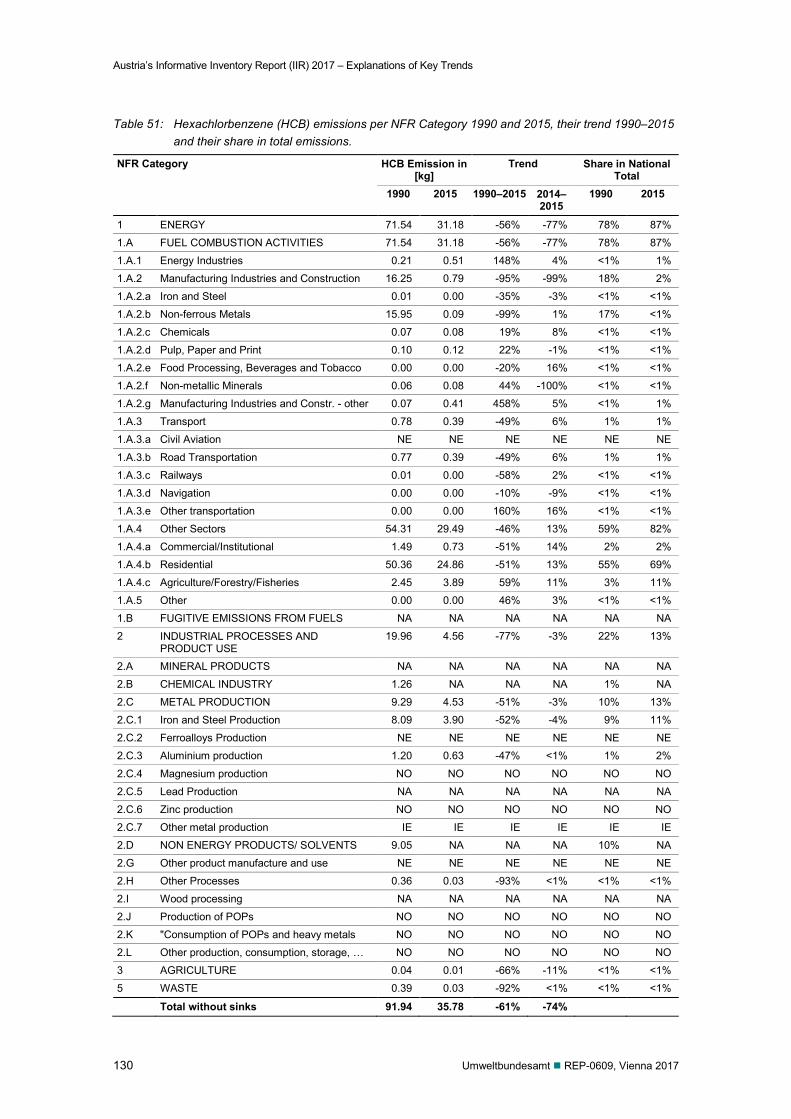
Austria’s Informative Inventory Report (IIR) 2017 – Explanations of Key Trends
130 Umweltbundesamt REP-0609, Vienna 2017
Table 51: Hexachlorbenzene (HCB) emissions per NFR Category 1990 and 2015, their trend 1990–2015 and their share in total emissions.
NFR Category HCB Emission in [kg]
Trend Share in National Total
1990 2015 1990–2015 2014–2015
1990 2015
1 ENERGY 71.54 31.18 -56% -77% 78% 87%
1.A FUEL COMBUSTION ACTIVITIES 71.54 31.18 -56% -77% 78% 87%
1.A.1 Energy Industries 0.21 0.51 148% 4% <1% 1%
1.A.2 Manufacturing Industries and Construction 16.25 0.79 -95% -99% 18% 2%
1.A.2.a Iron and Steel 0.01 0.00 -35% -3% <1% <1%
1.A.2.b Non-ferrous Metals 15.95 0.09 -99% 1% 17% <1%
1.A.2.c Chemicals 0.07 0.08 19% 8% <1% <1%
1.A.2.d Pulp, Paper and Print 0.10 0.12 22% -1% <1% <1%
1.A.2.e Food Processing, Beverages and Tobacco 0.00 0.00 -20% 16% <1% <1%
1.A.2.f Non-metallic Minerals 0.06 0.08 44% -100% <1% <1%
1.A.2.g Manufacturing Industries and Constr. - other 0.07 0.41 458% 5% <1% 1%
1.A.3 Transport 0.78 0.39 -49% 6% 1% 1%
1.A.3.a Civil Aviation NE NE NE NE NE NE
1.A.3.b Road Transportation 0.77 0.39 -49% 6% 1% 1%
1.A.3.c Railways 0.01 0.00 -58% 2% <1% <1%
1.A.3.d Navigation 0.00 0.00 -10% -9% <1% <1%
1.A.3.e Other transportation 0.00 0.00 160% 16% <1% <1%
1.A.4 Other Sectors 54.31 29.49 -46% 13% 59% 82%
1.A.4.a Commercial/Institutional 1.49 0.73 -51% 14% 2% 2%
1.A.4.b Residential 50.36 24.86 -51% 13% 55% 69%
1.A.4.c Agriculture/Forestry/Fisheries 2.45 3.89 59% 11% 3% 11%
1.A.5 Other 0.00 0.00 46% 3% <1% <1%
1.B FUGITIVE EMISSIONS FROM FUELS NA NA NA NA NA NA
2 INDUSTRIAL PROCESSES AND PRODUCT USE
19.96 4.56 -77% -3% 22% 13%
2.A MINERAL PRODUCTS NA NA NA NA NA NA
2.B CHEMICAL INDUSTRY 1.26 NA NA NA 1% NA
2.C METAL PRODUCTION 9.29 4.53 -51% -3% 10% 13%
2.C.1 Iron and Steel Production 8.09 3.90 -52% -4% 9% 11%
2.C.2 Ferroalloys Production NE NE NE NE NE NE
2.C.3 Aluminium production 1.20 0.63 -47% <1% 1% 2%
2.C.4 Magnesium production NO NO NO NO NO NO
2.C.5 Lead Production NA NA NA NA NA NA
2.C.6 Zinc production NO NO NO NO NO NO
2.C.7 Other metal production IE IE IE IE IE IE
2.D NON ENERGY PRODUCTS/ SOLVENTS 9.05 NA NA NA 10% NA
2.G Other product manufacture and use NE NE NE NE NE NE
2.H Other Processes 0.36 0.03 -93% <1% <1% <1%
2.I Wood processing NA NA NA NA NA NA
2.J Production of POPs NO NO NO NO NO NO
2.K "Consumption of POPs and heavy metals NO NO NO NO NO NO
2.L Other production, consumption, storage, … NO NO NO NO NO NO
3 AGRICULTURE 0.04 0.01 -66% -11% <1% <1%
5 WASTE 0.39 0.03 -92% <1% <1% <1%
Total without sinks 91.94 35.78 -61% -74%
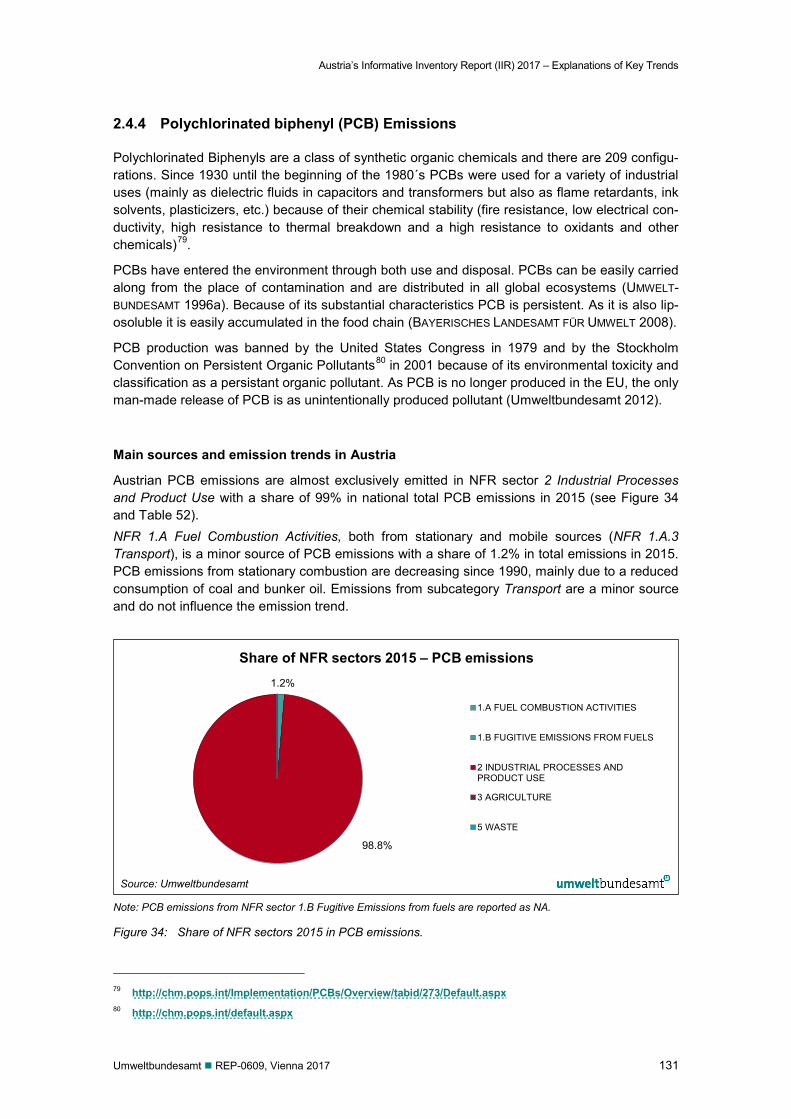
Austria’s Informative Inventory Report (IIR) 2017 – Explanations of Key Trends
Umweltbundesamt REP-0609, Vienna 2017 131
2.4.4 Polychlorinated biphenyl (PCB) Emissions
Polychlorinated Biphenyls are a class of synthetic organic chemicals and there are 209 configu-rations. Since 1930 until the beginning of the 1980´s PCBs were used for a variety of industrial uses (mainly as dielectric fluids in capacitors and transformers but also as flame retardants, ink solvents, plasticizers, etc.) because of their chemical stability (fire resistance, low electrical con-ductivity, high resistance to thermal breakdown and a high resistance to oxidants and other chemicals)79.
PCBs have entered the environment through both use and disposal. PCBs can be easily carried along from the place of contamination and are distributed in all global ecosystems (UMWELT-BUNDESAMT 1996a). Because of its substantial characteristics PCB is persistent. As it is also lip-osoluble it is easily accumulated in the food chain (BAYERISCHES LANDESAMT FÜR UMWELT 2008).
PCB production was banned by the United States Congress in 1979 and by the Stockholm Convention on Persistent Organic Pollutants80 in 2001 because of its environmental toxicity and classification as a persistant organic pollutant. As PCB is no longer produced in the EU, the only man-made release of PCB is as unintentionally produced pollutant (Umweltbundesamt 2012).
Main sources and emission trends in Austria
Austrian PCB emissions are almost exclusively emitted in NFR sector 2 Industrial Processes and Product Use with a share of 99% in national total PCB emissions in 2015 (see Figure 34 and Table 52). NFR 1.A Fuel Combustion Activities, both from stationary and mobile sources (NFR 1.A.3 Transport), is a minor source of PCB emissions with a share of 1.2% in total emissions in 2015. PCB emissions from stationary combustion are decreasing since 1990, mainly due to a reduced consumption of coal and bunker oil. Emissions from subcategory Transport are a minor source and do not influence the emission trend.
Note: PCB emissions from NFR sector 1.B Fugitive Emissions from fuels are reported as NA.
Figure 34: Share of NFR sectors 2015 in PCB emissions.
79 http://chm.pops.int/Implementation/PCBs/Overview/tabid/273/Default.aspx 80 http://chm.pops.int/default.aspx
1.2%
98.8%
Share of NFR sectors 2015 – PCB emissions
1.A FUEL COMBUSTION ACTIVITIES
1.B FUGITIVE EMISSIONS FROM FUELS
2 INDUSTRIAL PROCESSES ANDPRODUCT USE
3 AGRICULTURE
5 WASTE
Source: Umweltbundesamt
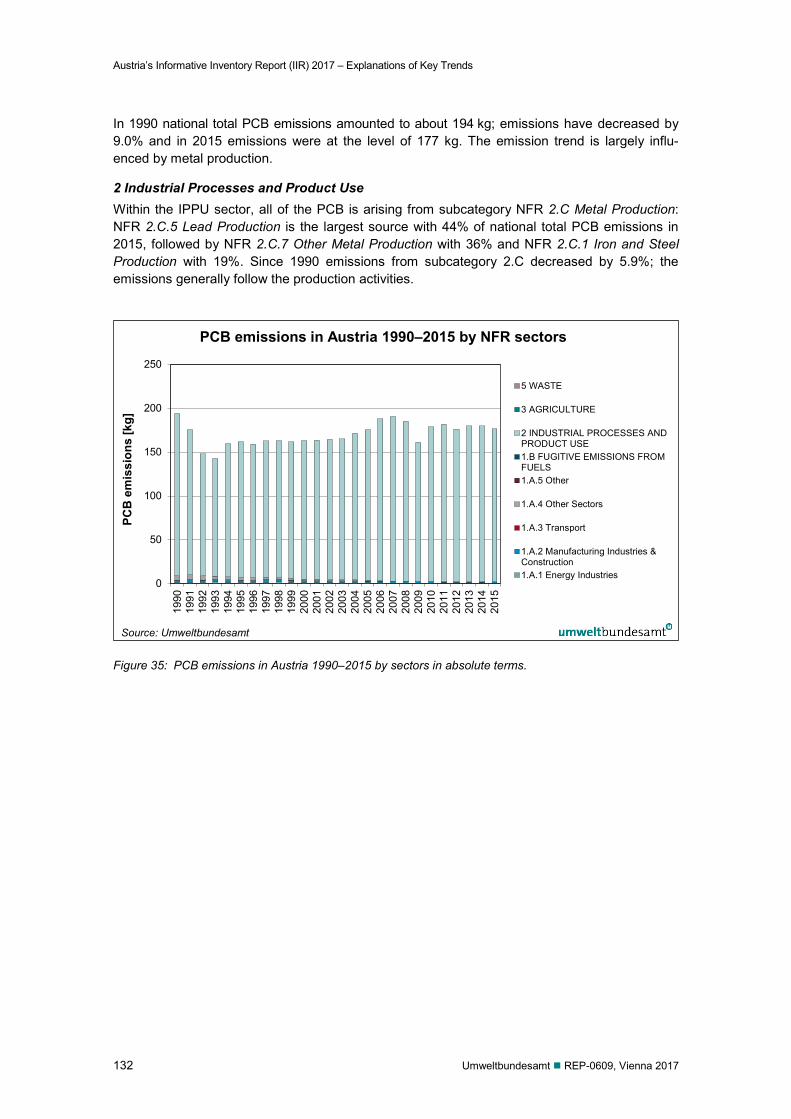
Austria’s Informative Inventory Report (IIR) 2017 – Explanations of Key Trends
132 Umweltbundesamt REP-0609, Vienna 2017
In 1990 national total PCB emissions amounted to about 194 kg; emissions have decreased by 9.0% and in 2015 emissions were at the level of 177 kg. The emission trend is largely influ-enced by metal production.
2 Industrial Processes and Product Use Within the IPPU sector, all of the PCB is arising from subcategory NFR 2.C Metal Production: NFR 2.C.5 Lead Production is the largest source with 44% of national total PCB emissions in 2015, followed by NFR 2.C.7 Other Metal Production with 36% and NFR 2.C.1 Iron and Steel Production with 19%. Since 1990 emissions from subcategory 2.C decreased by 5.9%; the emissions generally follow the production activities.
Figure 35: PCB emissions in Austria 1990–2015 by sectors in absolute terms.
0
50
100
150
200
250
1990
1991
1992
1993
1994
1995
1996
1997
1998
1999
2000
2001
2002
2003
2004
2005
2006
2007
2008
2009
2010
2011
2012
2013
2014
2015
PCB
em
issi
ons
[kg]
PCB emissions in Austria 1990–2015 by NFR sectors
5 WASTE
3 AGRICULTURE
2 INDUSTRIAL PROCESSES ANDPRODUCT USE1.B FUGITIVE EMISSIONS FROMFUELS1.A.5 Other
1.A.4 Other Sectors
1.A.3 Transport
1.A.2 Manufacturing Industries &Construction1.A.1 Energy Industries
Source: Umweltbundesamt
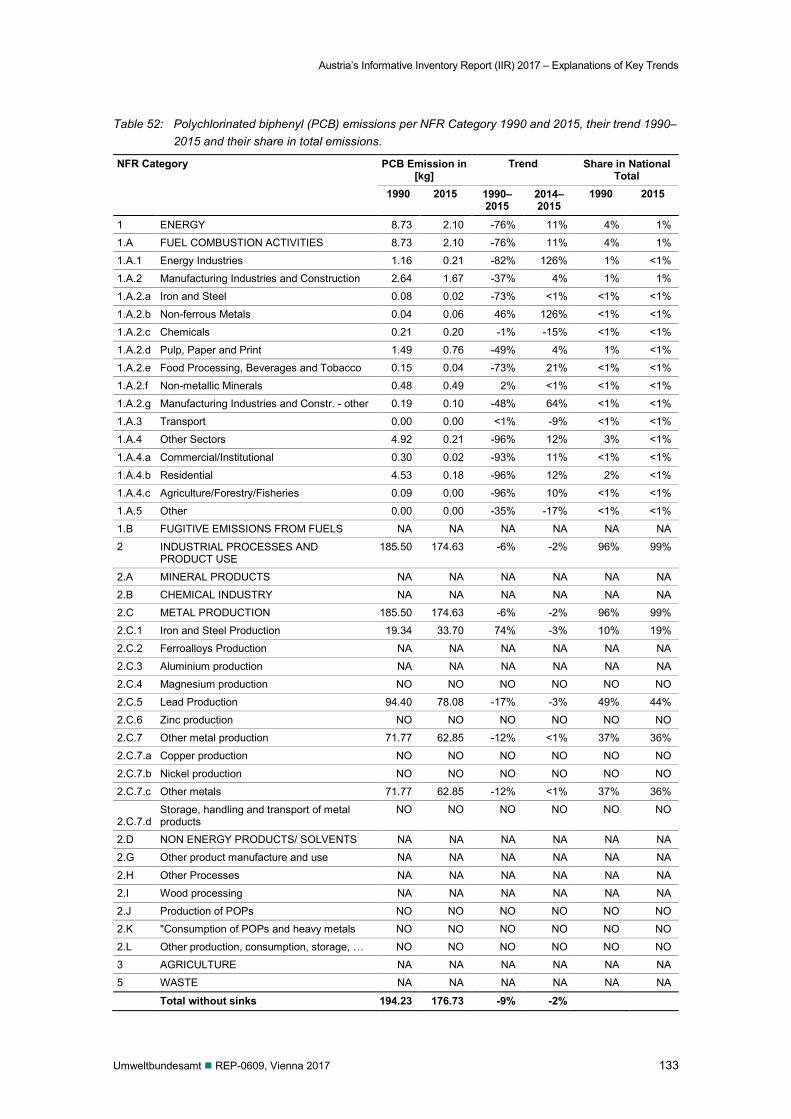
Austria’s Informative Inventory Report (IIR) 2017 – Explanations of Key Trends
Umweltbundesamt REP-0609, Vienna 2017 133
Table 52: Polychlorinated biphenyl (PCB) emissions per NFR Category 1990 and 2015, their trend 1990–2015 and their share in total emissions.
NFR Category PCB Emission in [kg]
Trend Share in National Total
1990 2015 1990–2015
2014–2015
1990 2015
1 ENERGY 8.73 2.10 -76% 11% 4% 1%
1.A FUEL COMBUSTION ACTIVITIES 8.73 2.10 -76% 11% 4% 1%
1.A.1 Energy Industries 1.16 0.21 -82% 126% 1% <1%
1.A.2 Manufacturing Industries and Construction 2.64 1.67 -37% 4% 1% 1%
1.A.2.a Iron and Steel 0.08 0.02 -73% <1% <1% <1%
1.A.2.b Non-ferrous Metals 0.04 0.06 46% 126% <1% <1%
1.A.2.c Chemicals 0.21 0.20 -1% -15% <1% <1%
1.A.2.d Pulp, Paper and Print 1.49 0.76 -49% 4% 1% <1%
1.A.2.e Food Processing, Beverages and Tobacco 0.15 0.04 -73% 21% <1% <1%
1.A.2.f Non-metallic Minerals 0.48 0.49 2% <1% <1% <1%
1.A.2.g Manufacturing Industries and Constr. - other 0.19 0.10 -48% 64% <1% <1%
1.A.3 Transport 0.00 0.00 <1% -9% <1% <1%
1.A.4 Other Sectors 4.92 0.21 -96% 12% 3% <1%
1.A.4.a Commercial/Institutional 0.30 0.02 -93% 11% <1% <1%
1.A.4.b Residential 4.53 0.18 -96% 12% 2% <1%
1.A.4.c Agriculture/Forestry/Fisheries 0.09 0.00 -96% 10% <1% <1%
1.A.5 Other 0.00 0.00 -35% -17% <1% <1%
1.B FUGITIVE EMISSIONS FROM FUELS NA NA NA NA NA NA
2 INDUSTRIAL PROCESSES AND PRODUCT USE
185.50 174.63 -6% -2% 96% 99%
2.A MINERAL PRODUCTS NA NA NA NA NA NA
2.B CHEMICAL INDUSTRY NA NA NA NA NA NA
2.C METAL PRODUCTION 185.50 174.63 -6% -2% 96% 99%
2.C.1 Iron and Steel Production 19.34 33.70 74% -3% 10% 19%
2.C.2 Ferroalloys Production NA NA NA NA NA NA
2.C.3 Aluminium production NA NA NA NA NA NA
2.C.4 Magnesium production NO NO NO NO NO NO
2.C.5 Lead Production 94.40 78.08 -17% -3% 49% 44%
2.C.6 Zinc production NO NO NO NO NO NO
2.C.7 Other metal production 71.77 62.85 -12% <1% 37% 36%
2.C.7.a Copper production NO NO NO NO NO NO
2.C.7.b Nickel production NO NO NO NO NO NO
2.C.7.c Other metals 71.77 62.85 -12% <1% 37% 36%
2.C.7.d Storage, handling and transport of metal products
NO NO NO NO NO NO
2.D NON ENERGY PRODUCTS/ SOLVENTS NA NA NA NA NA NA
2.G Other product manufacture and use NA NA NA NA NA NA
2.H Other Processes NA NA NA NA NA NA
2.I Wood processing NA NA NA NA NA NA
2.J Production of POPs NO NO NO NO NO NO
2.K "Consumption of POPs and heavy metals NO NO NO NO NO NO
2.L Other production, consumption, storage, … NO NO NO NO NO NO
3 AGRICULTURE NA NA NA NA NA NA
5 WASTE NA NA NA NA NA NA
Total without sinks 194.23 176.73 -9% -2%
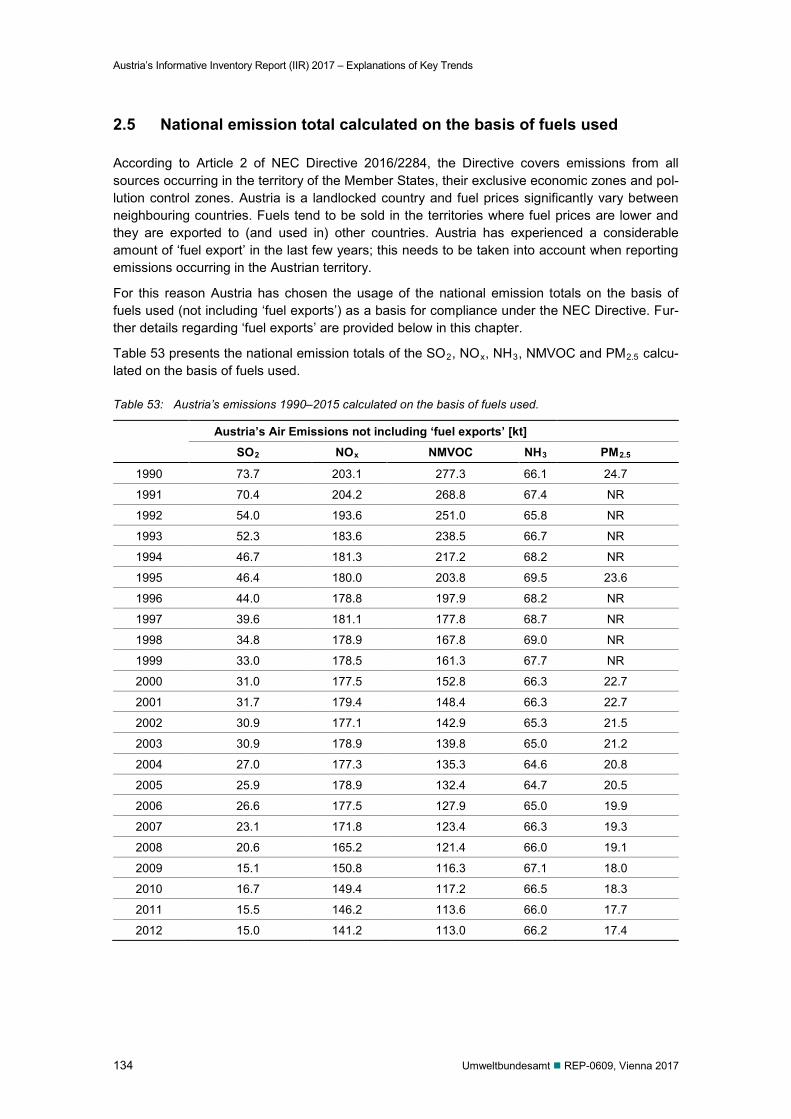
Austria’s Informative Inventory Report (IIR) 2017 – Explanations of Key Trends
134 Umweltbundesamt REP-0609, Vienna 2017
2.5 National emission total calculated on the basis of fuels used
According to Article 2 of NEC Directive 2016/2284, the Directive covers emissions from all sources occurring in the territory of the Member States, their exclusive economic zones and pol-lution control zones. Austria is a landlocked country and fuel prices significantly vary between neighbouring countries. Fuels tend to be sold in the territories where fuel prices are lower and they are exported to (and used in) other countries. Austria has experienced a considerable amount of ‘fuel export’ in the last few years; this needs to be taken into account when reporting emissions occurring in the Austrian territory.
For this reason Austria has chosen the usage of the national emission totals on the basis of fuels used (not including ‘fuel exports’) as a basis for compliance under the NEC Directive. Fur-ther details regarding ‘fuel exports’ are provided below in this chapter.
Table 53 presents the national emission totals of the SO2, NOx, NH3, NMVOC and PM2.5 calcu-lated on the basis of fuels used.
Table 53: Austria’s emissions 1990–2015 calculated on the basis of fuels used.
Austria’s Air Emissions not including ‘fuel exports’ [kt] SO2 NOx NMVOC NH3 PM2.5
1990 73.7 203.1 277.3 66.1 24.7
1991 70.4 204.2 268.8 67.4 NR
1992 54.0 193.6 251.0 65.8 NR
1993 52.3 183.6 238.5 66.7 NR
1994 46.7 181.3 217.2 68.2 NR
1995 46.4 180.0 203.8 69.5 23.6
1996 44.0 178.8 197.9 68.2 NR
1997 39.6 181.1 177.8 68.7 NR
1998 34.8 178.9 167.8 69.0 NR
1999 33.0 178.5 161.3 67.7 NR
2000 31.0 177.5 152.8 66.3 22.7
2001 31.7 179.4 148.4 66.3 22.7
2002 30.9 177.1 142.9 65.3 21.5
2003 30.9 178.9 139.8 65.0 21.2
2004 27.0 177.3 135.3 64.6 20.8
2005 25.9 178.9 132.4 64.7 20.5
2006 26.6 177.5 127.9 65.0 19.9
2007 23.1 171.8 123.4 66.3 19.3
2008 20.6 165.2 121.4 66.0 19.1
2009 15.1 150.8 116.3 67.1 18.0
2010 16.7 149.4 117.2 66.5 18.3
2011 15.5 146.2 113.6 66.0 17.7
2012 15.0 141.2 113.0 66.2 17.4
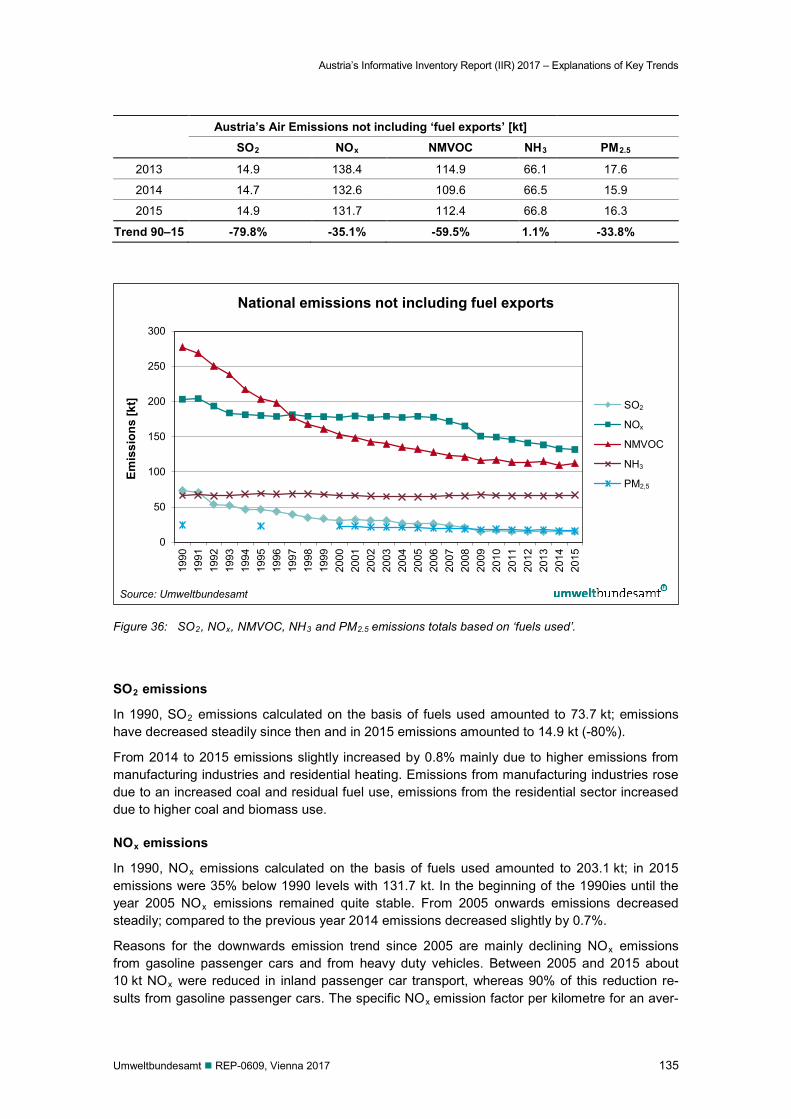
Austria’s Informative Inventory Report (IIR) 2017 – Explanations of Key Trends
Umweltbundesamt REP-0609, Vienna 2017 135
Austria’s Air Emissions not including ‘fuel exports’ [kt] SO2 NOx NMVOC NH3 PM2.5
2013 14.9 138.4 114.9 66.1 17.6
2014 14.7 132.6 109.6 66.5 15.9
2015 14.9 131.7 112.4 66.8 16.3
Trend 90–15 -79.8% -35.1% -59.5% 1.1% -33.8%
Figure 36: SO2, NOx, NMVOC, NH3 and PM2.5 emissions totals based on ‘fuels used’.
SO2 emissions
In 1990, SO2 emissions calculated on the basis of fuels used amounted to 73.7 kt; emissions have decreased steadily since then and in 2015 emissions amounted to 14.9 kt (-80%).
From 2014 to 2015 emissions slightly increased by 0.8% mainly due to higher emissions from manufacturing industries and residential heating. Emissions from manufacturing industries rose due to an increased coal and residual fuel use, emissions from the residential sector increased due to higher coal and biomass use.
NOx emissions
In 1990, NOx emissions calculated on the basis of fuels used amounted to 203.1 kt; in 2015 emissions were 35% below 1990 levels with 131.7 kt. In the beginning of the 1990ies until the year 2005 NOx emissions remained quite stable. From 2005 onwards emissions decreased steadily; compared to the previous year 2014 emissions decreased slightly by 0.7%.
Reasons for the downwards emission trend since 2005 are mainly declining NOx emissions from gasoline passenger cars and from heavy duty vehicles. Between 2005 and 2015 about 10 kt NOx were reduced in inland passenger car transport, whereas 90% of this reduction re-sults from gasoline passenger cars. The specific NOx emission factor per kilometre for an aver-
0
50
100
150
200
250
300
1990
1991
1992
1993
1994
1995
1996
1997
1998
1999
2000
2001
2002
2003
2004
2005
2006
2007
2008
2009
2010
2011
2012
2013
2014
2015
Emis
sion
s [k
t]
National emissions not including fuel exports
SO2
NOx
NMVOC
NH3
PM2.5
Source: Umweltbundesamt
SO2
NOx
NMVOC
NH3
PM2,5
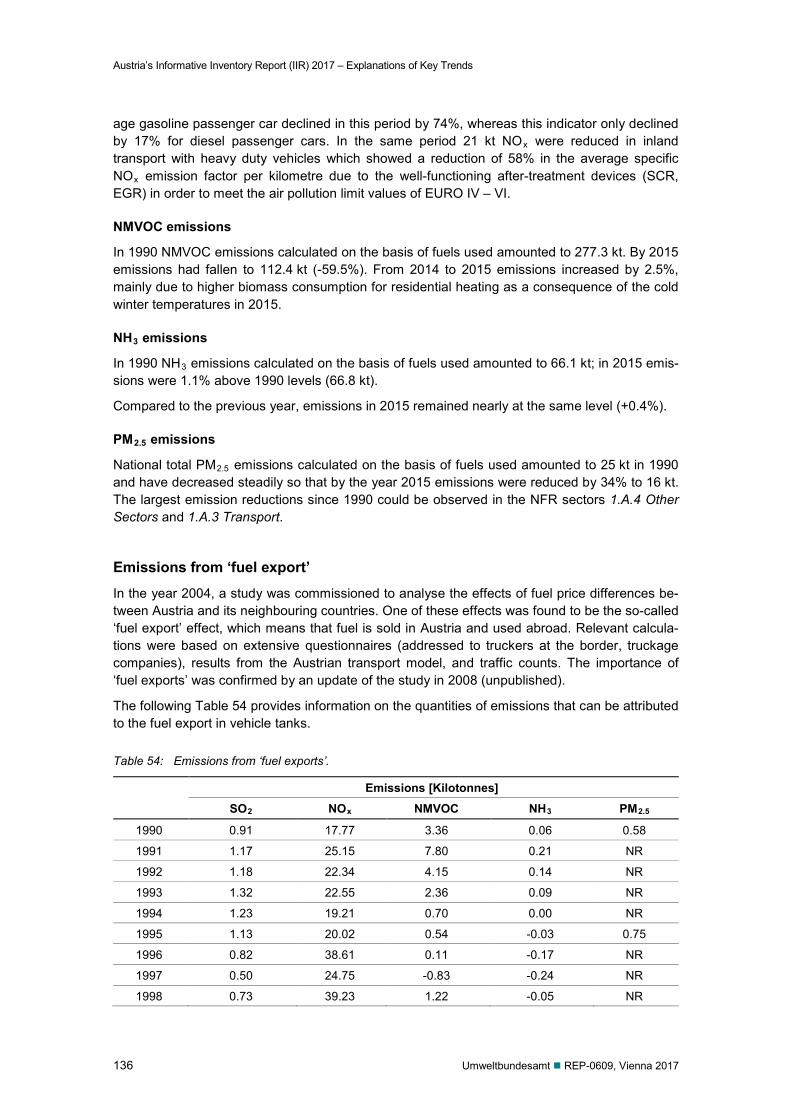
Austria’s Informative Inventory Report (IIR) 2017 – Explanations of Key Trends
136 Umweltbundesamt REP-0609, Vienna 2017
age gasoline passenger car declined in this period by 74%, whereas this indicator only declined by 17% for diesel passenger cars. In the same period 21 kt NOx were reduced in inland transport with heavy duty vehicles which showed a reduction of 58% in the average specific NOx emission factor per kilometre due to the well-functioning after-treatment devices (SCR, EGR) in order to meet the air pollution limit values of EURO IV – VI.
NMVOC emissions
In 1990 NMVOC emissions calculated on the basis of fuels used amounted to 277.3 kt. By 2015 emissions had fallen to 112.4 kt (-59.5%). From 2014 to 2015 emissions increased by 2.5%, mainly due to higher biomass consumption for residential heating as a consequence of the cold winter temperatures in 2015.
NH3 emissions
In 1990 NH3 emissions calculated on the basis of fuels used amounted to 66.1 kt; in 2015 emis-sions were 1.1% above 1990 levels (66.8 kt).
Compared to the previous year, emissions in 2015 remained nearly at the same level (+0.4%).
PM2.5 emissions
National total PM2.5 emissions calculated on the basis of fuels used amounted to 25 kt in 1990 and have decreased steadily so that by the year 2015 emissions were reduced by 34% to 16 kt. The largest emission reductions since 1990 could be observed in the NFR sectors 1.A.4 Other Sectors and 1.A.3 Transport.
Emissions from ‘fuel export’ In the year 2004, a study was commissioned to analyse the effects of fuel price differences be-tween Austria and its neighbouring countries. One of these effects was found to be the so-called ‘fuel export’ effect, which means that fuel is sold in Austria and used abroad. Relevant calcula-tions were based on extensive questionnaires (addressed to truckers at the border, truckage companies), results from the Austrian transport model, and traffic counts. The importance of ‘fuel exports’ was confirmed by an update of the study in 2008 (unpublished).
The following Table 54 provides information on the quantities of emissions that can be attributed to the fuel export in vehicle tanks.
Table 54: Emissions from ‘fuel exports’.
Emissions [Kilotonnes] SO2 NOx NMVOC NH3 PM2.5
1990 0.91 17.77 3.36 0.06 0.58
1991 1.17 25.15 7.80 0.21 NR
1992 1.18 22.34 4.15 0.14 NR
1993 1.32 22.55 2.36 0.09 NR
1994 1.23 19.21 0.70 0.00 NR
1995 1.13 20.02 0.54 -0.03 0.75
1996 0.82 38.61 0.11 -0.17 NR
1997 0.50 24.75 -0.83 -0.24 NR
1998 0.73 39.23 1.22 -0.05 NR

Austria’s Informative Inventory Report (IIR) 2017 – Explanations of Key Trends
Umweltbundesamt REP-0609, Vienna 2017 137
Emissions [Kilotonnes] SO2 NOx NMVOC NH3 PM2.5
1999 0.54 31.10 0.00 -0.22 NR
2000 0.60 37.61 0.43 -0.21 0.90
2001 0.71 45.51 1.53 -0.03 1.12
2002 0.76 53.66 3.30 0.36 1.45
2003 0.82 60.10 4.28 0.57 1.68
2004 0.06 59.03 4.32 0.61 1.66
2005 0.05 59.11 4.19 0.59 1.63
2006 0.04 46.11 3.25 0.55 1.31
2007 0.04 41.24 2.87 0.52 1.15
2008 0.03 31.92 1.97 0.35 0.81
2009 0.03 29.99 1.78 0.33 0.73
2010 0.04 31.66 1.54 0.26 0.70
2011 0.03 25.22 1.08 0.17 0.52
2012 0.03 23.31 0.94 0.15 0.46
2013 0.04 25.87 0.85 0.12 0.48
2014 0.03 20.43 0.62 0.08 0.36
2015 0.03 17.39 0.53 0.06 0.30
Trend 90–15 -96.4% -2.2% -84.3 15.8% -48.9
In 2015 about 12% of the reported national total NOx emissions were caused by ‘fuel export’. Emissions from fuel export increased between 1990 and 2005. From then emissions show a decreasing trend which is in line with decreased activities (amount of fuel consumption) from 2005 onwards. Truck traffic holds the main share in fuel export (energy related) with 93%. This reduction can be explained due to the fact that NOx after treatment systems of trucks are work-ing very well. In 2015, NOx emissions of total fuel export were slightly below the level of 1990.
In passenger transport the phenomenon of fuel export plays a minor role with an average share of only about 1% in NOx emissions of sector road transport in 2015. In contrast, fuel export in road freight transport with heavy duty vehicles plays a major role in Austria with an average share of 22% in NOx emissions of sector road transport in 2015. For more details, please also refer to chapter 3.2.6.
Austria’s Informative Inventory Report (IIR) 2017 – Energy (NFR Sector 1)
138 Umweltbundesamt REP-0609, Vienna 2017
3 ENERGY (NFR SECTOR 1)
Sector 1 Energy considers emissions originating from fuel combustion activities (NFR 1.A) 1.A.1 Energy Industries 1.A.2 Manufacturing Industries and Construction 1.A.3 Transport 1.A.4 Other Sectors (commercial and residential) 1.A.5 Other (Military)
as well as fugitive emissions from fuels (NFR 1.B) 1.B.1 Solid fuels 1.B.2 Oil and natural gas.
3.1 NFR 1.A Stationary Fuel Combustion Activities
3.1.1 General description
This chapter gives an overview of category 1.A Stationary Fuel Combustion Activities. It includes information on completeness, QA/QC and planned improvements as well as on emissions, emission trends and methodologies applied (including emission factors).
Information is also provided in the Austrian National Inventory Report 2016 (UMWELTBUNDESAMT 2017a) which is part of the submission under the UNFCCC. Additionally to information provided in this document, Annex 2 of (UMWELTBUNDESAMT 2017a)
includes further information on the underlying activity data used for emissions estimation. It describes the national energy balance (fuels and fuel categories, net calorific values) and the methodology of how activity data are extracted from the energy balance (correspondence of energy balance to SNAP and IPCC categories).
National energy balance data is presented in Annex 4 of (UMWELTBUNDESAMT 2017a).
3.1.1.1 Completeness
Table 55 provides information on the status of emission estimates of all sub categories. A “” indicates that emissions from this sub category have been estimated.
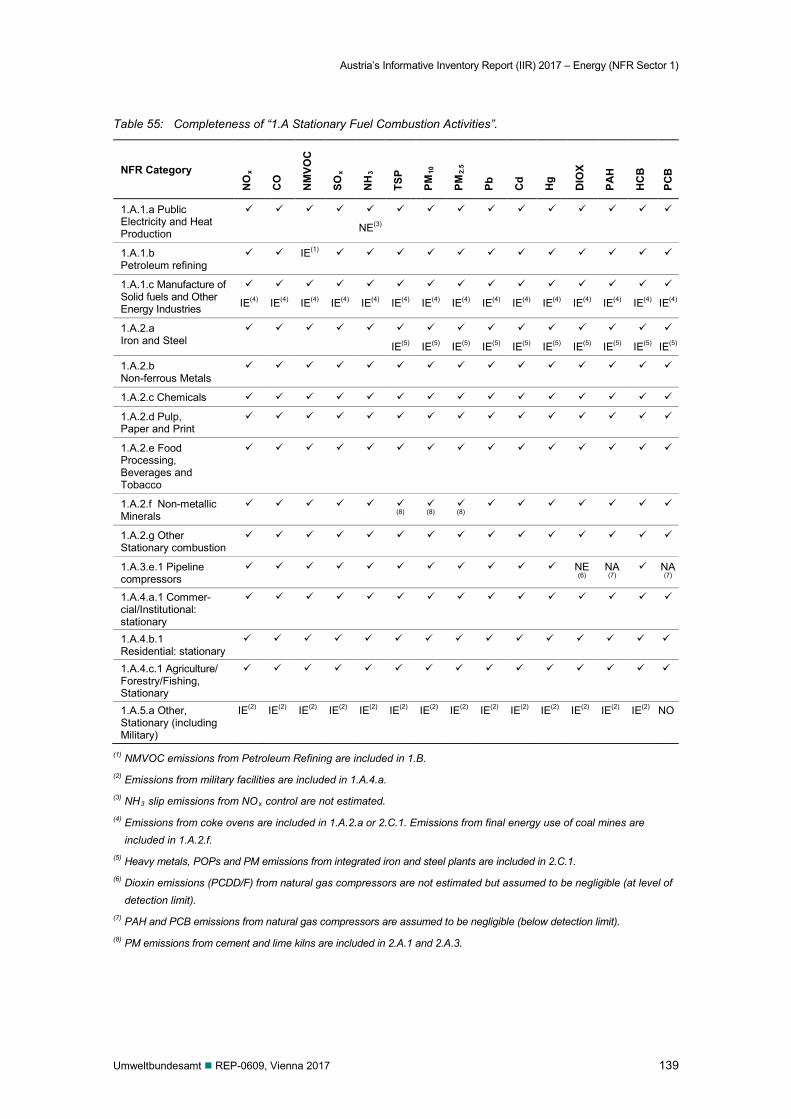
Austria’s Informative Inventory Report (IIR) 2017 – Energy (NFR Sector 1)
Umweltbundesamt REP-0609, Vienna 2017 139
Table 55: Completeness of “1.A Stationary Fuel Combustion Activities”.
NFR Category
NO
x
CO
NM
VOC
SOx
NH
3
TSP
PM10
PM2.
5
Pb
Cd
Hg
DIO
X
PAH
HC
B
PCB
1.A.1.a Public Electricity and Heat Production
NE(3)
1.A.1.b Petroleum refining
IE(1)
1.A.1.c Manufacture of Solid fuels and Other Energy Industries
IE(4)
IE(4)
IE(4)
IE(4)
IE(4)
IE(4)
IE(4)
IE(4)
IE(4)
IE(4)
IE(4)
IE(4)
IE(4)
IE(4)
IE(4)
1.A.2.a Iron and Steel
IE(5)
IE(5)
IE(5)
IE(5)
IE(5)
IE(5)
IE(5)
IE(5)
IE(5)
IE(5)
1.A.2.b Non-ferrous Metals
1.A.2.c Chemicals
1.A.2.d Pulp, Paper and Print
1.A.2.e Food Processing, Beverages and Tobacco
1.A.2.f Non-metallic Minerals
(8)
(8)
(8)
1.A.2.g Other Stationary combustion
1.A.3.e.1 Pipeline compressors
NE (6)
NA (7)
NA (7)
1.A.4.a.1 Commer-cial/Institutional: stationary
1.A.4.b.1 Residential: stationary
1.A.4.c.1 Agriculture/ Forestry/Fishing, Stationary
1.A.5.a Other, Stationary (including Military)
IE(2) IE(2) IE(2) IE(2) IE(2) IE(2) IE(2) IE(2) IE(2) IE(2) IE(2) IE(2) IE(2) IE(2) NO
(1) NMVOC emissions from Petroleum Refining are included in 1.B. (2) Emissions from military facilities are included in 1.A.4.a. (3) NH3 slip emissions from NOx control are not estimated. (4) Emissions from coke ovens are included in 1.A.2.a or 2.C.1. Emissions from final energy use of coal mines are
included in 1.A.2.f. (5) Heavy metals, POPs and PM emissions from integrated iron and steel plants are included in 2.C.1. (6) Dioxin emissions (PCDD/F) from natural gas compressors are not estimated but assumed to be negligible (at level of
detection limit). (7) PAH and PCB emissions from natural gas compressors are assumed to be negligible (below detection limit). (8) PM emissions from cement and lime kilns are included in 2.A.1 and 2.A.3.
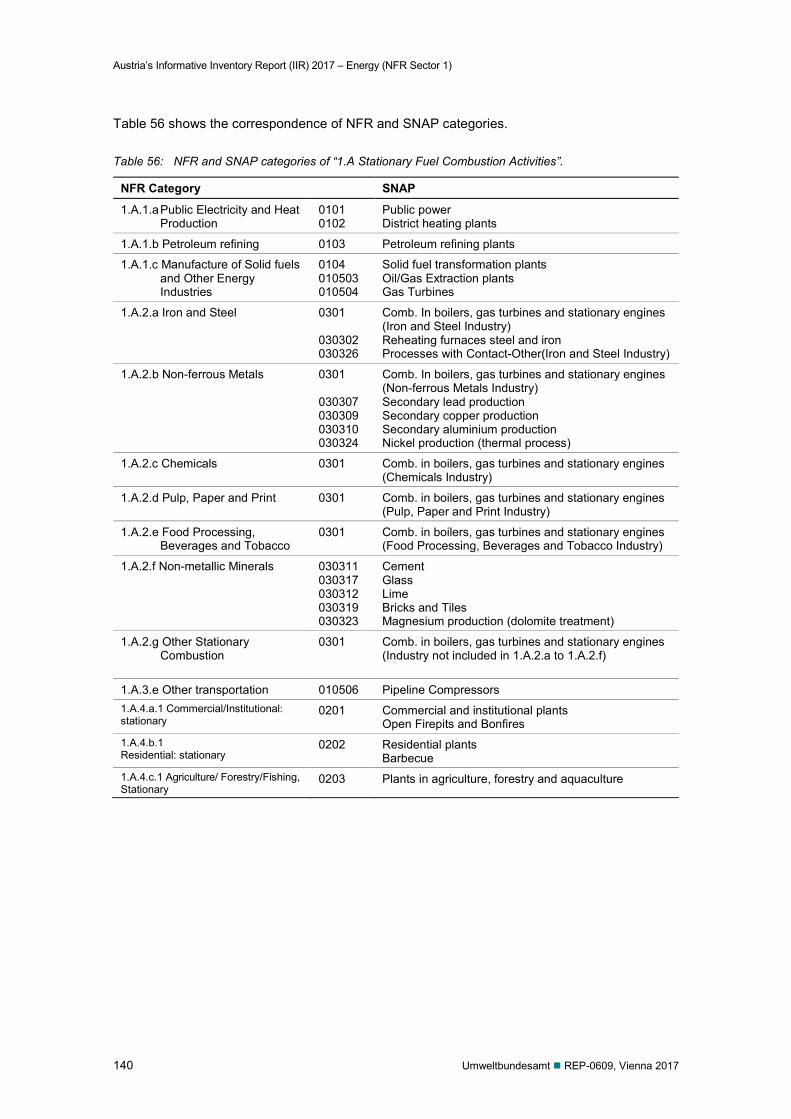
Austria’s Informative Inventory Report (IIR) 2017 – Energy (NFR Sector 1)
140 Umweltbundesamt REP-0609, Vienna 2017
Table 56 shows the correspondence of NFR and SNAP categories.
Table 56: NFR and SNAP categories of “1.A Stationary Fuel Combustion Activities”.
NFR Category SNAP
1.A.1.a Public Electricity and Heat Production
0101 0102
Public power District heating plants
1.A.1.b Petroleum refining 0103 Petroleum refining plants
1.A.1.c Manufacture of Solid fuels and Other Energy Industries
0104 010503 010504
Solid fuel transformation plants Oil/Gas Extraction plants Gas Turbines
1.A.2.a Iron and Steel 0301 030302 030326
Comb. In boilers, gas turbines and stationary engines (Iron and Steel Industry) Reheating furnaces steel and iron Processes with Contact-Other(Iron and Steel Industry)
1.A.2.b Non-ferrous Metals 0301 030307 030309 030310 030324
Comb. In boilers, gas turbines and stationary engines (Non-ferrous Metals Industry) Secondary lead production Secondary copper production Secondary aluminium production Nickel production (thermal process)
1.A.2.c Chemicals 0301 Comb. in boilers, gas turbines and stationary engines (Chemicals Industry)
1.A.2.d Pulp, Paper and Print 0301 Comb. in boilers, gas turbines and stationary engines (Pulp, Paper and Print Industry)
1.A.2.e Food Processing, Beverages and Tobacco
0301 Comb. in boilers, gas turbines and stationary engines (Food Processing, Beverages and Tobacco Industry)
1.A.2.f Non-metallic Minerals
030311 030317 030312 030319 030323
Cement Glass Lime Bricks and Tiles Magnesium production (dolomite treatment)
1.A.2.g Other Stationary Combustion
0301
Comb. in boilers, gas turbines and stationary engines (Industry not included in 1.A.2.a to 1.A.2.f)
1.A.3.e Other transportation 010506 Pipeline Compressors 1.A.4.a.1 Commercial/Institutional: stationary
0201 Commercial and institutional plants Open Firepits and Bonfires
1.A.4.b.1 Residential: stationary
0202 Residential plants Barbecue
1.A.4.c.1 Agriculture/ Forestry/Fishing, Stationary
0203 Plants in agriculture, forestry and aquaculture
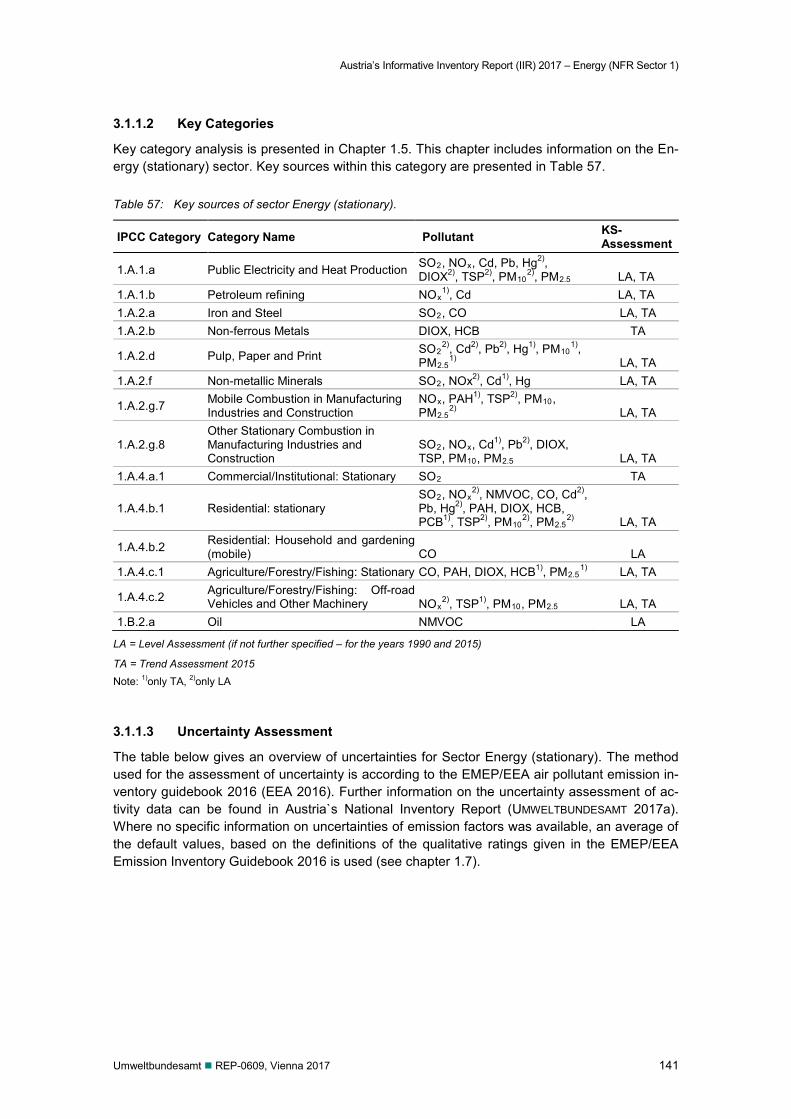
Austria’s Informative Inventory Report (IIR) 2017 – Energy (NFR Sector 1)
Umweltbundesamt REP-0609, Vienna 2017 141
3.1.1.2 Key Categories
Key category analysis is presented in Chapter 1.5. This chapter includes information on the En-ergy (stationary) sector. Key sources within this category are presented in Table 57.
Table 57: Key sources of sector Energy (stationary).
IPCC Category Category Name Pollutant KS-Assessment
1.A.1.a Public Electricity and Heat Production SO2, NOx, Cd, Pb, Hg2), DIOX2), TSP2), PM10
2), PM2.5 LA, TA 1.A.1.b Petroleum refining NOx
1), Cd LA, TA 1.A.2.a Iron and Steel SO2, CO LA, TA 1.A.2.b Non-ferrous Metals DIOX, HCB TA
1.A.2.d Pulp, Paper and Print SO22), Cd2), Pb2), Hg1), PM10
1), PM2.5
1) LA, TA 1.A.2.f Non-metallic Minerals SO2, NOx2), Cd1), Hg LA, TA
1.A.2.g.7 Mobile Combustion in Manufacturing Industries and Construction
NOx, PAH1), TSP2), PM10, PM2.5
2) LA, TA
1.A.2.g.8 Other Stationary Combustion in Manufacturing Industries and Construction
SO2, NOx, Cd1), Pb2), DIOX, TSP, PM10, PM2.5 LA, TA
1.A.4.a.1 Commercial/Institutional: Stationary SO2 TA
1.A.4.b.1 Residential: stationary SO2, NOx
2), NMVOC, CO, Cd2), Pb, Hg2), PAH, DIOX, HCB, PCB1), TSP2), PM10
2), PM2.52) LA, TA
1.A.4.b.2 Residential: Household and gardening (mobile) CO LA
1.A.4.c.1 Agriculture/Forestry/Fishing: Stationary CO, PAH, DIOX, HCB1), PM2.51) LA, TA
1.A.4.c.2 Agriculture/Forestry/Fishing: Off-road Vehicles and Other Machinery NOx
2), TSP1), PM10, PM2.5 LA, TA 1.B.2.a Oil NMVOC LA
LA = Level Assessment (if not further specified – for the years 1990 and 2015)
TA = Trend Assessment 2015 Note: 1)only TA, 2)only LA
3.1.1.3 Uncertainty Assessment
The table below gives an overview of uncertainties for Sector Energy (stationary). The method used for the assessment of uncertainty is according to the EMEP/EEA air pollutant emission in-ventory guidebook 2016 (EEA 2016). Further information on the uncertainty assessment of ac-tivity data can be found in Austria`s National Inventory Report (UMWELTBUNDESAMT 2017a). Where no specific information on uncertainties of emission factors was available, an average of the default values, based on the definitions of the qualitative ratings given in the EMEP/EEA Emission Inventory Guidebook 2016 is used (see chapter 1.7).
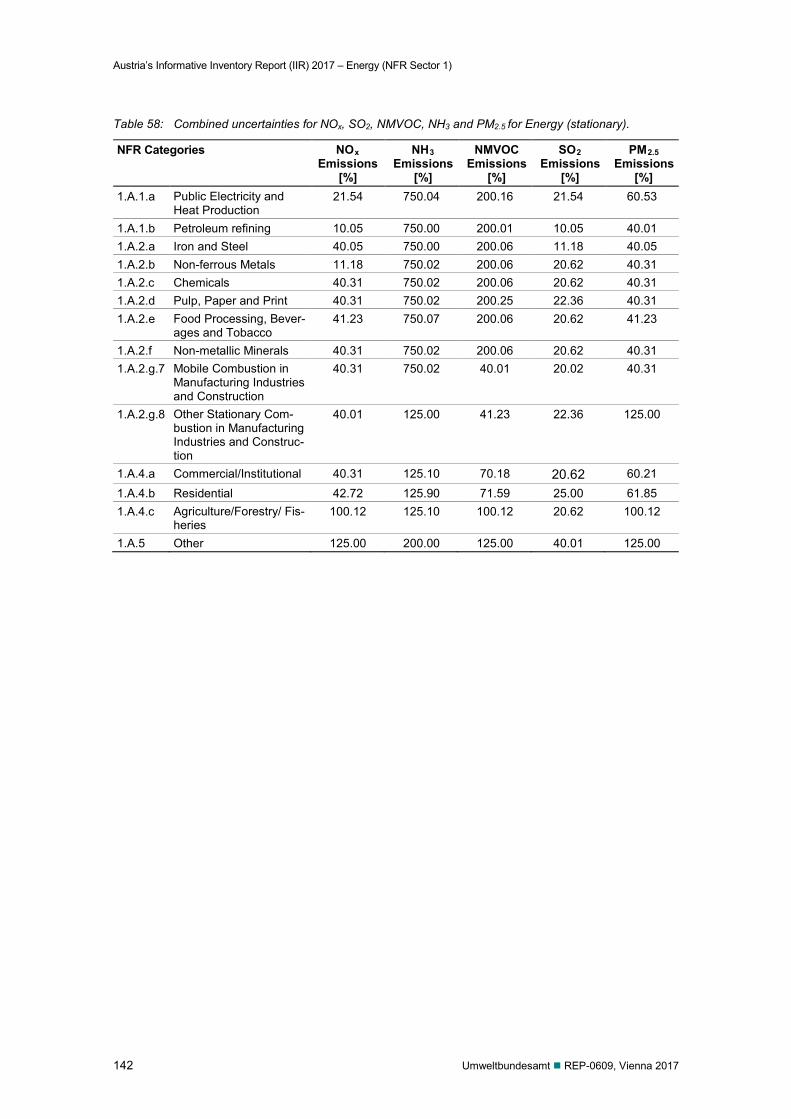
Austria’s Informative Inventory Report (IIR) 2017 – Energy (NFR Sector 1)
142 Umweltbundesamt REP-0609, Vienna 2017
Table 58: Combined uncertainties for NOx, SO2, NMVOC, NH3 and PM2.5 for Energy (stationary).
NFR Categories NOx Emissions
[%]
NH3 Emissions
[%]
NMVOC Emissions
[%]
SO2 Emissions
[%]
PM2.5 Emissions
[%] 1.A.1.a Public Electricity and
Heat Production 21.54 750.04 200.16 21.54 60.53
1.A.1.b Petroleum refining 10.05 750.00 200.01 10.05 40.01 1.A.2.a Iron and Steel 40.05 750.00 200.06 11.18 40.05 1.A.2.b Non-ferrous Metals 11.18 750.02 200.06 20.62 40.31 1.A.2.c Chemicals 40.31 750.02 200.06 20.62 40.31 1.A.2.d Pulp, Paper and Print 40.31 750.02 200.25 22.36 40.31 1.A.2.e Food Processing, Bever-
ages and Tobacco 41.23 750.07 200.06 20.62 41.23
1.A.2.f Non-metallic Minerals 40.31 750.02 200.06 20.62 40.31 1.A.2.g.7 Mobile Combustion in
Manufacturing Industries and Construction
40.31 750.02 40.01 20.02 40.31
1.A.2.g.8 Other Stationary Com-bustion in Manufacturing Industries and Construc-tion
40.01 125.00 41.23 22.36 125.00
1.A.4.a Commercial/Institutional 40.31 125.10 70.18 20.62 60.21 1.A.4.b Residential 42.72 125.90 71.59 25.00 61.85 1.A.4.c Agriculture/Forestry/ Fis-
heries 100.12 125.10 100.12 20.62 100.12
1.A.5 Other 125.00 200.00 125.00 40.01 125.00
Austria’s Informative Inventory Report (IIR) 2017 – Energy (NFR Sector 1)
Umweltbundesamt REP-0609, Vienna 2017 143
3.1.2 Methodological issues
General Methodology for stationary sources of NFR categories 1.A.1 to 1.A.5
For large point sources in categories 1.A.1.a, 1.A.1.b, 1.A.2.a, 1.A.2.d and 1.A.2.f (cement in-dustry) emission measurements of NOx, SO2, NMVOC, CO and TSP are the basis for the report-ed emissions.
The remaining sources (area sources), where measured (plant-specific) emission data and plant specific activity data is not available, were estimated using the simple CORINAIR methodology by multiplying the fuel consumption of each sub category taken from the national energy balance with a fuel and technology dependent emission factor. Fuel specific emission factors are mainly country specific and taken from national studies.
Emission factors Emission factors are expressed as: kg released pollutant per TJ of burned fuel [kg/TJ].
Emission factors may vary over time for the following reasons: The chemical characteristics of a fuel category varies, e.g. sulphur content in residual oil. The mix of fuels of a fuel category changes over time. If the different fuels of a fuel category
have different calorific values and their share in the fuel category changes, the calorific value of the fuel category might change over time. If emission factors are in the unit kg/t the trans-formation to kg/TJ induces a different emission factor due to varying net calorific values.
The (abatement-) technology of a facility – or of facilities – changes over time. Sources of NOx, SO2, VOC, CO, and TSP emission factors have been periodically published reports (BMWA 1990), (BMWA 1996), (UMWELTBUNDESAMT 2001a), (UMWELTBUNDESAMT 2004b). In these studies emission factors are provided for the years 1987, 1995 and 1996. Emission fac-tors are mainly based on country specific measurements. NH3 emission factors are taken from a national study (UMWELTBUNDESAMT 1993) and (EMEP/CORINAIR 2005, chapter B112). Details are included in the relevant chapters.
PCB emission factors PCB emission factors for coal and gasoil are selected from the EMEP 2013 Guidebook. The PCB emission factor of 3600 µg/t for residual fuel oil has been selected from (KAKAREKA et al 2004) and converted to 85 µg/GJ.
The PCB emission factors for biofuels and waste have been derived from the ratio of Dioxin and PCB emission factors according to the measurements undertaken by (HEDMAN et al 2006). A ra-tio of 0.09 g PCB per g Dioxin has been selected. The same ratio has also been selected for re-finery fuels.
NH3
Emission factors are constant for the whole time series.
SO2, NOx, NMVOC, CO
For the years 1990 to 1994 emission factors are linearly interpolated by using the emission fac-tors from 1987 and 1995 taken from the studies mentioned above. From 1997 onwards mainly the emission factors of 1996 are used.
In several national studies only emission factors for VOC are cited. NMVOC emissions are cal-culated by subtracting a certain share of CH4 emissions from VOC emissions.
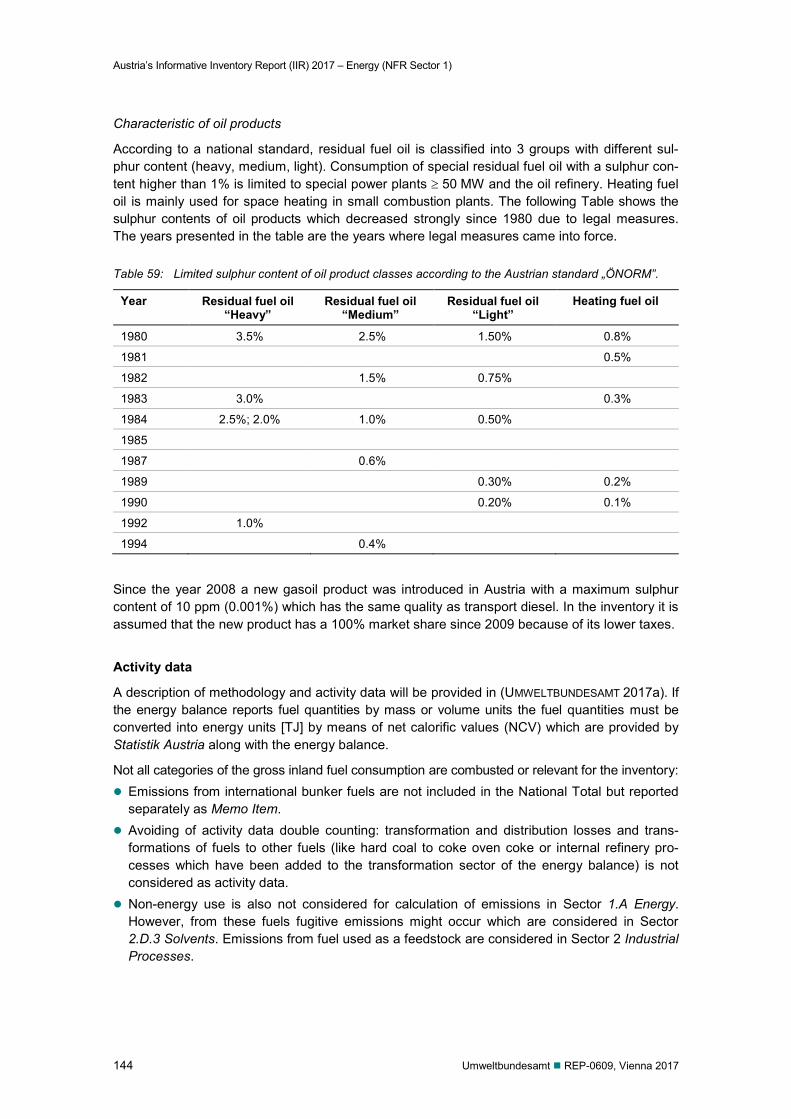
Austria’s Informative Inventory Report (IIR) 2017 – Energy (NFR Sector 1)
144 Umweltbundesamt REP-0609, Vienna 2017
Characteristic of oil products
According to a national standard, residual fuel oil is classified into 3 groups with different sul-phur content (heavy, medium, light). Consumption of special residual fuel oil with a sulphur con-tent higher than 1% is limited to special power plants ≥ 50 MW and the oil refinery. Heating fuel oil is mainly used for space heating in small combustion plants. The following Table shows the sulphur contents of oil products which decreased strongly since 1980 due to legal measures. The years presented in the table are the years where legal measures came into force.
Table 59: Limited sulphur content of oil product classes according to the Austrian standard „ÖNORM”.
Year Residual fuel oil “Heavy”
Residual fuel oil “Medium”
Residual fuel oil “Light”
Heating fuel oil
1980 3.5% 2.5% 1.50% 0.8%
1981 0.5%
1982 1.5% 0.75%
1983 3.0% 0.3%
1984 2.5%; 2.0% 1.0% 0.50%
1985
1987 0.6%
1989 0.30% 0.2%
1990 0.20% 0.1%
1992 1.0%
1994 0.4%
Since the year 2008 a new gasoil product was introduced in Austria with a maximum sulphur content of 10 ppm (0.001%) which has the same quality as transport diesel. In the inventory it is assumed that the new product has a 100% market share since 2009 because of its lower taxes.
Activity data
A description of methodology and activity data will be provided in (UMWELTBUNDESAMT 2017a). If the energy balance reports fuel quantities by mass or volume units the fuel quantities must be converted into energy units [TJ] by means of net calorific values (NCV) which are provided by Statistik Austria along with the energy balance.
Not all categories of the gross inland fuel consumption are combusted or relevant for the inventory: Emissions from international bunker fuels are not included in the National Total but reported
separately as Memo Item. Avoiding of activity data double counting: transformation and distribution losses and trans-
formations of fuels to other fuels (like hard coal to coke oven coke or internal refinery pro-cesses which have been added to the transformation sector of the energy balance) is not considered as activity data.
Non-energy use is also not considered for calculation of emissions in Sector 1.A Energy. However, from these fuels fugitive emissions might occur which are considered in Sector 2.D.3 Solvents. Emissions from fuel used as a feedstock are considered in Sector 2 Industrial Processes.
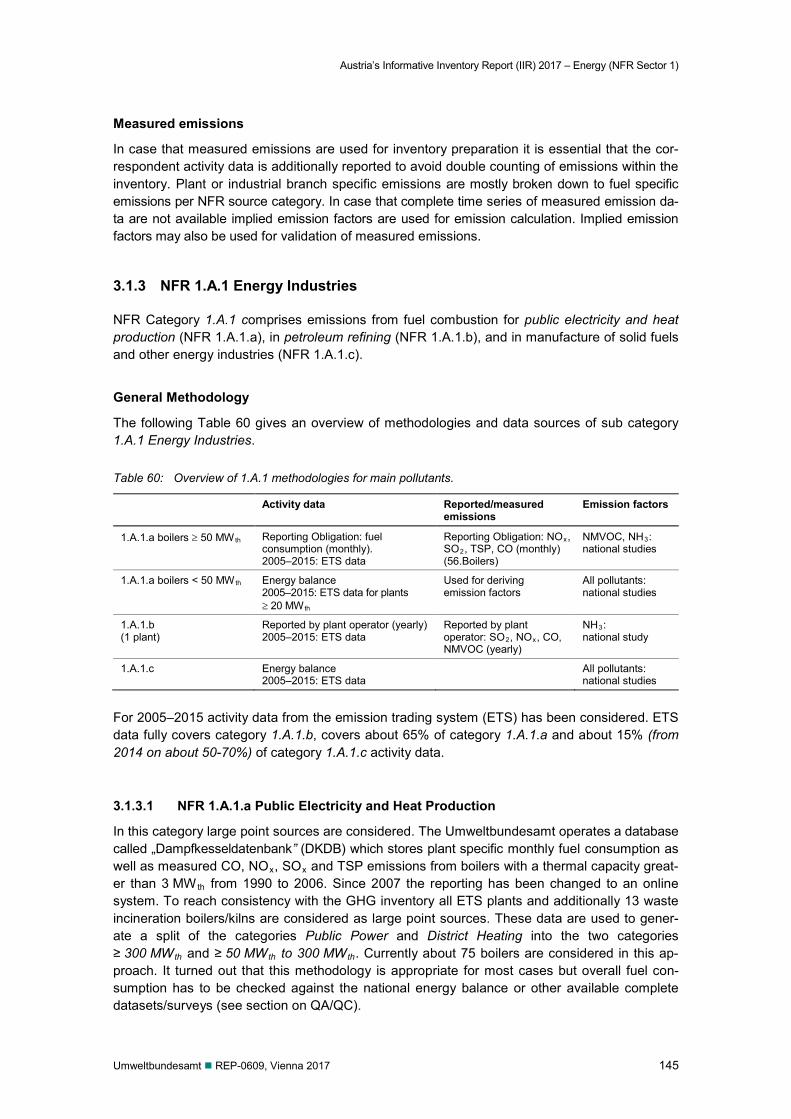
Austria’s Informative Inventory Report (IIR) 2017 – Energy (NFR Sector 1)
Umweltbundesamt REP-0609, Vienna 2017 145
Measured emissions
In case that measured emissions are used for inventory preparation it is essential that the cor-respondent activity data is additionally reported to avoid double counting of emissions within the inventory. Plant or industrial branch specific emissions are mostly broken down to fuel specific emissions per NFR source category. In case that complete time series of measured emission da-ta are not available implied emission factors are used for emission calculation. Implied emission factors may also be used for validation of measured emissions.
3.1.3 NFR 1.A.1 Energy Industries
NFR Category 1.A.1 comprises emissions from fuel combustion for public electricity and heat production (NFR 1.A.1.a), in petroleum refining (NFR 1.A.1.b), and in manufacture of solid fuels and other energy industries (NFR 1.A.1.c).
General Methodology
The following Table 60 gives an overview of methodologies and data sources of sub category 1.A.1 Energy Industries.
Table 60: Overview of 1.A.1 methodologies for main pollutants.
Activity data Reported/measured emissions
Emission factors
1.A.1.a boilers ≥ 50 MWth Reporting Obligation: fuel consumption (monthly). 2005–2015: ETS data
Reporting Obligation: NOx, SO2, TSP, CO (monthly) (56.Boilers)
NMVOC, NH3: national studies
1.A.1.a boilers < 50 MWth Energy balance 2005–2015: ETS data for plants ≥ 20 MWth
Used for deriving emission factors
All pollutants: national studies
1.A.1.b (1 plant)
Reported by plant operator (yearly) 2005–2015: ETS data
Reported by plant operator: SO2, NOx, CO, NMVOC (yearly)
NH3: national study
1.A.1.c Energy balance 2005–2015: ETS data
All pollutants: national studies
For 2005–2015 activity data from the emission trading system (ETS) has been considered. ETS data fully covers category 1.A.1.b, covers about 65% of category 1.A.1.a and about 15% (from 2014 on about 50-70%) of category 1.A.1.c activity data.
3.1.3.1 NFR 1.A.1.a Public Electricity and Heat Production
In this category large point sources are considered. The Umweltbundesamt operates a database called „Dampfkesseldatenbank” (DKDB) which stores plant specific monthly fuel consumption as well as measured CO, NOx, SOx and TSP emissions from boilers with a thermal capacity great-er than 3 MWth from 1990 to 2006. Since 2007 the reporting has been changed to an online system. To reach consistency with the GHG inventory all ETS plants and additionally 13 waste incineration boilers/kilns are considered as large point sources. These data are used to gener-ate a split of the categories Public Power and District Heating into the two categories ≥ 300 MWth and ≥ 50 MWth to 300 MWth. Currently about 75 boilers are considered in this ap-proach. It turned out that this methodology is appropriate for most cases but overall fuel con-sumption has to be checked against the national energy balance or other available complete datasets/surveys (see section on QA/QC).
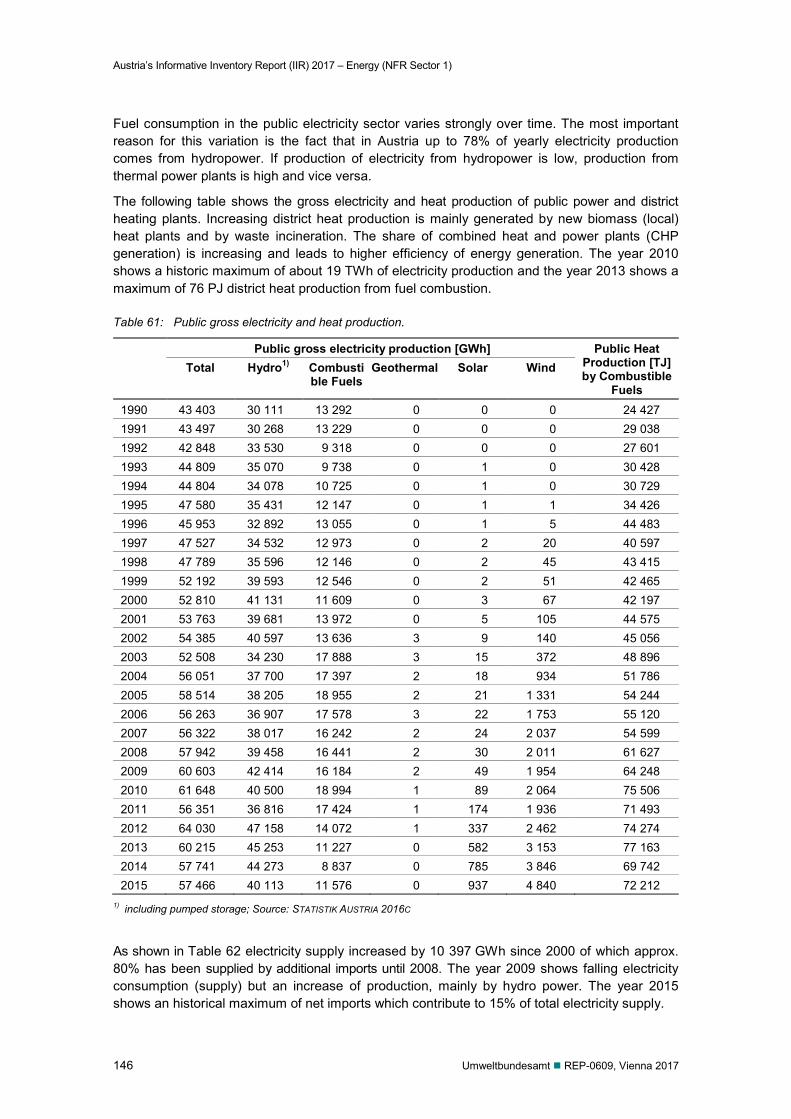
Austria’s Informative Inventory Report (IIR) 2017 – Energy (NFR Sector 1)
146 Umweltbundesamt REP-0609, Vienna 2017
Fuel consumption in the public electricity sector varies strongly over time. The most important reason for this variation is the fact that in Austria up to 78% of yearly electricity production comes from hydropower. If production of electricity from hydropower is low, production from thermal power plants is high and vice versa.
The following table shows the gross electricity and heat production of public power and district heating plants. Increasing district heat production is mainly generated by new biomass (local) heat plants and by waste incineration. The share of combined heat and power plants (CHP generation) is increasing and leads to higher efficiency of energy generation. The year 2010 shows a historic maximum of about 19 TWh of electricity production and the year 2013 shows a maximum of 76 PJ district heat production from fuel combustion.
Table 61: Public gross electricity and heat production.
Public gross electricity production [GWh] Public Heat Production [TJ] by Combustible
Fuels
Total Hydro1) Combustible Fuels
Geothermal Solar Wind
1990 43 403 30 111 13 292 0 0 0 24 427 1991 43 497 30 268 13 229 0 0 0 29 038 1992 42 848 33 530 9 318 0 0 0 27 601 1993 44 809 35 070 9 738 0 1 0 30 428 1994 44 804 34 078 10 725 0 1 0 30 729 1995 47 580 35 431 12 147 0 1 1 34 426 1996 45 953 32 892 13 055 0 1 5 44 483 1997 47 527 34 532 12 973 0 2 20 40 597 1998 47 789 35 596 12 146 0 2 45 43 415 1999 52 192 39 593 12 546 0 2 51 42 465 2000 52 810 41 131 11 609 0 3 67 42 197 2001 53 763 39 681 13 972 0 5 105 44 575 2002 54 385 40 597 13 636 3 9 140 45 056 2003 52 508 34 230 17 888 3 15 372 48 896 2004 56 051 37 700 17 397 2 18 934 51 786 2005 58 514 38 205 18 955 2 21 1 331 54 244 2006 56 263 36 907 17 578 3 22 1 753 55 120 2007 56 322 38 017 16 242 2 24 2 037 54 599 2008 57 942 39 458 16 441 2 30 2 011 61 627 2009 60 603 42 414 16 184 2 49 1 954 64 248 2010 61 648 40 500 18 994 1 89 2 064 75 506 2011 56 351 36 816 17 424 1 174 1 936 71 493 2012 64 030 47 158 14 072 1 337 2 462 74 274 2013 60 215 45 253 11 227 0 582 3 153 77 163 2014 57 741 44 273 8 837 0 785 3 846 69 742 2015 57 466 40 113 11 576 0 937 4 840 72 212
1) including pumped storage; Source: STATISTIK AUSTRIA 2016C
As shown in Table 62 electricity supply increased by 10 397 GWh since 2000 of which approx. 80% has been supplied by additional imports until 2008. The year 2009 shows falling electricity consumption (supply) but an increase of production, mainly by hydro power. The year 2015 shows an historical maximum of net imports which contribute to 15% of total electricity supply.
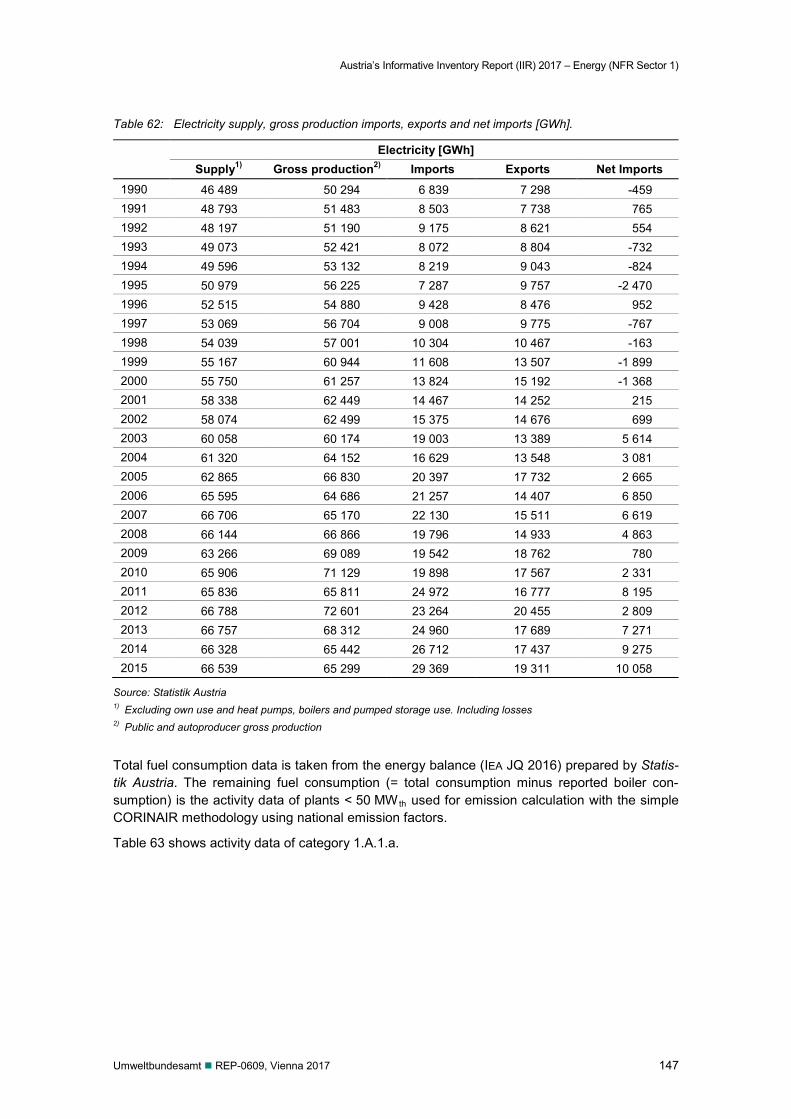
Austria’s Informative Inventory Report (IIR) 2017 – Energy (NFR Sector 1)
Umweltbundesamt REP-0609, Vienna 2017 147
Table 62: Electricity supply, gross production imports, exports and net imports [GWh].
Electricity [GWh] Supply1) Gross production2) Imports Exports Net Imports
1990 46 489 50 294 6 839 7 298 -459 1991 48 793 51 483 8 503 7 738 765 1992 48 197 51 190 9 175 8 621 554 1993 49 073 52 421 8 072 8 804 -732 1994 49 596 53 132 8 219 9 043 -824 1995 50 979 56 225 7 287 9 757 -2 470 1996 52 515 54 880 9 428 8 476 952 1997 53 069 56 704 9 008 9 775 -767 1998 54 039 57 001 10 304 10 467 -163 1999 55 167 60 944 11 608 13 507 -1 899 2000 55 750 61 257 13 824 15 192 -1 368 2001 58 338 62 449 14 467 14 252 215 2002 58 074 62 499 15 375 14 676 699 2003 60 058 60 174 19 003 13 389 5 614 2004 61 320 64 152 16 629 13 548 3 081 2005 62 865 66 830 20 397 17 732 2 665 2006 65 595 64 686 21 257 14 407 6 850 2007 66 706 65 170 22 130 15 511 6 619 2008 66 144 66 866 19 796 14 933 4 863 2009 63 266 69 089 19 542 18 762 780 2010 65 906 71 129 19 898 17 567 2 331 2011 65 836 65 811 24 972 16 777 8 195 2012 66 788 72 601 23 264 20 455 2 809 2013 66 757 68 312 24 960 17 689 7 271 2014 66 328 65 442 26 712 17 437 9 275 2015 66 539 65 299 29 369 19 311 10 058
Source: Statistik Austria 1) Excluding own use and heat pumps, boilers and pumped storage use. Including losses 2) Public and autoproducer gross production
Total fuel consumption data is taken from the energy balance (IEA JQ 2016) prepared by Statis-tik Austria. The remaining fuel consumption (= total consumption minus reported boiler con-sumption) is the activity data of plants < 50 MWth used for emission calculation with the simple CORINAIR methodology using national emission factors.
Table 63 shows activity data of category 1.A.1.a.
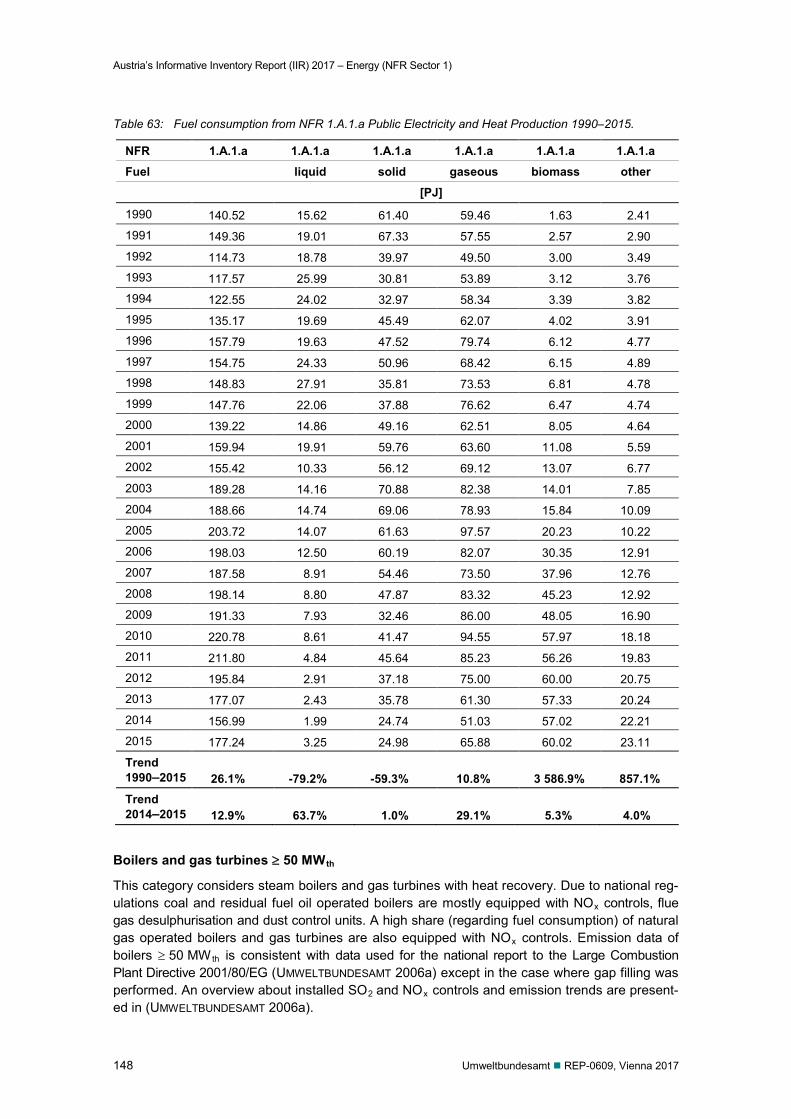
Austria’s Informative Inventory Report (IIR) 2017 – Energy (NFR Sector 1)
148 Umweltbundesamt REP-0609, Vienna 2017
Table 63: Fuel consumption from NFR 1.A.1.a Public Electricity and Heat Production 1990–2015.
NFR 1.A.1.a 1.A.1.a 1.A.1.a 1.A.1.a 1.A.1.a 1.A.1.a Fuel liquid solid gaseous biomass other [PJ]
1990 140.52 15.62 61.40 59.46 1.63 2.41
1991 149.36 19.01 67.33 57.55 2.57 2.90
1992 114.73 18.78 39.97 49.50 3.00 3.49 1993 117.57 25.99 30.81 53.89 3.12 3.76 1994 122.55 24.02 32.97 58.34 3.39 3.82 1995 135.17 19.69 45.49 62.07 4.02 3.91 1996 157.79 19.63 47.52 79.74 6.12 4.77 1997 154.75 24.33 50.96 68.42 6.15 4.89 1998 148.83 27.91 35.81 73.53 6.81 4.78 1999 147.76 22.06 37.88 76.62 6.47 4.74 2000 139.22 14.86 49.16 62.51 8.05 4.64 2001 159.94 19.91 59.76 63.60 11.08 5.59 2002 155.42 10.33 56.12 69.12 13.07 6.77
2003 189.28 14.16 70.88 82.38 14.01 7.85
2004 188.66 14.74 69.06 78.93 15.84 10.09
2005 203.72 14.07 61.63 97.57 20.23 10.22 2006 198.03 12.50 60.19 82.07 30.35 12.91 2007 187.58 8.91 54.46 73.50 37.96 12.76 2008 198.14 8.80 47.87 83.32 45.23 12.92 2009 191.33 7.93 32.46 86.00 48.05 16.90 2010 220.78 8.61 41.47 94.55 57.97 18.18 2011 211.80 4.84 45.64 85.23 56.26 19.83 2012 195.84 2.91 37.18 75.00 60.00 20.75 2013 177.07 2.43 35.78 61.30 57.33 20.24 2014 156.99 1.99 24.74 51.03 57.02 22.21 2015 177.24 3.25 24.98 65.88 60.02 23.11
Trend 1990–2015 26.1% -79.2% -59.3% 10.8% 3 586.9% 857.1% Trend 2014–2015 12.9% 63.7% 1.0% 29.1% 5.3% 4.0%
Boilers and gas turbines ≥ 50 MWth
This category considers steam boilers and gas turbines with heat recovery. Due to national reg-ulations coal and residual fuel oil operated boilers are mostly equipped with NOx controls, flue gas desulphurisation and dust control units. A high share (regarding fuel consumption) of natural gas operated boilers and gas turbines are also equipped with NOx controls. Emission data of boilers ≥ 50 MWth is consistent with data used for the national report to the Large Combustion Plant Directive 2001/80/EG (UMWELTBUNDESAMT 2006a) except in the case where gap filling was performed. An overview about installed SO2 and NOx controls and emission trends are present-ed in (UMWELTBUNDESAMT 2006a).
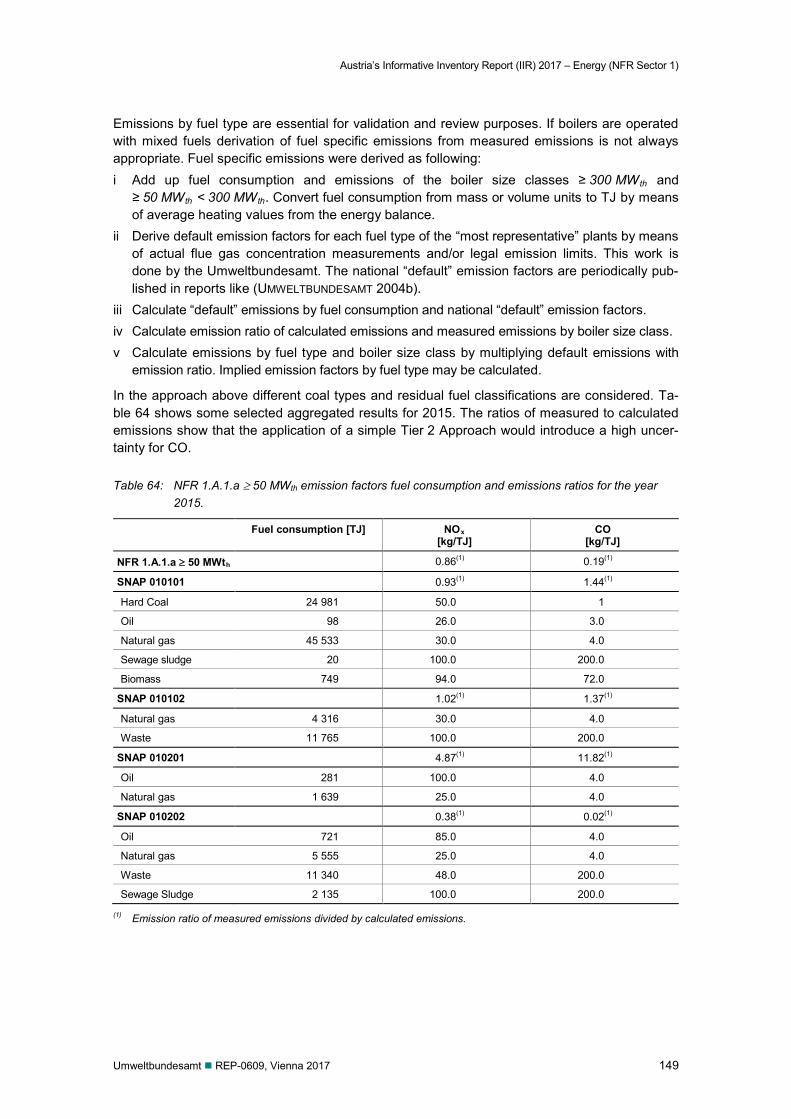
Austria’s Informative Inventory Report (IIR) 2017 – Energy (NFR Sector 1)
Umweltbundesamt REP-0609, Vienna 2017 149
Emissions by fuel type are essential for validation and review purposes. If boilers are operated with mixed fuels derivation of fuel specific emissions from measured emissions is not always appropriate. Fuel specific emissions were derived as following: i Add up fuel consumption and emissions of the boiler size classes ≥ 300 MWth and
≥ 50 MWth < 300 MWth. Convert fuel consumption from mass or volume units to TJ by means of average heating values from the energy balance.
ii Derive default emission factors for each fuel type of the “most representative” plants by means of actual flue gas concentration measurements and/or legal emission limits. This work is done by the Umweltbundesamt. The national “default” emission factors are periodically pub-lished in reports like (UMWELTBUNDESAMT 2004b).
iii Calculate “default” emissions by fuel consumption and national “default” emission factors. iv Calculate emission ratio of calculated emissions and measured emissions by boiler size class. v Calculate emissions by fuel type and boiler size class by multiplying default emissions with
emission ratio. Implied emission factors by fuel type may be calculated.
In the approach above different coal types and residual fuel classifications are considered. Ta-ble 64 shows some selected aggregated results for 2015. The ratios of measured to calculated emissions show that the application of a simple Tier 2 Approach would introduce a high uncer-tainty for CO.
Table 64: NFR 1.A.1.a ≥ 50 MWth emission factors fuel consumption and emissions ratios for the year 2015.
Fuel consumption [TJ] NOx [kg/TJ]
CO [kg/TJ]
NFR 1.A.1.a ≥ 50 MWth 0.86(1) 0.19(1)
SNAP 010101 0.93(1) 1.44(1)
Hard Coal 24 981 50.0 1
Oil 98 26.0 3.0
Natural gas 45 533 30.0 4.0
Sewage sludge 20 100.0 200.0
Biomass 749 94.0 72.0
SNAP 010102 1.02(1) 1.37(1)
Natural gas 4 316 30.0 4.0
Waste 11 765 100.0 200.0
SNAP 010201 4.87(1) 11.82(1)
Oil 281 100.0 4.0
Natural gas 1 639 25.0 4.0
SNAP 010202 0.38(1) 0.02(1)
Oil 721 85.0 4.0
Natural gas 5 555 25.0 4.0
Waste 11 340 48.0 200.0
Sewage Sludge 2 135 100.0 200.0
(1) Emission ratio of measured emissions divided by calculated emissions.
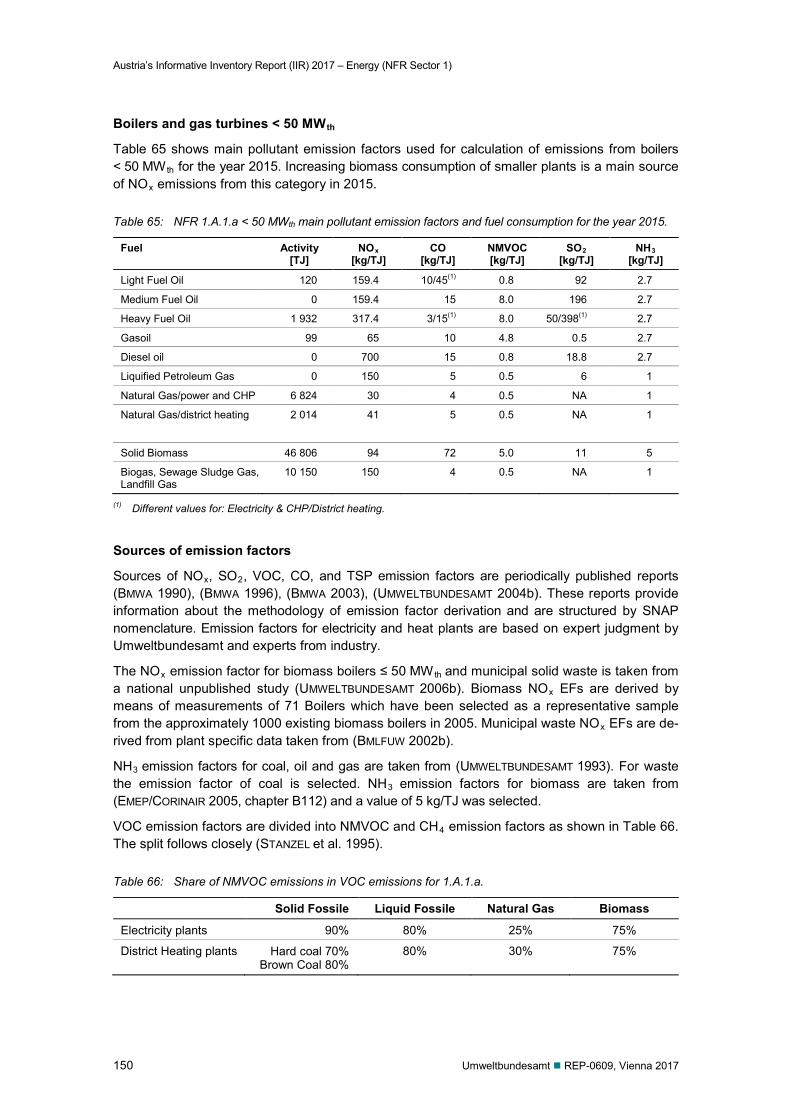
Austria’s Informative Inventory Report (IIR) 2017 – Energy (NFR Sector 1)
150 Umweltbundesamt REP-0609, Vienna 2017
Boilers and gas turbines < 50 MWth
Table 65 shows main pollutant emission factors used for calculation of emissions from boilers < 50 MWth for the year 2015. Increasing biomass consumption of smaller plants is a main source of NOx emissions from this category in 2015.
Table 65: NFR 1.A.1.a < 50 MWth main pollutant emission factors and fuel consumption for the year 2015.
Fuel Activity [TJ]
NOx [kg/TJ]
CO [kg/TJ]
NMVOC [kg/TJ]
SO2 [kg/TJ]
NH3 [kg/TJ]
Light Fuel Oil 120 159.4 10/45(1) 0.8 92 2.7
Medium Fuel Oil 0 159.4 15 8.0 196 2.7
Heavy Fuel Oil 1 932 317.4 3/15(1) 8.0 50/398(1) 2.7
Gasoil 99 65 10 4.8 0.5 2.7
Diesel oil 0 700 15 0.8 18.8 2.7
Liquified Petroleum Gas 0 150 5 0.5 6 1
Natural Gas/power and CHP 6 824 30 4 0.5 NA 1
Natural Gas/district heating 2 014
41 5 0.5 NA 1
Solid Biomass 46 806 94 72 5.0 11 5
Biogas, Sewage Sludge Gas, Landfill Gas
10 150 150 4 0.5 NA 1
(1) Different values for: Electricity & CHP/District heating.
Sources of emission factors
Sources of NOx, SO2, VOC, CO, and TSP emission factors are periodically published reports (BMWA 1990), (BMWA 1996), (BMWA 2003), (UMWELTBUNDESAMT 2004b). These reports provide information about the methodology of emission factor derivation and are structured by SNAP nomenclature. Emission factors for electricity and heat plants are based on expert judgment by Umweltbundesamt and experts from industry.
The NOx emission factor for biomass boilers ≤ 50 MWth and municipal solid waste is taken from a national unpublished study (UMWELTBUNDESAMT 2006b). Biomass NOx EFs are derived by means of measurements of 71 Boilers which have been selected as a representative sample from the approximately 1000 existing biomass boilers in 2005. Municipal waste NOx EFs are de-rived from plant specific data taken from (BMLFUW 2002b).
NH3 emission factors for coal, oil and gas are taken from (UMWELTBUNDESAMT 1993). For waste the emission factor of coal is selected. NH3 emission factors for biomass are taken from (EMEP/CORINAIR 2005, chapter B112) and a value of 5 kg/TJ was selected.
VOC emission factors are divided into NMVOC and CH4 emission factors as shown in Table 66. The split follows closely (STANZEL et al. 1995).
Table 66: Share of NMVOC emissions in VOC emissions for 1.A.1.a.
Solid Fossile Liquid Fossile Natural Gas Biomass
Electricity plants 90% 80% 25% 75%
District Heating plants Hard coal 70% Brown Coal 80%
80% 30% 75%
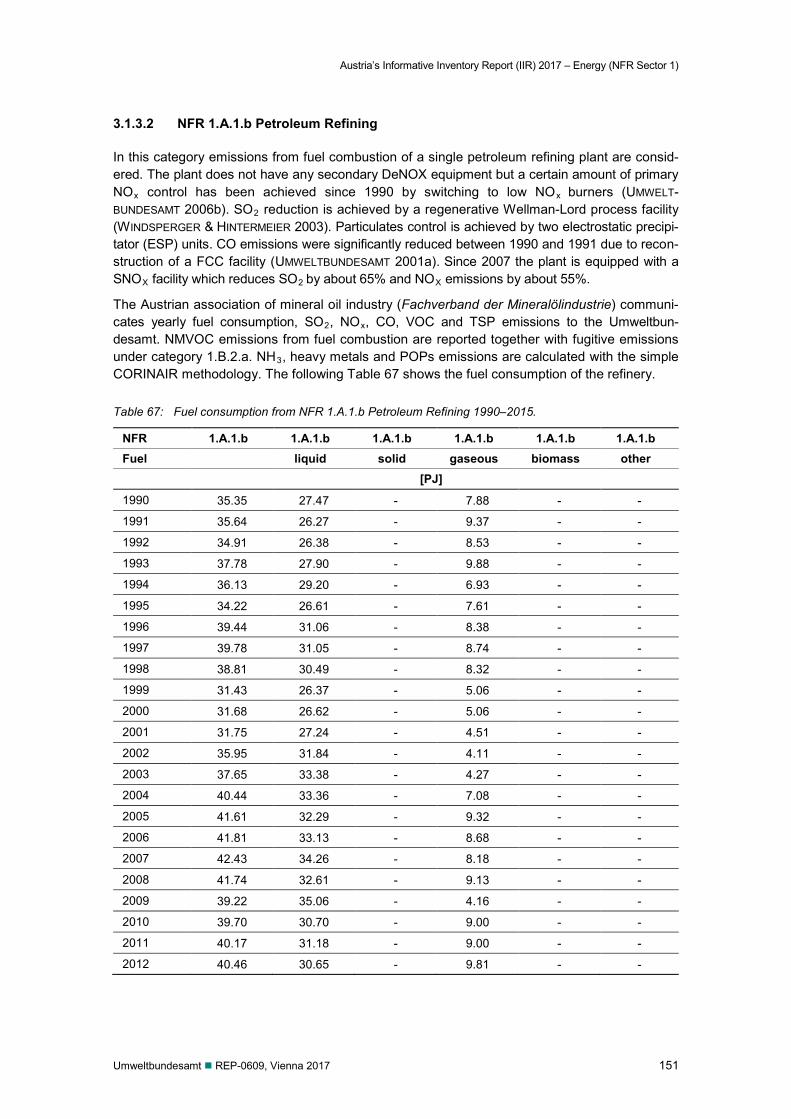
Austria’s Informative Inventory Report (IIR) 2017 – Energy (NFR Sector 1)
Umweltbundesamt REP-0609, Vienna 2017 151
3.1.3.2 NFR 1.A.1.b Petroleum Refining
In this category emissions from fuel combustion of a single petroleum refining plant are consid-ered. The plant does not have any secondary DeNOX equipment but a certain amount of primary NOx control has been achieved since 1990 by switching to low NOx burners (UMWELT-BUNDESAMT 2006b). SO2 reduction is achieved by a regenerative Wellman-Lord process facility (WINDSPERGER & HINTERMEIER 2003). Particulates control is achieved by two electrostatic precipi-tator (ESP) units. CO emissions were significantly reduced between 1990 and 1991 due to recon-struction of a FCC facility (UMWELTBUNDESAMT 2001a). Since 2007 the plant is equipped with a SNOX facility which reduces SO2 by about 65% and NOX emissions by about 55%.
The Austrian association of mineral oil industry (Fachverband der Mineralölindustrie) communi-cates yearly fuel consumption, SO2, NOx, CO, VOC and TSP emissions to the Umweltbun-desamt. NMVOC emissions from fuel combustion are reported together with fugitive emissions under category 1.B.2.a. NH3, heavy metals and POPs emissions are calculated with the simple CORINAIR methodology. The following Table 67 shows the fuel consumption of the refinery.
Table 67: Fuel consumption from NFR 1.A.1.b Petroleum Refining 1990–2015.
NFR 1.A.1.b 1.A.1.b 1.A.1.b 1.A.1.b 1.A.1.b 1.A.1.b Fuel liquid solid gaseous biomass other [PJ]
1990 35.35 27.47 - 7.88 - -
1991 35.64 26.27 - 9.37 - -
1992 34.91 26.38 - 8.53 - -
1993 37.78 27.90 - 9.88 - -
1994 36.13 29.20 - 6.93 - -
1995 34.22 26.61 - 7.61 - -
1996 39.44 31.06 - 8.38 - -
1997 39.78 31.05 - 8.74 - -
1998 38.81 30.49 - 8.32 - -
1999 31.43 26.37 - 5.06 - -
2000 31.68 26.62 - 5.06 - -
2001 31.75 27.24 - 4.51 - -
2002 35.95 31.84 - 4.11 - -
2003 37.65 33.38 - 4.27 - -
2004 40.44 33.36 - 7.08 - -
2005 41.61 32.29 - 9.32 - -
2006 41.81 33.13 - 8.68 - -
2007 42.43 34.26 - 8.18 - -
2008 41.74 32.61 - 9.13 - -
2009 39.22 35.06 - 4.16 - -
2010 39.70 30.70 - 9.00 - -
2011 40.17 31.18 - 9.00 - -
2012 40.46 30.65 - 9.81 - -
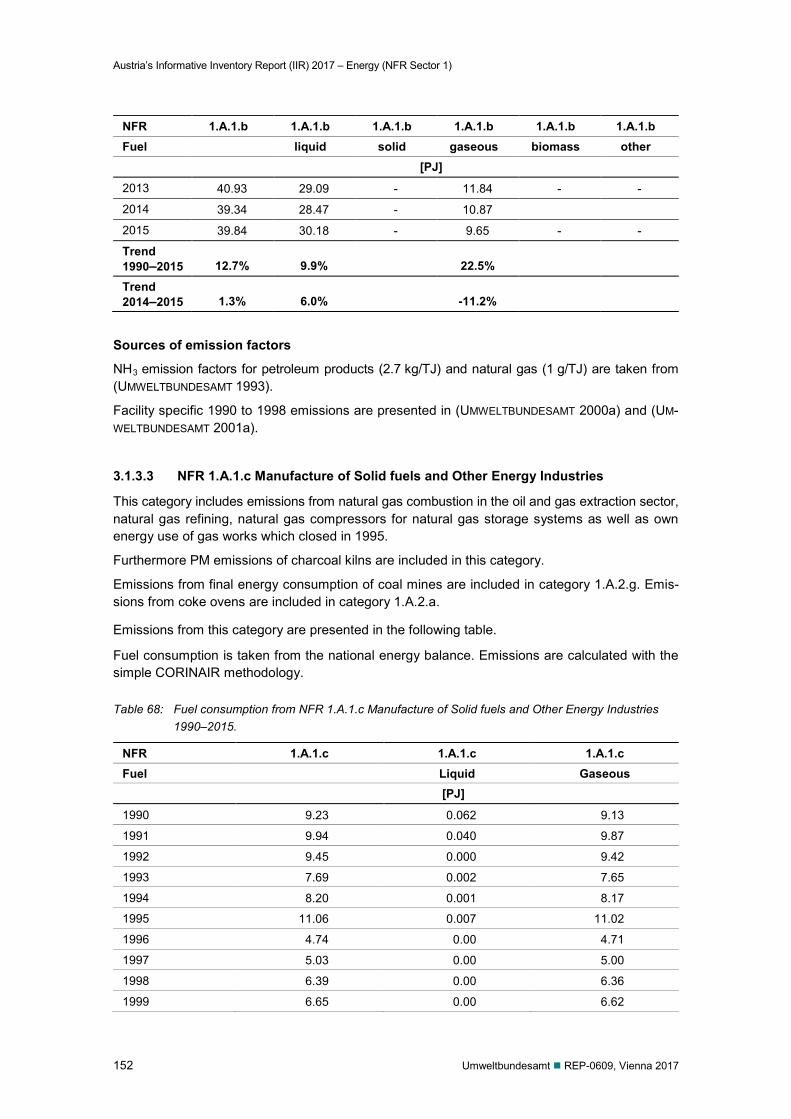
Austria’s Informative Inventory Report (IIR) 2017 – Energy (NFR Sector 1)
152 Umweltbundesamt REP-0609, Vienna 2017
NFR 1.A.1.b 1.A.1.b 1.A.1.b 1.A.1.b 1.A.1.b 1.A.1.b Fuel liquid solid gaseous biomass other [PJ]
2013 40.93 29.09 - 11.84 - -
2014 39.34 28.47 - 10.87
2015 39.84 30.18 - 9.65 - -
Trend 1990–2015 12.7% 9.9% 22.5%
Trend 2014–2015 1.3% 6.0% -11.2%
Sources of emission factors
NH3 emission factors for petroleum products (2.7 kg/TJ) and natural gas (1 g/TJ) are taken from (UMWELTBUNDESAMT 1993).
Facility specific 1990 to 1998 emissions are presented in (UMWELTBUNDESAMT 2000a) and (UM-WELTBUNDESAMT 2001a).
3.1.3.3 NFR 1.A.1.c Manufacture of Solid fuels and Other Energy Industries
This category includes emissions from natural gas combustion in the oil and gas extraction sector, natural gas refining, natural gas compressors for natural gas storage systems as well as own energy use of gas works which closed in 1995.
Furthermore PM emissions of charcoal kilns are included in this category.
Emissions from final energy consumption of coal mines are included in category 1.A.2.g. Emis-sions from coke ovens are included in category 1.A.2.a.
Emissions from this category are presented in the following table.
Fuel consumption is taken from the national energy balance. Emissions are calculated with the simple CORINAIR methodology.
Table 68: Fuel consumption from NFR 1.A.1.c Manufacture of Solid fuels and Other Energy Industries 1990–2015.
NFR 1.A.1.c 1.A.1.c 1.A.1.c Fuel Liquid Gaseous [PJ]
1990 9.23 0.062 9.13
1991 9.94 0.040 9.87
1992 9.45 0.000 9.42
1993 7.69 0.002 7.65
1994 8.20 0.001 8.17
1995 11.06 0.007 11.02
1996 4.74 0.00 4.71
1997 5.03 0.00 5.00
1998 6.39 0.00 6.36
1999 6.65 0.00 6.62
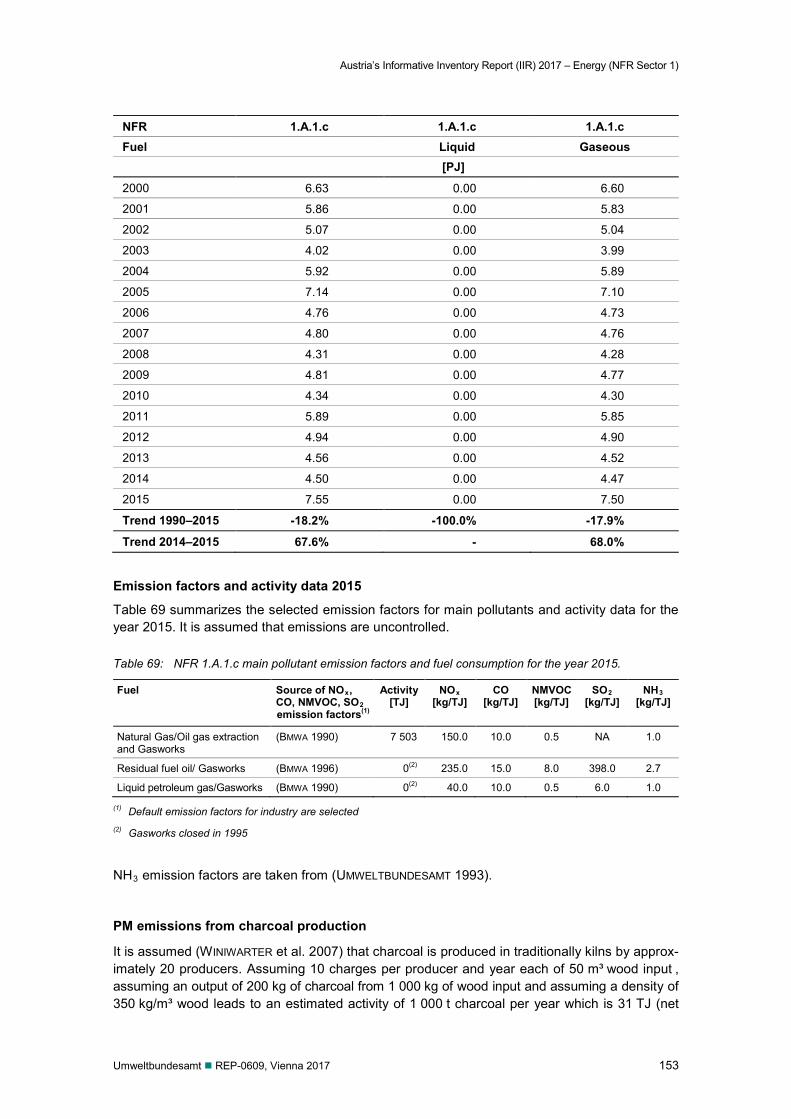
Austria’s Informative Inventory Report (IIR) 2017 – Energy (NFR Sector 1)
Umweltbundesamt REP-0609, Vienna 2017 153
NFR 1.A.1.c 1.A.1.c 1.A.1.c Fuel Liquid Gaseous [PJ]
2000 6.63 0.00 6.60
2001 5.86 0.00 5.83
2002 5.07 0.00 5.04
2003 4.02 0.00 3.99
2004 5.92 0.00 5.89
2005 7.14 0.00 7.10
2006 4.76 0.00 4.73
2007 4.80 0.00 4.76
2008 4.31 0.00 4.28
2009 4.81 0.00 4.77
2010 4.34 0.00 4.30
2011 5.89 0.00 5.85
2012 4.94 0.00 4.90
2013 4.56 0.00 4.52
2014 4.50 0.00 4.47
2015 7.55 0.00 7.50
Trend 1990–2015 -18.2% -100.0% -17.9%
Trend 2014–2015 67.6% - 68.0%
Emission factors and activity data 2015
Table 69 summarizes the selected emission factors for main pollutants and activity data for the year 2015. It is assumed that emissions are uncontrolled.
Table 69: NFR 1.A.1.c main pollutant emission factors and fuel consumption for the year 2015.
Fuel Source of NOx, CO, NMVOC, SO2 emission factors(1)
Activity [TJ]
NOx [kg/TJ]
CO [kg/TJ]
NMVOC [kg/TJ]
SO2 [kg/TJ]
NH3 [kg/TJ]
Natural Gas/Oil gas extraction and Gasworks
(BMWA 1990) 7 503 150.0 10.0 0.5 NA 1.0
Residual fuel oil/ Gasworks (BMWA 1996) 0(2) 235.0 15.0 8.0 398.0 2.7
Liquid petroleum gas/Gasworks (BMWA 1990) 0(2) 40.0 10.0 0.5 6.0 1.0
(1) Default emission factors for industry are selected (2) Gasworks closed in 1995
NH3 emission factors are taken from (UMWELTBUNDESAMT 1993).
PM emissions from charcoal production
It is assumed (WINIWARTER et al. 2007) that charcoal is produced in traditionally kilns by approx-imately 20 producers. Assuming 10 charges per producer and year each of 50 m³ wood input , assuming an output of 200 kg of charcoal from 1 000 kg of wood input and assuming a density of 350 kg/m³ wood leads to an estimated activity of 1 000 t charcoal per year which is 31 TJ (net
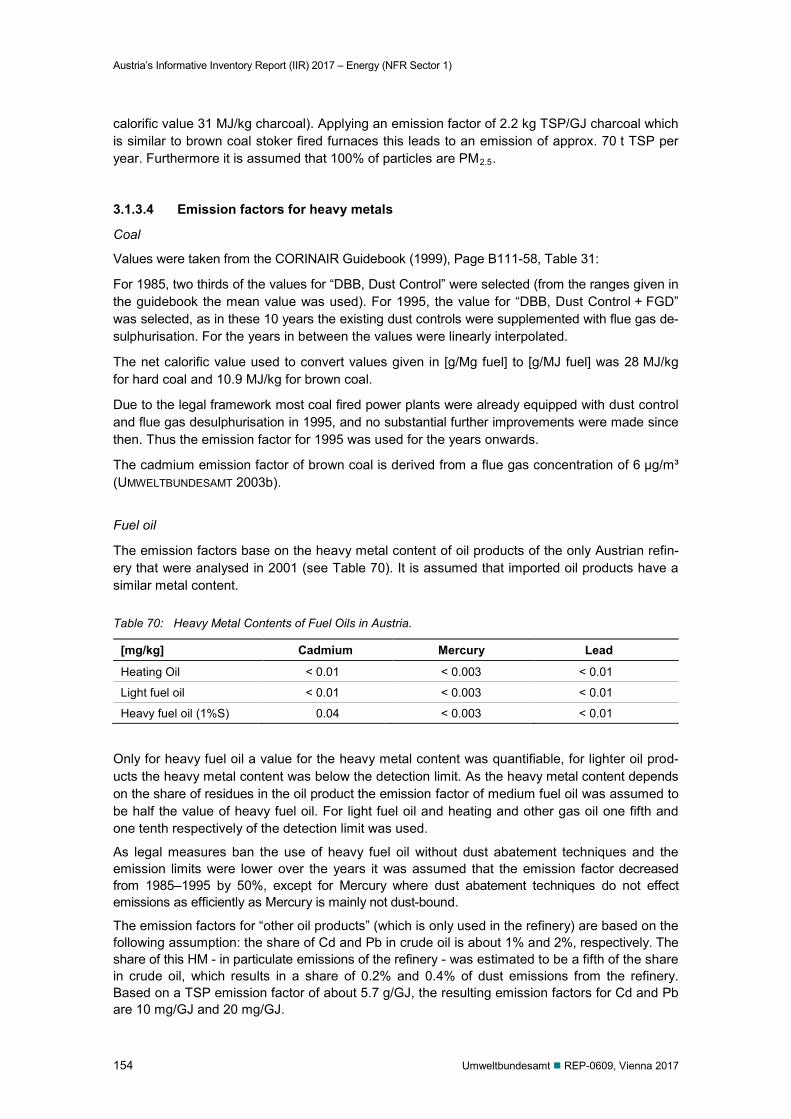
Austria’s Informative Inventory Report (IIR) 2017 – Energy (NFR Sector 1)
154 Umweltbundesamt REP-0609, Vienna 2017
calorific value 31 MJ/kg charcoal). Applying an emission factor of 2.2 kg TSP/GJ charcoal which is similar to brown coal stoker fired furnaces this leads to an emission of approx. 70 t TSP per year. Furthermore it is assumed that 100% of particles are PM2.5.
3.1.3.4 Emission factors for heavy metals
Coal
Values were taken from the CORINAIR Guidebook (1999), Page B111-58, Table 31:
For 1985, two thirds of the values for “DBB, Dust Control” were selected (from the ranges given in the guidebook the mean value was used). For 1995, the value for “DBB, Dust Control + FGD” was selected, as in these 10 years the existing dust controls were supplemented with flue gas de-sulphurisation. For the years in between the values were linearly interpolated.
The net calorific value used to convert values given in [g/Mg fuel] to [g/MJ fuel] was 28 MJ/kg for hard coal and 10.9 MJ/kg for brown coal.
Due to the legal framework most coal fired power plants were already equipped with dust control and flue gas desulphurisation in 1995, and no substantial further improvements were made since then. Thus the emission factor for 1995 was used for the years onwards.
The cadmium emission factor of brown coal is derived from a flue gas concentration of 6 µg/m³ (UMWELTBUNDESAMT 2003b).
Fuel oil
The emission factors base on the heavy metal content of oil products of the only Austrian refin-ery that were analysed in 2001 (see Table 70). It is assumed that imported oil products have a similar metal content.
Table 70: Heavy Metal Contents of Fuel Oils in Austria.
[mg/kg] Cadmium Mercury Lead
Heating Oil < 0.01 < 0.003 < 0.01
Light fuel oil < 0.01 < 0.003 < 0.01
Heavy fuel oil (1%S) 0.04 < 0.003 < 0.01
Only for heavy fuel oil a value for the heavy metal content was quantifiable, for lighter oil prod-ucts the heavy metal content was below the detection limit. As the heavy metal content depends on the share of residues in the oil product the emission factor of medium fuel oil was assumed to be half the value of heavy fuel oil. For light fuel oil and heating and other gas oil one fifth and one tenth respectively of the detection limit was used.
As legal measures ban the use of heavy fuel oil without dust abatement techniques and the emission limits were lower over the years it was assumed that the emission factor decreased from 1985–1995 by 50%, except for Mercury where dust abatement techniques do not effect emissions as efficiently as Mercury is mainly not dust-bound.
The emission factors for “other oil products” (which is only used in the refinery) are based on the following assumption: the share of Cd and Pb in crude oil is about 1% and 2%, respectively. The share of this HM - in particulate emissions of the refinery - was estimated to be a fifth of the share in crude oil, which results in a share of 0.2% and 0.4% of dust emissions from the refinery. Based on a TSP emission factor of about 5.7 g/GJ, the resulting emission factors for Cd and Pb are 10 mg/GJ and 20 mg/GJ.
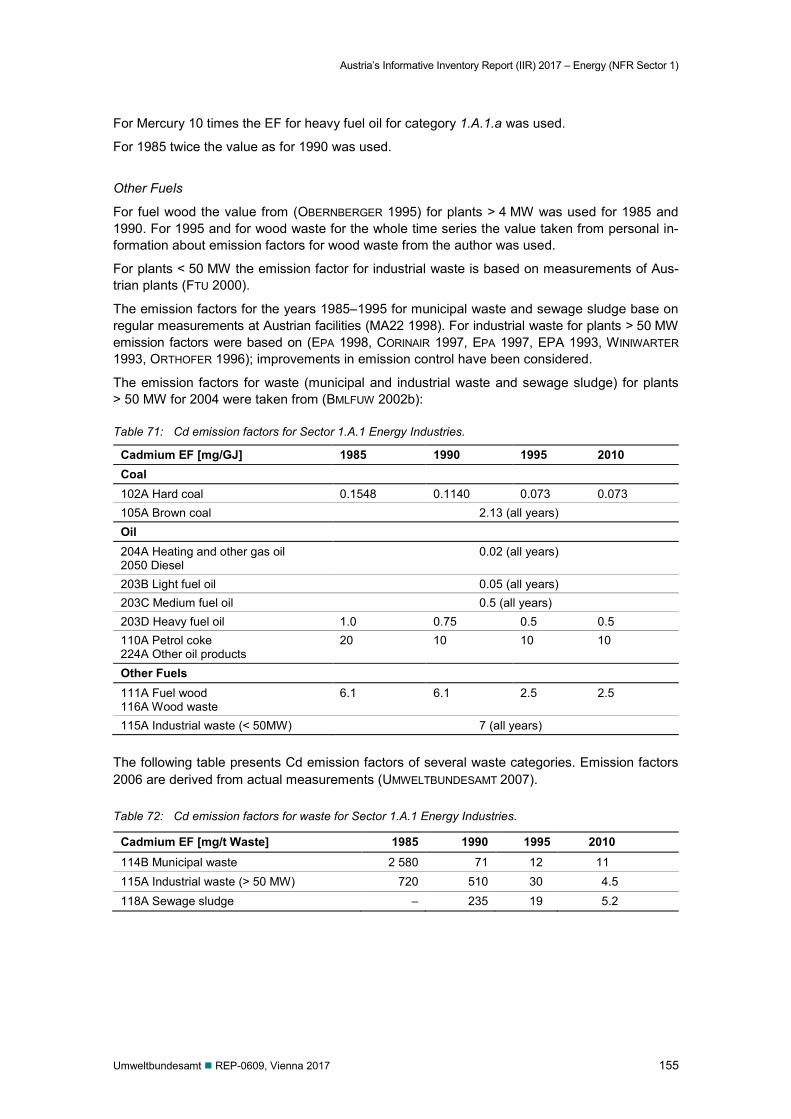
Austria’s Informative Inventory Report (IIR) 2017 – Energy (NFR Sector 1)
Umweltbundesamt REP-0609, Vienna 2017 155
For Mercury 10 times the EF for heavy fuel oil for category 1.A.1.a was used.
For 1985 twice the value as for 1990 was used.
Other Fuels
For fuel wood the value from (OBERNBERGER 1995) for plants > 4 MW was used for 1985 and 1990. For 1995 and for wood waste for the whole time series the value taken from personal in-formation about emission factors for wood waste from the author was used.
For plants < 50 MW the emission factor for industrial waste is based on measurements of Aus-trian plants (FTU 2000).
The emission factors for the years 1985–1995 for municipal waste and sewage sludge base on regular measurements at Austrian facilities (MA22 1998). For industrial waste for plants > 50 MW emission factors were based on (EPA 1998, CORINAIR 1997, EPA 1997, EPA 1993, WINIWARTER 1993, ORTHOFER 1996); improvements in emission control have been considered.
The emission factors for waste (municipal and industrial waste and sewage sludge) for plants > 50 MW for 2004 were taken from (BMLFUW 2002b):
Table 71: Cd emission factors for Sector 1.A.1 Energy Industries.
Cadmium EF [mg/GJ] 1985 1990 1995 2010 Coal 102A Hard coal 0.1548 0.1140 0.073 0.073 105A Brown coal 2.13 (all years) Oil 204A Heating and other gas oil 2050 Diesel
0.02 (all years)
203B Light fuel oil 0.05 (all years) 203C Medium fuel oil 0.5 (all years) 203D Heavy fuel oil 1.0 0.75 0.5 0.5 110A Petrol coke 224A Other oil products
20 10 10 10
Other Fuels 111A Fuel wood 116A Wood waste
6.1 6.1 2.5 2.5
115A Industrial waste (< 50MW) 7 (all years) The following table presents Cd emission factors of several waste categories. Emission factors 2006 are derived from actual measurements (UMWELTBUNDESAMT 2007).
Table 72: Cd emission factors for waste for Sector 1.A.1 Energy Industries.
Cadmium EF [mg/t Waste] 1985 1990 1995 2010 114B Municipal waste 2 580 71 12 11 115A Industrial waste (> 50 MW) 720 510 30 4.5 118A Sewage sludge – 235 19 5.2
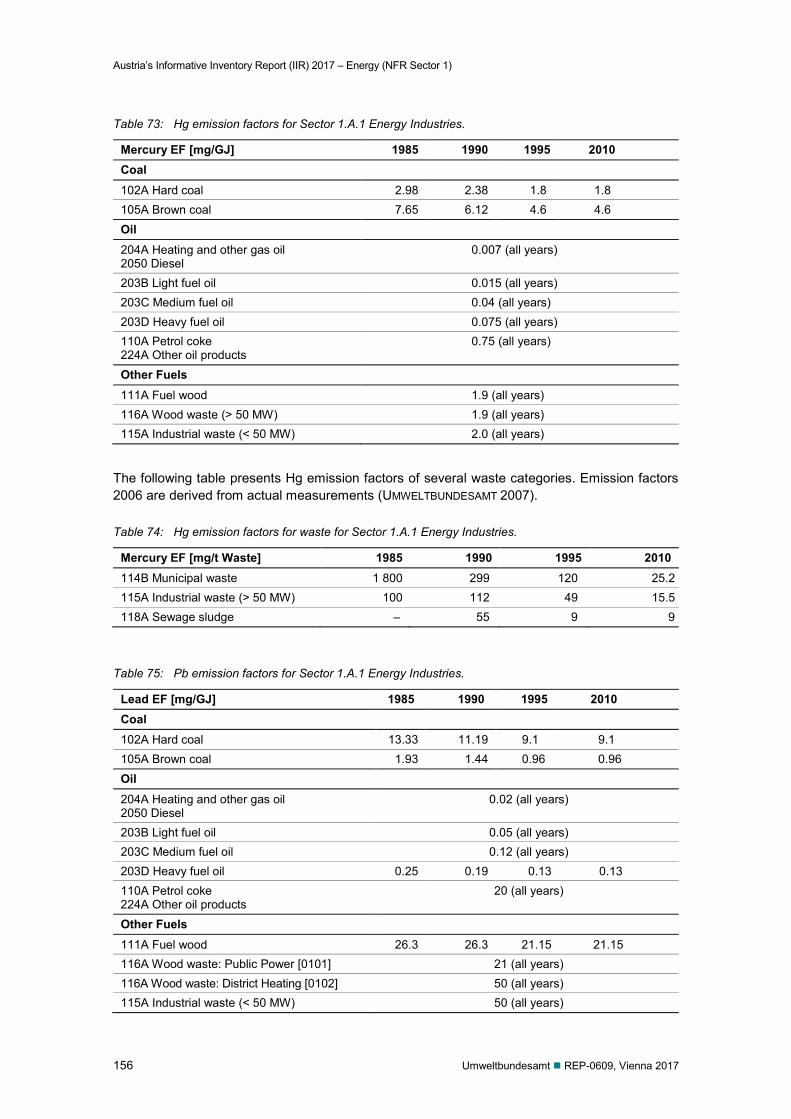
Austria’s Informative Inventory Report (IIR) 2017 – Energy (NFR Sector 1)
156 Umweltbundesamt REP-0609, Vienna 2017
Table 73: Hg emission factors for Sector 1.A.1 Energy Industries.
Mercury EF [mg/GJ] 1985 1990 1995 2010 Coal 102A Hard coal 2.98 2.38 1.8 1.8 105A Brown coal 7.65 6.12 4.6 4.6 Oil 204A Heating and other gas oil 2050 Diesel
0.007 (all years)
203B Light fuel oil 0.015 (all years) 203C Medium fuel oil 0.04 (all years) 203D Heavy fuel oil 0.075 (all years) 110A Petrol coke 224A Other oil products
0.75 (all years)
Other Fuels 111A Fuel wood 1.9 (all years) 116A Wood waste (> 50 MW) 1.9 (all years) 115A Industrial waste (< 50 MW) 2.0 (all years)
The following table presents Hg emission factors of several waste categories. Emission factors 2006 are derived from actual measurements (UMWELTBUNDESAMT 2007).
Table 74: Hg emission factors for waste for Sector 1.A.1 Energy Industries.
Mercury EF [mg/t Waste] 1985 1990 1995 2010 114B Municipal waste 1 800 299 120 25.2 115A Industrial waste (> 50 MW) 100 112 49 15.5 118A Sewage sludge – 55 9 9
Table 75: Pb emission factors for Sector 1.A.1 Energy Industries.
Lead EF [mg/GJ] 1985 1990 1995 2010 Coal 102A Hard coal 13.33 11.19 9.1 9.1 105A Brown coal 1.93 1.44 0.96 0.96 Oil 204A Heating and other gas oil 2050 Diesel
0.02 (all years)
203B Light fuel oil 0.05 (all years) 203C Medium fuel oil 0.12 (all years) 203D Heavy fuel oil 0.25 0.19 0.13 0.13 110A Petrol coke 224A Other oil products
20 (all years)
Other Fuels
111A Fuel wood 26.3 26.3 21.15 21.15 116A Wood waste: Public Power [0101] 21 (all years) 116A Wood waste: District Heating [0102] 50 (all years) 115A Industrial waste (< 50 MW) 50 (all years)
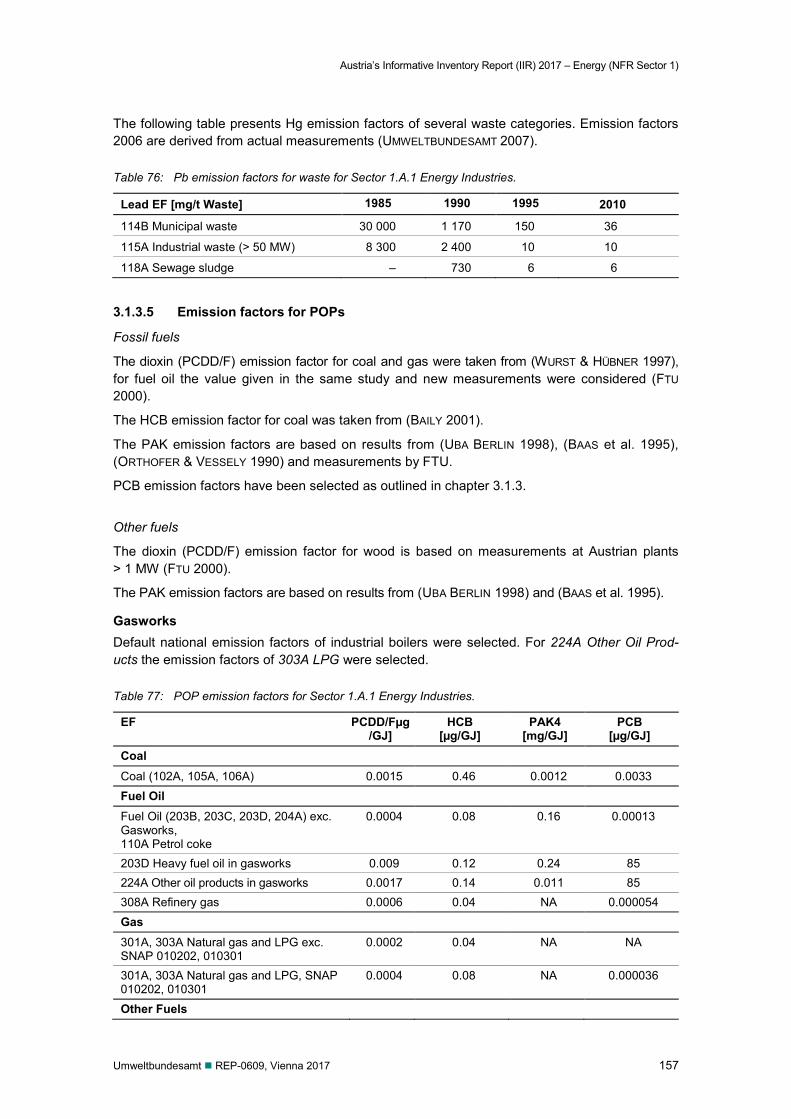
Austria’s Informative Inventory Report (IIR) 2017 – Energy (NFR Sector 1)
Umweltbundesamt REP-0609, Vienna 2017 157
The following table presents Hg emission factors of several waste categories. Emission factors 2006 are derived from actual measurements (UMWELTBUNDESAMT 2007).
Table 76: Pb emission factors for waste for Sector 1.A.1 Energy Industries.
Lead EF [mg/t Waste] 1985 1990 1995 2010
114B Municipal waste 30 000 1 170 150 36
115A Industrial waste (> 50 MW) 8 300 2 400 10 10
118A Sewage sludge – 730 6 6
3.1.3.5 Emission factors for POPs
Fossil fuels
The dioxin (PCDD/F) emission factor for coal and gas were taken from (WURST & HÜBNER 1997), for fuel oil the value given in the same study and new measurements were considered (FTU 2000).
The HCB emission factor for coal was taken from (BAILY 2001).
The PAK emission factors are based on results from (UBA BERLIN 1998), (BAAS et al. 1995), (ORTHOFER & VESSELY 1990) and measurements by FTU.
PCB emission factors have been selected as outlined in chapter 3.1.3.
Other fuels
The dioxin (PCDD/F) emission factor for wood is based on measurements at Austrian plants > 1 MW (FTU 2000).
The PAK emission factors are based on results from (UBA BERLIN 1998) and (BAAS et al. 1995).
Gasworks Default national emission factors of industrial boilers were selected. For 224A Other Oil Prod-ucts the emission factors of 303A LPG were selected.
Table 77: POP emission factors for Sector 1.A.1 Energy Industries.
EF PCDD/Fµg/GJ]
HCB [µg/GJ]
PAK4 [mg/GJ]
PCB [µg/GJ]
Coal Coal (102A, 105A, 106A) 0.0015 0.46 0.0012 0.0033 Fuel Oil
Fuel Oil (203B, 203C, 203D, 204A) exc. Gasworks, 110A Petrol coke
0.0004 0.08 0.16 0.00013
203D Heavy fuel oil in gasworks 0.009 0.12 0.24 85 224A Other oil products in gasworks 0.0017 0.14 0.011 85 308A Refinery gas 0.0006 0.04 NA 0.000054 Gas 301A, 303A Natural gas and LPG exc. SNAP 010202, 010301
0.0002 0.04 NA NA
301A, 303A Natural gas and LPG, SNAP 010202, 010301
0.0004 0.08 NA 0.000036
Other Fuels
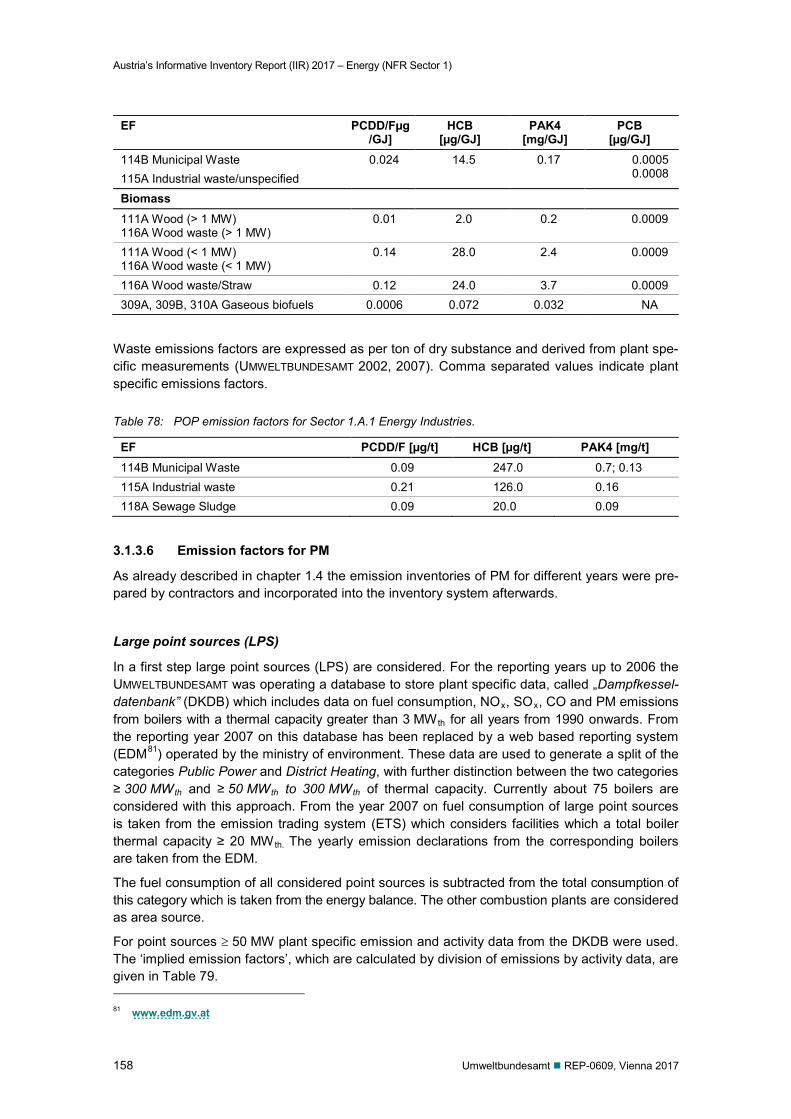
Austria’s Informative Inventory Report (IIR) 2017 – Energy (NFR Sector 1)
158 Umweltbundesamt REP-0609, Vienna 2017
EF PCDD/Fµg/GJ]
HCB [µg/GJ]
PAK4 [mg/GJ]
PCB [µg/GJ]
114B Municipal Waste 115A Industrial waste/unspecified
0.024 14.5 0.17 0.0005 0.0008
Biomass 111A Wood (> 1 MW) 116A Wood waste (> 1 MW)
0.01 2.0 0.2 0.0009
111A Wood (< 1 MW) 116A Wood waste (< 1 MW)
0.14 28.0 2.4 0.0009
116A Wood waste/Straw 0.12 24.0 3.7 0.0009 309A, 309B, 310A Gaseous biofuels 0.0006 0.072 0.032 NA
Waste emissions factors are expressed as per ton of dry substance and derived from plant spe-cific measurements (UMWELTBUNDESAMT 2002, 2007). Comma separated values indicate plant specific emissions factors.
Table 78: POP emission factors for Sector 1.A.1 Energy Industries.
EF PCDD/F [µg/t] HCB [µg/t] PAK4 [mg/t] 114B Municipal Waste 0.09 247.0 0.7; 0.13 115A Industrial waste 0.21 126.0 0.16 118A Sewage Sludge 0.09 20.0 0.09
3.1.3.6 Emission factors for PM
As already described in chapter 1.4 the emission inventories of PM for different years were pre-pared by contractors and incorporated into the inventory system afterwards.
Large point sources (LPS)
In a first step large point sources (LPS) are considered. For the reporting years up to 2006 the UMWELTBUNDESAMT was operating a database to store plant specific data, called „Dampfkessel-datenbank” (DKDB) which includes data on fuel consumption, NOx, SOx, CO and PM emissions from boilers with a thermal capacity greater than 3 MWth for all years from 1990 onwards. From the reporting year 2007 on this database has been replaced by a web based reporting system (EDM81) operated by the ministry of environment. These data are used to generate a split of the categories Public Power and District Heating, with further distinction between the two categories ≥ 300 MWth and ≥ 50 MWth to 300 MWth of thermal capacity. Currently about 75 boilers are considered with this approach. From the year 2007 on fuel consumption of large point sources is taken from the emission trading system (ETS) which considers facilities which a total boiler thermal capacity ≥ 20 MW th. The yearly emission declarations from the corresponding boilers are taken from the EDM.
The fuel consumption of all considered point sources is subtracted from the total consumption of this category which is taken from the energy balance. The other combustion plants are considered as area source.
For point sources ≥ 50 MW plant specific emission and activity data from the DKDB were used. The ‘implied emission factors’, which are calculated by division of emissions by activity data, are given in Table 79. 81 www.edm.gv.at
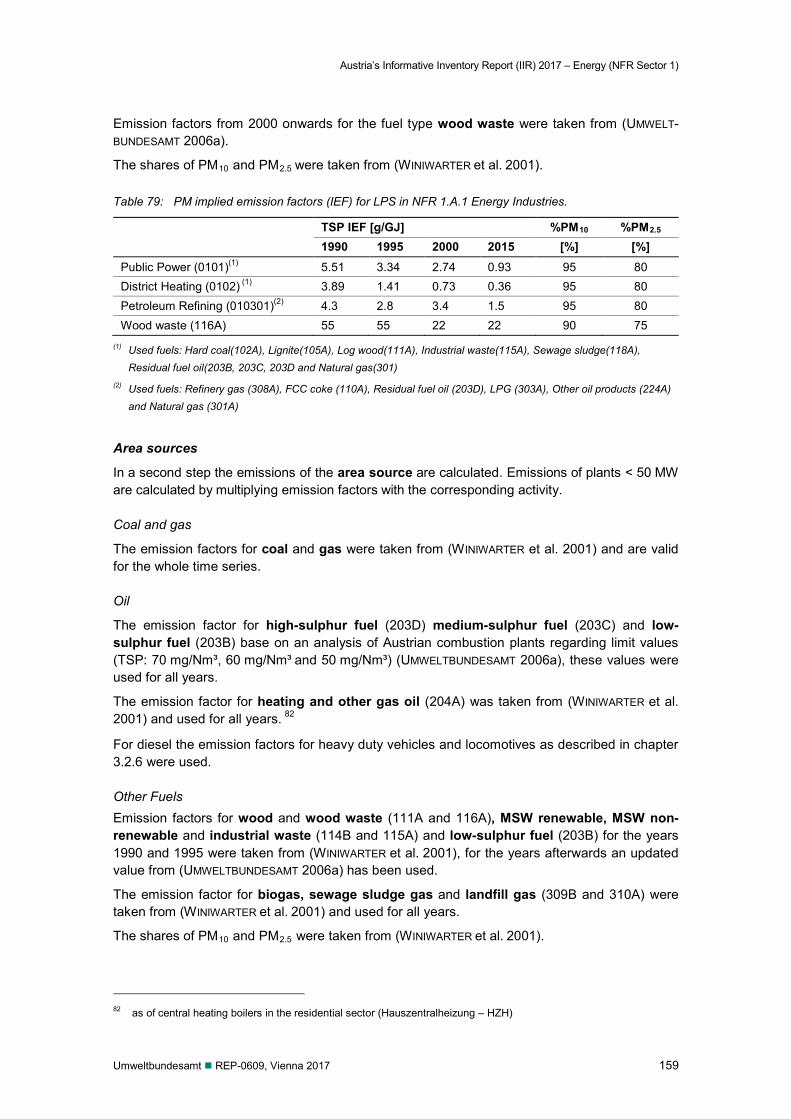
Austria’s Informative Inventory Report (IIR) 2017 – Energy (NFR Sector 1)
Umweltbundesamt REP-0609, Vienna 2017 159
Emission factors from 2000 onwards for the fuel type wood waste were taken from (UMWELT-BUNDESAMT 2006a).
The shares of PM10 and PM2.5 were taken from (WINIWARTER et al. 2001).
Table 79: PM implied emission factors (IEF) for LPS in NFR 1.A.1 Energy Industries.
TSP IEF [g/GJ] %PM10 %PM2.5 1990 1995 2000 2015 [%] [%]
Public Power (0101)(1) 5.51 3.34 2.74 0.93 95 80 District Heating (0102) (1) 3.89 1.41 0.73 0.36 95 80 Petroleum Refining (010301)(2) 4.3 2.8 3.4 1.5 95 80 Wood waste (116A) 55 55 22 22 90 75
(1) Used fuels: Hard coal(102A), Lignite(105A), Log wood(111A), Industrial waste(115A), Sewage sludge(118A), Residual fuel oil(203B, 203C, 203D and Natural gas(301)
(2) Used fuels: Refinery gas (308A), FCC coke (110A), Residual fuel oil (203D), LPG (303A), Other oil products (224A) and Natural gas (301A)
Area sources
In a second step the emissions of the area source are calculated. Emissions of plants < 50 MW are calculated by multiplying emission factors with the corresponding activity. Coal and gas
The emission factors for coal and gas were taken from (WINIWARTER et al. 2001) and are valid for the whole time series. Oil
The emission factor for high-sulphur fuel (203D) medium-sulphur fuel (203C) and low-sulphur fuel (203B) base on an analysis of Austrian combustion plants regarding limit values (TSP: 70 mg/Nm³, 60 mg/Nm³ and 50 mg/Nm³) (UMWELTBUNDESAMT 2006a), these values were used for all years.
The emission factor for heating and other gas oil (204A) was taken from (WINIWARTER et al. 2001) and used for all years. 82
For diesel the emission factors for heavy duty vehicles and locomotives as described in chapter 3.2.6 were used. Other Fuels Emission factors for wood and wood waste (111A and 116A), MSW renewable, MSW non-renewable and industrial waste (114B and 115A) and low-sulphur fuel (203B) for the years 1990 and 1995 were taken from (WINIWARTER et al. 2001), for the years afterwards an updated value from (UMWELTBUNDESAMT 2006a) has been used.
The emission factor for biogas, sewage sludge gas and landfill gas (309B and 310A) were taken from (WINIWARTER et al. 2001) and used for all years.
The shares of PM10 and PM2.5 were taken from (WINIWARTER et al. 2001).
82 as of central heating boilers in the residential sector (Hauszentralheizung – HZH)
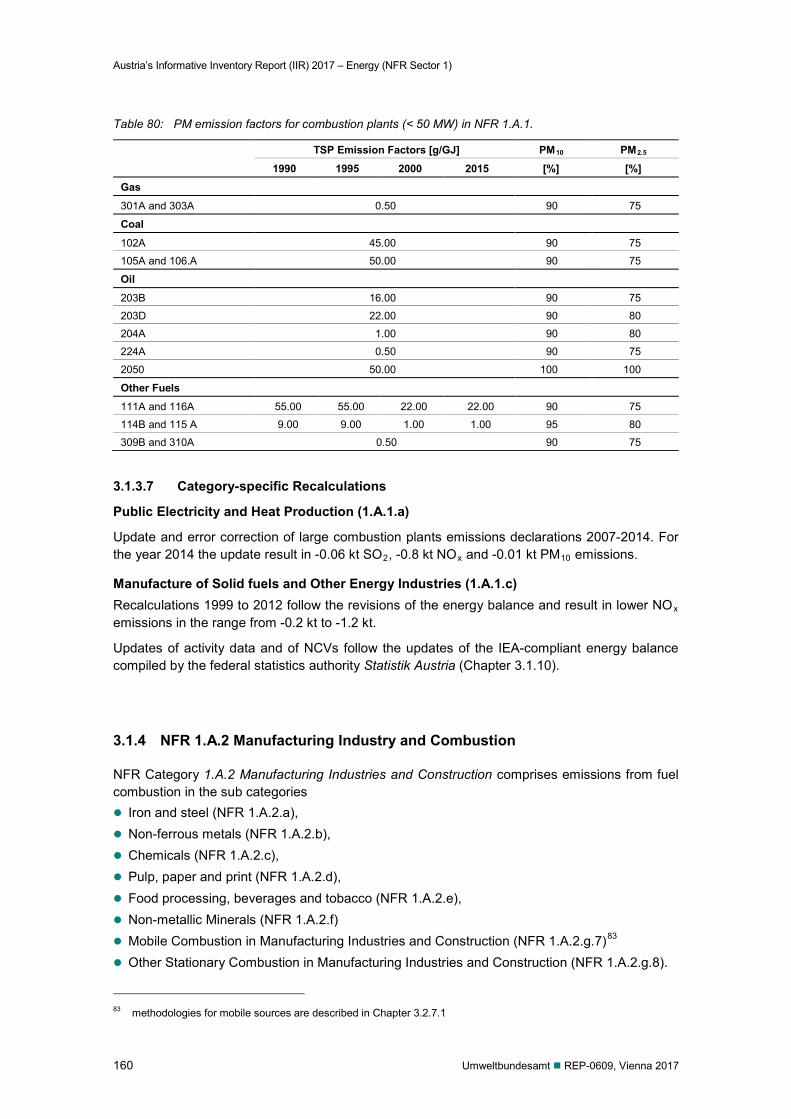
Austria’s Informative Inventory Report (IIR) 2017 – Energy (NFR Sector 1)
160 Umweltbundesamt REP-0609, Vienna 2017
Table 80: PM emission factors for combustion plants (< 50 MW) in NFR 1.A.1.
TSP Emission Factors [g/GJ] PM10 PM2.5
1990 1995 2000 2015 [%] [%] Gas
301A and 303A 0.50 90 75
Coal
102A 45.00 90 75
105A and 106.A 50.00 90 75
Oil
203B 16.00 90 75
203D 22.00 90 80
204A 1.00 90 80
224A 0.50 90 75
2050 50.00 100 100
Other Fuels
111A and 116A 55.00 55.00 22.00 22.00 90 75
114B and 115 A 9.00 9.00 1.00 1.00 95 80
309B and 310A 0.50 90 75
3.1.3.7 Category-specific Recalculations
Public Electricity and Heat Production (1.A.1.a)
Update and error correction of large combustion plants emissions declarations 2007-2014. For the year 2014 the update result in -0.06 kt SO2, -0.8 kt NOx and -0.01 kt PM10 emissions.
Manufacture of Solid fuels and Other Energy Industries (1.A.1.c) Recalculations 1999 to 2012 follow the revisions of the energy balance and result in lower NOx emissions in the range from -0.2 kt to -1.2 kt.
Updates of activity data and of NCVs follow the updates of the IEA-compliant energy balance compiled by the federal statistics authority Statistik Austria (Chapter 3.1.10).
3.1.4 NFR 1.A.2 Manufacturing Industry and Combustion
NFR Category 1.A.2 Manufacturing Industries and Construction comprises emissions from fuel combustion in the sub categories Iron and steel (NFR 1.A.2.a), Non-ferrous metals (NFR 1.A.2.b), Chemicals (NFR 1.A.2.c), Pulp, paper and print (NFR 1.A.2.d), Food processing, beverages and tobacco (NFR 1.A.2.e), Non-metallic Minerals (NFR 1.A.2.f) Mobile Combustion in Manufacturing Industries and Construction (NFR 1.A.2.g.7)83 Other Stationary Combustion in Manufacturing Industries and Construction (NFR 1.A.2.g.8).
83 methodologies for mobile sources are described in Chapter 3.2.7.1
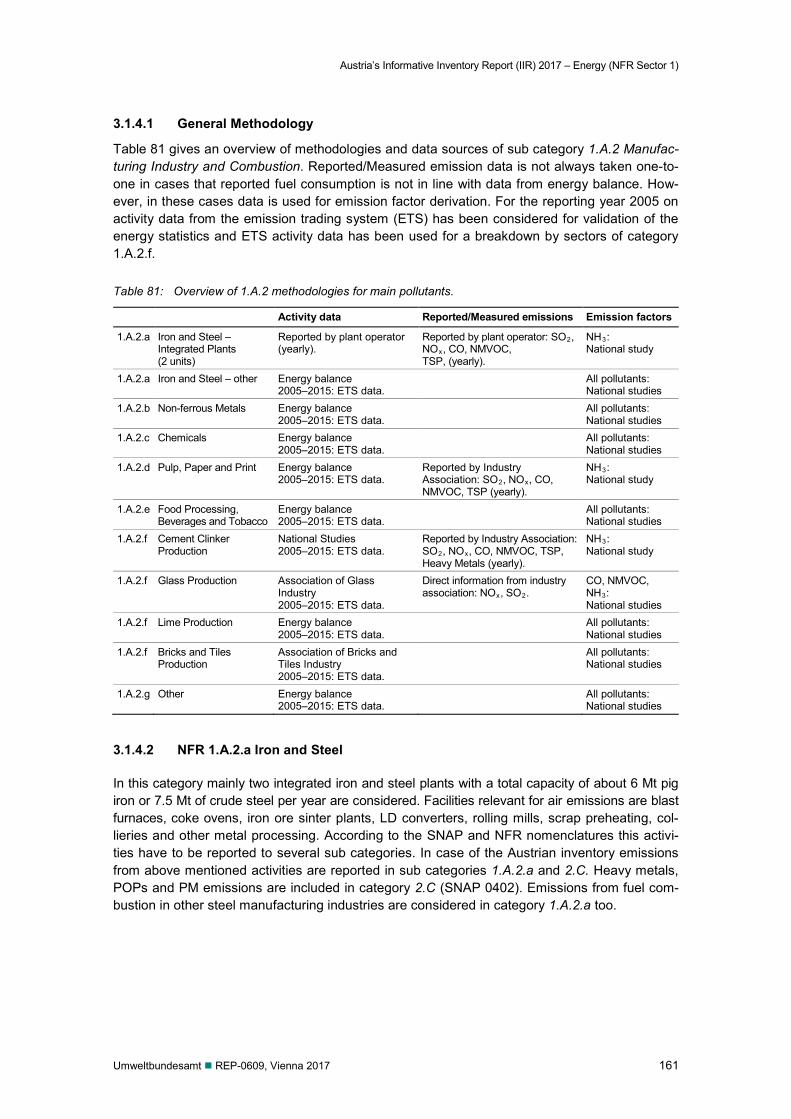
Austria’s Informative Inventory Report (IIR) 2017 – Energy (NFR Sector 1)
Umweltbundesamt REP-0609, Vienna 2017 161
3.1.4.1 General Methodology
Table 81 gives an overview of methodologies and data sources of sub category 1.A.2 Manufac-turing Industry and Combustion. Reported/Measured emission data is not always taken one-to-one in cases that reported fuel consumption is not in line with data from energy balance. How-ever, in these cases data is used for emission factor derivation. For the reporting year 2005 on activity data from the emission trading system (ETS) has been considered for validation of the energy statistics and ETS activity data has been used for a breakdown by sectors of category 1.A.2.f.
Table 81: Overview of 1.A.2 methodologies for main pollutants.
Activity data Reported/Measured emissions Emission factors
1.A.2.a Iron and Steel – Integrated Plants (2 units)
Reported by plant operator (yearly).
Reported by plant operator: SO2, NOx, CO, NMVOC, TSP, (yearly).
NH3: National study
1.A.2.a Iron and Steel – other Energy balance 2005–2015: ETS data.
All pollutants: National studies
1.A.2.b Non-ferrous Metals Energy balance 2005–2015: ETS data.
All pollutants: National studies
1.A.2.c Chemicals Energy balance 2005–2015: ETS data.
All pollutants: National studies
1.A.2.d Pulp, Paper and Print Energy balance 2005–2015: ETS data.
Reported by Industry Association: SO2, NOx, CO, NMVOC, TSP (yearly).
NH3: National study
1.A.2.e Food Processing, Beverages and Tobacco
Energy balance 2005–2015: ETS data.
All pollutants: National studies
1.A.2.f Cement Clinker Production
National Studies 2005–2015: ETS data.
Reported by Industry Association: SO2, NOx, CO, NMVOC, TSP, Heavy Metals (yearly).
NH3: National study
1.A.2.f Glass Production Association of Glass Industry 2005–2015: ETS data.
Direct information from industry association: NOx, SO2.
CO, NMVOC, NH3: National studies
1.A.2.f Lime Production Energy balance 2005–2015: ETS data.
All pollutants: National studies
1.A.2.f Bricks and Tiles Production
Association of Bricks and Tiles Industry 2005–2015: ETS data.
All pollutants: National studies
1.A.2.g Other Energy balance 2005–2015: ETS data.
All pollutants: National studies
3.1.4.2 NFR 1.A.2.a Iron and Steel
In this category mainly two integrated iron and steel plants with a total capacity of about 6 Mt pig iron or 7.5 Mt of crude steel per year are considered. Facilities relevant for air emissions are blast furnaces, coke ovens, iron ore sinter plants, LD converters, rolling mills, scrap preheating, col-lieries and other metal processing. According to the SNAP and NFR nomenclatures this activi-ties have to be reported to several sub categories. In case of the Austrian inventory emissions from above mentioned activities are reported in sub categories 1.A.2.a and 2.C. Heavy metals, POPs and PM emissions are included in category 2.C (SNAP 0402). Emissions from fuel com-bustion in other steel manufacturing industries are considered in category 1.A.2.a too.
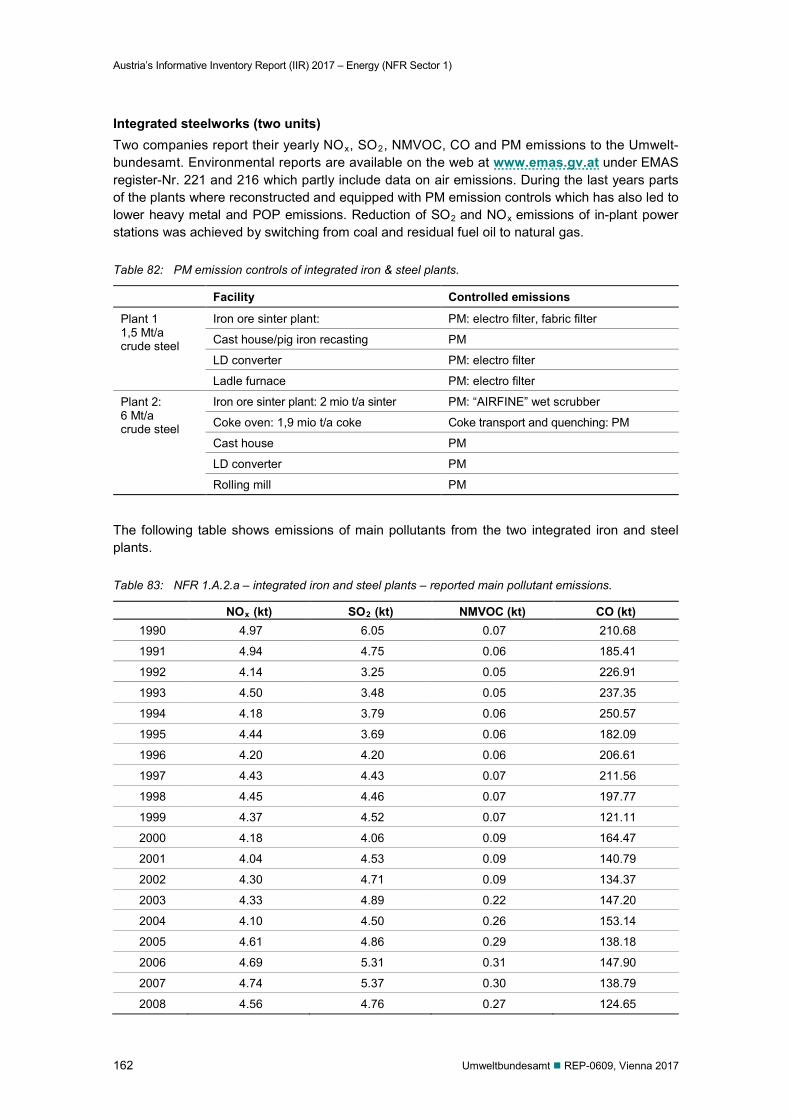
Austria’s Informative Inventory Report (IIR) 2017 – Energy (NFR Sector 1)
162 Umweltbundesamt REP-0609, Vienna 2017
Integrated steelworks (two units) Two companies report their yearly NOx, SO2, NMVOC, CO and PM emissions to the Umwelt-bundesamt. Environmental reports are available on the web at www.emas.gv.at under EMAS register-Nr. 221 and 216 which partly include data on air emissions. During the last years parts of the plants where reconstructed and equipped with PM emission controls which has also led to lower heavy metal and POP emissions. Reduction of SO2 and NOx emissions of in-plant power stations was achieved by switching from coal and residual fuel oil to natural gas.
Table 82: PM emission controls of integrated iron & steel plants.
Facility Controlled emissions
Plant 1 1,5 Mt/a crude steel
Iron ore sinter plant: PM: electro filter, fabric filter
Cast house/pig iron recasting PM
LD converter PM: electro filter
Ladle furnace PM: electro filter
Plant 2: 6 Mt/a crude steel
Iron ore sinter plant: 2 mio t/a sinter PM: “AIRFINE” wet scrubber
Coke oven: 1,9 mio t/a coke Coke transport and quenching: PM
Cast house PM
LD converter PM
Rolling mill PM
The following table shows emissions of main pollutants from the two integrated iron and steel plants.
Table 83: NFR 1.A.2.a – integrated iron and steel plants – reported main pollutant emissions.
NOx (kt) SO2 (kt) NMVOC (kt) CO (kt)
1990 4.97 6.05 0.07 210.68
1991 4.94 4.75 0.06 185.41
1992 4.14 3.25 0.05 226.91
1993 4.50 3.48 0.05 237.35
1994 4.18 3.79 0.06 250.57
1995 4.44 3.69 0.06 182.09
1996 4.20 4.20 0.06 206.61
1997 4.43 4.43 0.07 211.56
1998 4.45 4.46 0.07 197.77
1999 4.37 4.52 0.07 121.11
2000 4.18 4.06 0.09 164.47
2001 4.04 4.53 0.09 140.79
2002 4.30 4.71 0.09 134.37
2003 4.33 4.89 0.22 147.20
2004 4.10 4.50 0.26 153.14
2005 4.61 4.86 0.29 138.18
2006 4.69 5.31 0.31 147.90
2007 4.74 5.37 0.30 138.79
2008 4.56 4.76 0.27 124.65
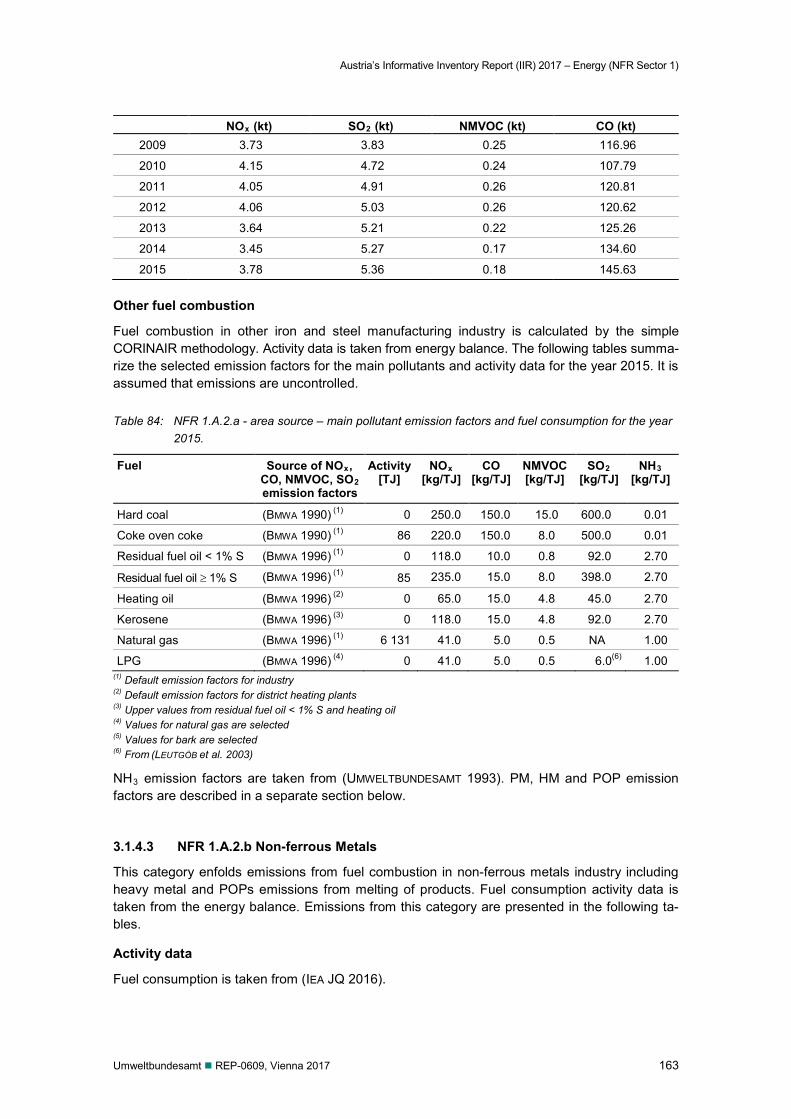
Austria’s Informative Inventory Report (IIR) 2017 – Energy (NFR Sector 1)
Umweltbundesamt REP-0609, Vienna 2017 163
NOx (kt) SO2 (kt) NMVOC (kt) CO (kt)
2009 3.73 3.83 0.25 116.96
2010 4.15 4.72 0.24 107.79
2011 4.05 4.91 0.26 120.81
2012 4.06 5.03 0.26 120.62
2013 3.64 5.21 0.22 125.26
2014 3.45 5.27 0.17 134.60
2015 3.78 5.36 0.18 145.63
Other fuel combustion
Fuel combustion in other iron and steel manufacturing industry is calculated by the simple CORINAIR methodology. Activity data is taken from energy balance. The following tables summa-rize the selected emission factors for the main pollutants and activity data for the year 2015. It is assumed that emissions are uncontrolled.
Table 84: NFR 1.A.2.a - area source – main pollutant emission factors and fuel consumption for the year 2015.
Fuel Source of NOx, CO, NMVOC, SO2 emission factors
Activity [TJ]
NOx [kg/TJ]
CO [kg/TJ]
NMVOC [kg/TJ]
SO2 [kg/TJ]
NH3 [kg/TJ]
Hard coal (BMWA 1990) (1) 0 250.0 150.0 15.0 600.0 0.01
Coke oven coke (BMWA 1990) (1) 86 220.0 150.0 8.0 500.0 0.01
Residual fuel oil < 1% S (BMWA 1996) (1) 0 118.0 10.0 0.8 92.0 2.70
Residual fuel oil ≥ 1% S (BMWA 1996) (1) 85 235.0 15.0 8.0 398.0 2.70
Heating oil (BMWA 1996) (2) 0 65.0 15.0 4.8 45.0 2.70
Kerosene (BMWA 1996) (3) 0 118.0 15.0 4.8 92.0 2.70
Natural gas (BMWA 1996) (1) 6 131 41.0 5.0 0.5 NA 1.00
LPG (BMWA 1996) (4) 0 41.0 5.0 0.5 6.0(6) 1.00 (1) Default emission factors for industry (2) Default emission factors for district heating plants (3) Upper values from residual fuel oil < 1% S and heating oil (4) Values for natural gas are selected (5) Values for bark are selected (6) From (LEUTGÖB et al. 2003)
NH3 emission factors are taken from (UMWELTBUNDESAMT 1993). PM, HM and POP emission factors are described in a separate section below.
3.1.4.3 NFR 1.A.2.b Non-ferrous Metals
This category enfolds emissions from fuel combustion in non-ferrous metals industry including heavy metal and POPs emissions from melting of products. Fuel consumption activity data is taken from the energy balance. Emissions from this category are presented in the following ta-bles.
Activity data
Fuel consumption is taken from (IEA JQ 2016).
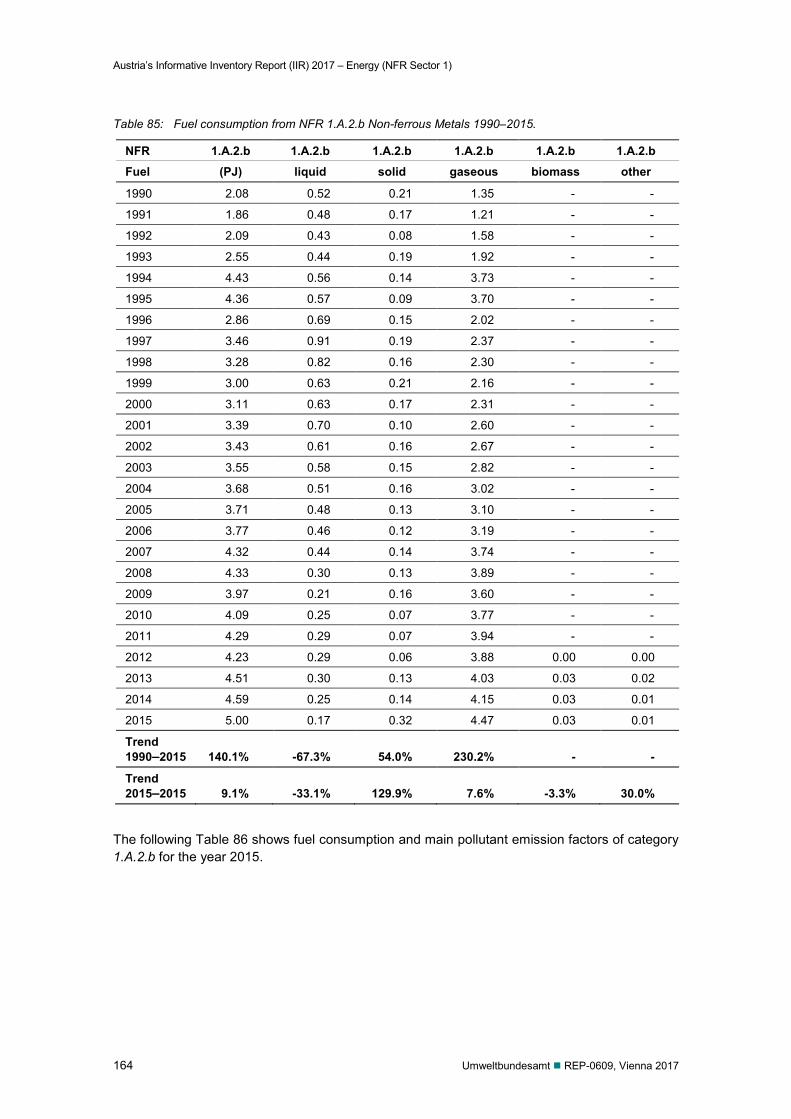
Austria’s Informative Inventory Report (IIR) 2017 – Energy (NFR Sector 1)
164 Umweltbundesamt REP-0609, Vienna 2017
Table 85: Fuel consumption from NFR 1.A.2.b Non-ferrous Metals 1990–2015.
NFR 1.A.2.b 1.A.2.b 1.A.2.b 1.A.2.b 1.A.2.b 1.A.2.b Fuel (PJ) liquid solid gaseous biomass other
1990 2.08 0.52 0.21 1.35 - -
1991 1.86 0.48 0.17 1.21 - -
1992 2.09 0.43 0.08 1.58 - -
1993 2.55 0.44 0.19 1.92 - -
1994 4.43 0.56 0.14 3.73 - -
1995 4.36 0.57 0.09 3.70 - -
1996 2.86 0.69 0.15 2.02 - -
1997 3.46 0.91 0.19 2.37 - -
1998 3.28 0.82 0.16 2.30 - -
1999 3.00 0.63 0.21 2.16 - -
2000 3.11 0.63 0.17 2.31 - -
2001 3.39 0.70 0.10 2.60 - -
2002 3.43 0.61 0.16 2.67 - -
2003 3.55 0.58 0.15 2.82 - -
2004 3.68 0.51 0.16 3.02 - -
2005 3.71 0.48 0.13 3.10 - -
2006 3.77 0.46 0.12 3.19 - -
2007 4.32 0.44 0.14 3.74 - -
2008 4.33 0.30 0.13 3.89 - -
2009 3.97 0.21 0.16 3.60 - -
2010 4.09 0.25 0.07 3.77 - -
2011 4.29 0.29 0.07 3.94 - -
2012 4.23 0.29 0.06 3.88 0.00 0.00
2013 4.51 0.30 0.13 4.03 0.03 0.02
2014 4.59 0.25 0.14 4.15 0.03 0.01
2015 5.00 0.17 0.32 4.47 0.03 0.01
Trend 1990–2015 140.1% -67.3% 54.0% 230.2% - -
Trend 2015–2015 9.1% -33.1% 129.9% 7.6% -3.3% 30.0%
The following Table 86 shows fuel consumption and main pollutant emission factors of category 1.A.2.b for the year 2015.
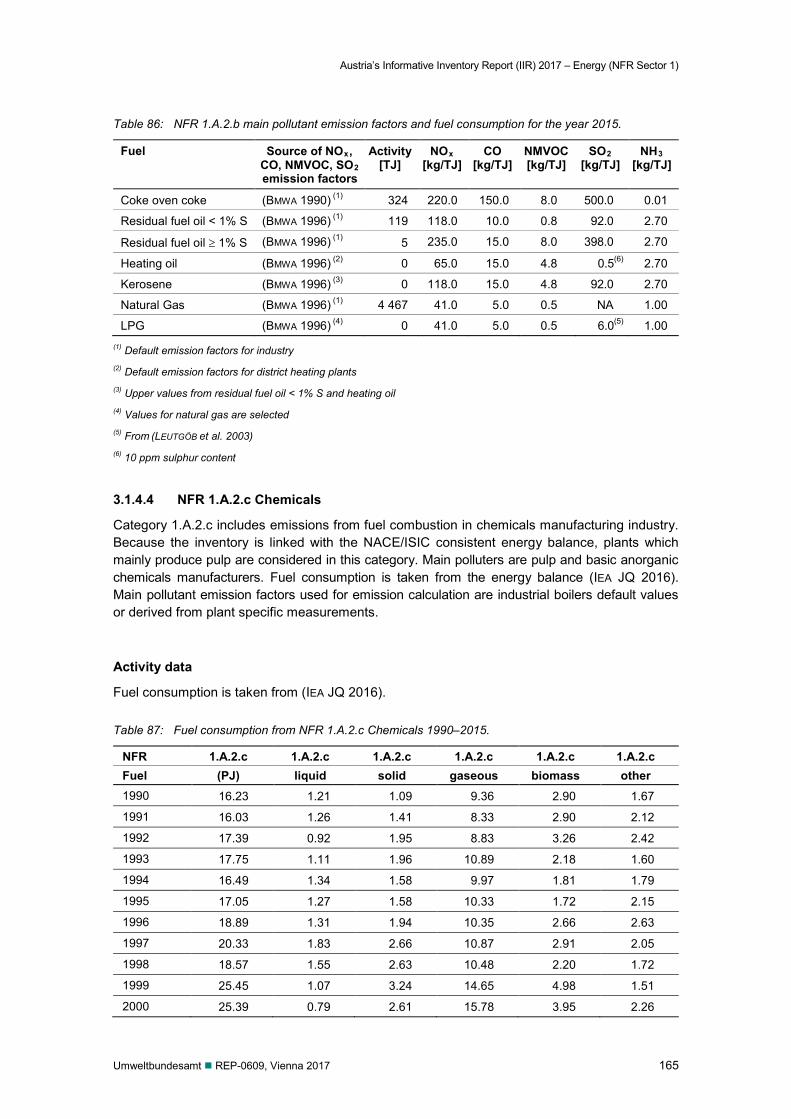
Austria’s Informative Inventory Report (IIR) 2017 – Energy (NFR Sector 1)
Umweltbundesamt REP-0609, Vienna 2017 165
Table 86: NFR 1.A.2.b main pollutant emission factors and fuel consumption for the year 2015.
Fuel Source of NOx, CO, NMVOC, SO2 emission factors
Activity [TJ]
NOx [kg/TJ]
CO [kg/TJ]
NMVOC [kg/TJ]
SO2 [kg/TJ]
NH3 [kg/TJ]
Coke oven coke (BMWA 1990) (1) 324 220.0 150.0 8.0 500.0 0.01
Residual fuel oil < 1% S (BMWA 1996) (1) 119 118.0 10.0 0.8 92.0 2.70
Residual fuel oil ≥ 1% S (BMWA 1996) (1) 5 235.0 15.0 8.0 398.0 2.70
Heating oil (BMWA 1996) (2) 0 65.0 15.0 4.8 0.5(6) 2.70
Kerosene (BMWA 1996) (3) 0 118.0 15.0 4.8 92.0 2.70
Natural Gas (BMWA 1996) (1) 4 467 41.0 5.0 0.5 NA 1.00
LPG (BMWA 1996) (4) 0 41.0 5.0 0.5 6.0(5) 1.00 (1) Default emission factors for industry (2) Default emission factors for district heating plants (3) Upper values from residual fuel oil < 1% S and heating oil (4) Values for natural gas are selected (5) From (LEUTGÖB et al. 2003) (6) 10 ppm sulphur content
3.1.4.4 NFR 1.A.2.c Chemicals
Category 1.A.2.c includes emissions from fuel combustion in chemicals manufacturing industry. Because the inventory is linked with the NACE/ISIC consistent energy balance, plants which mainly produce pulp are considered in this category. Main polluters are pulp and basic anorganic chemicals manufacturers. Fuel consumption is taken from the energy balance (IEA JQ 2016). Main pollutant emission factors used for emission calculation are industrial boilers default values or derived from plant specific measurements.
Activity data
Fuel consumption is taken from (IEA JQ 2016).
Table 87: Fuel consumption from NFR 1.A.2.c Chemicals 1990–2015.
NFR 1.A.2.c 1.A.2.c 1.A.2.c 1.A.2.c 1.A.2.c 1.A.2.c Fuel (PJ) liquid solid gaseous biomass other 1990 16.23 1.21 1.09 9.36 2.90 1.67
1991 16.03 1.26 1.41 8.33 2.90 2.12
1992 17.39 0.92 1.95 8.83 3.26 2.42
1993 17.75 1.11 1.96 10.89 2.18 1.60
1994 16.49 1.34 1.58 9.97 1.81 1.79
1995 17.05 1.27 1.58 10.33 1.72 2.15
1996 18.89 1.31 1.94 10.35 2.66 2.63
1997 20.33 1.83 2.66 10.87 2.91 2.05
1998 18.57 1.55 2.63 10.48 2.20 1.72
1999 25.45 1.07 3.24 14.65 4.98 1.51
2000 25.39 0.79 2.61 15.78 3.95 2.26
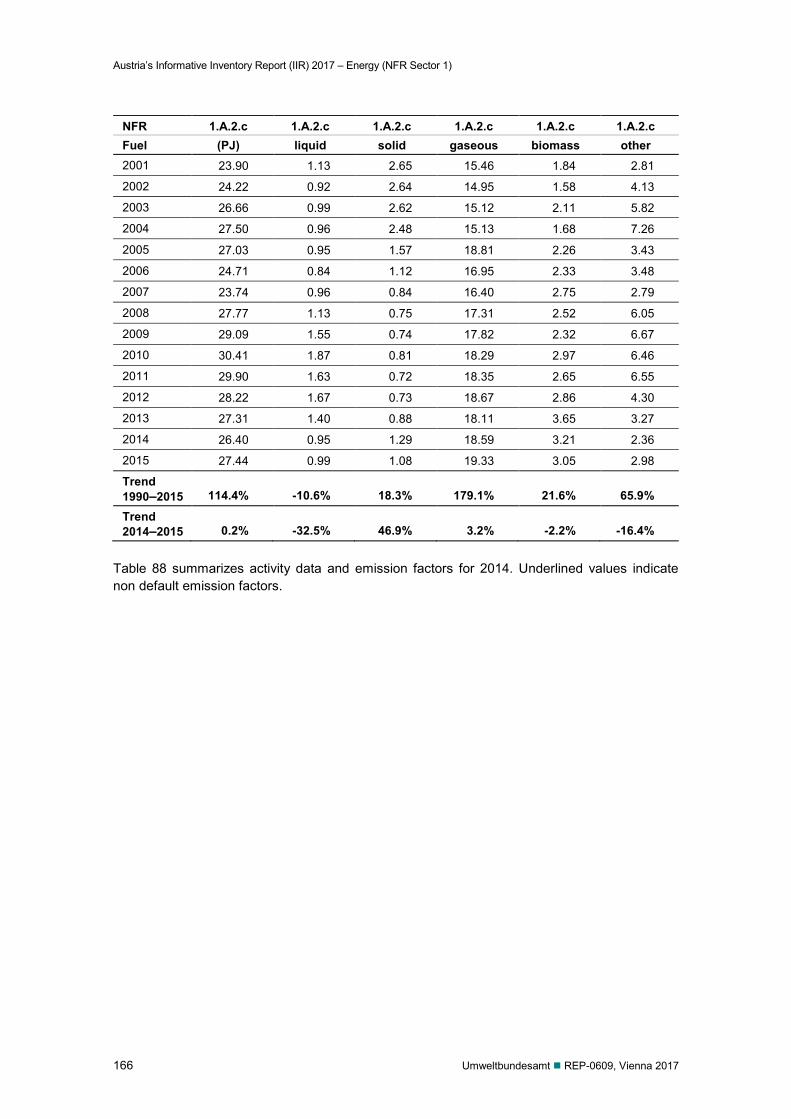
Austria’s Informative Inventory Report (IIR) 2017 – Energy (NFR Sector 1)
166 Umweltbundesamt REP-0609, Vienna 2017
NFR 1.A.2.c 1.A.2.c 1.A.2.c 1.A.2.c 1.A.2.c 1.A.2.c Fuel (PJ) liquid solid gaseous biomass other 2001 23.90 1.13 2.65 15.46 1.84 2.81
2002 24.22 0.92 2.64 14.95 1.58 4.13
2003 26.66 0.99 2.62 15.12 2.11 5.82
2004 27.50 0.96 2.48 15.13 1.68 7.26
2005 27.03 0.95 1.57 18.81 2.26 3.43
2006 24.71 0.84 1.12 16.95 2.33 3.48
2007 23.74 0.96 0.84 16.40 2.75 2.79
2008 27.77 1.13 0.75 17.31 2.52 6.05
2009 29.09 1.55 0.74 17.82 2.32 6.67
2010 30.41 1.87 0.81 18.29 2.97 6.46
2011 29.90 1.63 0.72 18.35 2.65 6.55
2012 28.22 1.67 0.73 18.67 2.86 4.30
2013 27.31 1.40 0.88 18.11 3.65 3.27
2014 26.40 0.95 1.29 18.59 3.21 2.36
2015 27.44 0.99 1.08 19.33 3.05 2.98
Trend 1990–2015 114.4% -10.6% 18.3% 179.1% 21.6% 65.9%
Trend 2014–2015 0.2% -32.5% 46.9% 3.2% -2.2% -16.4%
Table 88 summarizes activity data and emission factors for 2014. Underlined values indicate non default emission factors.
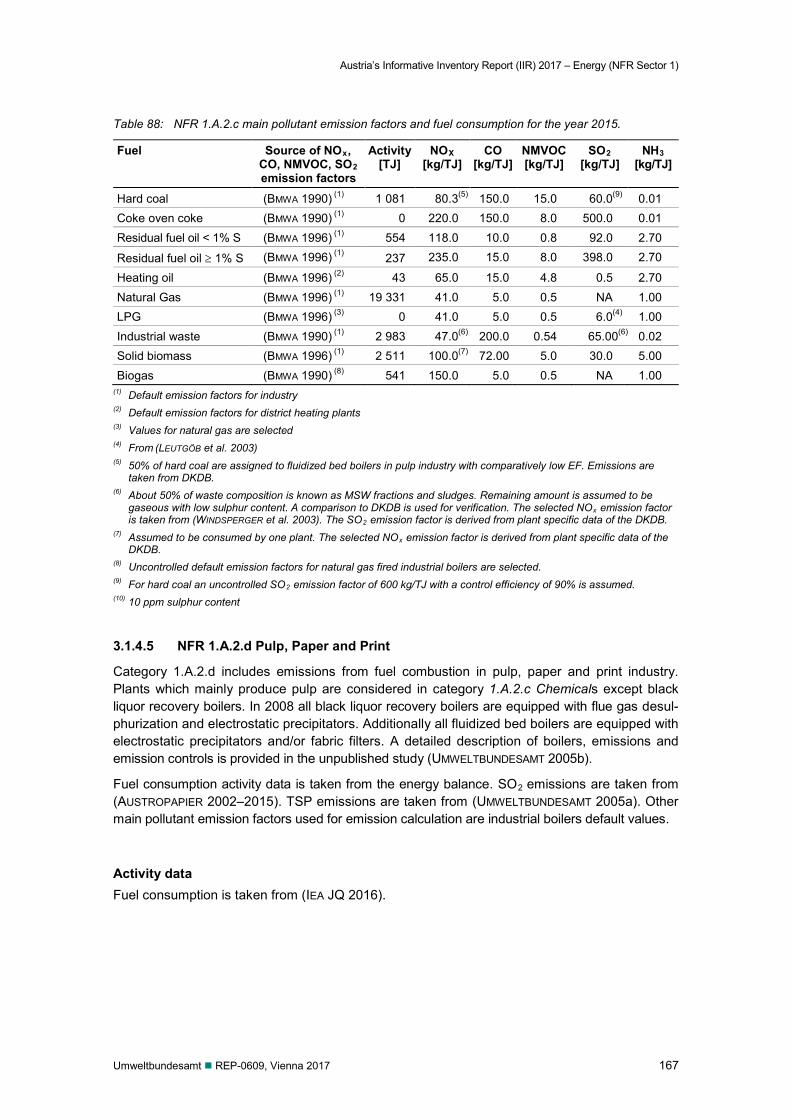
Austria’s Informative Inventory Report (IIR) 2017 – Energy (NFR Sector 1)
Umweltbundesamt REP-0609, Vienna 2017 167
Table 88: NFR 1.A.2.c main pollutant emission factors and fuel consumption for the year 2015.
Fuel Source of NOx, CO, NMVOC, SO2 emission factors
Activity [TJ]
NOX [kg/TJ]
CO [kg/TJ]
NMVOC [kg/TJ]
SO2 [kg/TJ]
NH3 [kg/TJ]
Hard coal (BMWA 1990) (1) 1 081 80.3(5) 150.0 15.0 60.0(9) 0.01 Coke oven coke (BMWA 1990) (1) 0 220.0 150.0 8.0 500.0 0.01 Residual fuel oil < 1% S (BMWA 1996) (1) 554 118.0 10.0 0.8 92.0 2.70
Residual fuel oil ≥ 1% S (BMWA 1996) (1) 237 235.0 15.0 8.0 398.0 2.70
Heating oil (BMWA 1996) (2) 43 65.0 15.0 4.8 0.5 2.70 Natural Gas (BMWA 1996) (1) 19 331 41.0 5.0 0.5 NA 1.00 LPG (BMWA 1996) (3) 0 41.0 5.0 0.5 6.0(4) 1.00 Industrial waste (BMWA 1990) (1) 2 983 47.0(6) 200.0 0.54 65.00(6) 0.02 Solid biomass (BMWA 1996) (1) 2 511 100.0(7) 72.00 5.0 30.0 5.00 Biogas (BMWA 1990) (8) 541 150.0 5.0 0.5 NA 1.00
(1) Default emission factors for industry (2) Default emission factors for district heating plants (3) Values for natural gas are selected (4) From (LEUTGÖB et al. 2003) (5) 50% of hard coal are assigned to fluidized bed boilers in pulp industry with comparatively low EF. Emissions are
taken from DKDB. (6) About 50% of waste composition is known as MSW fractions and sludges. Remaining amount is assumed to be
gaseous with low sulphur content. A comparison to DKDB is used for verification. The selected NOx emission factor is taken from (WINDSPERGER et al. 2003). The SO2 emission factor is derived from plant specific data of the DKDB.
(7) Assumed to be consumed by one plant. The selected NOx emission factor is derived from plant specific data of the DKDB.
(8) Uncontrolled default emission factors for natural gas fired industrial boilers are selected. (9) For hard coal an uncontrolled SO2 emission factor of 600 kg/TJ with a control efficiency of 90% is assumed. (10) 10 ppm sulphur content
3.1.4.5 NFR 1.A.2.d Pulp, Paper and Print
Category 1.A.2.d includes emissions from fuel combustion in pulp, paper and print industry. Plants which mainly produce pulp are considered in category 1.A.2.c Chemicals except black liquor recovery boilers. In 2008 all black liquor recovery boilers are equipped with flue gas desul-phurization and electrostatic precipitators. Additionally all fluidized bed boilers are equipped with electrostatic precipitators and/or fabric filters. A detailed description of boilers, emissions and emission controls is provided in the unpublished study (UMWELTBUNDESAMT 2005b).
Fuel consumption activity data is taken from the energy balance. SO2 emissions are taken from (AUSTROPAPIER 2002–2015). TSP emissions are taken from (UMWELTBUNDESAMT 2005a). Other main pollutant emission factors used for emission calculation are industrial boilers default values.
Activity data Fuel consumption is taken from (IEA JQ 2016).
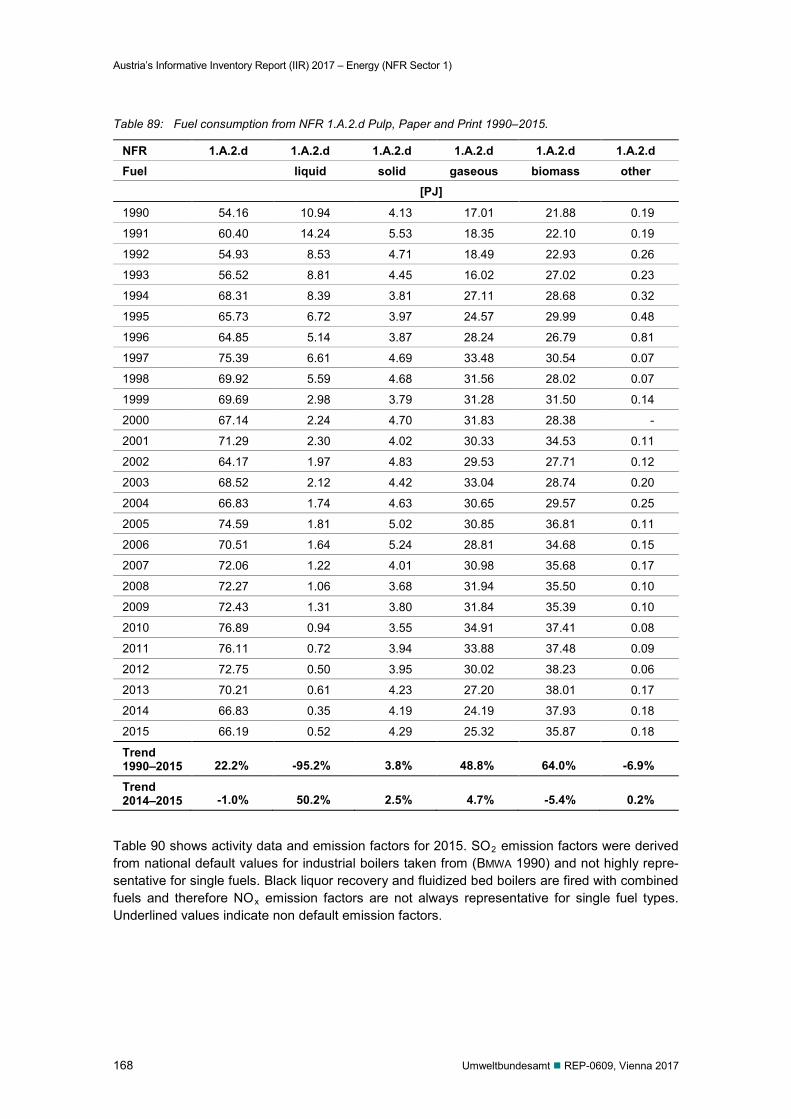
Austria’s Informative Inventory Report (IIR) 2017 – Energy (NFR Sector 1)
168 Umweltbundesamt REP-0609, Vienna 2017
Table 89: Fuel consumption from NFR 1.A.2.d Pulp, Paper and Print 1990–2015.
NFR 1.A.2.d 1.A.2.d 1.A.2.d 1.A.2.d 1.A.2.d 1.A.2.d Fuel liquid solid gaseous biomass other [PJ]
1990 54.16 10.94 4.13 17.01 21.88 0.19
1991 60.40 14.24 5.53 18.35 22.10 0.19
1992 54.93 8.53 4.71 18.49 22.93 0.26
1993 56.52 8.81 4.45 16.02 27.02 0.23
1994 68.31 8.39 3.81 27.11 28.68 0.32
1995 65.73 6.72 3.97 24.57 29.99 0.48
1996 64.85 5.14 3.87 28.24 26.79 0.81
1997 75.39 6.61 4.69 33.48 30.54 0.07
1998 69.92 5.59 4.68 31.56 28.02 0.07
1999 69.69 2.98 3.79 31.28 31.50 0.14
2000 67.14 2.24 4.70 31.83 28.38 -
2001 71.29 2.30 4.02 30.33 34.53 0.11
2002 64.17 1.97 4.83 29.53 27.71 0.12
2003 68.52 2.12 4.42 33.04 28.74 0.20
2004 66.83 1.74 4.63 30.65 29.57 0.25
2005 74.59 1.81 5.02 30.85 36.81 0.11
2006 70.51 1.64 5.24 28.81 34.68 0.15
2007 72.06 1.22 4.01 30.98 35.68 0.17
2008 72.27 1.06 3.68 31.94 35.50 0.10
2009 72.43 1.31 3.80 31.84 35.39 0.10
2010 76.89 0.94 3.55 34.91 37.41 0.08
2011 76.11 0.72 3.94 33.88 37.48 0.09
2012 72.75 0.50 3.95 30.02 38.23 0.06
2013 70.21 0.61 4.23 27.20 38.01 0.17
2014 66.83 0.35 4.19 24.19 37.93 0.18
2015 66.19 0.52 4.29 25.32 35.87 0.18
Trend 1990–2015 22.2% -95.2% 3.8% 48.8% 64.0% -6.9%
Trend 2014–2015 -1.0% 50.2% 2.5% 4.7% -5.4% 0.2%
Table 90 shows activity data and emission factors for 2015. SO2 emission factors were derived from national default values for industrial boilers taken from (BMWA 1990) and not highly repre-sentative for single fuels. Black liquor recovery and fluidized bed boilers are fired with combined fuels and therefore NOx emission factors are not always representative for single fuel types. Underlined values indicate non default emission factors.
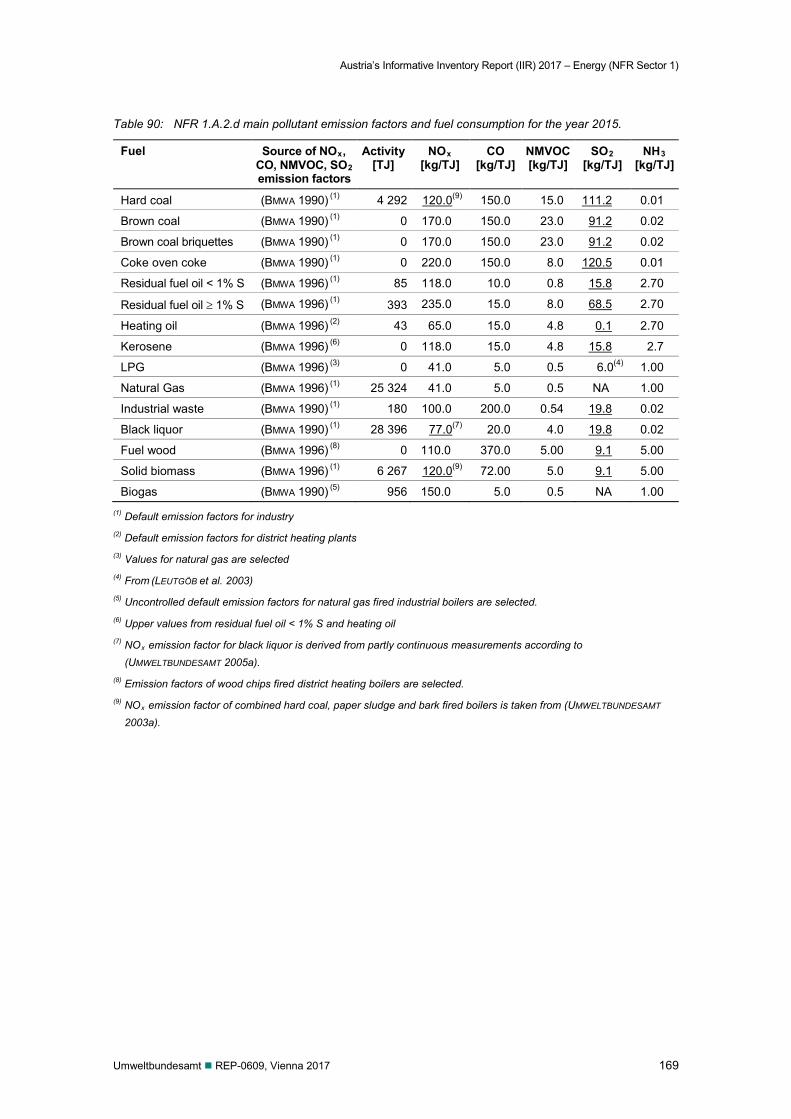
Austria’s Informative Inventory Report (IIR) 2017 – Energy (NFR Sector 1)
Umweltbundesamt REP-0609, Vienna 2017 169
Table 90: NFR 1.A.2.d main pollutant emission factors and fuel consumption for the year 2015.
Fuel Source of NOx, CO, NMVOC, SO2 emission factors
Activity [TJ]
NOx [kg/TJ]
CO [kg/TJ]
NMVOC [kg/TJ]
SO2 [kg/TJ]
NH3 [kg/TJ]
Hard coal (BMWA 1990) (1) 4 292 120.0(9) 150.0 15.0 111.2 0.01
Brown coal (BMWA 1990) (1) 0 170.0 150.0 23.0 91.2 0.02
Brown coal briquettes (BMWA 1990) (1) 0 170.0 150.0 23.0 91.2 0.02
Coke oven coke (BMWA 1990) (1) 0 220.0 150.0 8.0 120.5 0.01
Residual fuel oil < 1% S (BMWA 1996) (1) 85 118.0 10.0 0.8 15.8 2.70
Residual fuel oil ≥ 1% S (BMWA 1996) (1) 393 235.0 15.0 8.0 68.5 2.70
Heating oil (BMWA 1996) (2) 43 65.0 15.0 4.8 0.1 2.70
Kerosene (BMWA 1996) (6) 0 118.0 15.0 4.8 15.8 2.7
LPG (BMWA 1996) (3) 0 41.0 5.0 0.5 6.0(4) 1.00
Natural Gas (BMWA 1996) (1) 25 324 41.0 5.0 0.5 NA 1.00
Industrial waste (BMWA 1990) (1) 180 100.0 200.0 0.54 19.8 0.02
Black liquor (BMWA 1990) (1) 28 396 77.0(7) 20.0 4.0 19.8 0.02
Fuel wood (BMWA 1996) (8) 0 110.0 370.0 5.00 9.1 5.00
Solid biomass (BMWA 1996) (1) 6 267 120.0(9) 72.00 5.0 9.1 5.00
Biogas (BMWA 1990) (5) 956 150.0 5.0 0.5 NA 1.00 (1) Default emission factors for industry (2) Default emission factors for district heating plants (3) Values for natural gas are selected (4) From (LEUTGÖB et al. 2003) (5) Uncontrolled default emission factors for natural gas fired industrial boilers are selected. (6) Upper values from residual fuel oil < 1% S and heating oil (7) NOx emission factor for black liquor is derived from partly continuous measurements according to
(UMWELTBUNDESAMT 2005a). (8) Emission factors of wood chips fired district heating boilers are selected. (9) NOx emission factor of combined hard coal, paper sludge and bark fired boilers is taken from (UMWELTBUNDESAMT
2003a).
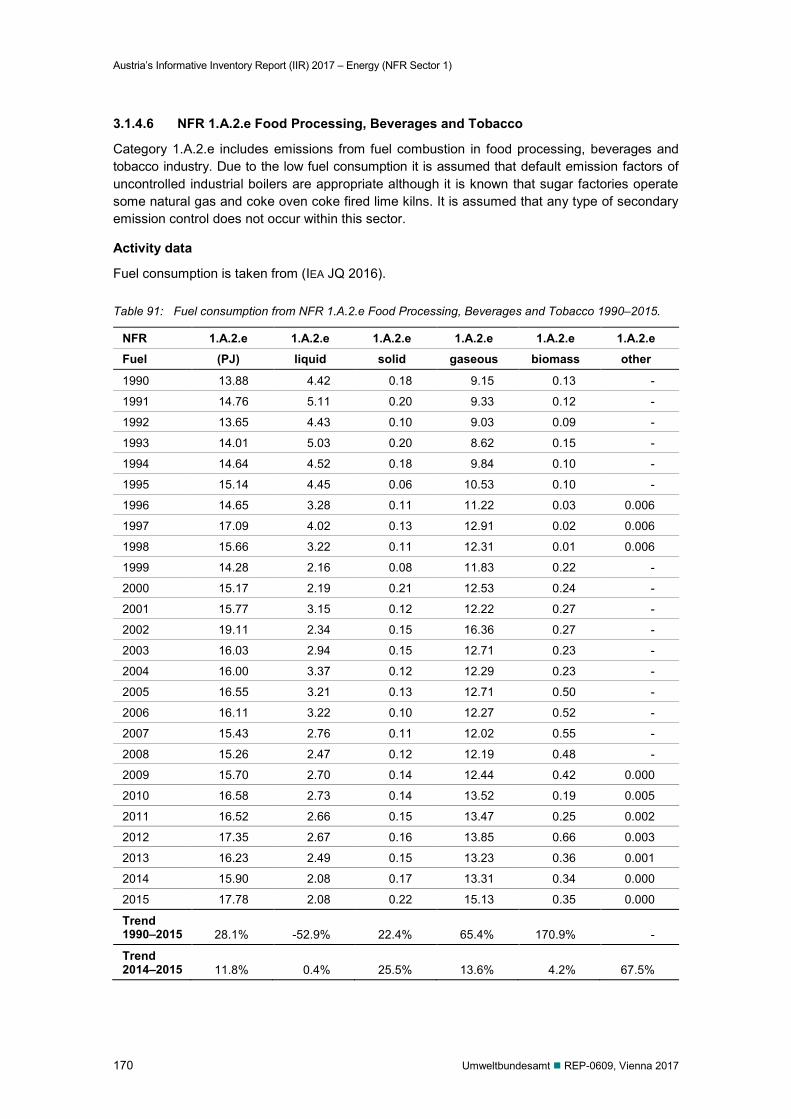
Austria’s Informative Inventory Report (IIR) 2017 – Energy (NFR Sector 1)
170 Umweltbundesamt REP-0609, Vienna 2017
3.1.4.6 NFR 1.A.2.e Food Processing, Beverages and Tobacco
Category 1.A.2.e includes emissions from fuel combustion in food processing, beverages and tobacco industry. Due to the low fuel consumption it is assumed that default emission factors of uncontrolled industrial boilers are appropriate although it is known that sugar factories operate some natural gas and coke oven coke fired lime kilns. It is assumed that any type of secondary emission control does not occur within this sector.
Activity data
Fuel consumption is taken from (IEA JQ 2016).
Table 91: Fuel consumption from NFR 1.A.2.e Food Processing, Beverages and Tobacco 1990–2015.
NFR 1.A.2.e 1.A.2.e 1.A.2.e 1.A.2.e 1.A.2.e 1.A.2.e Fuel (PJ) liquid solid gaseous biomass other
1990 13.88 4.42 0.18 9.15 0.13 -
1991 14.76 5.11 0.20 9.33 0.12 -
1992 13.65 4.43 0.10 9.03 0.09 -
1993 14.01 5.03 0.20 8.62 0.15 -
1994 14.64 4.52 0.18 9.84 0.10 -
1995 15.14 4.45 0.06 10.53 0.10 -
1996 14.65 3.28 0.11 11.22 0.03 0.006
1997 17.09 4.02 0.13 12.91 0.02 0.006
1998 15.66 3.22 0.11 12.31 0.01 0.006
1999 14.28 2.16 0.08 11.83 0.22 -
2000 15.17 2.19 0.21 12.53 0.24 -
2001 15.77 3.15 0.12 12.22 0.27 -
2002 19.11 2.34 0.15 16.36 0.27 -
2003 16.03 2.94 0.15 12.71 0.23 -
2004 16.00 3.37 0.12 12.29 0.23 -
2005 16.55 3.21 0.13 12.71 0.50 -
2006 16.11 3.22 0.10 12.27 0.52 -
2007 15.43 2.76 0.11 12.02 0.55 -
2008 15.26 2.47 0.12 12.19 0.48 -
2009 15.70 2.70 0.14 12.44 0.42 0.000
2010 16.58 2.73 0.14 13.52 0.19 0.005
2011 16.52 2.66 0.15 13.47 0.25 0.002
2012 17.35 2.67 0.16 13.85 0.66 0.003
2013 16.23 2.49 0.15 13.23 0.36 0.001
2014 15.90 2.08 0.17 13.31 0.34 0.000
2015 17.78 2.08 0.22 15.13 0.35 0.000
Trend 1990–2015 28.1% -52.9% 22.4% 65.4% 170.9% -
Trend 2014–2015 11.8% 0.4% 25.5% 13.6% 4.2% 67.5%
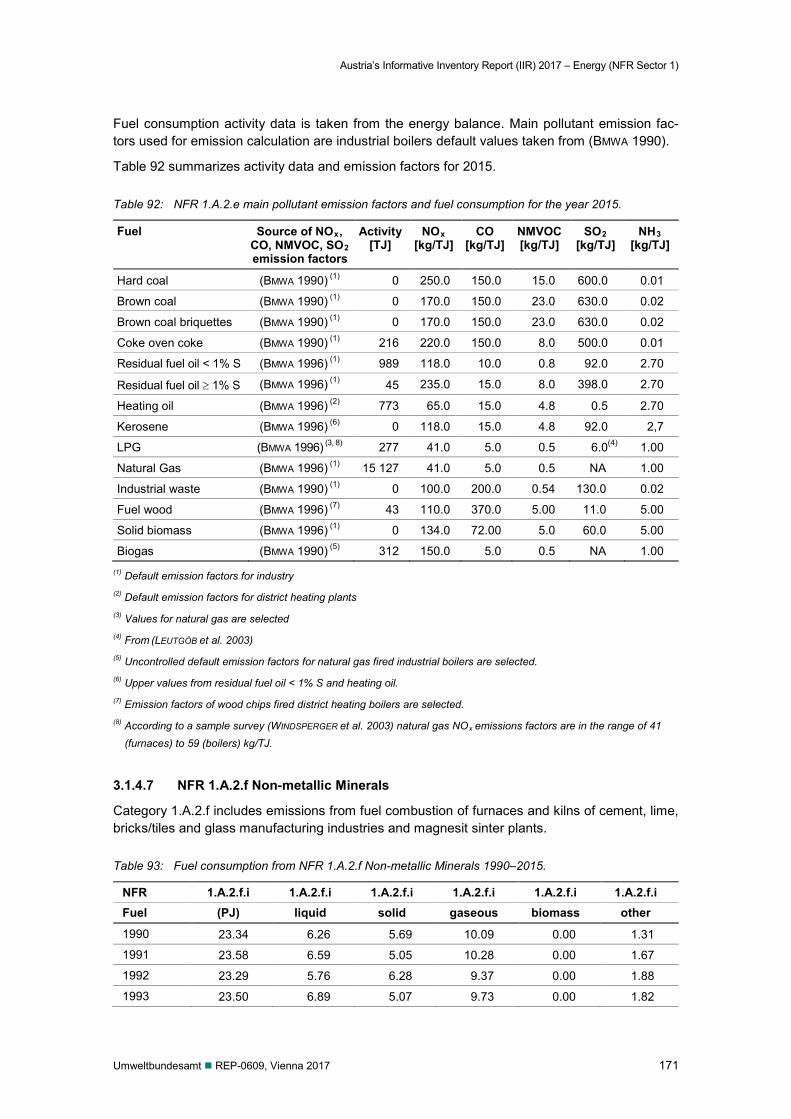
Austria’s Informative Inventory Report (IIR) 2017 – Energy (NFR Sector 1)
Umweltbundesamt REP-0609, Vienna 2017 171
Fuel consumption activity data is taken from the energy balance. Main pollutant emission fac-tors used for emission calculation are industrial boilers default values taken from (BMWA 1990).
Table 92 summarizes activity data and emission factors for 2015.
Table 92: NFR 1.A.2.e main pollutant emission factors and fuel consumption for the year 2015.
Fuel Source of NOx, CO, NMVOC, SO2 emission factors
Activity [TJ]
NOx [kg/TJ]
CO [kg/TJ]
NMVOC [kg/TJ]
SO2 [kg/TJ]
NH3 [kg/TJ]
Hard coal (BMWA 1990) (1) 0 250.0 150.0 15.0 600.0 0.01
Brown coal (BMWA 1990) (1) 0 170.0 150.0 23.0 630.0 0.02
Brown coal briquettes (BMWA 1990) (1) 0 170.0 150.0 23.0 630.0 0.02
Coke oven coke (BMWA 1990) (1) 216 220.0 150.0 8.0 500.0 0.01
Residual fuel oil < 1% S (BMWA 1996) (1) 989 118.0 10.0 0.8 92.0 2.70
Residual fuel oil ≥ 1% S (BMWA 1996) (1) 45 235.0 15.0 8.0 398.0 2.70
Heating oil (BMWA 1996) (2) 773 65.0 15.0 4.8 0.5 2.70
Kerosene (BMWA 1996) (6) 0 118.0 15.0 4.8 92.0 2,7
LPG (BMWA 1996) (3, 8) 277 41.0 5.0 0.5 6.0(4) 1.00
Natural Gas (BMWA 1996) (1) 15 127 41.0 5.0 0.5 NA 1.00
Industrial waste (BMWA 1990) (1) 0 100.0 200.0 0.54 130.0 0.02
Fuel wood (BMWA 1996) (7) 43 110.0 370.0 5.00 11.0 5.00
Solid biomass (BMWA 1996) (1) 0 134.0 72.00 5.0 60.0 5.00
Biogas (BMWA 1990) (5) 312 150.0 5.0 0.5 NA 1.00 (1) Default emission factors for industry (2) Default emission factors for district heating plants (3) Values for natural gas are selected (4) From (LEUTGÖB et al. 2003) (5) Uncontrolled default emission factors for natural gas fired industrial boilers are selected. (6) Upper values from residual fuel oil < 1% S and heating oil. (7) Emission factors of wood chips fired district heating boilers are selected. (8) According to a sample survey (WINDSPERGER et al. 2003) natural gas NOx emissions factors are in the range of 41
(furnaces) to 59 (boilers) kg/TJ.
3.1.4.7 NFR 1.A.2.f Non-metallic Minerals
Category 1.A.2.f includes emissions from fuel combustion of furnaces and kilns of cement, lime, bricks/tiles and glass manufacturing industries and magnesit sinter plants.
Table 93: Fuel consumption from NFR 1.A.2.f Non-metallic Minerals 1990–2015.
NFR 1.A.2.f.i 1.A.2.f.i 1.A.2.f.i 1.A.2.f.i 1.A.2.f.i 1.A.2.f.i Fuel (PJ) liquid solid gaseous biomass other
1990 23.34 6.26 5.69 10.09 0.00 1.31
1991 23.58 6.59 5.05 10.28 0.00 1.67
1992 23.29 5.76 6.28 9.37 0.00 1.88
1993 23.50 6.89 5.07 9.73 0.00 1.82
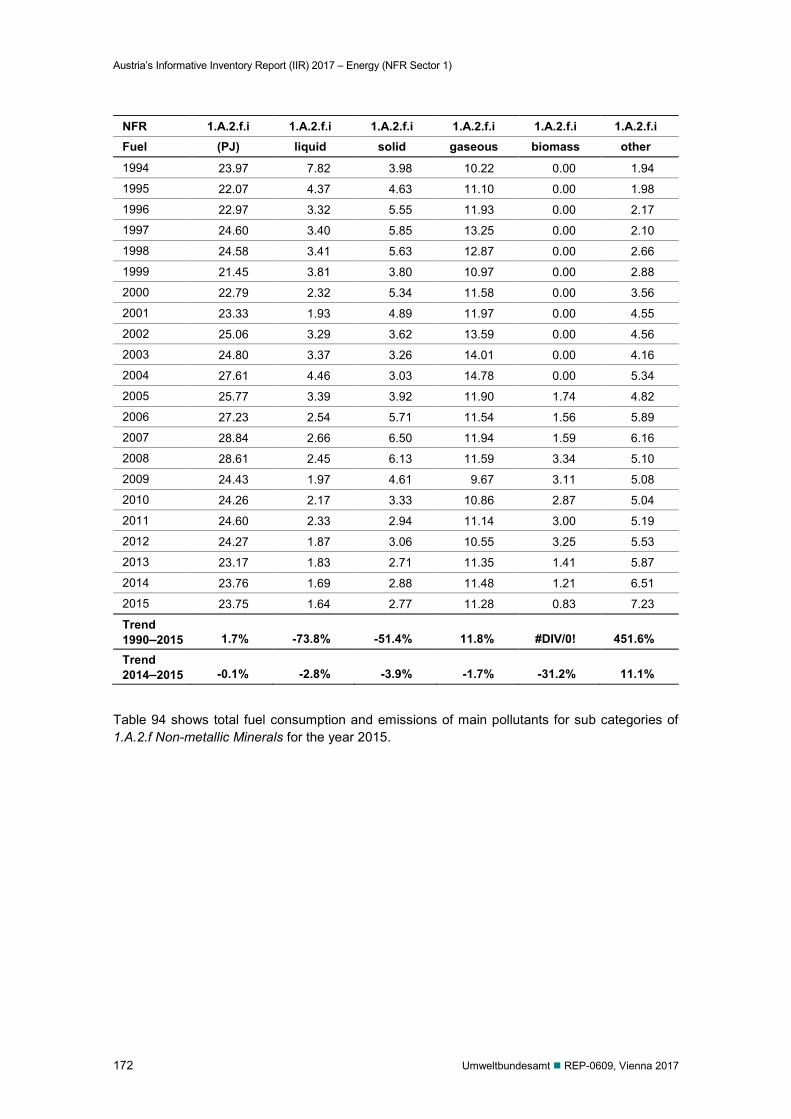
Austria’s Informative Inventory Report (IIR) 2017 – Energy (NFR Sector 1)
172 Umweltbundesamt REP-0609, Vienna 2017
NFR 1.A.2.f.i 1.A.2.f.i 1.A.2.f.i 1.A.2.f.i 1.A.2.f.i 1.A.2.f.i Fuel (PJ) liquid solid gaseous biomass other
1994 23.97 7.82 3.98 10.22 0.00 1.94
1995 22.07 4.37 4.63 11.10 0.00 1.98
1996 22.97 3.32 5.55 11.93 0.00 2.17
1997 24.60 3.40 5.85 13.25 0.00 2.10
1998 24.58 3.41 5.63 12.87 0.00 2.66
1999 21.45 3.81 3.80 10.97 0.00 2.88
2000 22.79 2.32 5.34 11.58 0.00 3.56
2001 23.33 1.93 4.89 11.97 0.00 4.55
2002 25.06 3.29 3.62 13.59 0.00 4.56
2003 24.80 3.37 3.26 14.01 0.00 4.16
2004 27.61 4.46 3.03 14.78 0.00 5.34
2005 25.77 3.39 3.92 11.90 1.74 4.82
2006 27.23 2.54 5.71 11.54 1.56 5.89
2007 28.84 2.66 6.50 11.94 1.59 6.16
2008 28.61 2.45 6.13 11.59 3.34 5.10
2009 24.43 1.97 4.61 9.67 3.11 5.08
2010 24.26 2.17 3.33 10.86 2.87 5.04
2011 24.60 2.33 2.94 11.14 3.00 5.19
2012 24.27 1.87 3.06 10.55 3.25 5.53
2013 23.17 1.83 2.71 11.35 1.41 5.87
2014 23.76 1.69 2.88 11.48 1.21 6.51
2015 23.75 1.64 2.77 11.28 0.83 7.23
Trend 1990–2015 1.7% -73.8% -51.4% 11.8% #DIV/0! 451.6%
Trend 2014–2015 -0.1% -2.8% -3.9% -1.7% -31.2% 11.1%
Table 94 shows total fuel consumption and emissions of main pollutants for sub categories of 1.A.2.f Non-metallic Minerals for the year 2015.
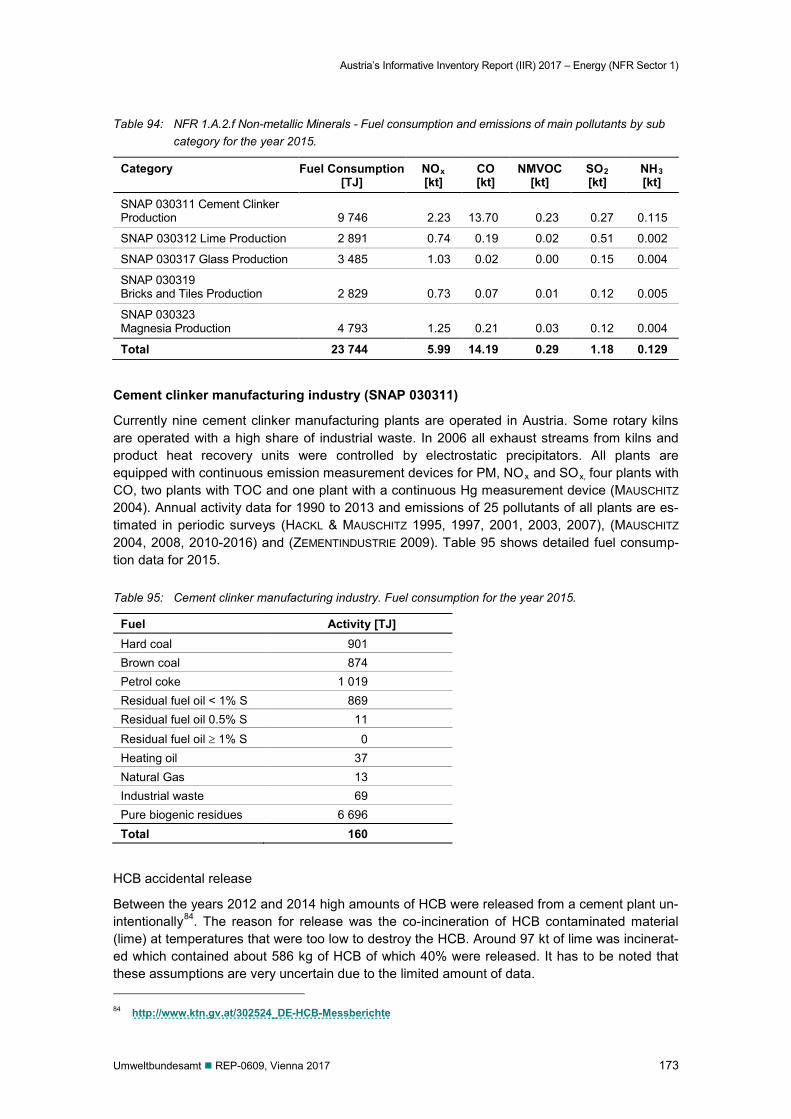
Austria’s Informative Inventory Report (IIR) 2017 – Energy (NFR Sector 1)
Umweltbundesamt REP-0609, Vienna 2017 173
Table 94: NFR 1.A.2.f Non-metallic Minerals - Fuel consumption and emissions of main pollutants by sub category for the year 2015.
Category Fuel Consumption [TJ]
NOx [kt]
CO [kt]
NMVOC [kt]
SO2 [kt]
NH3 [kt]
SNAP 030311 Cement Clinker Production 9 746 2.23 13.70 0.23 0.27 0.115
SNAP 030312 Lime Production 2 891 0.74 0.19 0.02 0.51 0.002
SNAP 030317 Glass Production 3 485 1.03 0.02 0.00 0.15 0.004
SNAP 030319 Bricks and Tiles Production 2 829 0.73 0.07 0.01 0.12 0.005
SNAP 030323 Magnesia Production 4 793 1.25 0.21 0.03 0.12 0.004
Total 23 744 5.99 14.19 0.29 1.18 0.129
Cement clinker manufacturing industry (SNAP 030311)
Currently nine cement clinker manufacturing plants are operated in Austria. Some rotary kilns are operated with a high share of industrial waste. In 2006 all exhaust streams from kilns and product heat recovery units were controlled by electrostatic precipitators. All plants are equipped with continuous emission measurement devices for PM, NOx and SOx, four plants with CO, two plants with TOC and one plant with a continuous Hg measurement device (MAUSCHITZ 2004). Annual activity data for 1990 to 2013 and emissions of 25 pollutants of all plants are es-timated in periodic surveys (HACKL & MAUSCHITZ 1995, 1997, 2001, 2003, 2007), (MAUSCHITZ 2004, 2008, 2010-2016) and (ZEMENTINDUSTRIE 2009). Table 95 shows detailed fuel consump-tion data for 2015.
Table 95: Cement clinker manufacturing industry. Fuel consumption for the year 2015.
Fuel Activity [TJ] Hard coal 901 Brown coal 874 Petrol coke 1 019 Residual fuel oil < 1% S 869 Residual fuel oil 0.5% S 11 Residual fuel oil ≥ 1% S 0 Heating oil 37 Natural Gas 13 Industrial waste 69 Pure biogenic residues 6 696 Total 160
HCB accidental release
Between the years 2012 and 2014 high amounts of HCB were released from a cement plant un-intentionally84. The reason for release was the co-incineration of HCB contaminated material (lime) at temperatures that were too low to destroy the HCB. Around 97 kt of lime was incinerat-ed which contained about 586 kg of HCB of which 40% were released. It has to be noted that these assumptions are very uncertain due to the limited amount of data. 84 http://www.ktn.gv.at/302524_DE-HCB-Messberichte
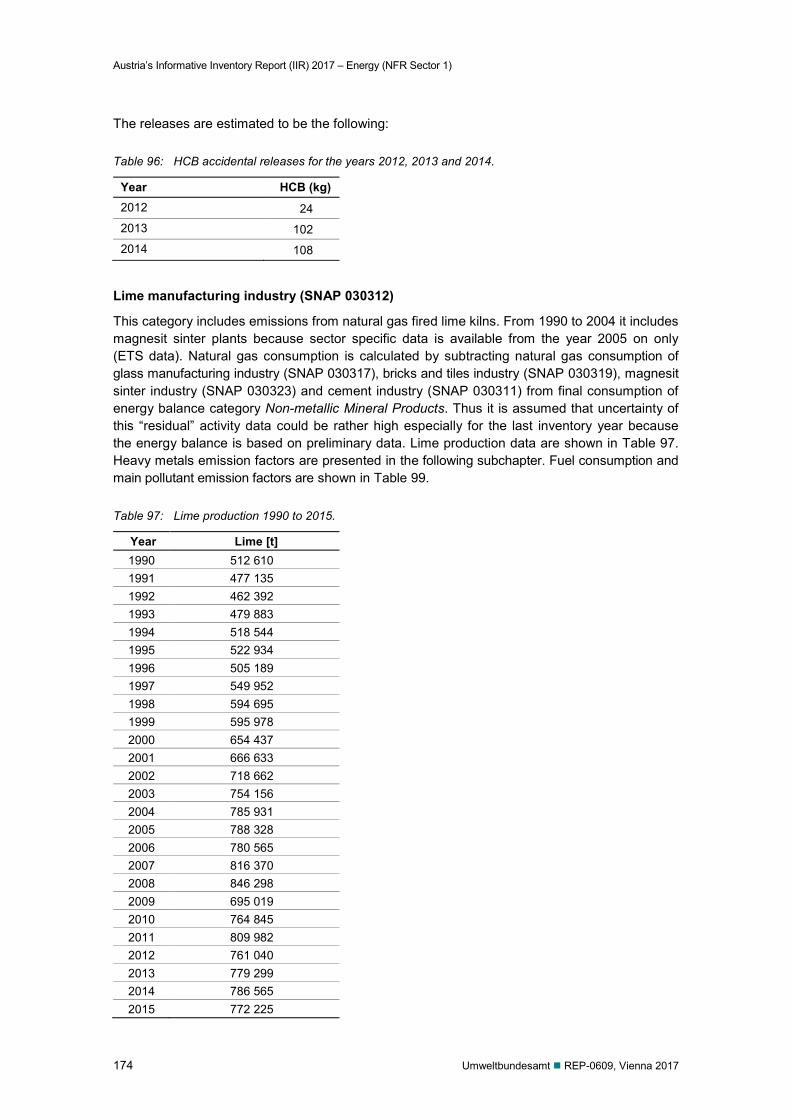
Austria’s Informative Inventory Report (IIR) 2017 – Energy (NFR Sector 1)
174 Umweltbundesamt REP-0609, Vienna 2017
The releases are estimated to be the following:
Table 96: HCB accidental releases for the years 2012, 2013 and 2014.
Year HCB (kg) 2012 24 2013 102 2014 108
Lime manufacturing industry (SNAP 030312)
This category includes emissions from natural gas fired lime kilns. From 1990 to 2004 it includes magnesit sinter plants because sector specific data is available from the year 2005 on only (ETS data). Natural gas consumption is calculated by subtracting natural gas consumption of glass manufacturing industry (SNAP 030317), bricks and tiles industry (SNAP 030319), magnesit sinter industry (SNAP 030323) and cement industry (SNAP 030311) from final consumption of energy balance category Non-metallic Mineral Products. Thus it is assumed that uncertainty of this “residual” activity data could be rather high especially for the last inventory year because the energy balance is based on preliminary data. Lime production data are shown in Table 97. Heavy metals emission factors are presented in the following subchapter. Fuel consumption and main pollutant emission factors are shown in Table 99.
Table 97: Lime production 1990 to 2015.
Year Lime [t] 1990 512 610 1991 477 135 1992 462 392 1993 479 883 1994 518 544 1995 522 934 1996 505 189 1997 549 952 1998 594 695 1999 595 978 2000 654 437 2001 666 633 2002 718 662 2003 754 156 2004 785 931 2005 788 328 2006 780 565 2007 816 370 2008 846 298 2009 695 019 2010 764 845 2011 809 982 2012 761 040 2013 779 299 2014 786 565 2015 772 225
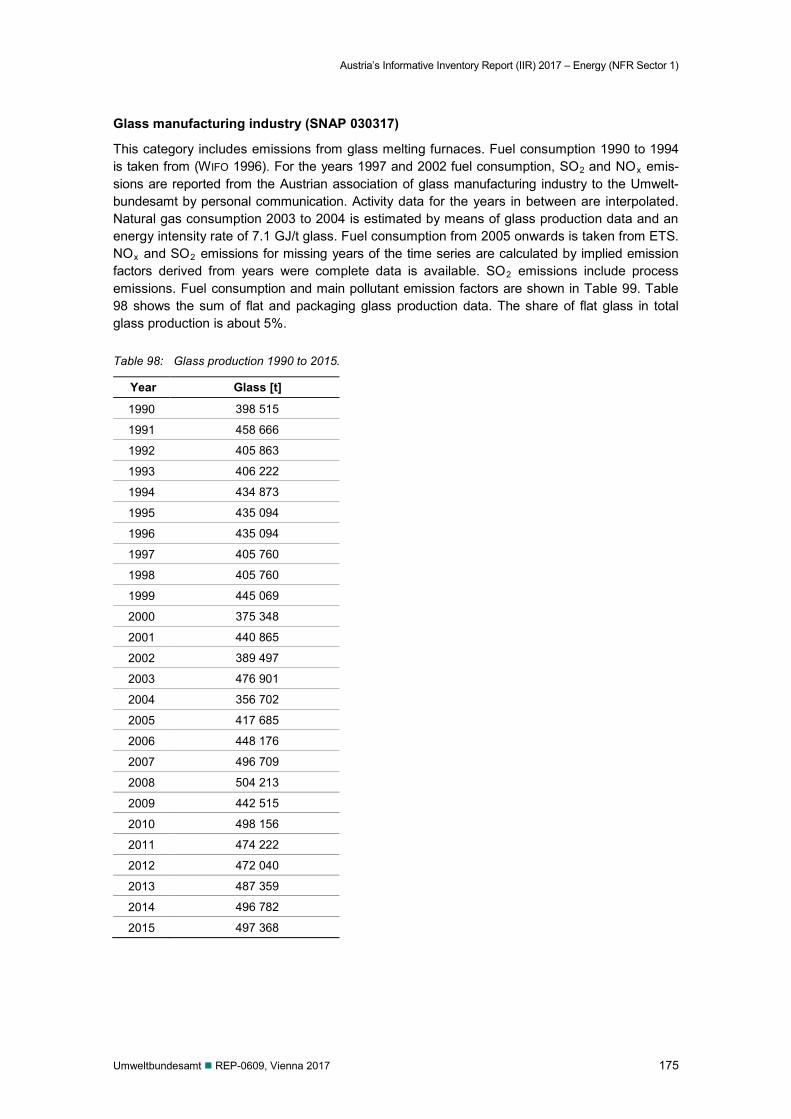
Austria’s Informative Inventory Report (IIR) 2017 – Energy (NFR Sector 1)
Umweltbundesamt REP-0609, Vienna 2017 175
Glass manufacturing industry (SNAP 030317)
This category includes emissions from glass melting furnaces. Fuel consumption 1990 to 1994 is taken from (WIFO 1996). For the years 1997 and 2002 fuel consumption, SO2 and NOx emis-sions are reported from the Austrian association of glass manufacturing industry to the Umwelt-bundesamt by personal communication. Activity data for the years in between are interpolated. Natural gas consumption 2003 to 2004 is estimated by means of glass production data and an energy intensity rate of 7.1 GJ/t glass. Fuel consumption from 2005 onwards is taken from ETS. NOx and SO2 emissions for missing years of the time series are calculated by implied emission factors derived from years were complete data is available. SO2 emissions include process emissions. Fuel consumption and main pollutant emission factors are shown in Table 99. Table 98 shows the sum of flat and packaging glass production data. The share of flat glass in total glass production is about 5%.
Table 98: Glass production 1990 to 2015.
Year Glass [t]
1990 398 515
1991 458 666
1992 405 863
1993 406 222
1994 434 873
1995 435 094
1996 435 094
1997 405 760
1998 405 760
1999 445 069
2000 375 348
2001 440 865
2002 389 497
2003 476 901
2004 356 702
2005 417 685
2006 448 176
2007 496 709
2008 504 213
2009 442 515
2010 498 156
2011 474 222
2012 472 040
2013 487 359
2014 496 782
2015 497 368
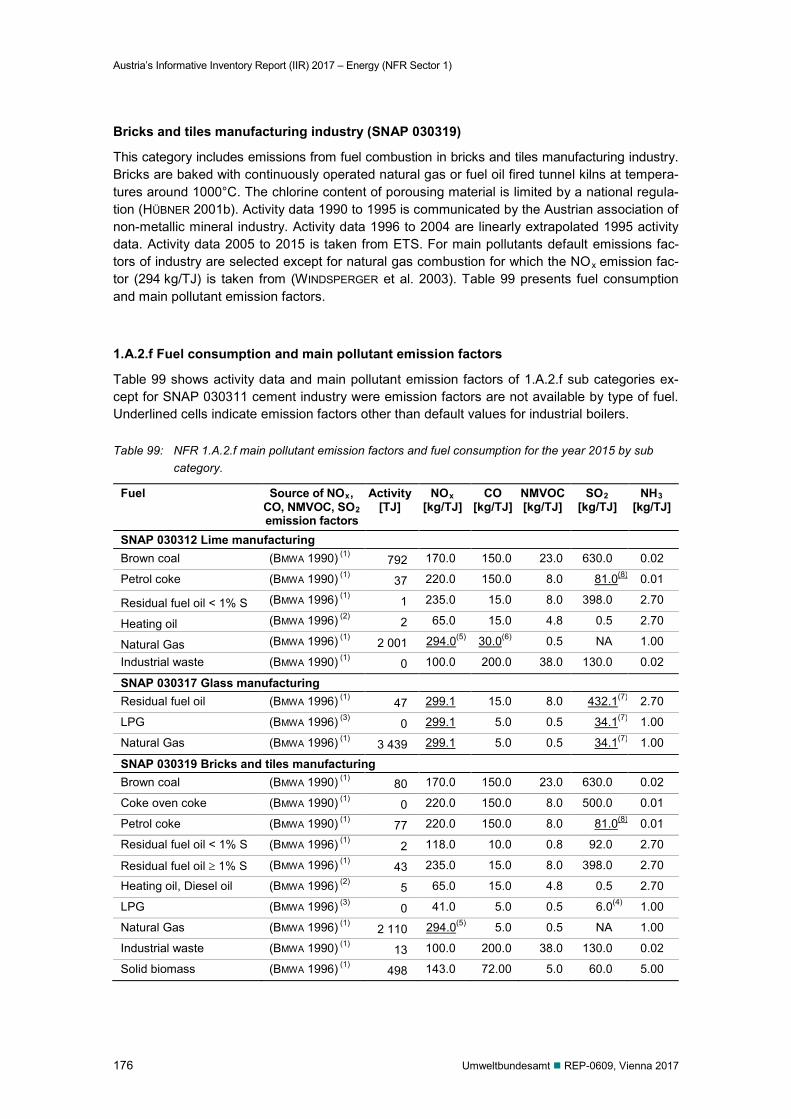
Austria’s Informative Inventory Report (IIR) 2017 – Energy (NFR Sector 1)
176 Umweltbundesamt REP-0609, Vienna 2017
Bricks and tiles manufacturing industry (SNAP 030319)
This category includes emissions from fuel combustion in bricks and tiles manufacturing industry. Bricks are baked with continuously operated natural gas or fuel oil fired tunnel kilns at tempera-tures around 1000°C. The chlorine content of porousing material is limited by a national regula-tion (HÜBNER 2001b). Activity data 1990 to 1995 is communicated by the Austrian association of non-metallic mineral industry. Activity data 1996 to 2004 are linearly extrapolated 1995 activity data. Activity data 2005 to 2015 is taken from ETS. For main pollutants default emissions fac-tors of industry are selected except for natural gas combustion for which the NOx emission fac-tor (294 kg/TJ) is taken from (WINDSPERGER et al. 2003). Table 99 presents fuel consumption and main pollutant emission factors.
1.A.2.f Fuel consumption and main pollutant emission factors
Table 99 shows activity data and main pollutant emission factors of 1.A.2.f sub categories ex-cept for SNAP 030311 cement industry were emission factors are not available by type of fuel. Underlined cells indicate emission factors other than default values for industrial boilers.
Table 99: NFR 1.A.2.f main pollutant emission factors and fuel consumption for the year 2015 by sub category.
Fuel Source of NOx, CO, NMVOC, SO2 emission factors
Activity [TJ]
NOx [kg/TJ]
CO [kg/TJ]
NMVOC [kg/TJ]
SO2 [kg/TJ]
NH3 [kg/TJ]
SNAP 030312 Lime manufacturing Brown coal (BMWA 1990) (1) 792 170.0 150.0 23.0 630.0 0.02
Petrol coke (BMWA 1990) (1) 37 220.0 150.0 8.0 81.0(8) 0.01
Residual fuel oil < 1% S (BMWA 1996) (1) 1 235.0 15.0 8.0 398.0 2.70
Heating oil (BMWA 1996) (2) 2 65.0 15.0 4.8 0.5 2.70
Natural Gas (BMWA 1996) (1) 2 001 294.0(5) 30.0(6) 0.5 NA 1.00
Industrial waste (BMWA 1990) (1) 0 100.0 200.0 38.0 130.0 0.02
SNAP 030317 Glass manufacturing Residual fuel oil (BMWA 1996) (1) 47 299.1 15.0 8.0 432.1(7) 2.70
LPG (BMWA 1996) (3) 0 299.1 5.0 0.5 34.1(7) 1.00
Natural Gas (BMWA 1996) (1) 3 439 299.1 5.0 0.5 34.1(7) 1.00
SNAP 030319 Bricks and tiles manufacturing Brown coal (BMWA 1990) (1) 80 170.0 150.0 23.0 630.0 0.02
Coke oven coke (BMWA 1990) (1) 0 220.0 150.0 8.0 500.0 0.01
Petrol coke (BMWA 1990) (1) 77 220.0 150.0 8.0 81.0(8) 0.01
Residual fuel oil < 1% S (BMWA 1996) (1) 2 118.0 10.0 0.8 92.0 2.70
Residual fuel oil ≥ 1% S (BMWA 1996) (1) 43 235.0 15.0 8.0 398.0 2.70
Heating oil, Diesel oil (BMWA 1996) (2) 5 65.0 15.0 4.8 0.5 2.70
LPG (BMWA 1996) (3) 0 41.0 5.0 0.5 6.0(4) 1.00
Natural Gas (BMWA 1996) (1) 2 110 294.0(5) 5.0 0.5 NA 1.00
Industrial waste (BMWA 1990) (1) 13 100.0 200.0 38.0 130.0 0.02
Solid biomass (BMWA 1996) (1) 498 143.0 72.00 5.0 60.0 5.00
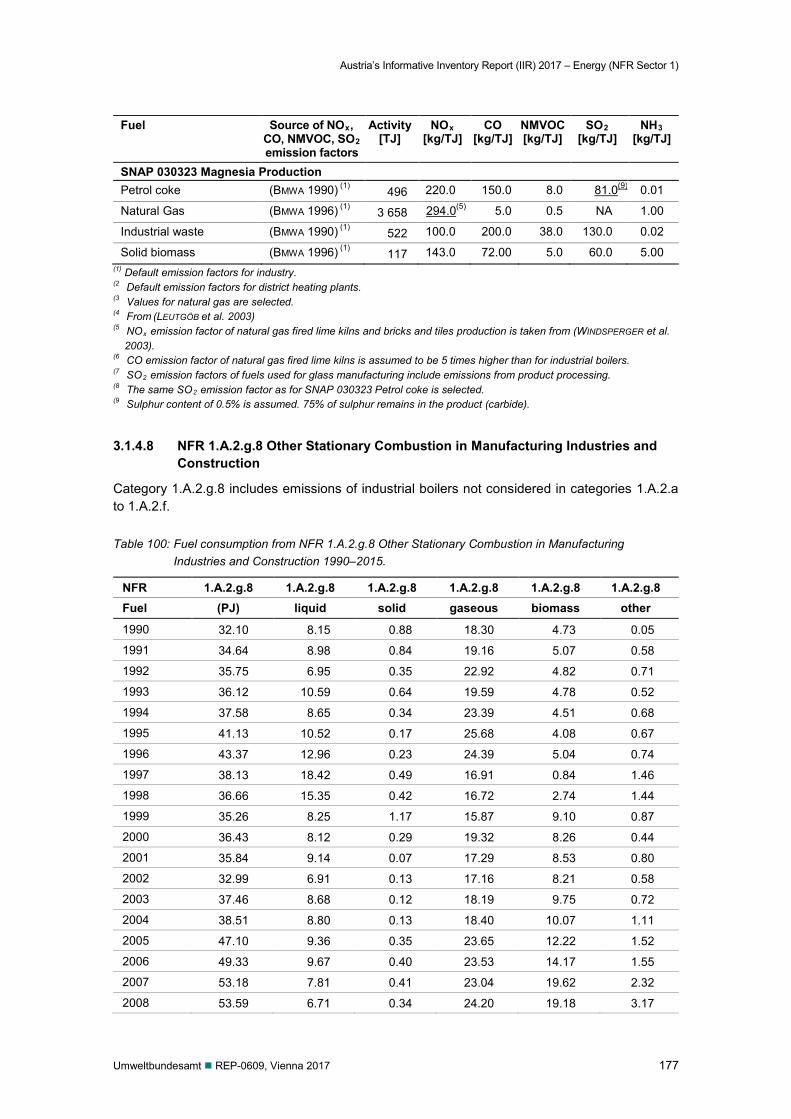
Austria’s Informative Inventory Report (IIR) 2017 – Energy (NFR Sector 1)
Umweltbundesamt REP-0609, Vienna 2017 177
Fuel Source of NOx, CO, NMVOC, SO2 emission factors
Activity [TJ]
NOx [kg/TJ]
CO [kg/TJ]
NMVOC [kg/TJ]
SO2 [kg/TJ]
NH3 [kg/TJ]
SNAP 030323 Magnesia Production Petrol coke (BMWA 1990) (1) 496 220.0 150.0 8.0 81.0(9) 0.01
Natural Gas (BMWA 1996) (1) 3 658 294.0(5) 5.0 0.5 NA 1.00
Industrial waste (BMWA 1990) (1) 522 100.0 200.0 38.0 130.0 0.02
Solid biomass (BMWA 1996) (1) 117 143.0 72.00 5.0 60.0 5.00 (1) Default emission factors for industry. (2 Default emission factors for district heating plants. (3 Values for natural gas are selected. (4 From (LEUTGÖB et al. 2003) (5 NOx emission factor of natural gas fired lime kilns and bricks and tiles production is taken from (WINDSPERGER et al.
2003). (6 CO emission factor of natural gas fired lime kilns is assumed to be 5 times higher than for industrial boilers. (7 SO2 emission factors of fuels used for glass manufacturing include emissions from product processing. (8 The same SO2 emission factor as for SNAP 030323 Petrol coke is selected. (9 Sulphur content of 0.5% is assumed. 75% of sulphur remains in the product (carbide).
3.1.4.8 NFR 1.A.2.g.8 Other Stationary Combustion in Manufacturing Industries and Construction
Category 1.A.2.g.8 includes emissions of industrial boilers not considered in categories 1.A.2.a to 1.A.2.f.
Table 100: Fuel consumption from NFR 1.A.2.g.8 Other Stationary Combustion in Manufacturing Industries and Construction 1990–2015.
NFR 1.A.2.g.8 1.A.2.g.8 1.A.2.g.8 1.A.2.g.8 1.A.2.g.8 1.A.2.g.8 Fuel (PJ) liquid solid gaseous biomass other
1990 32.10 8.15 0.88 18.30 4.73 0.05
1991 34.64 8.98 0.84 19.16 5.07 0.58
1992 35.75 6.95 0.35 22.92 4.82 0.71
1993 36.12 10.59 0.64 19.59 4.78 0.52
1994 37.58 8.65 0.34 23.39 4.51 0.68
1995 41.13 10.52 0.17 25.68 4.08 0.67
1996 43.37 12.96 0.23 24.39 5.04 0.74
1997 38.13 18.42 0.49 16.91 0.84 1.46
1998 36.66 15.35 0.42 16.72 2.74 1.44
1999 35.26 8.25 1.17 15.87 9.10 0.87
2000 36.43 8.12 0.29 19.32 8.26 0.44
2001 35.84 9.14 0.07 17.29 8.53 0.80
2002 32.99 6.91 0.13 17.16 8.21 0.58
2003 37.46 8.68 0.12 18.19 9.75 0.72
2004 38.51 8.80 0.13 18.40 10.07 1.11
2005 47.10 9.36 0.35 23.65 12.22 1.52
2006 49.33 9.67 0.40 23.53 14.17 1.55
2007 53.18 7.81 0.41 23.04 19.62 2.32
2008 53.59 6.71 0.34 24.20 19.18 3.17
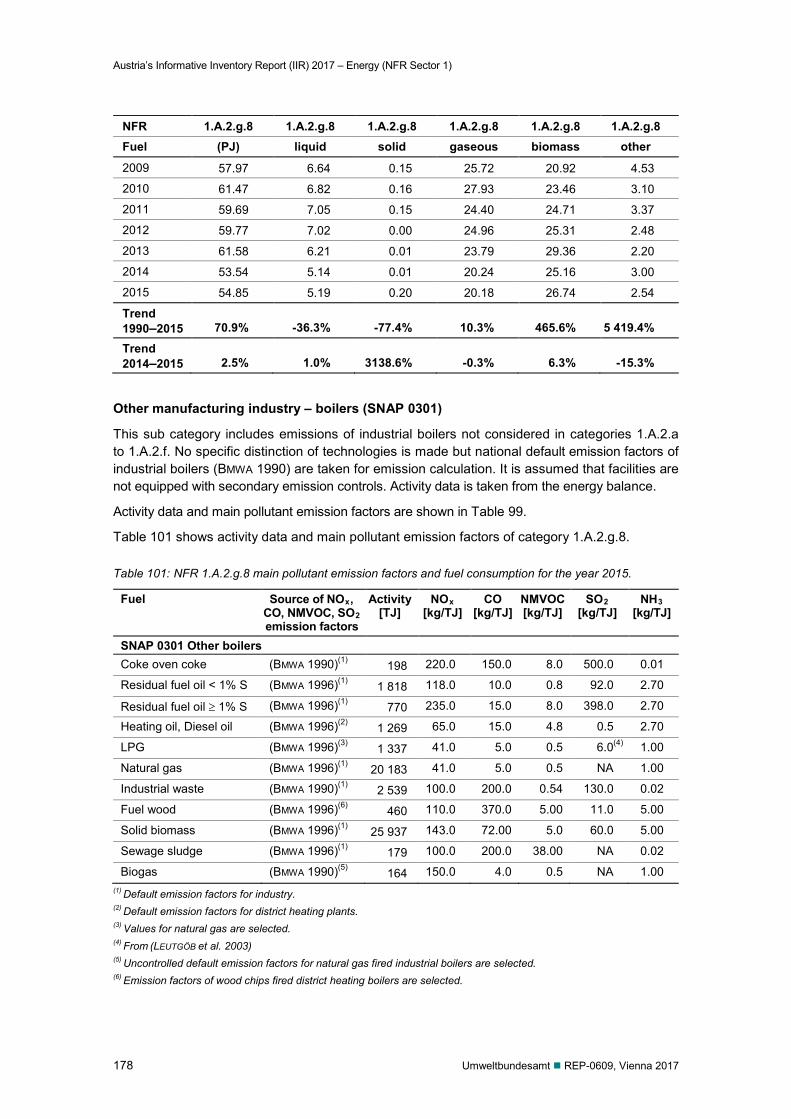
Austria’s Informative Inventory Report (IIR) 2017 – Energy (NFR Sector 1)
178 Umweltbundesamt REP-0609, Vienna 2017
NFR 1.A.2.g.8 1.A.2.g.8 1.A.2.g.8 1.A.2.g.8 1.A.2.g.8 1.A.2.g.8 Fuel (PJ) liquid solid gaseous biomass other
2009 57.97 6.64 0.15 25.72 20.92 4.53
2010 61.47 6.82 0.16 27.93 23.46 3.10
2011 59.69 7.05 0.15 24.40 24.71 3.37
2012 59.77 7.02 0.00 24.96 25.31 2.48
2013 61.58 6.21 0.01 23.79 29.36 2.20
2014 53.54 5.14 0.01 20.24 25.16 3.00
2015 54.85 5.19 0.20 20.18 26.74 2.54
Trend 1990–2015 70.9% -36.3% -77.4% 10.3% 465.6% 5 419.4%
Trend 2014–2015 2.5% 1.0% 3138.6% -0.3% 6.3% -15.3%
Other manufacturing industry – boilers (SNAP 0301)
This sub category includes emissions of industrial boilers not considered in categories 1.A.2.a to 1.A.2.f. No specific distinction of technologies is made but national default emission factors of industrial boilers (BMWA 1990) are taken for emission calculation. It is assumed that facilities are not equipped with secondary emission controls. Activity data is taken from the energy balance.
Activity data and main pollutant emission factors are shown in Table 99.
Table 101 shows activity data and main pollutant emission factors of category 1.A.2.g.8.
Table 101: NFR 1.A.2.g.8 main pollutant emission factors and fuel consumption for the year 2015.
Fuel Source of NOx, CO, NMVOC, SO2 emission factors
Activity [TJ]
NOx [kg/TJ]
CO [kg/TJ]
NMVOC [kg/TJ]
SO2 [kg/TJ]
NH3 [kg/TJ]
SNAP 0301 Other boilers Coke oven coke (BMWA 1990)(1) 198 220.0 150.0 8.0 500.0 0.01
Residual fuel oil < 1% S (BMWA 1996)(1) 1 818 118.0 10.0 0.8 92.0 2.70
Residual fuel oil ≥ 1% S (BMWA 1996)(1) 770 235.0 15.0 8.0 398.0 2.70
Heating oil, Diesel oil (BMWA 1996)(2) 1 269 65.0 15.0 4.8 0.5 2.70
LPG (BMWA 1996)(3) 1 337 41.0 5.0 0.5 6.0(4) 1.00
Natural gas (BMWA 1996)(1) 20 183 41.0 5.0 0.5 NA 1.00
Industrial waste (BMWA 1990)(1) 2 539 100.0 200.0 0.54 130.0 0.02
Fuel wood (BMWA 1996)(6) 460 110.0 370.0 5.00 11.0 5.00
Solid biomass (BMWA 1996)(1) 25 937 143.0 72.00 5.0 60.0 5.00
Sewage sludge (BMWA 1996)(1) 179 100.0 200.0 38.00 NA 0.02
Biogas (BMWA 1990)(5) 164 150.0 4.0 0.5 NA 1.00 (1) Default emission factors for industry. (2) Default emission factors for district heating plants. (3) Values for natural gas are selected. (4) From (LEUTGÖB et al. 2003) (5) Uncontrolled default emission factors for natural gas fired industrial boilers are selected. (6) Emission factors of wood chips fired district heating boilers are selected.
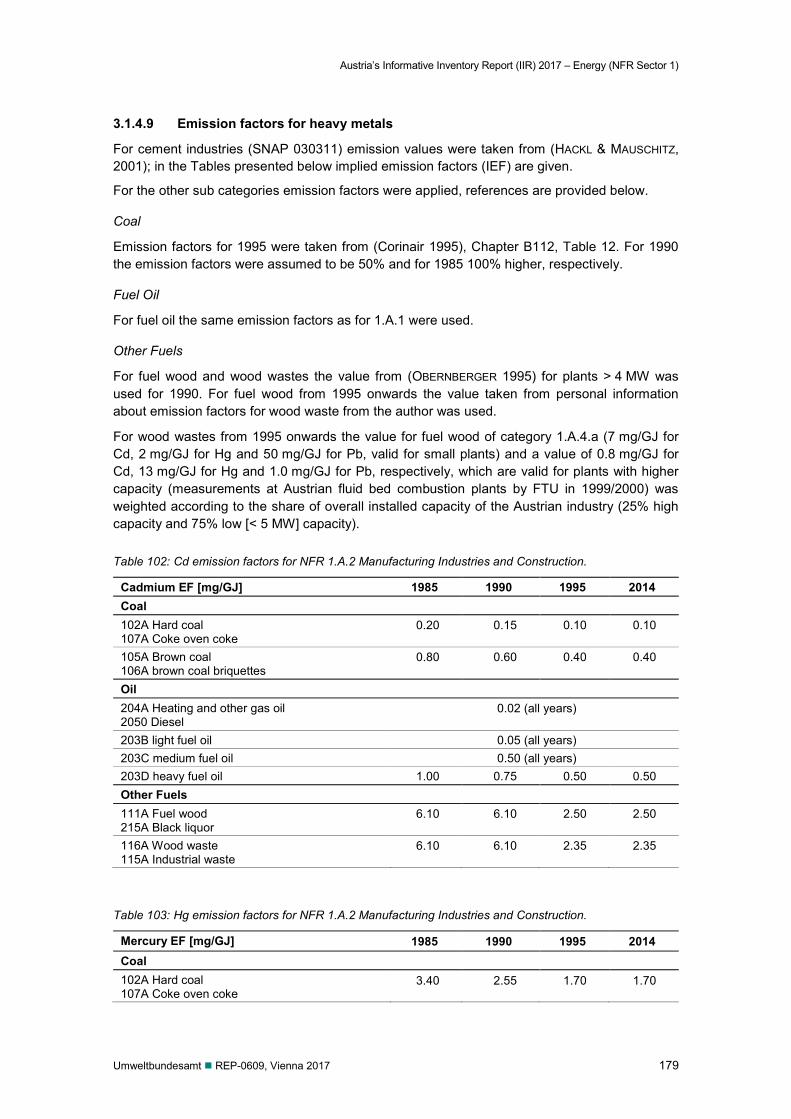
Austria’s Informative Inventory Report (IIR) 2017 – Energy (NFR Sector 1)
Umweltbundesamt REP-0609, Vienna 2017 179
3.1.4.9 Emission factors for heavy metals
For cement industries (SNAP 030311) emission values were taken from (HACKL & MAUSCHITZ, 2001); in the Tables presented below implied emission factors (IEF) are given.
For the other sub categories emission factors were applied, references are provided below.
Coal
Emission factors for 1995 were taken from (Corinair 1995), Chapter B112, Table 12. For 1990 the emission factors were assumed to be 50% and for 1985 100% higher, respectively.
Fuel Oil
For fuel oil the same emission factors as for 1.A.1 were used.
Other Fuels
For fuel wood and wood wastes the value from (OBERNBERGER 1995) for plants > 4 MW was used for 1990. For fuel wood from 1995 onwards the value taken from personal information about emission factors for wood waste from the author was used.
For wood wastes from 1995 onwards the value for fuel wood of category 1.A.4.a (7 mg/GJ for Cd, 2 mg/GJ for Hg and 50 mg/GJ for Pb, valid for small plants) and a value of 0.8 mg/GJ for Cd, 13 mg/GJ for Hg and 1.0 mg/GJ for Pb, respectively, which are valid for plants with higher capacity (measurements at Austrian fluid bed combustion plants by FTU in 1999/2000) was weighted according to the share of overall installed capacity of the Austrian industry (25% high capacity and 75% low [< 5 MW] capacity).
Table 102: Cd emission factors for NFR 1.A.2 Manufacturing Industries and Construction.
Cadmium EF [mg/GJ] 1985 1990 1995 2014 Coal 102A Hard coal 107A Coke oven coke
0.20 0.15 0.10 0.10
105A Brown coal 106A brown coal briquettes
0.80 0.60 0.40 0.40
Oil 204A Heating and other gas oil 2050 Diesel
0.02 (all years)
203B light fuel oil 0.05 (all years) 203C medium fuel oil 0.50 (all years) 203D heavy fuel oil 1.00 0.75 0.50 0.50 Other Fuels 111A Fuel wood 215A Black liquor
6.10 6.10 2.50 2.50
116A Wood waste 115A Industrial waste
6.10 6.10 2.35 2.35
Table 103: Hg emission factors for NFR 1.A.2 Manufacturing Industries and Construction.
Mercury EF [mg/GJ] 1985 1990 1995 2014 Coal 102A Hard coal 107A Coke oven coke
3.40 2.55 1.70 1.70
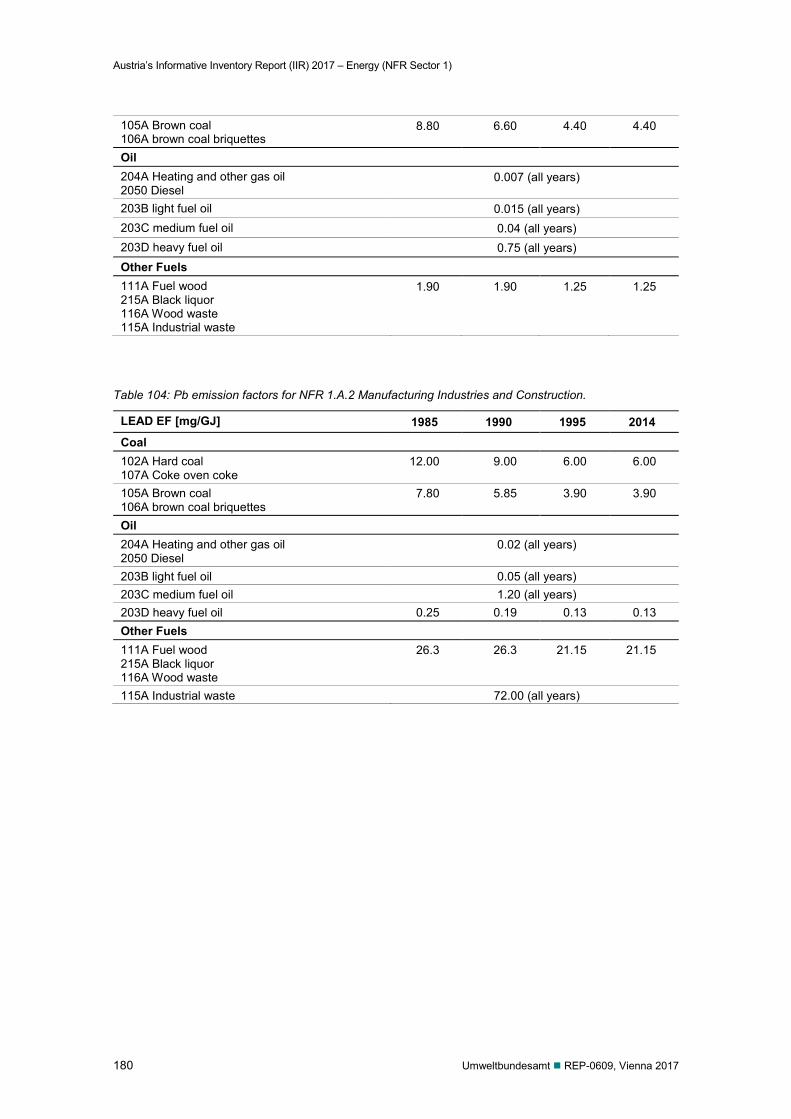
Austria’s Informative Inventory Report (IIR) 2017 – Energy (NFR Sector 1)
180 Umweltbundesamt REP-0609, Vienna 2017
105A Brown coal 106A brown coal briquettes
8.80 6.60 4.40 4.40
Oil 204A Heating and other gas oil 2050 Diesel
0.007 (all years)
203B light fuel oil 0.015 (all years) 203C medium fuel oil 0.04 (all years) 203D heavy fuel oil 0.75 (all years) Other Fuels 111A Fuel wood 215A Black liquor 116A Wood waste 115A Industrial waste
1.90 1.90 1.25 1.25
Table 104: Pb emission factors for NFR 1.A.2 Manufacturing Industries and Construction.
LEAD EF [mg/GJ] 1985 1990 1995 2014 Coal 102A Hard coal 107A Coke oven coke
12.00 9.00 6.00 6.00
105A Brown coal 106A brown coal briquettes
7.80 5.85 3.90 3.90
Oil 204A Heating and other gas oil 2050 Diesel
0.02 (all years)
203B light fuel oil 0.05 (all years) 203C medium fuel oil 1.20 (all years) 203D heavy fuel oil 0.25 0.19 0.13 0.13 Other Fuels 111A Fuel wood 215A Black liquor 116A Wood waste
26.3 26.3 21.15 21.15
115A Industrial waste 72.00 (all years)
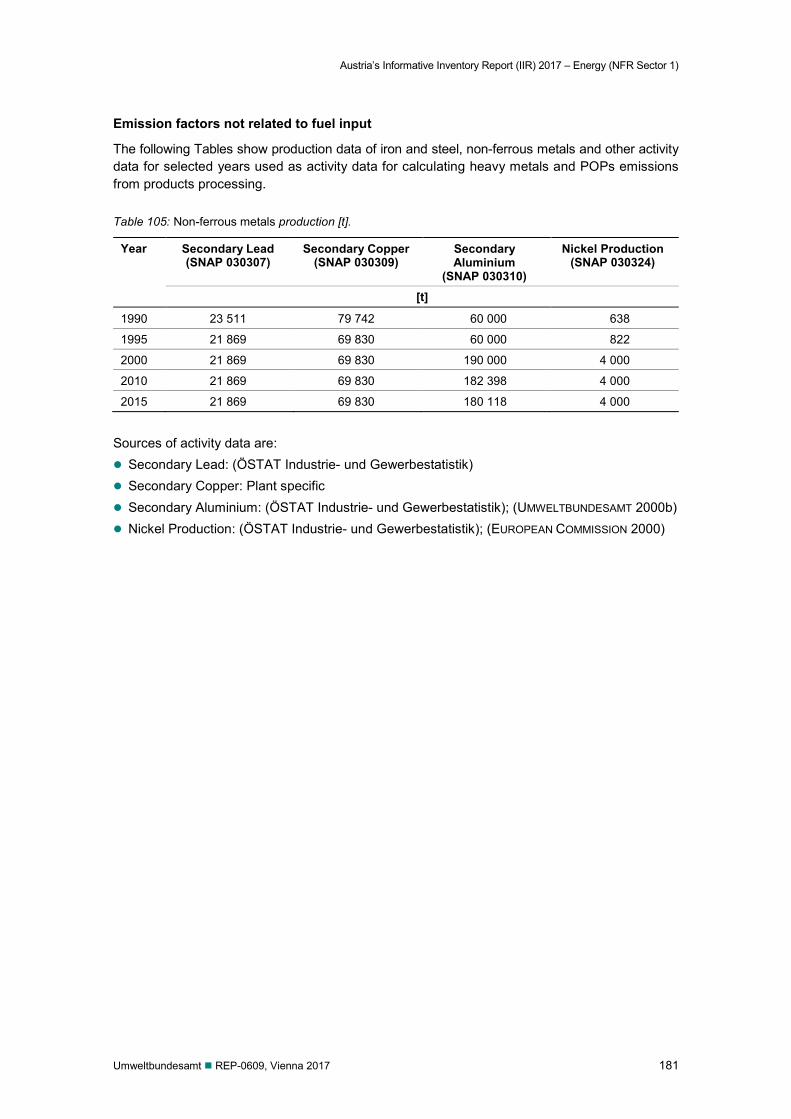
Austria’s Informative Inventory Report (IIR) 2017 – Energy (NFR Sector 1)
Umweltbundesamt REP-0609, Vienna 2017 181
Emission factors not related to fuel input
The following Tables show production data of iron and steel, non-ferrous metals and other activity data for selected years used as activity data for calculating heavy metals and POPs emissions from products processing.
Table 105: Non-ferrous metals production [t].
Year Secondary Lead (SNAP 030307)
Secondary Copper (SNAP 030309)
Secondary Aluminium
(SNAP 030310)
Nickel Production (SNAP 030324)
[t]
1990 23 511 79 742 60 000 638
1995 21 869 69 830 60 000 822
2000 21 869 69 830 190 000 4 000
2010 21 869 69 830 182 398 4 000
2015 21 869 69 830 180 118 4 000
Sources of activity data are: Secondary Lead: (ÖSTAT Industrie- und Gewerbestatistik) Secondary Copper: Plant specific Secondary Aluminium: (ÖSTAT Industrie- und Gewerbestatistik); (UMWELTBUNDESAMT 2000b) Nickel Production: (ÖSTAT Industrie- und Gewerbestatistik); (EUROPEAN COMMISSION 2000)
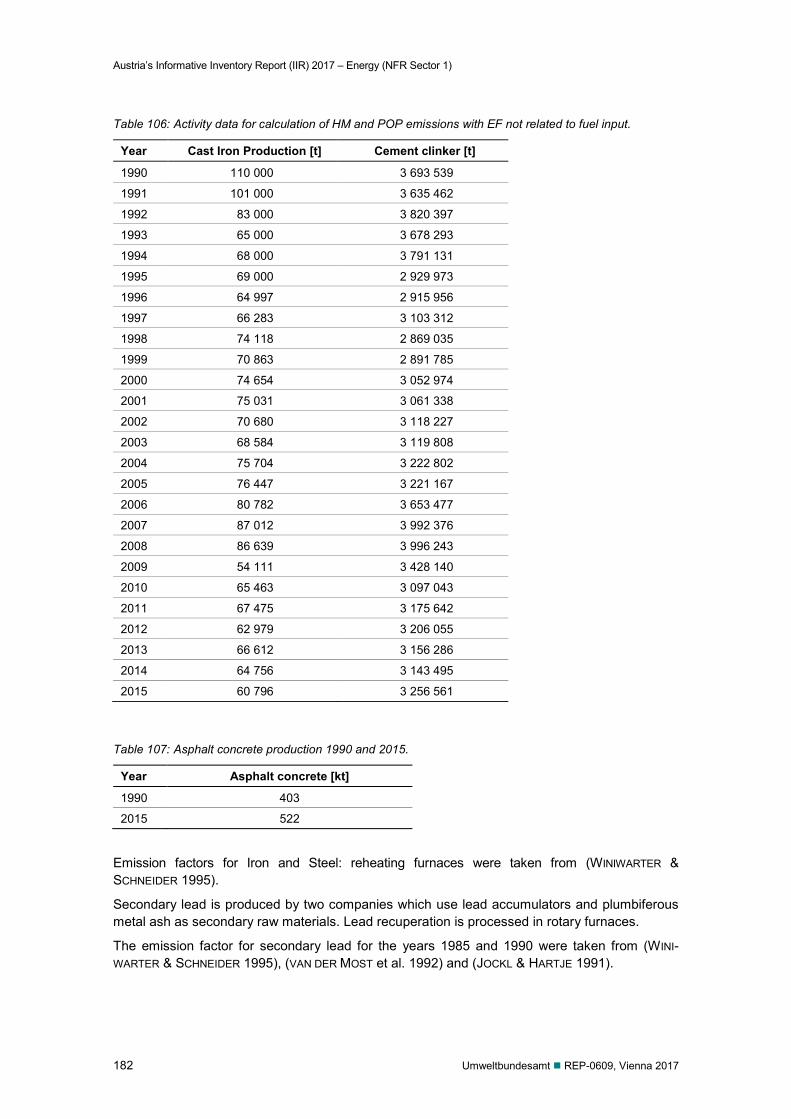
Austria’s Informative Inventory Report (IIR) 2017 – Energy (NFR Sector 1)
182 Umweltbundesamt REP-0609, Vienna 2017
Table 106: Activity data for calculation of HM and POP emissions with EF not related to fuel input.
Year Cast Iron Production [t] Cement clinker [t]
1990 110 000 3 693 539
1991 101 000 3 635 462
1992 83 000 3 820 397
1993 65 000 3 678 293
1994 68 000 3 791 131
1995 69 000 2 929 973
1996 64 997 2 915 956
1997 66 283 3 103 312
1998 74 118 2 869 035
1999 70 863 2 891 785
2000 74 654 3 052 974
2001 75 031 3 061 338
2002 70 680 3 118 227
2003 68 584 3 119 808
2004 75 704 3 222 802
2005 76 447 3 221 167
2006 80 782 3 653 477
2007 87 012 3 992 376
2008 86 639 3 996 243
2009 54 111 3 428 140
2010 65 463 3 097 043
2011 67 475 3 175 642
2012 62 979 3 206 055
2013 66 612 3 156 286
2014 64 756 3 143 495
2015 60 796 3 256 561
Table 107: Asphalt concrete production 1990 and 2015.
Year Asphalt concrete [kt]
1990 403
2015 522
Emission factors for Iron and Steel: reheating furnaces were taken from (WINIWARTER & SCHNEIDER 1995).
Secondary lead is produced by two companies which use lead accumulators and plumbiferous metal ash as secondary raw materials. Lead recuperation is processed in rotary furnaces.
The emission factor for secondary lead for the years 1985 and 1990 were taken from (WINI-WARTER & SCHNEIDER 1995), (VAN DER MOST et al. 1992) and (JOCKL & HARTJE 1991).
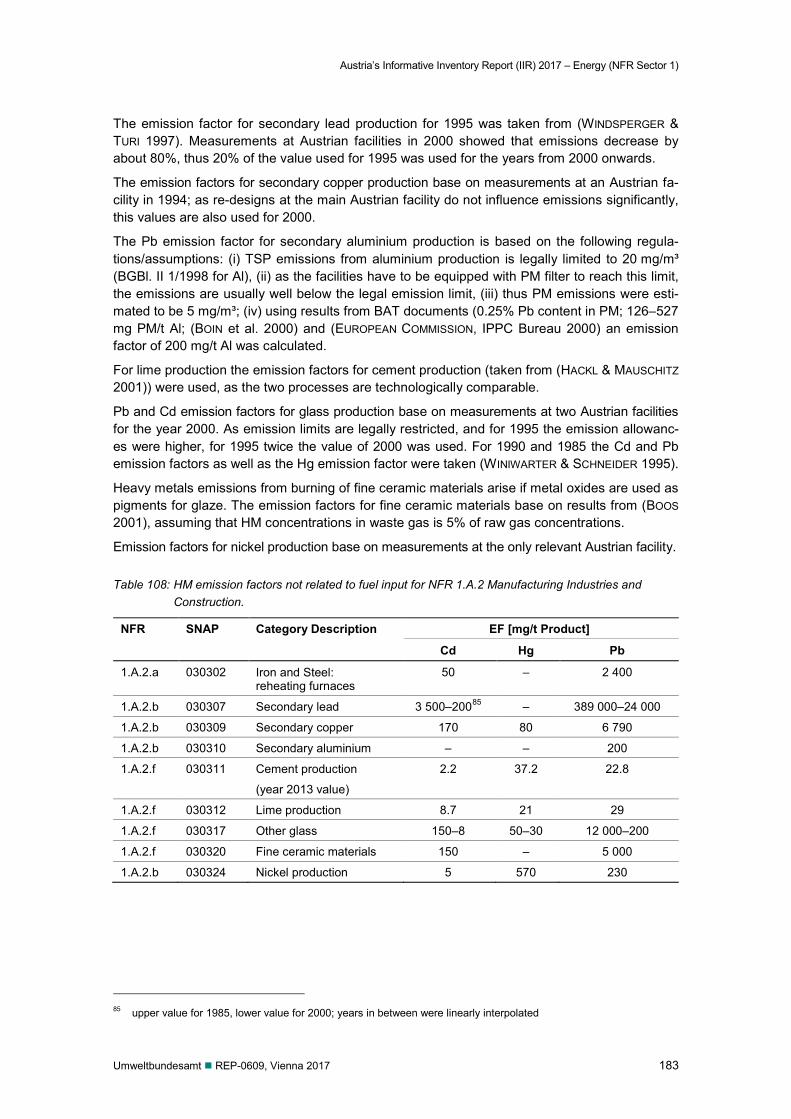
Austria’s Informative Inventory Report (IIR) 2017 – Energy (NFR Sector 1)
Umweltbundesamt REP-0609, Vienna 2017 183
The emission factor for secondary lead production for 1995 was taken from (WINDSPERGER & TURI 1997). Measurements at Austrian facilities in 2000 showed that emissions decrease by about 80%, thus 20% of the value used for 1995 was used for the years from 2000 onwards.
The emission factors for secondary copper production base on measurements at an Austrian fa-cility in 1994; as re-designs at the main Austrian facility do not influence emissions significantly, this values are also used for 2000.
The Pb emission factor for secondary aluminium production is based on the following regula-tions/assumptions: (i) TSP emissions from aluminium production is legally limited to 20 mg/m³ (BGBl. II 1/1998 for Al), (ii) as the facilities have to be equipped with PM filter to reach this limit, the emissions are usually well below the legal emission limit, (iii) thus PM emissions were esti-mated to be 5 mg/m³; (iv) using results from BAT documents (0.25% Pb content in PM; 126–527 mg PM/t Al; (BOIN et al. 2000) and (EUROPEAN COMMISSION, IPPC Bureau 2000) an emission factor of 200 mg/t Al was calculated.
For lime production the emission factors for cement production (taken from (HACKL & MAUSCHITZ 2001)) were used, as the two processes are technologically comparable.
Pb and Cd emission factors for glass production base on measurements at two Austrian facilities for the year 2000. As emission limits are legally restricted, and for 1995 the emission allowanc-es were higher, for 1995 twice the value of 2000 was used. For 1990 and 1985 the Cd and Pb emission factors as well as the Hg emission factor were taken (WINIWARTER & SCHNEIDER 1995).
Heavy metals emissions from burning of fine ceramic materials arise if metal oxides are used as pigments for glaze. The emission factors for fine ceramic materials base on results from (BOOS 2001), assuming that HM concentrations in waste gas is 5% of raw gas concentrations.
Emission factors for nickel production base on measurements at the only relevant Austrian facility.
Table 108: HM emission factors not related to fuel input for NFR 1.A.2 Manufacturing Industries and Construction.
NFR SNAP Category Description EF [mg/t Product]
Cd Hg Pb
1.A.2.a 030302 Iron and Steel: reheating furnaces
50 – 2 400
1.A.2.b 030307 Secondary lead 3 500–20085 – 389 000–24 000
1.A.2.b 030309 Secondary copper 170 80 6 790
1.A.2.b 030310 Secondary aluminium – – 200
1.A.2.f 030311 Cement production
(year 2013 value)
2.2 37.2 22.8
1.A.2.f 030312 Lime production 8.7 21 29
1.A.2.f 030317 Other glass 150–8 50–30 12 000–200
1.A.2.f 030320 Fine ceramic materials 150 – 5 000
1.A.2.b 030324 Nickel production 5 570 230
85 upper value for 1985, lower value for 2000; years in between were linearly interpolated
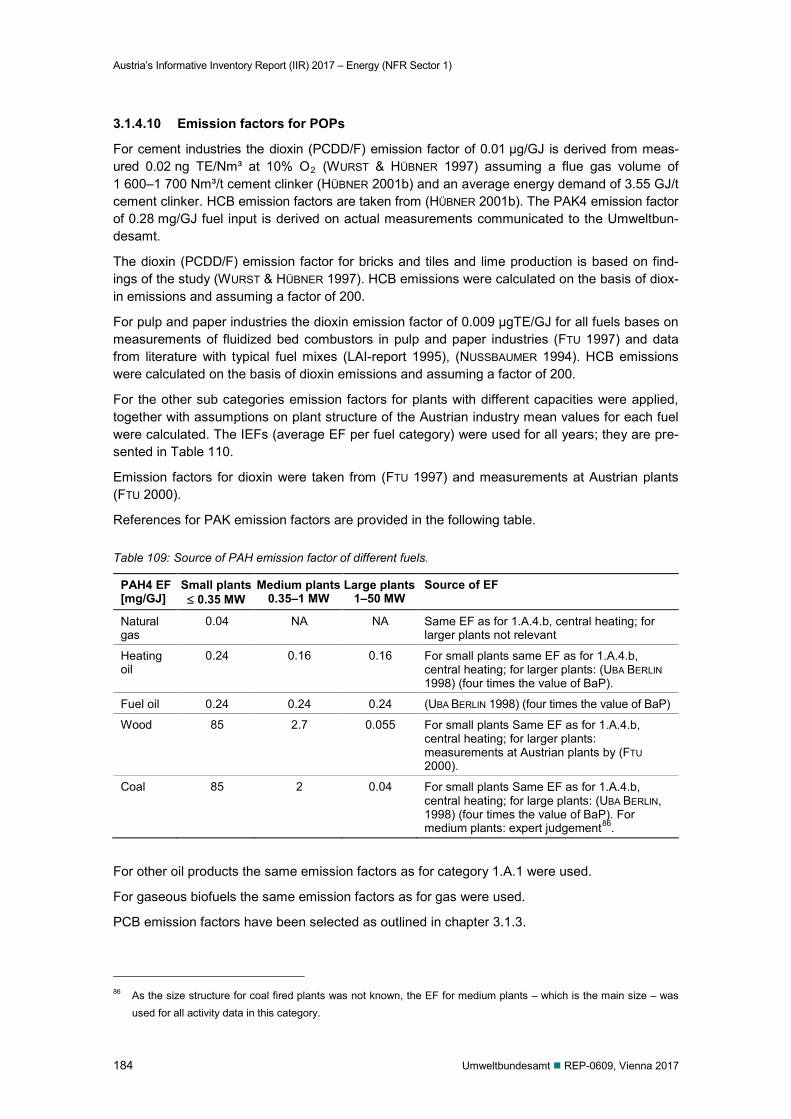
Austria’s Informative Inventory Report (IIR) 2017 – Energy (NFR Sector 1)
184 Umweltbundesamt REP-0609, Vienna 2017
3.1.4.10 Emission factors for POPs
For cement industries the dioxin (PCDD/F) emission factor of 0.01 µg/GJ is derived from meas-ured 0.02 ng TE/Nm³ at 10% O2 (WURST & HÜBNER 1997) assuming a flue gas volume of 1 600–1 700 Nm³/t cement clinker (HÜBNER 2001b) and an average energy demand of 3.55 GJ/t cement clinker. HCB emission factors are taken from (HÜBNER 2001b). The PAK4 emission factor of 0.28 mg/GJ fuel input is derived on actual measurements communicated to the Umweltbun-desamt.
The dioxin (PCDD/F) emission factor for bricks and tiles and lime production is based on find-ings of the study (WURST & HÜBNER 1997). HCB emissions were calculated on the basis of diox-in emissions and assuming a factor of 200.
For pulp and paper industries the dioxin emission factor of 0.009 µgTE/GJ for all fuels bases on measurements of fluidized bed combustors in pulp and paper industries (FTU 1997) and data from literature with typical fuel mixes (LAI-report 1995), (NUSSBAUMER 1994). HCB emissions were calculated on the basis of dioxin emissions and assuming a factor of 200.
For the other sub categories emission factors for plants with different capacities were applied, together with assumptions on plant structure of the Austrian industry mean values for each fuel were calculated. The IEFs (average EF per fuel category) were used for all years; they are pre-sented in Table 110.
Emission factors for dioxin were taken from (FTU 1997) and measurements at Austrian plants (FTU 2000).
References for PAK emission factors are provided in the following table.
Table 109: Source of PAH emission factor of different fuels.
PAH4 EF [mg/GJ]
Small plants ≤ 0.35 MW
Medium plants 0.35–1 MW
Large plants 1–50 MW
Source of EF
Natural gas
0.04 NA NA Same EF as for 1.A.4.b, central heating; for larger plants not relevant
Heating oil
0.24 0.16 0.16 For small plants same EF as for 1.A.4.b, central heating; for larger plants: (UBA BERLIN 1998) (four times the value of BaP).
Fuel oil 0.24 0.24 0.24 (UBA BERLIN 1998) (four times the value of BaP)
Wood 85 2.7 0.055 For small plants Same EF as for 1.A.4.b, central heating; for larger plants: measurements at Austrian plants by (FTU 2000).
Coal 85 2 0.04 For small plants Same EF as for 1.A.4.b, central heating; for large plants: (UBA BERLIN, 1998) (four times the value of BaP). For medium plants: expert judgement86.
For other oil products the same emission factors as for category 1.A.1 were used.
For gaseous biofuels the same emission factors as for gas were used.
PCB emission factors have been selected as outlined in chapter 3.1.3.
86 As the size structure for coal fired plants was not known, the EF for medium plants – which is the main size – was
used for all activity data in this category.
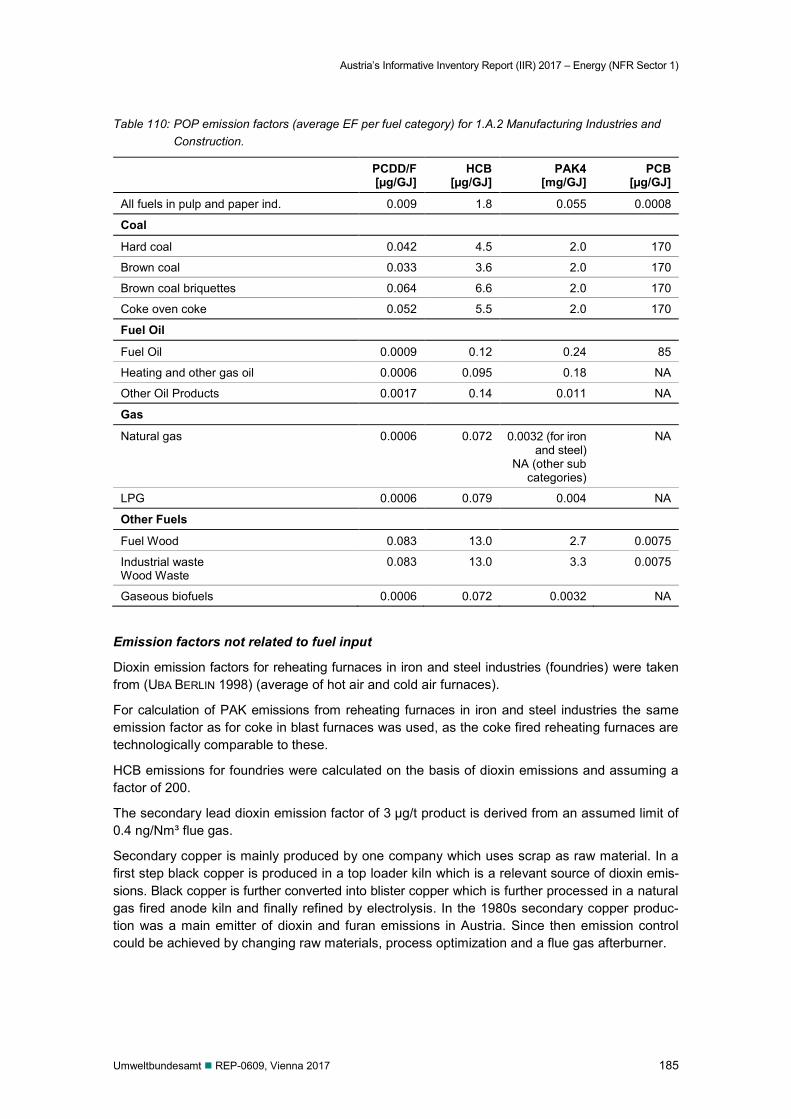
Austria’s Informative Inventory Report (IIR) 2017 – Energy (NFR Sector 1)
Umweltbundesamt REP-0609, Vienna 2017 185
Table 110: POP emission factors (average EF per fuel category) for 1.A.2 Manufacturing Industries and Construction.
PCDD/F [µg/GJ]
HCB [µg/GJ]
PAK4 [mg/GJ]
PCB [µg/GJ]
All fuels in pulp and paper ind. 0.009 1.8 0.055 0.0008
Coal
Hard coal 0.042 4.5 2.0 170
Brown coal 0.033 3.6 2.0 170
Brown coal briquettes 0.064 6.6 2.0 170
Coke oven coke 0.052 5.5 2.0 170
Fuel Oil
Fuel Oil 0.0009 0.12 0.24 85
Heating and other gas oil 0.0006 0.095 0.18 NA
Other Oil Products 0.0017 0.14 0.011 NA
Gas
Natural gas 0.0006 0.072 0.0032 (for iron and steel)
NA (other sub categories)
NA
LPG 0.0006 0.079 0.004 NA
Other Fuels
Fuel Wood 0.083 13.0 2.7 0.0075
Industrial waste Wood Waste
0.083 13.0 3.3 0.0075
Gaseous biofuels 0.0006 0.072 0.0032 NA
Emission factors not related to fuel input
Dioxin emission factors for reheating furnaces in iron and steel industries (foundries) were taken from (UBA BERLIN 1998) (average of hot air and cold air furnaces).
For calculation of PAK emissions from reheating furnaces in iron and steel industries the same emission factor as for coke in blast furnaces was used, as the coke fired reheating furnaces are technologically comparable to these.
HCB emissions for foundries were calculated on the basis of dioxin emissions and assuming a factor of 200.
The secondary lead dioxin emission factor of 3 µg/t product is derived from an assumed limit of 0.4 ng/Nm³ flue gas.
Secondary copper is mainly produced by one company which uses scrap as raw material. In a first step black copper is produced in a top loader kiln which is a relevant source of dioxin emis-sions. Black copper is further converted into blister copper which is further processed in a natural gas fired anode kiln and finally refined by electrolysis. In the 1980s secondary copper produc-tion was a main emitter of dioxin and furan emissions in Austria. Since then emission control could be achieved by changing raw materials, process optimization and a flue gas afterburner.
Austria’s Informative Inventory Report (IIR) 2017 – Energy (NFR Sector 1)
186 Umweltbundesamt REP-0609, Vienna 2017
The dioxin emission factor from secondary copper production for the years after 1991 was taken from (WURST & HÜBNER 1997), in the years before no emission control (thermo reactor) was op-erating, furthermore input materials with more impurities were used. Thus emissions for these years were estimated to be about 200 times higher.
HCB emissions for secondary copper production were estimated on the basis of dioxin emis-sions and a factor of 330 which was calculated from different measurements at an Austrian fa-cility (HÜBNER et al. 2000).
Secondary aluminium is mainly produced by two companies which uses scrap as raw materials. The raw material is mainly processed in rotary kilns and in some cases in hearth type furnaces. The main driver for dioxin and furan emissions is the composition of processed raw material (Chlorine content). While in the early 1990s emissions were widely uncontrolled the facilities have been recently equipped with particle filters and flue gas afterburners.
The dioxin emission factors for secondary aluminium production for the years 1985–1989 was taken from the Belgian emission inventory, as in these years in Austrian facilities hexachloroe-than was used which results in higher emissions (and the Belgian emission factor reflect this). For 1990 the emission factor was taken from (HÜBNER 2000). For 1999 onwards a reduction by 95% was assumed, as dioxin emission reduction measures in the main Austrian plant started to operate.
HCB emissions for secondary aluminium production were estimated on the basis of dioxin emis-sions and a factor of 500, which was calculated taken from (AITTOLA et al. 1996).
POPs emissions are released in asphalt concrete plants when the bitumen/flint mixture is heat-ed.
As dioxin EF the mean value of the emission factors given in (US-EPA 1998) was applied.
The PAK emission factor for asphalt concrete plants was taken from (SCHEIDL 1996).
Nickel is mainly produced by one company which uses catalysts and other potential recyclable as raw material. The raw material is processed in a rotary kiln and an electric arc furnace. Diox-in emissions 1993 are taken from an emissions declaration. Dioxin emissions of the remaining time series are calculated by multiplying production data with the implied emission factor of 1993.
The dioxin emission factor for nickel production bases on measurements in the only relevant Austrian facility.
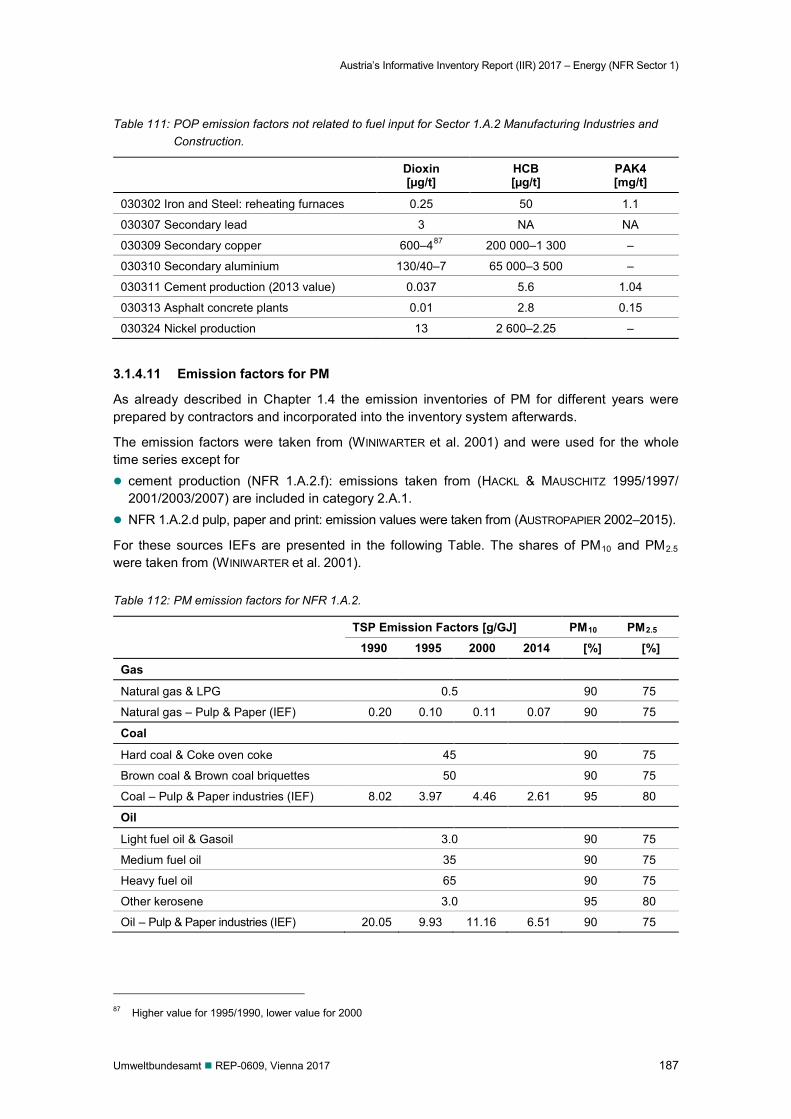
Austria’s Informative Inventory Report (IIR) 2017 – Energy (NFR Sector 1)
Umweltbundesamt REP-0609, Vienna 2017 187
Table 111: POP emission factors not related to fuel input for Sector 1.A.2 Manufacturing Industries and Construction.
Dioxin [µg/t]
HCB [µg/t]
PAK4 [mg/t]
030302 Iron and Steel: reheating furnaces 0.25 50 1.1
030307 Secondary lead 3 NA NA
030309 Secondary copper 600–487 200 000–1 300 –
030310 Secondary aluminium 130/40–7 65 000–3 500 –
030311 Cement production (2013 value) 0.037 5.6 1.04
030313 Asphalt concrete plants 0.01 2.8 0.15
030324 Nickel production 13 2 600–2.25 –
3.1.4.11 Emission factors for PM
As already described in Chapter 1.4 the emission inventories of PM for different years were prepared by contractors and incorporated into the inventory system afterwards.
The emission factors were taken from (WINIWARTER et al. 2001) and were used for the whole time series except for cement production (NFR 1.A.2.f): emissions taken from (HACKL & MAUSCHITZ 1995/1997/
2001/2003/2007) are included in category 2.A.1. NFR 1.A.2.d pulp, paper and print: emission values were taken from (AUSTROPAPIER 2002–2015).
For these sources IEFs are presented in the following Table. The shares of PM10 and PM2.5 were taken from (WINIWARTER et al. 2001).
Table 112: PM emission factors for NFR 1.A.2.
TSP Emission Factors [g/GJ] PM10 PM2.5 1990 1995 2000 2014 [%] [%]
Gas
Natural gas & LPG 0.5 90 75
Natural gas – Pulp & Paper (IEF) 0.20 0.10 0.11 0.07 90 75
Coal
Hard coal & Coke oven coke 45 90 75
Brown coal & Brown coal briquettes 50 90 75
Coal – Pulp & Paper industries (IEF) 8.02 3.97 4.46 2.61 95 80
Oil
Light fuel oil & Gasoil 3.0 90 75
Medium fuel oil 35 90 75
Heavy fuel oil 65 90 75
Other kerosene 3.0 95 80
Oil – Pulp & Paper industries (IEF) 20.05 9.93 11.16 6.51 90 75
87 Higher value for 1995/1990, lower value for 2000
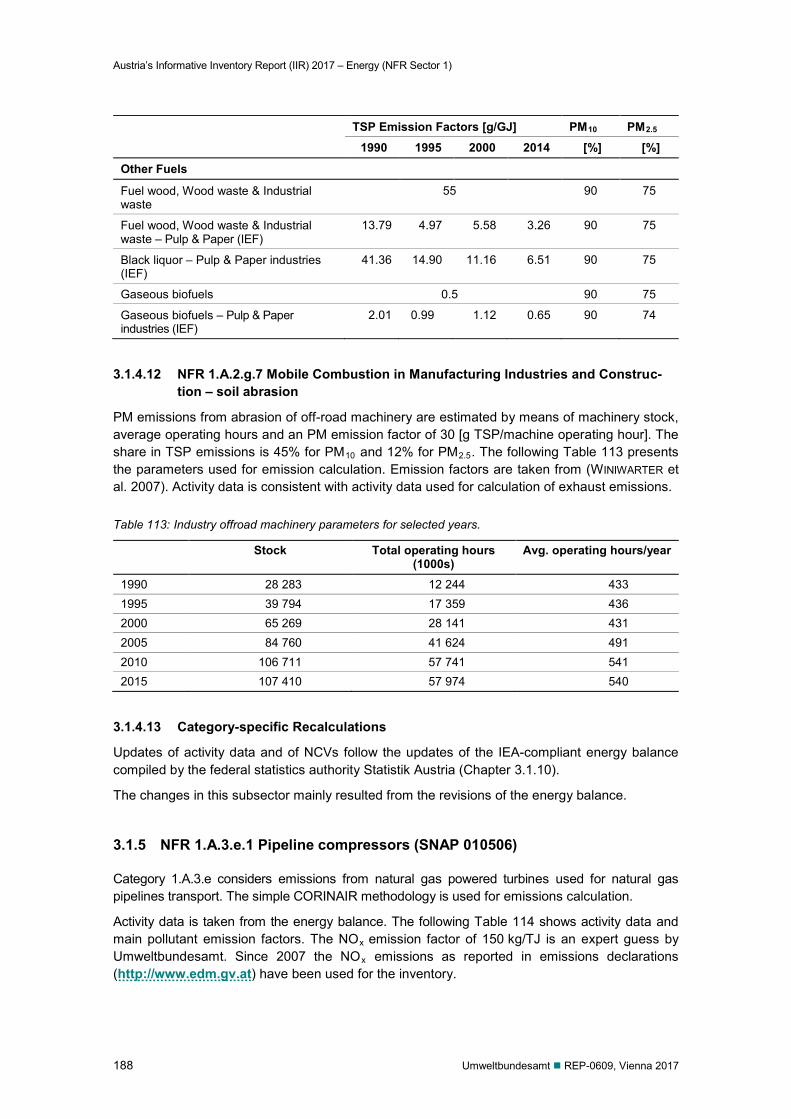
Austria’s Informative Inventory Report (IIR) 2017 – Energy (NFR Sector 1)
188 Umweltbundesamt REP-0609, Vienna 2017
TSP Emission Factors [g/GJ] PM10 PM2.5 1990 1995 2000 2014 [%] [%]
Other Fuels
Fuel wood, Wood waste & Industrial waste
55 90 75
Fuel wood, Wood waste & Industrial waste – Pulp & Paper (IEF)
13.79 4.97 5.58 3.26 90 75
Black liquor – Pulp & Paper industries (IEF)
41.36 14.90 11.16 6.51 90 75
Gaseous biofuels 0.5 90 75
Gaseous biofuels – Pulp & Paper industries (IEF)
2.01 0.99 1.12 0.65 90 74
3.1.4.12 NFR 1.A.2.g.7 Mobile Combustion in Manufacturing Industries and Construc-tion – soil abrasion
PM emissions from abrasion of off-road machinery are estimated by means of machinery stock, average operating hours and an PM emission factor of 30 [g TSP/machine operating hour]. The share in TSP emissions is 45% for PM10 and 12% for PM2.5. The following Table 113 presents the parameters used for emission calculation. Emission factors are taken from (WINIWARTER et al. 2007). Activity data is consistent with activity data used for calculation of exhaust emissions.
Table 113: Industry offroad machinery parameters for selected years.
Stock Total operating hours (1000s)
Avg. operating hours/year
1990 28 283 12 244 433 1995 39 794 17 359 436 2000 65 269 28 141 431 2005 84 760 41 624 491 2010 106 711 57 741 541 2015 107 410 57 974 540
3.1.4.13 Category-specific Recalculations
Updates of activity data and of NCVs follow the updates of the IEA-compliant energy balance compiled by the federal statistics authority Statistik Austria (Chapter 3.1.10).
The changes in this subsector mainly resulted from the revisions of the energy balance.
3.1.5 NFR 1.A.3.e.1 Pipeline compressors (SNAP 010506)
Category 1.A.3.e considers emissions from natural gas powered turbines used for natural gas pipelines transport. The simple CORINAIR methodology is used for emissions calculation.
Activity data is taken from the energy balance. The following Table 114 shows activity data and main pollutant emission factors. The NOx emission factor of 150 kg/TJ is an expert guess by Umweltbundesamt. Since 2007 the NOx emissions as reported in emissions declarations (http://www.edm.gv.at) have been used for the inventory.
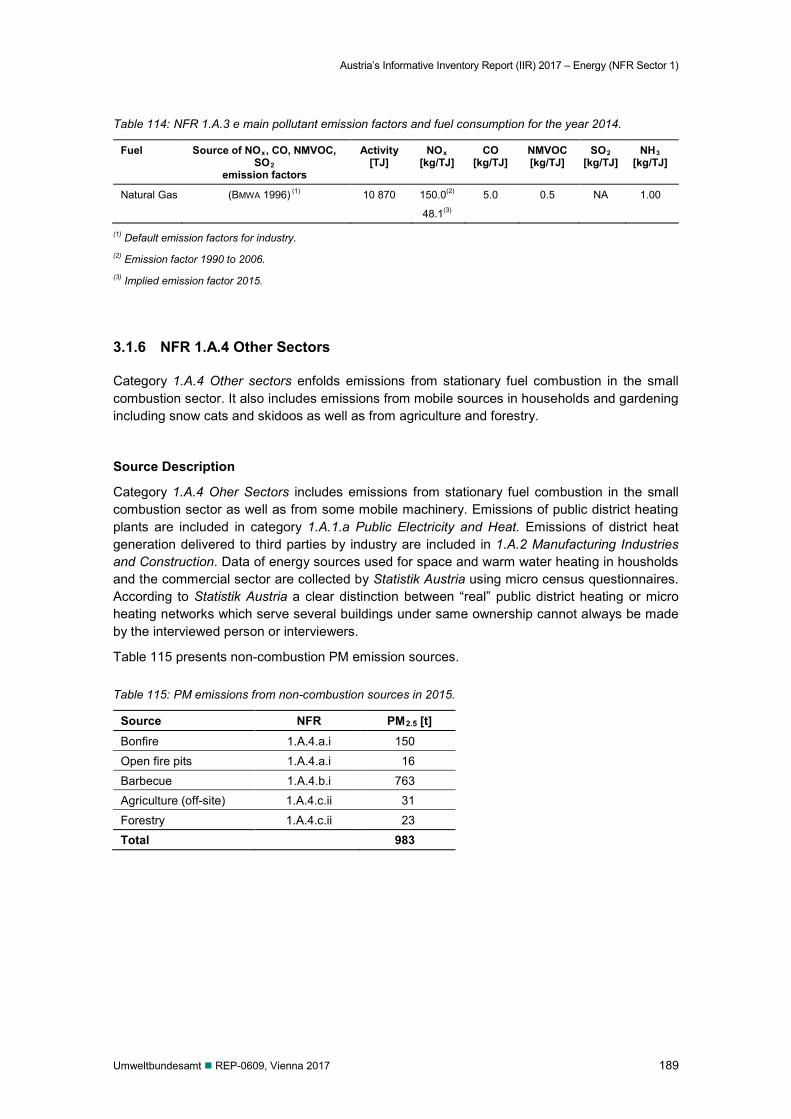
Austria’s Informative Inventory Report (IIR) 2017 – Energy (NFR Sector 1)
Umweltbundesamt REP-0609, Vienna 2017 189
Table 114: NFR 1.A.3 e main pollutant emission factors and fuel consumption for the year 2014.
Fuel Source of NOx, CO, NMVOC, SO2
emission factors
Activity [TJ]
NOx [kg/TJ]
CO [kg/TJ]
NMVOC [kg/TJ]
SO2 [kg/TJ]
NH3 [kg/TJ]
Natural Gas (BMWA 1996) (1) 10 870 150.0(2)
48.1(3)
5.0 0.5 NA 1.00
(1) Default emission factors for industry. (2) Emission factor 1990 to 2006. (3) Implied emission factor 2015.
3.1.6 NFR 1.A.4 Other Sectors
Category 1.A.4 Other sectors enfolds emissions from stationary fuel combustion in the small combustion sector. It also includes emissions from mobile sources in households and gardening including snow cats and skidoos as well as from agriculture and forestry.
Source Description
Category 1.A.4 Oher Sectors includes emissions from stationary fuel combustion in the small combustion sector as well as from some mobile machinery. Emissions of public district heating plants are included in category 1.A.1.a Public Electricity and Heat. Emissions of district heat generation delivered to third parties by industry are included in 1.A.2 Manufacturing Industries and Construction. Data of energy sources used for space and warm water heating in housholds and the commercial sector are collected by Statistik Austria using micro census questionnaires. According to Statistik Austria a clear distinction between “real” public district heating or micro heating networks which serve several buildings under same ownership cannot always be made by the interviewed person or interviewers.
Table 115 presents non-combustion PM emission sources.
Table 115: PM emissions from non-combustion sources in 2015.
Source NFR PM2.5 [t] Bonfire 1.A.4.a.i 150 Open fire pits 1.A.4.a.i 16 Barbecue 1.A.4.b.i 763 Agriculture (off-site) 1.A.4.c.ii 31 Forestry 1.A.4.c.ii 23 Total 983
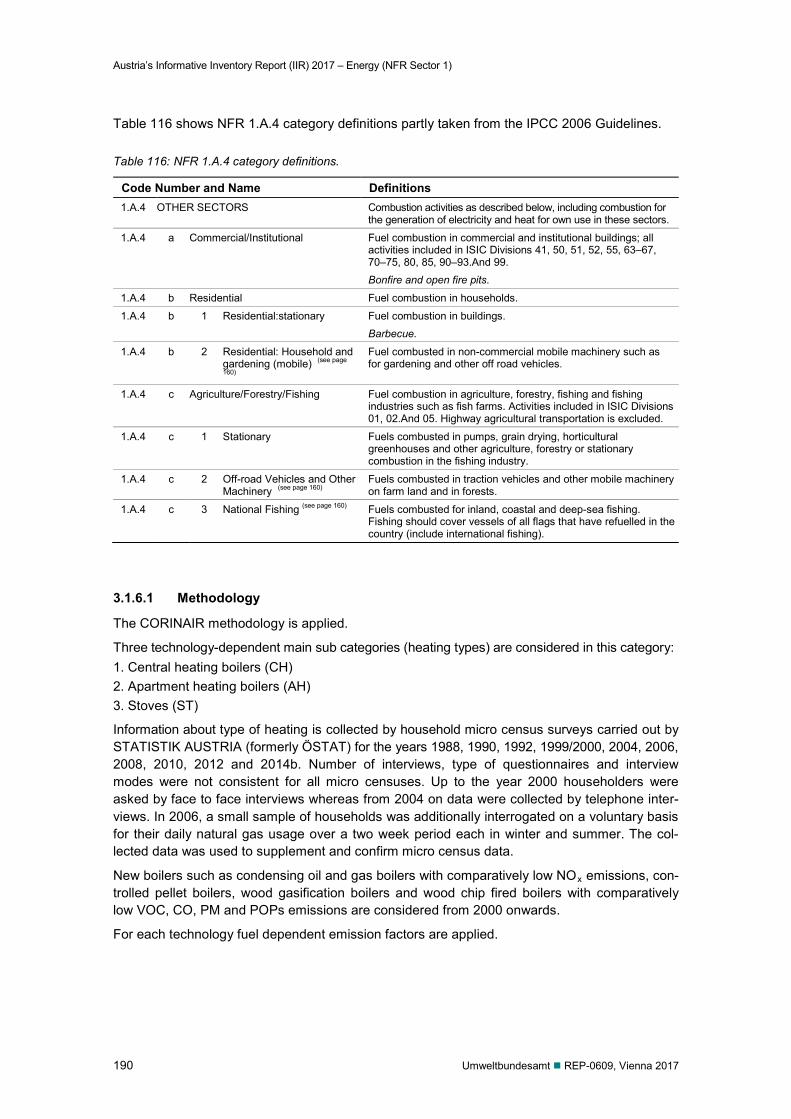
Austria’s Informative Inventory Report (IIR) 2017 – Energy (NFR Sector 1)
190 Umweltbundesamt REP-0609, Vienna 2017
Table 116 shows NFR 1.A.4 category definitions partly taken from the IPCC 2006 Guidelines.
Table 116: NFR 1.A.4 category definitions.
Code Number and Name Definitions 1.A.4 OTHER SECTORS Combustion activities as described below, including combustion for
the generation of electricity and heat for own use in these sectors.
1.A.4 a Commercial/Institutional Fuel combustion in commercial and institutional buildings; all activities included in ISIC Divisions 41, 50, 51, 52, 55, 63–67, 70–75, 80, 85, 90–93.And 99. Bonfire and open fire pits.
1.A.4 b Residential Fuel combustion in households.
1.A.4 b 1 Residential:stationary Fuel combustion in buildings. Barbecue.
1.A.4 b 2 Residential: Household and gardening (mobile) (see page
160)
Fuel combusted in non-commercial mobile machinery such as for gardening and other off road vehicles.
1.A.4 c Agriculture/Forestry/Fishing Fuel combustion in agriculture, forestry, fishing and fishing industries such as fish farms. Activities included in ISIC Divisions 01, 02.And 05. Highway agricultural transportation is excluded.
1.A.4 c 1 Stationary Fuels combusted in pumps, grain drying, horticultural greenhouses and other agriculture, forestry or stationary combustion in the fishing industry.
1.A.4 c 2 Off-road Vehicles and Other Machinery (see page 160)
Fuels combusted in traction vehicles and other mobile machinery on farm land and in forests.
1.A.4 c 3 National Fishing (see page 160) Fuels combusted for inland, coastal and deep-sea fishing. Fishing should cover vessels of all flags that have refuelled in the country (include international fishing).
3.1.6.1 Methodology
The CORINAIR methodology is applied.
Three technology-dependent main sub categories (heating types) are considered in this category: 1. Central heating boilers (CH) 2. Apartment heating boilers (AH) 3. Stoves (ST)
Information about type of heating is collected by household micro census surveys carried out by STATISTIK AUSTRIA (formerly ÖSTAT) for the years 1988, 1990, 1992, 1999/2000, 2004, 2006, 2008, 2010, 2012 and 2014b. Number of interviews, type of questionnaires and interview modes were not consistent for all micro censuses. Up to the year 2000 householders were asked by face to face interviews whereas from 2004 on data were collected by telephone inter-views. In 2006, a small sample of households was additionally interrogated on a voluntary basis for their daily natural gas usage over a two week period each in winter and summer. The col-lected data was used to supplement and confirm micro census data.
New boilers such as condensing oil and gas boilers with comparatively low NOx emissions, con-trolled pellet boilers, wood gasification boilers and wood chip fired boilers with comparatively low VOC, CO, PM and POPs emissions are considered from 2000 onwards.
For each technology fuel dependent emission factors are applied.
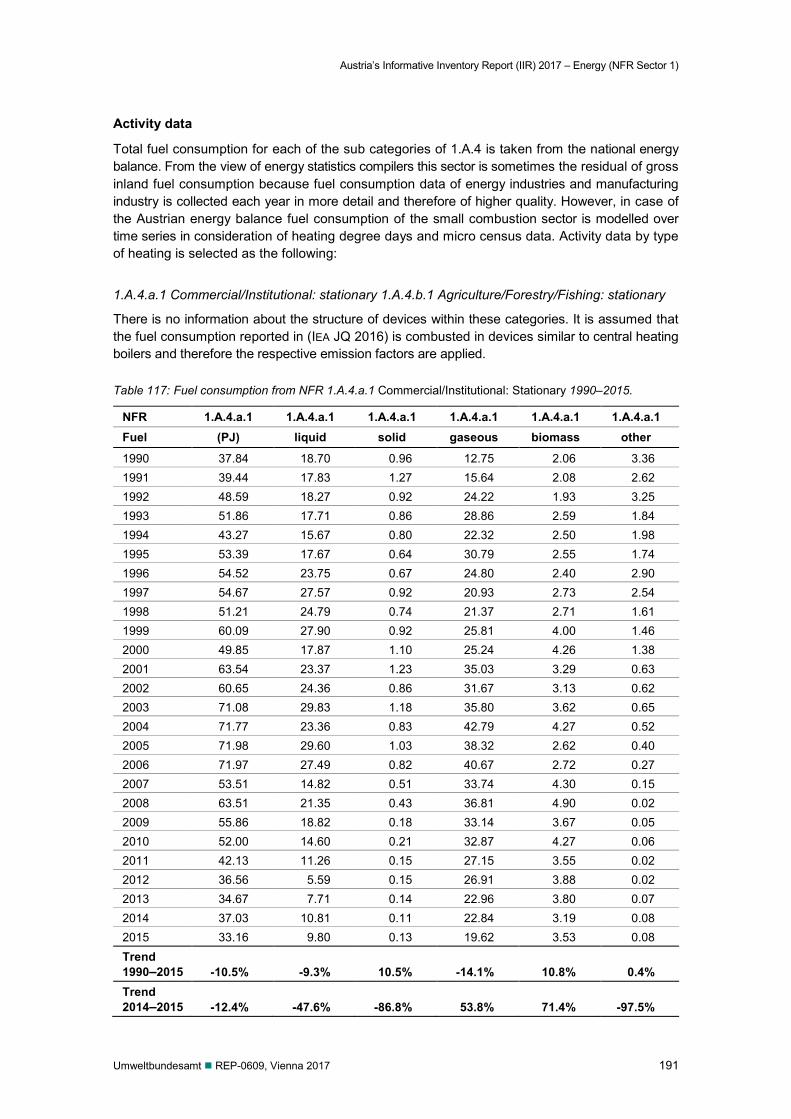
Austria’s Informative Inventory Report (IIR) 2017 – Energy (NFR Sector 1)
Umweltbundesamt REP-0609, Vienna 2017 191
Activity data
Total fuel consumption for each of the sub categories of 1.A.4 is taken from the national energy balance. From the view of energy statistics compilers this sector is sometimes the residual of gross inland fuel consumption because fuel consumption data of energy industries and manufacturing industry is collected each year in more detail and therefore of higher quality. However, in case of the Austrian energy balance fuel consumption of the small combustion sector is modelled over time series in consideration of heating degree days and micro census data. Activity data by type of heating is selected as the following:
1.A.4.a.1 Commercial/Institutional: stationary 1.A.4.b.1 Agriculture/Forestry/Fishing: stationary
There is no information about the structure of devices within these categories. It is assumed that the fuel consumption reported in (IEA JQ 2016) is combusted in devices similar to central heating boilers and therefore the respective emission factors are applied.
Table 117: Fuel consumption from NFR 1.A.4.a.1 Commercial/Institutional: Stationary 1990–2015.
NFR 1.A.4.a.1 1.A.4.a.1 1.A.4.a.1 1.A.4.a.1 1.A.4.a.1 1.A.4.a.1 Fuel (PJ) liquid solid gaseous biomass other
1990 37.84 18.70 0.96 12.75 2.06 3.36 1991 39.44 17.83 1.27 15.64 2.08 2.62 1992 48.59 18.27 0.92 24.22 1.93 3.25 1993 51.86 17.71 0.86 28.86 2.59 1.84 1994 43.27 15.67 0.80 22.32 2.50 1.98 1995 53.39 17.67 0.64 30.79 2.55 1.74 1996 54.52 23.75 0.67 24.80 2.40 2.90 1997 54.67 27.57 0.92 20.93 2.73 2.54 1998 51.21 24.79 0.74 21.37 2.71 1.61 1999 60.09 27.90 0.92 25.81 4.00 1.46 2000 49.85 17.87 1.10 25.24 4.26 1.38 2001 63.54 23.37 1.23 35.03 3.29 0.63 2002 60.65 24.36 0.86 31.67 3.13 0.62 2003 71.08 29.83 1.18 35.80 3.62 0.65 2004 71.77 23.36 0.83 42.79 4.27 0.52 2005 71.98 29.60 1.03 38.32 2.62 0.40 2006 71.97 27.49 0.82 40.67 2.72 0.27 2007 53.51 14.82 0.51 33.74 4.30 0.15 2008 63.51 21.35 0.43 36.81 4.90 0.02 2009 55.86 18.82 0.18 33.14 3.67 0.05 2010 52.00 14.60 0.21 32.87 4.27 0.06 2011 42.13 11.26 0.15 27.15 3.55 0.02 2012 36.56 5.59 0.15 26.91 3.88 0.02 2013 34.67 7.71 0.14 22.96 3.80 0.07 2014 37.03 10.81 0.11 22.84 3.19 0.08 2015 33.16 9.80 0.13 19.62 3.53 0.08 Trend 1990–2015 -10.5% -9.3% 10.5% -14.1% 10.8% 0.4% Trend 2014–2015 -12.4% -47.6% -86.8% 53.8% 71.4% -97.5%
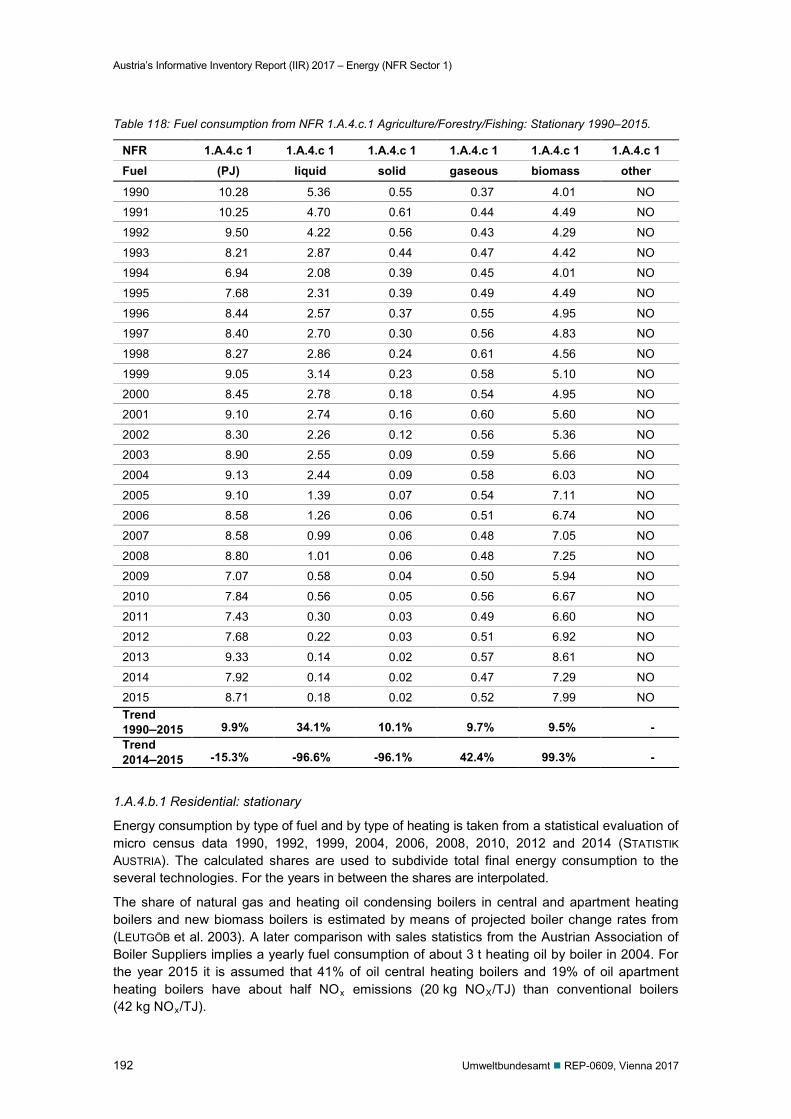
Austria’s Informative Inventory Report (IIR) 2017 – Energy (NFR Sector 1)
192 Umweltbundesamt REP-0609, Vienna 2017
Table 118: Fuel consumption from NFR 1.A.4.c.1 Agriculture/Forestry/Fishing: Stationary 1990–2015.
NFR 1.A.4.c 1 1.A.4.c 1 1.A.4.c 1 1.A.4.c 1 1.A.4.c 1 1.A.4.c 1 Fuel (PJ) liquid solid gaseous biomass other
1990 10.28 5.36 0.55 0.37 4.01 NO
1991 10.25 4.70 0.61 0.44 4.49 NO
1992 9.50 4.22 0.56 0.43 4.29 NO
1993 8.21 2.87 0.44 0.47 4.42 NO
1994 6.94 2.08 0.39 0.45 4.01 NO
1995 7.68 2.31 0.39 0.49 4.49 NO
1996 8.44 2.57 0.37 0.55 4.95 NO
1997 8.40 2.70 0.30 0.56 4.83 NO
1998 8.27 2.86 0.24 0.61 4.56 NO
1999 9.05 3.14 0.23 0.58 5.10 NO
2000 8.45 2.78 0.18 0.54 4.95 NO
2001 9.10 2.74 0.16 0.60 5.60 NO
2002 8.30 2.26 0.12 0.56 5.36 NO
2003 8.90 2.55 0.09 0.59 5.66 NO
2004 9.13 2.44 0.09 0.58 6.03 NO
2005 9.10 1.39 0.07 0.54 7.11 NO
2006 8.58 1.26 0.06 0.51 6.74 NO
2007 8.58 0.99 0.06 0.48 7.05 NO
2008 8.80 1.01 0.06 0.48 7.25 NO
2009 7.07 0.58 0.04 0.50 5.94 NO
2010 7.84 0.56 0.05 0.56 6.67 NO
2011 7.43 0.30 0.03 0.49 6.60 NO
2012 7.68 0.22 0.03 0.51 6.92 NO
2013 9.33 0.14 0.02 0.57 8.61 NO
2014 7.92 0.14 0.02 0.47 7.29 NO
2015 8.71 0.18 0.02 0.52 7.99 NO Trend 1990–2015 9.9% 34.1% 10.1% 9.7% 9.5% - Trend 2014–2015 -15.3% -96.6% -96.1% 42.4% 99.3% -
1.A.4.b.1 Residential: stationary
Energy consumption by type of fuel and by type of heating is taken from a statistical evaluation of micro census data 1990, 1992, 1999, 2004, 2006, 2008, 2010, 2012 and 2014 (STATISTIK AUSTRIA). The calculated shares are used to subdivide total final energy consumption to the several technologies. For the years in between the shares are interpolated.
The share of natural gas and heating oil condensing boilers in central and apartment heating boilers and new biomass boilers is estimated by means of projected boiler change rates from (LEUTGÖB et al. 2003). A later comparison with sales statistics from the Austrian Association of Boiler Suppliers implies a yearly fuel consumption of about 3 t heating oil by boiler in 2004. For the year 2015 it is assumed that 41% of oil central heating boilers and 19% of oil apartment heating boilers have about half NOx emissions (20 kg NOX/TJ) than conventional boilers (42 kg NOx/TJ).
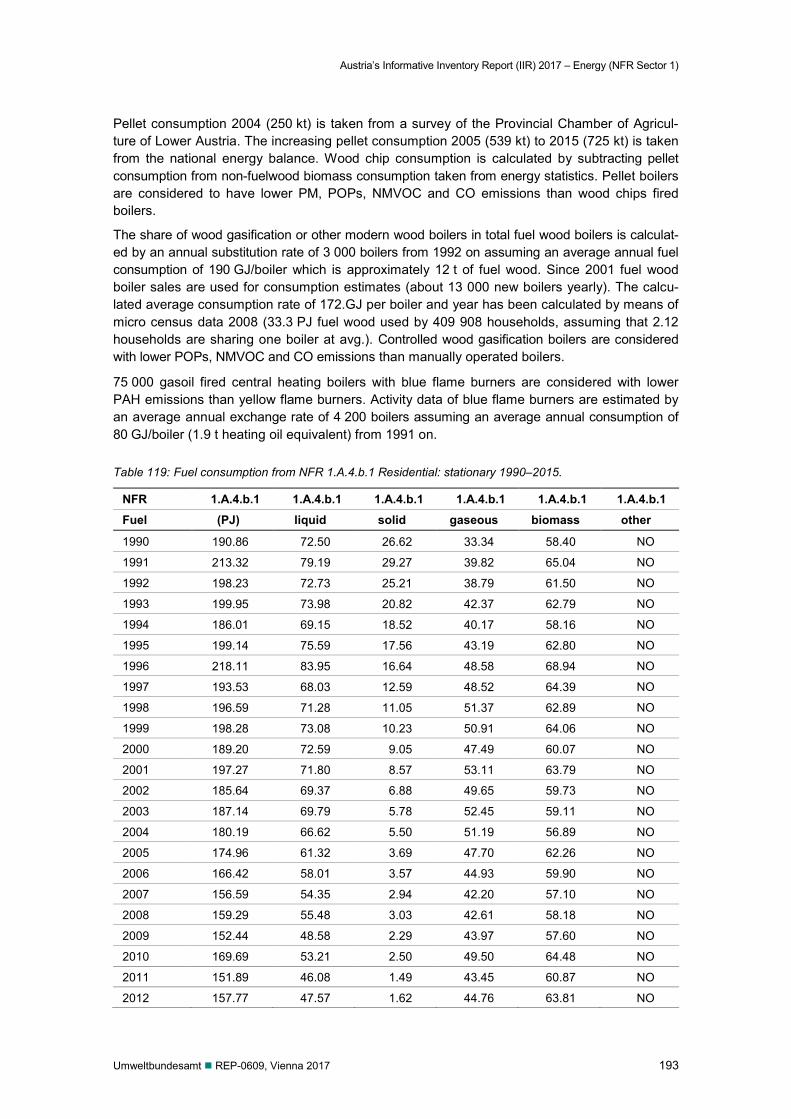
Austria’s Informative Inventory Report (IIR) 2017 – Energy (NFR Sector 1)
Umweltbundesamt REP-0609, Vienna 2017 193
Pellet consumption 2004 (250 kt) is taken from a survey of the Provincial Chamber of Agricul-ture of Lower Austria. The increasing pellet consumption 2005 (539 kt) to 2015 (725 kt) is taken from the national energy balance. Wood chip consumption is calculated by subtracting pellet consumption from non-fuelwood biomass consumption taken from energy statistics. Pellet boilers are considered to have lower PM, POPs, NMVOC and CO emissions than wood chips fired boilers.
The share of wood gasification or other modern wood boilers in total fuel wood boilers is calculat-ed by an annual substitution rate of 3 000 boilers from 1992 on assuming an average annual fuel consumption of 190 GJ/boiler which is approximately 12 t of fuel wood. Since 2001 fuel wood boiler sales are used for consumption estimates (about 13 000 new boilers yearly). The calcu-lated average consumption rate of 172.GJ per boiler and year has been calculated by means of micro census data 2008 (33.3 PJ fuel wood used by 409 908 households, assuming that 2.12 households are sharing one boiler at avg.). Controlled wood gasification boilers are considered with lower POPs, NMVOC and CO emissions than manually operated boilers.
75 000 gasoil fired central heating boilers with blue flame burners are considered with lower PAH emissions than yellow flame burners. Activity data of blue flame burners are estimated by an average annual exchange rate of 4 200 boilers assuming an average annual consumption of 80 GJ/boiler (1.9 t heating oil equivalent) from 1991 on.
Table 119: Fuel consumption from NFR 1.A.4.b.1 Residential: stationary 1990–2015.
NFR 1.A.4.b.1 1.A.4.b.1 1.A.4.b.1 1.A.4.b.1 1.A.4.b.1 1.A.4.b.1 Fuel (PJ) liquid solid gaseous biomass other
1990 190.86 72.50 26.62 33.34 58.40 NO
1991 213.32 79.19 29.27 39.82 65.04 NO
1992 198.23 72.73 25.21 38.79 61.50 NO
1993 199.95 73.98 20.82 42.37 62.79 NO
1994 186.01 69.15 18.52 40.17 58.16 NO
1995 199.14 75.59 17.56 43.19 62.80 NO
1996 218.11 83.95 16.64 48.58 68.94 NO
1997 193.53 68.03 12.59 48.52 64.39 NO
1998 196.59 71.28 11.05 51.37 62.89 NO
1999 198.28 73.08 10.23 50.91 64.06 NO
2000 189.20 72.59 9.05 47.49 60.07 NO
2001 197.27 71.80 8.57 53.11 63.79 NO
2002 185.64 69.37 6.88 49.65 59.73 NO
2003 187.14 69.79 5.78 52.45 59.11 NO
2004 180.19 66.62 5.50 51.19 56.89 NO
2005 174.96 61.32 3.69 47.70 62.26 NO
2006 166.42 58.01 3.57 44.93 59.90 NO
2007 156.59 54.35 2.94 42.20 57.10 NO
2008 159.29 55.48 3.03 42.61 58.18 NO
2009 152.44 48.58 2.29 43.97 57.60 NO
2010 169.69 53.21 2.50 49.50 64.48 NO
2011 151.89 46.08 1.49 43.45 60.87 NO
2012 157.77 47.57 1.62 44.76 63.81 NO
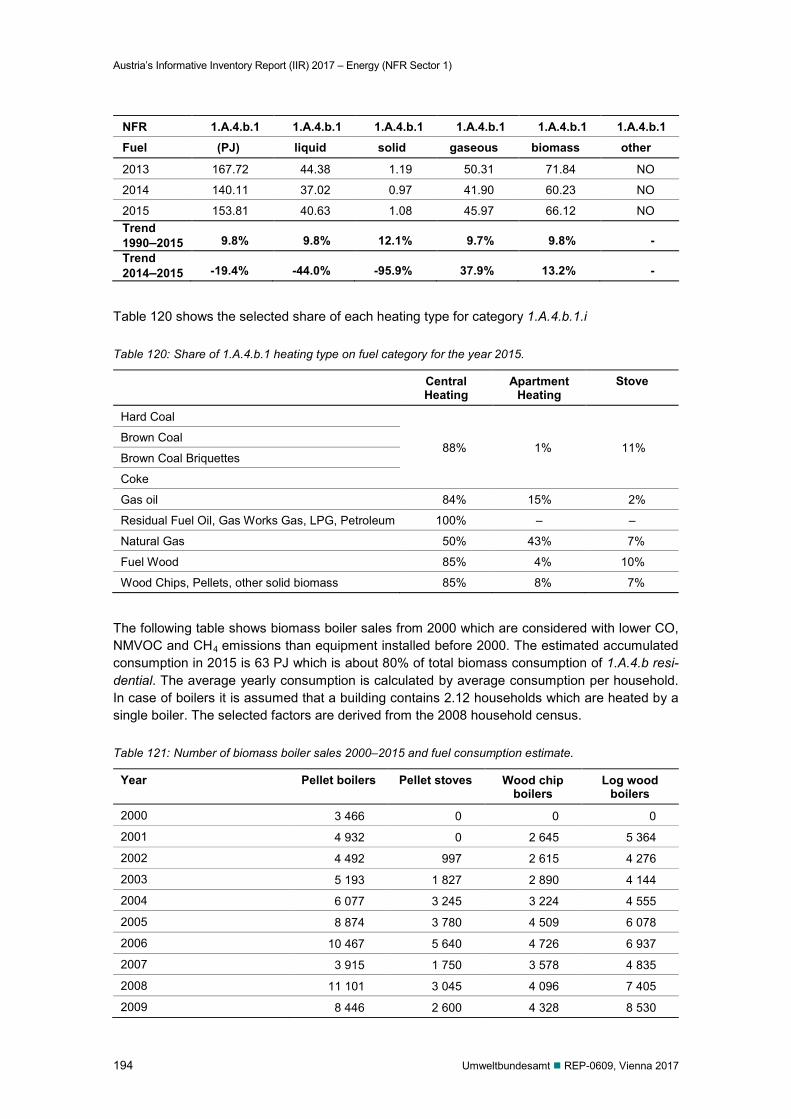
Austria’s Informative Inventory Report (IIR) 2017 – Energy (NFR Sector 1)
194 Umweltbundesamt REP-0609, Vienna 2017
NFR 1.A.4.b.1 1.A.4.b.1 1.A.4.b.1 1.A.4.b.1 1.A.4.b.1 1.A.4.b.1 Fuel (PJ) liquid solid gaseous biomass other
2013 167.72 44.38 1.19 50.31 71.84 NO
2014 140.11 37.02 0.97 41.90 60.23 NO
2015 153.81 40.63 1.08 45.97 66.12 NO Trend 1990–2015 9.8% 9.8% 12.1% 9.7% 9.8% - Trend 2014–2015 -19.4% -44.0% -95.9% 37.9% 13.2% -
Table 120 shows the selected share of each heating type for category 1.A.4.b.1.i
Table 120: Share of 1.A.4.b.1 heating type on fuel category for the year 2015.
Central Heating
Apartment Heating
Stove
Hard Coal
88% 1% 11% Brown Coal
Brown Coal Briquettes
Coke
Gas oil 84% 15% 2%
Residual Fuel Oil, Gas Works Gas, LPG, Petroleum 100% – –
Natural Gas 50% 43% 7%
Fuel Wood 85% 4% 10%
Wood Chips, Pellets, other solid biomass 85% 8% 7%
The following table shows biomass boiler sales from 2000 which are considered with lower CO, NMVOC and CH4 emissions than equipment installed before 2000. The estimated accumulated consumption in 2015 is 63 PJ which is about 80% of total biomass consumption of 1.A.4.b resi-dential. The average yearly consumption is calculated by average consumption per household. In case of boilers it is assumed that a building contains 2.12 households which are heated by a single boiler. The selected factors are derived from the 2008 household census.
Table 121: Number of biomass boiler sales 2000–2015 and fuel consumption estimate.
Year Pellet boilers Pellet stoves Wood chip boilers
Log wood boilers
2000 3 466 0 0 0
2001 4 932 0 2 645 5 364
2002 4 492 997 2 615 4 276
2003 5 193 1 827 2 890 4 144
2004 6 077 3 245 3 224 4 555
2005 8 874 3 780 4 509 6 078
2006 10 467 5 640 4 726 6 937
2007 3 915 1 750 3 578 4 835
2008 11 101 3 045 4 096 7 405
2009 8 446 2 600 4 328 8 530
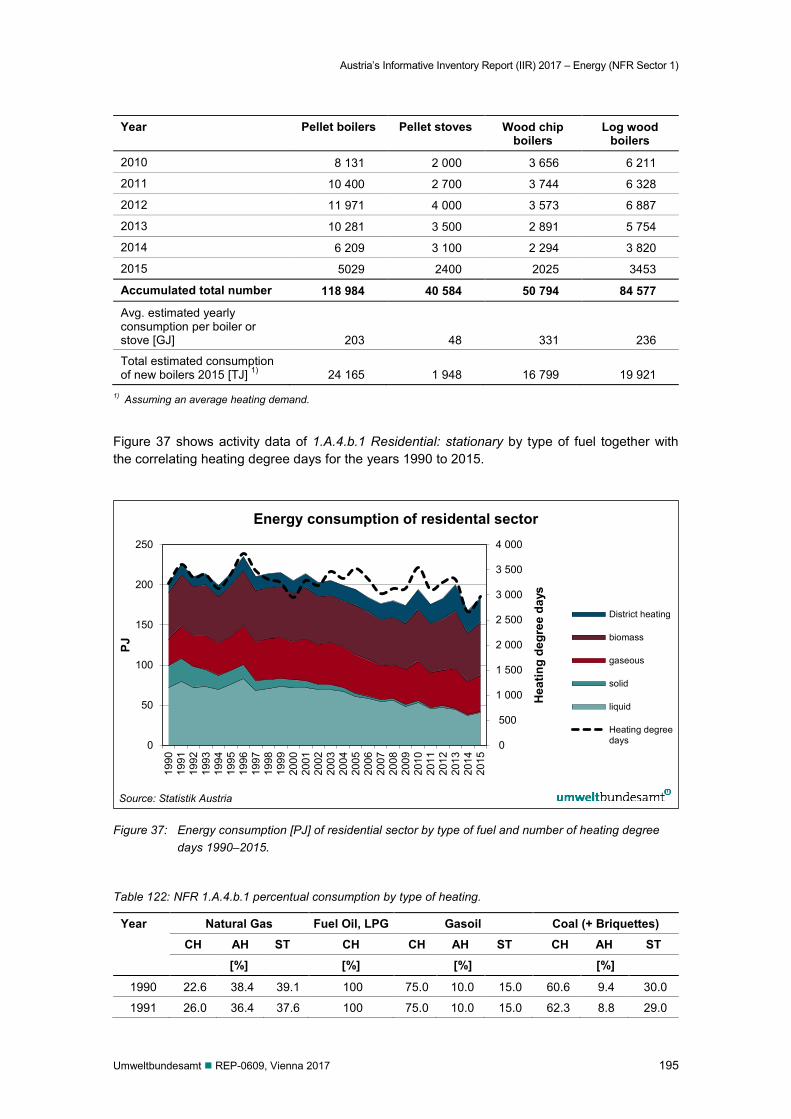
Austria’s Informative Inventory Report (IIR) 2017 – Energy (NFR Sector 1)
Umweltbundesamt REP-0609, Vienna 2017 195
Year Pellet boilers Pellet stoves Wood chip boilers
Log wood boilers
2010 8 131 2 000 3 656 6 211
2011 10 400 2 700 3 744 6 328
2012 11 971 4 000 3 573 6 887
2013 10 281 3 500 2 891 5 754
2014 6 209 3 100 2 294 3 820
2015 5029 2400 2025 3453
Accumulated total number 118 984 40 584 50 794 84 577
Avg. estimated yearly consumption per boiler or stove [GJ] 203 48 331 236
Total estimated consumption of new boilers 2015 [TJ] 1) 24 165 1 948 16 799 19 921
1) Assuming an average heating demand.
Figure 37 shows activity data of 1.A.4.b.1 Residential: stationary by type of fuel together with the correlating heating degree days for the years 1990 to 2015.
Figure 37: Energy consumption [PJ] of residential sector by type of fuel and number of heating degree days 1990–2015.
Table 122: NFR 1.A.4.b.1 percentual consumption by type of heating.
Year Natural Gas Fuel Oil, LPG Gasoil Coal (+ Briquettes) CH AH ST CH CH AH ST CH AH ST [%] [%] [%] [%]
1990 22.6 38.4 39.1 100 75.0 10.0 15.0 60.6 9.4 30.0
1991 26.0 36.4 37.6 100 75.0 10.0 15.0 62.3 8.8 29.0
0
500
1 000
1 500
2 000
2 500
3 000
3 500
4 000
0
50
100
150
200
250
1990
1991
1992
1993
1994
1995
1996
1997
1998
1999
2000
2001
2002
2003
2004
2005
2006
2007
2008
2009
2010
2011
2012
2013
2014
2015
Hea
ting
degr
ee d
ays
PJ
Energy consumption of residental sector
District heating
biomass
gaseous
solid
liquid
Heating degreedays
Source: Statistik Austria
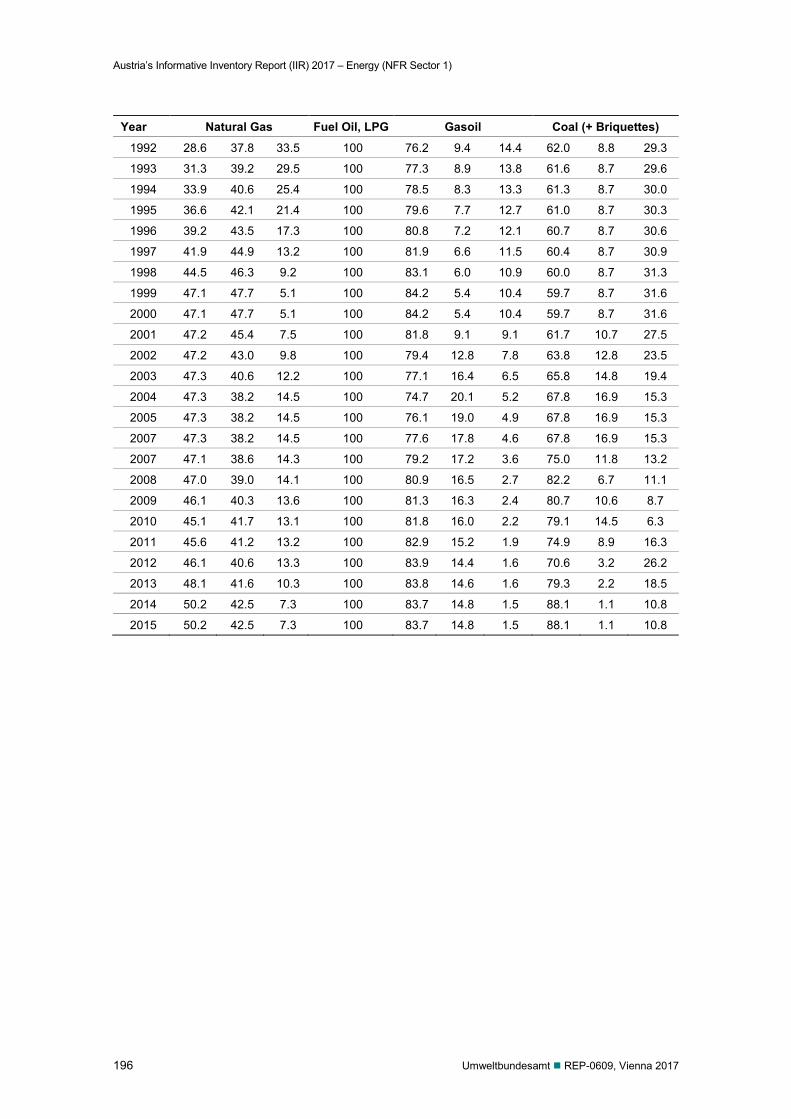
Austria’s Informative Inventory Report (IIR) 2017 – Energy (NFR Sector 1)
196 Umweltbundesamt REP-0609, Vienna 2017
Year Natural Gas Fuel Oil, LPG Gasoil Coal (+ Briquettes)
1992 28.6 37.8 33.5 100 76.2 9.4 14.4 62.0 8.8 29.3
1993 31.3 39.2 29.5 100 77.3 8.9 13.8 61.6 8.7 29.6
1994 33.9 40.6 25.4 100 78.5 8.3 13.3 61.3 8.7 30.0
1995 36.6 42.1 21.4 100 79.6 7.7 12.7 61.0 8.7 30.3
1996 39.2 43.5 17.3 100 80.8 7.2 12.1 60.7 8.7 30.6
1997 41.9 44.9 13.2 100 81.9 6.6 11.5 60.4 8.7 30.9
1998 44.5 46.3 9.2 100 83.1 6.0 10.9 60.0 8.7 31.3
1999 47.1 47.7 5.1 100 84.2 5.4 10.4 59.7 8.7 31.6
2000 47.1 47.7 5.1 100 84.2 5.4 10.4 59.7 8.7 31.6
2001 47.2 45.4 7.5 100 81.8 9.1 9.1 61.7 10.7 27.5
2002 47.2 43.0 9.8 100 79.4 12.8 7.8 63.8 12.8 23.5
2003 47.3 40.6 12.2 100 77.1 16.4 6.5 65.8 14.8 19.4
2004 47.3 38.2 14.5 100 74.7 20.1 5.2 67.8 16.9 15.3
2005 47.3 38.2 14.5 100 76.1 19.0 4.9 67.8 16.9 15.3
2007 47.3 38.2 14.5 100 77.6 17.8 4.6 67.8 16.9 15.3
2007 47.1 38.6 14.3 100 79.2 17.2 3.6 75.0 11.8 13.2
2008 47.0 39.0 14.1 100 80.9 16.5 2.7 82.2 6.7 11.1
2009 46.1 40.3 13.6 100 81.3 16.3 2.4 80.7 10.6 8.7
2010 45.1 41.7 13.1 100 81.8 16.0 2.2 79.1 14.5 6.3
2011 45.6 41.2 13.2 100 82.9 15.2 1.9 74.9 8.9 16.3
2012 46.1 40.6 13.3 100 83.9 14.4 1.6 70.6 3.2 26.2
2013 48.1 41.6 10.3 100 83.8 14.6 1.6 79.3 2.2 18.5
2014 50.2 42.5 7.3 100 83.7 14.8 1.5 88.1 1.1 10.8
2015 50.2 42.5 7.3 100 83.7 14.8 1.5 88.1 1.1 10.8
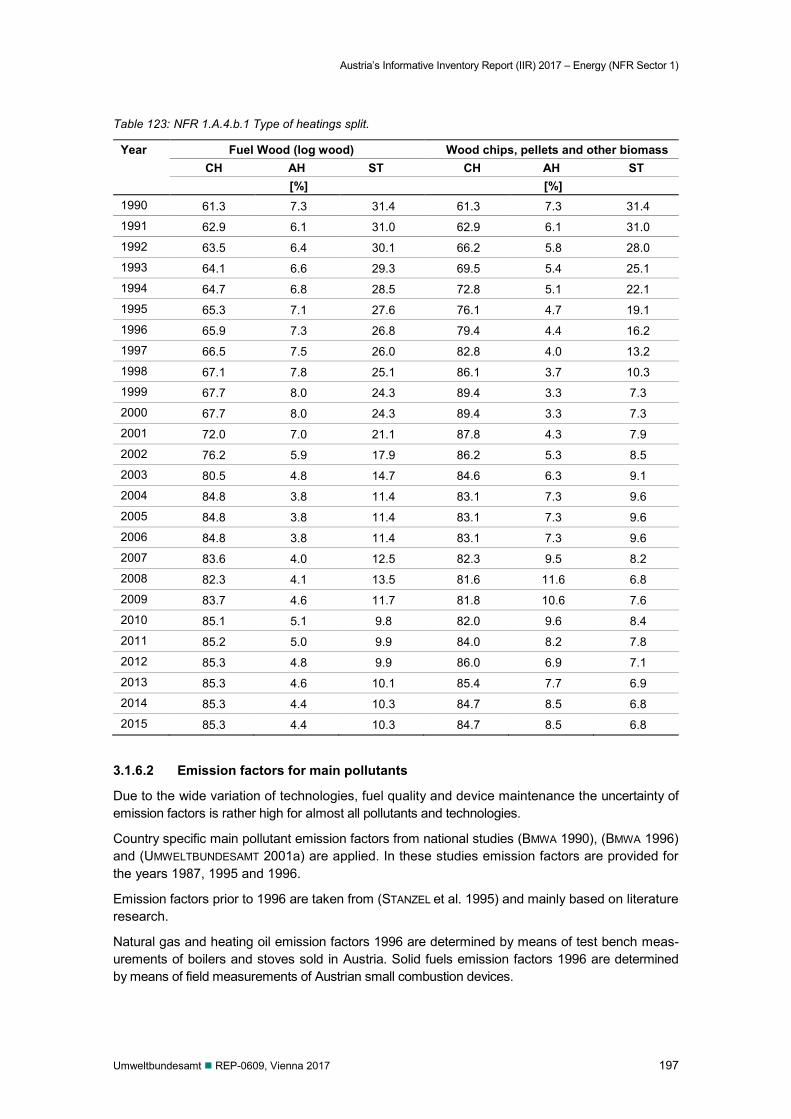
Austria’s Informative Inventory Report (IIR) 2017 – Energy (NFR Sector 1)
Umweltbundesamt REP-0609, Vienna 2017 197
Table 123: NFR 1.A.4.b.1 Type of heatings split.
Year Fuel Wood (log wood) Wood chips, pellets and other biomass CH AH ST CH AH ST
[%] [%] 1990 61.3 7.3 31.4 61.3 7.3 31.4 1991 62.9 6.1 31.0 62.9 6.1 31.0 1992 63.5 6.4 30.1 66.2 5.8 28.0 1993 64.1 6.6 29.3 69.5 5.4 25.1 1994 64.7 6.8 28.5 72.8 5.1 22.1 1995 65.3 7.1 27.6 76.1 4.7 19.1 1996 65.9 7.3 26.8 79.4 4.4 16.2 1997 66.5 7.5 26.0 82.8 4.0 13.2 1998 67.1 7.8 25.1 86.1 3.7 10.3 1999 67.7 8.0 24.3 89.4 3.3 7.3 2000 67.7 8.0 24.3 89.4 3.3 7.3 2001 72.0 7.0 21.1 87.8 4.3 7.9 2002 76.2 5.9 17.9 86.2 5.3 8.5 2003 80.5 4.8 14.7 84.6 6.3 9.1 2004 84.8 3.8 11.4 83.1 7.3 9.6 2005 84.8 3.8 11.4 83.1 7.3 9.6 2006 84.8 3.8 11.4 83.1 7.3 9.6 2007 83.6 4.0 12.5 82.3 9.5 8.2 2008 82.3 4.1 13.5 81.6 11.6 6.8 2009 83.7 4.6 11.7 81.8 10.6 7.6 2010 85.1 5.1 9.8 82.0 9.6 8.4 2011 85.2 5.0 9.9 84.0 8.2 7.8 2012 85.3 4.8 9.9 86.0 6.9 7.1 2013 85.3 4.6 10.1 85.4 7.7 6.9 2014 85.3 4.4 10.3 84.7 8.5 6.8 2015 85.3 4.4 10.3 84.7 8.5 6.8
3.1.6.2 Emission factors for main pollutants
Due to the wide variation of technologies, fuel quality and device maintenance the uncertainty of emission factors is rather high for almost all pollutants and technologies.
Country specific main pollutant emission factors from national studies (BMWA 1990), (BMWA 1996) and (UMWELTBUNDESAMT 2001a) are applied. In these studies emission factors are provided for the years 1987, 1995 and 1996.
Emission factors prior to 1996 are taken from (STANZEL et al. 1995) and mainly based on literature research.
Natural gas and heating oil emission factors 1996 are determined by means of test bench meas-urements of boilers and stoves sold in Austria. Solid fuels emission factors 1996 are determined by means of field measurements of Austrian small combustion devices.
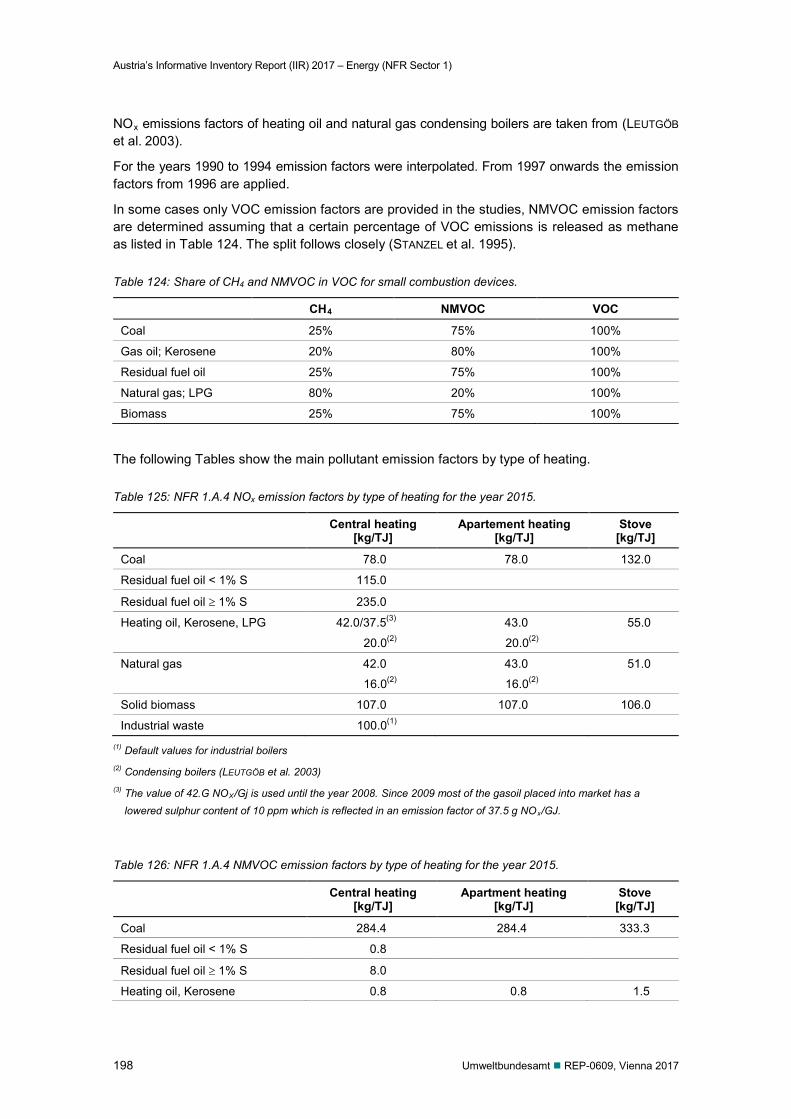
Austria’s Informative Inventory Report (IIR) 2017 – Energy (NFR Sector 1)
198 Umweltbundesamt REP-0609, Vienna 2017
NOx emissions factors of heating oil and natural gas condensing boilers are taken from (LEUTGÖB et al. 2003).
For the years 1990 to 1994 emission factors were interpolated. From 1997 onwards the emission factors from 1996 are applied.
In some cases only VOC emission factors are provided in the studies, NMVOC emission factors are determined assuming that a certain percentage of VOC emissions is released as methane as listed in Table 124. The split follows closely (STANZEL et al. 1995).
Table 124: Share of CH4 and NMVOC in VOC for small combustion devices.
CH4 NMVOC VOC
Coal 25% 75% 100%
Gas oil; Kerosene 20% 80% 100%
Residual fuel oil 25% 75% 100%
Natural gas; LPG 80% 20% 100%
Biomass 25% 75% 100%
The following Tables show the main pollutant emission factors by type of heating.
Table 125: NFR 1.A.4 NOx emission factors by type of heating for the year 2015.
Central heating [kg/TJ]
Apartement heating [kg/TJ]
Stove [kg/TJ]
Coal 78.0 78.0 132.0
Residual fuel oil < 1% S 115.0
Residual fuel oil ≥ 1% S 235.0
Heating oil, Kerosene, LPG 42.0/37.5(3) 43.0 55.0
20.0(2) 20.0(2)
Natural gas 42.0 43.0 51.0
16.0(2) 16.0(2)
Solid biomass 107.0 107.0 106.0
Industrial waste 100.0(1) (1) Default values for industrial boilers (2) Condensing boilers (LEUTGÖB et al. 2003) (3) The value of 42.G NOX/Gj is used until the year 2008. Since 2009 most of the gasoil placed into market has a
lowered sulphur content of 10 ppm which is reflected in an emission factor of 37.5 g NOx/GJ.
Table 126: NFR 1.A.4 NMVOC emission factors by type of heating for the year 2015.
Central heating [kg/TJ]
Apartment heating [kg/TJ]
Stove [kg/TJ]
Coal 284.4 284.4 333.3
Residual fuel oil < 1% S 0.8
Residual fuel oil ≥ 1% S 8.0
Heating oil, Kerosene 0.8 0.8 1.5
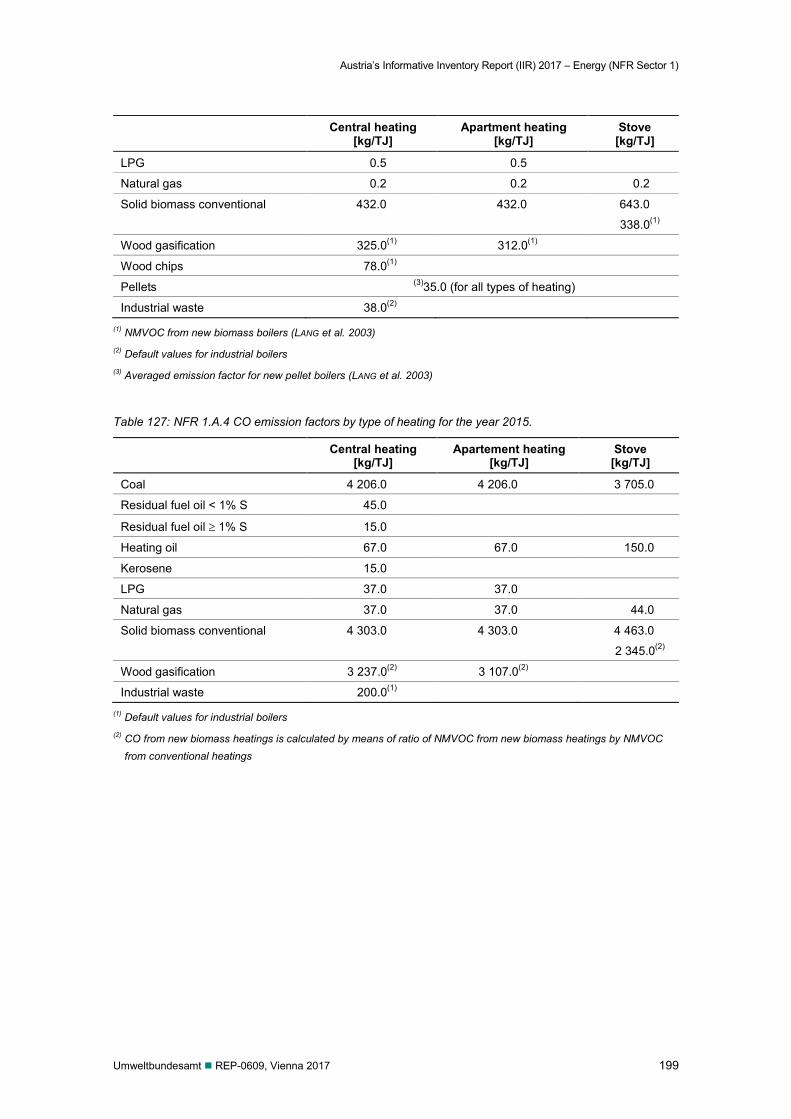
Austria’s Informative Inventory Report (IIR) 2017 – Energy (NFR Sector 1)
Umweltbundesamt REP-0609, Vienna 2017 199
Central heating [kg/TJ]
Apartment heating [kg/TJ]
Stove [kg/TJ]
LPG 0.5 0.5
Natural gas 0.2 0.2 0.2
Solid biomass conventional 432.0 432.0 643.0
338.0(1)
Wood gasification 325.0(1) 312.0(1)
Wood chips 78.0(1)
Pellets (3)35.0 (for all types of heating)
Industrial waste 38.0(2) (1) NMVOC from new biomass boilers (LANG et al. 2003) (2) Default values for industrial boilers (3) Averaged emission factor for new pellet boilers (LANG et al. 2003)
Table 127: NFR 1.A.4 CO emission factors by type of heating for the year 2015.
Central heating [kg/TJ]
Apartement heating [kg/TJ]
Stove [kg/TJ]
Coal 4 206.0 4 206.0 3 705.0
Residual fuel oil < 1% S 45.0
Residual fuel oil ≥ 1% S 15.0
Heating oil 67.0 67.0 150.0
Kerosene 15.0
LPG 37.0 37.0
Natural gas 37.0 37.0 44.0
Solid biomass conventional 4 303.0 4 303.0 4 463.0
2 345.0(2)
Wood gasification 3 237.0(2) 3 107.0(2)
Industrial waste 200.0(1) (1) Default values for industrial boilers (2) CO from new biomass heatings is calculated by means of ratio of NMVOC from new biomass heatings by NMVOC
from conventional heatings
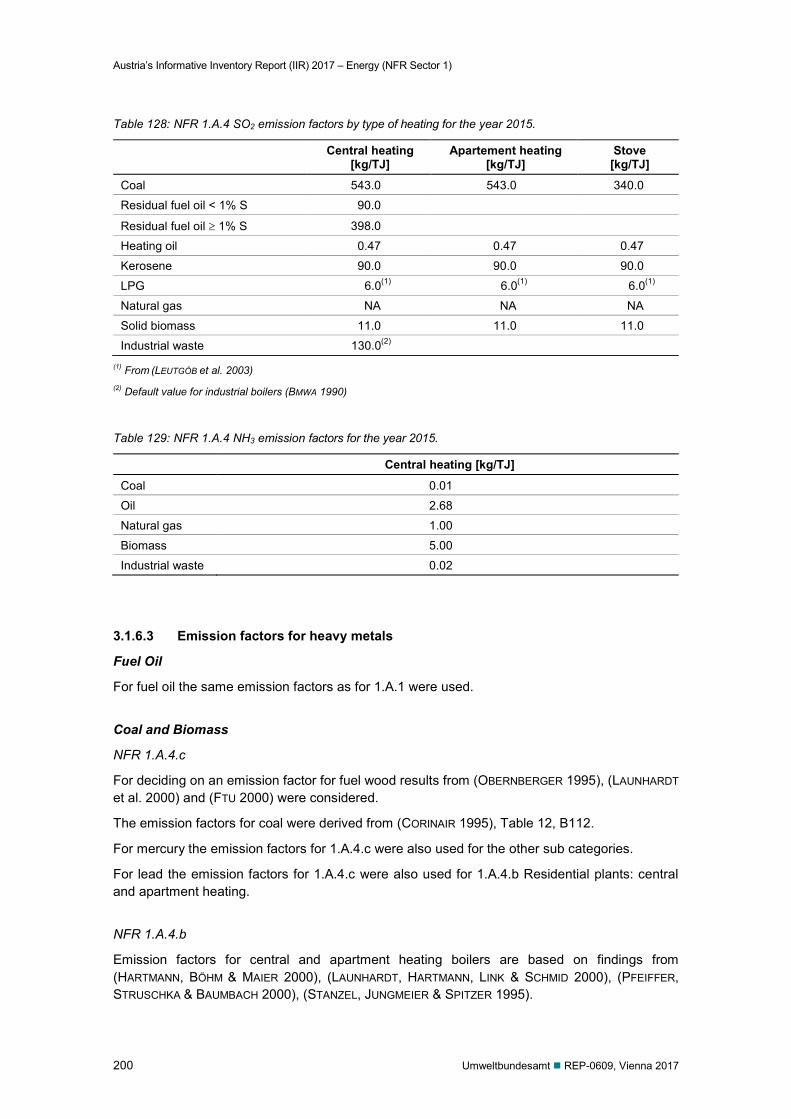
Austria’s Informative Inventory Report (IIR) 2017 – Energy (NFR Sector 1)
200 Umweltbundesamt REP-0609, Vienna 2017
Table 128: NFR 1.A.4 SO2 emission factors by type of heating for the year 2015.
Central heating [kg/TJ]
Apartement heating [kg/TJ]
Stove [kg/TJ]
Coal 543.0 543.0 340.0
Residual fuel oil < 1% S 90.0
Residual fuel oil ≥ 1% S 398.0
Heating oil 0.47 0.47 0.47
Kerosene 90.0 90.0 90.0
LPG 6.0(1) 6.0(1) 6.0(1)
Natural gas NA NA NA
Solid biomass 11.0 11.0 11.0
Industrial waste 130.0(2) (1) From (LEUTGÖB et al. 2003) (2) Default value for industrial boilers (BMWA 1990)
Table 129: NFR 1.A.4 NH3 emission factors for the year 2015.
Central heating [kg/TJ]
Coal 0.01
Oil 2.68
Natural gas 1.00
Biomass 5.00
Industrial waste 0.02
3.1.6.3 Emission factors for heavy metals
Fuel Oil
For fuel oil the same emission factors as for 1.A.1 were used.
Coal and Biomass
NFR 1.A.4.c
For deciding on an emission factor for fuel wood results from (OBERNBERGER 1995), (LAUNHARDT et al. 2000) and (FTU 2000) were considered.
The emission factors for coal were derived from (CORINAIR 1995), Table 12, B112.
For mercury the emission factors for 1.A.4.c were also used for the other sub categories.
For lead the emission factors for 1.A.4.c were also used for 1.A.4.b Residential plants: central and apartment heating.
NFR 1.A.4.b
Emission factors for central and apartment heating boilers are based on findings from (HARTMANN, BÖHM & MAIER 2000), (LAUNHARDT, HARTMANN, LINK & SCHMID 2000), (PFEIFFER, STRUSCHKA & BAUMBACH 2000), (STANZEL, JUNGMEIER & SPITZER 1995).
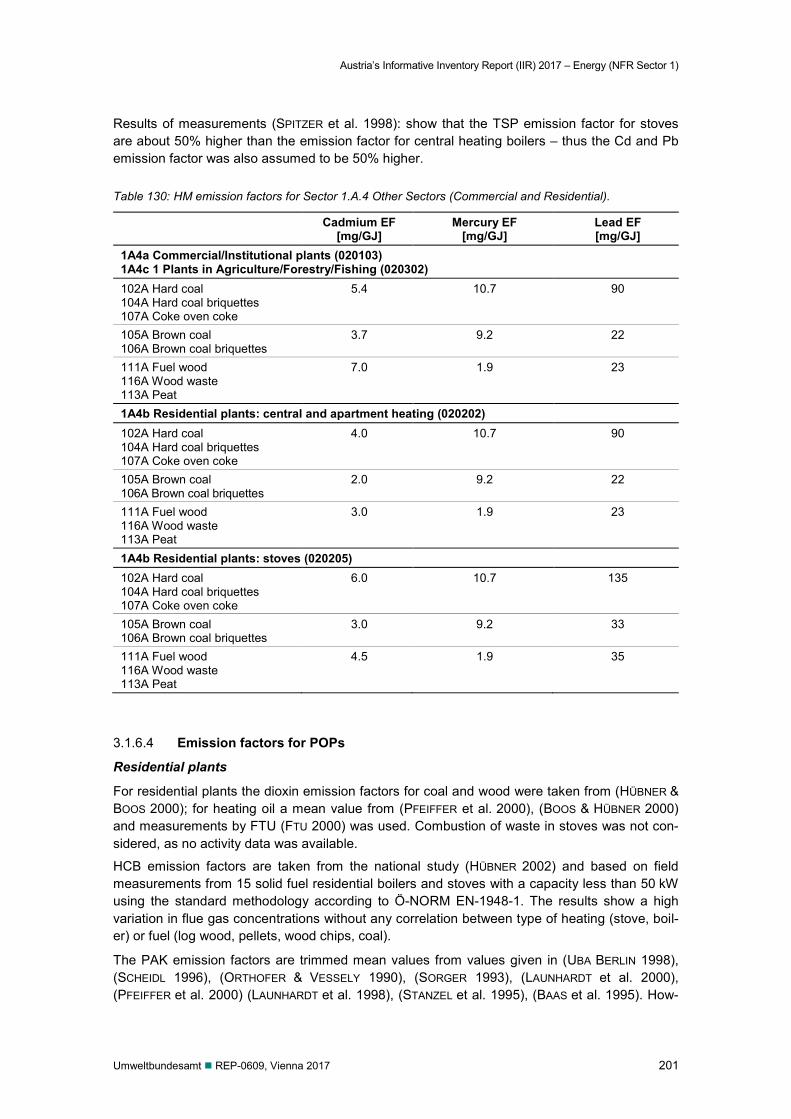
Austria’s Informative Inventory Report (IIR) 2017 – Energy (NFR Sector 1)
Umweltbundesamt REP-0609, Vienna 2017 201
Results of measurements (SPITZER et al. 1998): show that the TSP emission factor for stoves are about 50% higher than the emission factor for central heating boilers – thus the Cd and Pb emission factor was also assumed to be 50% higher.
Table 130: HM emission factors for Sector 1.A.4 Other Sectors (Commercial and Residential).
Cadmium EF [mg/GJ]
Mercury EF [mg/GJ]
Lead EF [mg/GJ]
1A4a Commercial/Institutional plants (020103) 1A4c 1 Plants in Agriculture/Forestry/Fishing (020302) 102A Hard coal 104A Hard coal briquettes 107A Coke oven coke
5.4 10.7 90
105A Brown coal 106A Brown coal briquettes
3.7 9.2 22
111A Fuel wood 116A Wood waste 113A Peat
7.0 1.9 23
1A4b Residential plants: central and apartment heating (020202) 102A Hard coal 104A Hard coal briquettes 107A Coke oven coke
4.0 10.7 90
105A Brown coal 106A Brown coal briquettes
2.0 9.2 22
111A Fuel wood 116A Wood waste 113A Peat
3.0 1.9 23
1A4b Residential plants: stoves (020205) 102A Hard coal 104A Hard coal briquettes 107A Coke oven coke
6.0 10.7 135
105A Brown coal 106A Brown coal briquettes
3.0 9.2 33
111A Fuel wood 116A Wood waste 113A Peat
4.5 1.9 35
3.1.6.4 Emission factors for POPs
Residential plants
For residential plants the dioxin emission factors for coal and wood were taken from (HÜBNER & BOOS 2000); for heating oil a mean value from (PFEIFFER et al. 2000), (BOOS & HÜBNER 2000) and measurements by FTU (FTU 2000) was used. Combustion of waste in stoves was not con-sidered, as no activity data was available.
HCB emission factors are taken from the national study (HÜBNER 2002) and based on field measurements from 15 solid fuel residential boilers and stoves with a capacity less than 50 kW using the standard methodology according to Ö-NORM EN-1948-1. The results show a high variation in flue gas concentrations without any correlation between type of heating (stove, boil-er) or fuel (log wood, pellets, wood chips, coal).
The PAK emission factors are trimmed mean values from values given in (UBA BERLIN 1998), (SCHEIDL 1996), (ORTHOFER & VESSELY 1990), (SORGER 1993), (LAUNHARDT et al. 2000), (PFEIFFER et al. 2000) (LAUNHARDT et al. 1998), (STANZEL et al. 1995), (BAAS et al. 1995). How-
Austria’s Informative Inventory Report (IIR) 2017 – Energy (NFR Sector 1)
202 Umweltbundesamt REP-0609, Vienna 2017
ever, it was not possible to determine different emission factors for stoves and central heating boilers from the values given in the cited literature. Thus for solid fuels the same proportions given from the dioxin EFs, and for oil the proportions of carbon black given in (HÜBNER et al. 1996), was used. For natural gas it was assumed that the values given in literature are valid for stoves and that the values for central heating boilers are assumed to be five times lower.
PCB emission factors have been selected as outlined in chapter 3.1.3.
Commercial and Institutional plants and Plants in Agriculture/Forestry/Fishing
The same emission factors as used for central heating in the residential sector and for small (and medium) plants of category 1.A.2 were used (the share of the different size classes is based on expert judgement). The values given in the following Table are averaged values per fuel category.
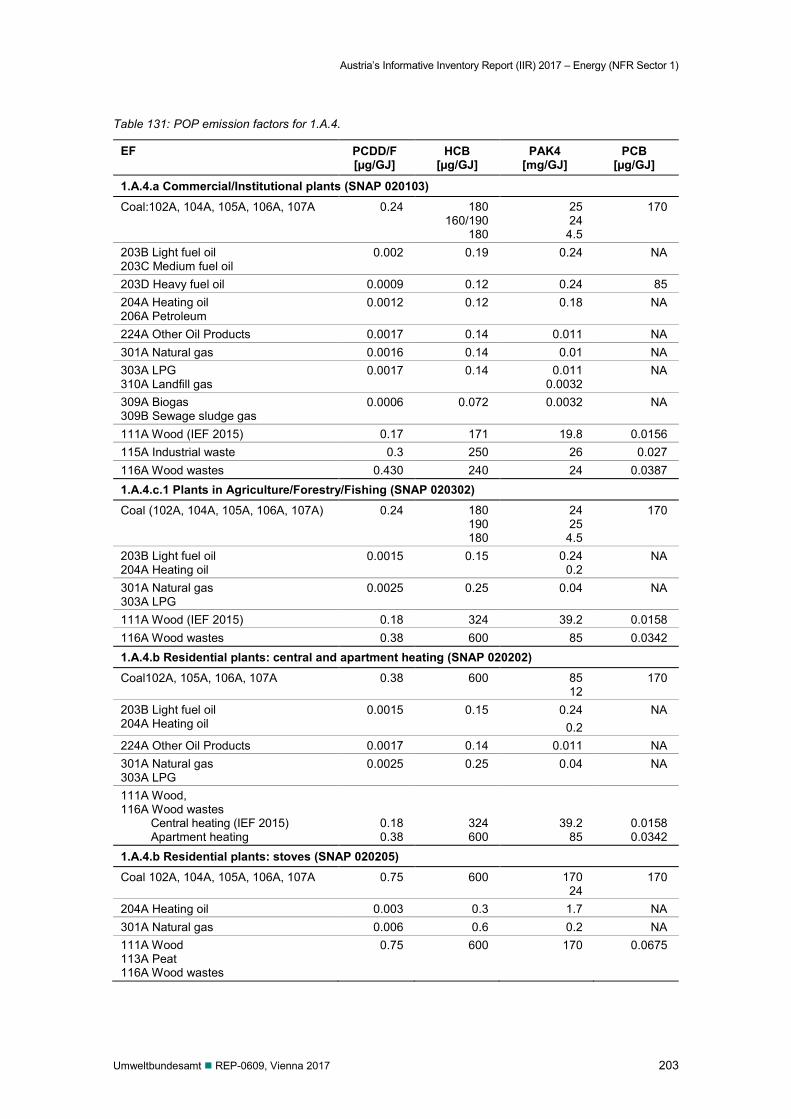
Austria’s Informative Inventory Report (IIR) 2017 – Energy (NFR Sector 1)
Umweltbundesamt REP-0609, Vienna 2017 203
Table 131: POP emission factors for 1.A.4.
EF PCDD/F [µg/GJ]
HCB [µg/GJ]
PAK4 [mg/GJ]
PCB [µg/GJ]
1.A.4.a Commercial/Institutional plants (SNAP 020103) Coal:102A, 104A, 105A, 106A, 107A 0.24 180
160/190 180
25 24
4.5
170
203B Light fuel oil 203C Medium fuel oil
0.002 0.19 0.24 NA
203D Heavy fuel oil 0.0009 0.12 0.24 85 204A Heating oil 206A Petroleum
0.0012 0.12 0.18 NA
224A Other Oil Products 0.0017 0.14 0.011 NA 301A Natural gas 0.0016 0.14 0.01 NA 303A LPG 310A Landfill gas
0.0017 0.14 0.011 0.0032
NA
309A Biogas 309B Sewage sludge gas
0.0006 0.072 0.0032 NA
111A Wood (IEF 2015) 0.17 171 19.8 0.0156 115A Industrial waste 0.3 250 26 0.027 116A Wood wastes 0.430 240 24 0.0387 1.A.4.c.1 Plants in Agriculture/Forestry/Fishing (SNAP 020302) Coal (102A, 104A, 105A, 106A, 107A) 0.24 180
190 180
24 25
4.5
170
203B Light fuel oil 204A Heating oil
0.0015 0.15 0.24 0.2
NA
301A Natural gas 303A LPG
0.0025 0.25 0.04 NA
111A Wood (IEF 2015) 0.18 324 39.2 0.0158 116A Wood wastes 0.38 600 85 0.0342 1.A.4.b Residential plants: central and apartment heating (SNAP 020202) Coal102A, 105A, 106A, 107A 0.38 600 85
12 170
203B Light fuel oil 204A Heating oil
0.0015 0.15 0.24 0.2
NA
224A Other Oil Products 0.0017 0.14 0.011 NA 301A Natural gas 303A LPG
0.0025 0.25 0.04 NA
111A Wood, 116A Wood wastes Central heating (IEF 2015) Apartment heating
0.18 0.38
324 600
39.2 85
0.0158 0.0342
1.A.4.b Residential plants: stoves (SNAP 020205) Coal 102A, 104A, 105A, 106A, 107A 0.75 600 170
24 170
204A Heating oil 0.003 0.3 1.7 NA 301A Natural gas 0.006 0.6 0.2 NA 111A Wood 113A Peat 116A Wood wastes
0.75 600 170 0.0675
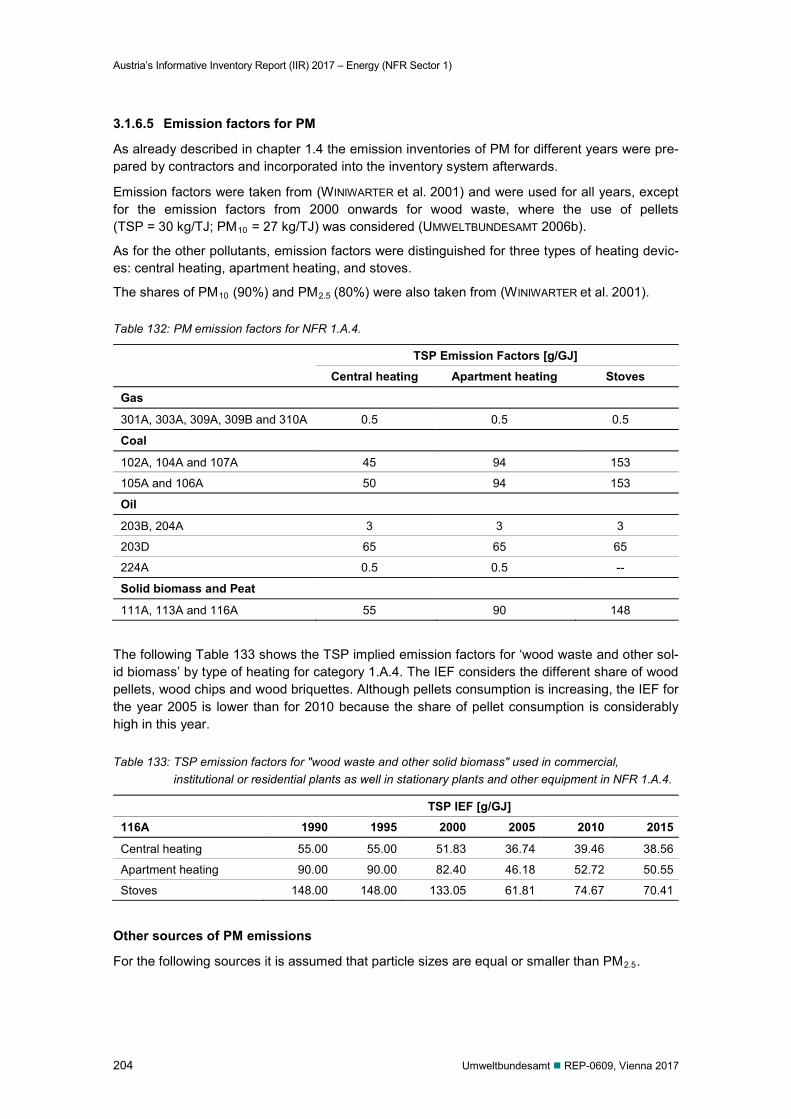
Austria’s Informative Inventory Report (IIR) 2017 – Energy (NFR Sector 1)
204 Umweltbundesamt REP-0609, Vienna 2017
3.1.6.5 Emission factors for PM
As already described in chapter 1.4 the emission inventories of PM for different years were pre-pared by contractors and incorporated into the inventory system afterwards.
Emission factors were taken from (WINIWARTER et al. 2001) and were used for all years, except for the emission factors from 2000 onwards for wood waste, where the use of pellets (TSP = 30 kg/TJ; PM10 = 27 kg/TJ) was considered (UMWELTBUNDESAMT 2006b).
As for the other pollutants, emission factors were distinguished for three types of heating devic-es: central heating, apartment heating, and stoves.
The shares of PM10 (90%) and PM2.5 (80%) were also taken from (WINIWARTER et al. 2001).
Table 132: PM emission factors for NFR 1.A.4.
TSP Emission Factors [g/GJ] Central heating Apartment heating Stoves
Gas
301A, 303A, 309A, 309B and 310A 0.5 0.5 0.5
Coal
102A, 104A and 107A 45 94 153
105A and 106A 50 94 153
Oil
203B, 204A 3 3 3
203D 65 65 65
224A 0.5 0.5 --
Solid biomass and Peat
111A, 113A and 116A 55 90 148
The following Table 133 shows the TSP implied emission factors for ‘wood waste and other sol-id biomass’ by type of heating for category 1.A.4. The IEF considers the different share of wood pellets, wood chips and wood briquettes. Although pellets consumption is increasing, the IEF for the year 2005 is lower than for 2010 because the share of pellet consumption is considerably high in this year.
Table 133: TSP emission factors for "wood waste and other solid biomass" used in commercial, institutional or residential plants as well in stationary plants and other equipment in NFR 1.A.4.
TSP IEF [g/GJ] 116A 1990 1995 2000 2005 2010 2015
Central heating 55.00 55.00 51.83 36.74 39.46 38.56
Apartment heating 90.00 90.00 82.40 46.18 52.72 50.55
Stoves 148.00 148.00 133.05 61.81 74.67 70.41
Other sources of PM emissions
For the following sources it is assumed that particle sizes are equal or smaller than PM2.5.
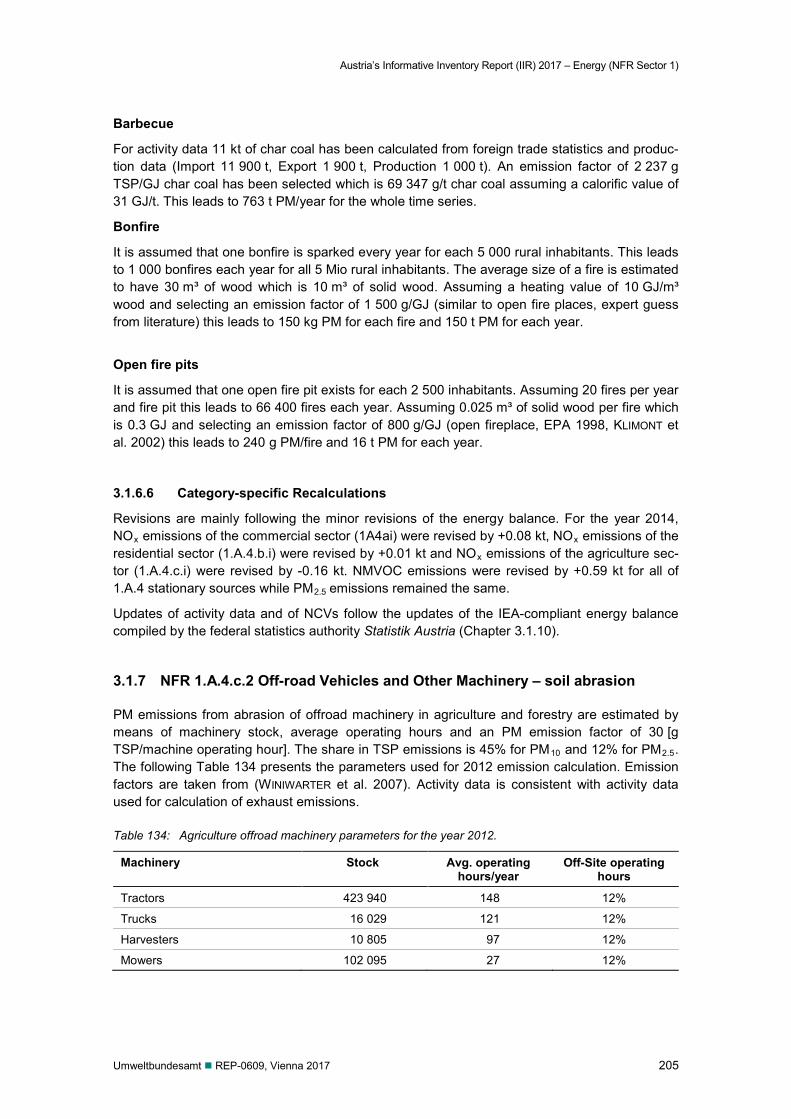
Austria’s Informative Inventory Report (IIR) 2017 – Energy (NFR Sector 1)
Umweltbundesamt REP-0609, Vienna 2017 205
Barbecue
For activity data 11 kt of char coal has been calculated from foreign trade statistics and produc-tion data (Import 11 900 t, Export 1 900 t, Production 1 000 t). An emission factor of 2 237 g TSP/GJ char coal has been selected which is 69 347 g/t char coal assuming a calorific value of 31 GJ/t. This leads to 763 t PM/year for the whole time series.
Bonfire
It is assumed that one bonfire is sparked every year for each 5 000 rural inhabitants. This leads to 1 000 bonfires each year for all 5 Mio rural inhabitants. The average size of a fire is estimated to have 30 m³ of wood which is 10 m³ of solid wood. Assuming a heating value of 10 GJ/m³ wood and selecting an emission factor of 1 500 g/GJ (similar to open fire places, expert guess from literature) this leads to 150 kg PM for each fire and 150 t PM for each year.
Open fire pits
It is assumed that one open fire pit exists for each 2 500 inhabitants. Assuming 20 fires per year and fire pit this leads to 66 400 fires each year. Assuming 0.025 m³ of solid wood per fire which is 0.3 GJ and selecting an emission factor of 800 g/GJ (open fireplace, EPA 1998, KLIMONT et al. 2002) this leads to 240 g PM/fire and 16 t PM for each year.
3.1.6.6 Category-specific Recalculations
Revisions are mainly following the minor revisions of the energy balance. For the year 2014, NOx emissions of the commercial sector (1A4ai) were revised by +0.08 kt, NOx emissions of the residential sector (1.A.4.b.i) were revised by +0.01 kt and NOx emissions of the agriculture sec-tor (1.A.4.c.i) were revised by -0.16 kt. NMVOC emissions were revised by +0.59 kt for all of 1.A.4 stationary sources while PM2.5 emissions remained the same.
Updates of activity data and of NCVs follow the updates of the IEA-compliant energy balance compiled by the federal statistics authority Statistik Austria (Chapter 3.1.10).
3.1.7 NFR 1.A.4.c.2 Off-road Vehicles and Other Machinery – soil abrasion
PM emissions from abrasion of offroad machinery in agriculture and forestry are estimated by means of machinery stock, average operating hours and an PM emission factor of 30 [g TSP/machine operating hour]. The share in TSP emissions is 45% for PM10 and 12% for PM2.5. The following Table 134 presents the parameters used for 2012 emission calculation. Emission factors are taken from (WINIWARTER et al. 2007). Activity data is consistent with activity data used for calculation of exhaust emissions.
Table 134: Agriculture offroad machinery parameters for the year 2012.
Machinery Stock Avg. operating hours/year
Off-Site operating hours
Tractors 423 940 148 12%
Trucks 16 029 121 12%
Harvesters 10 805 97 12%
Mowers 102 095 27 12%
Austria’s Informative Inventory Report (IIR) 2017 – Energy (NFR Sector 1)
206 Umweltbundesamt REP-0609, Vienna 2017
3.1.8 Quality Assurance and Quality Control (QA/QC)
Comparison with EPER and E-PRTR data
Comparison of emissions with reported 2004/2005 EPER and 2007–2015 E-PRTR data does not explicitly identify inconsistencies.
1.A.1.a Activity data and GHG emissions are in general of high quality due to the needs of GHG calcu-lation and CO2-trading. The quality system which is well defined for GHG is basically also ap-plied to non-GHG but is not always fully documented in the inventory system. The following QA/QC procedures are performed depending on resource availability.
1.A.1.a LPS data gap filling (DKDB)
It has to be noted that emissions from DKDB are reported for heating periods from October year(n) to September year(n+1). Due to this and in case of other missing values emissions and fuel consumption for an inventory year are completed by taking the monthly values from the previous inventory year if available. In some cases either activity data or emission data is not complete and gap filling is performed by using other monthly emission ratios of that plant. For boilers with mixed fuel consumption a linear regression model (MS-Excel function “RGP”) is sometimes used.
1.A.1.a LPS data validation (DKDB)
An outcome of the methodology as presented in Table 64 is the ratios of measured and calculat-ed emissions by fuel type. Possible reasons for unexplainable ratios: Default emission factors are not appropriate because the group includes inhomogeneous
boiler technologies. Changed technologies are not reflected. Boilers used for default emission factor derivation are not the consistent with boilers consid-
ered in the inventory approach. Emission declarations are not appropriate (fuel consumption is not consistent with emissions). Activity data of large boilers and other large plants is checked with the national energy balance. For some fuels (coal, residual fuel oil, waste) and categories total national consumption is lim-ited to a few boilers. In this case LPS consumption may be checked with data from Statistik Austria or with the spatial „Bundesländer” energy balance. In some cases published environ-mental reports which are underlying a QA/QC system like EMAS have been used for validation purpose.
1.A.1.b Petroleum refining
Reported fuel consumption is checked with energy balance. Monthly data from DKDB provides emissions by boiler which is cross-checked with reported flue gas concentrations or mandatory limits.
Austria’s Informative Inventory Report (IIR) 2017 – Energy (NFR Sector 1)
Umweltbundesamt REP-0609, Vienna 2017 207
3.1.9 Planned improvements
It is expected to decrease uncertainty of category 1.A.4 emissions significantly if emission factors are developed which are linked to statistical data more accurate. However, CO, NMVOC and TSP emissions of new residential biomass boilers should be updated according to already exist-ing measurements. The current selected emission factors do not accurately consider the im-proved combustion efficiency of modern boilers.
3.1.10 Recalculations
This chapter presents the recalculation difference of fuel combustion activity data with respect to the previous submission.
Activity data has been updated with data from the new edition of the energy balance, affecting emissions of all pollutants.
Revision of the energy balance Gross natural gas consumption has been revised for the years 1999 (+0.7 PJ) and for
2002−2008 (between −0.8 to −5.9 PJ). The revision was due to harmonisation with official to-tal natural gas consumption as published by the Austrian Energy regulator (e-Control). The revision affected the ‘own use’ of the energy sector as well as the ‘final energy consumption’.
For liquid fuels minor revisions were made for the whole time series because of a switch from national energy balance to the Eurostat/IEA dataset which has rounded values. Larger shifts of gasoil between 1.A.4.a and 1.A.4.b categories were carried out for the years 2002–2003 (0.6-0.7 PJ) and 2005–2006 (8.7-4.6 PJ). For the year 2014 about 0.5 PJ of gasoil was shift-ed from manufacturing industries to the residential sector.
For solid fuels minor revisions were made for the years 2002−2014 with the largest change in 2011 (-0.03 PJ).
For ‘other fuels’ the major revision took place for the year 2014 where a shift of ‘industrial waste’ to municipal solid waste’ was reported by energy statistics.
For biomass the major revision took place for the years 2005 and 2007–2014. For NFR 1.A.1.a biomass was revised downwards by -3.2 PJ in the year 2015. For NFR 1.A.4 sub cat-egories biomass was revised downwards for the years 2007-2014 (between -1.1 to -2.6 PJ). For NFR 1.A.2.g.8 biomass was revised downwards by -1 PJ for the year 2013 and by -5.5 PJ for the year 2014.
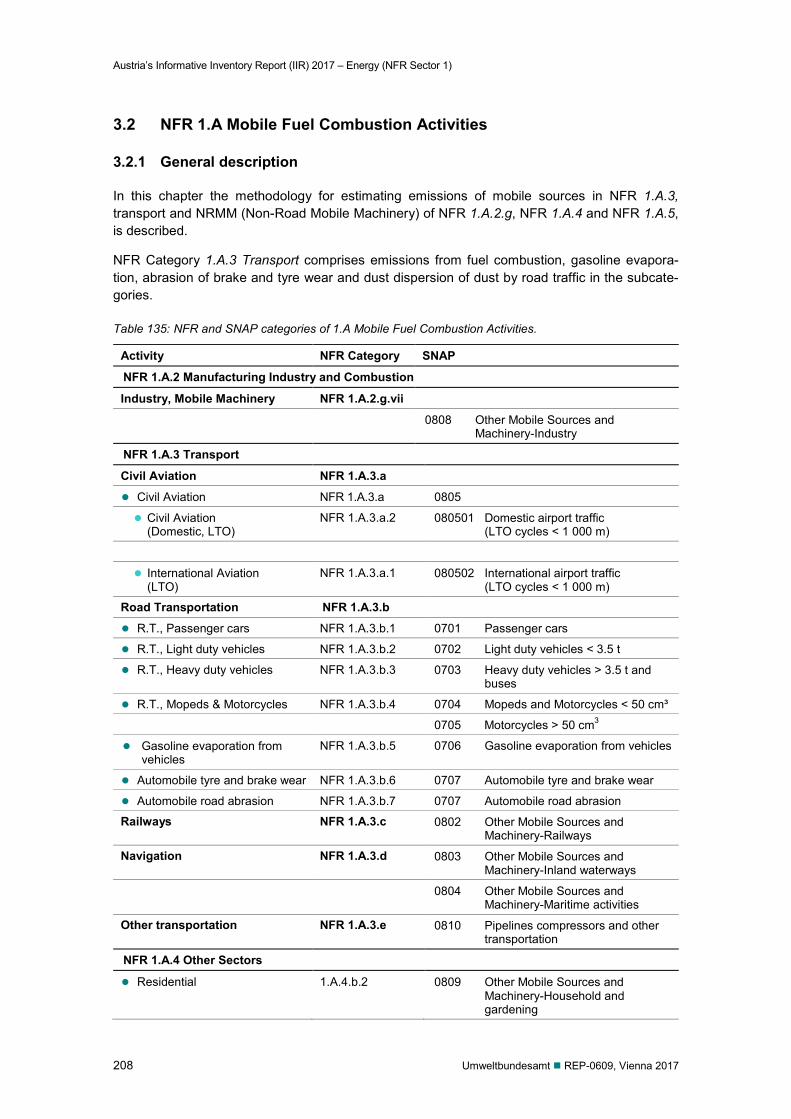
Austria’s Informative Inventory Report (IIR) 2017 – Energy (NFR Sector 1)
208 Umweltbundesamt REP-0609, Vienna 2017
3.2 NFR 1.A Mobile Fuel Combustion Activities
3.2.1 General description
In this chapter the methodology for estimating emissions of mobile sources in NFR 1.A.3, transport and NRMM (Non-Road Mobile Machinery) of NFR 1.A.2.g, NFR 1.A.4 and NFR 1.A.5, is described.
NFR Category 1.A.3 Transport comprises emissions from fuel combustion, gasoline evapora-tion, abrasion of brake and tyre wear and dust dispersion of dust by road traffic in the subcate-gories.
Table 135: NFR and SNAP categories of 1.A Mobile Fuel Combustion Activities.
Activity NFR Category SNAP
NFR 1.A.2 Manufacturing Industry and Combustion
Industry, Mobile Machinery NFR 1.A.2.g.vii
0808 Other Mobile Sources and Machinery-Industry
NFR 1.A.3 Transport
Civil Aviation NFR 1.A.3.a
Civil Aviation NFR 1.A.3.a 0805
Civil Aviation (Domestic, LTO)
NFR 1.A.3.a.2 080501 Domestic airport traffic (LTO cycles < 1 000 m)
International Aviation (LTO)
NFR 1.A.3.a.1 080502 International airport traffic (LTO cycles < 1 000 m)
Road Transportation NFR 1.A.3.b
R.T., Passenger cars NFR 1.A.3.b.1 0701 Passenger cars
R.T., Light duty vehicles NFR 1.A.3.b.2 0702 Light duty vehicles < 3.5 t
R.T., Heavy duty vehicles NFR 1.A.3.b.3 0703 Heavy duty vehicles > 3.5 t and buses
R.T., Mopeds & Motorcycles NFR 1.A.3.b.4 0704 Mopeds and Motorcycles < 50 cm³
0705 Motorcycles > 50 cm3
Gasoline evaporation from vehicles
NFR 1.A.3.b.5 0706 Gasoline evaporation from vehicles
Automobile tyre and brake wear NFR 1.A.3.b.6 0707 Automobile tyre and brake wear
Automobile road abrasion NFR 1.A.3.b.7 0707 Automobile road abrasion
Railways NFR 1.A.3.c 0802 Other Mobile Sources and Machinery-Railways
Navigation NFR 1.A.3.d 0803 Other Mobile Sources and Machinery-Inland waterways
0804 Other Mobile Sources and Machinery-Maritime activities
Other transportation NFR 1.A.3.e 0810 Pipelines compressors and other transportation
NFR 1.A.4 Other Sectors
Residential 1.A.4.b.2 0809 Other Mobile Sources and Machinery-Household and gardening
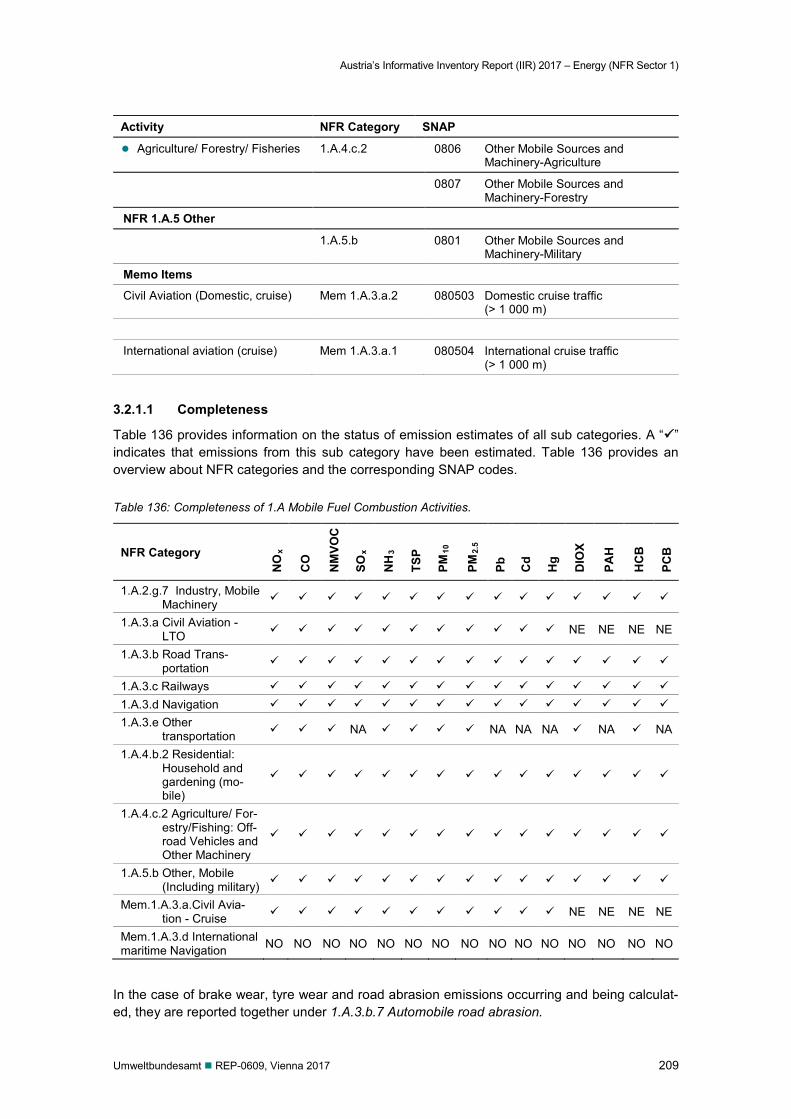
Austria’s Informative Inventory Report (IIR) 2017 – Energy (NFR Sector 1)
Umweltbundesamt REP-0609, Vienna 2017 209
Activity NFR Category SNAP
Agriculture/ Forestry/ Fisheries 1.A.4.c.2 0806 Other Mobile Sources and Machinery-Agriculture
0807 Other Mobile Sources and Machinery-Forestry
NFR 1.A.5 Other 1.A.5.b 0801 Other Mobile Sources and
Machinery-Military
Memo Items
Civil Aviation (Domestic, cruise) Mem 1.A.3.a.2 080503 Domestic cruise traffic (> 1 000 m)
International aviation (cruise) Mem 1.A.3.a.1 080504 International cruise traffic (> 1 000 m)
3.2.1.1 Completeness
Table 136 provides information on the status of emission estimates of all sub categories. A “” indicates that emissions from this sub category have been estimated. Table 136 provides an overview about NFR categories and the corresponding SNAP codes.
Table 136: Completeness of 1.A Mobile Fuel Combustion Activities.
NFR Category
NO
x
CO
NM
VOC
SOx
NH
3
TSP
PM10
PM2.
5
Pb
Cd
Hg
DIO
X
PAH
HC
B
PCB
1.A.2.g.7 Industry, Mobile Machinery
1.A.3.a Civil Aviation - LTO NE NE NE NE
1.A.3.b Road Trans- portation
1.A.3.c Railways 1.A.3.d Navigation 1.A.3.e Other
transportation NA NA NA NA NA NA
1.A.4.b.2 Residential: Household and gardening (mo-bile)
1.A.4.c.2 Agriculture/ For-estry/Fishing: Off-road Vehicles and Other Machinery
1.A.5.b Other, Mobile (Including military)
Mem.1.A.3.a.Civil Avia-tion - Cruise NE NE NE NE
Mem.1.A.3.d International maritime Navigation NO NO NO NO NO NO NO NO NO NO NO NO NO NO NO
In the case of brake wear, tyre wear and road abrasion emissions occurring and being calculat-ed, they are reported together under 1.A.3.b.7 Automobile road abrasion.
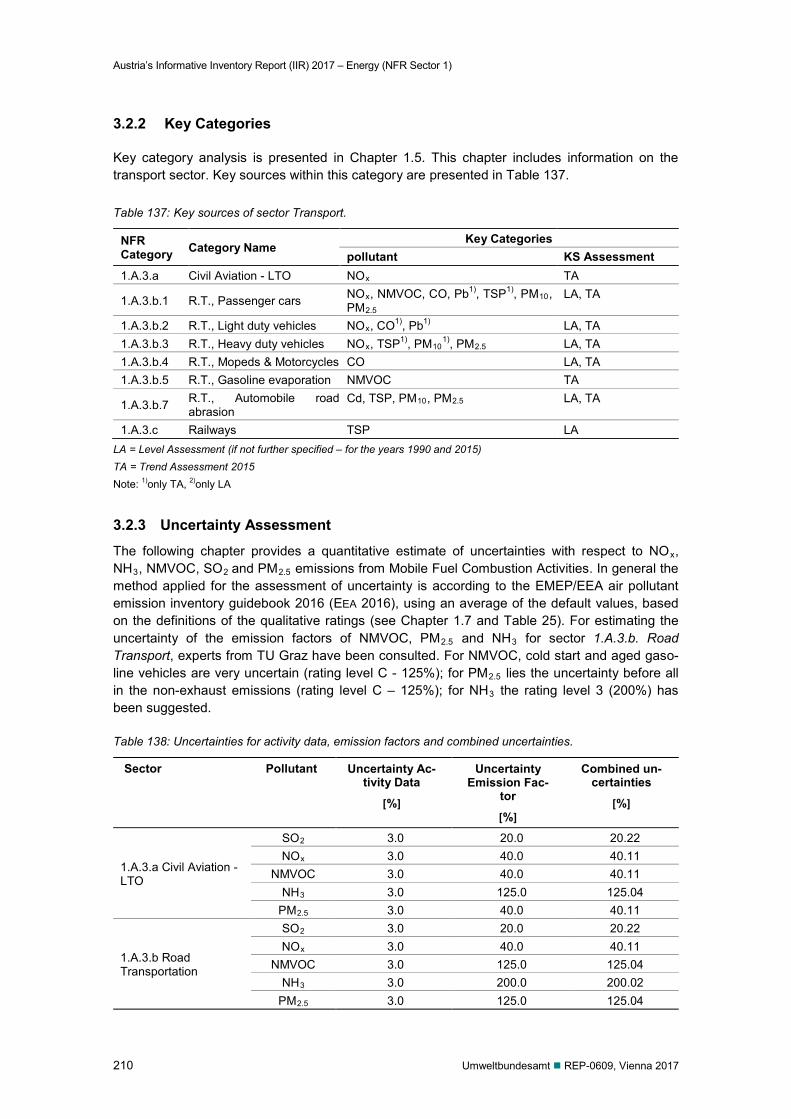
Austria’s Informative Inventory Report (IIR) 2017 – Energy (NFR Sector 1)
210 Umweltbundesamt REP-0609, Vienna 2017
3.2.2 Key Categories
Key category analysis is presented in Chapter 1.5. This chapter includes information on the transport sector. Key sources within this category are presented in Table 137.
Table 137: Key sources of sector Transport.
NFR Category Category Name
Key Categories pollutant KS Assessment
1.A.3.a Civil Aviation - LTO NOx TA
1.A.3.b.1 R.T., Passenger cars NOx, NMVOC, CO, Pb1), TSP1), PM10, PM2.5
LA, TA
1.A.3.b.2 R.T., Light duty vehicles NOx, CO1), Pb1) LA, TA 1.A.3.b.3 R.T., Heavy duty vehicles NOx, TSP1), PM10
1), PM2.5 LA, TA 1.A.3.b.4 R.T., Mopeds & Motorcycles CO LA, TA 1.A.3.b.5 R.T., Gasoline evaporation NMVOC TA
1.A.3.b.7 R.T., Automobile road abrasion
Cd, TSP, PM10, PM2.5 LA, TA
1.A.3.c Railways TSP LA LA = Level Assessment (if not further specified – for the years 1990 and 2015) TA = Trend Assessment 2015 Note: 1)only TA, 2)only LA
3.2.3 Uncertainty Assessment The following chapter provides a quantitative estimate of uncertainties with respect to NOx, NH3, NMVOC, SO2 and PM2.5 emissions from Mobile Fuel Combustion Activities. In general the method applied for the assessment of uncertainty is according to the EMEP/EEA air pollutant emission inventory guidebook 2016 (EEA 2016), using an average of the default values, based on the definitions of the qualitative ratings (see Chapter 1.7 and Table 25). For estimating the uncertainty of the emission factors of NMVOC, PM2.5 and NH3 for sector 1.A.3.b. Road Transport, experts from TU Graz have been consulted. For NMVOC, cold start and aged gaso-line vehicles are very uncertain (rating level C - 125%); for PM2.5 lies the uncertainty before all in the non-exhaust emissions (rating level C – 125%); for NH3 the rating level 3 (200%) has been suggested.
Table 138: Uncertainties for activity data, emission factors and combined uncertainties.
Sector Pollutant Uncertainty Ac-tivity Data
[%]
Uncertainty Emission Fac-
tor
[%]
Combined un-certainties
[%]
1.A.3.a Civil Aviation - LTO
SO2 3.0 20.0 20.22 NOx 3.0 40.0 40.11
NMVOC 3.0 40.0 40.11 NH3 3.0 125.0 125.04
PM2.5 3.0 40.0 40.11
1.A.3.b Road Transportation
SO2 3.0 20.0 20.22 NOx 3.0 40.0 40.11
NMVOC 3.0 125.0 125.04 NH3 3.0 200.0 200.02
PM2.5 3.0 125.0 125.04
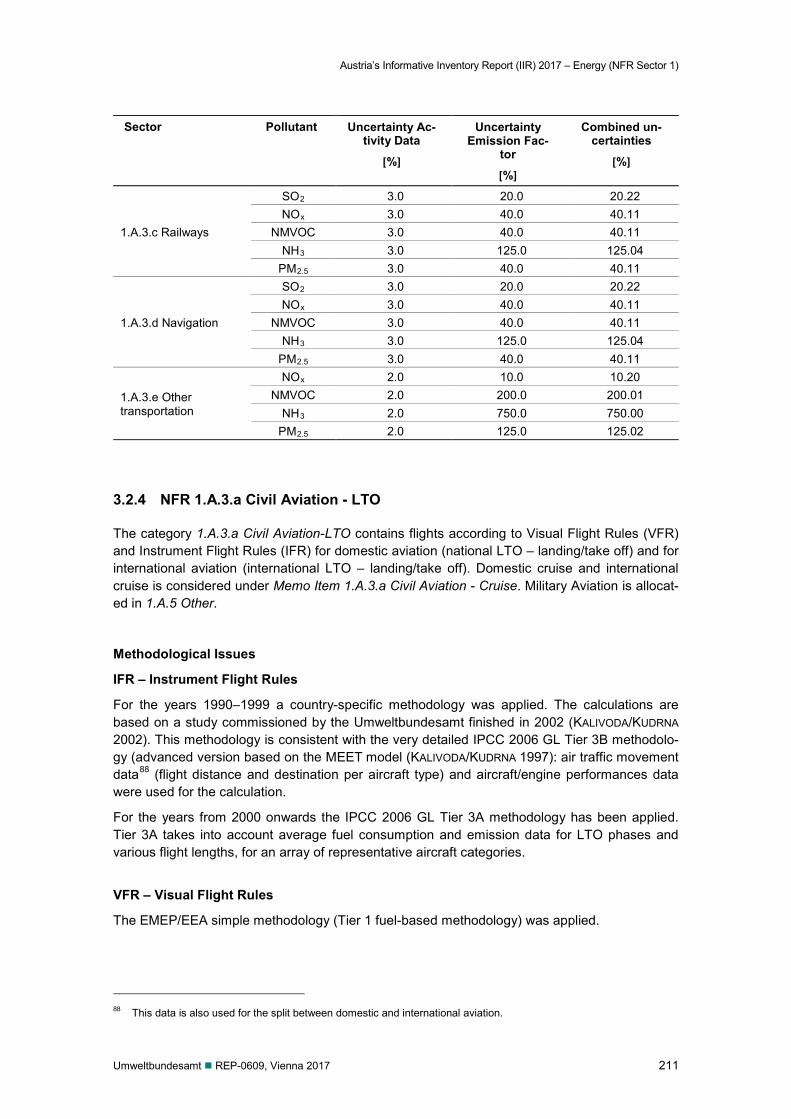
Austria’s Informative Inventory Report (IIR) 2017 – Energy (NFR Sector 1)
Umweltbundesamt REP-0609, Vienna 2017 211
Sector Pollutant Uncertainty Ac-tivity Data
[%]
Uncertainty Emission Fac-
tor
[%]
Combined un-certainties
[%]
1.A.3.c Railways
SO2 3.0 20.0 20.22 NOx 3.0 40.0 40.11
NMVOC 3.0 40.0 40.11 NH3 3.0 125.0 125.04
PM2.5 3.0 40.0 40.11
1.A.3.d Navigation
SO2 3.0 20.0 20.22 NOx 3.0 40.0 40.11
NMVOC 3.0 40.0 40.11 NH3 3.0 125.0 125.04
PM2.5 3.0 40.0 40.11
1.A.3.e Other transportation
NOx 2.0 10.0 10.20 NMVOC 2.0 200.0 200.01
NH3 2.0 750.0 750.00 PM2.5 2.0 125.0 125.02
3.2.4 NFR 1.A.3.a Civil Aviation - LTO
The category 1.A.3.a Civil Aviation-LTO contains flights according to Visual Flight Rules (VFR) and Instrument Flight Rules (IFR) for domestic aviation (national LTO – landing/take off) and for international aviation (international LTO – landing/take off). Domestic cruise and international cruise is considered under Memo Item 1.A.3.a Civil Aviation - Cruise. Military Aviation is allocat-ed in 1.A.5 Other.
Methodological Issues
IFR – Instrument Flight Rules
For the years 1990–1999 a country-specific methodology was applied. The calculations are based on a study commissioned by the Umweltbundesamt finished in 2002 (KALIVODA/KUDRNA 2002). This methodology is consistent with the very detailed IPCC 2006 GL Tier 3B methodolo-gy (advanced version based on the MEET model (KALIVODA/KUDRNA 1997): air traffic movement data88 (flight distance and destination per aircraft type) and aircraft/engine performances data were used for the calculation.
For the years from 2000 onwards the IPCC 2006 GL Tier 3A methodology has been applied. Tier 3A takes into account average fuel consumption and emission data for LTO phases and various flight lengths, for an array of representative aircraft categories.
VFR – Visual Flight Rules
The EMEP/EEA simple methodology (Tier 1 fuel-based methodology) was applied.
88 This data is also used for the split between domestic and international aviation.
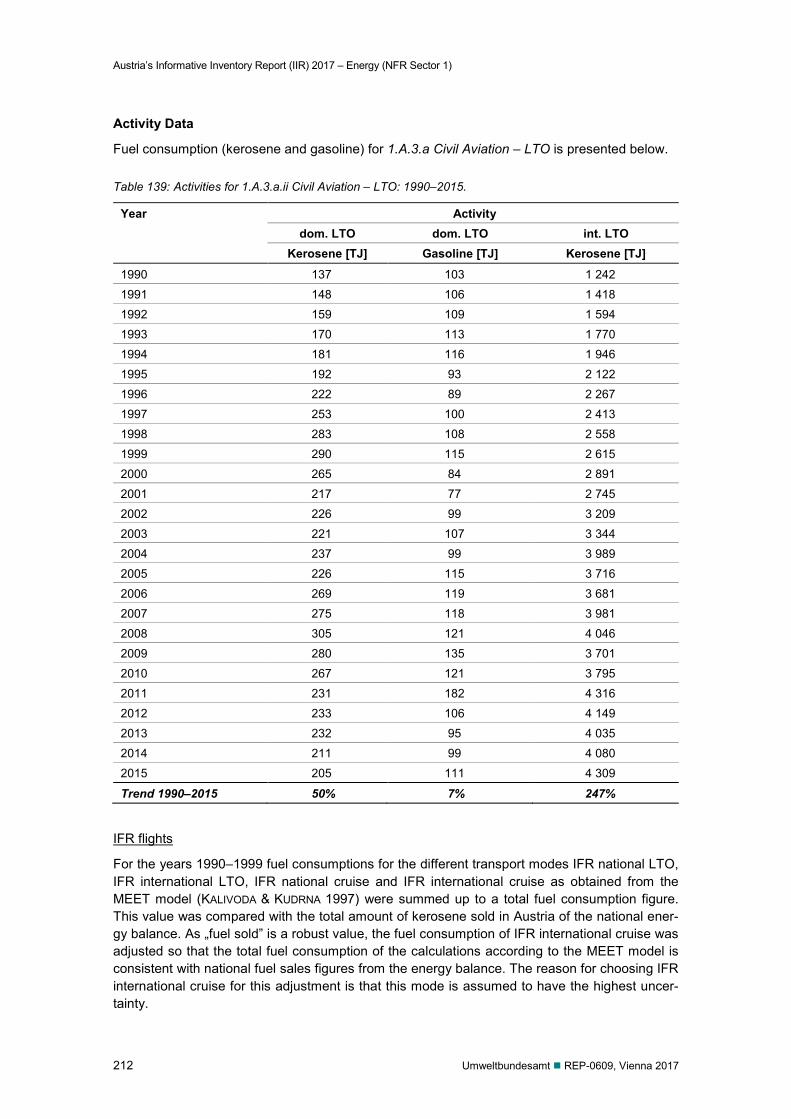
Austria’s Informative Inventory Report (IIR) 2017 – Energy (NFR Sector 1)
212 Umweltbundesamt REP-0609, Vienna 2017
Activity Data
Fuel consumption (kerosene and gasoline) for 1.A.3.a Civil Aviation – LTO is presented below.
Table 139: Activities for 1.A.3.a.ii Civil Aviation – LTO: 1990–2015.
Year Activity dom. LTO dom. LTO int. LTO
Kerosene [TJ] Gasoline [TJ] Kerosene [TJ]
1990 137 103 1 242
1991 148 106 1 418
1992 159 109 1 594
1993 170 113 1 770
1994 181 116 1 946
1995 192 93 2 122
1996 222 89 2 267
1997 253 100 2 413
1998 283 108 2 558
1999 290 115 2 615
2000 265 84 2 891
2001 217 77 2 745
2002 226 99 3 209
2003 221 107 3 344
2004 237 99 3 989
2005 226 115 3 716
2006 269 119 3 681
2007 275 118 3 981
2008 305 121 4 046
2009 280 135 3 701
2010 267 121 3 795
2011 231 182 4 316
2012 233 106 4 149
2013 232 95 4 035
2014 211 99 4 080
2015 205 111 4 309
Trend 1990–2015 50% 7% 247%
IFR flights
For the years 1990–1999 fuel consumptions for the different transport modes IFR national LTO, IFR international LTO, IFR national cruise and IFR international cruise as obtained from the MEET model (KALIVODA & KUDRNA 1997) were summed up to a total fuel consumption figure. This value was compared with the total amount of kerosene sold in Austria of the national ener-gy balance. As „fuel sold” is a robust value, the fuel consumption of IFR international cruise was adjusted so that the total fuel consumption of the calculations according to the MEET model is consistent with national fuel sales figures from the energy balance. The reason for choosing IFR international cruise for this adjustment is that this mode is assumed to have the highest uncer-tainty.
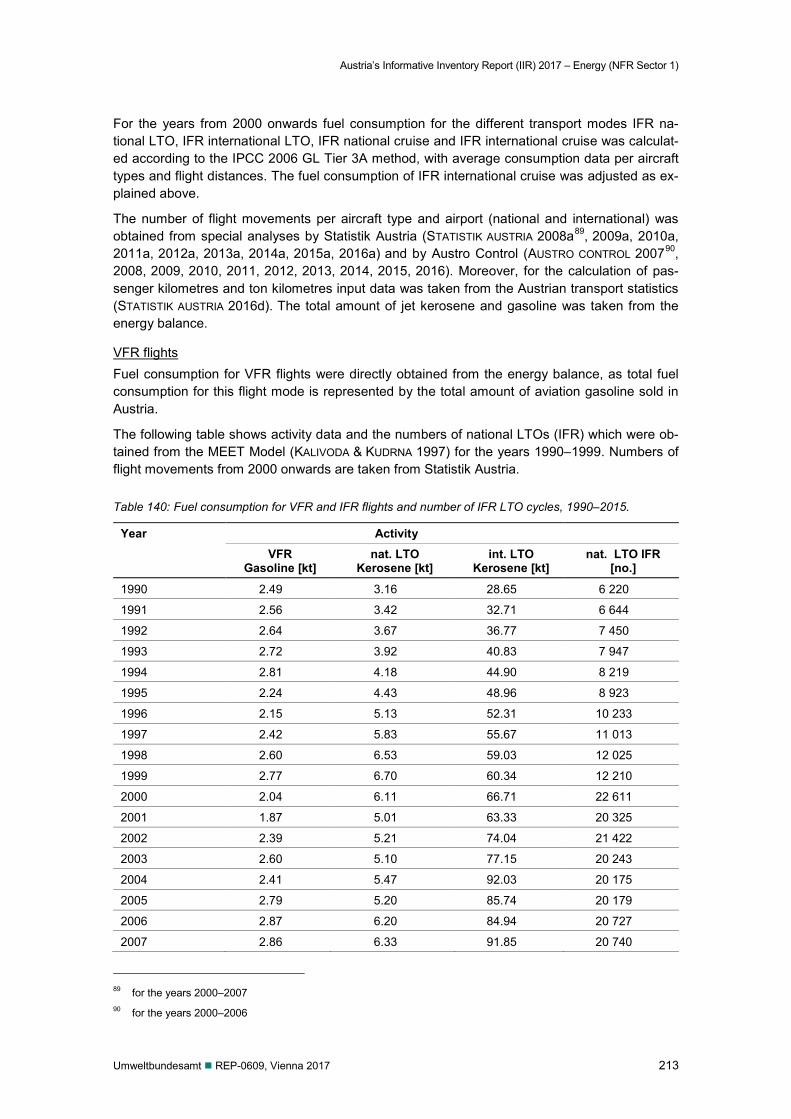
Austria’s Informative Inventory Report (IIR) 2017 – Energy (NFR Sector 1)
Umweltbundesamt REP-0609, Vienna 2017 213
For the years from 2000 onwards fuel consumption for the different transport modes IFR na-tional LTO, IFR international LTO, IFR national cruise and IFR international cruise was calculat-ed according to the IPCC 2006 GL Tier 3A method, with average consumption data per aircraft types and flight distances. The fuel consumption of IFR international cruise was adjusted as ex-plained above.
The number of flight movements per aircraft type and airport (national and international) was obtained from special analyses by Statistik Austria (STATISTIK AUSTRIA 2008a89, 2009a, 2010a, 2011a, 2012a, 2013a, 2014a, 2015a, 2016a) and by Austro Control (AUSTRO CONTROL 200790, 2008, 2009, 2010, 2011, 2012, 2013, 2014, 2015, 2016). Moreover, for the calculation of pas-senger kilometres and ton kilometres input data was taken from the Austrian transport statistics (STATISTIK AUSTRIA 2016d). The total amount of jet kerosene and gasoline was taken from the energy balance.
VFR flights Fuel consumption for VFR flights were directly obtained from the energy balance, as total fuel consumption for this flight mode is represented by the total amount of aviation gasoline sold in Austria.
The following table shows activity data and the numbers of national LTOs (IFR) which were ob-tained from the MEET Model (KALIVODA & KUDRNA 1997) for the years 1990–1999. Numbers of flight movements from 2000 onwards are taken from Statistik Austria.
Table 140: Fuel consumption for VFR and IFR flights and number of IFR LTO cycles, 1990–2015.
Year Activity VFR
Gasoline [kt] nat. LTO
Kerosene [kt] int. LTO
Kerosene [kt] nat. LTO IFR
[no.]
1990 2.49 3.16 28.65 6 220
1991 2.56 3.42 32.71 6 644
1992 2.64 3.67 36.77 7 450
1993 2.72 3.92 40.83 7 947
1994 2.81 4.18 44.90 8 219
1995 2.24 4.43 48.96 8 923
1996 2.15 5.13 52.31 10 233
1997 2.42 5.83 55.67 11 013
1998 2.60 6.53 59.03 12 025
1999 2.77 6.70 60.34 12 210
2000 2.04 6.11 66.71 22 611
2001 1.87 5.01 63.33 20 325
2002 2.39 5.21 74.04 21 422
2003 2.60 5.10 77.15 20 243
2004 2.41 5.47 92.03 20 175
2005 2.79 5.20 85.74 20 179
2006 2.87 6.20 84.94 20 727
2007 2.86 6.33 91.85 20 740
89 for the years 2000–2007 90 for the years 2000–2006
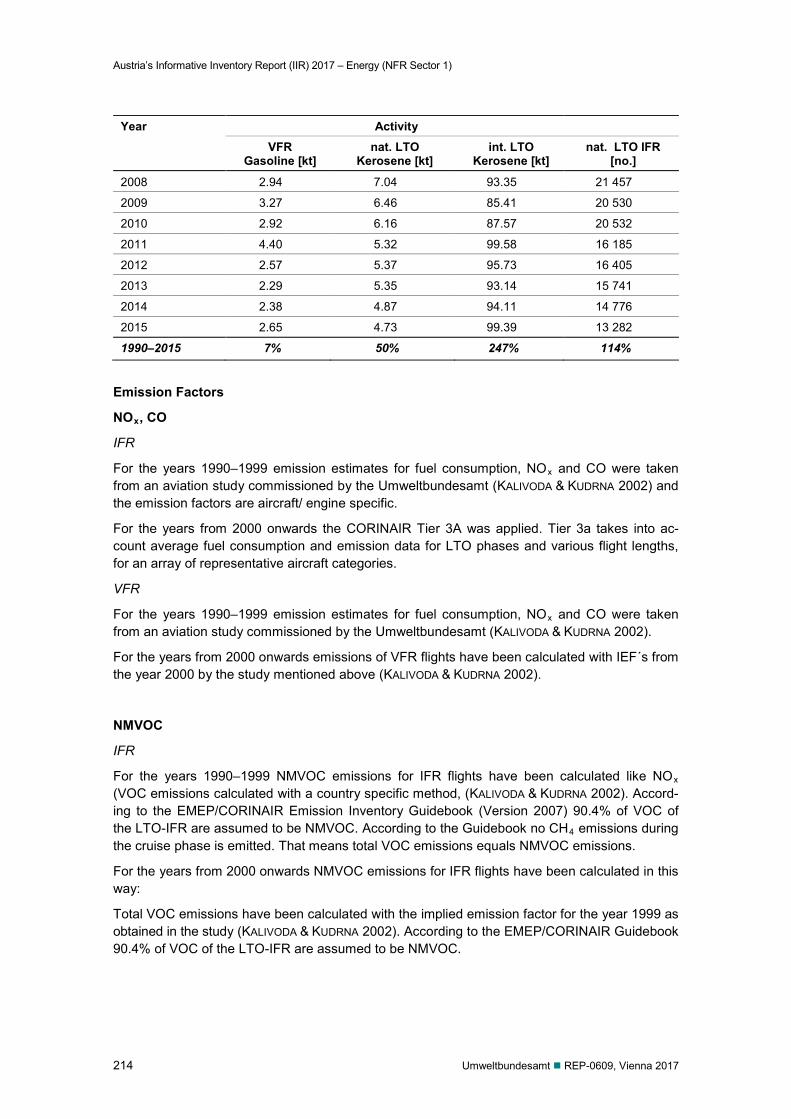
Austria’s Informative Inventory Report (IIR) 2017 – Energy (NFR Sector 1)
214 Umweltbundesamt REP-0609, Vienna 2017
Year Activity VFR
Gasoline [kt] nat. LTO
Kerosene [kt] int. LTO
Kerosene [kt] nat. LTO IFR
[no.]
2008 2.94 7.04 93.35 21 457
2009 3.27 6.46 85.41 20 530
2010 2.92 6.16 87.57 20 532
2011 4.40 5.32 99.58 16 185
2012 2.57 5.37 95.73 16 405
2013 2.29 5.35 93.14 15 741
2014 2.38 4.87 94.11 14 776
2015 2.65 4.73 99.39 13 282
1990–2015 7% 50% 247% 114%
Emission Factors
NOx, CO
IFR
For the years 1990–1999 emission estimates for fuel consumption, NOx and CO were taken from an aviation study commissioned by the Umweltbundesamt (KALIVODA & KUDRNA 2002) and the emission factors are aircraft/ engine specific.
For the years from 2000 onwards the CORINAIR Tier 3A was applied. Tier 3a takes into ac-count average fuel consumption and emission data for LTO phases and various flight lengths, for an array of representative aircraft categories.
VFR
For the years 1990–1999 emission estimates for fuel consumption, NOx and CO were taken from an aviation study commissioned by the Umweltbundesamt (KALIVODA & KUDRNA 2002).
For the years from 2000 onwards emissions of VFR flights have been calculated with IEF´s from the year 2000 by the study mentioned above (KALIVODA & KUDRNA 2002).
NMVOC
IFR
For the years 1990–1999 NMVOC emissions for IFR flights have been calculated like NOx (VOC emissions calculated with a country specific method, (KALIVODA & KUDRNA 2002). Accord-ing to the EMEP/CORINAIR Emission Inventory Guidebook (Version 2007) 90.4% of VOC of the LTO-IFR are assumed to be NMVOC. According to the Guidebook no CH4 emissions during the cruise phase is emitted. That means total VOC emissions equals NMVOC emissions.
For the years from 2000 onwards NMVOC emissions for IFR flights have been calculated in this way:
Total VOC emissions have been calculated with the implied emission factor for the year 1999 as obtained in the study (KALIVODA & KUDRNA 2002). According to the EMEP/CORINAIR Guidebook 90.4% of VOC of the LTO-IFR are assumed to be NMVOC.
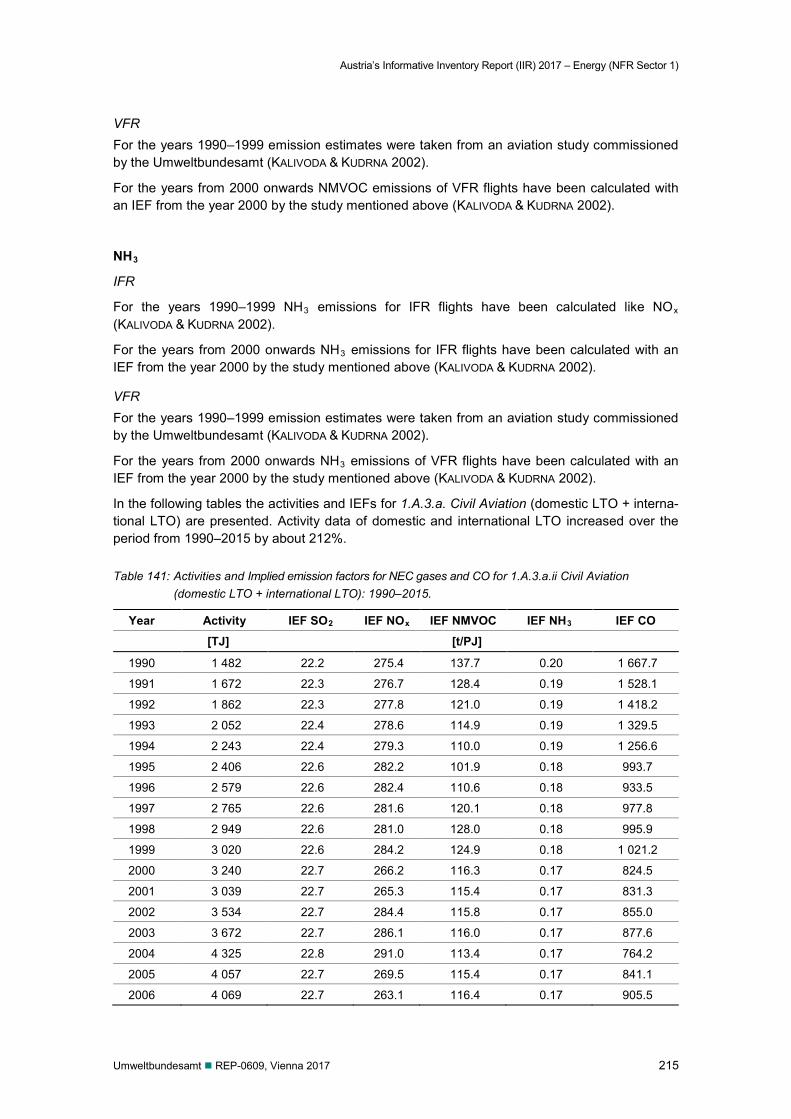
Austria’s Informative Inventory Report (IIR) 2017 – Energy (NFR Sector 1)
Umweltbundesamt REP-0609, Vienna 2017 215
VFR For the years 1990–1999 emission estimates were taken from an aviation study commissioned by the Umweltbundesamt (KALIVODA & KUDRNA 2002).
For the years from 2000 onwards NMVOC emissions of VFR flights have been calculated with an IEF from the year 2000 by the study mentioned above (KALIVODA & KUDRNA 2002).
NH3
IFR
For the years 1990–1999 NH3 emissions for IFR flights have been calculated like NOx (KALIVODA & KUDRNA 2002).
For the years from 2000 onwards NH3 emissions for IFR flights have been calculated with an IEF from the year 2000 by the study mentioned above (KALIVODA & KUDRNA 2002).
VFR For the years 1990–1999 emission estimates were taken from an aviation study commissioned by the Umweltbundesamt (KALIVODA & KUDRNA 2002).
For the years from 2000 onwards NH3 emissions of VFR flights have been calculated with an IEF from the year 2000 by the study mentioned above (KALIVODA & KUDRNA 2002).
In the following tables the activities and IEFs for 1.A.3.a. Civil Aviation (domestic LTO + interna-tional LTO) are presented. Activity data of domestic and international LTO increased over the period from 1990–2015 by about 212%.
Table 141: Activities and Implied emission factors for NEC gases and CO for 1.A.3.a.ii Civil Aviation (domestic LTO + international LTO): 1990–2015.
Year Activity IEF SO2 IEF NOx IEF NMVOC IEF NH3 IEF CO [TJ] [t/PJ]
1990 1 482 22.2 275.4 137.7 0.20 1 667.7
1991 1 672 22.3 276.7 128.4 0.19 1 528.1
1992 1 862 22.3 277.8 121.0 0.19 1 418.2
1993 2 052 22.4 278.6 114.9 0.19 1 329.5
1994 2 243 22.4 279.3 110.0 0.19 1 256.6
1995 2 406 22.6 282.2 101.9 0.18 993.7
1996 2 579 22.6 282.4 110.6 0.18 933.5
1997 2 765 22.6 281.6 120.1 0.18 977.8
1998 2 949 22.6 281.0 128.0 0.18 995.9
1999 3 020 22.6 284.2 124.9 0.18 1 021.2
2000 3 240 22.7 266.2 116.3 0.17 824.5
2001 3 039 22.7 265.3 115.4 0.17 831.3
2002 3 534 22.7 284.4 115.8 0.17 855.0
2003 3 672 22.7 286.1 116.0 0.17 877.6
2004 4 325 22.8 291.0 113.4 0.17 764.2
2005 4 057 22.7 269.5 115.4 0.17 841.1
2006 4 069 22.7 263.1 116.4 0.17 905.5
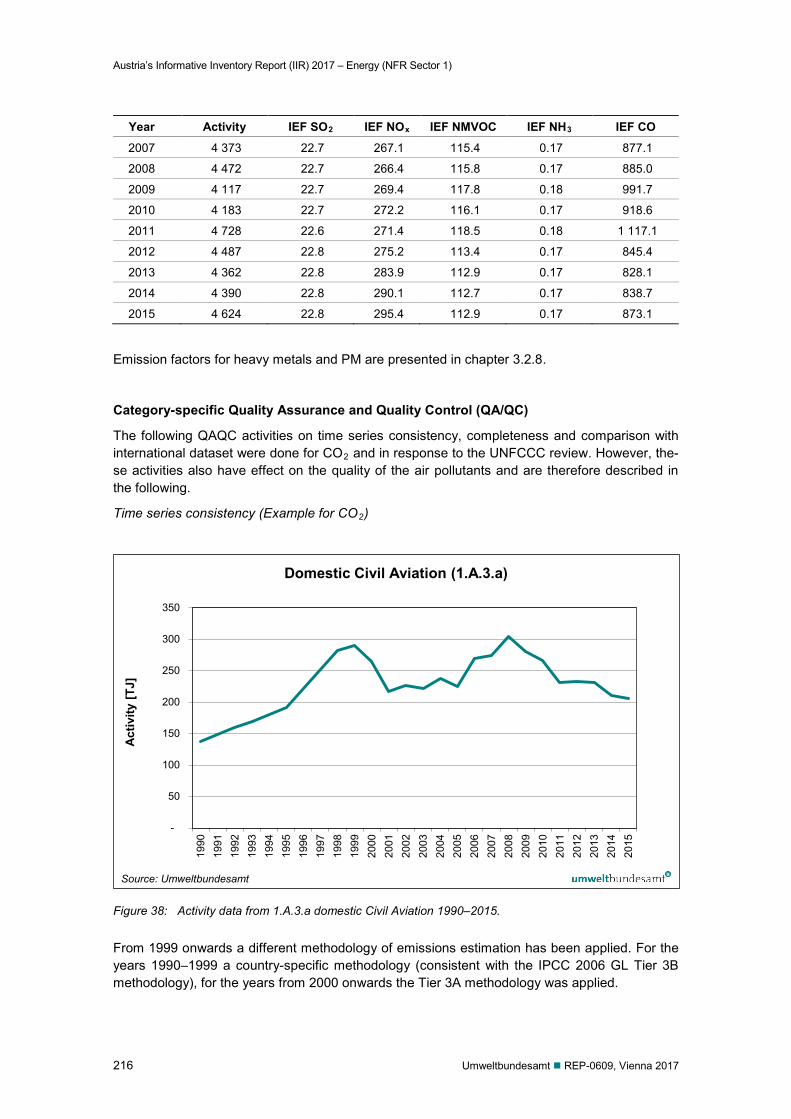
Austria’s Informative Inventory Report (IIR) 2017 – Energy (NFR Sector 1)
216 Umweltbundesamt REP-0609, Vienna 2017
Year Activity IEF SO2 IEF NOx IEF NMVOC IEF NH3 IEF CO
2007 4 373 22.7 267.1 115.4 0.17 877.1
2008 4 472 22.7 266.4 115.8 0.17 885.0
2009 4 117 22.7 269.4 117.8 0.18 991.7
2010 4 183 22.7 272.2 116.1 0.17 918.6
2011 4 728 22.6 271.4 118.5 0.18 1 117.1
2012 4 487 22.8 275.2 113.4 0.17 845.4
2013 4 362 22.8 283.9 112.9 0.17 828.1
2014 4 390 22.8 290.1 112.7 0.17 838.7
2015 4 624 22.8 295.4 112.9 0.17 873.1
Emission factors for heavy metals and PM are presented in chapter 3.2.8.
Category-specific Quality Assurance and Quality Control (QA/QC)
The following QAQC activities on time series consistency, completeness and comparison with international dataset were done for CO2 and in response to the UNFCCC review. However, the-se activities also have effect on the quality of the air pollutants and are therefore described in the following.
Time series consistency (Example for CO2)
Figure 38: Activity data from 1.A.3.a domestic Civil Aviation 1990–2015.
From 1999 onwards a different methodology of emissions estimation has been applied. For the years 1990–1999 a country-specific methodology (consistent with the IPCC 2006 GL Tier 3B methodology), for the years from 2000 onwards the Tier 3A methodology was applied.
-
50
100
150
200
250
300
350
1990
1991
1992
1993
1994
1995
1996
1997
1998
1999
2000
2001
2002
2003
2004
2005
2006
2007
2008
2009
2010
2011
2012
2013
2014
2015
Act
ivity
[TJ]
Domestic Civil Aviation (1.A.3.a)
Source: Umweltbundesamt
Austria’s Informative Inventory Report (IIR) 2017 – Energy (NFR Sector 1)
Umweltbundesamt REP-0609, Vienna 2017 217
To show that there is no underestimation of domestic aviation emissions, domestic fuel con-sumption is multiplied with the default CO2 emission factor of 3 150 kg CO2/Mg fuel (CORINAIR, KALIVODA & KUDRNA. 2002). Total reported CO2 emissions for domestic aviation in the year 2000 are consistent with the IPCC 2006 GL Tier 3A methodology (new method), whereas the Tier 3B methodology (old method) deviates by 22%.
Table 142: Methodology dependent calculation of CO2 emissions from 1.A.3.a Civil Aviation in 2000.
2000
dom LTO dom. LTO dom. cruise dom. deviation gasoline kerosene total
CO2 [kt] %
OLI2016 (1990–2015) 6.4 19.3 41.6 67.24
CORINAIR CO2 default EF Tier 3B methodology 6.4 21.6 54.1 82.11 22.1
CORINAIR CO2 default EF Tier 3A methodology 6.4 19.2 41.5 67.18 -0.1
Since there is no systematic deviation between the two models’ results, Austria has decided not to replace the more accurate data applied for the period 1990–1999 (FCCC/ARR/2011/AUT§46).
The peak of activity data and GHG emissions in 1999, followed by a decrease within two years by nearly 30% is an artefact due to the shortcomings of the method used from 1999 onwards. The old methodology reflects much better real-world effects, because this methodology is con-sistent with the very detailed IPCC 2006 GL Tier 3B methodology (advanced version based on MEET (KALIVODA & KUDRNA 1997): air traffic movement data (flight distance and destination per aircraft type) and aircraft/engine performances data were used for the calculation. Due to budg-etary constraints such a detailed study has not been repeated since then.
Harmonization inventory and IEA data
In 2013 the ERT detected inconsistencies of fuel consumption data of domestic aviation and domestic navigation between the CRF tables and the IEA data (ICR 2013). In response to that it was explained that Austria uses a bottom-up approach to estimate fuel consumption whilst IEA relies on top-down approach based on fuel consumption statistics reported by Statistics Austria
After having discussed this issue with Statistics Austria an Explanatory Note (30/09/2013) has been compiled by Statistics Austria declaring that a regular adoption of inventory data for the split between national and international fuel consumption in civil aviation and navigation in the national statistics will be adopted in the future, as far as the data can be submitted in time (early November).
As part of the regular QA/QC, the energy split between national and international aviation is provided to Statistics Austria for the IEA statistics based on the bottom-up model used to calcu-late the annual emission inventory.
Completeness
In response to a question raised by the ERT (ICR 2013) it was explained that emissions of ground activities at domestic airports are also included, even if they are not separately reported under 1.A.3.a Aviation. This can be assured as Austria reports emissions from total fuel sold from the energy balance.
Austria’s Informative Inventory Report (IIR) 2017 – Energy (NFR Sector 1)
218 Umweltbundesamt REP-0609, Vienna 2017
The approach in the Austrian inventory is as follows: After calculating fuel consumption for in-land road transport and off-road transport using a bottom-up approach (NEMO, GEORG), the sum of this fuel used is compared with the total fuel sold from the national energy balance (for details see 1.A.3.b Road Transport). The difference is then allocated to fuel export, which in-cludes fuel consumption for ground activities at airports and harbors as well, including fuel con-sumption by unregistered vehicles. As the fuel consumption reported under fuel export is in-cluded in the national totals91, an underestimation of emissions can be excluded.
Comparison IEA (military jet kerosene data)
In 2014, the ERT noted a significant difference in jet kerosene consumption (civil aviation) be-tween IEA data and CRF Table 1.C. In response to the draft ARR 2014, Austria explained that the IEA value also includes military jet kerosene data and that this is the reason for the differ-ence.
Category-specific Recalculations
No recalculations have been made in this year’s submission.
Category-specific Planned Improvements
Regarding activities it is planned to rely on Austro Control, Austria’s national flight authority, as the future data supplier for flight movements. The current data supplier, Statistik Austria, uses a different definition of flights, therefore reporting a set of domestic flights which are slightly devi-ating from those reported by Eurocontrol. After this discrepancy has been examined thoroughly, the exchange of the data supplier will be necessary. This improvement is planned to be imple-mented during the preparation for the submission in 2018. During this process also an update of aircraft types and emission factors following the latest EMEP/EEA Guidebook 2016 is planned.92
3.2.5 NFR Memo Item 1.A.3.a Civil Aviation – Cruise
In 2015, the share of Civil Aviation – Cruise in the total fuel consumption in the aviation sector in Austria amounted to 85%. Emissions and activity data from aviation assigned include the transport modes domestic and international cruise traffic for IFR-flights.
Methodological Issues
Emissions from International Bunkers have been calculated using the methodology and emis-sion factors as described in Chapter 1.A.3.a Civil aviation.
91 GHG emissions from fuel export are included in 1.A.3.b, and are presented separately in Table 66 (Chapter
3.2.12.2) 92 For calculating emissions from 1.A.3.a Civil aviation emission factors are currently taken from the EMEP/CORINAIR
Emission Inventory Guidebook 2007 (EEA 2007).
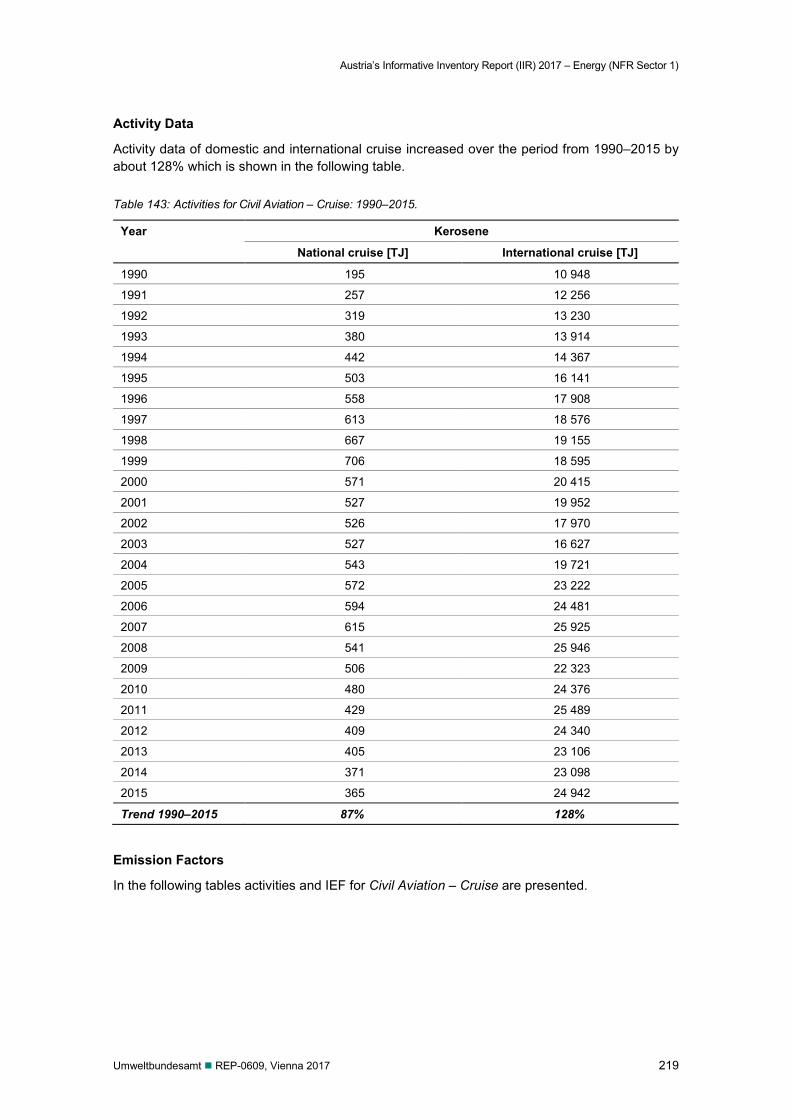
Austria’s Informative Inventory Report (IIR) 2017 – Energy (NFR Sector 1)
Umweltbundesamt REP-0609, Vienna 2017 219
Activity Data
Activity data of domestic and international cruise increased over the period from 1990–2015 by about 128% which is shown in the following table.
Table 143: Activities for Civil Aviation – Cruise: 1990–2015.
Year Kerosene
National cruise [TJ] International cruise [TJ]
1990 195 10 948
1991 257 12 256
1992 319 13 230
1993 380 13 914
1994 442 14 367
1995 503 16 141
1996 558 17 908
1997 613 18 576
1998 667 19 155
1999 706 18 595
2000 571 20 415
2001 527 19 952
2002 526 17 970
2003 527 16 627
2004 543 19 721
2005 572 23 222
2006 594 24 481
2007 615 25 925
2008 541 25 946
2009 506 22 323
2010 480 24 376
2011 429 25 489
2012 409 24 340
2013 405 23 106
2014 371 23 098
2015 365 24 942
Trend 1990–2015 87% 128%
Emission Factors
In the following tables activities and IEF for Civil Aviation – Cruise are presented.
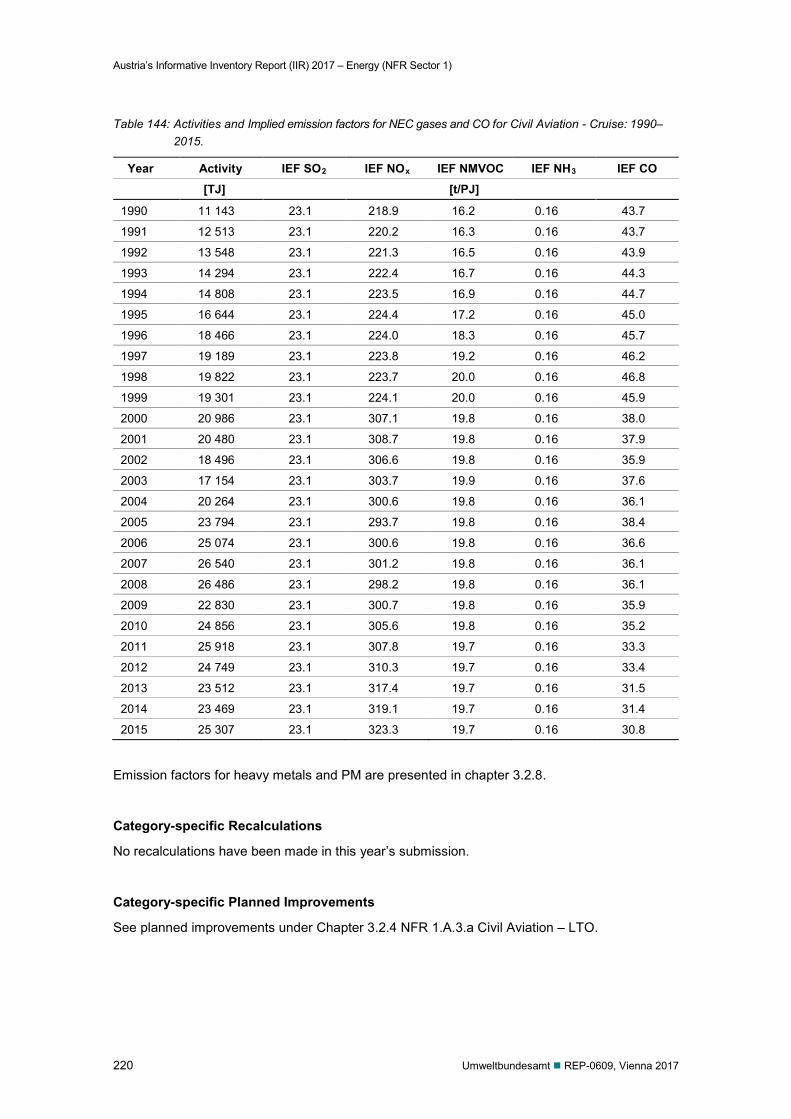
Austria’s Informative Inventory Report (IIR) 2017 – Energy (NFR Sector 1)
220 Umweltbundesamt REP-0609, Vienna 2017
Table 144: Activities and Implied emission factors for NEC gases and CO for Civil Aviation - Cruise: 1990–2015.
Year Activity IEF SO2 IEF NOx IEF NMVOC IEF NH3 IEF CO [TJ] [t/PJ]
1990 11 143 23.1 218.9 16.2 0.16 43.7
1991 12 513 23.1 220.2 16.3 0.16 43.7
1992 13 548 23.1 221.3 16.5 0.16 43.9
1993 14 294 23.1 222.4 16.7 0.16 44.3
1994 14 808 23.1 223.5 16.9 0.16 44.7
1995 16 644 23.1 224.4 17.2 0.16 45.0
1996 18 466 23.1 224.0 18.3 0.16 45.7
1997 19 189 23.1 223.8 19.2 0.16 46.2
1998 19 822 23.1 223.7 20.0 0.16 46.8
1999 19 301 23.1 224.1 20.0 0.16 45.9
2000 20 986 23.1 307.1 19.8 0.16 38.0
2001 20 480 23.1 308.7 19.8 0.16 37.9
2002 18 496 23.1 306.6 19.8 0.16 35.9
2003 17 154 23.1 303.7 19.9 0.16 37.6
2004 20 264 23.1 300.6 19.8 0.16 36.1
2005 23 794 23.1 293.7 19.8 0.16 38.4
2006 25 074 23.1 300.6 19.8 0.16 36.6
2007 26 540 23.1 301.2 19.8 0.16 36.1
2008 26 486 23.1 298.2 19.8 0.16 36.1
2009 22 830 23.1 300.7 19.8 0.16 35.9
2010 24 856 23.1 305.6 19.8 0.16 35.2
2011 25 918 23.1 307.8 19.7 0.16 33.3
2012 24 749 23.1 310.3 19.7 0.16 33.4
2013 23 512 23.1 317.4 19.7 0.16 31.5
2014 23 469 23.1 319.1 19.7 0.16 31.4
2015 25 307 23.1 323.3 19.7 0.16 30.8
Emission factors for heavy metals and PM are presented in chapter 3.2.8.
Category-specific Recalculations
No recalculations have been made in this year’s submission.
Category-specific Planned Improvements
See planned improvements under Chapter 3.2.4 NFR 1.A.3.a Civil Aviation – LTO.
Austria’s Informative Inventory Report (IIR) 2017 – Energy (NFR Sector 1)
Umweltbundesamt REP-0609, Vienna 2017 221
3.2.5.1 NFR Memo Item 1.A.3.d International maritime Navigation
Austria does not have any activities under Memo 1 a 3 d International maritime navigation. Ac-tivities under International inland waterways are included in the national total according to the reporting under CLRTAP.
3.2.6 NFR 1.A.3.b Road Transport
Emissions from road transportation are covered in this category. It includes emissions from pas-senger cars, light duty vehicles, heavy duty vehicles and busses, mopeds and motorcycles, gasoline evaporation from vehicles as well as vehicle tyre, brake and road surface wear.
Road Transport is the main emission source for NOx, SO2, NMVOC and NH3 emissions of the transport sector. Up to 2005 especially classic air pollutants from road transport – NOx and PM emissions – have increased mainly because of: steady increase of transport activity altered spatial structures: urban sprawl and centralization changing demand structures in the industry: growing division of labour and flexible production
methods (just-in-time production) cause the inventory being replaced by means of transport disproportionately existing infrastructure for motorized individual transport and further devel-
opment changed lifestyle and mobility needs of the population fuel exports by – especially in comparison with Germany and Italy – cheap fuel prices in Austria Technical improvements and a stricter legislation, however, led to a reduction of emissions per vehicle or per mileage respectively of mostly all other air pollutants. Methodological Issues
Mobile road combustion is differentiated into the categories Passenger Cars, Light Duty Vehi-cles, Heavy Duty Vehicles and Buses, Mopeds and Motorcycles. In order to apply the EMEP/EEA methodology a split of the fuel consumption of different vehicle categories is need-ed.
Bottom up Methodology – fuel consumed
Energy consumption and emissions of the different vehicle categories are calculated by multi-plying the yearly road performance per vehicle category (km/vehicle and year) by the specific energy use (g/km) and by the emission factors in g/km (Model: NEMO).
NEMO also models the road performance and emissions per vehicle size, age and motor type based on dynamic vehicle specific drop out- and road performance functions.
To determine fuel consumption and emissions of domestic road transport, vehicle stock and total annual road performance (mileage driven per year) of the vehicle categories should be recorded as precisely as possible. The current traffic volumes up to and ing 2007 are taken from Austrian National Transport Model “VMOe 2025+” Verkehrs-Mengenmodell-Österreich (Federal Transport Model, Ministry of Transport, BMVIT, not pub-lished). Mileage data after 2007 is calculated from the growth rates according to the final results of the automatic traffic counting stations and the toll data (ASFINAG 2016).
Austria’s Informative Inventory Report (IIR) 2017 – Energy (NFR Sector 1)
222 Umweltbundesamt REP-0609, Vienna 2017
Top down Methodology – Fuel sold
Based on the NEMO model fuel consumption and emissions for road transport are calculated with a bottom-up approach. Calculated fuel consumption of road transport is then summed up with calculated fuel consumption of off road traffic and is compared with national total fuel sold.
The difference between the fuel consumption calculated in the bottom-up methodology for road traffic plus off-road transport within Austria and total fuel sales in Austria (obtained from the yearly Austrian energy balance) is allocated to fuel export (fuel sold in Austria but consumed abroad).
The emissions reported for Austria also include the emissions from the fuel exports.
Fuel export93
Since the end of the nineties an increasing discrepancy between the total Austrian fuel sales and the computed domestic fuel consumption became apparent. From 2003 onward this gap accounts for roughly 30% of the total fuel sales. A possible explanation of this discrepancy is the „fuel export in the vehicle tank” – due to the relatively low fuel prices in Austria (in compari-son to the neighbouring countries). Meaning that to a greater extent fuel is filled up in Austria and consumed abroad. This assumption is underpinned by two national studies (MOLITOR et al. 2004; MOLITOR et al. 2009).
It is assumed that the fuel export fleet (mainly travelling on highways) is similar to the Austrian fleet on highways, which means that no different efficiency rates are assumed for the fuel export fleet.
NEMO – Network Emission Model
Emissions from Mobile Combustion have so far been calculated with the model GLOBEMI (HAUSBERGER 1997; HAUSBERGER et al. 2014). The calculations have been based on a detailed depiction of fleet composition, driving behaviour, related energy consumption and emission fac-tors.
From submission 2015 (1990-2013) onwards calculations are based on the model NEMO – Network Emission Model (DIPPOLD et al. 2012; HAUSBERGER et al. 2015a, 2015b). NEMO is set up on the same methodology as the former model GLOBEMI and combines a detailed calcula-tion of the fleet composition with the simulation of energy consumption and emission output on vehicle level. It is fully capable to depict the upcoming variety of possible combinations of pro-pulsion systems (internal combustion engine, hybrid, plug-in-hybrid, electric propulsion, fuel cell …) and alternative fuels (CNG, biogas, FAME, Ethanol, GTL, BTL, H2 …).
In addition, NEMO has been designed to be also suitable for all main application fields of simu-lation of energy consumption and emission output on a road-section based model approach. As there does not yet exist a complete road network for Austria on a highly resolved spatial level, the old methodology based on a categorisation of the traffic activity into “urban”, “rural” and “mo-torway” has been currently also applied in NEMO.
93 Under the LRTAP Convention national emissions are reported based on fuel sold (including fuel export); under the
NEC Directive national emissions are reported based on fuel used (excluding fuel export).
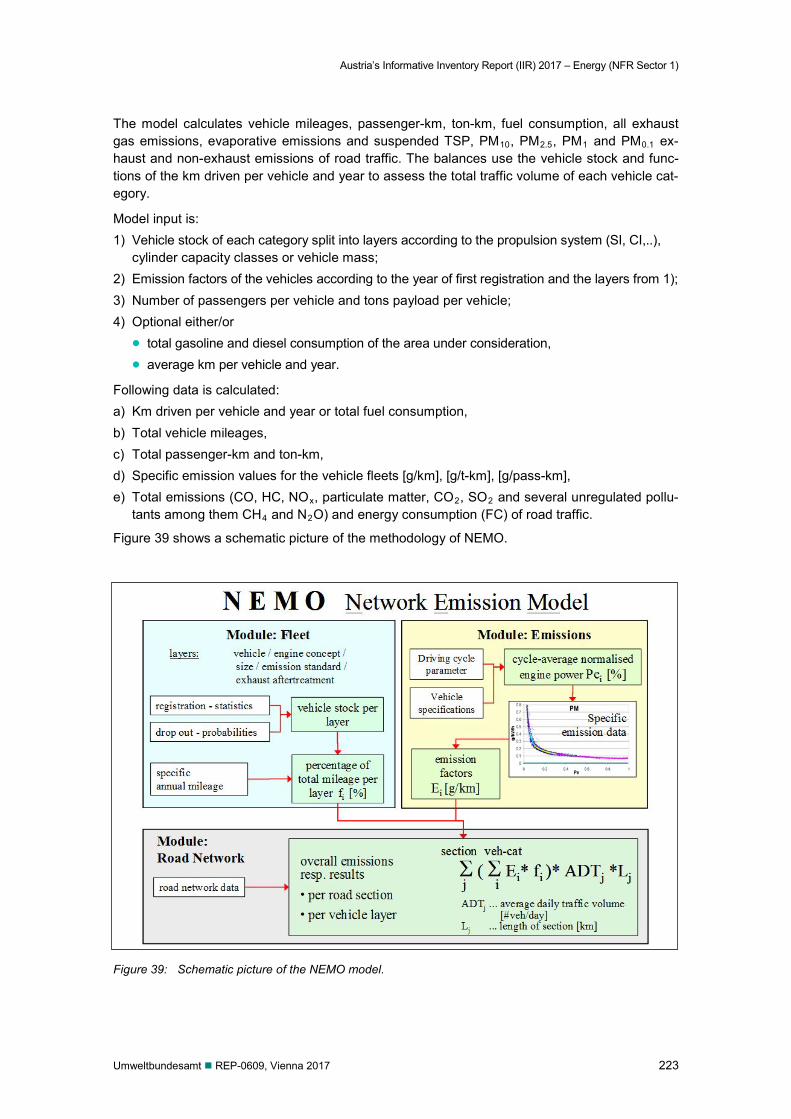
Austria’s Informative Inventory Report (IIR) 2017 – Energy (NFR Sector 1)
Umweltbundesamt REP-0609, Vienna 2017 223
The model calculates vehicle mileages, passenger-km, ton-km, fuel consumption, all exhaust gas emissions, evaporative emissions and suspended TSP, PM10, PM2.5, PM1 and PM0.1 ex-haust and non-exhaust emissions of road traffic. The balances use the vehicle stock and func-tions of the km driven per vehicle and year to assess the total traffic volume of each vehicle cat-egory.
Model input is: 1) Vehicle stock of each category split into layers according to the propulsion system (SI, CI,..),
cylinder capacity classes or vehicle mass; 2) Emission factors of the vehicles according to the year of first registration and the layers from 1); 3) Number of passengers per vehicle and tons payload per vehicle; 4) Optional either/or total gasoline and diesel consumption of the area under consideration, average km per vehicle and year.
Following data is calculated: a) Km driven per vehicle and year or total fuel consumption, b) Total vehicle mileages, c) Total passenger-km and ton-km, d) Specific emission values for the vehicle fleets [g/km], [g/t-km], [g/pass-km], e) Total emissions (CO, HC, NOx, particulate matter, CO2, SO2 and several unregulated pollu-
tants among them CH4 and N2O) and energy consumption (FC) of road traffic.
Figure 39 shows a schematic picture of the methodology of NEMO.
Figure 39: Schematic picture of the NEMO model.
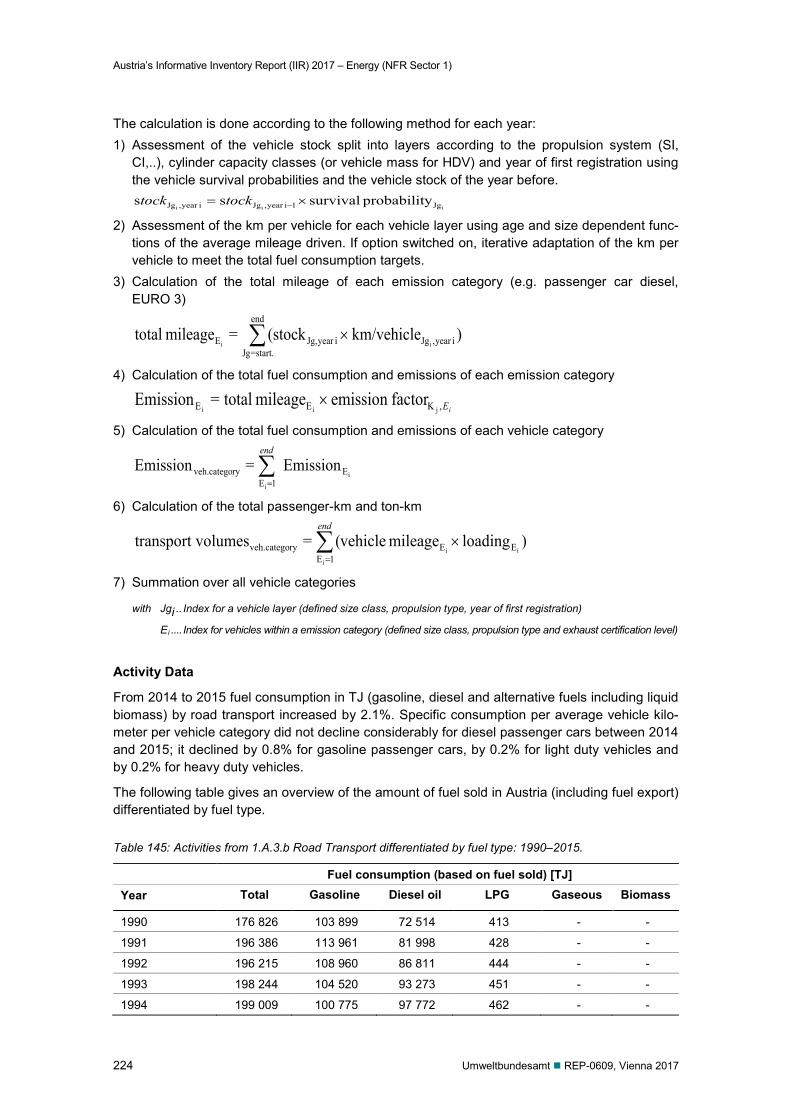
Austria’s Informative Inventory Report (IIR) 2017 – Energy (NFR Sector 1)
224 Umweltbundesamt REP-0609, Vienna 2017
The calculation is done according to the following method for each year: 1) Assessment of the vehicle stock split into layers according to the propulsion system (SI,
CI,..), cylinder capacity classes (or vehicle mass for HDV) and year of first registration using the vehicle survival probabilities and the vehicle stock of the year before.
iii Jg1iyear ,Jgiyear ,Jg yprobabilit survivalss ×= −tocktock 2) Assessment of the km per vehicle for each vehicle layer using age and size dependent func-
tions of the average mileage driven. If option switched on, iterative adaptation of the km per vehicle to meet the total fuel consumption targets.
3) Calculation of the total mileage of each emission category (e.g. passenger car diesel, EURO 3)
)km/vehicle (stock=mileage total iyear ,Jg
end
start.=Jgiyear Jg,E ii ∑ ×
4) Calculation of the total fuel consumption and emissions of each emission category
iE,KEE jiifactoremission mileage total=Emission ×
5) Calculation of the total fuel consumption and emissions of each vehicle category
i
i
E1E
ryveh.catego Emission=Emission ∑=
end
6) Calculation of the total passenger-km and ton-km
)loadingmileage vehicle(=volumestransport ii
i
EE1E
ryveh.catego ×∑=
end
7) Summation over all vehicle categories
with Jgi .. Index for a vehicle layer (defined size class, propulsion type, year of first registration)
Ei .... Index for vehicles within a emission category (defined size class, propulsion type and exhaust certification level)
Activity Data
From 2014 to 2015 fuel consumption in TJ (gasoline, diesel and alternative fuels including liquid biomass) by road transport increased by 2.1%. Specific consumption per average vehicle kilo-meter per vehicle category did not decline considerably for diesel passenger cars between 2014 and 2015; it declined by 0.8% for gasoline passenger cars, by 0.2% for light duty vehicles and by 0.2% for heavy duty vehicles.
The following table gives an overview of the amount of fuel sold in Austria (including fuel export) differentiated by fuel type.
Table 145: Activities from 1.A.3.b Road Transport differentiated by fuel type: 1990–2015.
Fuel consumption (based on fuel sold) [TJ] Year Total Gasoline Diesel oil LPG Gaseous Biomass
1990 176 826 103 899 72 514 413 - -
1991 196 386 113 961 81 998 428 - -
1992 196 215 108 960 86 811 444 - -
1993 198 244 104 520 93 273 451 - -
1994 199 009 100 775 97 772 462 - -
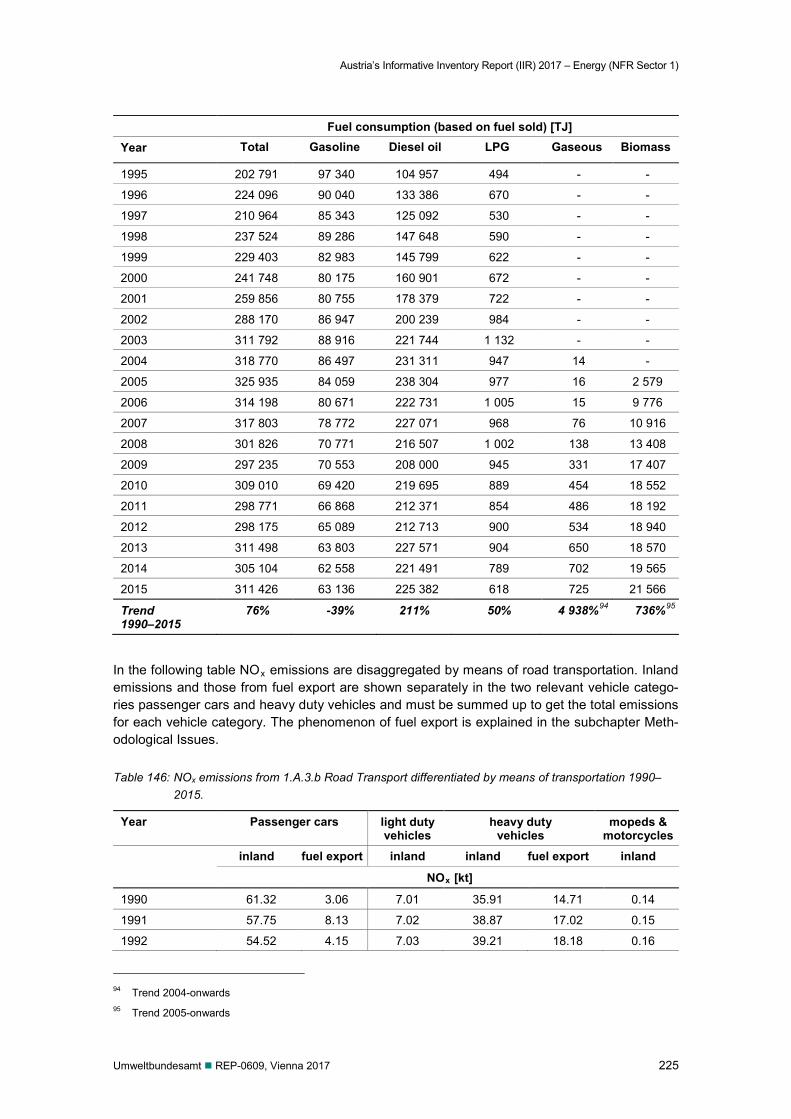
Austria’s Informative Inventory Report (IIR) 2017 – Energy (NFR Sector 1)
Umweltbundesamt REP-0609, Vienna 2017 225
Fuel consumption (based on fuel sold) [TJ] Year Total Gasoline Diesel oil LPG Gaseous Biomass
1995 202 791 97 340 104 957 494 - -
1996 224 096 90 040 133 386 670 - -
1997 210 964 85 343 125 092 530 - -
1998 237 524 89 286 147 648 590 - -
1999 229 403 82 983 145 799 622 - -
2000 241 748 80 175 160 901 672 - -
2001 259 856 80 755 178 379 722 - -
2002 288 170 86 947 200 239 984 - -
2003 311 792 88 916 221 744 1 132 - -
2004 318 770 86 497 231 311 947 14 -
2005 325 935 84 059 238 304 977 16 2 579
2006 314 198 80 671 222 731 1 005 15 9 776
2007 317 803 78 772 227 071 968 76 10 916
2008 301 826 70 771 216 507 1 002 138 13 408
2009 297 235 70 553 208 000 945 331 17 407
2010 309 010 69 420 219 695 889 454 18 552
2011 298 771 66 868 212 371 854 486 18 192
2012 298 175 65 089 212 713 900 534 18 940
2013 311 498 63 803 227 571 904 650 18 570
2014 305 104 62 558 221 491 789 702 19 565
2015 311 426 63 136 225 382 618 725 21 566
Trend 1990–2015
76% -39% 211% 50% 4 938%94 736%95
In the following table NOx emissions are disaggregated by means of road transportation. Inland emissions and those from fuel export are shown separately in the two relevant vehicle catego-ries passenger cars and heavy duty vehicles and must be summed up to get the total emissions for each vehicle category. The phenomenon of fuel export is explained in the subchapter Meth-odological Issues.
Table 146: NOx emissions from 1.A.3.b Road Transport differentiated by means of transportation 1990–2015.
Year Passenger cars light duty vehicles
heavy duty vehicles
mopeds & motorcycles
inland fuel export inland inland fuel export inland
NOx [kt]
1990 61.32 3.06 7.01 35.91 14.71 0.14
1991 57.75 8.13 7.02 38.87 17.02 0.15
1992 54.52 4.15 7.03 39.21 18.18 0.16
94 Trend 2004-onwards 95 Trend 2005-onwards
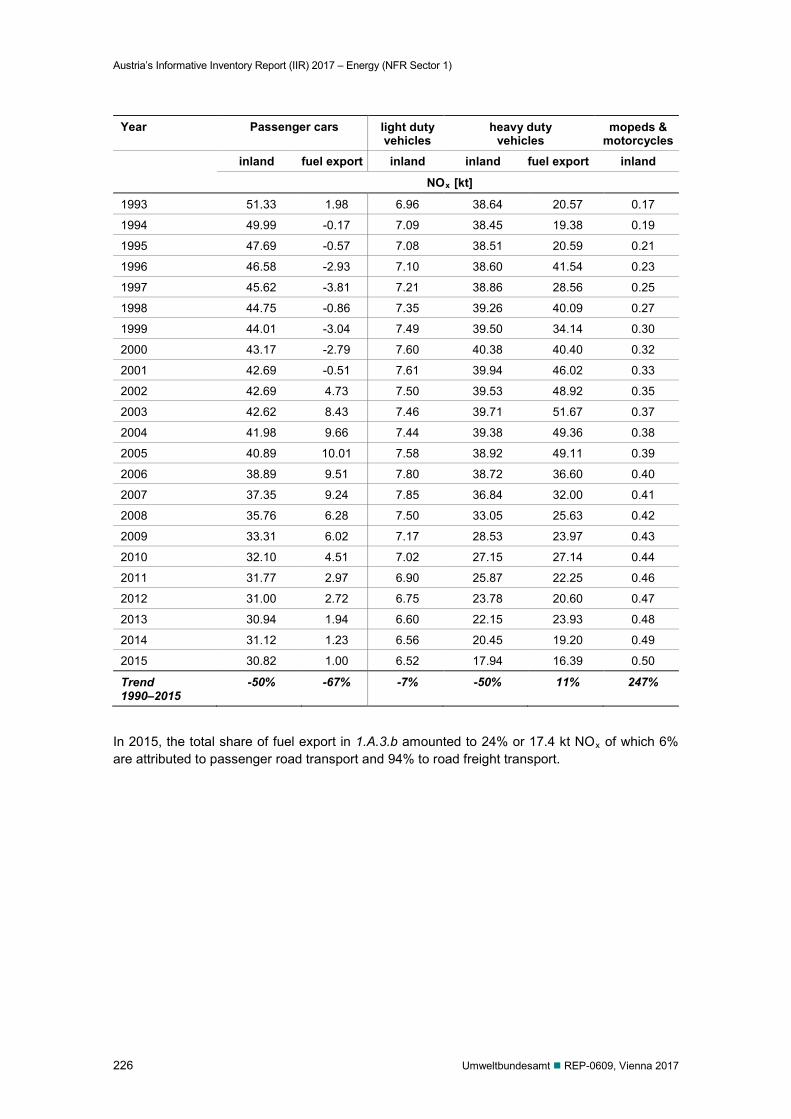
Austria’s Informative Inventory Report (IIR) 2017 – Energy (NFR Sector 1)
226 Umweltbundesamt REP-0609, Vienna 2017
Year Passenger cars light duty vehicles
heavy duty vehicles
mopeds & motorcycles
inland fuel export inland inland fuel export inland
NOx [kt]
1993 51.33 1.98 6.96 38.64 20.57 0.17
1994 49.99 -0.17 7.09 38.45 19.38 0.19
1995 47.69 -0.57 7.08 38.51 20.59 0.21
1996 46.58 -2.93 7.10 38.60 41.54 0.23
1997 45.62 -3.81 7.21 38.86 28.56 0.25
1998 44.75 -0.86 7.35 39.26 40.09 0.27
1999 44.01 -3.04 7.49 39.50 34.14 0.30
2000 43.17 -2.79 7.60 40.38 40.40 0.32
2001 42.69 -0.51 7.61 39.94 46.02 0.33
2002 42.69 4.73 7.50 39.53 48.92 0.35
2003 42.62 8.43 7.46 39.71 51.67 0.37
2004 41.98 9.66 7.44 39.38 49.36 0.38
2005 40.89 10.01 7.58 38.92 49.11 0.39
2006 38.89 9.51 7.80 38.72 36.60 0.40
2007 37.35 9.24 7.85 36.84 32.00 0.41
2008 35.76 6.28 7.50 33.05 25.63 0.42
2009 33.31 6.02 7.17 28.53 23.97 0.43
2010 32.10 4.51 7.02 27.15 27.14 0.44
2011 31.77 2.97 6.90 25.87 22.25 0.46
2012 31.00 2.72 6.75 23.78 20.60 0.47
2013 30.94 1.94 6.60 22.15 23.93 0.48
2014 31.12 1.23 6.56 20.45 19.20 0.49
2015 30.82 1.00 6.52 17.94 16.39 0.50
Trend 1990–2015
-50% -67% -7% -50% 11% 247%
In 2015, the total share of fuel export in 1.A.3.b amounted to 24% or 17.4 kt NOx of which 6% are attributed to passenger road transport and 94% to road freight transport.
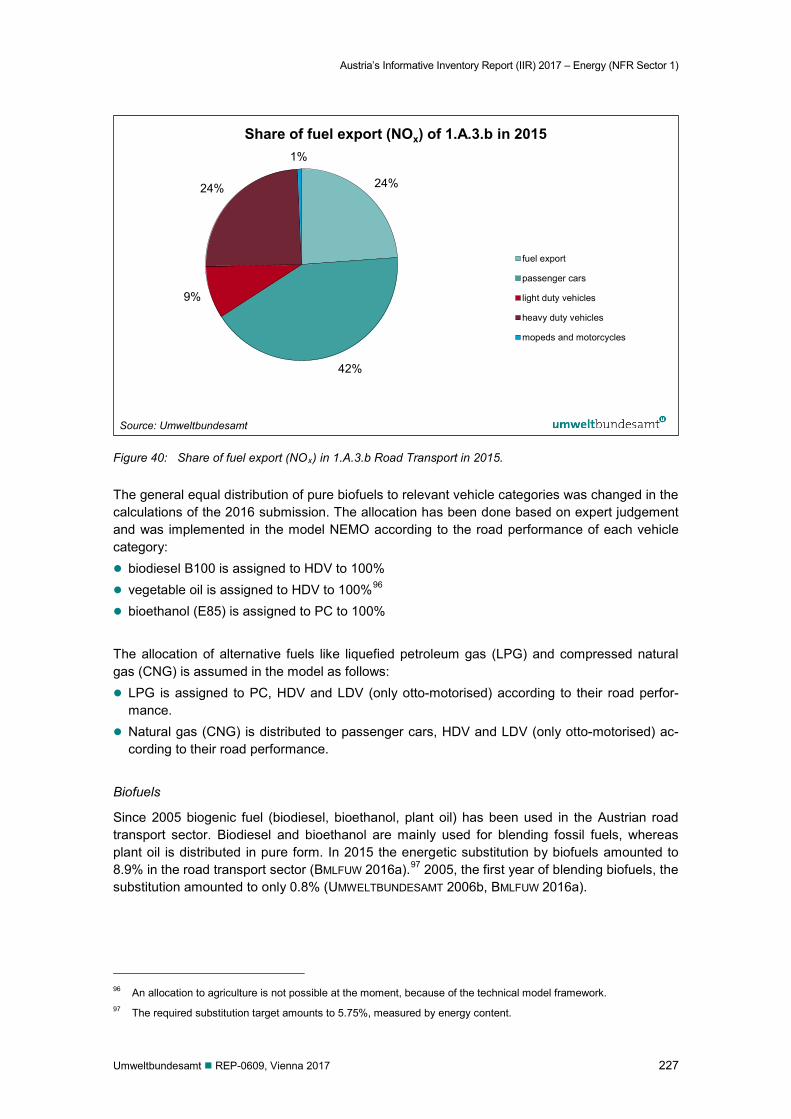
Austria’s Informative Inventory Report (IIR) 2017 – Energy (NFR Sector 1)
Umweltbundesamt REP-0609, Vienna 2017 227
Figure 40: Share of fuel export (NOx) in 1.A.3.b Road Transport in 2015.
The general equal distribution of pure biofuels to relevant vehicle categories was changed in the calculations of the 2016 submission. The allocation has been done based on expert judgement and was implemented in the model NEMO according to the road performance of each vehicle category: biodiesel B100 is assigned to HDV to 100% vegetable oil is assigned to HDV to 100%96 bioethanol (E85) is assigned to PC to 100% The allocation of alternative fuels like liquefied petroleum gas (LPG) and compressed natural gas (CNG) is assumed in the model as follows: LPG is assigned to PC, HDV and LDV (only otto-motorised) according to their road perfor-
mance. Natural gas (CNG) is distributed to passenger cars, HDV and LDV (only otto-motorised) ac-
cording to their road performance.
Biofuels
Since 2005 biogenic fuel (biodiesel, bioethanol, plant oil) has been used in the Austrian road transport sector. Biodiesel and bioethanol are mainly used for blending fossil fuels, whereas plant oil is distributed in pure form. In 2015 the energetic substitution by biofuels amounted to 8.9% in the road transport sector (BMLFUW 2016a).97 2005, the first year of blending biofuels, the substitution amounted to only 0.8% (UMWELTBUNDESAMT 2006b, BMLFUW 2016a).
96 An allocation to agriculture is not possible at the moment, because of the technical model framework. 97 The required substitution target amounts to 5.75%, measured by energy content.
24%
42%
9%
24%
1%
Share of fuel export (NOx) of 1.A.3.b in 2015
fuel export
passenger cars
light duty vehicles
heavy duty vehicles
mopeds and motorcycles
Source: Umweltbundesamt
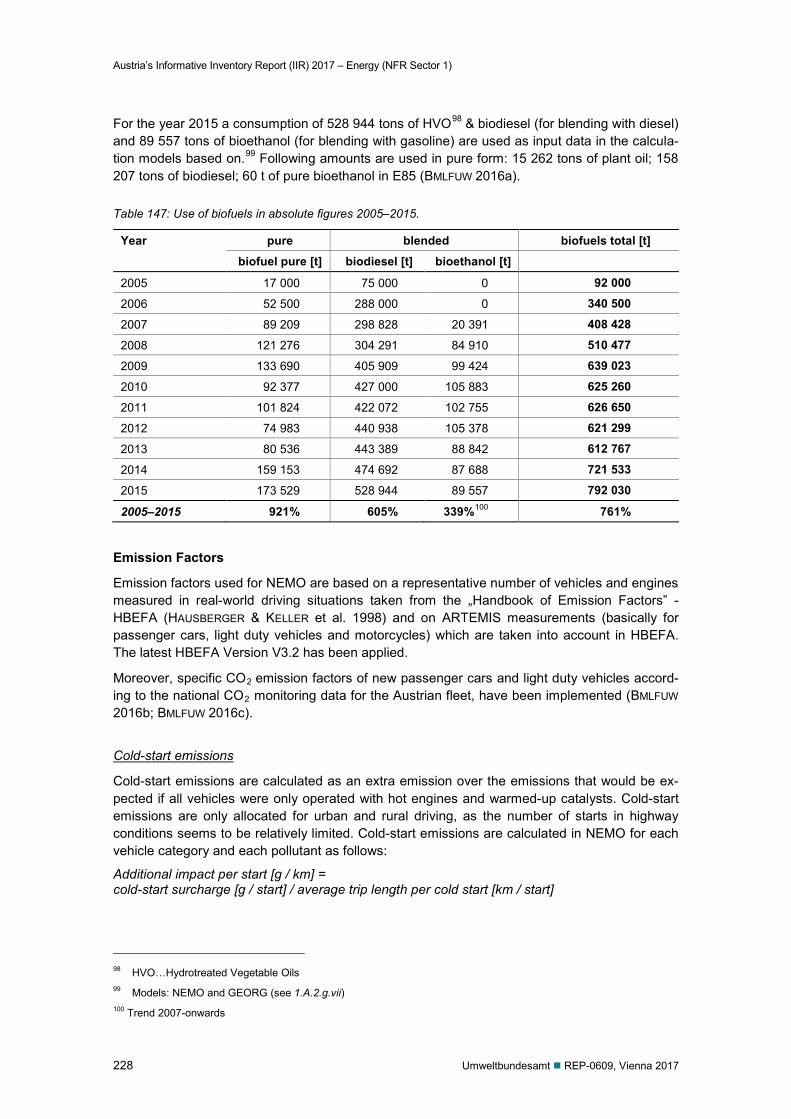
Austria’s Informative Inventory Report (IIR) 2017 – Energy (NFR Sector 1)
228 Umweltbundesamt REP-0609, Vienna 2017
For the year 2015 a consumption of 528 944 tons of HVO98 & biodiesel (for blending with diesel) and 89 557 tons of bioethanol (for blending with gasoline) are used as input data in the calcula-tion models based on.99 Following amounts are used in pure form: 15 262 tons of plant oil; 158 207 tons of biodiesel; 60 t of pure bioethanol in E85 (BMLFUW 2016a).
Table 147: Use of biofuels in absolute figures 2005–2015.
Year pure blended biofuels total [t] biofuel pure [t] biodiesel [t] bioethanol [t]
2005 17 000 75 000 0 92 000
2006 52 500 288 000 0 340 500
2007 89 209 298 828 20 391 408 428
2008 121 276 304 291 84 910 510 477
2009 133 690 405 909 99 424 639 023
2010 92 377 427 000 105 883 625 260
2011 101 824 422 072 102 755 626 650
2012 74 983 440 938 105 378 621 299
2013 80 536 443 389 88 842 612 767
2014 159 153 474 692 87 688 721 533
2015 173 529 528 944 89 557 792 030
2005–2015 921% 605% 339%100 761%
Emission Factors
Emission factors used for NEMO are based on a representative number of vehicles and engines measured in real-world driving situations taken from the „Handbook of Emission Factors” - HBEFA (HAUSBERGER & KELLER et al. 1998) and on ARTEMIS measurements (basically for passenger cars, light duty vehicles and motorcycles) which are taken into account in HBEFA. The latest HBEFA Version V3.2 has been applied.
Moreover, specific CO2 emission factors of new passenger cars and light duty vehicles accord-ing to the national CO2 monitoring data for the Austrian fleet, have been implemented (BMLFUW 2016b; BMLFUW 2016c). Cold-start emissions
Cold-start emissions are calculated as an extra emission over the emissions that would be ex-pected if all vehicles were only operated with hot engines and warmed-up catalysts. Cold-start emissions are only allocated for urban and rural driving, as the number of starts in highway conditions seems to be relatively limited. Cold-start emissions are calculated in NEMO for each vehicle category and each pollutant as follows:
Additional impact per start [g / km] = cold-start surcharge [g / start] / average trip length per cold start [km / start]
98 HVO…Hydrotreated Vegetable Oils 99 Models: NEMO and GEORG (see 1.A.2.g.vii) 100 Trend 2007-onwards
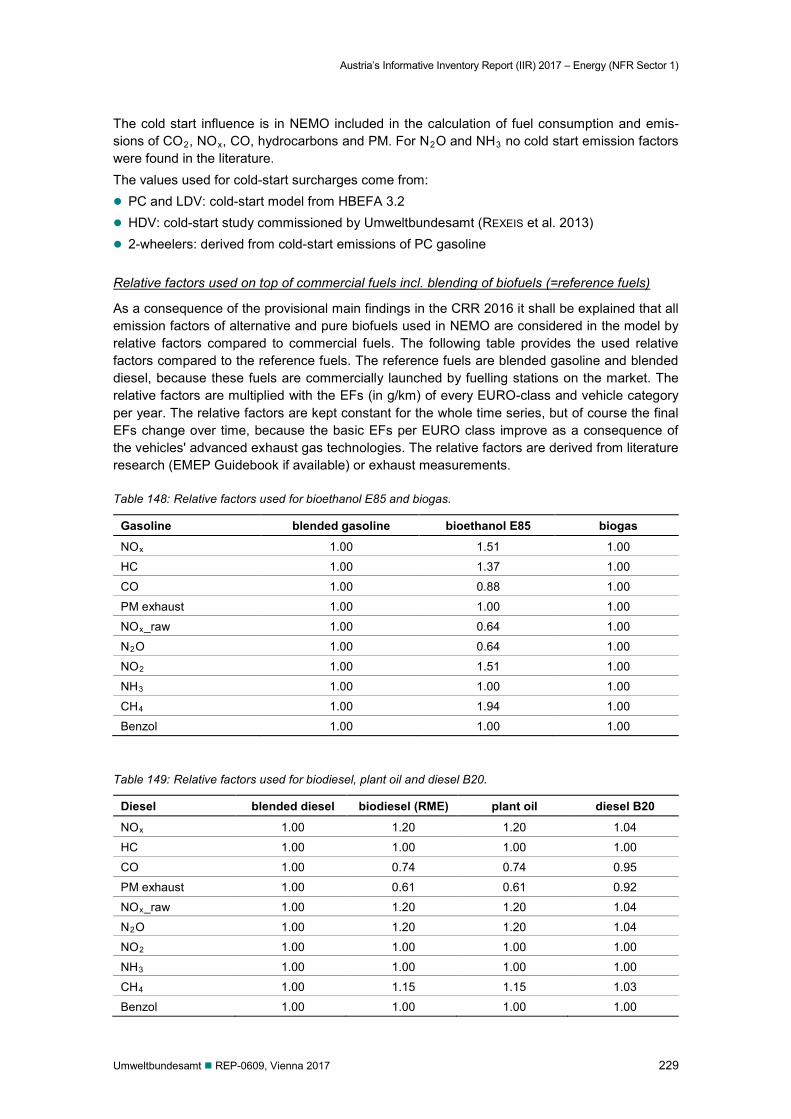
Austria’s Informative Inventory Report (IIR) 2017 – Energy (NFR Sector 1)
Umweltbundesamt REP-0609, Vienna 2017 229
The cold start influence is in NEMO included in the calculation of fuel consumption and emis-sions of CO2, NOx, CO, hydrocarbons and PM. For N2O and NH3 no cold start emission factors were found in the literature. The values used for cold-start surcharges come from: PC and LDV: cold-start model from HBEFA 3.2 HDV: cold-start study commissioned by Umweltbundesamt (REXEIS et al. 2013) 2-wheelers: derived from cold-start emissions of PC gasoline Relative factors used on top of commercial fuels incl. blending of biofuels (=reference fuels)
As a consequence of the provisional main findings in the CRR 2016 it shall be explained that all emission factors of alternative and pure biofuels used in NEMO are considered in the model by relative factors compared to commercial fuels. The following table provides the used relative factors compared to the reference fuels. The reference fuels are blended gasoline and blended diesel, because these fuels are commercially launched by fuelling stations on the market. The relative factors are multiplied with the EFs (in g/km) of every EURO-class and vehicle category per year. The relative factors are kept constant for the whole time series, but of course the final EFs change over time, because the basic EFs per EURO class improve as a consequence of the vehicles' advanced exhaust gas technologies. The relative factors are derived from literature research (EMEP Guidebook if available) or exhaust measurements.
Table 148: Relative factors used for bioethanol E85 and biogas.
Gasoline blended gasoline bioethanol E85 biogas
NOx 1.00 1.51 1.00
HC 1.00 1.37 1.00
CO 1.00 0.88 1.00
PM exhaust 1.00 1.00 1.00
NOx_raw 1.00 0.64 1.00
N2O 1.00 0.64 1.00
NO2 1.00 1.51 1.00
NH3 1.00 1.00 1.00
CH4 1.00 1.94 1.00
Benzol 1.00 1.00 1.00
Table 149: Relative factors used for biodiesel, plant oil and diesel B20.
Diesel blended diesel biodiesel (RME) plant oil diesel B20
NOx 1.00 1.20 1.20 1.04
HC 1.00 1.00 1.00 1.00
CO 1.00 0.74 0.74 0.95
PM exhaust 1.00 0.61 0.61 0.92
NOx_raw 1.00 1.20 1.20 1.04
N2O 1.00 1.20 1.20 1.04
NO2 1.00 1.00 1.00 1.00
NH3 1.00 1.00 1.00 1.00
CH4 1.00 1.15 1.15 1.03
Benzol 1.00 1.00 1.00 1.00
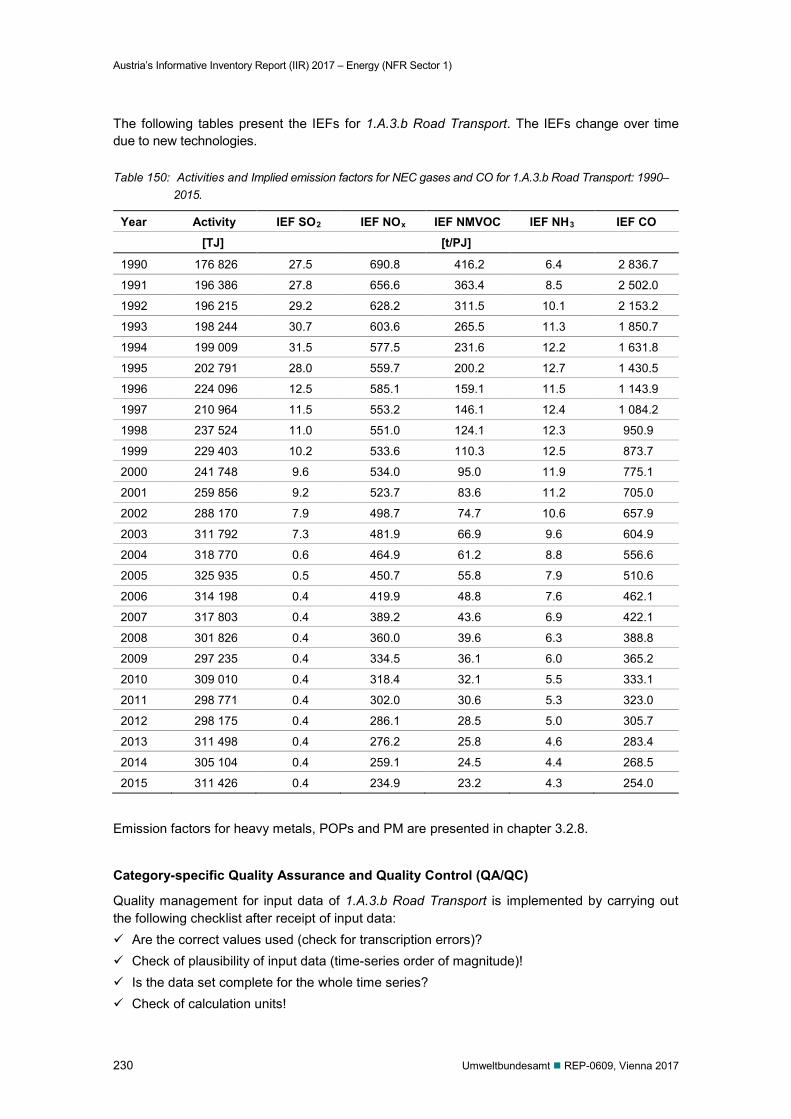
Austria’s Informative Inventory Report (IIR) 2017 – Energy (NFR Sector 1)
230 Umweltbundesamt REP-0609, Vienna 2017
The following tables present the IEFs for 1.A.3.b Road Transport. The IEFs change over time due to new technologies.
Table 150: Activities and Implied emission factors for NEC gases and CO for 1.A.3.b Road Transport: 1990–2015.
Year Activity IEF SO2 IEF NOx IEF NMVOC IEF NH3 IEF CO [TJ] [t/PJ]
1990 176 826 27.5 690.8 416.2 6.4 2 836.7
1991 196 386 27.8 656.6 363.4 8.5 2 502.0
1992 196 215 29.2 628.2 311.5 10.1 2 153.2
1993 198 244 30.7 603.6 265.5 11.3 1 850.7
1994 199 009 31.5 577.5 231.6 12.2 1 631.8
1995 202 791 28.0 559.7 200.2 12.7 1 430.5
1996 224 096 12.5 585.1 159.1 11.5 1 143.9
1997 210 964 11.5 553.2 146.1 12.4 1 084.2
1998 237 524 11.0 551.0 124.1 12.3 950.9
1999 229 403 10.2 533.6 110.3 12.5 873.7
2000 241 748 9.6 534.0 95.0 11.9 775.1
2001 259 856 9.2 523.7 83.6 11.2 705.0
2002 288 170 7.9 498.7 74.7 10.6 657.9
2003 311 792 7.3 481.9 66.9 9.6 604.9
2004 318 770 0.6 464.9 61.2 8.8 556.6
2005 325 935 0.5 450.7 55.8 7.9 510.6
2006 314 198 0.4 419.9 48.8 7.6 462.1
2007 317 803 0.4 389.2 43.6 6.9 422.1
2008 301 826 0.4 360.0 39.6 6.3 388.8
2009 297 235 0.4 334.5 36.1 6.0 365.2
2010 309 010 0.4 318.4 32.1 5.5 333.1
2011 298 771 0.4 302.0 30.6 5.3 323.0
2012 298 175 0.4 286.1 28.5 5.0 305.7
2013 311 498 0.4 276.2 25.8 4.6 283.4
2014 305 104 0.4 259.1 24.5 4.4 268.5
2015 311 426 0.4 234.9 23.2 4.3 254.0
Emission factors for heavy metals, POPs and PM are presented in chapter 3.2.8.
Category-specific Quality Assurance and Quality Control (QA/QC)
Quality management for input data of 1.A.3.b Road Transport is implemented by carrying out the following checklist after receipt of input data: Are the correct values used (check for transcription errors)? Check of plausibility of input data (time-series order of magnitude)! Is the data set complete for the whole time series? Check of calculation units!
Austria’s Informative Inventory Report (IIR) 2017 – Energy (NFR Sector 1)
Umweltbundesamt REP-0609, Vienna 2017 231
Check of plausibility of results (time-series order of magnitude)! Are all references clearly made? Are all assumptions documented?
Category-specific Recalculations
For the year 2014 marginal changes occurred due to revised levels for liquefied petroleum gas (LPG) and biogas in the national energy balance. However, there has been a recalculation in the subcategories 1.A.3.b.i and 1.A.3.b.ii as specific fuel consumption per vehicle kilometer has been revised upwards, which was also explained in response to a question raised during the ini-tial checks of the annual ESD Review 2017. This recalculation resulted in a slight increase of domestic fuel consumption of road transport for the years 2011–2014. Affected vehicle catego-ries for the recalculation in domestic road transport were passenger cars (2011, 2012, 2013, 2014) and light duty vehicles (2013, 2014). The reason for this recalculation was updated infor-mation especially on the specific diesel consumption of PCs and LDVs per vehicle kilometre ac-cording to the latest vehicle measurements in independent laboratories. This results vice versa in a reduced amount of diesel which can be allocated to fuel exports. This is due to the Austrian methodology for estimating GHG from road transport (please see NIR 2016, p.126 – fuel ex-port), where the total fuel sold in Austria is subtracted by the inland road transport and the off-road transport to derive fuel exports. There cannot be any underestimation in total fuel con-sumption, because the amount of total fuel sold in Austria taken from the energy balance is the value which determines the GHG emissions of transport. The recalculation therefore did not change the total GHG emissions from transport but only the contributions from the sub-categories. Since fuel export is mainly characterised by truck traffic with HDV the revision of in-land consumption pops up in the category 1A3biii (heavy duty vehicles in fuel export).
Category-specific Planned Improvements In response to the ERT’s question on an update on the progress of CH4 and N2O emissions as-sociated with biomass (ARR 2014 para 30) and the provisional main findings of the CRR 2016, Austria does not plan to separate emissions from biomass fuels, because most of these fuels is used in blended diesel and gasoline and therefore a separation of N2O and CH4 emissions from this fuels would be 'artificial'. From Austria’s viewpoint the current reporting is more transparent in the manner that emissions from gasoline and diesel cars are reported adequately to the ac-cording fuels.
3.2.7 Other mobile sources – Off Road
Off-road sources are mobile engines and mobile machinery in the NFR sectors 1.A.2.g.vii Indus-try, 1.A.3.c Railways, 1.A.3.d Navigation, 1.A.4.b.2 Household and Gardening, 1.A.4.c.2 Agricul-ture and Forestry and 1.A.5.b Military activities.
3.2.7.1 NFR 1.A.2.g.vii Off-road vehicles and other machinery
Methodological Issues
Energy consumption and emissions of off-road traffic in Austria are calculated with the model GEORG (Grazer Emissionsmodell für Off-Road Geräte). This model has been developed within a study about off-road emissions in Austria (HAUSBERGER 2000). The study was prepared to im-prove the poor data quality in this sector. The following categories were taken into account: 1.A.2.f Industry,
Austria’s Informative Inventory Report (IIR) 2017 – Energy (NFR Sector 1)
232 Umweltbundesamt REP-0609, Vienna 2017
1.A.3.c Railways, 1.A.3.d Navigation, 1.A.4.b Household and Gardening, 1.A.4.c Agriculture and Forestry, 1.A.5 Military activities. Input data to the model are: Machinery stock data (obtained from data on licences, through inquiries and statistical ex-
trapolation); Assumptions on drop-out rates of machinery (broken down machinery will be replaced); Operating time (obtained through inquiries), related to age of machinery.
From machinery stock data and drop-out rates an age structure of the off-road machinery was obtained by GEORG. Four categories of engine types were considered. Depending on the fuel consumption of the engine the ratio power of the engine was calculated. Emissions were calcu-lated by multiplying an engine specific emission factor (expressed in g/kWh) by the average en-gine power, the operating time and the number of vehicles.
With this method national fuel consumption and national emissions are calculated (bottom-up). Calculated fuel consumption of off-road traffic is then summed up with total fuel consumption of inland road transport and is compared with total fuel sold in Austria according to the national energy balance. The difference is allocated to fuel export (for details concerning fuel export see 1.A.3.b). The emissions reported for Austria also include the emissions from fuel exports as-suming that the fuel export fleet (mainly travelling on highways) is similar to the Austrian fleet on highways. The used methodology conforms to the requirements of the EMEP/EEA Tier 3 meth-odology. Activity Data
Activity data, vehicle stock and specific fuel consumption for vehicles and machinery (e.g. lead-ers, diggers, etc.), were taken from: Statistik Austria (fuel statistics), Questionnaire to vehicle and machinery users (HAUSBERGER 2000), Interviews with experts and expert judgment
validating the questionnaire results (HAUSBERGER 2000) and Information from vehicle and machinery manufacturers (HAUSBERGER 2000). An allocation of pure biofuels on the off -road sector has not been performed due to lack of da-ta.
Activities used for estimating the emissions of mobile sources in 1.A.2.g.vii are presented in Ta-ble 155. Activities include liquid fuels (diesel, gasoline and biofuels). Emission Factors
The following emission factors for four categories of engine types (average motor capacity) de-pending on the year of construction are used in the GEORG model. They represent emissions according to the engine power output and also fuel consumption. They are close to the emission standards for diesel NRMM (Non-Road Mobile Machinery). The values for 2014 represent the year where the latest emission standard Stage IV has been introduced on EU level.
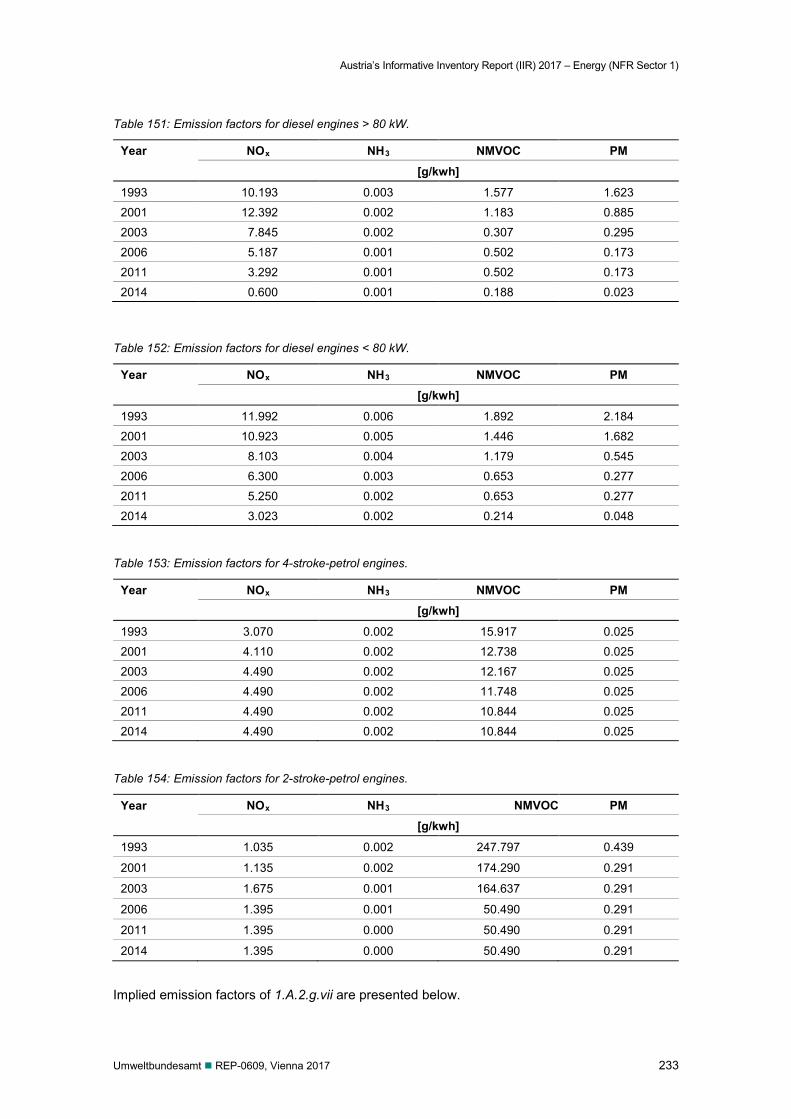
Austria’s Informative Inventory Report (IIR) 2017 – Energy (NFR Sector 1)
Umweltbundesamt REP-0609, Vienna 2017 233
Table 151: Emission factors for diesel engines > 80 kW.
Year NOx NH3 NMVOC PM [g/kwh]
1993 10.193 0.003 1.577 1.623
2001 12.392 0.002 1.183 0.885
2003 7.845 0.002 0.307 0.295
2006 5.187 0.001 0.502 0.173
2011 3.292 0.001 0.502 0.173
2014 0.600 0.001 0.188 0.023
Table 152: Emission factors for diesel engines < 80 kW.
Year NOx NH3 NMVOC PM [g/kwh]
1993 11.992 0.006 1.892 2.184
2001 10.923 0.005 1.446 1.682
2003 8.103 0.004 1.179 0.545
2006 6.300 0.003 0.653 0.277
2011 5.250 0.002 0.653 0.277
2014 3.023 0.002 0.214 0.048
Table 153: Emission factors for 4-stroke-petrol engines.
Year NOx NH3 NMVOC PM [g/kwh]
1993 3.070 0.002 15.917 0.025
2001 4.110 0.002 12.738 0.025
2003 4.490 0.002 12.167 0.025
2006 4.490 0.002 11.748 0.025
2011 4.490 0.002 10.844 0.025
2014 4.490 0.002 10.844 0.025
Table 154: Emission factors for 2-stroke-petrol engines.
Year NOx NH3 NMVOC PM [g/kwh]
1993 1.035 0.002 247.797 0.439
2001 1.135 0.002 174.290 0.291
2003 1.675 0.001 164.637 0.291
2006 1.395 0.001 50.490 0.291
2011 1.395 0.000 50.490 0.291
2014 1.395 0.000 50.490 0.291
Implied emission factors of 1.A.2.g.vii are presented below.
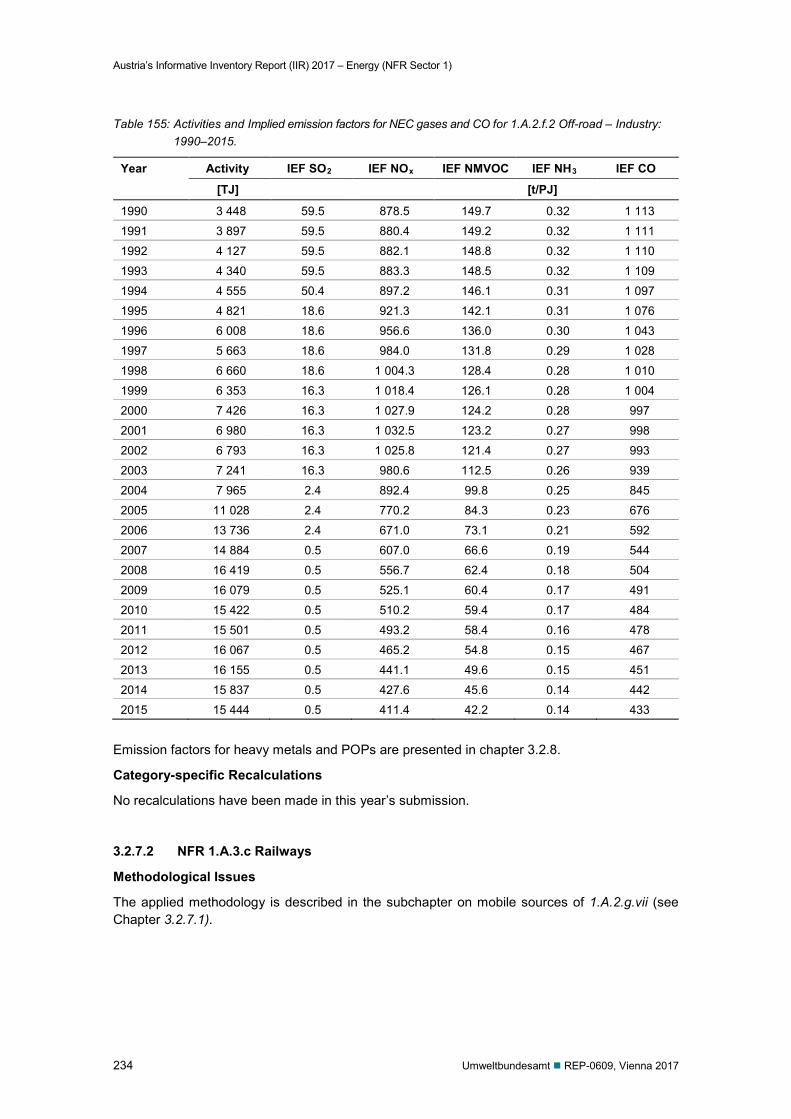
Austria’s Informative Inventory Report (IIR) 2017 – Energy (NFR Sector 1)
234 Umweltbundesamt REP-0609, Vienna 2017
Table 155: Activities and Implied emission factors for NEC gases and CO for 1.A.2.f.2 Off-road – Industry: 1990–2015.
Year Activity IEF SO2 IEF NOx IEF NMVOC IEF NH3 IEF CO
[TJ] [t/PJ]
1990 3 448 59.5 878.5 149.7 0.32 1 113
1991 3 897 59.5 880.4 149.2 0.32 1 111
1992 4 127 59.5 882.1 148.8 0.32 1 110
1993 4 340 59.5 883.3 148.5 0.32 1 109
1994 4 555 50.4 897.2 146.1 0.31 1 097
1995 4 821 18.6 921.3 142.1 0.31 1 076
1996 6 008 18.6 956.6 136.0 0.30 1 043
1997 5 663 18.6 984.0 131.8 0.29 1 028
1998 6 660 18.6 1 004.3 128.4 0.28 1 010
1999 6 353 16.3 1 018.4 126.1 0.28 1 004
2000 7 426 16.3 1 027.9 124.2 0.28 997
2001 6 980 16.3 1 032.5 123.2 0.27 998
2002 6 793 16.3 1 025.8 121.4 0.27 993
2003 7 241 16.3 980.6 112.5 0.26 939
2004 7 965 2.4 892.4 99.8 0.25 845
2005 11 028 2.4 770.2 84.3 0.23 676
2006 13 736 2.4 671.0 73.1 0.21 592
2007 14 884 0.5 607.0 66.6 0.19 544
2008 16 419 0.5 556.7 62.4 0.18 504
2009 16 079 0.5 525.1 60.4 0.17 491
2010 15 422 0.5 510.2 59.4 0.17 484
2011 15 501 0.5 493.2 58.4 0.16 478
2012 16 067 0.5 465.2 54.8 0.15 467
2013 16 155 0.5 441.1 49.6 0.15 451
2014 15 837 0.5 427.6 45.6 0.14 442
2015 15 444 0.5 411.4 42.2 0.14 433
Emission factors for heavy metals and POPs are presented in chapter 3.2.8.
Category-specific Recalculations
No recalculations have been made in this year’s submission.
3.2.7.2 NFR 1.A.3.c Railways
Methodological Issues
The applied methodology is described in the subchapter on mobile sources of 1.A.2.g.vii (see Chapter 3.2.7.1).
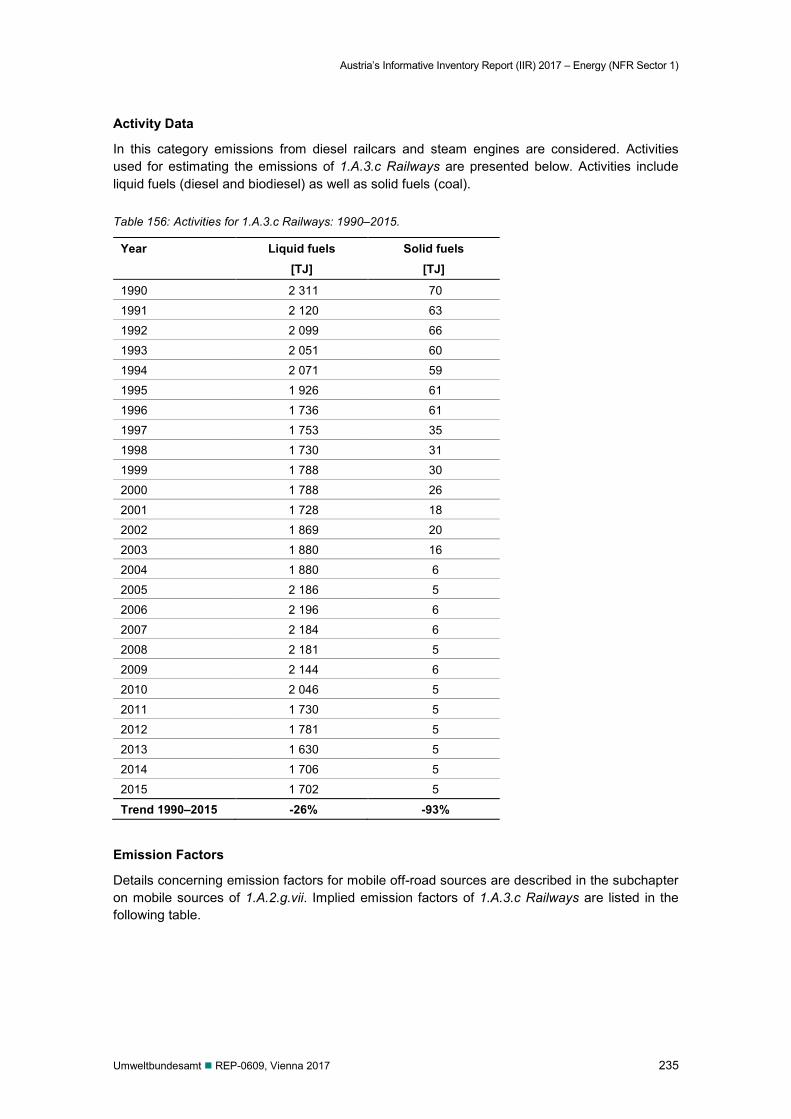
Austria’s Informative Inventory Report (IIR) 2017 – Energy (NFR Sector 1)
Umweltbundesamt REP-0609, Vienna 2017 235
Activity Data
In this category emissions from diesel railcars and steam engines are considered. Activities used for estimating the emissions of 1.A.3.c Railways are presented below. Activities include liquid fuels (diesel and biodiesel) as well as solid fuels (coal).
Table 156: Activities for 1.A.3.c Railways: 1990–2015.
Year Liquid fuels [TJ]
Solid fuels [TJ]
1990 2 311 70
1991 2 120 63
1992 2 099 66
1993 2 051 60
1994 2 071 59
1995 1 926 61
1996 1 736 61
1997 1 753 35
1998 1 730 31
1999 1 788 30
2000 1 788 26
2001 1 728 18
2002 1 869 20
2003 1 880 16
2004 1 880 6
2005 2 186 5
2006 2 196 6
2007 2 184 6
2008 2 181 5
2009 2 144 6
2010 2 046 5
2011 1 730 5
2012 1 781 5
2013 1 630 5
2014 1 706 5
2015 1 702 5
Trend 1990–2015 -26% -93%
Emission Factors
Details concerning emission factors for mobile off-road sources are described in the subchapter on mobile sources of 1.A.2.g.vii. Implied emission factors of 1.A.3.c Railways are listed in the following table.
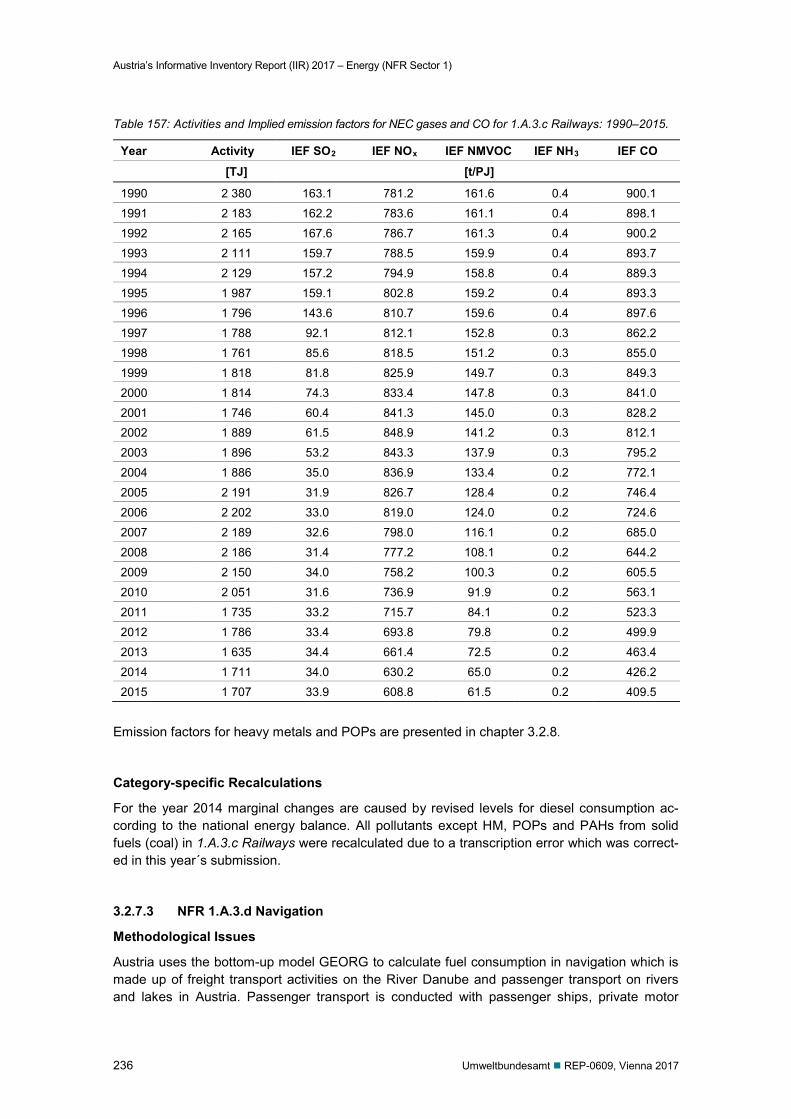
Austria’s Informative Inventory Report (IIR) 2017 – Energy (NFR Sector 1)
236 Umweltbundesamt REP-0609, Vienna 2017
Table 157: Activities and Implied emission factors for NEC gases and CO for 1.A.3.c Railways: 1990–2015.
Year Activity IEF SO2 IEF NOx IEF NMVOC IEF NH3 IEF CO [TJ] [t/PJ]
1990 2 380 163.1 781.2 161.6 0.4 900.1
1991 2 183 162.2 783.6 161.1 0.4 898.1
1992 2 165 167.6 786.7 161.3 0.4 900.2
1993 2 111 159.7 788.5 159.9 0.4 893.7
1994 2 129 157.2 794.9 158.8 0.4 889.3
1995 1 987 159.1 802.8 159.2 0.4 893.3
1996 1 796 143.6 810.7 159.6 0.4 897.6
1997 1 788 92.1 812.1 152.8 0.3 862.2
1998 1 761 85.6 818.5 151.2 0.3 855.0
1999 1 818 81.8 825.9 149.7 0.3 849.3
2000 1 814 74.3 833.4 147.8 0.3 841.0
2001 1 746 60.4 841.3 145.0 0.3 828.2 2002 1 889 61.5 848.9 141.2 0.3 812.1
2003 1 896 53.2 843.3 137.9 0.3 795.2
2004 1 886 35.0 836.9 133.4 0.2 772.1
2005 2 191 31.9 826.7 128.4 0.2 746.4
2006 2 202 33.0 819.0 124.0 0.2 724.6
2007 2 189 32.6 798.0 116.1 0.2 685.0
2008 2 186 31.4 777.2 108.1 0.2 644.2
2009 2 150 34.0 758.2 100.3 0.2 605.5
2010 2 051 31.6 736.9 91.9 0.2 563.1
2011 1 735 33.2 715.7 84.1 0.2 523.3
2012 1 786 33.4 693.8 79.8 0.2 499.9
2013 1 635 34.4 661.4 72.5 0.2 463.4
2014 1 711 34.0 630.2 65.0 0.2 426.2
2015 1 707 33.9 608.8 61.5 0.2 409.5
Emission factors for heavy metals and POPs are presented in chapter 3.2.8.
Category-specific Recalculations
For the year 2014 marginal changes are caused by revised levels for diesel consumption ac-cording to the national energy balance. All pollutants except HM, POPs and PAHs from solid fuels (coal) in 1.A.3.c Railways were recalculated due to a transcription error which was correct-ed in this year´s submission.
3.2.7.3 NFR 1.A.3.d Navigation
Methodological Issues
Austria uses the bottom-up model GEORG to calculate fuel consumption in navigation which is made up of freight transport activities on the River Danube and passenger transport on rivers and lakes in Austria. Passenger transport is conducted with passenger ships, private motor
Austria’s Informative Inventory Report (IIR) 2017 – Energy (NFR Sector 1)
Umweltbundesamt REP-0609, Vienna 2017 237
boats and sailing boats. The inland navigation fleet (stock) was obtained from registration statis-tics from provincial governments, the average yearly operating time as well as the average fuel consumption per hour from questionnaires to fleet operators and/or manufacturers’ data. Statis-tical data (tkm) for freight activities on the River Danube were obtained from (STATISTIK AUSTRIA 2016e). Additionally fuel consumption for working boats is taken into account in the national fuel consumption of navigation.
Emissions are calculated bottom-up with the model GEORG. The inland navigation fleet (stock) was obtained from registration statistics from provincial governments, the average yearly oper-ating time as well as the average fuel consumption per hour from questionnaires to fleet opera-tors and/or manufacturers’ data. Statistical data (tkm) for freight activities on the River Danube were obtained from (STATISTIK AUSTRIA 2016e). Methodological issues of the model GEORG are described in the subchapter on mobile sources of 1.A.2.g.vii (see Chapter 3.2.7.1).
Activity Data
This sector includes emissions from fuels used by vessels of all flags that depart and arrive in Austria (excludes fishing) and emissions from international inland waterways, including emis-sions from journeys that depart in Austria and arrive in a different country. Activities used for es-timating the emissions of 1.A.3.d Navigation are presented in Table 158. Activities include liquid fuels (diesel, gasoline and biofuels).
Emission Factors
Details concerning emission factors for mobile off-road sources are described in the subchapter on mobile sources of 1.A.2.g.vii (see Chapter 3.2.7.1). Implied emission factors of 1.A.3.d Navi-gation are listed below.
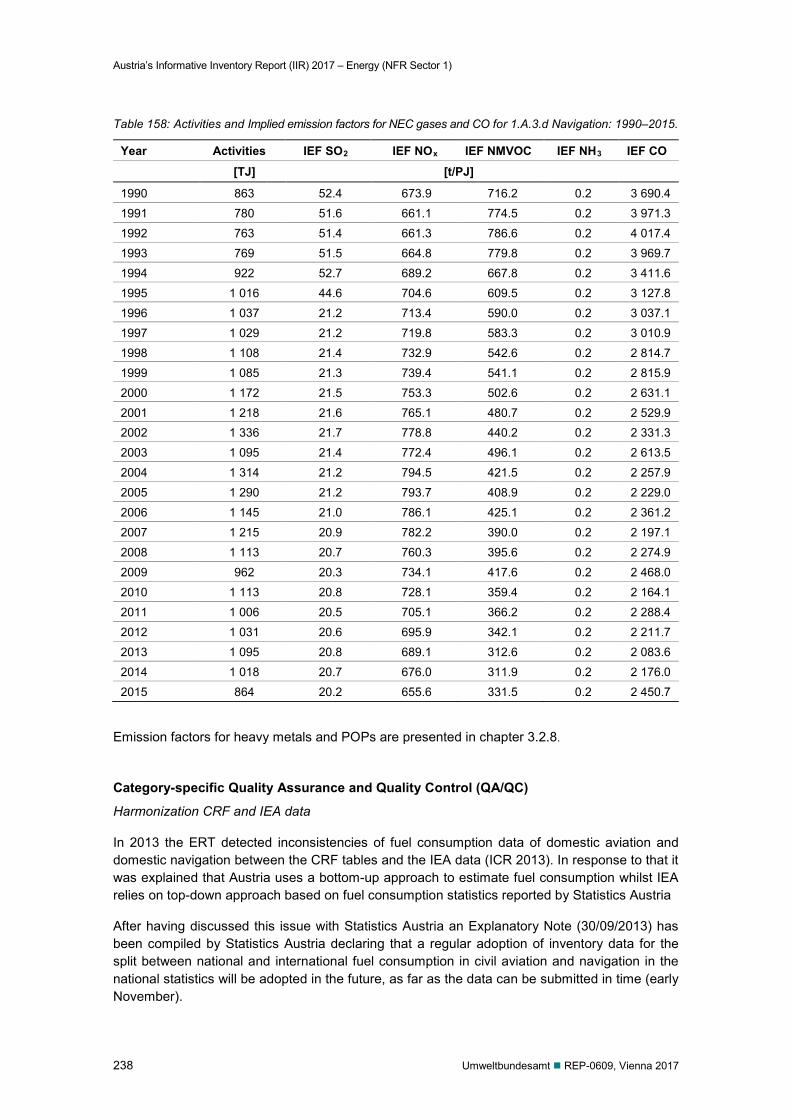
Austria’s Informative Inventory Report (IIR) 2017 – Energy (NFR Sector 1)
238 Umweltbundesamt REP-0609, Vienna 2017
Table 158: Activities and Implied emission factors for NEC gases and CO for 1.A.3.d Navigation: 1990–2015.
Year Activities IEF SO2 IEF NOx IEF NMVOC IEF NH3 IEF CO [TJ] [t/PJ]
1990 863 52.4 673.9 716.2 0.2 3 690.4
1991 780 51.6 661.1 774.5 0.2 3 971.3
1992 763 51.4 661.3 786.6 0.2 4 017.4
1993 769 51.5 664.8 779.8 0.2 3 969.7
1994 922 52.7 689.2 667.8 0.2 3 411.6
1995 1 016 44.6 704.6 609.5 0.2 3 127.8
1996 1 037 21.2 713.4 590.0 0.2 3 037.1
1997 1 029 21.2 719.8 583.3 0.2 3 010.9
1998 1 108 21.4 732.9 542.6 0.2 2 814.7
1999 1 085 21.3 739.4 541.1 0.2 2 815.9
2000 1 172 21.5 753.3 502.6 0.2 2 631.1
2001 1 218 21.6 765.1 480.7 0.2 2 529.9 2002 1 336 21.7 778.8 440.2 0.2 2 331.3
2003 1 095 21.4 772.4 496.1 0.2 2 613.5
2004 1 314 21.2 794.5 421.5 0.2 2 257.9
2005 1 290 21.2 793.7 408.9 0.2 2 229.0
2006 1 145 21.0 786.1 425.1 0.2 2 361.2
2007 1 215 20.9 782.2 390.0 0.2 2 197.1
2008 1 113 20.7 760.3 395.6 0.2 2 274.9
2009 962 20.3 734.1 417.6 0.2 2 468.0
2010 1 113 20.8 728.1 359.4 0.2 2 164.1
2011 1 006 20.5 705.1 366.2 0.2 2 288.4
2012 1 031 20.6 695.9 342.1 0.2 2 211.7
2013 1 095 20.8 689.1 312.6 0.2 2 083.6
2014 1 018 20.7 676.0 311.9 0.2 2 176.0
2015 864 20.2 655.6 331.5 0.2 2 450.7
Emission factors for heavy metals and POPs are presented in chapter 3.2.8.
Category-specific Quality Assurance and Quality Control (QA/QC)
Harmonization CRF and IEA data
In 2013 the ERT detected inconsistencies of fuel consumption data of domestic aviation and domestic navigation between the CRF tables and the IEA data (ICR 2013). In response to that it was explained that Austria uses a bottom-up approach to estimate fuel consumption whilst IEA relies on top-down approach based on fuel consumption statistics reported by Statistics Austria
After having discussed this issue with Statistics Austria an Explanatory Note (30/09/2013) has been compiled by Statistics Austria declaring that a regular adoption of inventory data for the split between national and international fuel consumption in civil aviation and navigation in the national statistics will be adopted in the future, as far as the data can be submitted in time (early November).
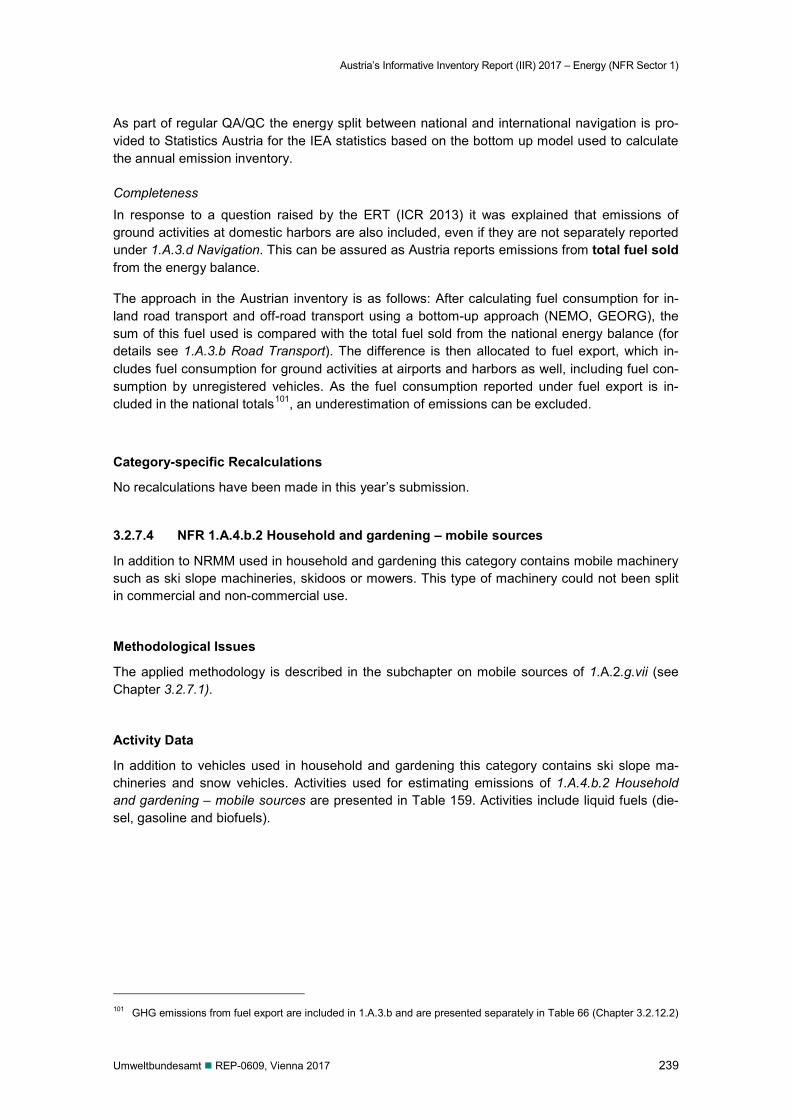
Austria’s Informative Inventory Report (IIR) 2017 – Energy (NFR Sector 1)
Umweltbundesamt REP-0609, Vienna 2017 239
As part of regular QA/QC the energy split between national and international navigation is pro-vided to Statistics Austria for the IEA statistics based on the bottom up model used to calculate the annual emission inventory.
Completeness In response to a question raised by the ERT (ICR 2013) it was explained that emissions of ground activities at domestic harbors are also included, even if they are not separately reported under 1.A.3.d Navigation. This can be assured as Austria reports emissions from total fuel sold from the energy balance.
The approach in the Austrian inventory is as follows: After calculating fuel consumption for in-land road transport and off-road transport using a bottom-up approach (NEMO, GEORG), the sum of this fuel used is compared with the total fuel sold from the national energy balance (for details see 1.A.3.b Road Transport). The difference is then allocated to fuel export, which in-cludes fuel consumption for ground activities at airports and harbors as well, including fuel con-sumption by unregistered vehicles. As the fuel consumption reported under fuel export is in-cluded in the national totals101, an underestimation of emissions can be excluded.
Category-specific Recalculations
No recalculations have been made in this year’s submission.
3.2.7.4 NFR 1.A.4.b.2 Household and gardening – mobile sources
In addition to NRMM used in household and gardening this category contains mobile machinery such as ski slope machineries, skidoos or mowers. This type of machinery could not been split in commercial and non-commercial use.
Methodological Issues
The applied methodology is described in the subchapter on mobile sources of 1.A.2.g.vii (see Chapter 3.2.7.1).
Activity Data
In addition to vehicles used in household and gardening this category contains ski slope ma-chineries and snow vehicles. Activities used for estimating emissions of 1.A.4.b.2 Household and gardening – mobile sources are presented in Table 159. Activities include liquid fuels (die-sel, gasoline and biofuels).
101 GHG emissions from fuel export are included in 1.A.3.b and are presented separately in Table 66 (Chapter 3.2.12.2)
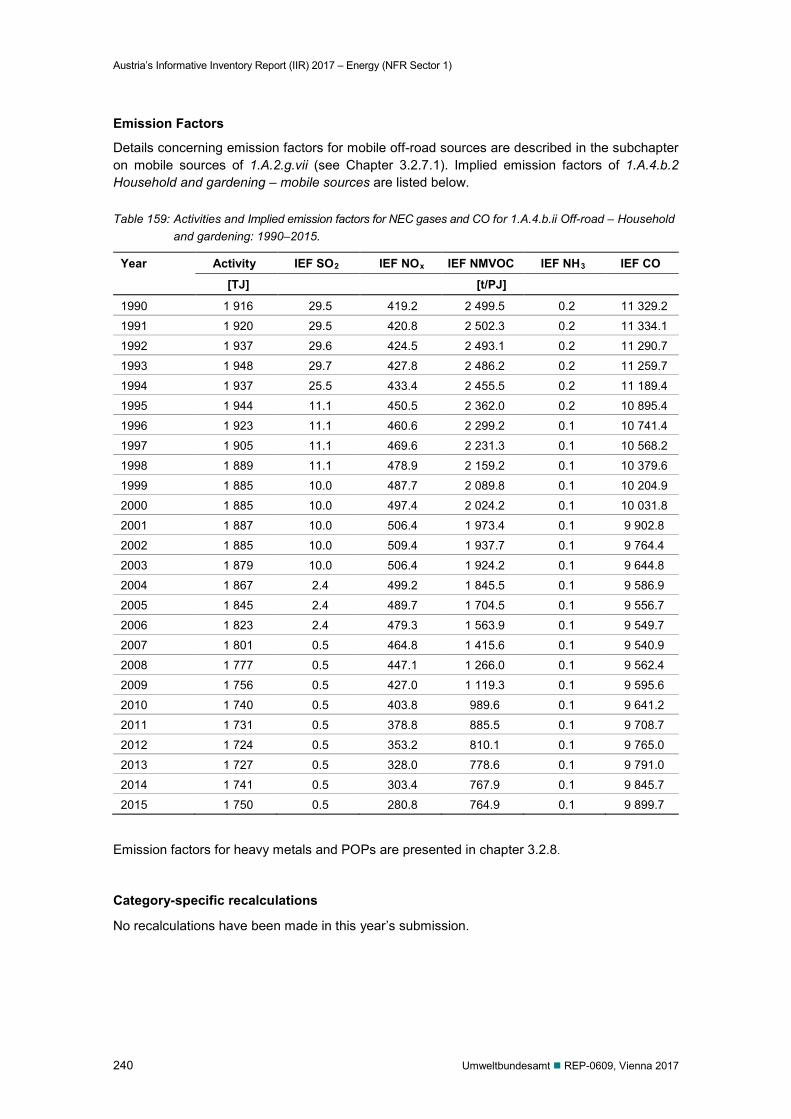
Austria’s Informative Inventory Report (IIR) 2017 – Energy (NFR Sector 1)
240 Umweltbundesamt REP-0609, Vienna 2017
Emission Factors
Details concerning emission factors for mobile off-road sources are described in the subchapter on mobile sources of 1.A.2.g.vii (see Chapter 3.2.7.1). Implied emission factors of 1.A.4.b.2 Household and gardening – mobile sources are listed below.
Table 159: Activities and Implied emission factors for NEC gases and CO for 1.A.4.b.ii Off-road – Household and gardening: 1990–2015.
Year Activity IEF SO2 IEF NOx IEF NMVOC IEF NH3 IEF CO
[TJ] [t/PJ]
1990 1 916 29.5 419.2 2 499.5 0.2 11 329.2
1991 1 920 29.5 420.8 2 502.3 0.2 11 334.1
1992 1 937 29.6 424.5 2 493.1 0.2 11 290.7
1993 1 948 29.7 427.8 2 486.2 0.2 11 259.7
1994 1 937 25.5 433.4 2 455.5 0.2 11 189.4
1995 1 944 11.1 450.5 2 362.0 0.2 10 895.4
1996 1 923 11.1 460.6 2 299.2 0.1 10 741.4
1997 1 905 11.1 469.6 2 231.3 0.1 10 568.2
1998 1 889 11.1 478.9 2 159.2 0.1 10 379.6
1999 1 885 10.0 487.7 2 089.8 0.1 10 204.9
2000 1 885 10.0 497.4 2 024.2 0.1 10 031.8
2001 1 887 10.0 506.4 1 973.4 0.1 9 902.8
2002 1 885 10.0 509.4 1 937.7 0.1 9 764.4
2003 1 879 10.0 506.4 1 924.2 0.1 9 644.8
2004 1 867 2.4 499.2 1 845.5 0.1 9 586.9
2005 1 845 2.4 489.7 1 704.5 0.1 9 556.7
2006 1 823 2.4 479.3 1 563.9 0.1 9 549.7
2007 1 801 0.5 464.8 1 415.6 0.1 9 540.9
2008 1 777 0.5 447.1 1 266.0 0.1 9 562.4
2009 1 756 0.5 427.0 1 119.3 0.1 9 595.6
2010 1 740 0.5 403.8 989.6 0.1 9 641.2
2011 1 731 0.5 378.8 885.5 0.1 9 708.7
2012 1 724 0.5 353.2 810.1 0.1 9 765.0
2013 1 727 0.5 328.0 778.6 0.1 9 791.0
2014 1 741 0.5 303.4 767.9 0.1 9 845.7
2015 1 750 0.5 280.8 764.9 0.1 9 899.7
Emission factors for heavy metals and POPs are presented in chapter 3.2.8.
Category-specific recalculations
No recalculations have been made in this year’s submission.
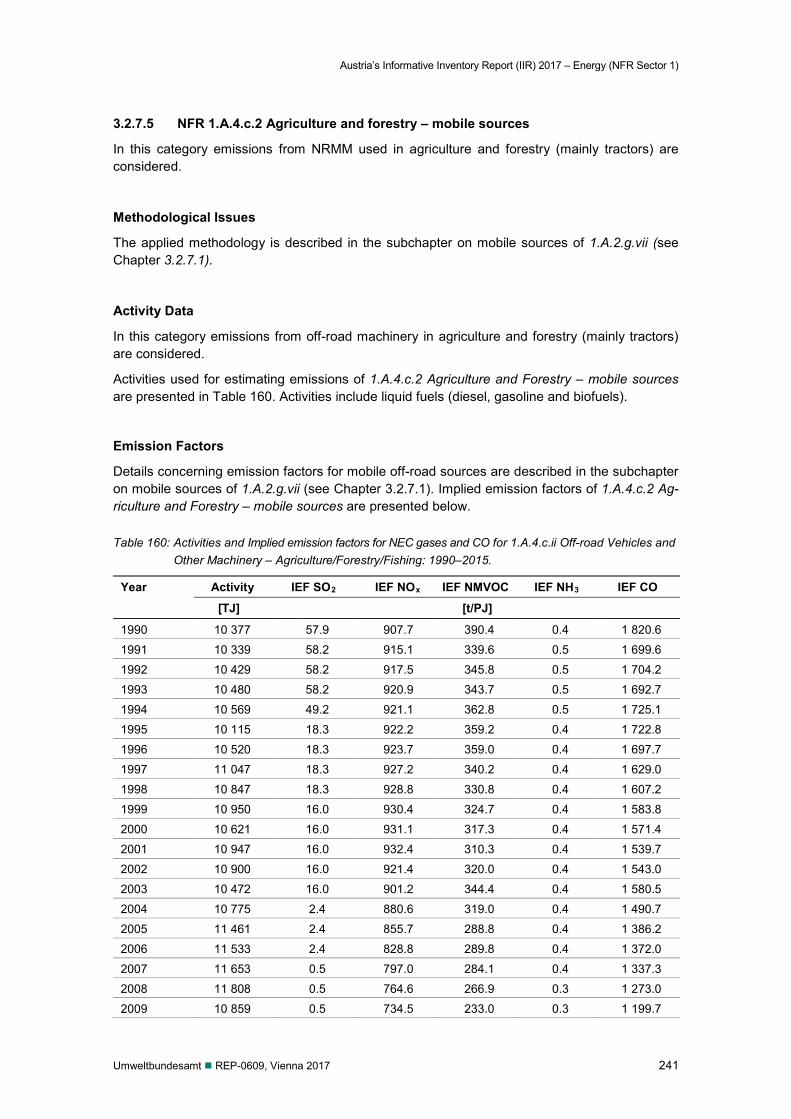
Austria’s Informative Inventory Report (IIR) 2017 – Energy (NFR Sector 1)
Umweltbundesamt REP-0609, Vienna 2017 241
3.2.7.5 NFR 1.A.4.c.2 Agriculture and forestry – mobile sources
In this category emissions from NRMM used in agriculture and forestry (mainly tractors) are considered.
Methodological Issues
The applied methodology is described in the subchapter on mobile sources of 1.A.2.g.vii (see Chapter 3.2.7.1).
Activity Data
In this category emissions from off-road machinery in agriculture and forestry (mainly tractors) are considered.
Activities used for estimating emissions of 1.A.4.c.2 Agriculture and Forestry – mobile sources are presented in Table 160. Activities include liquid fuels (diesel, gasoline and biofuels).
Emission Factors
Details concerning emission factors for mobile off-road sources are described in the subchapter on mobile sources of 1.A.2.g.vii (see Chapter 3.2.7.1). Implied emission factors of 1.A.4.c.2 Ag-riculture and Forestry – mobile sources are presented below.
Table 160: Activities and Implied emission factors for NEC gases and CO for 1.A.4.c.ii Off-road Vehicles and Other Machinery – Agriculture/Forestry/Fishing: 1990–2015.
Year Activity IEF SO2 IEF NOx IEF NMVOC IEF NH3 IEF CO
[TJ] [t/PJ]
1990 10 377 57.9 907.7 390.4 0.4 1 820.6
1991 10 339 58.2 915.1 339.6 0.5 1 699.6
1992 10 429 58.2 917.5 345.8 0.5 1 704.2
1993 10 480 58.2 920.9 343.7 0.5 1 692.7
1994 10 569 49.2 921.1 362.8 0.5 1 725.1
1995 10 115 18.3 922.2 359.2 0.4 1 722.8
1996 10 520 18.3 923.7 359.0 0.4 1 697.7
1997 11 047 18.3 927.2 340.2 0.4 1 629.0
1998 10 847 18.3 928.8 330.8 0.4 1 607.2
1999 10 950 16.0 930.4 324.7 0.4 1 583.8
2000 10 621 16.0 931.1 317.3 0.4 1 571.4
2001 10 947 16.0 932.4 310.3 0.4 1 539.7
2002 10 900 16.0 921.4 320.0 0.4 1 543.0
2003 10 472 16.0 901.2 344.4 0.4 1 580.5
2004 10 775 2.4 880.6 319.0 0.4 1 490.7
2005 11 461 2.4 855.7 288.8 0.4 1 386.2
2006 11 533 2.4 828.8 289.8 0.4 1 372.0
2007 11 653 0.5 797.0 284.1 0.4 1 337.3
2008 11 808 0.5 764.6 266.9 0.3 1 273.0
2009 10 859 0.5 734.5 233.0 0.3 1 199.7
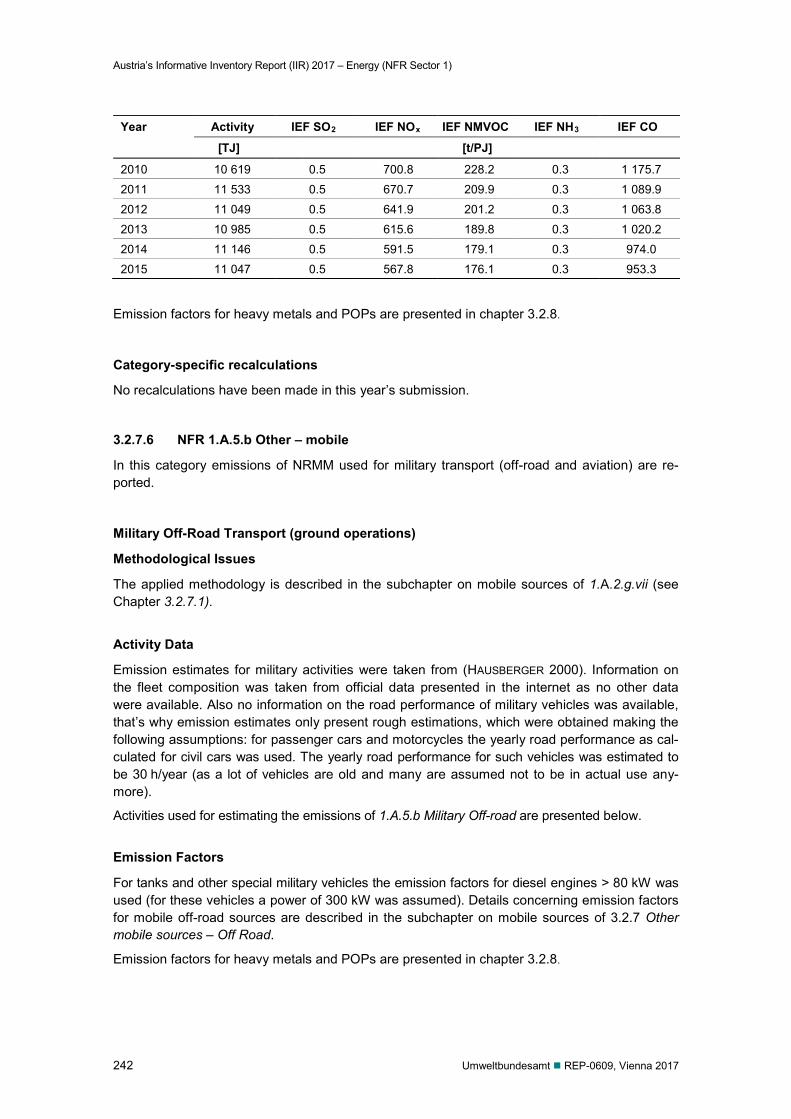
Austria’s Informative Inventory Report (IIR) 2017 – Energy (NFR Sector 1)
242 Umweltbundesamt REP-0609, Vienna 2017
Year Activity IEF SO2 IEF NOx IEF NMVOC IEF NH3 IEF CO
[TJ] [t/PJ]
2010 10 619 0.5 700.8 228.2 0.3 1 175.7
2011 11 533 0.5 670.7 209.9 0.3 1 089.9
2012 11 049 0.5 641.9 201.2 0.3 1 063.8
2013 10 985 0.5 615.6 189.8 0.3 1 020.2
2014 11 146 0.5 591.5 179.1 0.3 974.0
2015 11 047 0.5 567.8 176.1 0.3 953.3
Emission factors for heavy metals and POPs are presented in chapter 3.2.8.
Category-specific recalculations
No recalculations have been made in this year’s submission.
3.2.7.6 NFR 1.A.5.b Other – mobile
In this category emissions of NRMM used for military transport (off-road and aviation) are re-ported.
Military Off-Road Transport (ground operations)
Methodological Issues
The applied methodology is described in the subchapter on mobile sources of 1.A.2.g.vii (see Chapter 3.2.7.1).
Activity Data
Emission estimates for military activities were taken from (HAUSBERGER 2000). Information on the fleet composition was taken from official data presented in the internet as no other data were available. Also no information on the road performance of military vehicles was available, that’s why emission estimates only present rough estimations, which were obtained making the following assumptions: for passenger cars and motorcycles the yearly road performance as cal-culated for civil cars was used. The yearly road performance for such vehicles was estimated to be 30 h/year (as a lot of vehicles are old and many are assumed not to be in actual use any-more).
Activities used for estimating the emissions of 1.A.5.b Military Off-road are presented below.
Emission Factors
For tanks and other special military vehicles the emission factors for diesel engines > 80 kW was used (for these vehicles a power of 300 kW was assumed). Details concerning emission factors for mobile off-road sources are described in the subchapter on mobile sources of 3.2.7 Other mobile sources – Off Road.
Emission factors for heavy metals and POPs are presented in chapter 3.2.8.
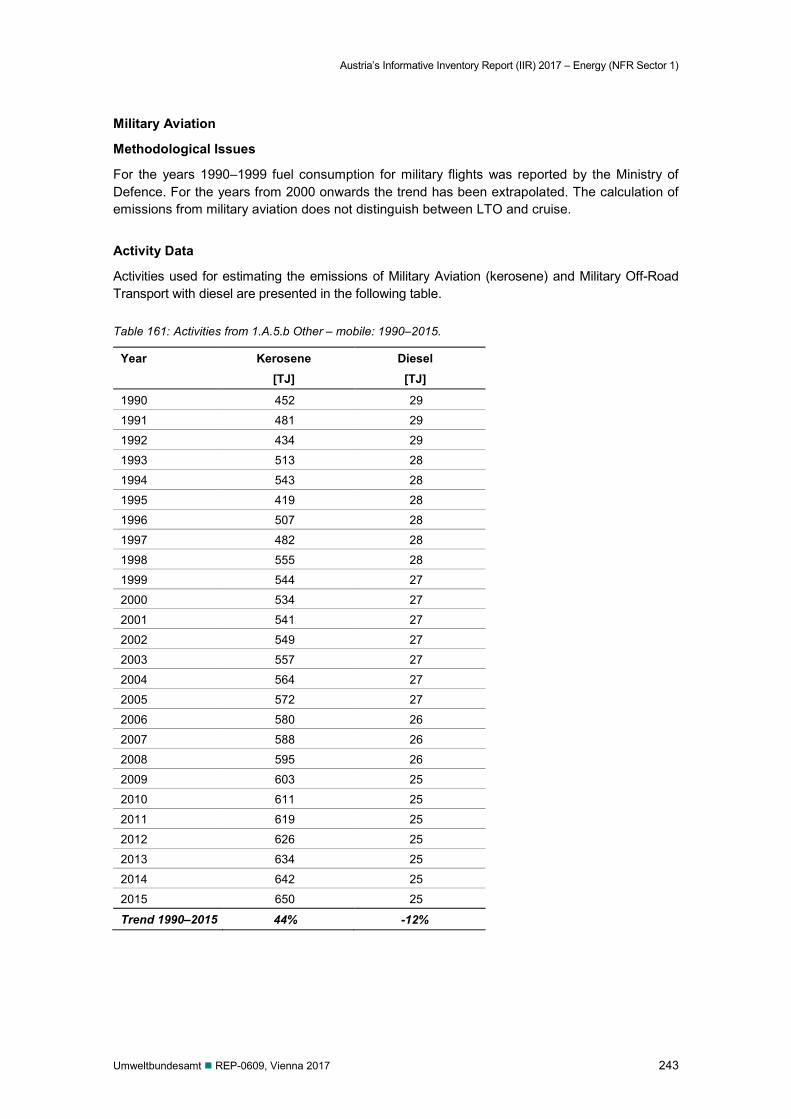
Austria’s Informative Inventory Report (IIR) 2017 – Energy (NFR Sector 1)
Umweltbundesamt REP-0609, Vienna 2017 243
Military Aviation
Methodological Issues
For the years 1990–1999 fuel consumption for military flights was reported by the Ministry of Defence. For the years from 2000 onwards the trend has been extrapolated. The calculation of emissions from military aviation does not distinguish between LTO and cruise.
Activity Data
Activities used for estimating the emissions of Military Aviation (kerosene) and Military Off-Road Transport with diesel are presented in the following table.
Table 161: Activities from 1.A.5.b Other – mobile: 1990–2015.
Year Kerosene [TJ]
Diesel [TJ]
1990 452 29
1991 481 29
1992 434 29
1993 513 28
1994 543 28
1995 419 28
1996 507 28
1997 482 28
1998 555 28
1999 544 27
2000 534 27
2001 541 27
2002 549 27
2003 557 27
2004 564 27
2005 572 27
2006 580 26
2007 588 26
2008 595 26
2009 603 25
2010 611 25
2011 619 25
2012 626 25
2013 634 25
2014 642 25
2015 650 25
Trend 1990–2015 44% -12%
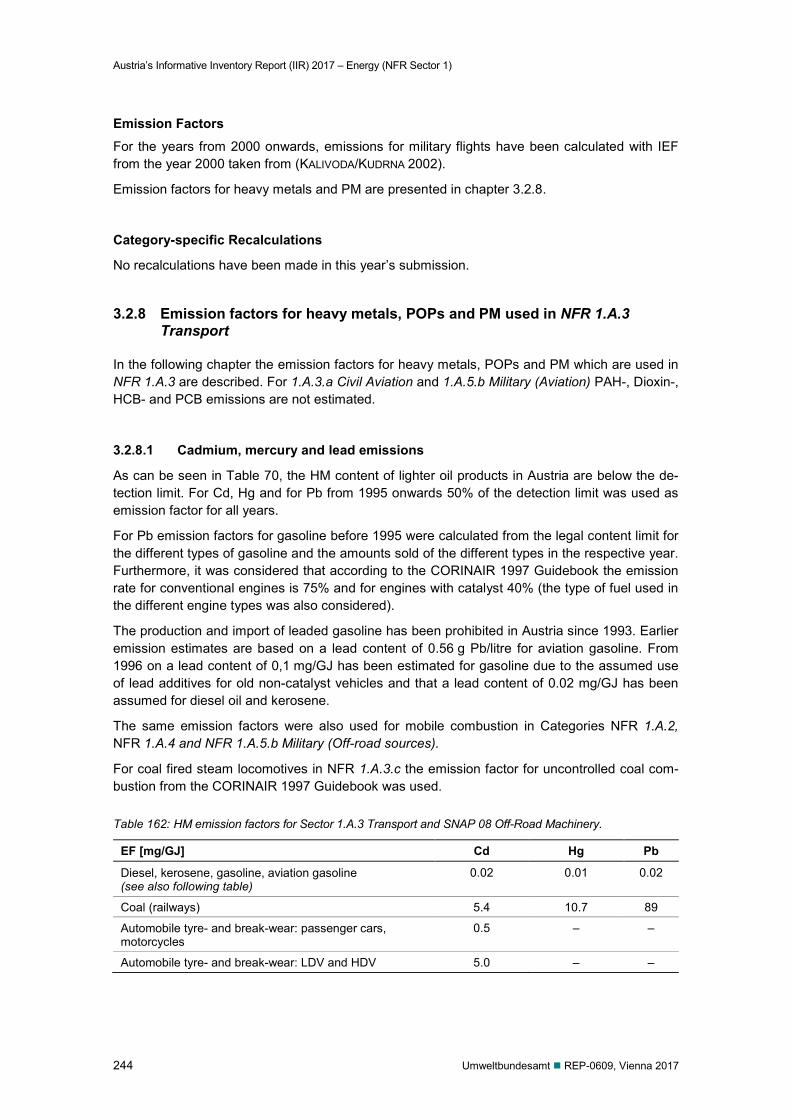
Austria’s Informative Inventory Report (IIR) 2017 – Energy (NFR Sector 1)
244 Umweltbundesamt REP-0609, Vienna 2017
Emission Factors For the years from 2000 onwards, emissions for military flights have been calculated with IEF from the year 2000 taken from (KALIVODA/KUDRNA 2002).
Emission factors for heavy metals and PM are presented in chapter 3.2.8.
Category-specific Recalculations
No recalculations have been made in this year’s submission.
3.2.8 Emission factors for heavy metals, POPs and PM used in NFR 1.A.3 Transport
In the following chapter the emission factors for heavy metals, POPs and PM which are used in NFR 1.A.3 are described. For 1.A.3.a Civil Aviation and 1.A.5.b Military (Aviation) PAH-, Dioxin-, HCB- and PCB emissions are not estimated.
3.2.8.1 Cadmium, mercury and lead emissions
As can be seen in Table 70, the HM content of lighter oil products in Austria are below the de-tection limit. For Cd, Hg and for Pb from 1995 onwards 50% of the detection limit was used as emission factor for all years.
For Pb emission factors for gasoline before 1995 were calculated from the legal content limit for the different types of gasoline and the amounts sold of the different types in the respective year. Furthermore, it was considered that according to the CORINAIR 1997 Guidebook the emission rate for conventional engines is 75% and for engines with catalyst 40% (the type of fuel used in the different engine types was also considered).
The production and import of leaded gasoline has been prohibited in Austria since 1993. Earlier emission estimates are based on a lead content of 0.56 g Pb/litre for aviation gasoline. From 1996 on a lead content of 0,1 mg/GJ has been estimated for gasoline due to the assumed use of lead additives for old non-catalyst vehicles and that a lead content of 0.02 mg/GJ has been assumed for diesel oil and kerosene.
The same emission factors were also used for mobile combustion in Categories NFR 1.A.2, NFR 1.A.4 and NFR 1.A.5.b Military (Off-road sources).
For coal fired steam locomotives in NFR 1.A.3.c the emission factor for uncontrolled coal com-bustion from the CORINAIR 1997 Guidebook was used.
Table 162: HM emission factors for Sector 1.A.3 Transport and SNAP 08 Off-Road Machinery.
EF [mg/GJ] Cd Hg Pb
Diesel, kerosene, gasoline, aviation gasoline (see also following table)
0.02 0.01 0.02
Coal (railways) 5.4 10.7 89
Automobile tyre- and break-wear: passenger cars, motorcycles
0.5 – –
Automobile tyre- and break-wear: LDV and HDV 5.0 – –
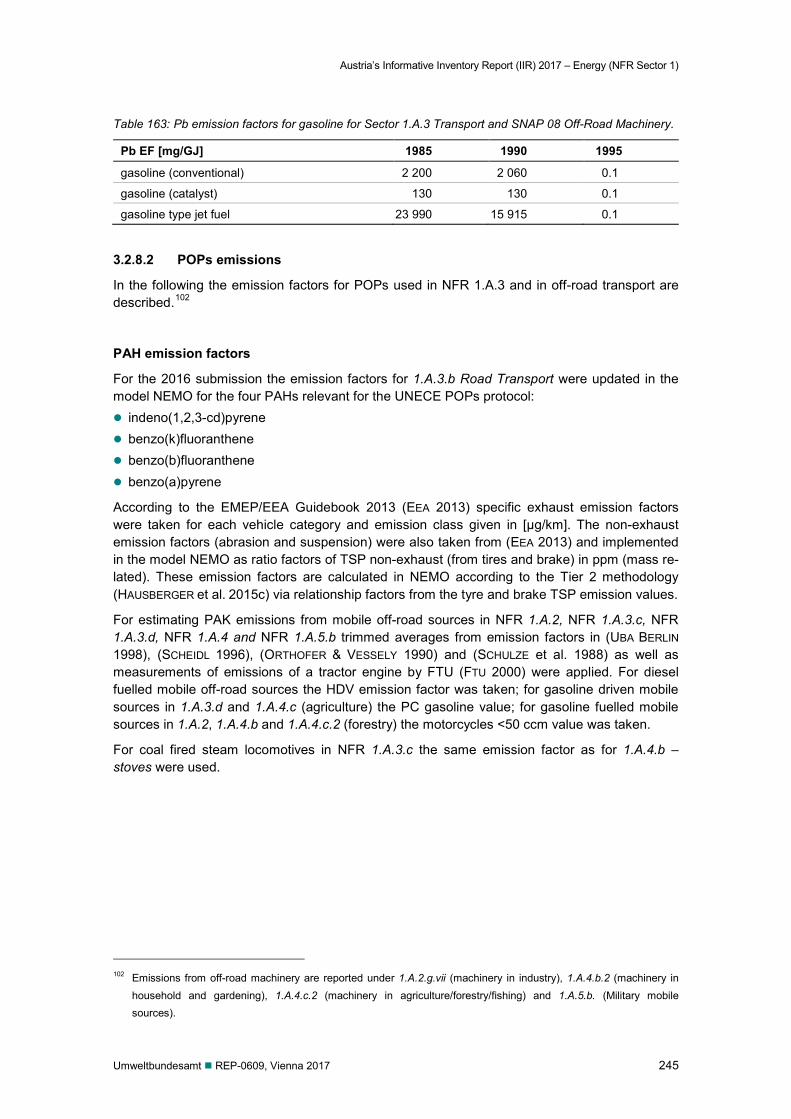
Austria’s Informative Inventory Report (IIR) 2017 – Energy (NFR Sector 1)
Umweltbundesamt REP-0609, Vienna 2017 245
Table 163: Pb emission factors for gasoline for Sector 1.A.3 Transport and SNAP 08 Off-Road Machinery.
Pb EF [mg/GJ] 1985 1990 1995
gasoline (conventional) 2 200 2 060 0.1
gasoline (catalyst) 130 130 0.1
gasoline type jet fuel 23 990 15 915 0.1
3.2.8.2 POPs emissions
In the following the emission factors for POPs used in NFR 1.A.3 and in off-road transport are described.102
PAH emission factors
For the 2016 submission the emission factors for 1.A.3.b Road Transport were updated in the model NEMO for the four PAHs relevant for the UNECE POPs protocol: indeno(1,2,3-cd)pyrene benzo(k)fluoranthene benzo(b)fluoranthene benzo(a)pyrene
According to the EMEP/EEA Guidebook 2013 (EEA 2013) specific exhaust emission factors were taken for each vehicle category and emission class given in [µg/km]. The non-exhaust emission factors (abrasion and suspension) were also taken from (EEA 2013) and implemented in the model NEMO as ratio factors of TSP non-exhaust (from tires and brake) in ppm (mass re-lated). These emission factors are calculated in NEMO according to the Tier 2 methodology (HAUSBERGER et al. 2015c) via relationship factors from the tyre and brake TSP emission values.
For estimating PAK emissions from mobile off-road sources in NFR 1.A.2, NFR 1.A.3.c, NFR 1.A.3.d, NFR 1.A.4 and NFR 1.A.5.b trimmed averages from emission factors in (UBA BERLIN 1998), (SCHEIDL 1996), (ORTHOFER & VESSELY 1990) and (SCHULZE et al. 1988) as well as measurements of emissions of a tractor engine by FTU (FTU 2000) were applied. For diesel fuelled mobile off-road sources the HDV emission factor was taken; for gasoline driven mobile sources in 1.A.3.d and 1.A.4.c (agriculture) the PC gasoline value; for gasoline fuelled mobile sources in 1.A.2, 1.A.4.b and 1.A.4.c.2 (forestry) the motorcycles <50 ccm value was taken.
For coal fired steam locomotives in NFR 1.A.3.c the same emission factor as for 1.A.4.b – stoves were used.
102 Emissions from off-road machinery are reported under 1.A.2.g.vii (machinery in industry), 1.A.4.b.2 (machinery in
household and gardening), 1.A.4.c.2 (machinery in agriculture/forestry/fishing) and 1.A.5.b. (Military mobile sources).
Austria’s Informative Inventory Report (IIR) 2017 – Energy (NFR Sector 1)
246 Umweltbundesamt REP-0609, Vienna 2017
Table 164: POP emission factors for Sector SNAP 08 Off-Road Machinery.
PCDD/F EF [µgTE/GJ] PAK4 [mg/GJ]
Passenger cars gasoline 0.046 5.3
PC. gasoline with catalyst 0.0012 0.32
Passenger cars diesel 0.0007 6.4
LDV 0.0007 6.4
HDV 0.0055 6.4
Motorcycles < 50 ccm 0.0031 21
Motorcycles < 50 ccm with catalyst 0.0012 2.1
Motorcycles > 50 ccm 0.0031 33
Coal fired steam locomotives 0.38 0.085
Dioxin emissions
Dioxin emission factors are presented in Table 164 and based on findings from (HÜBNER 2001).
HCB emissions
HCB emissions were calculated on the basis of dioxin emissions and assuming a factor of 200 (HÜBNER 2001).
PCB emission factors
PCB emissions from 1.A.3.b Road Transport were calculated and reported for the first time in the current submission. For the calculation of PCB emissions in the model NEMO specific emis-sion factors were taken from (EEA 2013) for each vehicle category and emission class given in [picograms/km]. Due to the low emission factors given in the Guidebook, the calculated PCB emissions from 1.A.3.b Road Transport are a minor source (HAUSBERGER et al. 2015c).
PCB emissions from mobile off-road machinery in NFR 1.A.2, NFR 1.A.3.c, NFR 1.A.3.d, NFR 1.A.4 and NFR 1.A.5 were calculated for the first time in the current submission. Since no calcu-lation method or values for these emissions are given in the literature, for diesel machines they were derived from truck emissions from road transport (approach: PCB emissions related to en-gine work). For gasoline-powered equipment, motorcycles have been used (approach: PCB emissions as a percentage of the HC emissions) (HAUSBERGER et al. 2015c).
3.2.8.3 PM emissions
Implied emission factors for Civil Aviation and Road Transport for PM can be found in Table 165 and Table 166. Emission factors for PM for Off-road transport are presented in chapter 3.2.7 Other mobile sources – Off Road.
The emission factors for ‘automobile tyre and break wear’ were taken from (VAN DER MOST & VELDT 1992), where it was considered that only 10% of the emitted particulate matter (PM) were relevant as air pollutants.
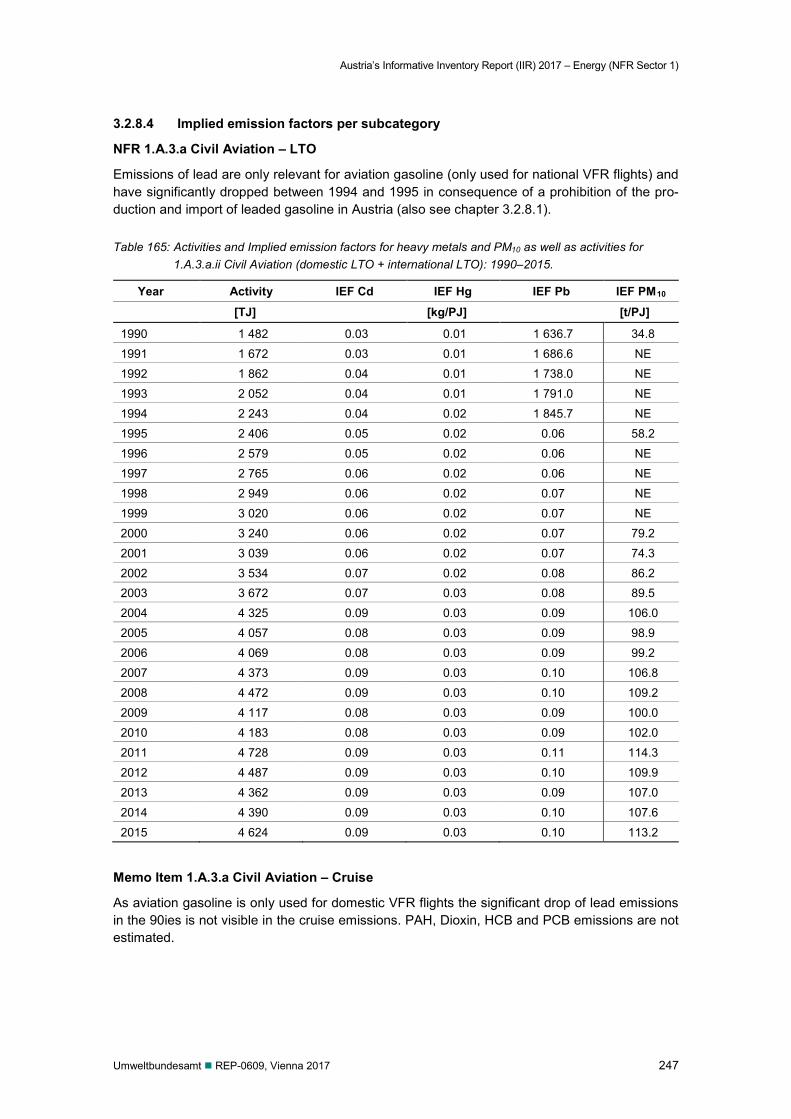
Austria’s Informative Inventory Report (IIR) 2017 – Energy (NFR Sector 1)
Umweltbundesamt REP-0609, Vienna 2017 247
3.2.8.4 Implied emission factors per subcategory
NFR 1.A.3.a Civil Aviation – LTO
Emissions of lead are only relevant for aviation gasoline (only used for national VFR flights) and have significantly dropped between 1994 and 1995 in consequence of a prohibition of the pro-duction and import of leaded gasoline in Austria (also see chapter 3.2.8.1).
Table 165: Activities and Implied emission factors for heavy metals and PM10 as well as activities for 1.A.3.a.ii Civil Aviation (domestic LTO + international LTO): 1990–2015.
Year Activity IEF Cd IEF Hg IEF Pb IEF PM10
[TJ] [kg/PJ] [t/PJ]
1990 1 482 0.03 0.01 1 636.7 34.8
1991 1 672 0.03 0.01 1 686.6 NE
1992 1 862 0.04 0.01 1 738.0 NE
1993 2 052 0.04 0.01 1 791.0 NE
1994 2 243 0.04 0.02 1 845.7 NE
1995 2 406 0.05 0.02 0.06 58.2
1996 2 579 0.05 0.02 0.06 NE
1997 2 765 0.06 0.02 0.06 NE
1998 2 949 0.06 0.02 0.07 NE
1999 3 020 0.06 0.02 0.07 NE
2000 3 240 0.06 0.02 0.07 79.2
2001 3 039 0.06 0.02 0.07 74.3
2002 3 534 0.07 0.02 0.08 86.2 2003 3 672 0.07 0.03 0.08 89.5
2004 4 325 0.09 0.03 0.09 106.0
2005 4 057 0.08 0.03 0.09 98.9
2006 4 069 0.08 0.03 0.09 99.2
2007 4 373 0.09 0.03 0.10 106.8
2008 4 472 0.09 0.03 0.10 109.2
2009 4 117 0.08 0.03 0.09 100.0
2010 4 183 0.08 0.03 0.09 102.0
2011 4 728 0.09 0.03 0.11 114.3
2012 4 487 0.09 0.03 0.10 109.9
2013 4 362 0.09 0.03 0.09 107.0
2014 4 390 0.09 0.03 0.10 107.6
2015 4 624 0.09 0.03 0.10 113.2
Memo Item 1.A.3.a Civil Aviation – Cruise
As aviation gasoline is only used for domestic VFR flights the significant drop of lead emissions in the 90ies is not visible in the cruise emissions. PAH, Dioxin, HCB and PCB emissions are not estimated.
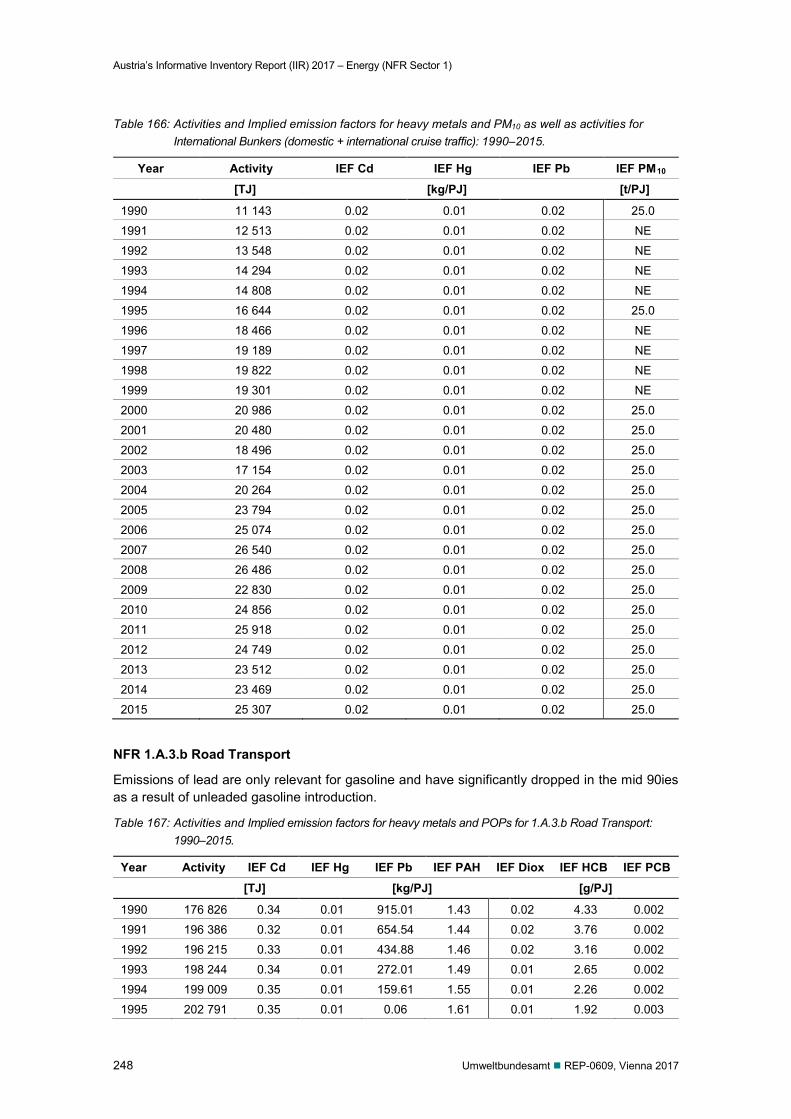
Austria’s Informative Inventory Report (IIR) 2017 – Energy (NFR Sector 1)
248 Umweltbundesamt REP-0609, Vienna 2017
Table 166: Activities and Implied emission factors for heavy metals and PM10 as well as activities for International Bunkers (domestic + international cruise traffic): 1990–2015.
Year Activity IEF Cd IEF Hg IEF Pb IEF PM10
[TJ] [kg/PJ] [t/PJ]
1990 11 143 0.02 0.01 0.02 25.0
1991 12 513 0.02 0.01 0.02 NE
1992 13 548 0.02 0.01 0.02 NE
1993 14 294 0.02 0.01 0.02 NE
1994 14 808 0.02 0.01 0.02 NE
1995 16 644 0.02 0.01 0.02 25.0
1996 18 466 0.02 0.01 0.02 NE
1997 19 189 0.02 0.01 0.02 NE
1998 19 822 0.02 0.01 0.02 NE
1999 19 301 0.02 0.01 0.02 NE
2000 20 986 0.02 0.01 0.02 25.0
2001 20 480 0.02 0.01 0.02 25.0
2002 18 496 0.02 0.01 0.02 25.0
2003 17 154 0.02 0.01 0.02 25.0
2004 20 264 0.02 0.01 0.02 25.0
2005 23 794 0.02 0.01 0.02 25.0
2006 25 074 0.02 0.01 0.02 25.0
2007 26 540 0.02 0.01 0.02 25.0
2008 26 486 0.02 0.01 0.02 25.0
2009 22 830 0.02 0.01 0.02 25.0
2010 24 856 0.02 0.01 0.02 25.0
2011 25 918 0.02 0.01 0.02 25.0
2012 24 749 0.02 0.01 0.02 25.0
2013 23 512 0.02 0.01 0.02 25.0
2014 23 469 0.02 0.01 0.02 25.0
2015 25 307 0.02 0.01 0.02 25.0
NFR 1.A.3.b Road Transport
Emissions of lead are only relevant for gasoline and have significantly dropped in the mid 90ies as a result of unleaded gasoline introduction.
Table 167: Activities and Implied emission factors for heavy metals and POPs for 1.A.3.b Road Transport: 1990–2015.
Year Activity IEF Cd IEF Hg IEF Pb IEF PAH IEF Diox IEF HCB IEF PCB [TJ] [kg/PJ] [g/PJ]
1990 176 826 0.34 0.01 915.01 1.43 0.02 4.33 0.002
1991 196 386 0.32 0.01 654.54 1.44 0.02 3.76 0.002
1992 196 215 0.33 0.01 434.88 1.46 0.02 3.16 0.002
1993 198 244 0.34 0.01 272.01 1.49 0.01 2.65 0.002
1994 199 009 0.35 0.01 159.61 1.55 0.01 2.26 0.002
1995 202 791 0.35 0.01 0.06 1.61 0.01 1.92 0.003
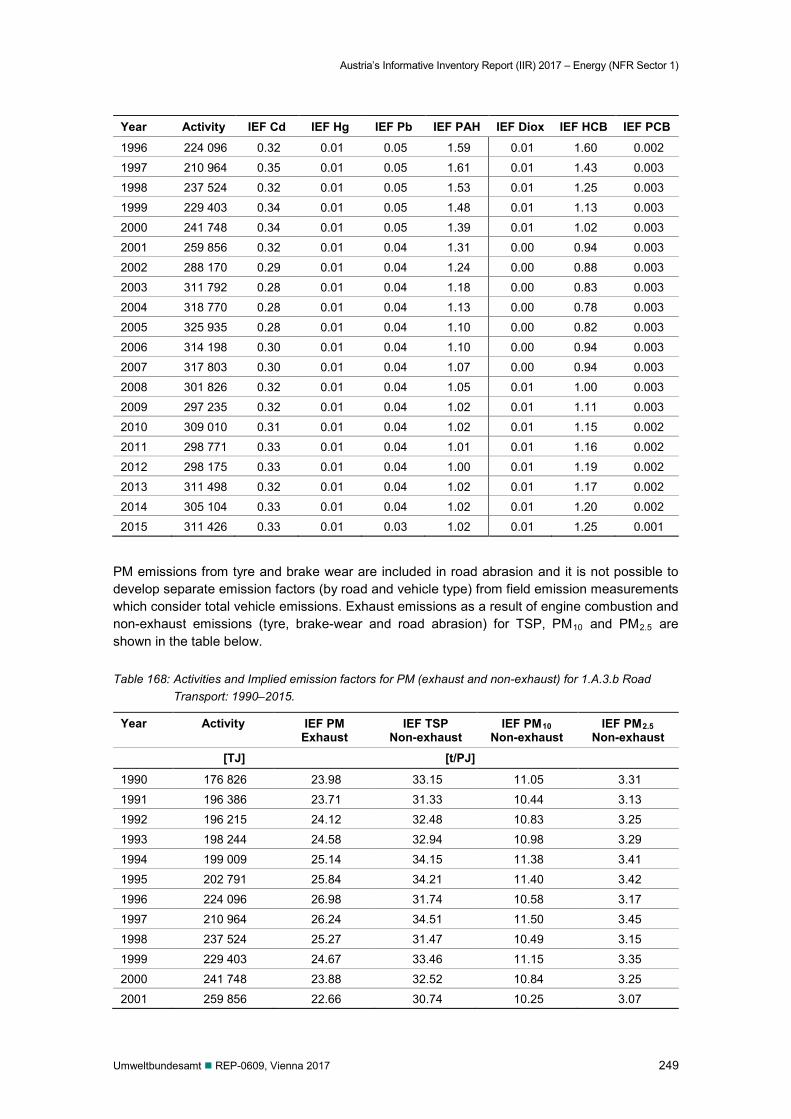
Austria’s Informative Inventory Report (IIR) 2017 – Energy (NFR Sector 1)
Umweltbundesamt REP-0609, Vienna 2017 249
Year Activity IEF Cd IEF Hg IEF Pb IEF PAH IEF Diox IEF HCB IEF PCB
1996 224 096 0.32 0.01 0.05 1.59 0.01 1.60 0.002
1997 210 964 0.35 0.01 0.05 1.61 0.01 1.43 0.003
1998 237 524 0.32 0.01 0.05 1.53 0.01 1.25 0.003
1999 229 403 0.34 0.01 0.05 1.48 0.01 1.13 0.003
2000 241 748 0.34 0.01 0.05 1.39 0.01 1.02 0.003
2001 259 856 0.32 0.01 0.04 1.31 0.00 0.94 0.003
2002 288 170 0.29 0.01 0.04 1.24 0.00 0.88 0.003
2003 311 792 0.28 0.01 0.04 1.18 0.00 0.83 0.003
2004 318 770 0.28 0.01 0.04 1.13 0.00 0.78 0.003
2005 325 935 0.28 0.01 0.04 1.10 0.00 0.82 0.003
2006 314 198 0.30 0.01 0.04 1.10 0.00 0.94 0.003
2007 317 803 0.30 0.01 0.04 1.07 0.00 0.94 0.003
2008 301 826 0.32 0.01 0.04 1.05 0.01 1.00 0.003
2009 297 235 0.32 0.01 0.04 1.02 0.01 1.11 0.003
2010 309 010 0.31 0.01 0.04 1.02 0.01 1.15 0.002
2011 298 771 0.33 0.01 0.04 1.01 0.01 1.16 0.002
2012 298 175 0.33 0.01 0.04 1.00 0.01 1.19 0.002
2013 311 498 0.32 0.01 0.04 1.02 0.01 1.17 0.002
2014 305 104 0.33 0.01 0.04 1.02 0.01 1.20 0.002
2015 311 426 0.33 0.01 0.03 1.02 0.01 1.25 0.001
PM emissions from tyre and brake wear are included in road abrasion and it is not possible to develop separate emission factors (by road and vehicle type) from field emission measurements which consider total vehicle emissions. Exhaust emissions as a result of engine combustion and non-exhaust emissions (tyre, brake-wear and road abrasion) for TSP, PM10 and PM2.5 are shown in the table below.
Table 168: Activities and Implied emission factors for PM (exhaust and non-exhaust) for 1.A.3.b Road Transport: 1990–2015.
Year Activity IEF PM Exhaust
IEF TSP Non-exhaust
IEF PM10 Non-exhaust
IEF PM2.5 Non-exhaust
[TJ] [t/PJ]
1990 176 826 23.98 33.15 11.05 3.31
1991 196 386 23.71 31.33 10.44 3.13
1992 196 215 24.12 32.48 10.83 3.25
1993 198 244 24.58 32.94 10.98 3.29
1994 199 009 25.14 34.15 11.38 3.41
1995 202 791 25.84 34.21 11.40 3.42
1996 224 096 26.98 31.74 10.58 3.17
1997 210 964 26.24 34.51 11.50 3.45
1998 237 524 25.27 31.47 10.49 3.15
1999 229 403 24.67 33.46 11.15 3.35
2000 241 748 23.88 32.52 10.84 3.25
2001 259 856 22.66 30.74 10.25 3.07
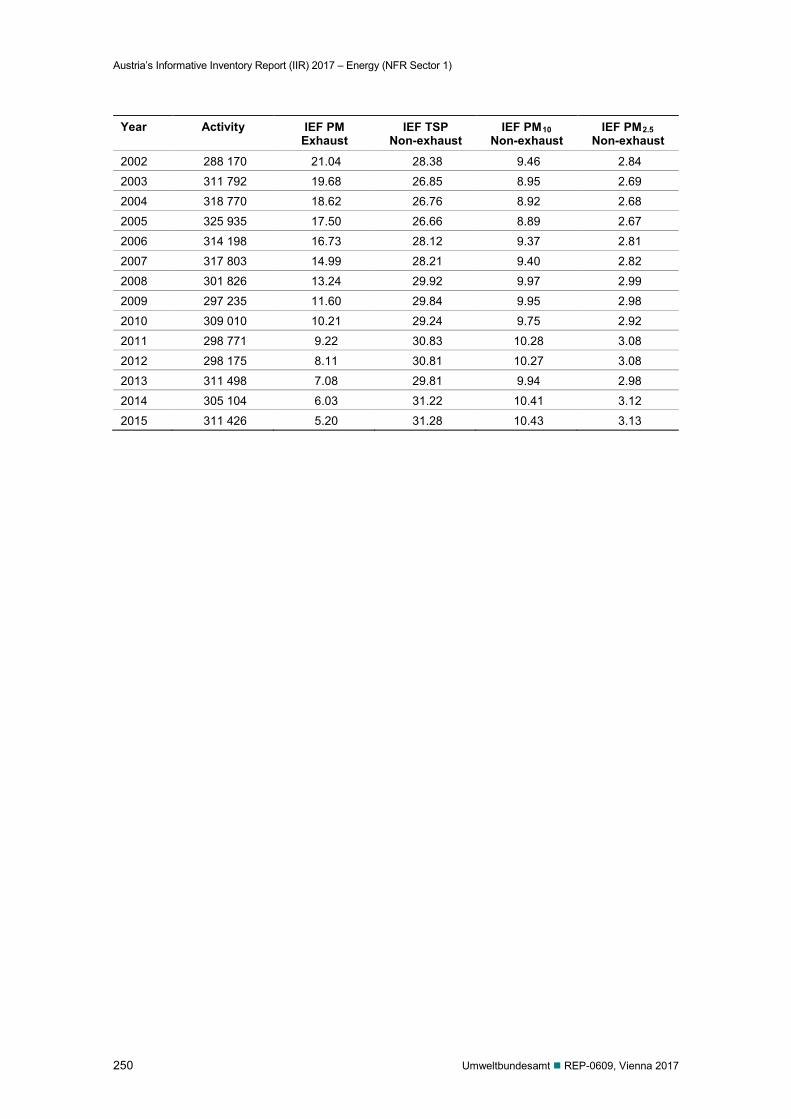
Austria’s Informative Inventory Report (IIR) 2017 – Energy (NFR Sector 1)
250 Umweltbundesamt REP-0609, Vienna 2017
Year Activity IEF PM Exhaust
IEF TSP Non-exhaust
IEF PM10 Non-exhaust
IEF PM2.5 Non-exhaust
2002 288 170 21.04 28.38 9.46 2.84
2003 311 792 19.68 26.85 8.95 2.69
2004 318 770 18.62 26.76 8.92 2.68
2005 325 935 17.50 26.66 8.89 2.67
2006 314 198 16.73 28.12 9.37 2.81
2007 317 803 14.99 28.21 9.40 2.82
2008 301 826 13.24 29.92 9.97 2.99
2009 297 235 11.60 29.84 9.95 2.98
2010 309 010 10.21 29.24 9.75 2.92
2011 298 771 9.22 30.83 10.28 3.08
2012 298 175 8.11 30.81 10.27 3.08
2013 311 498 7.08 29.81 9.94 2.98
2014 305 104 6.03 31.22 10.41 3.12
2015 311 426 5.20 31.28 10.43 3.13
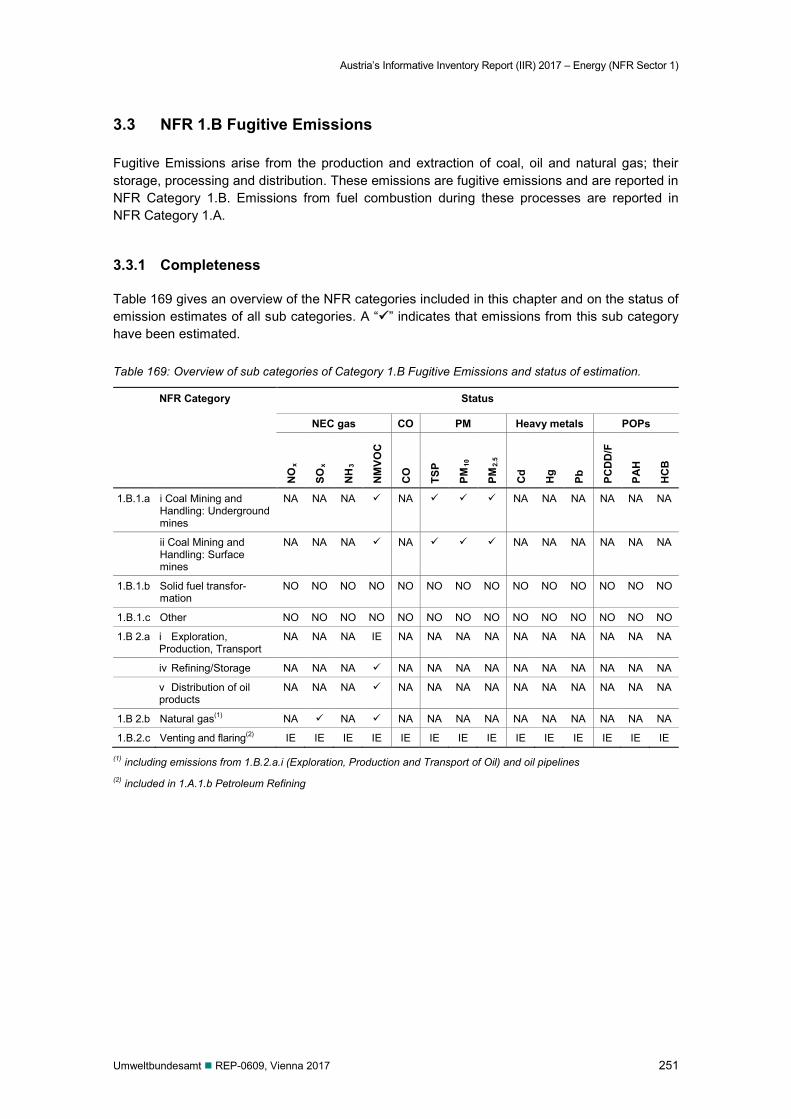
Austria’s Informative Inventory Report (IIR) 2017 – Energy (NFR Sector 1)
Umweltbundesamt REP-0609, Vienna 2017 251
3.3 NFR 1.B Fugitive Emissions
Fugitive Emissions arise from the production and extraction of coal, oil and natural gas; their storage, processing and distribution. These emissions are fugitive emissions and are reported in NFR Category 1.B. Emissions from fuel combustion during these processes are reported in NFR Category 1.A.
3.3.1 Completeness
Table 169 gives an overview of the NFR categories included in this chapter and on the status of emission estimates of all sub categories. A “” indicates that emissions from this sub category have been estimated.
Table 169: Overview of sub categories of Category 1.B Fugitive Emissions and status of estimation.
NFR Category Status
NEC gas CO PM Heavy metals POPs
NO
x
SOx
NH
3
NM
VOC
CO
TSP
PM10
PM2.
5
Cd
Hg
Pb
PCD
D/F
PAH
HC
B
1.B.1.a i Coal Mining and Handling: Underground mines
NA NA NA NA NA NA NA NA NA NA
ii Coal Mining and Handling: Surface mines
NA NA NA NA NA NA NA NA NA NA
1.B.1.b Solid fuel transfor-mation
NO NO NO NO NO NO NO NO NO NO NO NO NO NO
1.B.1.c Other NO NO NO NO NO NO NO NO NO NO NO NO NO NO
1.B 2.a i Exploration, Production, Transport
NA NA NA IE NA NA NA NA NA NA NA NA NA NA
iv Refining/Storage NA NA NA NA NA NA NA NA NA NA NA NA NA
v Distribution of oil products
NA NA NA NA NA NA NA NA NA NA NA NA NA
1.B 2.b Natural gas(1) NA NA NA NA NA NA NA NA NA NA NA NA
1.B.2.c Venting and flaring(2) IE IE IE IE IE IE IE IE IE IE IE IE IE IE
(1) including emissions from 1.B.2.a.i (Exploration, Production and Transport of Oil) and oil pipelines (2) included in 1.A.1.b Petroleum Refining
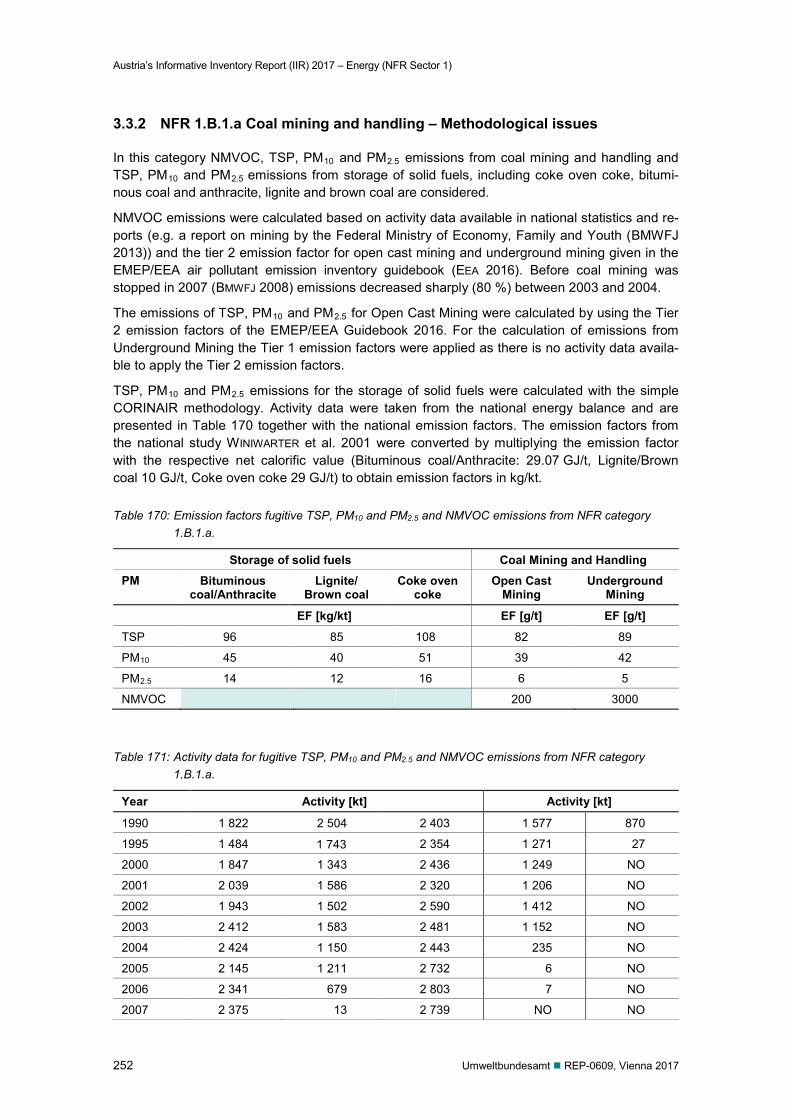
Austria’s Informative Inventory Report (IIR) 2017 – Energy (NFR Sector 1)
252 Umweltbundesamt REP-0609, Vienna 2017
3.3.2 NFR 1.B.1.a Coal mining and handling – Methodological issues
In this category NMVOC, TSP, PM10 and PM2.5 emissions from coal mining and handling and TSP, PM10 and PM2.5 emissions from storage of solid fuels, including coke oven coke, bitumi-nous coal and anthracite, lignite and brown coal are considered.
NMVOC emissions were calculated based on activity data available in national statistics and re-ports (e.g. a report on mining by the Federal Ministry of Economy, Family and Youth (BMWFJ 2013)) and the tier 2 emission factor for open cast mining and underground mining given in the EMEP/EEA air pollutant emission inventory guidebook (EEA 2016). Before coal mining was stopped in 2007 (BMWFJ 2008) emissions decreased sharply (80 %) between 2003 and 2004.
The emissions of TSP, PM10 and PM2.5 for Open Cast Mining were calculated by using the Tier 2 emission factors of the EMEP/EEA Guidebook 2016. For the calculation of emissions from Underground Mining the Tier 1 emission factors were applied as there is no activity data availa-ble to apply the Tier 2 emission factors.
TSP, PM10 and PM2.5 emissions for the storage of solid fuels were calculated with the simple CORINAIR methodology. Activity data were taken from the national energy balance and are presented in Table 170 together with the national emission factors. The emission factors from the national study WINIWARTER et al. 2001 were converted by multiplying the emission factor with the respective net calorific value (Bituminous coal/Anthracite: 29.07 GJ/t, Lignite/Brown coal 10 GJ/t, Coke oven coke 29 GJ/t) to obtain emission factors in kg/kt.
Table 170: Emission factors fugitive TSP, PM10 and PM2.5 and NMVOC emissions from NFR category 1.B.1.a.
Storage of solid fuels Coal Mining and Handling PM Bituminous
coal/Anthracite Lignite/
Brown coal Coke oven
coke Open Cast
Mining Underground
Mining
EF [kg/kt] EF [g/t] EF [g/t]
TSP 96 85 108 82 89
PM10 45 40 51 39 42
PM2.5 14 12 16 6 5
NMVOC 200 3000
Table 171: Activity data for fugitive TSP, PM10 and PM2.5 and NMVOC emissions from NFR category 1.B.1.a.
Year Activity [kt] Activity [kt]
1990 1 822 2 504 2 403 1 577 870
1995 1 484 1 743 2 354 1 271 27
2000 1 847 1 343 2 436 1 249 NO
2001 2 039 1 586 2 320 1 206 NO
2002 1 943 1 502 2 590 1 412 NO
2003 2 412 1 583 2 481 1 152 NO
2004 2 424 1 150 2 443 235 NO
2005 2 145 1 211 2 732 6 NO
2006 2 341 679 2 803 7 NO
2007 2 375 13 2 739 NO NO
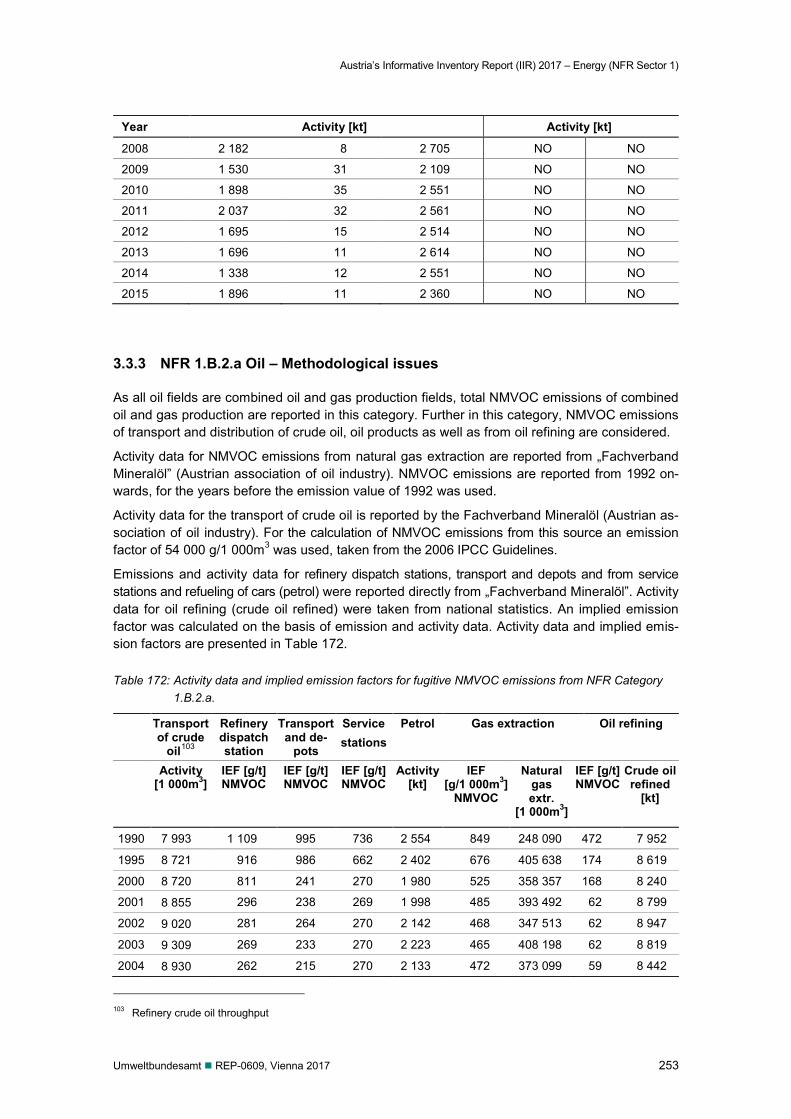
Austria’s Informative Inventory Report (IIR) 2017 – Energy (NFR Sector 1)
Umweltbundesamt REP-0609, Vienna 2017 253
Year Activity [kt] Activity [kt]
2008 2 182 8 2 705 NO NO
2009 1 530 31 2 109 NO NO
2010 1 898 35 2 551 NO NO
2011 2 037 32 2 561 NO NO
2012 1 695 15 2 514 NO NO
2013 1 696 11 2 614 NO NO
2014 1 338 12 2 551 NO NO
2015 1 896 11 2 360 NO NO
3.3.3 NFR 1.B.2.a Oil – Methodological issues
As all oil fields are combined oil and gas production fields, total NMVOC emissions of combined oil and gas production are reported in this category. Further in this category, NMVOC emissions of transport and distribution of crude oil, oil products as well as from oil refining are considered.
Activity data for NMVOC emissions from natural gas extraction are reported from „Fachverband Mineralöl” (Austrian association of oil industry). NMVOC emissions are reported from 1992 on-wards, for the years before the emission value of 1992 was used.
Activity data for the transport of crude oil is reported by the Fachverband Mineralöl (Austrian as-sociation of oil industry). For the calculation of NMVOC emissions from this source an emission factor of 54 000 g/1 000m3 was used, taken from the 2006 IPCC Guidelines.
Emissions and activity data for refinery dispatch stations, transport and depots and from service stations and refueling of cars (petrol) were reported directly from „Fachverband Mineralöl”. Activity data for oil refining (crude oil refined) were taken from national statistics. An implied emission factor was calculated on the basis of emission and activity data. Activity data and implied emis-sion factors are presented in Table 172.
Table 172: Activity data and implied emission factors for fugitive NMVOC emissions from NFR Category 1.B.2.a.
Transport of crude
oil103
Refinery dispatch station
Transport and de-
pots
Service stations
Petrol Gas extraction Oil refining
Activity [1 000m3]
IEF [g/t] NMVOC
IEF [g/t] NMVOC
IEF [g/t] NMVOC
Activity [kt]
IEF [g/1 000m3]
NMVOC
Natural gas extr.
[1 000m3]
IEF [g/t] NMVOC
Crude oil refined
[kt]
1990 7 993 1 109 995 736 2 554 849 248 090 472 7 952
1995 8 721 916 986 662 2 402 676 405 638 174 8 619
2000 8 720 811 241 270 1 980 525 358 357 168 8 240
2001 8 855 296 238 269 1 998 485 393 492 62 8 799
2002 9 020 281 264 270 2 142 468 347 513 62 8 947
2003 9 309 269 233 270 2 223 465 408 198 62 8 819
2004 8 930 262 215 270 2 133 472 373 099 59 8 442
103 Refinery crude oil throughput
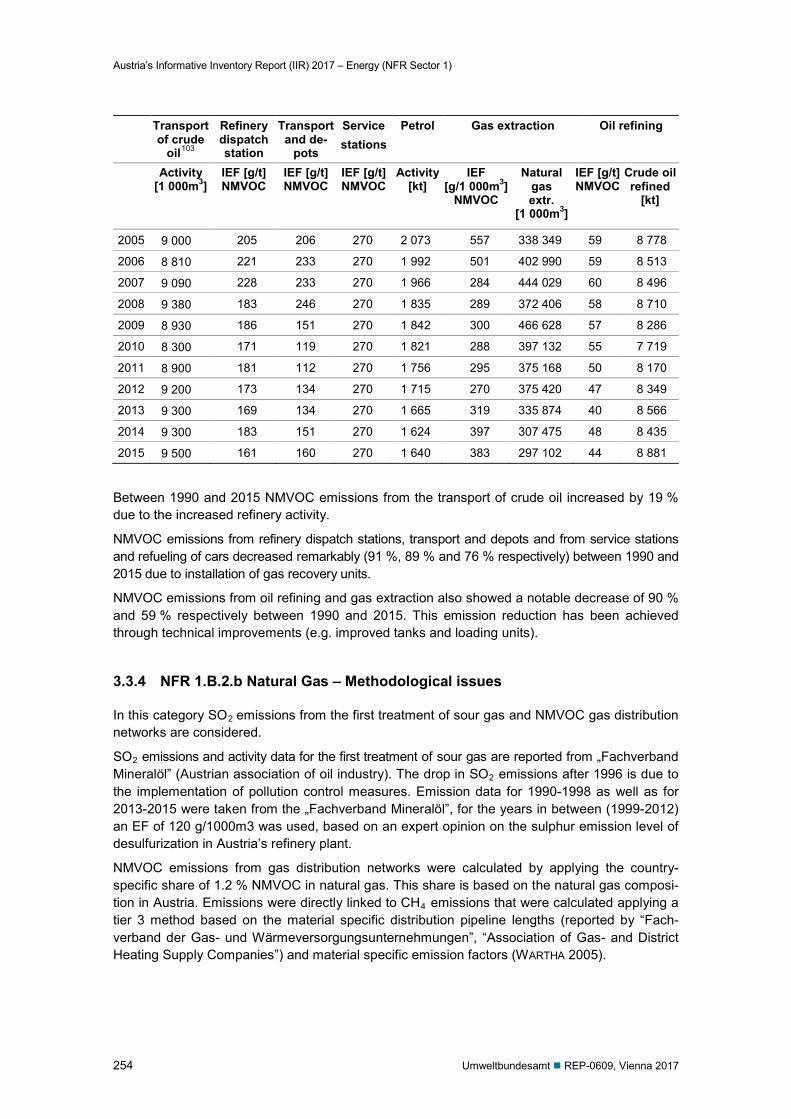
Austria’s Informative Inventory Report (IIR) 2017 – Energy (NFR Sector 1)
254 Umweltbundesamt REP-0609, Vienna 2017
Transport of crude
oil103
Refinery dispatch station
Transport and de-
pots
Service stations
Petrol Gas extraction Oil refining
Activity [1 000m3]
IEF [g/t] NMVOC
IEF [g/t] NMVOC
IEF [g/t] NMVOC
Activity [kt]
IEF [g/1 000m3]
NMVOC
Natural gas extr.
[1 000m3]
IEF [g/t] NMVOC
Crude oil refined
[kt]
2005 9 000 205 206 270 2 073 557 338 349 59 8 778
2006 8 810 221 233 270 1 992 501 402 990 59 8 513
2007 9 090 228 233 270 1 966 284 444 029 60 8 496
2008 9 380 183 246 270 1 835 289 372 406 58 8 710
2009 8 930 186 151 270 1 842 300 466 628 57 8 286
2010 8 300 171 119 270 1 821 288 397 132 55 7 719
2011 8 900 181 112 270 1 756 295 375 168 50 8 170
2012 9 200 173 134 270 1 715 270 375 420 47 8 349
2013 9 300 169 134 270 1 665 319 335 874 40 8 566
2014 9 300 183 151 270 1 624 397 307 475 48 8 435
2015 9 500 161 160 270 1 640 383 297 102 44 8 881
Between 1990 and 2015 NMVOC emissions from the transport of crude oil increased by 19 % due to the increased refinery activity.
NMVOC emissions from refinery dispatch stations, transport and depots and from service stations and refueling of cars decreased remarkably (91 %, 89 % and 76 % respectively) between 1990 and 2015 due to installation of gas recovery units.
NMVOC emissions from oil refining and gas extraction also showed a notable decrease of 90 % and 59 % respectively between 1990 and 2015. This emission reduction has been achieved through technical improvements (e.g. improved tanks and loading units).
3.3.4 NFR 1.B.2.b Natural Gas – Methodological issues
In this category SO2 emissions from the first treatment of sour gas and NMVOC gas distribution networks are considered.
SO2 emissions and activity data for the first treatment of sour gas are reported from „Fachverband Mineralöl” (Austrian association of oil industry). The drop in SO2 emissions after 1996 is due to the implementation of pollution control measures. Emission data for 1990-1998 as well as for 2013-2015 were taken from the „Fachverband Mineralöl”, for the years in between (1999-2012) an EF of 120 g/1000m3 was used, based on an expert opinion on the sulphur emission level of desulfurization in Austria’s refinery plant.
NMVOC emissions from gas distribution networks were calculated by applying the country-specific share of 1.2 % NMVOC in natural gas. This share is based on the natural gas composi-tion in Austria. Emissions were directly linked to CH4 emissions that were calculated applying a tier 3 method based on the material specific distribution pipeline lengths (reported by “Fach-verband der Gas- und Wärmeversorgungsunternehmungen”, “Association of Gas- and District Heating Supply Companies”) and material specific emission factors (WARTHA 2005).
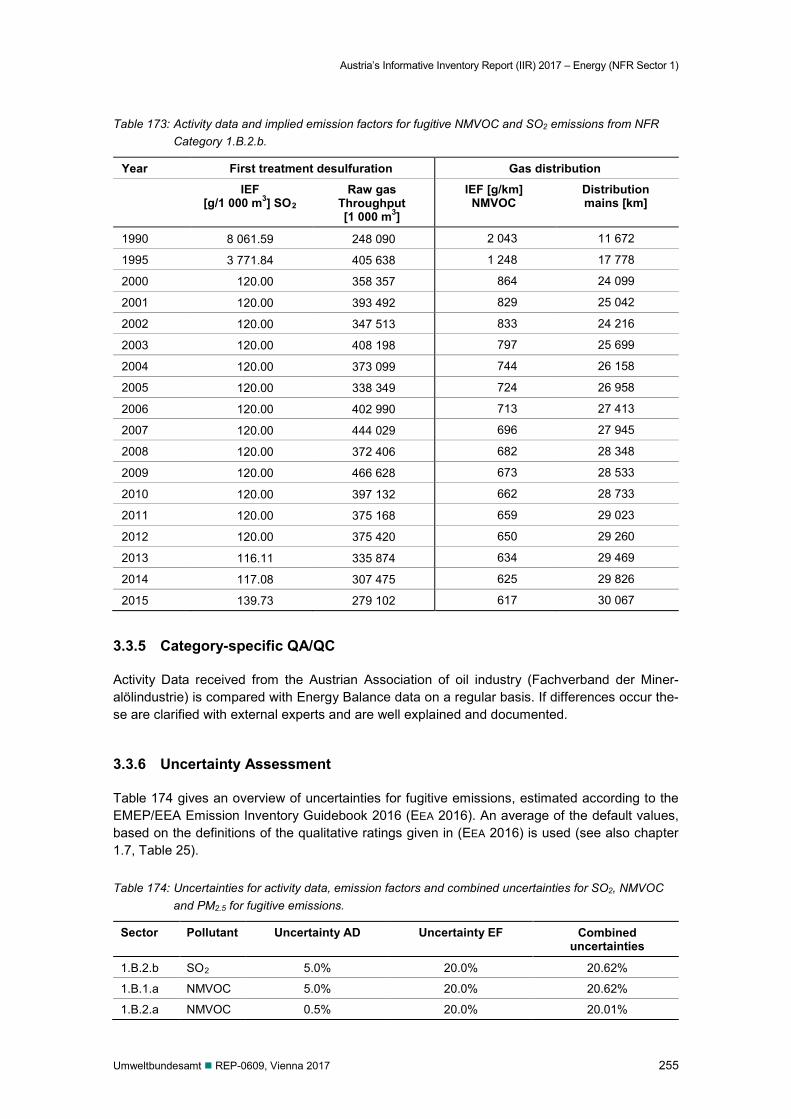
Austria’s Informative Inventory Report (IIR) 2017 – Energy (NFR Sector 1)
Umweltbundesamt REP-0609, Vienna 2017 255
Table 173: Activity data and implied emission factors for fugitive NMVOC and SO2 emissions from NFR Category 1.B.2.b.
Year First treatment desulfuration Gas distribution
IEF [g/1 000 m3] SO2
Raw gas Throughput [1 000 m3]
IEF [g/km] NMVOC
Distribution mains [km]
1990 8 061.59 248 090 2 043 11 672
1995 3 771.84 405 638 1 248 17 778
2000 120.00 358 357 864 24 099
2001 120.00 393 492 829 25 042
2002 120.00 347 513 833 24 216
2003 120.00 408 198 797 25 699
2004 120.00 373 099 744 26 158
2005 120.00 338 349 724 26 958
2006 120.00 402 990 713 27 413
2007 120.00 444 029 696 27 945
2008 120.00 372 406 682 28 348
2009 120.00 466 628 673 28 533
2010 120.00 397 132 662 28 733
2011 120.00 375 168 659 29 023
2012 120.00 375 420 650 29 260
2013 116.11 335 874 634 29 469
2014 117.08 307 475 625 29 826
2015 139.73 279 102 617 30 067
3.3.5 Category-specific QA/QC
Activity Data received from the Austrian Association of oil industry (Fachverband der Miner-alölindustrie) is compared with Energy Balance data on a regular basis. If differences occur the-se are clarified with external experts and are well explained and documented.
3.3.6 Uncertainty Assessment
Table 174 gives an overview of uncertainties for fugitive emissions, estimated according to the EMEP/EEA Emission Inventory Guidebook 2016 (EEA 2016). An average of the default values, based on the definitions of the qualitative ratings given in (EEA 2016) is used (see also chapter 1.7, Table 25).
Table 174: Uncertainties for activity data, emission factors and combined uncertainties for SO2, NMVOC and PM2.5 for fugitive emissions.
Sector Pollutant Uncertainty AD Uncertainty EF Combined uncertainties
1.B.2.b SO2 5.0% 20.0% 20.62%
1.B.1.a NMVOC 5.0% 20.0% 20.62%
1.B.2.a NMVOC 0.5% 20.0% 20.01%
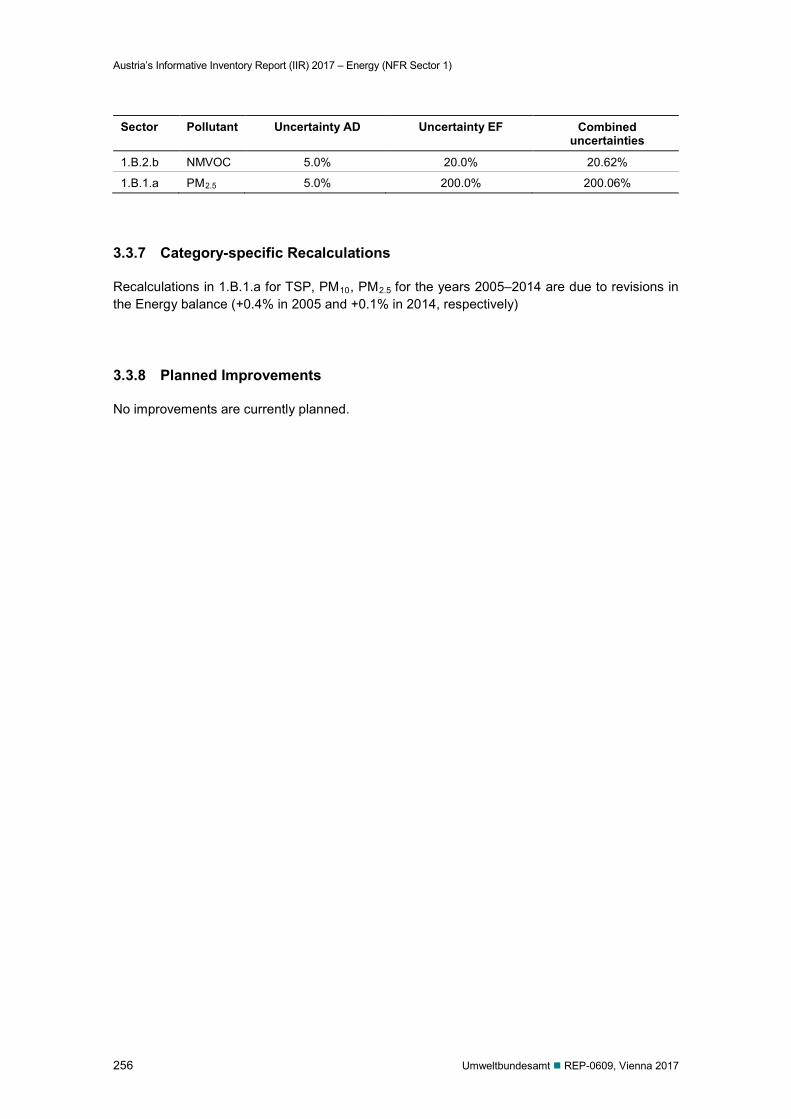
Austria’s Informative Inventory Report (IIR) 2017 – Energy (NFR Sector 1)
256 Umweltbundesamt REP-0609, Vienna 2017
Sector Pollutant Uncertainty AD Uncertainty EF Combined uncertainties
1.B.2.b NMVOC 5.0% 20.0% 20.62%
1.B.1.a PM2.5 5.0% 200.0% 200.06%
3.3.7 Category-specific Recalculations
Recalculations in 1.B.1.a for TSP, PM10, PM2.5 for the years 2005–2014 are due to revisions in the Energy balance (+0.4% in 2005 and +0.1% in 2014, respectively)
3.3.8 Planned Improvements
No improvements are currently planned.
Austria’s Informative Inventory Report (IIR) 2017 – Industrial Processes and Product Use (NFR Sector 2)
Umweltbundesamt REP-0609, Vienna 2017 257
4 INDUSTRIAL PROCESSES AND PRODUCT USE (NFR SECTOR 2)
4.1 Sector overview
This chapter includes information on the estimation of emissions of NEC gases, CO, particulate matter (PM), heavy metals (HM) and persistent organic pollutants (POPs) as well as references for activity data and emission factors reported under NFR Category 2 Industrial Processes and Product Use for the period from 1990 to 2015.
Emissions from this sector comprise emissions from the following categories: Mineral Products (2.A) Chemical Industry (2.B) Metal Production (2.C) Solvent use (2.D.3) Other product use (2.G) Other production (2.H) Wood processing (2.I)
Only process related emissions are considered in this sector; emissions due to fuel combustion in manufacturing industries are allocated to NFR Category 1.A.2 Fuel Combustion – Manufac-turing Industries and Construction (see Chapter 3.1.4).
4.2 General description
Table 175 gives an overview of the NFR categories included in this chapter. A “” indicates that emissions from this sub category have been estimated, “NA” indicates that the pollutant in ques-tion is not emitted during the respective industrial process.
Some categories in this sector are not occurring (NO) in Austria as there is no such produc-tion/use. For some categories, emissions are included elsewhere (IE). In Chapter 1.8, a general description regarding completeness is given.
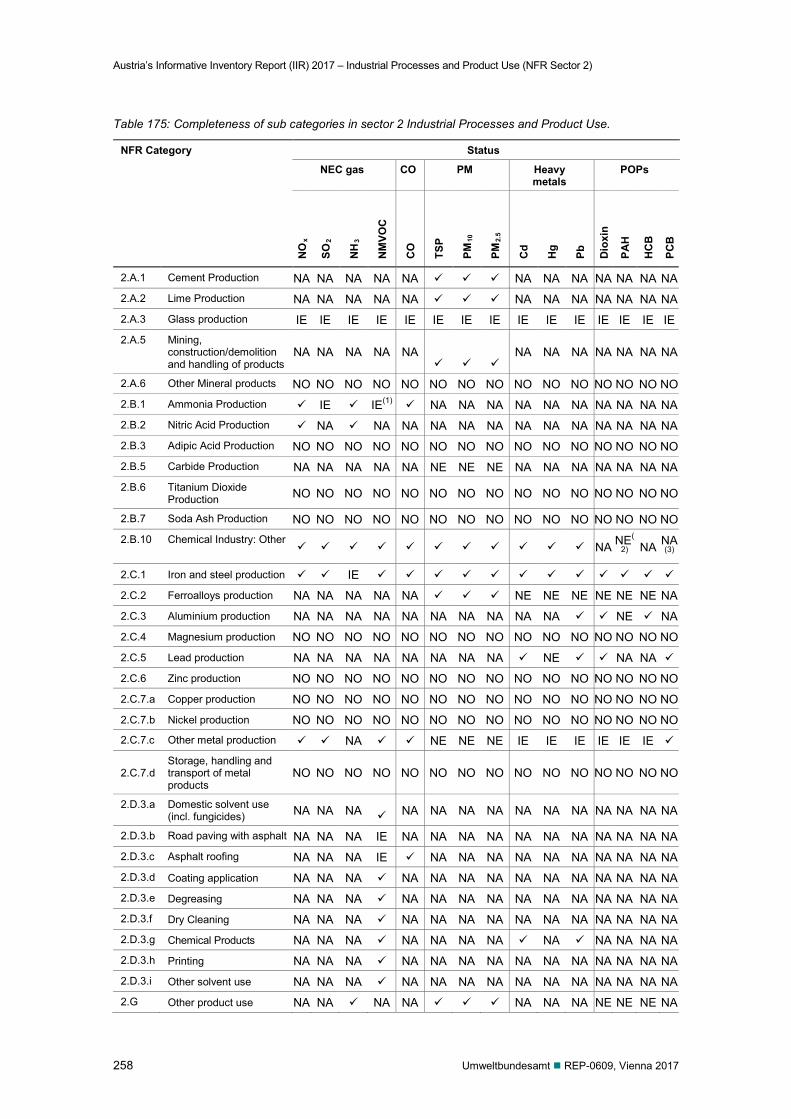
Austria’s Informative Inventory Report (IIR) 2017 – Industrial Processes and Product Use (NFR Sector 2)
258 Umweltbundesamt REP-0609, Vienna 2017
Table 175: Completeness of sub categories in sector 2 Industrial Processes and Product Use.
NFR Category Status
NEC gas CO PM Heavy metals
POPs
NO
x
SO2
NH
3
NM
VOC
CO
TSP
PM10
PM2.
5
Cd
Hg
Pb
Dio
xin
PAH
HC
B
PCB
2.A.1 Cement Production NA NA NA NA NA NA NA NA NA NA NA NA 2.A.2 Lime Production NA NA NA NA NA NA NA NA NA NA NA NA 2.A.3 Glass production IE IE IE IE IE IE IE IE IE IE IE IE IE IE IE 2.A.5 Mining,
construction/demolition and handling of products
NA NA NA NA NA
NA NA NA NA NA NA NA
2.A.6 Other Mineral products NO NO NO NO NO NO NO NO NO NO NO NO NO NO NO 2.B.1 Ammonia Production IE IE(1) NA NA NA NA NA NA NA NA NA NA 2.B.2 Nitric Acid Production NA NA NA NA NA NA NA NA NA NA NA NA NA 2.B.3 Adipic Acid Production NO NO NO NO NO NO NO NO NO NO NO NO NO NO NO 2.B.5 Carbide Production NA NA NA NA NA NE NE NE NA NA NA NA NA NA NA 2.B.6 Titanium Dioxide
Production NO NO NO NO NO NO NO NO NO NO NO NO NO NO NO
2.B.7 Soda Ash Production NO NO NO NO NO NO NO NO NO NO NO NO NO NO NO 2.B.10 Chemical Industry: Other
NA NE(
2) NA NA(3)
2.C.1 Iron and steel production IE
2.C.2 Ferroalloys production NA NA NA NA NA NE NE NE NE NE NE NA
2.C.3 Aluminium production NA NA NA NA NA NA NA NA NA NA NE NA
2.C.4 Magnesium production NO NO NO NO NO NO NO NO NO NO NO NO NO NO NO
2.C.5 Lead production NA NA NA NA NA NA NA NA NE NA NA
2.C.6 Zinc production NO NO NO NO NO NO NO NO NO NO NO NO NO NO NO
2.C.7.a Copper production NO NO NO NO NO NO NO NO NO NO NO NO NO NO NO
2.C.7.b Nickel production NO NO NO NO NO NO NO NO NO NO NO NO NO NO NO 2.C.7.c Other metal production NA NE NE NE IE IE IE IE IE IE
2.C.7.d Storage, handling and transport of metal products
NO NO NO NO NO NO NO NO NO NO NO NO NO NO NO
2.D.3.a Domestic solvent use (incl. fungicides) NA NA NA NA NA NA NA NA NA NA NA NA NA NA
2.D.3.b Road paving with asphalt NA NA NA IE NA NA NA NA NA NA NA NA NA NA NA 2.D.3.c Asphalt roofing NA NA NA IE NA NA NA NA NA NA NA NA NA NA 2.D.3.d Coating application NA NA NA NA NA NA NA NA NA NA NA NA NA NA 2.D.3.e Degreasing NA NA NA NA NA NA NA NA NA NA NA NA NA NA 2.D.3.f Dry Cleaning NA NA NA NA NA NA NA NA NA NA NA NA NA NA 2.D.3.g Chemical Products NA NA NA NA NA NA NA NA NA NA NA NA 2.D.3.h Printing NA NA NA NA NA NA NA NA NA NA NA NA NA NA 2.D.3.i Other solvent use NA NA NA NA NA NA NA NA NA NA NA NA NA NA 2.G Other product use NA NA NA NA NA NA NA NE NE NE NA
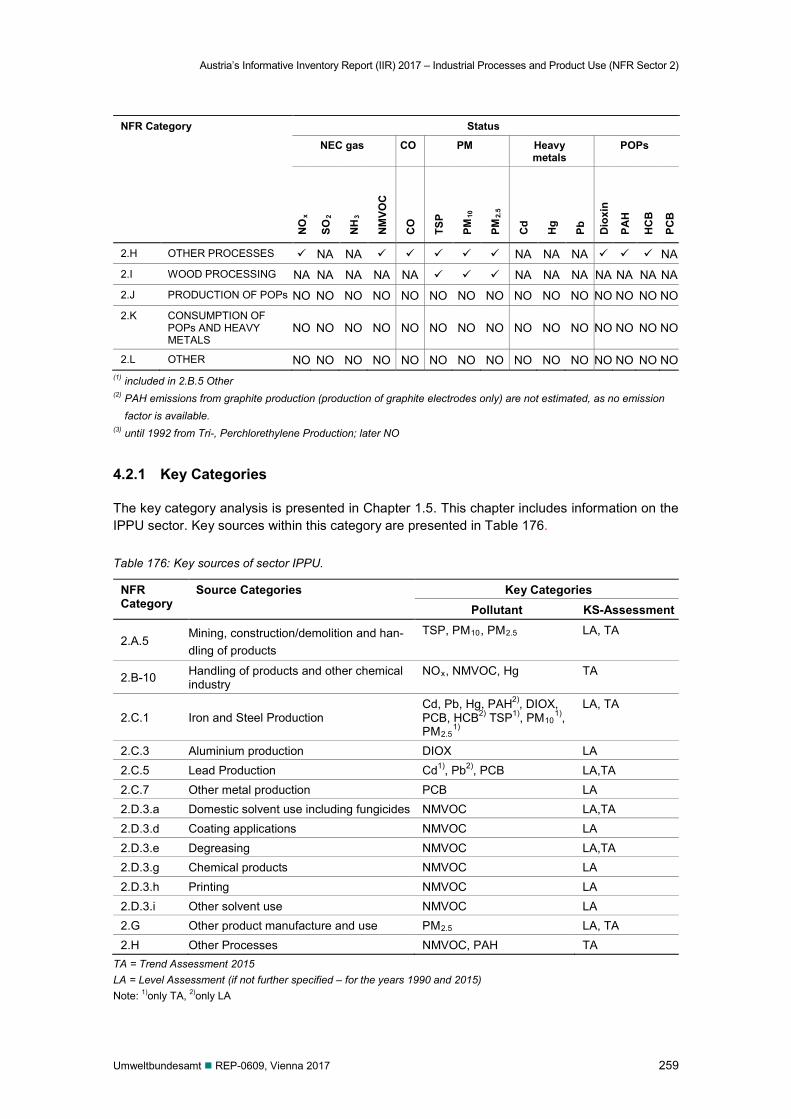
Austria’s Informative Inventory Report (IIR) 2017 – Industrial Processes and Product Use (NFR Sector 2)
Umweltbundesamt REP-0609, Vienna 2017 259
NFR Category Status
NEC gas CO PM Heavy metals
POPs
NO
x
SO2
NH
3
NM
VOC
CO
TSP
PM10
PM2.
5
Cd
Hg
Pb
Dio
xin
PAH
HC
B
PCB
2.H OTHER PROCESSES NA NA NA NA NA NA 2.I WOOD PROCESSING NA NA NA NA NA NA NA NA NA NA NA NA 2.J PRODUCTION OF POPs NO NO NO NO NO NO NO NO NO NO NO NO NO NO NO 2.K CONSUMPTION OF
POPs AND HEAVY METALS
NO NO NO NO NO NO NO NO NO NO NO NO NO NO NO
2.L OTHER NO NO NO NO NO NO NO NO NO NO NO NO NO NO NO (1) included in 2.B.5 Other (2) PAH emissions from graphite production (production of graphite electrodes only) are not estimated, as no emission
factor is available. (3) until 1992 from Tri-, Perchlorethylene Production; later NO
4.2.1 Key Categories
The key category analysis is presented in Chapter 1.5. This chapter includes information on the IPPU sector. Key sources within this category are presented in Table 176.
Table 176: Key sources of sector IPPU.
NFR Category
Source Categories Key Categories Pollutant KS-Assessment
2.A.5 Mining, construction/demolition and han-dling of products
TSP, PM10, PM2.5 LA, TA
2.B-10 Handling of products and other chemical industry
NOx, NMVOC, Hg TA
2.C.1 Iron and Steel Production Cd, Pb, Hg, PAH2), DIOX, PCB, HCB2) TSP1), PM10
1), PM2.5
1)
LA, TA
2.C.3 Aluminium production DIOX LA 2.C.5 Lead Production Cd1), Pb2), PCB LA,TA 2.C.7 Other metal production PCB LA 2.D.3.a Domestic solvent use including fungicides NMVOC LA,TA 2.D.3.d Coating applications NMVOC LA 2.D.3.e Degreasing NMVOC LA,TA 2.D.3.g Chemical products NMVOC LA 2.D.3.h Printing NMVOC LA 2.D.3.i Other solvent use NMVOC LA 2.G Other product manufacture and use PM2.5 LA, TA 2.H Other Processes NMVOC, PAH TA
TA = Trend Assessment 2015 LA = Level Assessment (if not further specified – for the years 1990 and 2015) Note: 1)only TA, 2)only LA
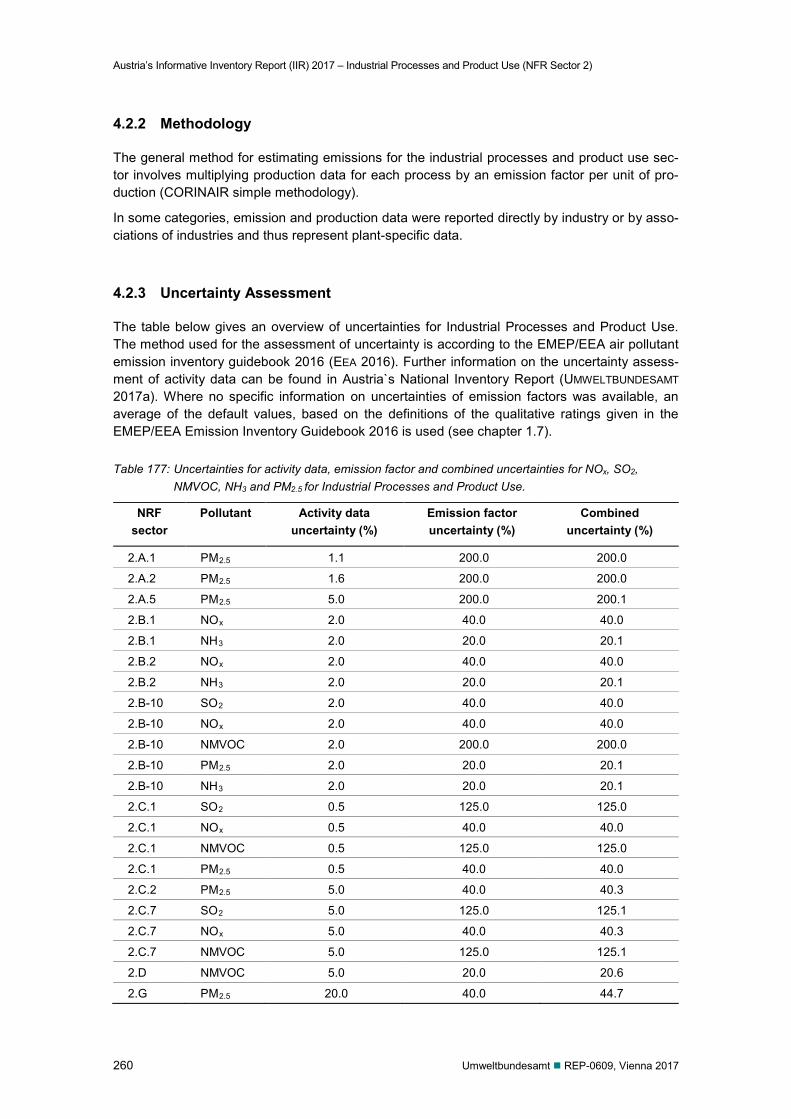
Austria’s Informative Inventory Report (IIR) 2017 – Industrial Processes and Product Use (NFR Sector 2)
260 Umweltbundesamt REP-0609, Vienna 2017
4.2.2 Methodology
The general method for estimating emissions for the industrial processes and product use sec-tor involves multiplying production data for each process by an emission factor per unit of pro-duction (CORINAIR simple methodology).
In some categories, emission and production data were reported directly by industry or by asso-ciations of industries and thus represent plant-specific data.
4.2.3 Uncertainty Assessment
The table below gives an overview of uncertainties for Industrial Processes and Product Use. The method used for the assessment of uncertainty is according to the EMEP/EEA air pollutant emission inventory guidebook 2016 (EEA 2016). Further information on the uncertainty assess-ment of activity data can be found in Austria`s National Inventory Report (UMWELTBUNDESAMT 2017a). Where no specific information on uncertainties of emission factors was available, an average of the default values, based on the definitions of the qualitative ratings given in the EMEP/EEA Emission Inventory Guidebook 2016 is used (see chapter 1.7).
Table 177: Uncertainties for activity data, emission factor and combined uncertainties for NOx, SO2, NMVOC, NH3 and PM2.5 for Industrial Processes and Product Use.
NRF sector
Pollutant Activity data uncertainty (%)
Emission factor uncertainty (%)
Combined uncertainty (%)
2.A.1 PM2.5 1.1 200.0 200.0
2.A.2 PM2.5 1.6 200.0 200.0
2.A.5 PM2.5 5.0 200.0 200.1
2.B.1 NOx 2.0 40.0 40.0
2.B.1 NH3 2.0 20.0 20.1
2.B.2 NOx 2.0 40.0 40.0
2.B.2 NH3 2.0 20.0 20.1
2.B-10 SO2 2.0 40.0 40.0
2.B-10 NOx 2.0 40.0 40.0
2.B-10 NMVOC 2.0 200.0 200.0
2.B-10 PM2.5 2.0 20.0 20.1
2.B-10 NH3 2.0 20.0 20.1
2.C.1 SO2 0.5 125.0 125.0
2.C.1 NOx 0.5 40.0 40.0
2.C.1 NMVOC 0.5 125.0 125.0
2.C.1 PM2.5 0.5 40.0 40.0
2.C.2 PM2.5 5.0 40.0 40.3
2.C.7 SO2 5.0 125.0 125.1
2.C.7 NOx 5.0 40.0 40.3
2.C.7 NMVOC 5.0 125.0 125.1
2.D NMVOC 5.0 20.0 20.6
2.G PM2.5 20.0 40.0 44.7
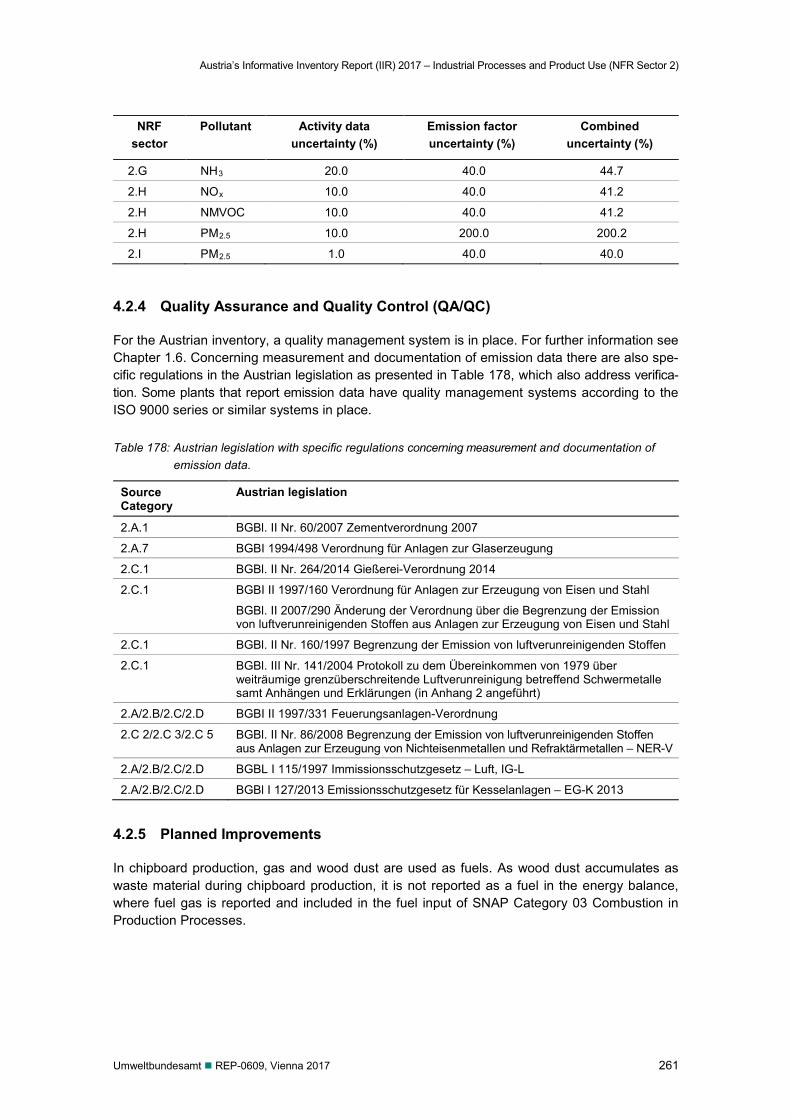
Austria’s Informative Inventory Report (IIR) 2017 – Industrial Processes and Product Use (NFR Sector 2)
Umweltbundesamt REP-0609, Vienna 2017 261
NRF sector
Pollutant Activity data uncertainty (%)
Emission factor uncertainty (%)
Combined uncertainty (%)
2.G NH3 20.0 40.0 44.7
2.H NOx 10.0 40.0 41.2
2.H NMVOC 10.0 40.0 41.2
2.H PM2.5 10.0 200.0 200.2
2.I PM2.5 1.0 40.0 40.0
4.2.4 Quality Assurance and Quality Control (QA/QC)
For the Austrian inventory, a quality management system is in place. For further information see Chapter 1.6. Concerning measurement and documentation of emission data there are also spe-cific regulations in the Austrian legislation as presented in Table 178, which also address verifica-tion. Some plants that report emission data have quality management systems according to the ISO 9000 series or similar systems in place.
Table 178: Austrian legislation with specific regulations concerning measurement and documentation of emission data.
Source Category
Austrian legislation
2.A.1 BGBl. II Nr. 60/2007 Zementverordnung 2007
2.A.7 BGBI 1994/498 Verordnung für Anlagen zur Glaserzeugung
2.C.1 BGBl. II Nr. 264/2014 Gießerei-Verordnung 2014
2.C.1 BGBI II 1997/160 Verordnung für Anlagen zur Erzeugung von Eisen und Stahl
BGBl. II 2007/290 Änderung der Verordnung über die Begrenzung der Emission von luftverunreinigenden Stoffen aus Anlagen zur Erzeugung von Eisen und Stahl
2.C.1 BGBl. II Nr. 160/1997 Begrenzung der Emission von luftverunreinigenden Stoffen
2.C.1 BGBl. III Nr. 141/2004 Protokoll zu dem Übereinkommen von 1979 über weiträumige grenzüberschreitende Luftverunreinigung betreffend Schwermetalle samt Anhängen und Erklärungen (in Anhang 2 angeführt)
2.A/2.B/2.C/2.D BGBI II 1997/331 Feuerungsanlagen-Verordnung
2.C 2/2.C 3/2.C 5 BGBl. II Nr. 86/2008 Begrenzung der Emission von luftverunreinigenden Stoffen aus Anlagen zur Erzeugung von Nichteisenmetallen und Refraktärmetallen – NER-V
2.A/2.B/2.C/2.D BGBL I 115/1997 Immissionsschutzgesetz – Luft, IG-L
2.A/2.B/2.C/2.D BGBl I 127/2013 Emissionsschutzgesetz für Kesselanlagen – EG-K 2013
4.2.5 Planned Improvements
In chipboard production, gas and wood dust are used as fuels. As wood dust accumulates as waste material during chipboard production, it is not reported as a fuel in the energy balance, where fuel gas is reported and included in the fuel input of SNAP Category 03 Combustion in Production Processes.
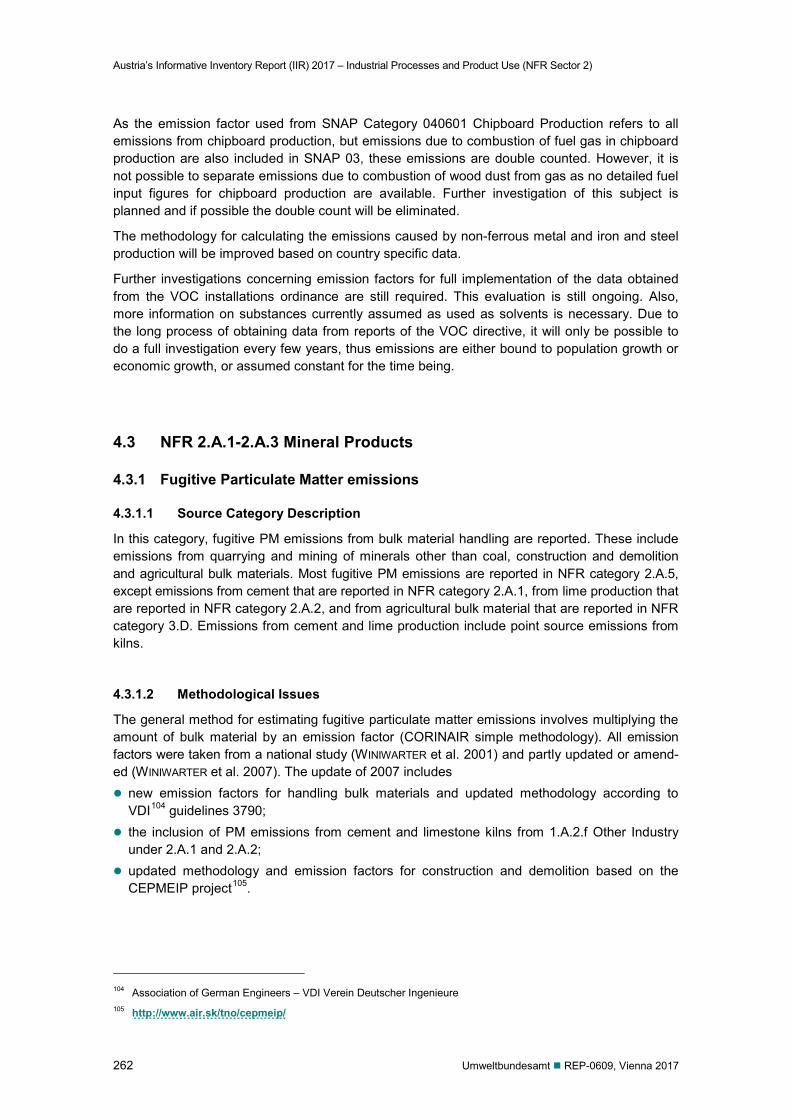
Austria’s Informative Inventory Report (IIR) 2017 – Industrial Processes and Product Use (NFR Sector 2)
262 Umweltbundesamt REP-0609, Vienna 2017
As the emission factor used from SNAP Category 040601 Chipboard Production refers to all emissions from chipboard production, but emissions due to combustion of fuel gas in chipboard production are also included in SNAP 03, these emissions are double counted. However, it is not possible to separate emissions due to combustion of wood dust from gas as no detailed fuel input figures for chipboard production are available. Further investigation of this subject is planned and if possible the double count will be eliminated.
The methodology for calculating the emissions caused by non-ferrous metal and iron and steel production will be improved based on country specific data.
Further investigations concerning emission factors for full implementation of the data obtained from the VOC installations ordinance are still required. This evaluation is still ongoing. Also, more information on substances currently assumed as used as solvents is necessary. Due to the long process of obtaining data from reports of the VOC directive, it will only be possible to do a full investigation every few years, thus emissions are either bound to population growth or economic growth, or assumed constant for the time being.
4.3 NFR 2.A.1-2.A.3 Mineral Products
4.3.1 Fugitive Particulate Matter emissions
4.3.1.1 Source Category Description
In this category, fugitive PM emissions from bulk material handling are reported. These include emissions from quarrying and mining of minerals other than coal, construction and demolition and agricultural bulk materials. Most fugitive PM emissions are reported in NFR category 2.A.5, except emissions from cement that are reported in NFR category 2.A.1, from lime production that are reported in NFR category 2.A.2, and from agricultural bulk material that are reported in NFR category 3.D. Emissions from cement and lime production include point source emissions from kilns.
4.3.1.2 Methodological Issues
The general method for estimating fugitive particulate matter emissions involves multiplying the amount of bulk material by an emission factor (CORINAIR simple methodology). All emission factors were taken from a national study (WINIWARTER et al. 2001) and partly updated or amend-ed (WINIWARTER et al. 2007). The update of 2007 includes new emission factors for handling bulk materials and updated methodology according to
VDI104 guidelines 3790; the inclusion of PM emissions from cement and limestone kilns from 1.A.2.f Other Industry
under 2.A.1 and 2.A.2; updated methodology and emission factors for construction and demolition based on the
CEPMEIP project105.
104 Association of German Engineers – VDI Verein Deutscher Ingenieure 105 http://www.air.sk/tno/cepmeip/
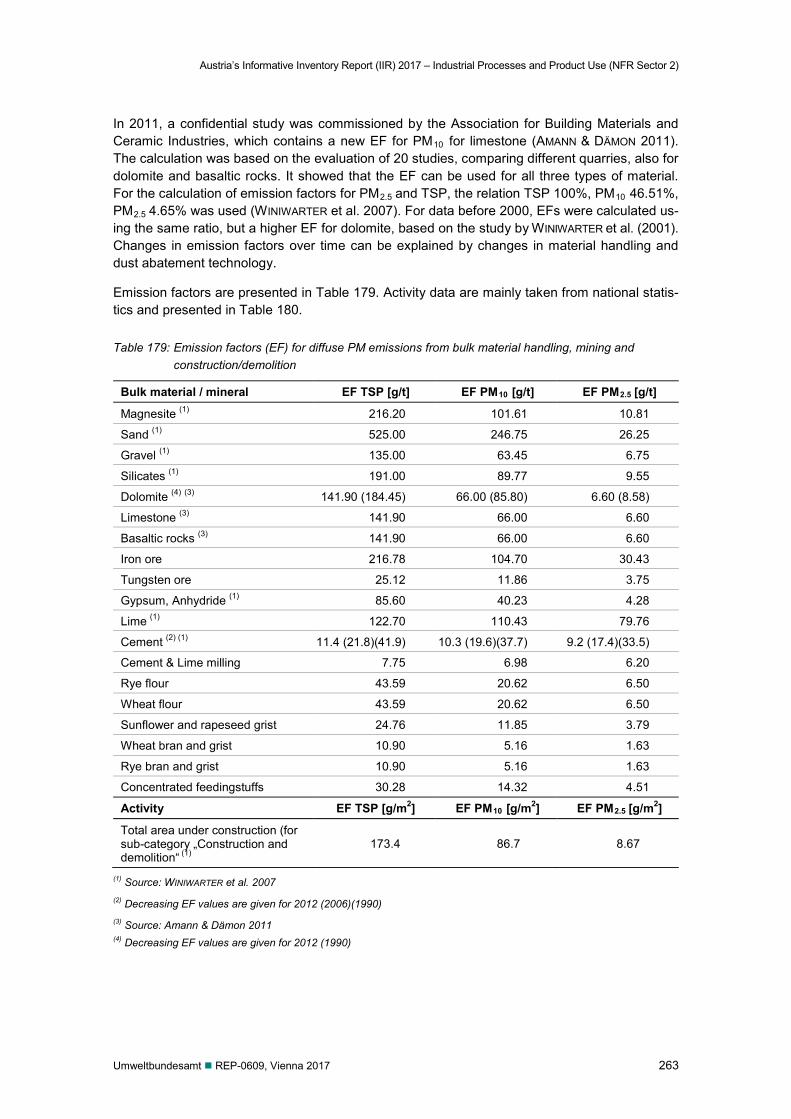
Austria’s Informative Inventory Report (IIR) 2017 – Industrial Processes and Product Use (NFR Sector 2)
Umweltbundesamt REP-0609, Vienna 2017 263
In 2011, a confidential study was commissioned by the Association for Building Materials and Ceramic Industries, which contains a new EF for PM10 for limestone (AMANN & DÄMON 2011). The calculation was based on the evaluation of 20 studies, comparing different quarries, also for dolomite and basaltic rocks. It showed that the EF can be used for all three types of material. For the calculation of emission factors for PM2.5 and TSP, the relation TSP 100%, PM10 46.51%, PM2.5 4.65% was used (WINIWARTER et al. 2007). For data before 2000, EFs were calculated us-ing the same ratio, but a higher EF for dolomite, based on the study by WINIWARTER et al. (2001). Changes in emission factors over time can be explained by changes in material handling and dust abatement technology.
Emission factors are presented in Table 179. Activity data are mainly taken from national statis-tics and presented in Table 180.
Table 179: Emission factors (EF) for diffuse PM emissions from bulk material handling, mining and construction/demolition
Bulk material / mineral EF TSP [g/t] EF PM10 [g/t] EF PM2.5 [g/t]
Magnesite (1) 216.20 101.61 10.81
Sand (1) 525.00 246.75 26.25
Gravel (1) 135.00 63.45 6.75
Silicates (1) 191.00 89.77 9.55
Dolomite (4) (3) 141.90 (184.45) 66.00 (85.80) 6.60 (8.58)
Limestone (3) 141.90 66.00 6.60
Basaltic rocks (3) 141.90 66.00 6.60
Iron ore 216.78 104.70 30.43
Tungsten ore 25.12 11.86 3.75
Gypsum, Anhydride (1) 85.60 40.23 4.28
Lime (1) 122.70 110.43 79.76
Cement (2) (1) 11.4 (21.8)(41.9) 10.3 (19.6)(37.7) 9.2 (17.4)(33.5)
Cement & Lime milling 7.75 6.98 6.20
Rye flour 43.59 20.62 6.50
Wheat flour 43.59 20.62 6.50
Sunflower and rapeseed grist 24.76 11.85 3.79
Wheat bran and grist 10.90 5.16 1.63
Rye bran and grist 10.90 5.16 1.63
Concentrated feedingstuffs 30.28 14.32 4.51
Activity EF TSP [g/m2] EF PM10 [g/m2] EF PM2.5 [g/m2]
Total area under construction (for sub-category „Construction and demolition“ (1)
173.4 86.7 8.67
(1) Source: WINIWARTER et al. 2007 (2) Decreasing EF values are given for 2012 (2006)(1990) (3) Source: Amann & Dämon 2011 (4) Decreasing EF values are given for 2012 (1990)
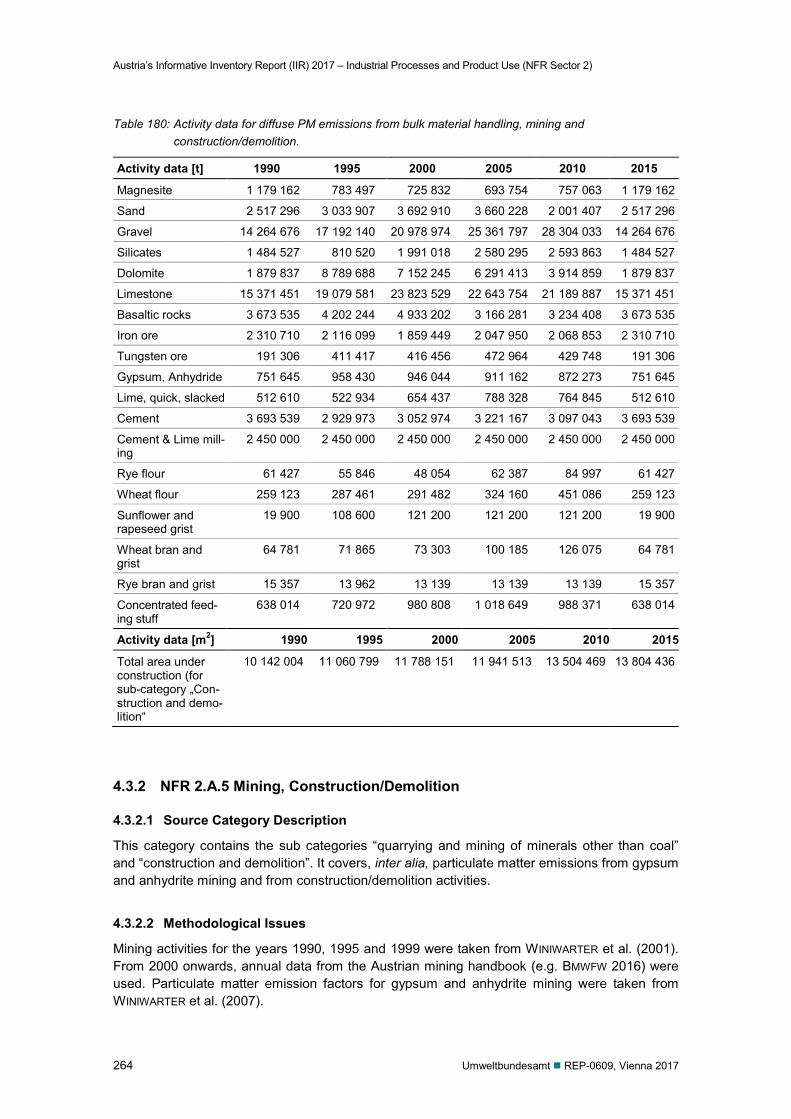
Austria’s Informative Inventory Report (IIR) 2017 – Industrial Processes and Product Use (NFR Sector 2)
264 Umweltbundesamt REP-0609, Vienna 2017
Table 180: Activity data for diffuse PM emissions from bulk material handling, mining and construction/demolition.
Activity data [t] 1990 1995 2000 2005 2010 2015
Magnesite 1 179 162 783 497 725 832 693 754 757 063 1 179 162
Sand 2 517 296 3 033 907 3 692 910 3 660 228 2 001 407 2 517 296
Gravel 14 264 676 17 192 140 20 978 974 25 361 797 28 304 033 14 264 676
Silicates 1 484 527 810 520 1 991 018 2 580 295 2 593 863 1 484 527
Dolomite 1 879 837 8 789 688 7 152 245 6 291 413 3 914 859 1 879 837
Limestone 15 371 451 19 079 581 23 823 529 22 643 754 21 189 887 15 371 451
Basaltic rocks 3 673 535 4 202 244 4 933 202 3 166 281 3 234 408 3 673 535
Iron ore 2 310 710 2 116 099 1 859 449 2 047 950 2 068 853 2 310 710
Tungsten ore 191 306 411 417 416 456 472 964 429 748 191 306
Gypsum, Anhydride 751 645 958 430 946 044 911 162 872 273 751 645
Lime, quick, slacked 512 610 522 934 654 437 788 328 764 845 512 610
Cement 3 693 539 2 929 973 3 052 974 3 221 167 3 097 043 3 693 539
Cement & Lime mill-ing
2 450 000 2 450 000 2 450 000 2 450 000 2 450 000 2 450 000
Rye flour 61 427 55 846 48 054 62 387 84 997 61 427
Wheat flour 259 123 287 461 291 482 324 160 451 086 259 123
Sunflower and rapeseed grist
19 900 108 600 121 200 121 200 121 200 19 900
Wheat bran and grist
64 781 71 865 73 303 100 185 126 075 64 781
Rye bran and grist 15 357 13 962 13 139 13 139 13 139 15 357
Concentrated feed-ing stuff
638 014 720 972 980 808 1 018 649 988 371 638 014
Activity data [m2] 1990 1995 2000 2005 2010 2015
Total area under construction (for sub-category „Con-struction and demo-lition“
10 142 004 11 060 799 11 788 151 11 941 513 13 504 469 13 804 436
4.3.2 NFR 2.A.5 Mining, Construction/Demolition
4.3.2.1 Source Category Description
This category contains the sub categories “quarrying and mining of minerals other than coal” and “construction and demolition”. It covers, inter alia, particulate matter emissions from gypsum and anhydrite mining and from construction/demolition activities.
4.3.2.2 Methodological Issues
Mining activities for the years 1990, 1995 and 1999 were taken from WINIWARTER et al. (2001). From 2000 onwards, annual data from the Austrian mining handbook (e.g. BMWFW 2016) were used. Particulate matter emission factors for gypsum and anhydrite mining were taken from WINIWARTER et al. (2007).
Austria’s Informative Inventory Report (IIR) 2017 – Industrial Processes and Product Use (NFR Sector 2)
Umweltbundesamt REP-0609, Vienna 2017 265
Construction and demolition emissions are based on data from Statistik Austria on the total area under construction (in m²). This area is multiplied by emission factors for TSP, PM10 and PM2.5 derived by WINIWARTER et al. (2007).
Emission factors and activity data for mining, construction/demolition and handling of products are presented in Table 179 and Table 180, above.
4.3.3 Category-specific Recalculations
NFR 2.A.5.b, SNAP 040617 Other – Construction and demolition: Emissions changed, due to changes of the building-cost index
The activity for 2012 until 2014 of the following categories provided by the Austrian mining handbook have changed (BMWFW 2016) NFR 2.A.5.a, SNAP 04 06 17 Other – X4F NFR 2.A.5.a, SNAP 040617 Other – X4G
4.4 NFR 2.B Chemical Products
4.4.1 NFR 2.B.1 Ammonia and 2.B.2 Nitric Acid Production
4.4.1.1 Source Category Description
Ammonia (NH3) is produced by catalytic steam reforming of natural gas or other light hydrocar-bons (e.g. liquefied petroleum gas, naphtha). Nitric acid (HNO3) is produced from ammonia (NH3), where in a first step NH3 reacts with air to NO and NO2 and then reacts with water to form HNO3. Both processes are minor sources of NH3 and NOx emissions. During ammonia pro-duction, small amounts of CO are emitted.
In Austria there is only one producer of ammonia and nitric acid.
The following chart (Figure 41) depicts the process of ammonia synthesis, the main production lines (ammonia, urea, melamine, nitric acid, fertiliser etc.) with their main raw material as well their internal subsequent processing of related products (UMWELTBUNDESAMT 2004d).
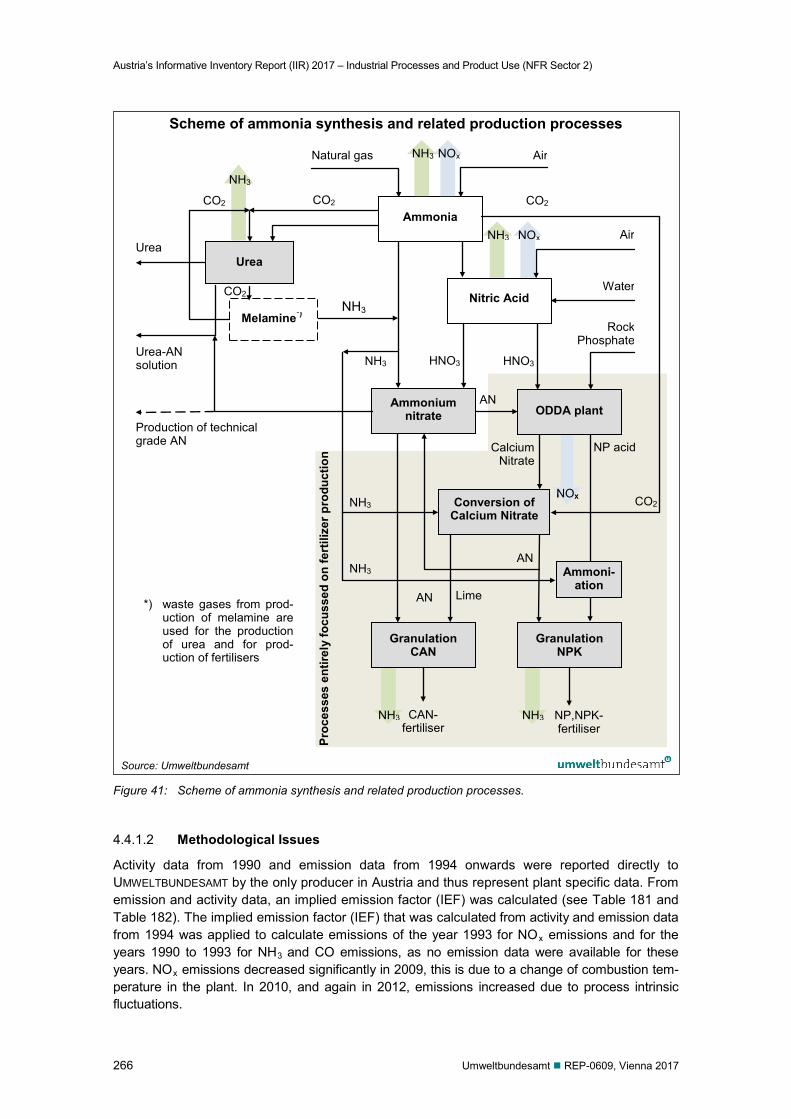
Austria’s Informative Inventory Report (IIR) 2017 – Industrial Processes and Product Use (NFR Sector 2)
266 Umweltbundesamt REP-0609, Vienna 2017
Scheme of ammonia synthesis and related production processes
Proc
esse
s en
tirel
y fo
cuss
ed o
n fe
rtili
zer p
rodu
ctio
n
NH3
NOx
NOx
NH3
NOx
Natural gas Air
CO2 CO2
CO2 NH3
Ammonia
Nitric Acid
Air
Urea
ODDA plant
Rock Phosphate
Conversion of Calcium Nitrate
Ammonium nitrate
AN
NH3
NH3
Urea
NP,NPK- fertiliser
Granulation NPK
Granulation CAN
CAN- fertiliser
AN
Production of technical grade AN
CO2
Water
Melamine*)
Calcium Nitrate
HNO3
HNO3
Lime *) waste gases from prod-
uction of melamine are used for the production of urea and for prod-uction of fertilisers
Urea-AN solution
Ammoni- ation
NH3
NP acid
AN
CO2
NH3
NOx
NH3
NH3
Figure 41: Scheme of ammonia synthesis and related production processes.
4.4.1.2 Methodological Issues
Activity data from 1990 and emission data from 1994 onwards were reported directly to UMWELTBUNDESAMT by the only producer in Austria and thus represent plant specific data. From emission and activity data, an implied emission factor (IEF) was calculated (see Table 181 and Table 182). The implied emission factor (IEF) that was calculated from activity and emission data from 1994 was applied to calculate emissions of the year 1993 for NOx emissions and for the years 1990 to 1993 for NH3 and CO emissions, as no emission data were available for these years. NOx emissions decreased significantly in 2009, this is due to a change of combustion tem-perature in the plant. In 2010, and again in 2012, emissions increased due to process intrinsic fluctuations.
Source: Umweltbundesamt
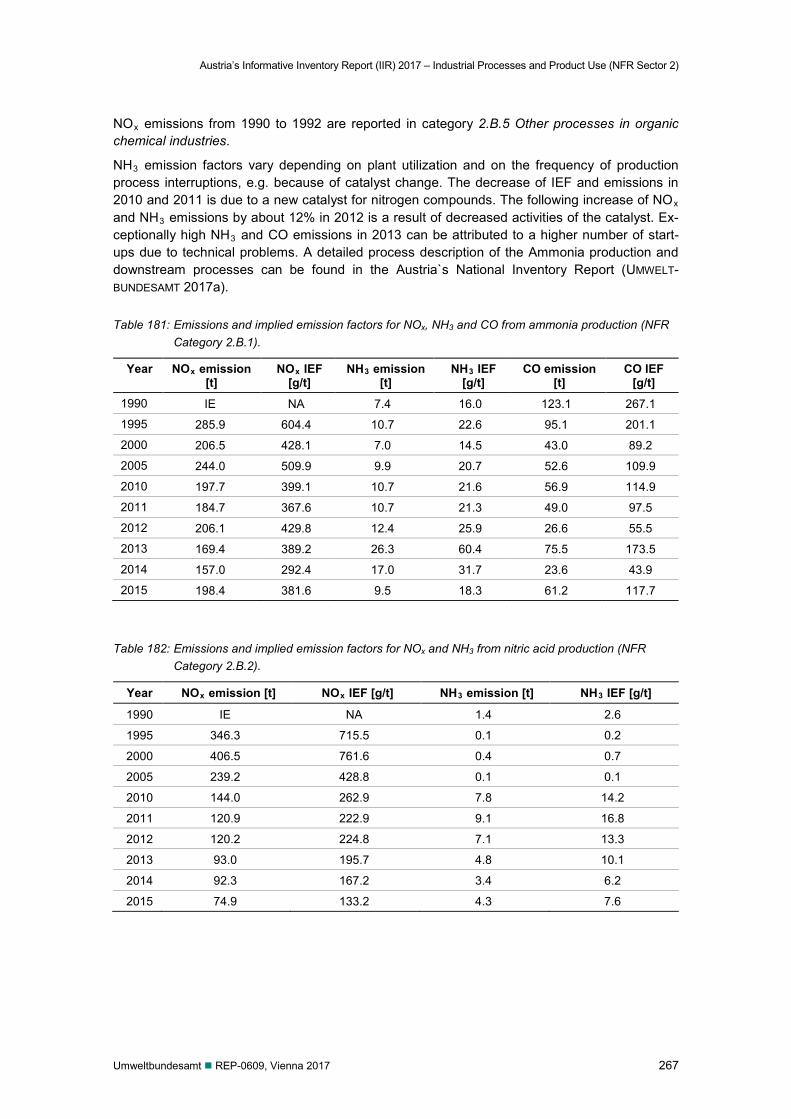
Austria’s Informative Inventory Report (IIR) 2017 – Industrial Processes and Product Use (NFR Sector 2)
Umweltbundesamt REP-0609, Vienna 2017 267
NOx emissions from 1990 to 1992 are reported in category 2.B.5 Other processes in organic chemical industries.
NH3 emission factors vary depending on plant utilization and on the frequency of production process interruptions, e.g. because of catalyst change. The decrease of IEF and emissions in 2010 and 2011 is due to a new catalyst for nitrogen compounds. The following increase of NOx and NH3 emissions by about 12% in 2012 is a result of decreased activities of the catalyst. Ex-ceptionally high NH3 and CO emissions in 2013 can be attributed to a higher number of start-ups due to technical problems. A detailed process description of the Ammonia production and downstream processes can be found in the Austria`s National Inventory Report (UMWELT-BUNDESAMT 2017a).
Table 181: Emissions and implied emission factors for NOx, NH3 and CO from ammonia production (NFR Category 2.B.1).
Year NOx emission [t]
NOx IEF [g/t]
NH3 emission [t]
NH3 IEF [g/t]
CO emission [t]
CO IEF [g/t]
1990 IE NA 7.4 16.0 123.1 267.1
1995 285.9 604.4 10.7 22.6 95.1 201.1
2000 206.5 428.1 7.0 14.5 43.0 89.2
2005 244.0 509.9 9.9 20.7 52.6 109.9
2010 197.7 399.1 10.7 21.6 56.9 114.9
2011 184.7 367.6 10.7 21.3 49.0 97.5
2012 206.1 429.8 12.4 25.9 26.6 55.5
2013 169.4 389.2 26.3 60.4 75.5 173.5
2014 157.0 292.4 17.0 31.7 23.6 43.9
2015 198.4 381.6 9.5 18.3 61.2 117.7
Table 182: Emissions and implied emission factors for NOx and NH3 from nitric acid production (NFR Category 2.B.2).
Year NOx emission [t] NOx IEF [g/t] NH3 emission [t] NH3 IEF [g/t]
1990 IE NA 1.4 2.6
1995 346.3 715.5 0.1 0.2
2000 406.5 761.6 0.4 0.7
2005 239.2 428.8 0.1 0.1
2010 144.0 262.9 7.8 14.2
2011 120.9 222.9 9.1 16.8
2012 120.2 224.8 7.1 13.3
2013 93.0 195.7 4.8 10.1
2014 92.3 167.2 3.4 6.2
2015 74.9 133.2 4.3 7.6
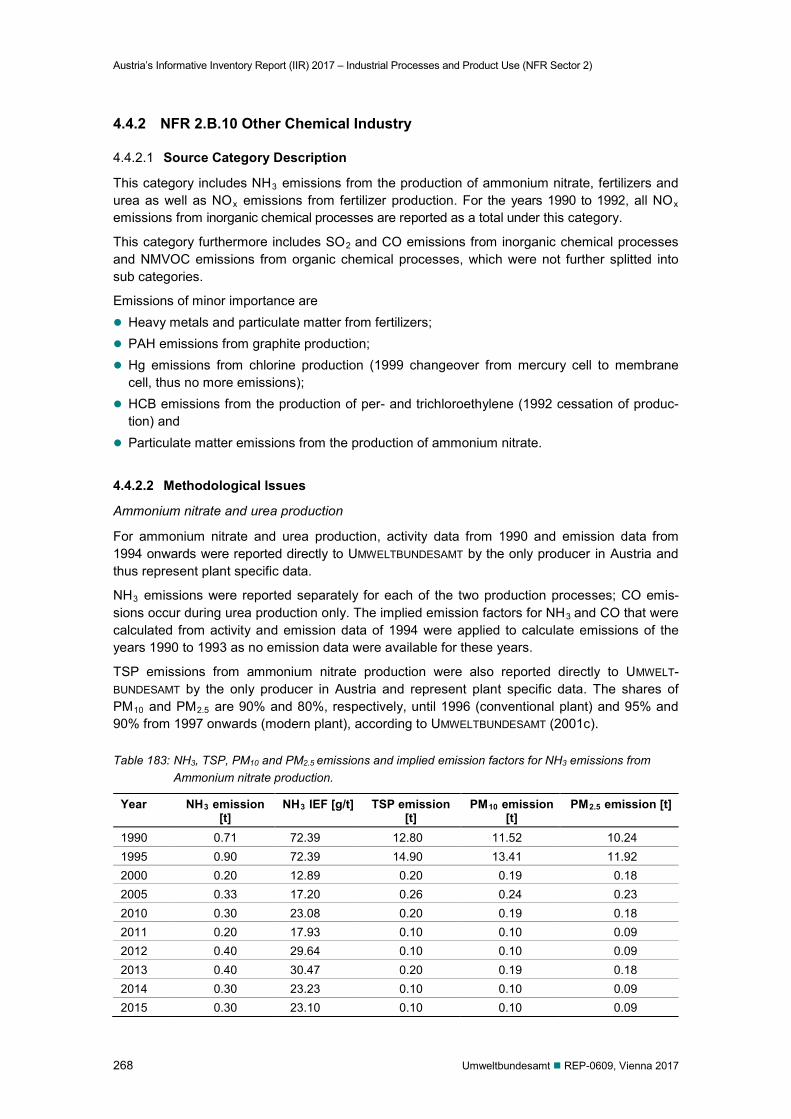
Austria’s Informative Inventory Report (IIR) 2017 – Industrial Processes and Product Use (NFR Sector 2)
268 Umweltbundesamt REP-0609, Vienna 2017
4.4.2 NFR 2.B.10 Other Chemical Industry
4.4.2.1 Source Category Description
This category includes NH3 emissions from the production of ammonium nitrate, fertilizers and urea as well as NOx emissions from fertilizer production. For the years 1990 to 1992, all NOx emissions from inorganic chemical processes are reported as a total under this category.
This category furthermore includes SO2 and CO emissions from inorganic chemical processes and NMVOC emissions from organic chemical processes, which were not further splitted into sub categories.
Emissions of minor importance are Heavy metals and particulate matter from fertilizers; PAH emissions from graphite production; Hg emissions from chlorine production (1999 changeover from mercury cell to membrane
cell, thus no more emissions); HCB emissions from the production of per- and trichloroethylene (1992 cessation of produc-
tion) and Particulate matter emissions from the production of ammonium nitrate. 4.4.2.2 Methodological Issues
Ammonium nitrate and urea production
For ammonium nitrate and urea production, activity data from 1990 and emission data from 1994 onwards were reported directly to UMWELTBUNDESAMT by the only producer in Austria and thus represent plant specific data.
NH3 emissions were reported separately for each of the two production processes; CO emis-sions occur during urea production only. The implied emission factors for NH3 and CO that were calculated from activity and emission data of 1994 were applied to calculate emissions of the years 1990 to 1993 as no emission data were available for these years.
TSP emissions from ammonium nitrate production were also reported directly to UMWELT-BUNDESAMT by the only producer in Austria and represent plant specific data. The shares of PM10 and PM2.5 are 90% and 80%, respectively, until 1996 (conventional plant) and 95% and 90% from 1997 onwards (modern plant), according to UMWELTBUNDESAMT (2001c).
Table 183: NH3, TSP, PM10 and PM2.5 emissions and implied emission factors for NH3 emissions from Ammonium nitrate production.
Year NH3 emission [t]
NH3 IEF [g/t] TSP emission [t]
PM10 emission [t]
PM2.5 emission [t]
1990 0.71 72.39 12.80 11.52 10.24 1995 0.90 72.39 14.90 13.41 11.92 2000 0.20 12.89 0.20 0.19 0.18 2005 0.33 17.20 0.26 0.24 0.23 2010 0.30 23.08 0.20 0.19 0.18 2011 0.20 17.93 0.10 0.10 0.09 2012 0.40 29.64 0.10 0.10 0.09 2013 0.40 30.47 0.20 0.19 0.18 2014 0.30 23.23 0.10 0.10 0.09 2015 0.30 23.10 0.10 0.10 0.09
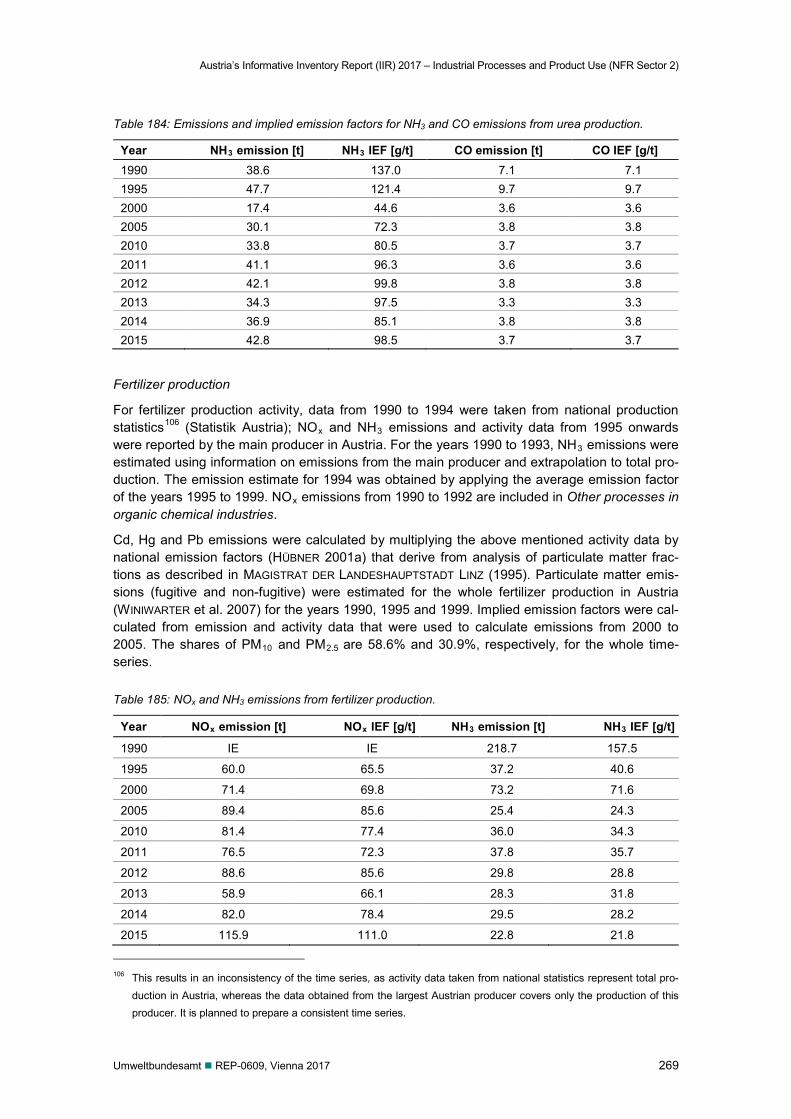
Austria’s Informative Inventory Report (IIR) 2017 – Industrial Processes and Product Use (NFR Sector 2)
Umweltbundesamt REP-0609, Vienna 2017 269
Table 184: Emissions and implied emission factors for NH3 and CO emissions from urea production.
Year NH3 emission [t] NH3 IEF [g/t] CO emission [t] CO IEF [g/t] 1990 38.6 137.0 7.1 7.1 1995 47.7 121.4 9.7 9.7 2000 17.4 44.6 3.6 3.6 2005 30.1 72.3 3.8 3.8 2010 33.8 80.5 3.7 3.7 2011 41.1 96.3 3.6 3.6 2012 42.1 99.8 3.8 3.8 2013 34.3 97.5 3.3 3.3 2014 36.9 85.1 3.8 3.8 2015 42.8 98.5 3.7 3.7
Fertilizer production
For fertilizer production activity, data from 1990 to 1994 were taken from national production statistics106 (Statistik Austria); NOx and NH3 emissions and activity data from 1995 onwards were reported by the main producer in Austria. For the years 1990 to 1993, NH3 emissions were estimated using information on emissions from the main producer and extrapolation to total pro-duction. The emission estimate for 1994 was obtained by applying the average emission factor of the years 1995 to 1999. NOx emissions from 1990 to 1992 are included in Other processes in organic chemical industries.
Cd, Hg and Pb emissions were calculated by multiplying the above mentioned activity data by national emission factors (HÜBNER 2001a) that derive from analysis of particulate matter frac-tions as described in MAGISTRAT DER LANDESHAUPTSTADT LINZ (1995). Particulate matter emis-sions (fugitive and non-fugitive) were estimated for the whole fertilizer production in Austria (WINIWARTER et al. 2007) for the years 1990, 1995 and 1999. Implied emission factors were cal-culated from emission and activity data that were used to calculate emissions from 2000 to 2005. The shares of PM10 and PM2.5 are 58.6% and 30.9%, respectively, for the whole time-series.
Table 185: NOx and NH3 emissions from fertilizer production.
Year NOx emission [t] NOx IEF [g/t] NH3 emission [t] NH3 IEF [g/t]
1990 IE IE 218.7 157.5
1995 60.0 65.5 37.2 40.6
2000 71.4 69.8 73.2 71.6
2005 89.4 85.6 25.4 24.3
2010 81.4 77.4 36.0 34.3
2011 76.5 72.3 37.8 35.7
2012 88.6 85.6 29.8 28.8
2013 58.9 66.1 28.3 31.8
2014 82.0 78.4 29.5 28.2
2015 115.9 111.0 22.8 21.8
106 This results in an inconsistency of the time series, as activity data taken from national statistics represent total pro-
duction in Austria, whereas the data obtained from the largest Austrian producer covers only the production of this producer. It is planned to prepare a consistent time series.
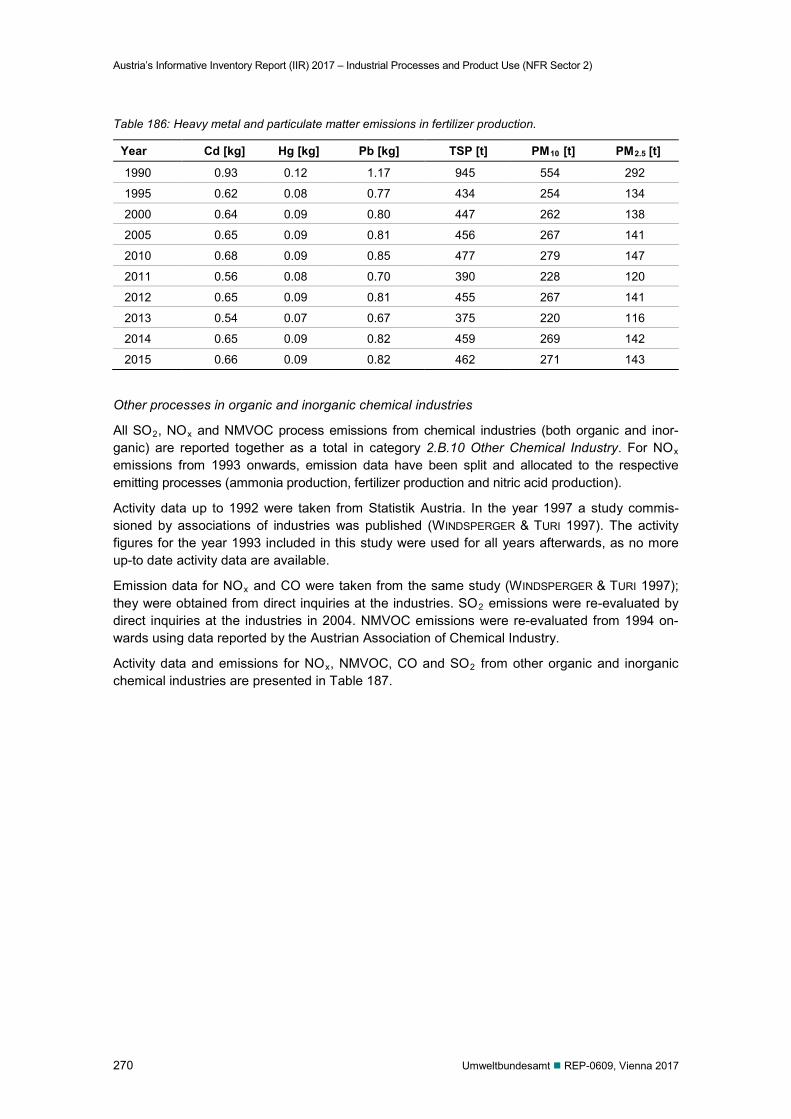
Austria’s Informative Inventory Report (IIR) 2017 – Industrial Processes and Product Use (NFR Sector 2)
270 Umweltbundesamt REP-0609, Vienna 2017
Table 186: Heavy metal and particulate matter emissions in fertilizer production.
Year Cd [kg] Hg [kg] Pb [kg] TSP [t] PM10 [t] PM2.5 [t]
1990 0.93 0.12 1.17 945 554 292
1995 0.62 0.08 0.77 434 254 134
2000 0.64 0.09 0.80 447 262 138
2005 0.65 0.09 0.81 456 267 141
2010 0.68 0.09 0.85 477 279 147
2011 0.56 0.08 0.70 390 228 120
2012 0.65 0.09 0.81 455 267 141
2013 0.54 0.07 0.67 375 220 116
2014 0.65 0.09 0.82 459 269 142
2015 0.66 0.09 0.82 462 271 143
Other processes in organic and inorganic chemical industries
All SO2, NOx and NMVOC process emissions from chemical industries (both organic and inor-ganic) are reported together as a total in category 2.B.10 Other Chemical Industry. For NOx emissions from 1993 onwards, emission data have been split and allocated to the respective emitting processes (ammonia production, fertilizer production and nitric acid production).
Activity data up to 1992 were taken from Statistik Austria. In the year 1997 a study commis-sioned by associations of industries was published (WINDSPERGER & TURI 1997). The activity figures for the year 1993 included in this study were used for all years afterwards, as no more up-to date activity data are available.
Emission data for NOx and CO were taken from the same study (WINDSPERGER & TURI 1997); they were obtained from direct inquiries at the industries. SO2 emissions were re-evaluated by direct inquiries at the industries in 2004. NMVOC emissions were re-evaluated from 1994 on-wards using data reported by the Austrian Association of Chemical Industry.
Activity data and emissions for NOx, NMVOC, CO and SO2 from other organic and inorganic chemical industries are presented in Table 187.
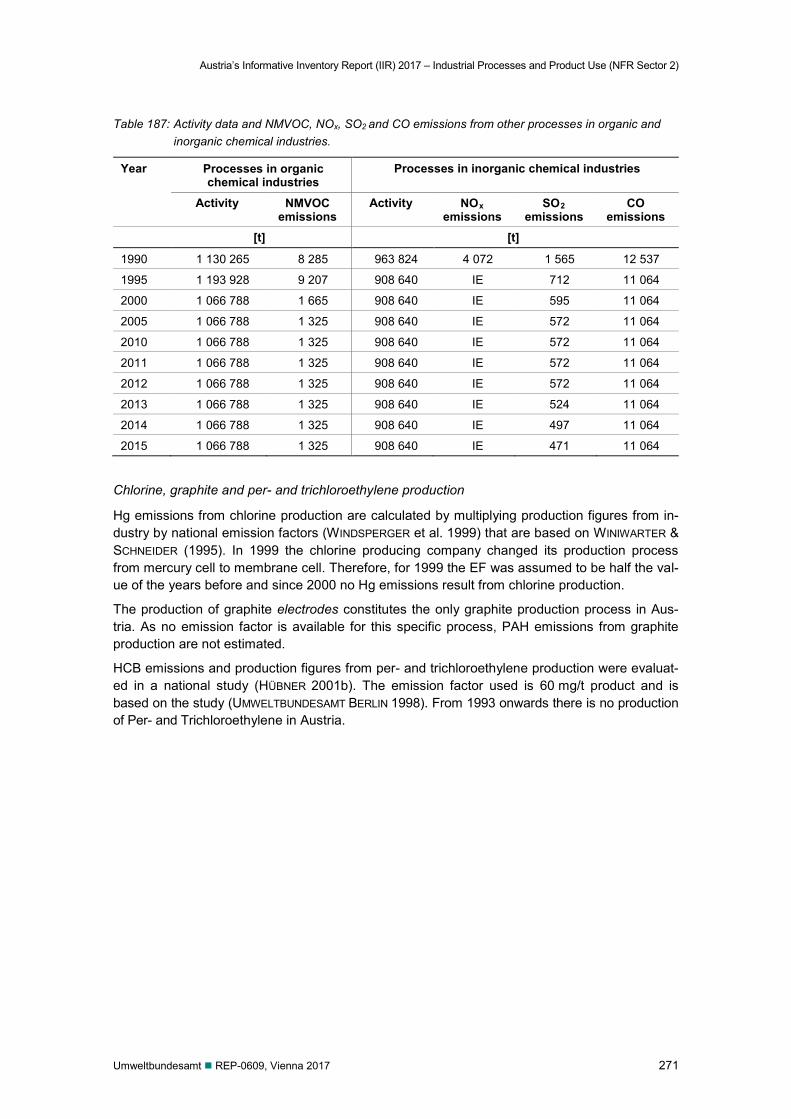
Austria’s Informative Inventory Report (IIR) 2017 – Industrial Processes and Product Use (NFR Sector 2)
Umweltbundesamt REP-0609, Vienna 2017 271
Table 187: Activity data and NMVOC, NOx, SO2 and CO emissions from other processes in organic and inorganic chemical industries.
Year Processes in organic chemical industries
Processes in inorganic chemical industries
Activity NMVOC emissions
Activity NOx emissions
SO2 emissions
CO emissions
[t] [t]
1990 1 130 265 8 285 963 824 4 072 1 565 12 537
1995 1 193 928 9 207 908 640 IE 712 11 064
2000 1 066 788 1 665 908 640 IE 595 11 064
2005 1 066 788 1 325 908 640 IE 572 11 064
2010 1 066 788 1 325 908 640 IE 572 11 064
2011 1 066 788 1 325 908 640 IE 572 11 064
2012 1 066 788 1 325 908 640 IE 572 11 064
2013 1 066 788 1 325 908 640 IE 524 11 064
2014 1 066 788 1 325 908 640 IE 497 11 064
2015 1 066 788 1 325 908 640 IE 471 11 064
Chlorine, graphite and per- and trichloroethylene production
Hg emissions from chlorine production are calculated by multiplying production figures from in-dustry by national emission factors (WINDSPERGER et al. 1999) that are based on WINIWARTER & SCHNEIDER (1995). In 1999 the chlorine producing company changed its production process from mercury cell to membrane cell. Therefore, for 1999 the EF was assumed to be half the val-ue of the years before and since 2000 no Hg emissions result from chlorine production.
The production of graphite electrodes constitutes the only graphite production process in Aus-tria. As no emission factor is available for this specific process, PAH emissions from graphite production are not estimated.
HCB emissions and production figures from per- and trichloroethylene production were evaluat-ed in a national study (HÜBNER 2001b). The emission factor used is 60 mg/t product and is based on the study (UMWELTBUNDESAMT BERLIN 1998). From 1993 onwards there is no production of Per- and Trichloroethylene in Austria.
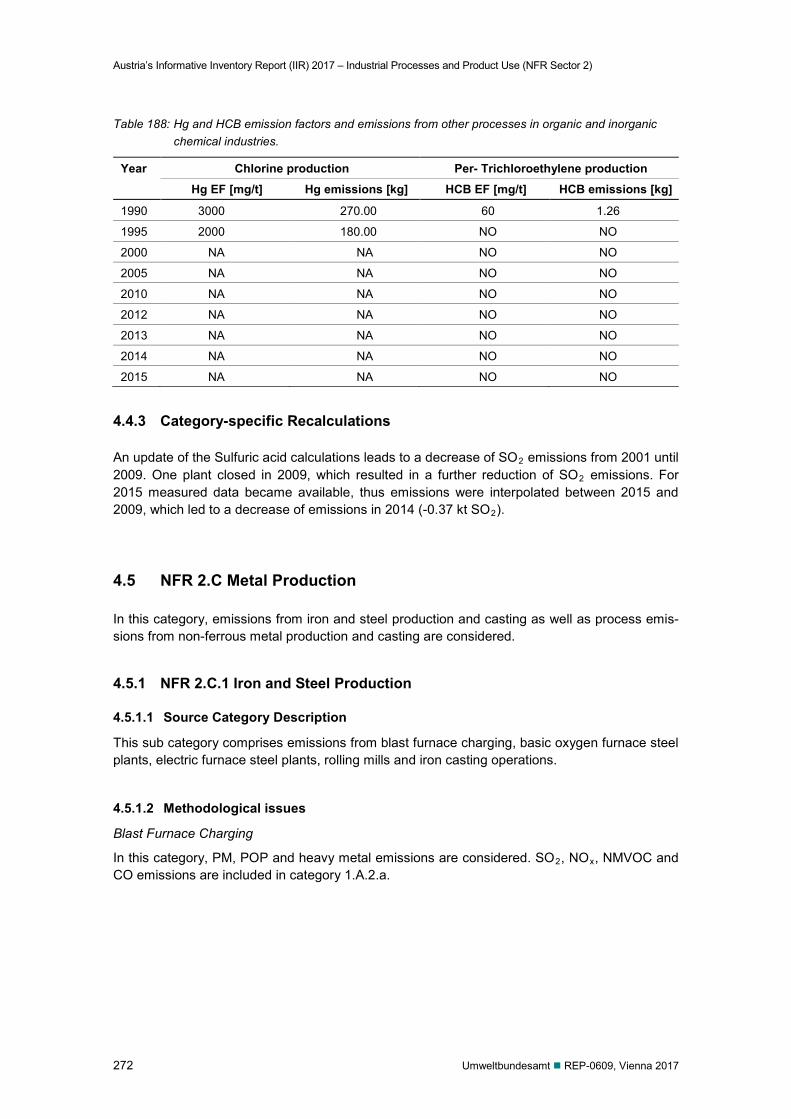
Austria’s Informative Inventory Report (IIR) 2017 – Industrial Processes and Product Use (NFR Sector 2)
272 Umweltbundesamt REP-0609, Vienna 2017
Table 188: Hg and HCB emission factors and emissions from other processes in organic and inorganic chemical industries.
Year Chlorine production Per- Trichloroethylene production Hg EF [mg/t] Hg emissions [kg] HCB EF [mg/t] HCB emissions [kg]
1990 3000 270.00 60 1.26
1995 2000 180.00 NO NO
2000 NA NA NO NO
2005 NA NA NO NO
2010 NA NA NO NO
2012 NA NA NO NO
2013 NA NA NO NO
2014 NA NA NO NO
2015 NA NA NO NO
4.4.3 Category-specific Recalculations
An update of the Sulfuric acid calculations leads to a decrease of SO2 emissions from 2001 until 2009. One plant closed in 2009, which resulted in a further reduction of SO2 emissions. For 2015 measured data became available, thus emissions were interpolated between 2015 and 2009, which led to a decrease of emissions in 2014 (-0.37 kt SO2).
4.5 NFR 2.C Metal Production
In this category, emissions from iron and steel production and casting as well as process emis-sions from non-ferrous metal production and casting are considered.
4.5.1 NFR 2.C.1 Iron and Steel Production
4.5.1.1 Source Category Description
This sub category comprises emissions from blast furnace charging, basic oxygen furnace steel plants, electric furnace steel plants, rolling mills and iron casting operations.
4.5.1.2 Methodological issues
Blast Furnace Charging
In this category, PM, POP and heavy metal emissions are considered. SO2, NOx, NMVOC and CO emissions are included in category 1.A.2.a.
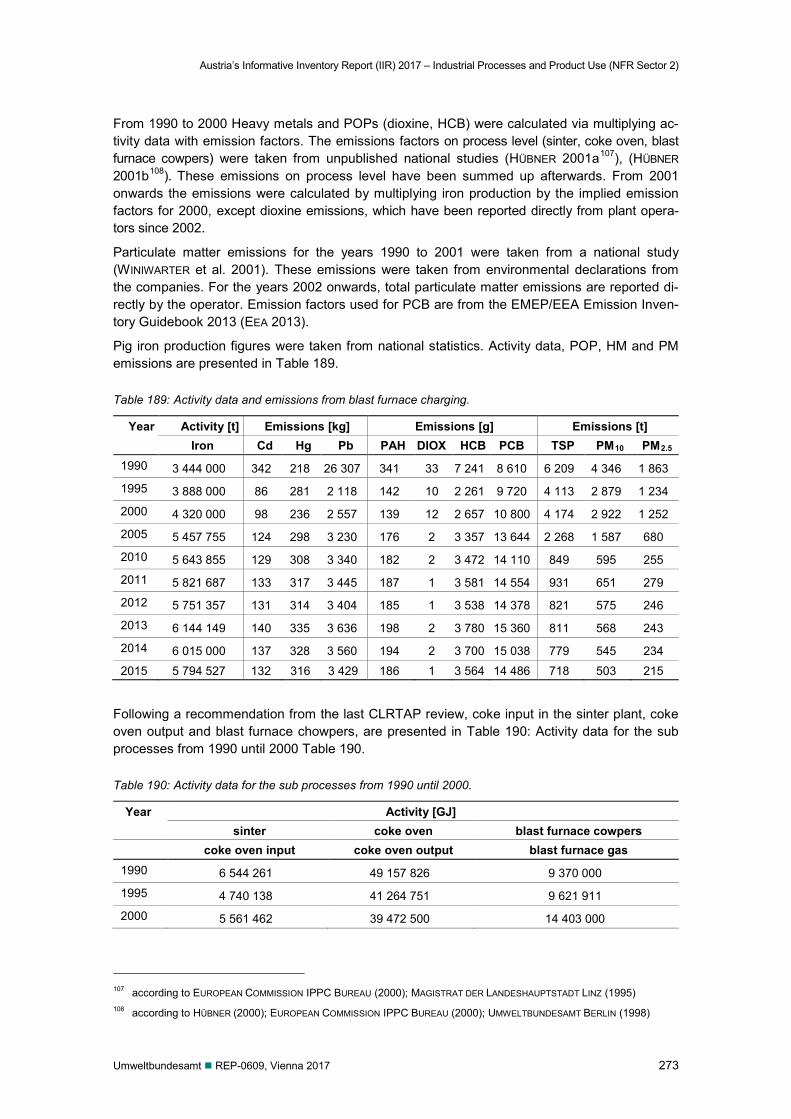
Austria’s Informative Inventory Report (IIR) 2017 – Industrial Processes and Product Use (NFR Sector 2)
Umweltbundesamt REP-0609, Vienna 2017 273
From 1990 to 2000 Heavy metals and POPs (dioxine, HCB) were calculated via multiplying ac-tivity data with emission factors. The emissions factors on process level (sinter, coke oven, blast furnace cowpers) were taken from unpublished national studies (HÜBNER 2001a107), (HÜBNER 2001b108). These emissions on process level have been summed up afterwards. From 2001 onwards the emissions were calculated by multiplying iron production by the implied emission factors for 2000, except dioxine emissions, which have been reported directly from plant opera-tors since 2002.
Particulate matter emissions for the years 1990 to 2001 were taken from a national study (WINIWARTER et al. 2001). These emissions were taken from environmental declarations from the companies. For the years 2002 onwards, total particulate matter emissions are reported di-rectly by the operator. Emission factors used for PCB are from the EMEP/EEA Emission Inven-tory Guidebook 2013 (EEA 2013).
Pig iron production figures were taken from national statistics. Activity data, POP, HM and PM emissions are presented in Table 189.
Table 189: Activity data and emissions from blast furnace charging.
Year Activity [t] Emissions [kg] Emissions [g] Emissions [t] Iron Cd Hg Pb PAH DIOX HCB PCB TSP PM10 PM2.5
1990 3 444 000 342 218 26 307 341 33 7 241 8 610 6 209 4 346 1 863
1995 3 888 000 86 281 2 118 142 10 2 261 9 720 4 113 2 879 1 234
2000 4 320 000 98 236 2 557 139 12 2 657 10 800 4 174 2 922 1 252
2005 5 457 755 124 298 3 230 176 2 3 357 13 644 2 268 1 587 680
2010 5 643 855 129 308 3 340 182 2 3 472 14 110 849 595 255
2011 5 821 687 133 317 3 445 187 1 3 581 14 554 931 651 279 2012 5 751 357 131 314 3 404 185 1 3 538 14 378 821 575 246
2013 6 144 149 140 335 3 636 198 2 3 780 15 360 811 568 243
2014 6 015 000 137 328 3 560 194 2 3 700 15 038 779 545 234
2015 5 794 527 132 316 3 429 186 1 3 564 14 486 718 503 215
Following a recommendation from the last CLRTAP review, coke input in the sinter plant, coke oven output and blast furnace chowpers, are presented in Table 190: Activity data for the sub processes from 1990 until 2000 Table 190.
Table 190: Activity data for the sub processes from 1990 until 2000.
Year Activity [GJ] sinter coke oven blast furnace cowpers
coke oven input coke oven output blast furnace gas 1990 6 544 261 49 157 826 9 370 000
1995 4 740 138 41 264 751 9 621 911
2000 5 561 462 39 472 500 14 403 000
107 according to EUROPEAN COMMISSION IPPC BUREAU (2000); MAGISTRAT DER LANDESHAUPTSTADT LINZ (1995) 108 according to HÜBNER (2000); EUROPEAN COMMISSION IPPC BUREAU (2000); UMWELTBUNDESAMT BERLIN (1998)
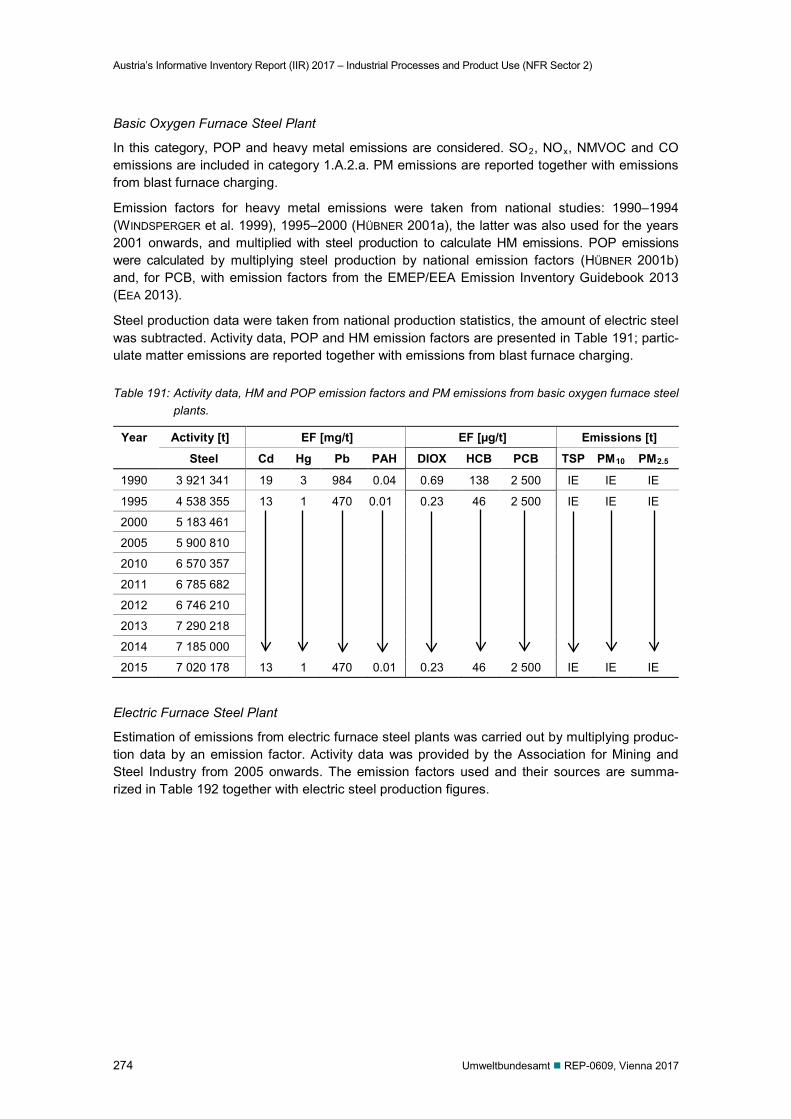
Austria’s Informative Inventory Report (IIR) 2017 – Industrial Processes and Product Use (NFR Sector 2)
274 Umweltbundesamt REP-0609, Vienna 2017
Basic Oxygen Furnace Steel Plant
In this category, POP and heavy metal emissions are considered. SO2, NOx, NMVOC and CO emissions are included in category 1.A.2.a. PM emissions are reported together with emissions from blast furnace charging.
Emission factors for heavy metal emissions were taken from national studies: 1990–1994 (WINDSPERGER et al. 1999), 1995–2000 (HÜBNER 2001a), the latter was also used for the years 2001 onwards, and multiplied with steel production to calculate HM emissions. POP emissions were calculated by multiplying steel production by national emission factors (HÜBNER 2001b) and, for PCB, with emission factors from the EMEP/EEA Emission Inventory Guidebook 2013 (EEA 2013).
Steel production data were taken from national production statistics, the amount of electric steel was subtracted. Activity data, POP and HM emission factors are presented in Table 191; partic-ulate matter emissions are reported together with emissions from blast furnace charging.
Table 191: Activity data, HM and POP emission factors and PM emissions from basic oxygen furnace steel plants.
Year Activity [t] EF [mg/t] EF [µg/t] Emissions [t]
Steel Cd Hg Pb PAH DIOX HCB PCB TSP PM10 PM2.5
1990 3 921 341 19 3 984 0.04 0.69 138 2 500 IE IE IE
1995 4 538 355 13 1 470 0.01 0.23 46 2 500 IE IE IE
2000 5 183 461
2005 5 900 810
2010 6 570 357
2011 6 785 682
2012 6 746 210
2013 7 290 218
2014 7 185 000
2015 7 020 178 13 1 470 0.01 0.23 46 2 500 IE IE IE
Electric Furnace Steel Plant
Estimation of emissions from electric furnace steel plants was carried out by multiplying produc-tion data by an emission factor. Activity data was provided by the Association for Mining and Steel Industry from 2005 onwards. The emission factors used and their sources are summa-rized in Table 192 together with electric steel production figures.
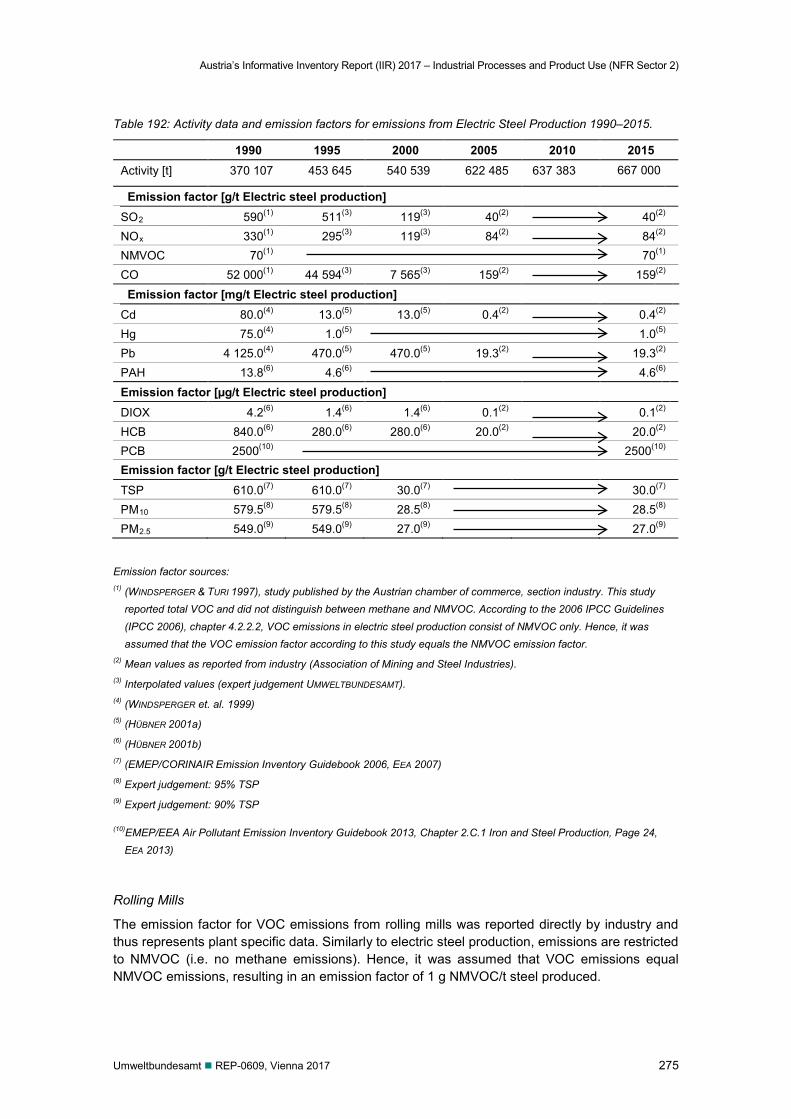
Austria’s Informative Inventory Report (IIR) 2017 – Industrial Processes and Product Use (NFR Sector 2)
Umweltbundesamt REP-0609, Vienna 2017 275
Table 192: Activity data and emission factors for emissions from Electric Steel Production 1990–2015.
1990 1995 2000 2005 2010 2015 Activity [t] 370 107 453 645 540 539 622 485 637 383 667 000
Emission factor [g/t Electric steel production] SO2 590(1) 511(3) 119(3) 40(2) 40(2) NOx 330(1) 295(3) 119(3) 84(2) 84(2) NMVOC 70(1) 70(1) CO 52 000(1) 44 594(3) 7 565(3) 159(2) 159(2)
Emission factor [mg/t Electric steel production] Cd 80.0(4) 13.0(5) 13.0(5) 0.4(2) 0.4(2) Hg 75.0(4) 1.0(5) 1.0(5) Pb 4 125.0(4) 470.0(5) 470.0(5) 19.3(2) 19.3(2) PAH 13.8(6) 4.6(6) 4.6(6) Emission factor [µg/t Electric steel production] DIOX 4.2(6) 1.4(6) 1.4(6) 0.1(2) 0.1(2) HCB 840.0(6) 280.0(6) 280.0(6) 20.0(2) 20.0(2) PCB 2500(10) 2500(10) Emission factor [g/t Electric steel production] TSP 610.0(7) 610.0(7) 30.0(7) 30.0(7) PM10 579.5(8) 579.5(8) 28.5(8) 28.5(8) PM2.5 549.0(9) 549.0(9) 27.0(9) 27.0(9)
Emission factor sources: (1) (WINDSPERGER & TURI 1997), study published by the Austrian chamber of commerce, section industry. This study
reported total VOC and did not distinguish between methane and NMVOC. According to the 2006 IPCC Guidelines (IPCC 2006), chapter 4.2.2.2, VOC emissions in electric steel production consist of NMVOC only. Hence, it was assumed that the VOC emission factor according to this study equals the NMVOC emission factor.
(2) Mean values as reported from industry (Association of Mining and Steel Industries). (3) Interpolated values (expert judgement UMWELTBUNDESAMT). (4) (WINDSPERGER et. al. 1999) (5) (HÜBNER 2001a) (6) (HÜBNER 2001b) (7) (EMEP/CORINAIR Emission Inventory Guidebook 2006, EEA 2007) (8) Expert judgement: 95% TSP (9) Expert judgement: 90% TSP
(10)EMEP/EEA Air Pollutant Emission Inventory Guidebook 2013, Chapter 2.C.1 Iron and Steel Production, Page 24, EEA 2013)
Rolling Mills
The emission factor for VOC emissions from rolling mills was reported directly by industry and thus represents plant specific data. Similarly to electric steel production, emissions are restricted to NMVOC (i.e. no methane emissions). Hence, it was assumed that VOC emissions equal NMVOC emissions, resulting in an emission factor of 1 g NMVOC/t steel produced.
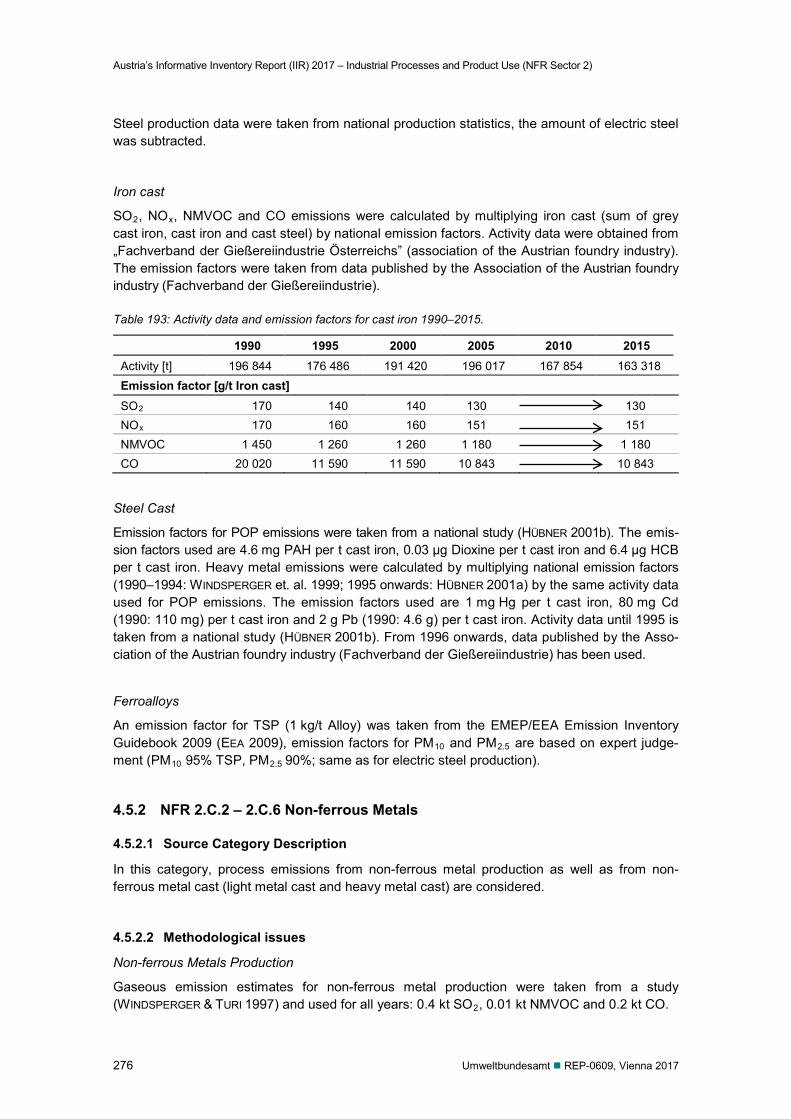
Austria’s Informative Inventory Report (IIR) 2017 – Industrial Processes and Product Use (NFR Sector 2)
276 Umweltbundesamt REP-0609, Vienna 2017
Steel production data were taken from national production statistics, the amount of electric steel was subtracted.
Iron cast
SO2, NOx, NMVOC and CO emissions were calculated by multiplying iron cast (sum of grey cast iron, cast iron and cast steel) by national emission factors. Activity data were obtained from „Fachverband der Gießereiindustrie Österreichs” (association of the Austrian foundry industry). The emission factors were taken from data published by the Association of the Austrian foundry industry (Fachverband der Gießereiindustrie).
Table 193: Activity data and emission factors for cast iron 1990–2015.
1990 1995 2000 2005 2010 2015 Activity [t] 196 844 176 486 191 420 196 017 167 854 163 318 Emission factor [g/t Iron cast] SO2 170 140 140 130 130 NOx 170 160 160 151 151 NMVOC 1 450 1 260 1 260 1 180 1 180 CO 20 020 11 590 11 590 10 843 10 843
Steel Cast
Emission factors for POP emissions were taken from a national study (HÜBNER 2001b). The emis-sion factors used are 4.6 mg PAH per t cast iron, 0.03 µg Dioxine per t cast iron and 6.4 µg HCB per t cast iron. Heavy metal emissions were calculated by multiplying national emission factors (1990–1994: WINDSPERGER et. al. 1999; 1995 onwards: HÜBNER 2001a) by the same activity data used for POP emissions. The emission factors used are 1 mg Hg per t cast iron, 80 mg Cd (1990: 110 mg) per t cast iron and 2 g Pb (1990: 4.6 g) per t cast iron. Activity data until 1995 is taken from a national study (HÜBNER 2001b). From 1996 onwards, data published by the Asso-ciation of the Austrian foundry industry (Fachverband der Gießereiindustrie) has been used.
Ferroalloys
An emission factor for TSP (1 kg/t Alloy) was taken from the EMEP/EEA Emission Inventory Guidebook 2009 (EEA 2009), emission factors for PM10 and PM2.5 are based on expert judge-ment (PM10 95% TSP, PM2.5 90%; same as for electric steel production).
4.5.2 NFR 2.C.2 – 2.C.6 Non-ferrous Metals
4.5.2.1 Source Category Description
In this category, process emissions from non-ferrous metal production as well as from non-ferrous metal cast (light metal cast and heavy metal cast) are considered.
4.5.2.2 Methodological issues
Non-ferrous Metals Production
Gaseous emission estimates for non-ferrous metal production were taken from a study (WINDSPERGER & TURI 1997) and used for all years: 0.4 kt SO2, 0.01 kt NMVOC and 0.2 kt CO.
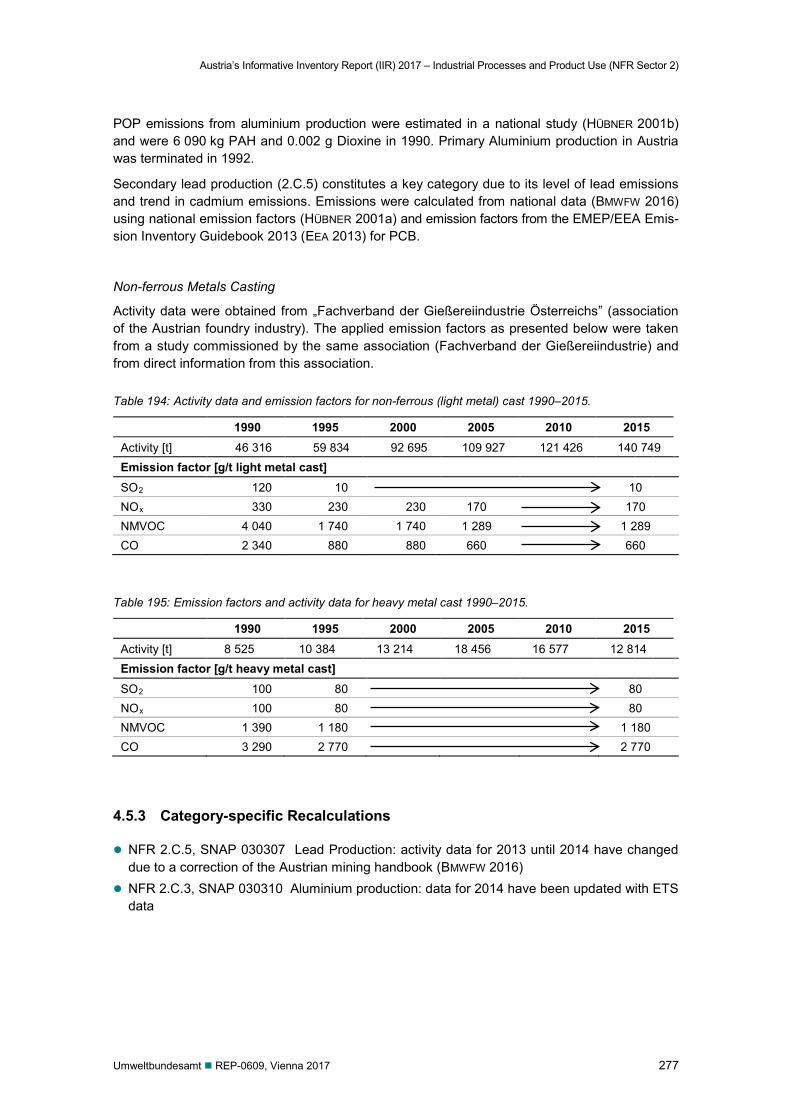
Austria’s Informative Inventory Report (IIR) 2017 – Industrial Processes and Product Use (NFR Sector 2)
Umweltbundesamt REP-0609, Vienna 2017 277
POP emissions from aluminium production were estimated in a national study (HÜBNER 2001b) and were 6 090 kg PAH and 0.002 g Dioxine in 1990. Primary Aluminium production in Austria was terminated in 1992.
Secondary lead production (2.C.5) constitutes a key category due to its level of lead emissions and trend in cadmium emissions. Emissions were calculated from national data (BMWFW 2016) using national emission factors (HÜBNER 2001a) and emission factors from the EMEP/EEA Emis-sion Inventory Guidebook 2013 (EEA 2013) for PCB.
Non-ferrous Metals Casting
Activity data were obtained from „Fachverband der Gießereiindustrie Österreichs” (association of the Austrian foundry industry). The applied emission factors as presented below were taken from a study commissioned by the same association (Fachverband der Gießereiindustrie) and from direct information from this association.
Table 194: Activity data and emission factors for non-ferrous (light metal) cast 1990–2015.
1990 1995 2000 2005 2010 2015 Activity [t] 46 316 59 834 92 695 109 927 121 426 140 749 Emission factor [g/t light metal cast] SO2 120 10 10 NOx 330 230 230 170 170 NMVOC 4 040 1 740 1 740 1 289 1 289 CO 2 340 880 880 660 660
Table 195: Emission factors and activity data for heavy metal cast 1990–2015.
1990 1995 2000 2005 2010 2015 Activity [t] 8 525 10 384 13 214 18 456 16 577 12 814 Emission factor [g/t heavy metal cast] SO2 100 80 80 NOx 100 80 80 NMVOC 1 390 1 180 1 180 CO 3 290 2 770 2 770
4.5.3 Category-specific Recalculations
NFR 2.C.5, SNAP 030307 Lead Production: activity data for 2013 until 2014 have changed due to a correction of the Austrian mining handbook (BMWFW 2016)
NFR 2.C.3, SNAP 030310 Aluminium production: data for 2014 have been updated with ETS data
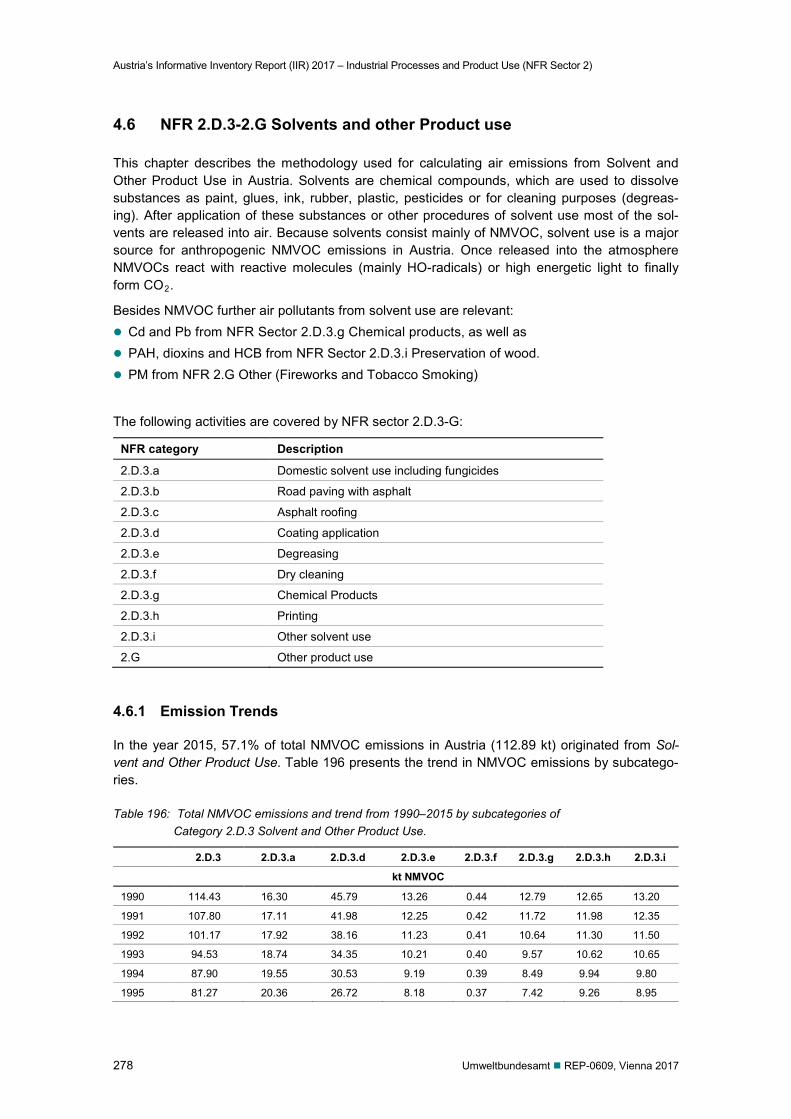
Austria’s Informative Inventory Report (IIR) 2017 – Industrial Processes and Product Use (NFR Sector 2)
278 Umweltbundesamt REP-0609, Vienna 2017
4.6 NFR 2.D.3-2.G Solvents and other Product use
This chapter describes the methodology used for calculating air emissions from Solvent and Other Product Use in Austria. Solvents are chemical compounds, which are used to dissolve substances as paint, glues, ink, rubber, plastic, pesticides or for cleaning purposes (degreas-ing). After application of these substances or other procedures of solvent use most of the sol-vents are released into air. Because solvents consist mainly of NMVOC, solvent use is a major source for anthropogenic NMVOC emissions in Austria. Once released into the atmosphere NMVOCs react with reactive molecules (mainly HO-radicals) or high energetic light to finally form CO2.
Besides NMVOC further air pollutants from solvent use are relevant: Cd and Pb from NFR Sector 2.D.3.g Chemical products, as well as PAH, dioxins and HCB from NFR Sector 2.D.3.i Preservation of wood. PM from NFR 2.G Other (Fireworks and Tobacco Smoking)
The following activities are covered by NFR sector 2.D.3-G:
NFR category Description
2.D.3.a Domestic solvent use including fungicides
2.D.3.b Road paving with asphalt
2.D.3.c Asphalt roofing
2.D.3.d Coating application
2.D.3.e Degreasing
2.D.3.f Dry cleaning
2.D.3.g Chemical Products
2.D.3.h Printing
2.D.3.i Other solvent use
2.G Other product use
4.6.1 Emission Trends
In the year 2015, 57.1% of total NMVOC emissions in Austria (112.89 kt) originated from Sol-vent and Other Product Use. Table 196 presents the trend in NMVOC emissions by subcatego-ries.
Table 196: Total NMVOC emissions and trend from 1990–2015 by subcategories of Category 2.D.3 Solvent and Other Product Use.
2.D.3 2.D.3.a 2.D.3.d 2.D.3.e 2.D.3.f 2.D.3.g 2.D.3.h 2.D.3.i
kt NMVOC
1990 114.43 16.30 45.79 13.26 0.44 12.79 12.65 13.20
1991 107.80 17.11 41.98 12.25 0.42 11.72 11.98 12.35
1992 101.17 17.92 38.16 11.23 0.41 10.64 11.30 11.50
1993 94.53 18.74 34.35 10.21 0.40 9.57 10.62 10.65
1994 87.90 19.55 30.53 9.19 0.39 8.49 9.94 9.80
1995 81.27 20.36 26.72 8.18 0.37 7.42 9.26 8.95
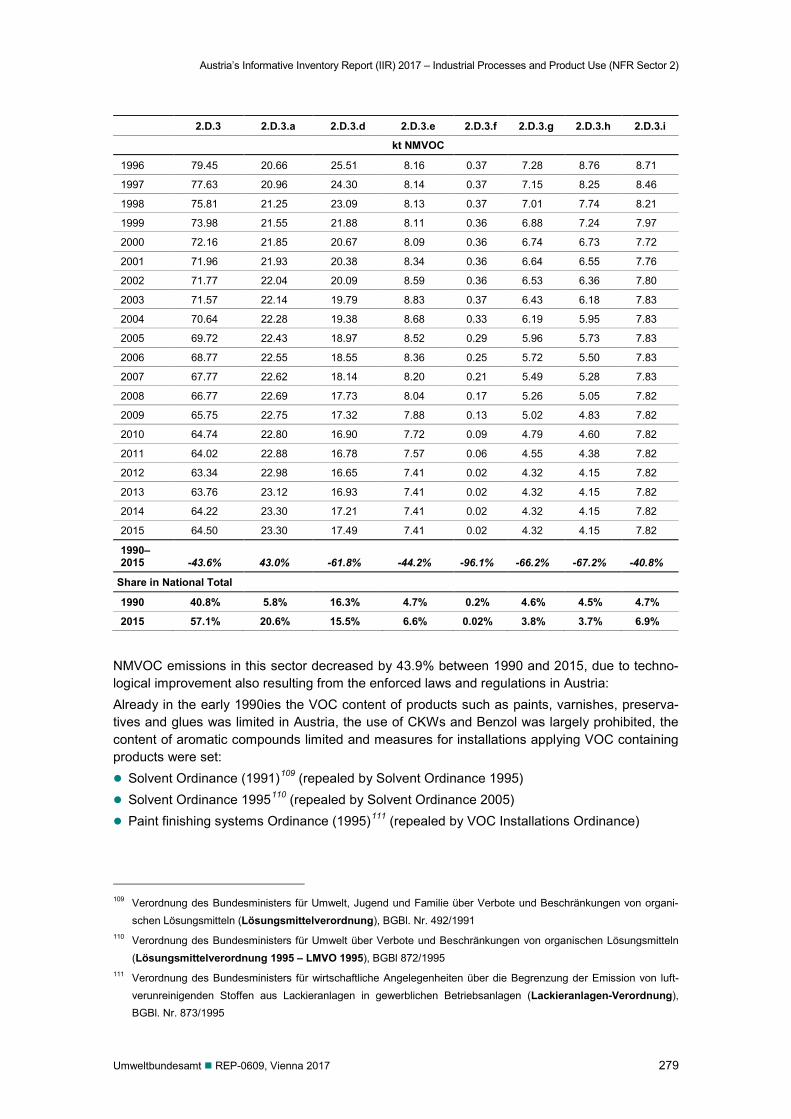
Austria’s Informative Inventory Report (IIR) 2017 – Industrial Processes and Product Use (NFR Sector 2)
Umweltbundesamt REP-0609, Vienna 2017 279
2.D.3 2.D.3.a 2.D.3.d 2.D.3.e 2.D.3.f 2.D.3.g 2.D.3.h 2.D.3.i
kt NMVOC
1996 79.45 20.66 25.51 8.16 0.37 7.28 8.76 8.71
1997 77.63 20.96 24.30 8.14 0.37 7.15 8.25 8.46
1998 75.81 21.25 23.09 8.13 0.37 7.01 7.74 8.21
1999 73.98 21.55 21.88 8.11 0.36 6.88 7.24 7.97
2000 72.16 21.85 20.67 8.09 0.36 6.74 6.73 7.72
2001 71.96 21.93 20.38 8.34 0.36 6.64 6.55 7.76
2002 71.77 22.04 20.09 8.59 0.36 6.53 6.36 7.80
2003 71.57 22.14 19.79 8.83 0.37 6.43 6.18 7.83
2004 70.64 22.28 19.38 8.68 0.33 6.19 5.95 7.83
2005 69.72 22.43 18.97 8.52 0.29 5.96 5.73 7.83
2006 68.77 22.55 18.55 8.36 0.25 5.72 5.50 7.83
2007 67.77 22.62 18.14 8.20 0.21 5.49 5.28 7.83
2008 66.77 22.69 17.73 8.04 0.17 5.26 5.05 7.82
2009 65.75 22.75 17.32 7.88 0.13 5.02 4.83 7.82
2010 64.74 22.80 16.90 7.72 0.09 4.79 4.60 7.82
2011 64.02 22.88 16.78 7.57 0.06 4.55 4.38 7.82
2012 63.34 22.98 16.65 7.41 0.02 4.32 4.15 7.82
2013 63.76 23.12 16.93 7.41 0.02 4.32 4.15 7.82
2014 64.22 23.30 17.21 7.41 0.02 4.32 4.15 7.82
2015 64.50 23.30 17.49 7.41 0.02 4.32 4.15 7.82
1990– 2015 -43.6% 43.0% -61.8% -44.2% -96.1% -66.2% -67.2% -40.8%
Share in National Total
1990 40.8% 5.8% 16.3% 4.7% 0.2% 4.6% 4.5% 4.7%
2015 57.1% 20.6% 15.5% 6.6% 0.02% 3.8% 3.7% 6.9%
NMVOC emissions in this sector decreased by 43.9% between 1990 and 2015, due to techno-logical improvement also resulting from the enforced laws and regulations in Austria: Already in the early 1990ies the VOC content of products such as paints, varnishes, preserva-tives and glues was limited in Austria, the use of CKWs and Benzol was largely prohibited, the content of aromatic compounds limited and measures for installations applying VOC containing products were set: Solvent Ordinance (1991)109 (repealed by Solvent Ordinance 1995) Solvent Ordinance 1995110 (repealed by Solvent Ordinance 2005) Paint finishing systems Ordinance (1995)111 (repealed by VOC Installations Ordinance)
109 Verordnung des Bundesministers für Umwelt, Jugend und Familie über Verbote und Beschränkungen von organi-
schen Lösungsmitteln (Lösungsmittelverordnung), BGBl. Nr. 492/1991 110 Verordnung des Bundesministers für Umwelt über Verbote und Beschränkungen von organischen Lösungsmitteln
(Lösungsmittelverordnung 1995 – LMVO 1995), BGBl 872/1995 111 Verordnung des Bundesministers für wirtschaftliche Angelegenheiten über die Begrenzung der Emission von luft-
verunreinigenden Stoffen aus Lackieranlagen in gewerblichen Betriebsanlagen (Lackieranlagen-Verordnung), BGBl. Nr. 873/1995
Austria’s Informative Inventory Report (IIR) 2017 – Industrial Processes and Product Use (NFR Sector 2)
280 Umweltbundesamt REP-0609, Vienna 2017
In the subsequent years the legislation was adapted to be in line with European legislation: VOC Installations Ordinance (2002)112, implementation of “Solvent Emission Directive”113 VOC Ordinance 2005114 – implementation of “Paints Directive”115 Amendment of VOC Ordinance (2005) 116 – implementation of “Industrial Emissions Directive”
2010/75/EC117
Measures implemented in emission intensive activity areas such as coating, painting and print-ing as well as in the pharmaceutical industry range from primary measures such as substitution of solvents, reduction of solvent contents and shift to lower or non-solvent emitting processes to secondary measures which basically is waste gas treatment.
4.6.2 NMVOC Emissions from Solvent and other product use (Category 2.D.3.a-i)
4.6.2.1 Methodological Issues
Emissions are estimated using a combination of Top-down data from national statistics which provide information on the overall solvent use in
Austria with bottom-up information from inquires in solvent consuming sectors
Top down data:
Data from national import/export and production statistics provide a balance for substances used as solvents and solvents contained in products:
Solvent Balance per Substancei = (Substancei Import – Substancei Export + Substancei Production)
From the Solvent Balance per Substance (or substance group, respectively) the non-solvent use of substances (i.e. where the substance is used as a reagent) is subtracted:
Solvent Use per Substancei = Solvent Balance per Substancei – Non Solvent Use of Sub-stancei
112 Verordnung des Bundesministers für Wirtschaft und Arbeit zur Umsetzung der Richtlinie 1999/13/EG über die Be-
grenzung der Emissionen bei der Verwendung organischer Lösungsmittel in gewerblichen Betriebsanlagen (VOC-Anlagen-Verordnung – VAV) BGBL II Nr. 301/2002
113 Council Directive 1999/13/EC of 11 March 1999 on the limitation of emissions of volatile organic compounds due to the use of organic solvents in certain activities and installations
114 Verordnung des Bundesministers für Land- und Forstwirtschaft, Umwelt und Wasserwirtschaft über die Begrenzung der Emissionen flüchtiger organischer Verbindungen durch Beschränkung des Inverkehrsetzens und der Verwen-dung organischer Lösungsmittel in bestimmten Farben und Lacken (Lösungsmittelverordnung 2005 – LMV 2005), BGBl. II Nr. 398/2005
115 Directive 2004/42/EC of the European Parliament and of the Council of 21 April 2004 on the limitation of emissions of volatile organic compounds due to the use of organic solvents in decorative paints and varnishes and vehicle re-finishing products and amending Directive 1999/13/EC
116 Verordnung des Bundesministers für Land- und Forstwirtschaft, Umwelt und Wasserwirtschaft, mit der die Lö-sungsmittelverordnung 2005 geändert wird (Änderung der Lösungsmittelverordnung 2005), BGBl. II Nr. 25/2013
117 Directive 2010/75/EU of the European Parliament and of the Council of 24 November 2010 on industrial emissions (integrated pollution prevention and control)
Austria’s Informative Inventory Report (IIR) 2017 – Industrial Processes and Product Use (NFR Sector 2)
Umweltbundesamt REP-0609, Vienna 2017 281
For products containing solvents, such as paints and glues, a balance of imports and exports is made, and the solvent content is estimated. The production of solvent containing products is not accounted for in this equation, as the amount of solvents used for their production are already accounted for in the above mentioned balance based on substance (groups):
Solvents in Productp = (Solvent-containing Productp Import – Solvent-containing Productp Export)* Solvent content of Productp
The overall solvent use in Austria is then calculated as the sum of the balances per substance and the amounts of solvents contained in products imported and exported:
Overall solvent use in Austria = ∑ i Solvent Use per Substancei + ∑p Solvents in Productp
QA/QC measures as explained under “recalculations” showed that variations from year to year reflect market effects rather than actual changes in overall consumption, this is why a regres-sion estimation of the top down data is used rather than annual data, which fluctuates. Where data on the overall consumption is available from the bottom up approach, it is used for those years; data for the years in between is interpolated. The reason behind this approach is that it became apparent that an analysis of the statistical data every year is far more difficult than ret-rospective analysis of a period of years. In an annual evaluation of statistical data, it is impossi-ble to differentiate between short term market or consumption effects and long term develop-ments (such as new non solvent application processes) that would make methodological changes or new further inquiries/data necessary.
Bottom up data
Extensive inquiries concerning solvent applications were made in several studies in the 90ies (WINDSPERGER et al. 2002a/2002b/2004/2008): for a reference year (2000) and several other years (1980, 1990, 1995, 2003) and the amount of solvents consumed in the different sub cate-gories was estimated.
In a first step an extensive survey on the use of solvents in the year 2000 was carried out in 1 300 Austrian companies (WINDSPERGER et al. 2002b). In this survey data about the solvent content of paints, cleaning agents etc. and on solvents used (both substances and substance categories) like acetone or alcohols were collected.
Furthermore information were gathered about; type of application of the solvents final application, cleaner, product preparation;
type of waste gas treatment open application, waste gas collection, waste gas treatment.
For every category of application and waste gas treatment an emission factor was estimated to calculate solvent emissions in the year 2000 (see Table 197).
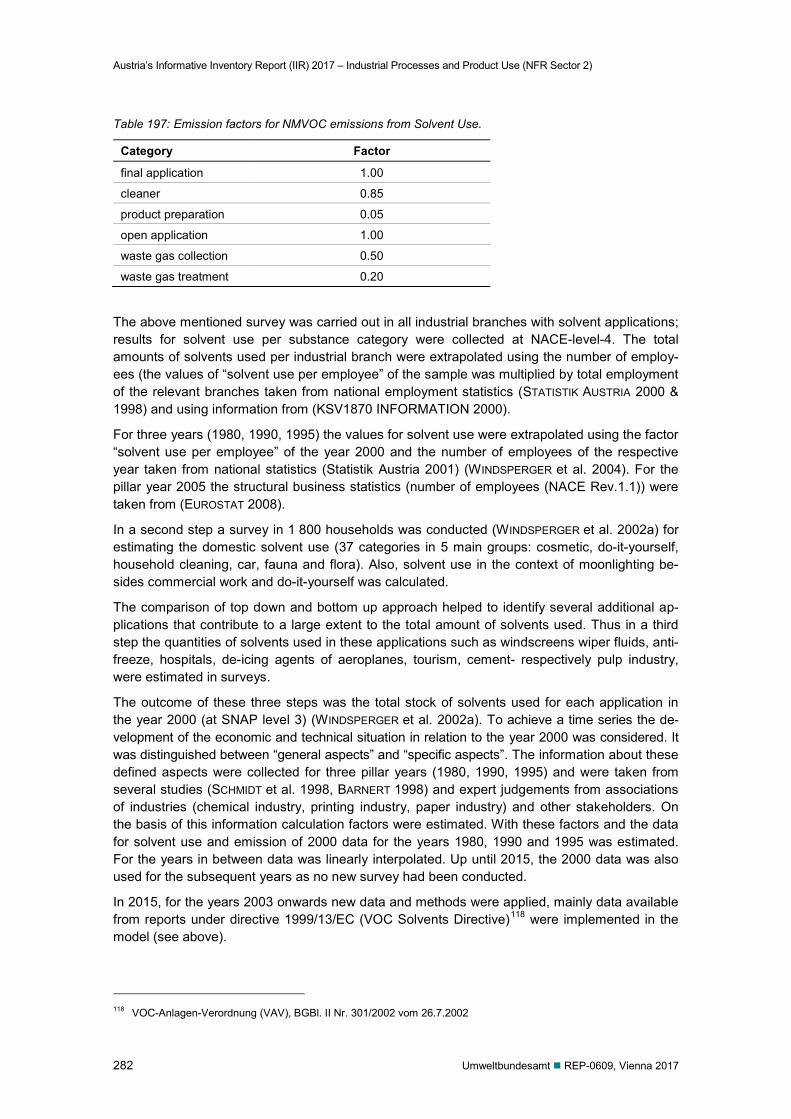
Austria’s Informative Inventory Report (IIR) 2017 – Industrial Processes and Product Use (NFR Sector 2)
282 Umweltbundesamt REP-0609, Vienna 2017
Table 197: Emission factors for NMVOC emissions from Solvent Use.
Category Factor
final application 1.00
cleaner 0.85
product preparation 0.05
open application 1.00
waste gas collection 0.50
waste gas treatment 0.20
The above mentioned survey was carried out in all industrial branches with solvent applications; results for solvent use per substance category were collected at NACE-level-4. The total amounts of solvents used per industrial branch were extrapolated using the number of employ-ees (the values of “solvent use per employee” of the sample was multiplied by total employment of the relevant branches taken from national employment statistics (STATISTIK AUSTRIA 2000 & 1998) and using information from (KSV1870 INFORMATION 2000).
For three years (1980, 1990, 1995) the values for solvent use were extrapolated using the factor “solvent use per employee” of the year 2000 and the number of employees of the respective year taken from national statistics (Statistik Austria 2001) (WINDSPERGER et al. 2004). For the pillar year 2005 the structural business statistics (number of employees (NACE Rev.1.1)) were taken from (EUROSTAT 2008).
In a second step a survey in 1 800 households was conducted (WINDSPERGER et al. 2002a) for estimating the domestic solvent use (37 categories in 5 main groups: cosmetic, do-it-yourself, household cleaning, car, fauna and flora). Also, solvent use in the context of moonlighting be-sides commercial work and do-it-yourself was calculated.
The comparison of top down and bottom up approach helped to identify several additional ap-plications that contribute to a large extent to the total amount of solvents used. Thus in a third step the quantities of solvents used in these applications such as windscreens wiper fluids, anti-freeze, hospitals, de-icing agents of aeroplanes, tourism, cement- respectively pulp industry, were estimated in surveys.
The outcome of these three steps was the total stock of solvents used for each application in the year 2000 (at SNAP level 3) (WINDSPERGER et al. 2002a). To achieve a time series the de-velopment of the economic and technical situation in relation to the year 2000 was considered. It was distinguished between “general aspects” and “specific aspects”. The information about these defined aspects were collected for three pillar years (1980, 1990, 1995) and were taken from several studies (SCHMIDT et al. 1998, BARNERT 1998) and expert judgements from associations of industries (chemical industry, printing industry, paper industry) and other stakeholders. On the basis of this information calculation factors were estimated. With these factors and the data for solvent use and emission of 2000 data for the years 1980, 1990 and 1995 was estimated. For the years in between data was linearly interpolated. Up until 2015, the 2000 data was also used for the subsequent years as no new survey had been conducted.
In 2015, for the years 2003 onwards new data and methods were applied, mainly data available from reports under directive 1999/13/EC (VOC Solvents Directive)118 were implemented in the model (see above).
118 VOC-Anlagen-Verordnung (VAV), BGBl. II Nr. 301/2002 vom 26.7.2002
Austria’s Informative Inventory Report (IIR) 2017 – Industrial Processes and Product Use (NFR Sector 2)
Umweltbundesamt REP-0609, Vienna 2017 283
Statistical data used for estimating the overall solvent use in Austria was re-evaluated for the years 2000 onwards: import-export/production statistics were screened for items that weren’t considered, but should have been considered, as well as for items that used to be considered, but might have included non-solvent uses. In addition, fluctuations in the timeline (i.e. significant differences between years) were checked and evaluated. Several changes were made resulting from this re-evaluation of the top-down data, the main changes were: non-methylated (un-denatured) ethanol is not considered any longer (as this normally is used
for human consumption and because this category also included bioethanol used as fuel which is denatured after export; the category showed a strongly negative balance in the last years)
non-solvent use of methanol in biodiesel production is now considered, thus subtracted from overall consumption.
Both changes (cumulated with other minor methodological changes as explained above) result-ed in a decrease of the top down value for overall solvent consumption with the highest effect in the mid 00 years.
As the overall top down data shows fluctuations that reflect market effects rather than actual changes in overall consumption, interpolated top down data is now used, also for previous years (see further explanations under methodological issues). For the reporting year 2015, data based on the assumptions of growth of the sector was applied, or constant emissions assumed. An in-depth re-evaluation of data obtained from reports under the VOC solvents directive is cur-rently being performed, as well as further re-evaluations of the top down approach.
Top down / bottom up combination Data from the top down/bottom up approach (for the reference year 2000) were compared, and sub sectors further investigated, until the data matched. This was also done for the recalculation for the years after 2000. Data was then split into sub sectors (based on those investigations) and this data also used for the extra- and interpolation of data for those years, for which no data on the development of the market was available. Finally, emission factors mainly from the in-quiries of the bottom up approach were applied, resulting in final emissions data per sub cate-gory.
For the years 2003 onwards the following improvements were made: new data collected in the course of the VOC installations ordinance mentioned above was
used to update emissions data for 2012: Data available from reports under directive 1999/13/EC (VOC Solvents Directive)119 was col-lected, and the allocation of the respective companies to different subsectors of the directive checked, and compare to those of the reporting requirements. It has to be noted that the re-porting requirement under this directive (ordinance) comprises only emissions data, that’s why the full implementation into the model requires further investigations concerning emis-sion factors. Where no complete coverage was given, employment data was used to extrapo-late emissions for total sub category emission in Austria. For those categories where the number of companies reporting was either too low or where the classification was unclear, trends of the VOC emissions reports were used. This concerns car repairing and mainte-nance, winding wire coating, surface cleaning (incl. electronics industry), and natural rubber.
Domestic use: extrapolation using population data Paints: extrapolation using paint consumption
119 VOC-Anlagen-Verordnung (VAV), BGBl. II Nr. 301/2002 vom 26.7.2002
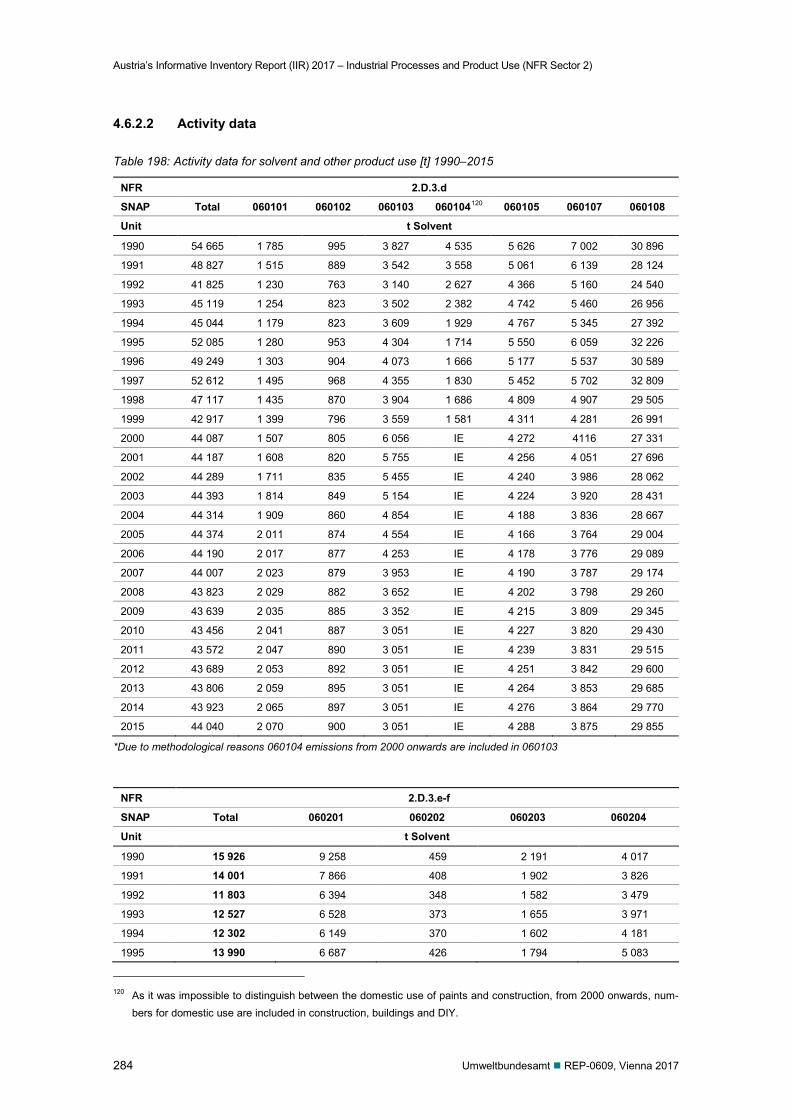
Austria’s Informative Inventory Report (IIR) 2017 – Industrial Processes and Product Use (NFR Sector 2)
284 Umweltbundesamt REP-0609, Vienna 2017
4.6.2.2 Activity data
Table 198: Activity data for solvent and other product use [t] 1990–2015
NFR 2.D.3.d
SNAP Total 060101 060102 060103 060104120 060105 060107 060108
Unit t Solvent
1990 54 665 1 785 995 3 827 4 535 5 626 7 002 30 896
1991 48 827 1 515 889 3 542 3 558 5 061 6 139 28 124
1992 41 825 1 230 763 3 140 2 627 4 366 5 160 24 540
1993 45 119 1 254 823 3 502 2 382 4 742 5 460 26 956
1994 45 044 1 179 823 3 609 1 929 4 767 5 345 27 392
1995 52 085 1 280 953 4 304 1 714 5 550 6 059 32 226
1996 49 249 1 303 904 4 073 1 666 5 177 5 537 30 589
1997 52 612 1 495 968 4 355 1 830 5 452 5 702 32 809
1998 47 117 1 435 870 3 904 1 686 4 809 4 907 29 505
1999 42 917 1 399 796 3 559 1 581 4 311 4 281 26 991
2000 44 087 1 507 805 6 056 IE 4 272 4116 27 331
2001 44 187 1 608 820 5 755 IE 4 256 4 051 27 696
2002 44 289 1 711 835 5 455 IE 4 240 3 986 28 062
2003 44 393 1 814 849 5 154 IE 4 224 3 920 28 431
2004 44 314 1 909 860 4 854 IE 4 188 3 836 28 667
2005 44 374 2 011 874 4 554 IE 4 166 3 764 29 004
2006 44 190 2 017 877 4 253 IE 4 178 3 776 29 089
2007 44 007 2 023 879 3 953 IE 4 190 3 787 29 174
2008 43 823 2 029 882 3 652 IE 4 202 3 798 29 260
2009 43 639 2 035 885 3 352 IE 4 215 3 809 29 345
2010 43 456 2 041 887 3 051 IE 4 227 3 820 29 430
2011 43 572 2 047 890 3 051 IE 4 239 3 831 29 515
2012 43 689 2 053 892 3 051 IE 4 251 3 842 29 600
2013 43 806 2 059 895 3 051 IE 4 264 3 853 29 685
2014 43 923 2 065 897 3 051 IE 4 276 3 864 29 770
2015 44 040 2 070 900 3 051 IE 4 288 3 875 29 855
*Due to methodological reasons 060104 emissions from 2000 onwards are included in 060103
NFR 2.D.3.e-f
SNAP Total 060201 060202 060203 060204
Unit t Solvent
1990 15 926 9 258 459 2 191 4 017
1991 14 001 7 866 408 1 902 3 826
1992 11 803 6 394 348 1 582 3 479
1993 12 527 6 528 373 1 655 3 971
1994 12 302 6 149 370 1 602 4 181
1995 13 990 6 687 426 1 794 5 083
120 As it was impossible to distinguish between the domestic use of paints and construction, from 2000 onwards, num-
bers for domestic use are included in construction, buildings and DIY.
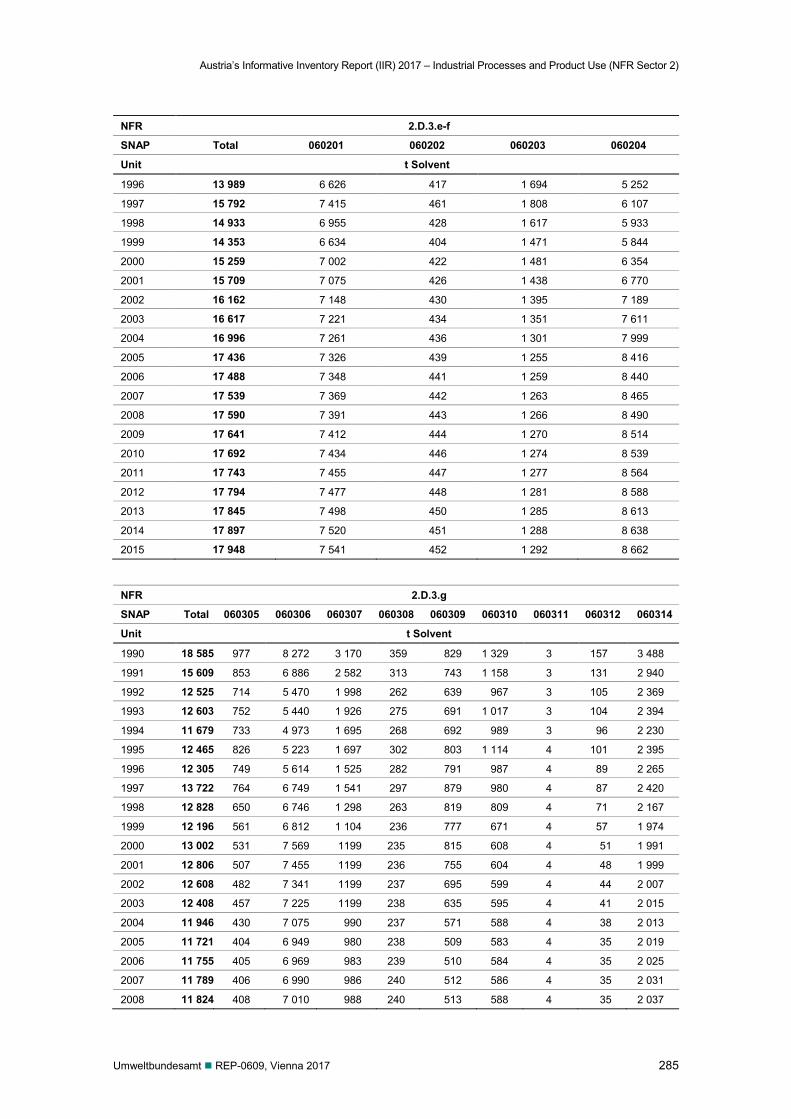
Austria’s Informative Inventory Report (IIR) 2017 – Industrial Processes and Product Use (NFR Sector 2)
Umweltbundesamt REP-0609, Vienna 2017 285
NFR 2.D.3.e-f
SNAP Total 060201 060202 060203 060204
Unit t Solvent
1996 13 989 6 626 417 1 694 5 252
1997 15 792 7 415 461 1 808 6 107
1998 14 933 6 955 428 1 617 5 933
1999 14 353 6 634 404 1 471 5 844
2000 15 259 7 002 422 1 481 6 354
2001 15 709 7 075 426 1 438 6 770
2002 16 162 7 148 430 1 395 7 189
2003 16 617 7 221 434 1 351 7 611
2004 16 996 7 261 436 1 301 7 999
2005 17 436 7 326 439 1 255 8 416
2006 17 488 7 348 441 1 259 8 440
2007 17 539 7 369 442 1 263 8 465
2008 17 590 7 391 443 1 266 8 490
2009 17 641 7 412 444 1 270 8 514
2010 17 692 7 434 446 1 274 8 539
2011 17 743 7 455 447 1 277 8 564
2012 17 794 7 477 448 1 281 8 588
2013 17 845 7 498 450 1 285 8 613
2014 17 897 7 520 451 1 288 8 638
2015 17 948 7 541 452 1 292 8 662
NFR 2.D.3.g
SNAP Total 060305 060306 060307 060308 060309 060310 060311 060312 060314
Unit t Solvent
1990 18 585 977 8 272 3 170 359 829 1 329 3 157 3 488
1991 15 609 853 6 886 2 582 313 743 1 158 3 131 2 940
1992 12 525 714 5 470 1 998 262 639 967 3 105 2 369
1993 12 603 752 5 440 1 926 275 691 1 017 3 104 2 394
1994 11 679 733 4 973 1 695 268 692 989 3 96 2 230
1995 12 465 826 5 223 1 697 302 803 1 114 4 101 2 395
1996 12 305 749 5 614 1 525 282 791 987 4 89 2 265
1997 13 722 764 6 749 1 541 297 879 980 4 87 2 420
1998 12 828 650 6 746 1 298 263 819 809 4 71 2 167
1999 12 196 561 6 812 1 104 236 777 671 4 57 1 974
2000 13 002 531 7 569 1199 235 815 608 4 51 1 991
2001 12 806 507 7 455 1199 236 755 604 4 48 1 999
2002 12 608 482 7 341 1199 237 695 599 4 44 2 007
2003 12 408 457 7 225 1199 238 635 595 4 41 2 015
2004 11 946 430 7 075 990 237 571 588 4 38 2 013
2005 11 721 404 6 949 980 238 509 583 4 35 2 019
2006 11 755 405 6 969 983 239 510 584 4 35 2 025
2007 11 789 406 6 990 986 240 512 586 4 35 2 031
2008 11 824 408 7 010 988 240 513 588 4 35 2 037
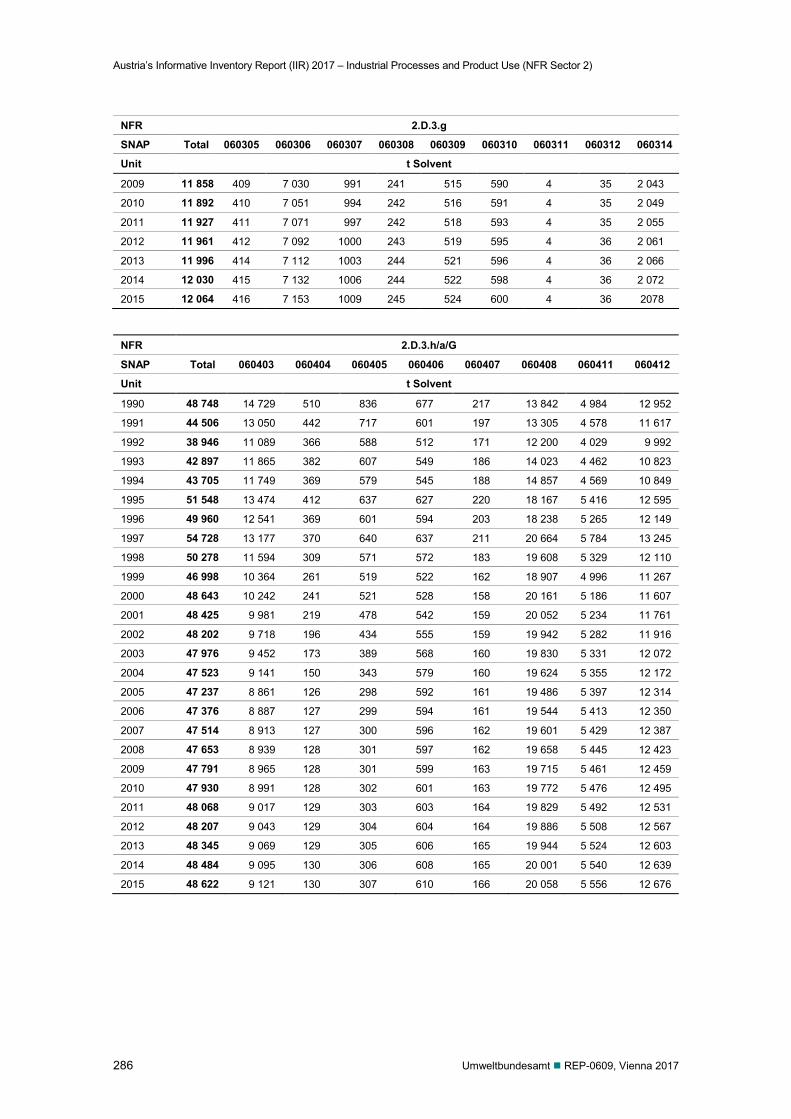
Austria’s Informative Inventory Report (IIR) 2017 – Industrial Processes and Product Use (NFR Sector 2)
286 Umweltbundesamt REP-0609, Vienna 2017
NFR 2.D.3.g
SNAP Total 060305 060306 060307 060308 060309 060310 060311 060312 060314
Unit t Solvent
2009 11 858 409 7 030 991 241 515 590 4 35 2 043
2010 11 892 410 7 051 994 242 516 591 4 35 2 049
2011 11 927 411 7 071 997 242 518 593 4 35 2 055
2012 11 961 412 7 092 1000 243 519 595 4 36 2 061
2013 11 996 414 7 112 1003 244 521 596 4 36 2 066
2014 12 030 415 7 132 1006 244 522 598 4 36 2 072
2015 12 064 416 7 153 1009 245 524 600 4 36 2078
NFR 2.D.3.h/a/G
SNAP Total 060403 060404 060405 060406 060407 060408 060411 060412
Unit t Solvent
1990 48 748 14 729 510 836 677 217 13 842 4 984 12 952
1991 44 506 13 050 442 717 601 197 13 305 4 578 11 617
1992 38 946 11 089 366 588 512 171 12 200 4 029 9 992
1993 42 897 11 865 382 607 549 186 14 023 4 462 10 823
1994 43 705 11 749 369 579 545 188 14 857 4 569 10 849
1995 51 548 13 474 412 637 627 220 18 167 5 416 12 595
1996 49 960 12 541 369 601 594 203 18 238 5 265 12 149
1997 54 728 13 177 370 640 637 211 20 664 5 784 13 245
1998 50 278 11 594 309 571 572 183 19 608 5 329 12 110
1999 46 998 10 364 261 519 522 162 18 907 4 996 11 267
2000 48 643 10 242 241 521 528 158 20 161 5 186 11 607
2001 48 425 9 981 219 478 542 159 20 052 5 234 11 761
2002 48 202 9 718 196 434 555 159 19 942 5 282 11 916
2003 47 976 9 452 173 389 568 160 19 830 5 331 12 072
2004 47 523 9 141 150 343 579 160 19 624 5 355 12 172
2005 47 237 8 861 126 298 592 161 19 486 5 397 12 314
2006 47 376 8 887 127 299 594 161 19 544 5 413 12 350
2007 47 514 8 913 127 300 596 162 19 601 5 429 12 387
2008 47 653 8 939 128 301 597 162 19 658 5 445 12 423
2009 47 791 8 965 128 301 599 163 19 715 5 461 12 459
2010 47 930 8 991 128 302 601 163 19 772 5 476 12 495
2011 48 068 9 017 129 303 603 164 19 829 5 492 12 531
2012 48 207 9 043 129 304 604 164 19 886 5 508 12 567
2013 48 345 9 069 129 305 606 165 19 944 5 524 12 603
2014 48 484 9 095 130 306 608 165 20 001 5 540 12 639
2015 48 622 9 121 130 307 610 166 20 058 5 556 12 676
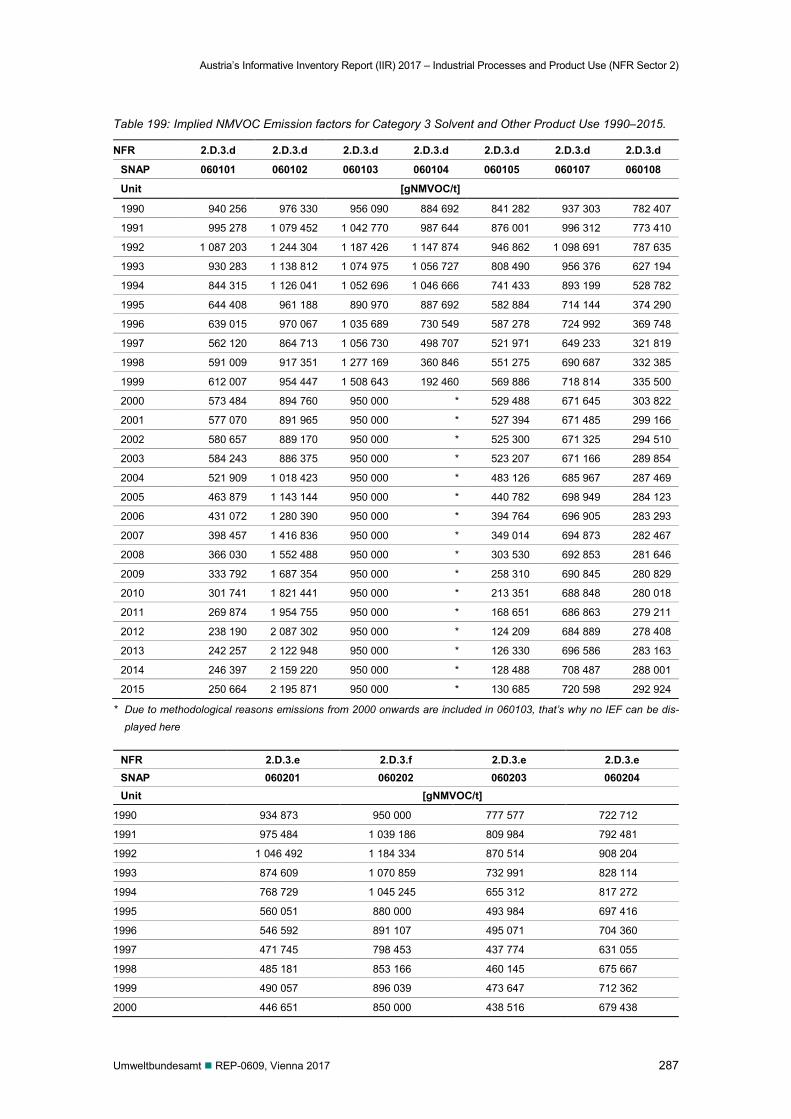
Austria’s Informative Inventory Report (IIR) 2017 – Industrial Processes and Product Use (NFR Sector 2)
Umweltbundesamt REP-0609, Vienna 2017 287
Table 199: Implied NMVOC Emission factors for Category 3 Solvent and Other Product Use 1990–2015.
NFR 2.D.3.d 2.D.3.d 2.D.3.d 2.D.3.d 2.D.3.d 2.D.3.d 2.D.3.d
SNAP 060101 060102 060103 060104 060105 060107 060108
Unit [gNMVOC/t]
1990 940 256 976 330 956 090 884 692 841 282 937 303 782 407
1991 995 278 1 079 452 1 042 770 987 644 876 001 996 312 773 410
1992 1 087 203 1 244 304 1 187 426 1 147 874 946 862 1 098 691 787 635
1993 930 283 1 138 812 1 074 975 1 056 727 808 490 956 376 627 194
1994 844 315 1 126 041 1 052 696 1 046 666 741 433 893 199 528 782
1995 644 408 961 188 890 970 887 692 582 884 714 144 374 290
1996 639 015 970 067 1 035 689 730 549 587 278 724 992 369 748
1997 562 120 864 713 1 056 730 498 707 521 971 649 233 321 819
1998 591 009 917 351 1 277 169 360 846 551 275 690 687 332 385
1999 612 007 954 447 1 508 643 192 460 569 886 718 814 335 500
2000 573 484 894 760 950 000 * 529 488 671 645 303 822
2001 577 070 891 965 950 000 * 527 394 671 485 299 166
2002 580 657 889 170 950 000 * 525 300 671 325 294 510
2003 584 243 886 375 950 000 * 523 207 671 166 289 854
2004 521 909 1 018 423 950 000 * 483 126 685 967 287 469
2005 463 879 1 143 144 950 000 * 440 782 698 949 284 123
2006 431 072 1 280 390 950 000 * 394 764 696 905 283 293
2007 398 457 1 416 836 950 000 * 349 014 694 873 282 467
2008 366 030 1 552 488 950 000 * 303 530 692 853 281 646
2009 333 792 1 687 354 950 000 * 258 310 690 845 280 829
2010 301 741 1 821 441 950 000 * 213 351 688 848 280 018
2011 269 874 1 954 755 950 000 * 168 651 686 863 279 211
2012 238 190 2 087 302 950 000 * 124 209 684 889 278 408
2013 242 257 2 122 948 950 000 * 126 330 696 586 283 163
2014 246 397 2 159 220 950 000 * 128 488 708 487 288 001
2015 250 664 2 195 871 950 000 * 130 685 720 598 292 924
* Due to methodological reasons emissions from 2000 onwards are included in 060103, that’s why no IEF can be dis-played here
NFR 2.D.3.e 2.D.3.f 2.D.3.e 2.D.3.e SNAP 060201 060202 060203 060204 Unit [gNMVOC/t]
1990 934 873 950 000 777 577 722 712
1991 975 484 1 039 186 809 984 792 481
1992 1 046 492 1 184 334 870 514 908 204
1993 874 609 1 070 859 732 991 828 114
1994 768 729 1 045 245 655 312 817 272
1995 560 051 880 000 493 984 697 416
1996 546 592 891 107 495 071 704 360
1997 471 745 798 453 437 774 631 055
1998 485 181 853 166 460 145 675 667
1999 490 057 896 039 473 647 712 362
2000 446 651 850 000 438 516 679 438
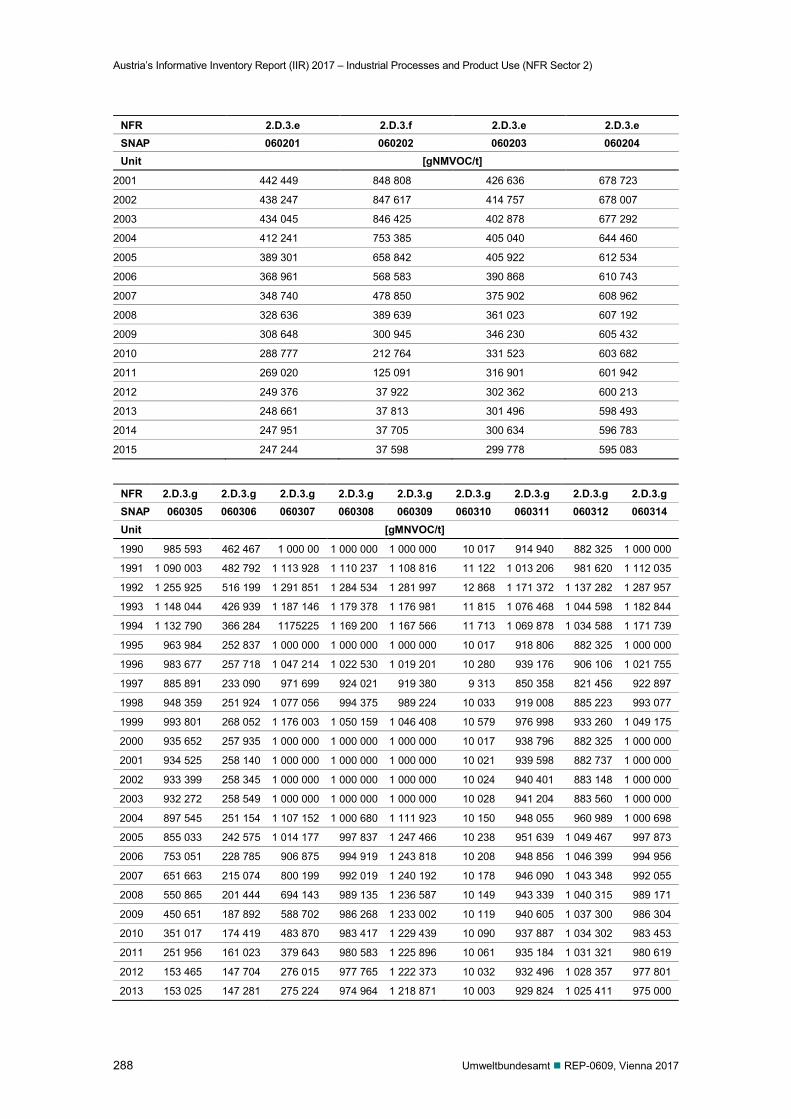
Austria’s Informative Inventory Report (IIR) 2017 – Industrial Processes and Product Use (NFR Sector 2)
288 Umweltbundesamt REP-0609, Vienna 2017
NFR 2.D.3.e 2.D.3.f 2.D.3.e 2.D.3.e SNAP 060201 060202 060203 060204 Unit [gNMVOC/t]
2001 442 449 848 808 426 636 678 723
2002 438 247 847 617 414 757 678 007
2003 434 045 846 425 402 878 677 292
2004 412 241 753 385 405 040 644 460
2005 389 301 658 842 405 922 612 534
2006 368 961 568 583 390 868 610 743
2007 348 740 478 850 375 902 608 962
2008 328 636 389 639 361 023 607 192
2009 308 648 300 945 346 230 605 432
2010 288 777 212 764 331 523 603 682
2011 269 020 125 091 316 901 601 942
2012 249 376 37 922 302 362 600 213
2013 248 661 37 813 301 496 598 493
2014 247 951 37 705 300 634 596 783
2015 247 244 37 598 299 778 595 083
NFR 2.D.3.g 2.D.3.g 2.D.3.g 2.D.3.g 2.D.3.g 2.D.3.g 2.D.3.g 2.D.3.g 2.D.3.g SNAP 060305 060306 060307 060308 060309 060310 060311 060312 060314 Unit [gMNVOC/t]
1990 985 593 462 467 1 000 00 1 000 000 1 000 000 10 017 914 940 882 325 1 000 000
1991 1 090 003 482 792 1 113 928 1 110 237 1 108 816 11 122 1 013 206 981 620 1 112 035
1992 1 255 925 516 199 1 291 851 1 284 534 1 281 997 12 868 1 171 372 1 137 282 1 287 957
1993 1 148 044 426 939 1 187 146 1 179 378 1 176 981 11 815 1 076 468 1 044 598 1 182 844
1994 1 132 790 366 284 1175225 1 169 200 1 167 566 11 713 1 069 878 1 034 588 1 171 739
1995 963 984 252 837 1 000 000 1 000 000 1 000 000 10 017 918 806 882 325 1 000 000
1996 983 677 257 718 1 047 214 1 022 530 1 019 201 10 280 939 176 906 106 1 021 755
1997 885 891 233 090 971 699 924 021 919 380 9 313 850 358 821 456 922 897
1998 948 359 251 924 1 077 056 994 375 989 224 10 033 919 008 885 223 993 077
1999 993 801 268 052 1 176 003 1 050 159 1 046 408 10 579 976 998 933 260 1 049 175
2000 935 652 257 935 1 000 000 1 000 000 1 000 000 10 017 938 796 882 325 1 000 000
2001 934 525 258 140 1 000 000 1 000 000 1 000 000 10 021 939 598 882 737 1 000 000
2002 933 399 258 345 1 000 000 1 000 000 1 000 000 10 024 940 401 883 148 1 000 000
2003 932 272 258 549 1 000 000 1 000 000 1 000 000 10 028 941 204 883 560 1 000 000
2004 897 545 251 154 1 107 152 1 000 680 1 111 923 10 150 948 055 960 989 1 000 698
2005 855 033 242 575 1 014 177 997 837 1 247 466 10 238 951 639 1 049 467 997 873
2006 753 051 228 785 906 875 994 919 1 243 818 10 208 948 856 1 046 399 994 956
2007 651 663 215 074 800 199 992 019 1 240 192 10 178 946 090 1 043 348 992 055
2008 550 865 201 444 694 143 989 135 1 236 587 10 149 943 339 1 040 315 989 171
2009 450 651 187 892 588 702 986 268 1 233 002 10 119 940 605 1 037 300 986 304
2010 351 017 174 419 483 870 983 417 1 229 439 10 090 937 887 1 034 302 983 453
2011 251 956 161 023 379 643 980 583 1 225 896 10 061 935 184 1 031 321 980 619
2012 153 465 147 704 276 015 977 765 1 222 373 10 032 932 496 1 028 357 977 801
2013 153 025 147 281 275 224 974 964 1 218 871 10 003 929 824 1 025 411 975 000
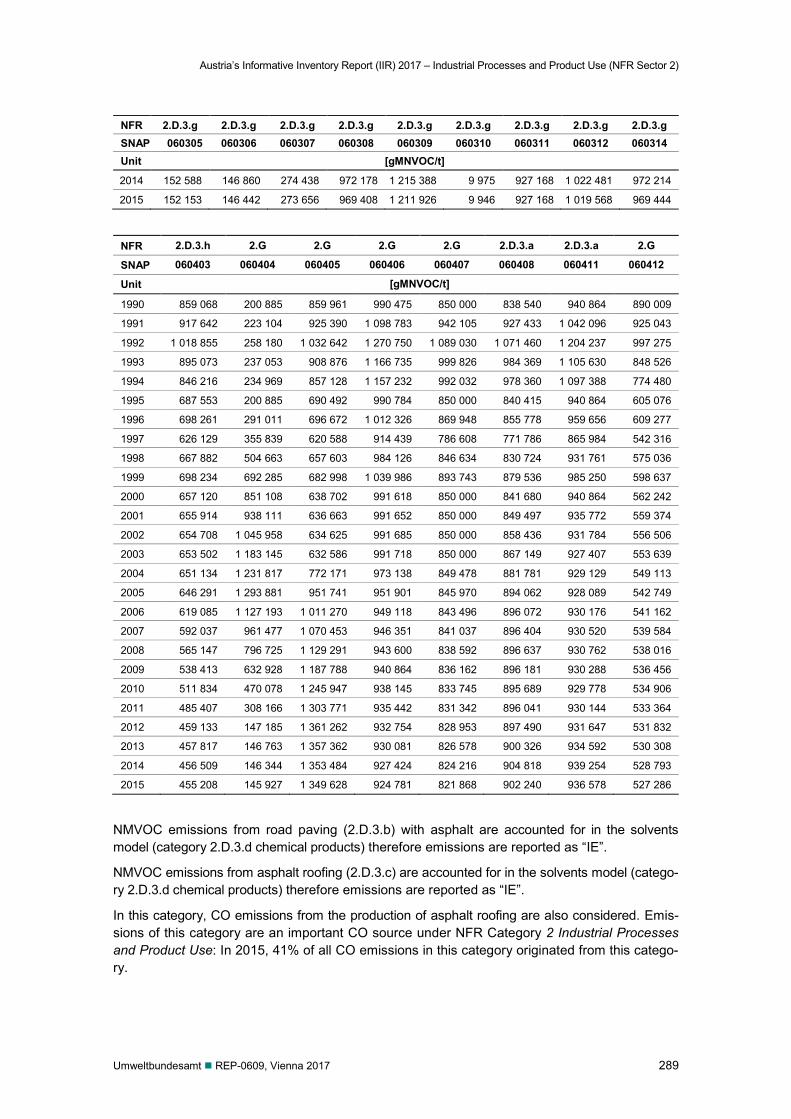
Austria’s Informative Inventory Report (IIR) 2017 – Industrial Processes and Product Use (NFR Sector 2)
Umweltbundesamt REP-0609, Vienna 2017 289
NFR 2.D.3.g 2.D.3.g 2.D.3.g 2.D.3.g 2.D.3.g 2.D.3.g 2.D.3.g 2.D.3.g 2.D.3.g SNAP 060305 060306 060307 060308 060309 060310 060311 060312 060314 Unit [gMNVOC/t]
2014 152 588 146 860 274 438 972 178 1 215 388 9 975 927 168 1 022 481 972 214
2015 152 153 146 442 273 656 969 408 1 211 926 9 946 927 168 1 019 568 969 444
NFR 2.D.3.h 2.G 2.G 2.G 2.G 2.D.3.a 2.D.3.a 2.G
SNAP 060403 060404 060405 060406 060407 060408 060411 060412
Unit [gMNVOC/t]
1990 859 068 200 885 859 961 990 475 850 000 838 540 940 864 890 009
1991 917 642 223 104 925 390 1 098 783 942 105 927 433 1 042 096 925 043
1992 1 018 855 258 180 1 032 642 1 270 750 1 089 030 1 071 460 1 204 237 997 275
1993 895 073 237 053 908 876 1 166 735 999 826 984 369 1 105 630 848 526
1994 846 216 234 969 857 128 1 157 232 992 032 978 360 1 097 388 774 480
1995 687 553 200 885 690 492 990 784 850 000 840 415 940 864 605 076
1996 698 261 291 011 696 672 1 012 326 869 948 855 778 959 656 609 277
1997 626 129 355 839 620 588 914 439 786 608 771 786 865 984 542 316
1998 667 882 504 663 657 603 984 126 846 634 830 724 931 761 575 036
1999 698 234 692 285 682 998 1 039 986 893 743 879 536 985 250 598 637
2000 657 120 851 108 638 702 991 618 850 000 841 680 940 864 562 242
2001 655 914 938 111 636 663 991 652 850 000 849 497 935 772 559 374
2002 654 708 1 045 958 634 625 991 685 850 000 858 436 931 784 556 506
2003 653 502 1 183 145 632 586 991 718 850 000 867 149 927 407 553 639
2004 651 134 1 231 817 772 171 973 138 849 478 881 781 929 129 549 113
2005 646 291 1 293 881 951 741 951 901 845 970 894 062 928 089 542 749
2006 619 085 1 127 193 1 011 270 949 118 843 496 896 072 930 176 541 162
2007 592 037 961 477 1 070 453 946 351 841 037 896 404 930 520 539 584
2008 565 147 796 725 1 129 291 943 600 838 592 896 637 930 762 538 016
2009 538 413 632 928 1 187 788 940 864 836 162 896 181 930 288 536 456
2010 511 834 470 078 1 245 947 938 145 833 745 895 689 929 778 534 906
2011 485 407 308 166 1 303 771 935 442 831 342 896 041 930 144 533 364
2012 459 133 147 185 1 361 262 932 754 828 953 897 490 931 647 531 832
2013 457 817 146 763 1 357 362 930 081 826 578 900 326 934 592 530 308
2014 456 509 146 344 1 353 484 927 424 824 216 904 818 939 254 528 793
2015 455 208 145 927 1 349 628 924 781 821 868 902 240 936 578 527 286
NMVOC emissions from road paving (2.D.3.b) with asphalt are accounted for in the solvents model (category 2.D.3.d chemical products) therefore emissions are reported as “IE”.
NMVOC emissions from asphalt roofing (2.D.3.c) are accounted for in the solvents model (catego-ry 2.D.3.d chemical products) therefore emissions are reported as “IE”.
In this category, CO emissions from the production of asphalt roofing are also considered. Emis-sions of this category are an important CO source under NFR Category 2 Industrial Processes and Product Use: In 2015, 41% of all CO emissions in this category originated from this catego-ry.
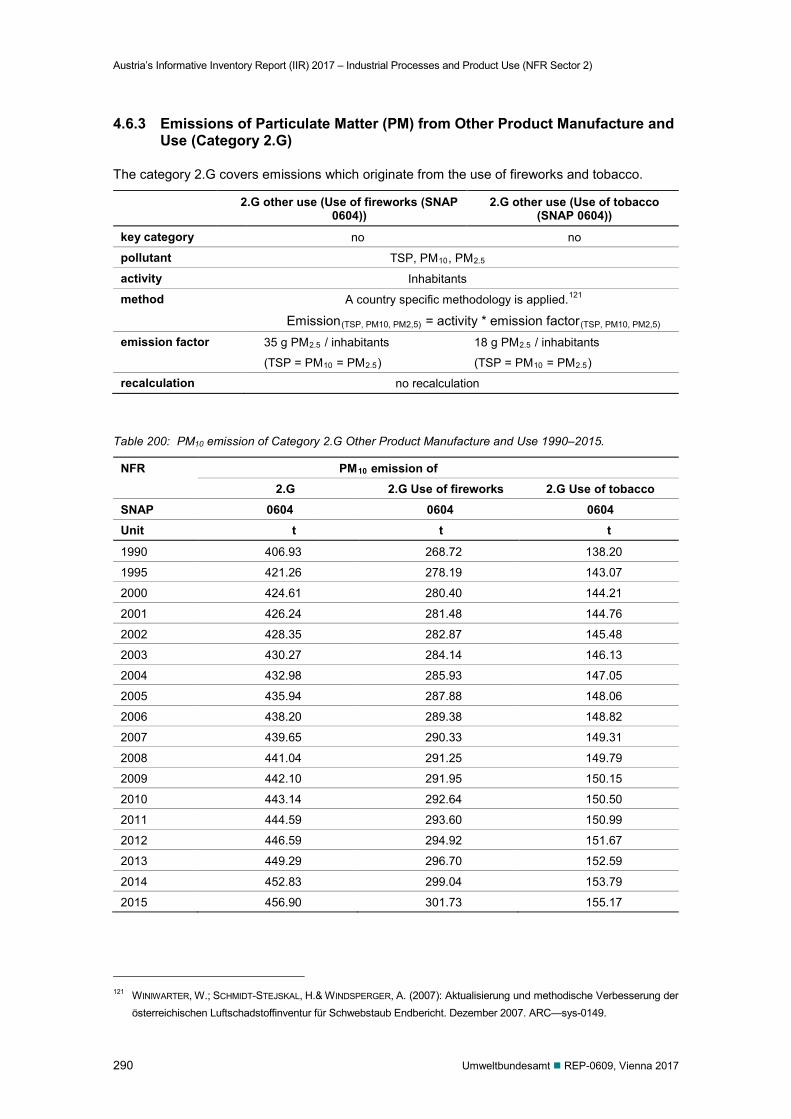
Austria’s Informative Inventory Report (IIR) 2017 – Industrial Processes and Product Use (NFR Sector 2)
290 Umweltbundesamt REP-0609, Vienna 2017
4.6.3 Emissions of Particulate Matter (PM) from Other Product Manufacture and Use (Category 2.G)
The category 2.G covers emissions which originate from the use of fireworks and tobacco.
2.G other use (Use of fireworks (SNAP 0604))
2.G other use (Use of tobacco (SNAP 0604))
key category no no
pollutant TSP, PM10, PM2.5
activity Inhabitants
method A country specific methodology is applied.121
Emission(TSP, PM10, PM2,5) = activity * emission factor(TSP, PM10, PM2,5) emission factor 35 g PM2.5 / inhabitants
(TSP = PM10 = PM2.5)
18 g PM2.5 / inhabitants
(TSP = PM10 = PM2.5)
recalculation no recalculation
Table 200: PM10 emission of Category 2.G Other Product Manufacture and Use 1990–2015.
NFR PM10 emission of 2.G 2.G Use of fireworks 2.G Use of tobacco
SNAP 0604 0604 0604 Unit t t t
1990 406.93 268.72 138.20
1995 421.26 278.19 143.07
2000 424.61 280.40 144.21
2001 426.24 281.48 144.76
2002 428.35 282.87 145.48
2003 430.27 284.14 146.13
2004 432.98 285.93 147.05
2005 435.94 287.88 148.06
2006 438.20 289.38 148.82
2007 439.65 290.33 149.31
2008 441.04 291.25 149.79
2009 442.10 291.95 150.15
2010 443.14 292.64 150.50
2011 444.59 293.60 150.99
2012 446.59 294.92 151.67
2013 449.29 296.70 152.59
2014 452.83 299.04 153.79
2015 456.90 301.73 155.17
121 WINIWARTER, W.; SCHMIDT-STEJSKAL, H.& WINDSPERGER, A. (2007): Aktualisierung und methodische Verbesserung der
österreichischen Luftschadstoffinventur für Schwebstaub Endbericht. Dezember 2007. ARC—sys-0149.
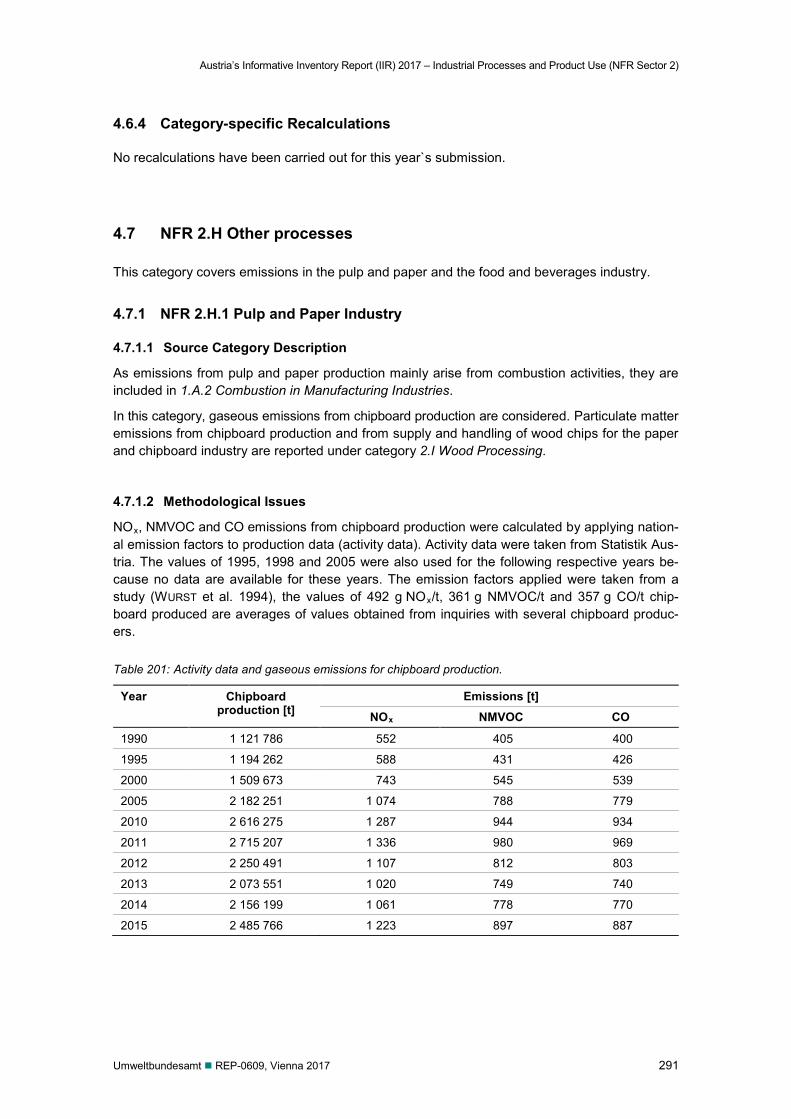
Austria’s Informative Inventory Report (IIR) 2017 – Industrial Processes and Product Use (NFR Sector 2)
Umweltbundesamt REP-0609, Vienna 2017 291
4.6.4 Category-specific Recalculations
No recalculations have been carried out for this year`s submission.
4.7 NFR 2.H Other processes
This category covers emissions in the pulp and paper and the food and beverages industry.
4.7.1 NFR 2.H.1 Pulp and Paper Industry
4.7.1.1 Source Category Description
As emissions from pulp and paper production mainly arise from combustion activities, they are included in 1.A.2 Combustion in Manufacturing Industries.
In this category, gaseous emissions from chipboard production are considered. Particulate matter emissions from chipboard production and from supply and handling of wood chips for the paper and chipboard industry are reported under category 2.I Wood Processing.
4.7.1.2 Methodological Issues
NOx, NMVOC and CO emissions from chipboard production were calculated by applying nation-al emission factors to production data (activity data). Activity data were taken from Statistik Aus-tria. The values of 1995, 1998 and 2005 were also used for the following respective years be-cause no data are available for these years. The emission factors applied were taken from a study (WURST et al. 1994), the values of 492 g NOx/t, 361 g NMVOC/t and 357 g CO/t chip-board produced are averages of values obtained from inquiries with several chipboard produc-ers.
Table 201: Activity data and gaseous emissions for chipboard production.
Year Chipboard production [t]
Emissions [t] NOx NMVOC CO
1990 1 121 786 552 405 400
1995 1 194 262 588 431 426
2000 1 509 673 743 545 539
2005 2 182 251 1 074 788 779
2010 2 616 275 1 287 944 934
2011 2 715 207 1 336 980 969
2012 2 250 491 1 107 812 803
2013 2 073 551 1 020 749 740
2014 2 156 199 1 061 778 770
2015 2 485 766 1 223 897 887
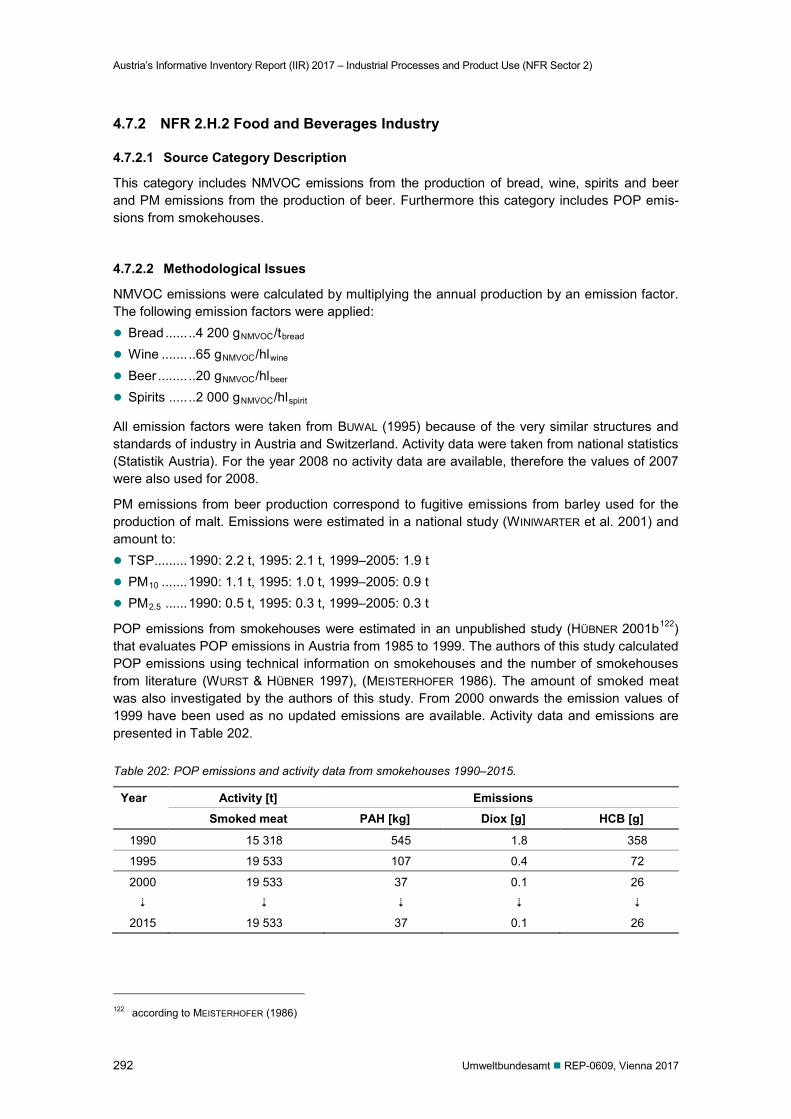
Austria’s Informative Inventory Report (IIR) 2017 – Industrial Processes and Product Use (NFR Sector 2)
292 Umweltbundesamt REP-0609, Vienna 2017
4.7.2 NFR 2.H.2 Food and Beverages Industry
4.7.2.1 Source Category Description
This category includes NMVOC emissions from the production of bread, wine, spirits and beer and PM emissions from the production of beer. Furthermore this category includes POP emis-sions from smokehouses.
4.7.2.2 Methodological Issues
NMVOC emissions were calculated by multiplying the annual production by an emission factor. The following emission factors were applied: Bread ...... ..4 200 gNMVOC/tbread Wine ....... ..65 gNMVOC/hlwine Beer ........ ..20 gNMVOC/hlbeer Spirits ..... ..2 000 gNMVOC/hlspirit
All emission factors were taken from BUWAL (1995) because of the very similar structures and standards of industry in Austria and Switzerland. Activity data were taken from national statistics (Statistik Austria). For the year 2008 no activity data are available, therefore the values of 2007 were also used for 2008.
PM emissions from beer production correspond to fugitive emissions from barley used for the production of malt. Emissions were estimated in a national study (WINIWARTER et al. 2001) and amount to: TSP......... 1990: 2.2 t, 1995: 2.1 t, 1999–2005: 1.9 t PM10 ....... 1990: 1.1 t, 1995: 1.0 t, 1999–2005: 0.9 t PM2.5 ...... 1990: 0.5 t, 1995: 0.3 t, 1999–2005: 0.3 t
POP emissions from smokehouses were estimated in an unpublished study (HÜBNER 2001b122) that evaluates POP emissions in Austria from 1985 to 1999. The authors of this study calculated POP emissions using technical information on smokehouses and the number of smokehouses from literature (WURST & HÜBNER 1997), (MEISTERHOFER 1986). The amount of smoked meat was also investigated by the authors of this study. From 2000 onwards the emission values of 1999 have been used as no updated emissions are available. Activity data and emissions are presented in Table 202.
Table 202: POP emissions and activity data from smokehouses 1990–2015.
Year Activity [t] Emissions Smoked meat PAH [kg] Diox [g] HCB [g]
1990 15 318 545 1.8 358
1995 19 533 107 0.4 72
2000 19 533 37 0.1 26
2015 19 533 37 0.1 26
122 according to MEISTERHOFER (1986)
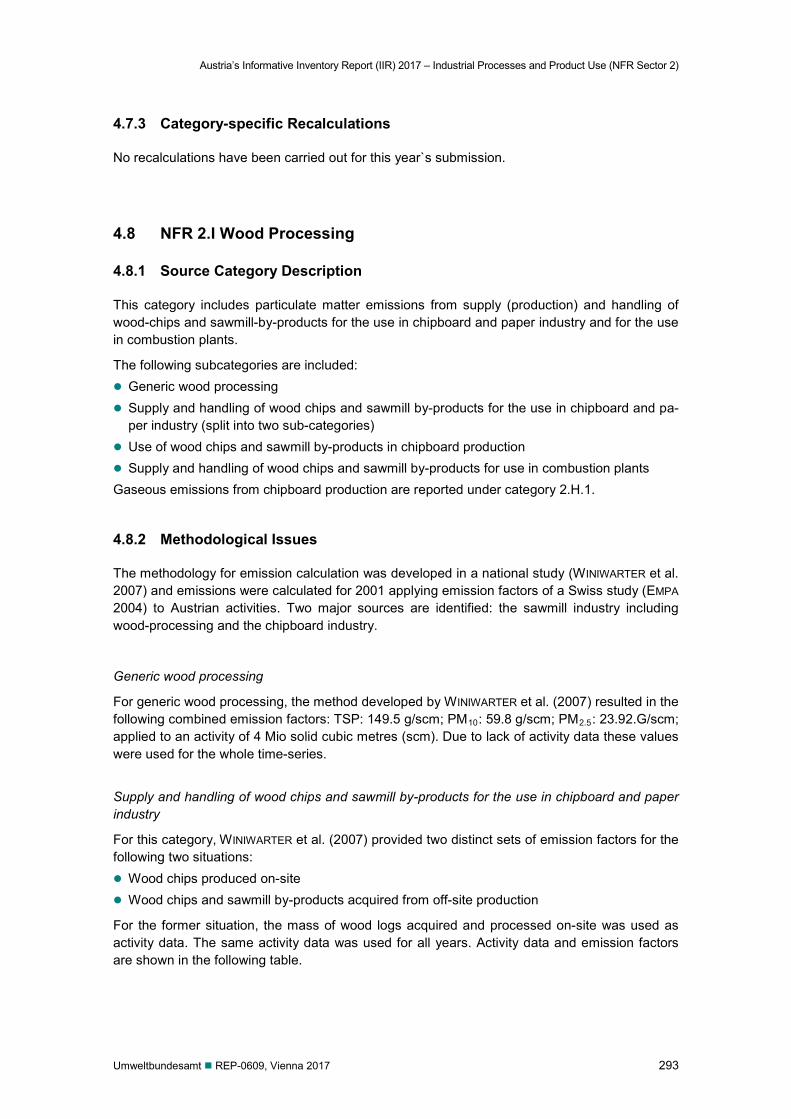
Austria’s Informative Inventory Report (IIR) 2017 – Industrial Processes and Product Use (NFR Sector 2)
Umweltbundesamt REP-0609, Vienna 2017 293
4.7.3 Category-specific Recalculations
No recalculations have been carried out for this year`s submission.
4.8 NFR 2.I Wood Processing
4.8.1 Source Category Description
This category includes particulate matter emissions from supply (production) and handling of wood-chips and sawmill-by-products for the use in chipboard and paper industry and for the use in combustion plants.
The following subcategories are included: Generic wood processing Supply and handling of wood chips and sawmill by-products for the use in chipboard and pa-
per industry (split into two sub-categories) Use of wood chips and sawmill by-products in chipboard production Supply and handling of wood chips and sawmill by-products for use in combustion plants Gaseous emissions from chipboard production are reported under category 2.H.1.
4.8.2 Methodological Issues
The methodology for emission calculation was developed in a national study (WINIWARTER et al. 2007) and emissions were calculated for 2001 applying emission factors of a Swiss study (EMPA 2004) to Austrian activities. Two major sources are identified: the sawmill industry including wood-processing and the chipboard industry.
Generic wood processing
For generic wood processing, the method developed by WINIWARTER et al. (2007) resulted in the following combined emission factors: TSP: 149.5 g/scm; PM10: 59.8 g/scm; PM2.5: 23.92.G/scm; applied to an activity of 4 Mio solid cubic metres (scm). Due to lack of activity data these values were used for the whole time-series.
Supply and handling of wood chips and sawmill by-products for the use in chipboard and paper industry
For this category, WINIWARTER et al. (2007) provided two distinct sets of emission factors for the following two situations: Wood chips produced on-site Wood chips and sawmill by-products acquired from off-site production
For the former situation, the mass of wood logs acquired and processed on-site was used as activity data. The same activity data was used for all years. Activity data and emission factors are shown in the following table.
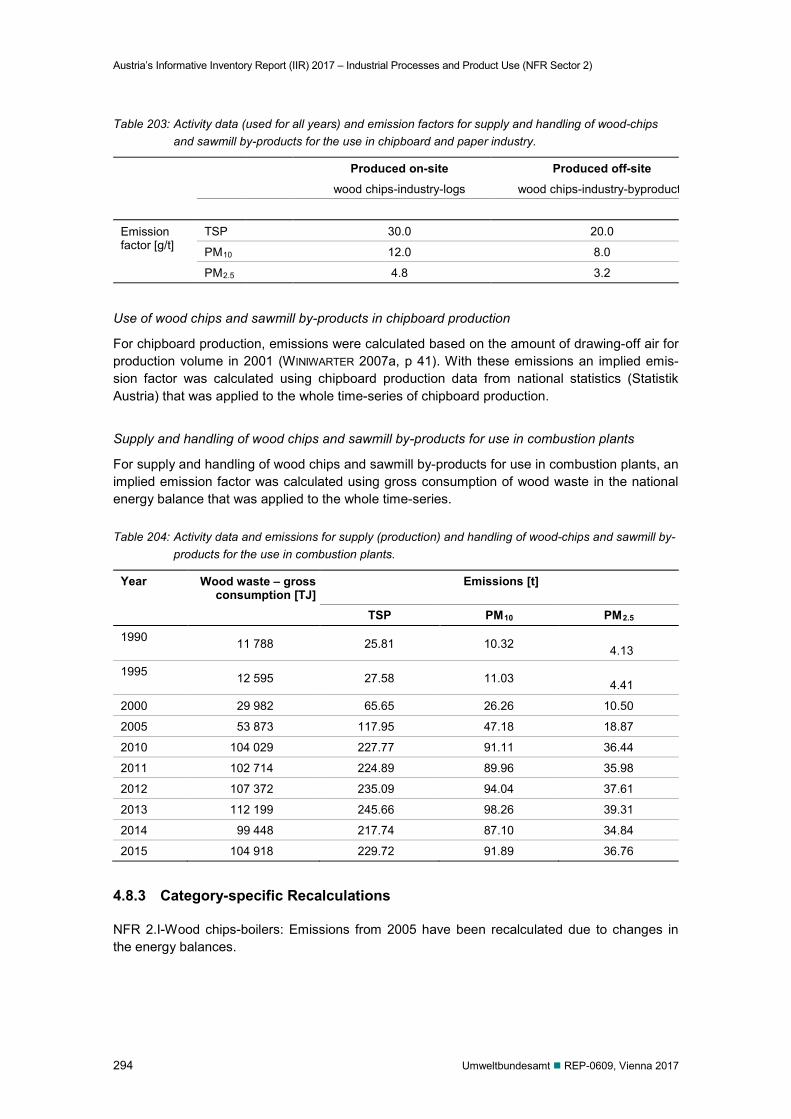
Austria’s Informative Inventory Report (IIR) 2017 – Industrial Processes and Product Use (NFR Sector 2)
294 Umweltbundesamt REP-0609, Vienna 2017
Table 203: Activity data (used for all years) and emission factors for supply and handling of wood-chips and sawmill by-products for the use in chipboard and paper industry.
Produced on-site wood chips-industry-logs
Produced off-site wood chips-industry-byproduct
Emission factor [g/t]
TSP 30.0 20.0
PM10 12.0 8.0
PM2.5 4.8 3.2
Use of wood chips and sawmill by-products in chipboard production
For chipboard production, emissions were calculated based on the amount of drawing-off air for production volume in 2001 (WINIWARTER 2007a, p 41). With these emissions an implied emis-sion factor was calculated using chipboard production data from national statistics (Statistik Austria) that was applied to the whole time-series of chipboard production.
Supply and handling of wood chips and sawmill by-products for use in combustion plants
For supply and handling of wood chips and sawmill by-products for use in combustion plants, an implied emission factor was calculated using gross consumption of wood waste in the national energy balance that was applied to the whole time-series.
Table 204: Activity data and emissions for supply (production) and handling of wood-chips and sawmill by-products for the use in combustion plants.
Year Wood waste – gross consumption [TJ]
Emissions [t]
TSP PM10 PM2.5
1990 11 788 25.81 10.32 4.13
1995 12 595 27.58 11.03 4.41
2000 29 982 65.65 26.26 10.50
2005 53 873 117.95 47.18 18.87
2010 104 029 227.77 91.11 36.44
2011 102 714 224.89 89.96 35.98
2012 107 372 235.09 94.04 37.61
2013 112 199 245.66 98.26 39.31
2014 99 448 217.74 87.10 34.84
2015 104 918 229.72 91.89 36.76
4.8.3 Category-specific Recalculations
NFR 2.I-Wood chips-boilers: Emissions from 2005 have been recalculated due to changes in the energy balances.
Austria’s Informative Inventory Report (IIR) 2017 – Agriculture (NFR Sector 3)
Umweltbundesamt REP-0609, Vienna 2017 295
5 AGRICULTURE (NFR SECTOR 3)
5.1 Sector Overview
This chapter includes information on the estimation of the emissions of NEC gases, CO, particu-late matter (PM), heavy metals (HM) and persistent organic pollutant (POP) of the sector Agricul-ture in Austria corresponding to the data reported in category 3 of the NFR format. It describes the calculations of source categories 3.B Manure Management, 3.D Agricultural Soils and 3.F Field Burning of Agricultural Residues.
For the other pollutants the agricultural sector is only a minor source: emissions of SO2, CO, heavy metals and POPs arise from category 3.F Field Burning of Agricultural Wastes; the contribu-tion to the national total for SO2, CO, dioxin, HCBs and heavy metals was below 1.5% for the whole time series.
To give an overview of Austria's agricultural sector some information is provided below (accord-ing to the 2010 Farm Structure Survey – full survey and the Agriculture Structure Survey 2013) (BMLFUW 2000–2016): Agriculture in Austria is rather small-structured: 166 317 farms are man-aged, 56.4% of these farms manage less than 20 ha, whereas only 5.2% of the Austrian farms manage more than 100 ha cultivated area. 115 331 holdings are classified as situated in less favoured areas. Related to the federal territory Austria has the highest share of mountainous areas in the EU (70%).
The agricultural area comprises 2.73 million hectares that is a share of ~ 33% of the total territo-ry (forestry ~ 41%, other area ~ 14%). The shares of the different agricultural activities are as follows: 50% arable land, 21% grassland (meadows mown several times and seeded grassland), 27% extensive grassland (meadows mown once, litter meadows, rough pastures, alpine pas-
tures and mountain meadows), 2% other types of agricultural land-use (vineyards, orchards, house gardens, vine and tree
nurseries).
5.2 General description
5.2.1 Completeness
Table 205 gives an overview of the NFR categories included in this chapter and presents the transformation matrix from SNAP categories. It also provides information on the status of emis-sion estimates of all subcategories. A „” indicates that emissions from this sub-category have been estimated.
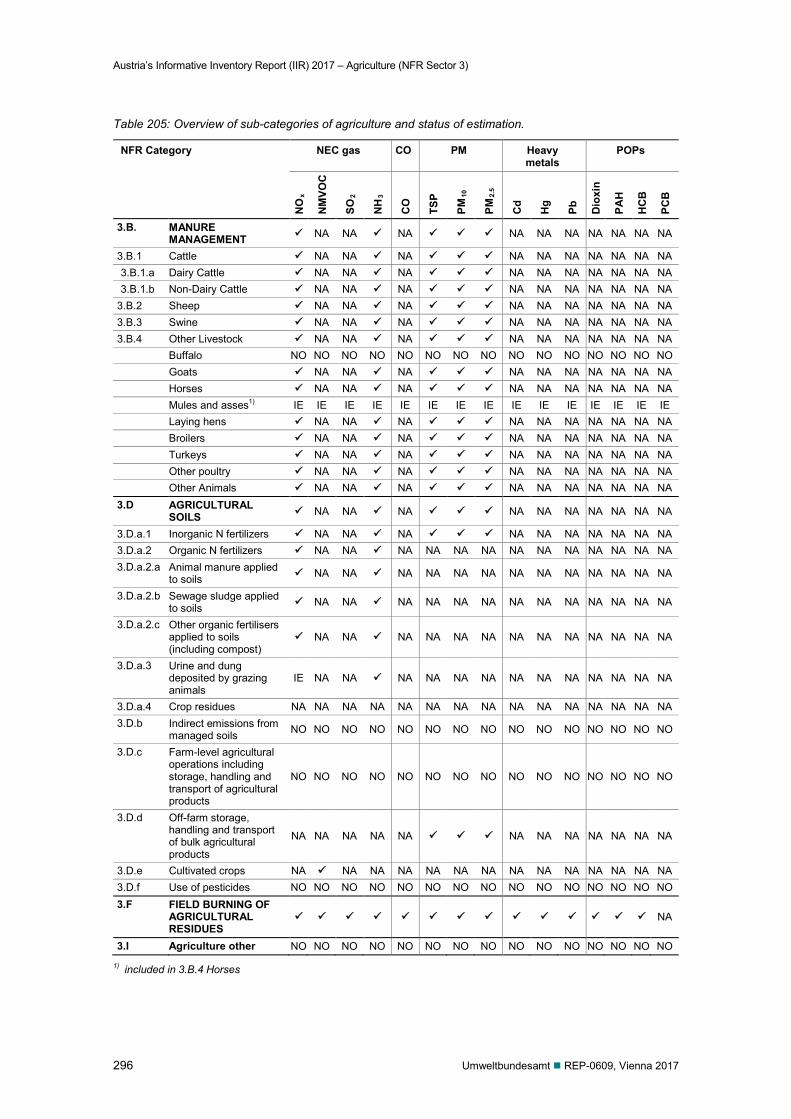
Austria’s Informative Inventory Report (IIR) 2017 – Agriculture (NFR Sector 3)
296 Umweltbundesamt REP-0609, Vienna 2017
Table 205: Overview of sub-categories of agriculture and status of estimation.
NFR Category NEC gas CO PM Heavy metals
POPs
NO
x
NM
VOC
SO2
NH
3
CO
TSP
PM10
PM2.
5
Cd
Hg
Pb
Dio
xin
PAH
HC
B
PCB
3.B. MANURE MANAGEMENT NA NA NA NA NA NA NA NA NA NA
3.B.1 Cattle NA NA NA NA NA NA NA NA NA NA 3.B.1.a Dairy Cattle NA NA NA NA NA NA NA NA NA NA 3.B.1.b Non-Dairy Cattle NA NA NA NA NA NA NA NA NA NA
3.B.2 Sheep NA NA NA NA NA NA NA NA NA NA 3.B.3 Swine NA NA NA NA NA NA NA NA NA NA 3.B.4 Other Livestock NA NA NA NA NA NA NA NA NA NA Buffalo NO NO NO NO NO NO NO NO NO NO NO NO NO NO NO Goats NA NA NA NA NA NA NA NA NA NA Horses NA NA NA NA NA NA NA NA NA NA Mules and asses1) IE IE IE IE IE IE IE IE IE IE IE IE IE IE IE Laying hens NA NA NA NA NA NA NA NA NA NA Broilers NA NA NA NA NA NA NA NA NA NA Turkeys NA NA NA NA NA NA NA NA NA NA Other poultry NA NA NA NA NA NA NA NA NA NA Other Animals NA NA NA NA NA NA NA NA NA NA 3.D AGRICULTURAL
SOILS NA NA NA NA NA NA NA NA NA NA
3.D.a.1 Inorganic N fertilizers NA NA NA NA NA NA NA NA NA NA 3.D.a.2 Organic N fertilizers NA NA NA NA NA NA NA NA NA NA NA NA NA 3.D.a.2.a Animal manure applied
to soils NA NA NA NA NA NA NA NA NA NA NA NA NA
3.D.a.2.b Sewage sludge applied to soils NA NA NA NA NA NA NA NA NA NA NA NA NA
3.D.a.2.c Other organic fertilisers applied to soils (including compost)
NA NA NA NA NA NA NA NA NA NA NA NA NA
3.D.a.3 Urine and dung deposited by grazing animals
IE NA NA NA NA NA NA NA NA NA NA NA NA NA
3.D.a.4 Crop residues NA NA NA NA NA NA NA NA NA NA NA NA NA NA NA 3.D.b Indirect emissions from
managed soils NO NO NO NO NO NO NO NO NO NO NO NO NO NO NO
3.D.c Farm-level agricultural operations including storage, handling and transport of agricultural products
NO NO NO NO NO NO NO NO NO NO NO NO NO NO NO
3.D.d Off-farm storage, handling and transport of bulk agricultural products
NA NA NA NA NA NA NA NA NA NA NA NA
3.D.e Cultivated crops NA NA NA NA NA NA NA NA NA NA NA NA NA NA 3.D.f Use of pesticides NO NO NO NO NO NO NO NO NO NO NO NO NO NO NO 3.F FIELD BURNING OF
AGRICULTURAL RESIDUES
NA
3.I Agriculture other NO NO NO NO NO NO NO NO NO NO NO NO NO NO NO
1) included in 3.B.4 Horses
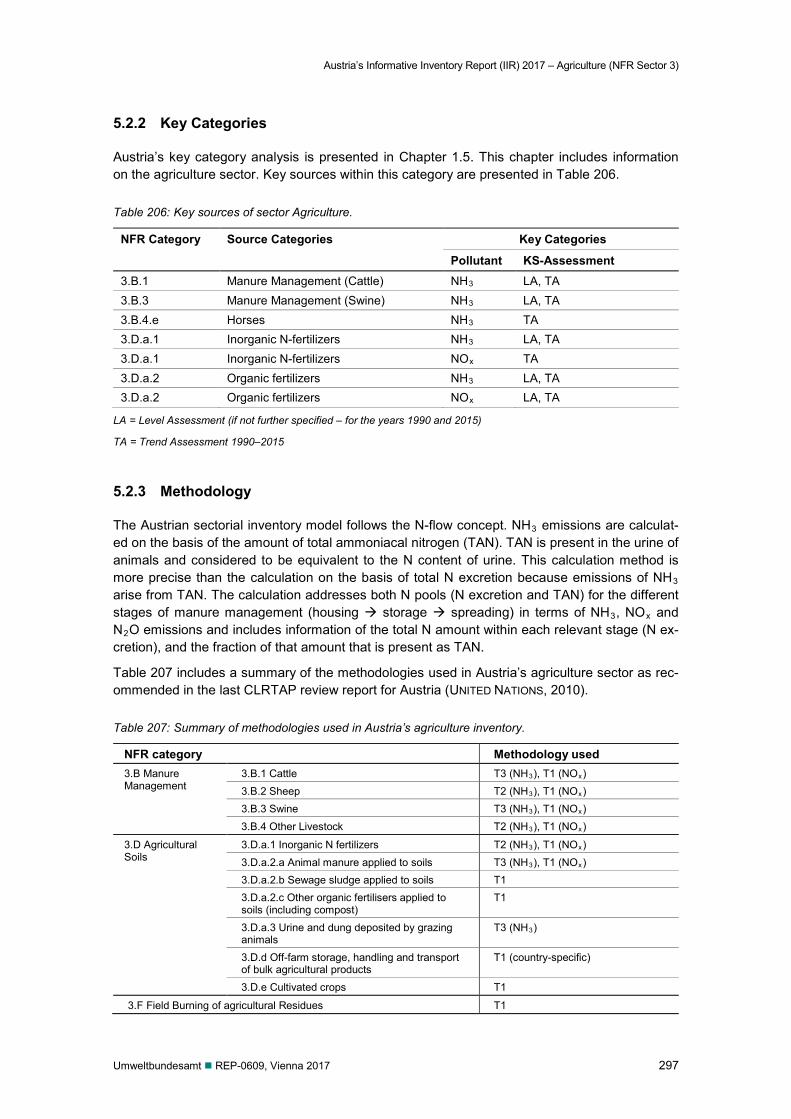
Austria’s Informative Inventory Report (IIR) 2017 – Agriculture (NFR Sector 3)
Umweltbundesamt REP-0609, Vienna 2017 297
5.2.2 Key Categories
Austria’s key category analysis is presented in Chapter 1.5. This chapter includes information on the agriculture sector. Key sources within this category are presented in Table 206.
Table 206: Key sources of sector Agriculture.
NFR Category Source Categories Key Categories
Pollutant KS-Assessment 3.B.1 Manure Management (Cattle) NH3 LA, TA 3.B.3 Manure Management (Swine) NH3 LA, TA 3.B.4.e Horses NH3 TA 3.D.a.1 Inorganic N-fertilizers NH3 LA, TA 3.D.a.1 Inorganic N-fertilizers NOx TA 3.D.a.2 Organic fertilizers NH3 LA, TA 3.D.a.2 Organic fertilizers NOx LA, TA
LA = Level Assessment (if not further specified – for the years 1990 and 2015)
TA = Trend Assessment 1990–2015
5.2.3 Methodology
The Austrian sectorial inventory model follows the N-flow concept. NH3 emissions are calculat-ed on the basis of the amount of total ammoniacal nitrogen (TAN). TAN is present in the urine of animals and considered to be equivalent to the N content of urine. This calculation method is more precise than the calculation on the basis of total N excretion because emissions of NH3 arise from TAN. The calculation addresses both N pools (N excretion and TAN) for the different stages of manure management (housing storage spreading) in terms of NH3, NOx and N2O emissions and includes information of the total N amount within each relevant stage (N ex-cretion), and the fraction of that amount that is present as TAN.
Table 207 includes a summary of the methodologies used in Austria’s agriculture sector as rec-ommended in the last CLRTAP review report for Austria (UNITED NATIONS, 2010).
Table 207: Summary of methodologies used in Austria’s agriculture inventory.
NFR category Methodology used 3.B Manure Management
3.B.1 Cattle T3 (NH3), T1 (NOx) 3.B.2 Sheep T2 (NH3), T1 (NOx) 3.B.3 Swine T3 (NH3), T1 (NOx) 3.B.4 Other Livestock T2 (NH3), T1 (NOx)
3.D Agricultural Soils
3.D.a.1 Inorganic N fertilizers T2 (NH3), T1 (NOx) 3.D.a.2.a Animal manure applied to soils T3 (NH3), T1 (NOx) 3.D.a.2.b Sewage sludge applied to soils T1 3.D.a.2.c Other organic fertilisers applied to soils (including compost)
T1
3.D.a.3 Urine and dung deposited by grazing animals
T3 (NH3)
3.D.d Off-farm storage, handling and transport of bulk agricultural products
T1 (country-specific)
3.D.e Cultivated crops T1
3.F Field Burning of agricultural Residues T1
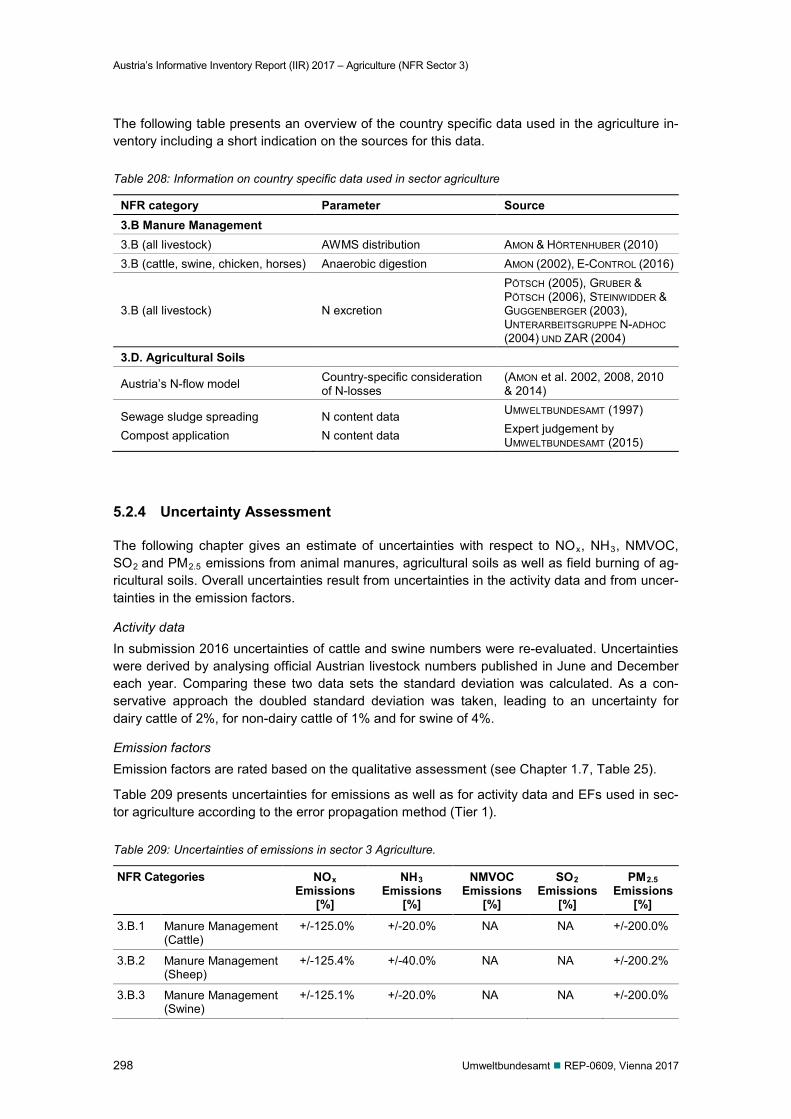
Austria’s Informative Inventory Report (IIR) 2017 – Agriculture (NFR Sector 3)
298 Umweltbundesamt REP-0609, Vienna 2017
The following table presents an overview of the country specific data used in the agriculture in-ventory including a short indication on the sources for this data.
Table 208: Information on country specific data used in sector agriculture
NFR category Parameter Source 3.B Manure Management 3.B (all livestock) AWMS distribution AMON & HÖRTENHUBER (2010) 3.B (cattle, swine, chicken, horses) Anaerobic digestion AMON (2002), E-CONTROL (2016)
3.B (all livestock) N excretion
PÖTSCH (2005), GRUBER & PÖTSCH (2006), STEINWIDDER & GUGGENBERGER (2003), UNTERARBEITSGRUPPE N-ADHOC (2004) UND ZAR (2004)
3.D. Agricultural Soils
Austria’s N-flow model Country-specific consideration of N-losses
(AMON et al. 2002, 2008, 2010 & 2014)
Sewage sludge spreading Compost application
N content data N content data
UMWELTBUNDESAMT (1997) Expert judgement by UMWELTBUNDESAMT (2015)
5.2.4 Uncertainty Assessment
The following chapter gives an estimate of uncertainties with respect to NOx, NH3, NMVOC, SO2 and PM2.5 emissions from animal manures, agricultural soils as well as field burning of ag-ricultural soils. Overall uncertainties result from uncertainties in the activity data and from uncer-tainties in the emission factors.
Activity data In submission 2016 uncertainties of cattle and swine numbers were re-evaluated. Uncertainties were derived by analysing official Austrian livestock numbers published in June and December each year. Comparing these two data sets the standard deviation was calculated. As a con-servative approach the doubled standard deviation was taken, leading to an uncertainty for dairy cattle of 2%, for non-dairy cattle of 1% and for swine of 4%.
Emission factors Emission factors are rated based on the qualitative assessment (see Chapter 1.7, Table 25).
Table 209 presents uncertainties for emissions as well as for activity data and EFs used in sec-tor agriculture according to the error propagation method (Tier 1).
Table 209: Uncertainties of emissions in sector 3 Agriculture.
NFR Categories NOx Emissions
[%]
NH3 Emissions
[%]
NMVOC Emissions
[%]
SO2 Emissions
[%]
PM2.5 Emissions
[%]
3.B.1 Manure Management (Cattle)
+/-125.0% +/-20.0% NA NA +/-200.0%
3.B.2 Manure Management (Sheep)
+/-125.4% +/-40.0% NA NA +/-200.2%
3.B.3 Manure Management (Swine)
+/-125.1% +/-20.0% NA NA +/-200.0%
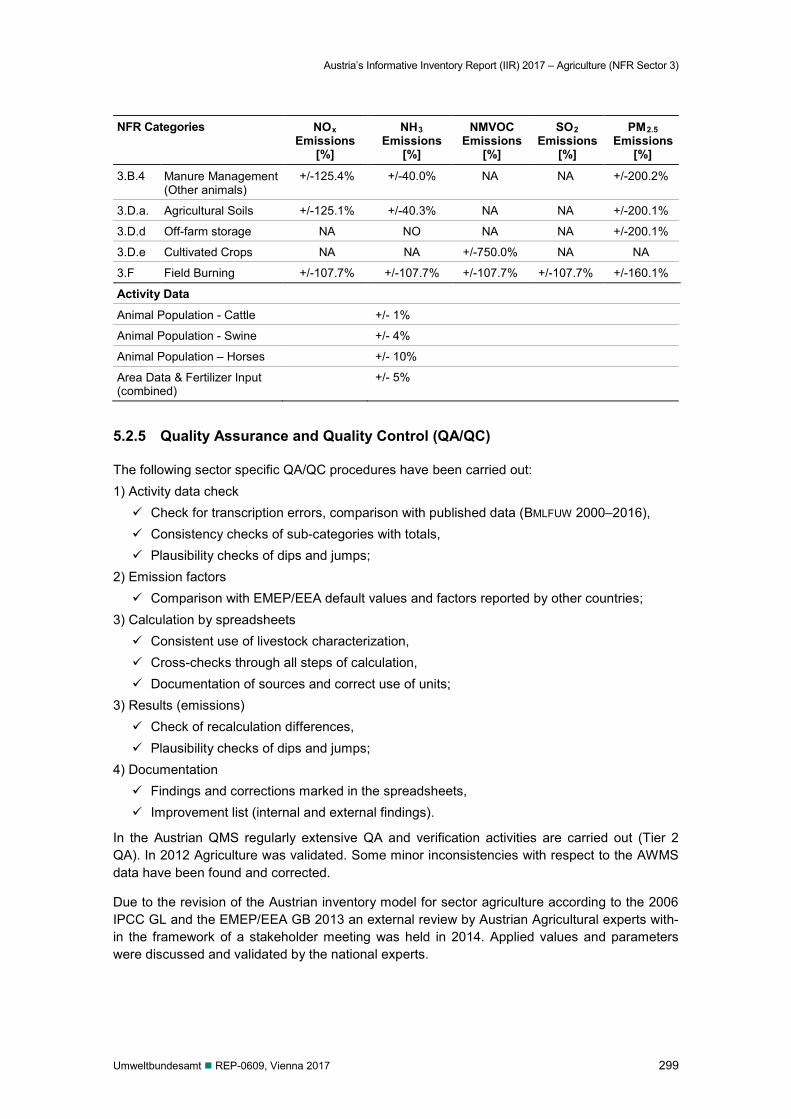
Austria’s Informative Inventory Report (IIR) 2017 – Agriculture (NFR Sector 3)
Umweltbundesamt REP-0609, Vienna 2017 299
NFR Categories NOx Emissions
[%]
NH3 Emissions
[%]
NMVOC Emissions
[%]
SO2 Emissions
[%]
PM2.5 Emissions
[%]
3.B.4 Manure Management (Other animals)
+/-125.4% +/-40.0% NA NA +/-200.2%
3.D.a. Agricultural Soils +/-125.1% +/-40.3% NA NA +/-200.1%
3.D.d Off-farm storage NA NO NA NA +/-200.1%
3.D.e Cultivated Crops NA NA +/-750.0% NA NA
3.F Field Burning +/-107.7% +/-107.7% +/-107.7% +/-107.7% +/-160.1%
Activity Data
Animal Population - Cattle +/- 1%
Animal Population - Swine +/- 4%
Animal Population – Horses +/- 10%
Area Data & Fertilizer Input (combined)
+/- 5%
5.2.5 Quality Assurance and Quality Control (QA/QC)
The following sector specific QA/QC procedures have been carried out: 1) Activity data check Check for transcription errors, comparison with published data (BMLFUW 2000–2016), Consistency checks of sub-categories with totals, Plausibility checks of dips and jumps;
2) Emission factors Comparison with EMEP/EEA default values and factors reported by other countries;
3) Calculation by spreadsheets Consistent use of livestock characterization, Cross-checks through all steps of calculation, Documentation of sources and correct use of units;
3) Results (emissions) Check of recalculation differences, Plausibility checks of dips and jumps;
4) Documentation Findings and corrections marked in the spreadsheets, Improvement list (internal and external findings).
In the Austrian QMS regularly extensive QA and verification activities are carried out (Tier 2 QA). In 2012 Agriculture was validated. Some minor inconsistencies with respect to the AWMS data have been found and corrected.
Due to the revision of the Austrian inventory model for sector agriculture according to the 2006 IPCC GL and the EMEP/EEA GB 2013 an external review by Austrian Agricultural experts with-in the framework of a stakeholder meeting was held in 2014. Applied values and parameters were discussed and validated by the national experts.
Austria’s Informative Inventory Report (IIR) 2017 – Agriculture (NFR Sector 3)
300 Umweltbundesamt REP-0609, Vienna 2017
In the course of the most recent ’Re-Accreditation audit’ (see chapter 1.6 on general QAQC) the technical auditor concentrated on the sector agriculture with a special focus on the technical process as well as internal documentation. The audit was successful, only some minor im-provements in the internal documentation were suggested.
A general description of Austria’s QMS (Quality Management System) is presented in Chapter 1.6.
5.2.6 Planned Improvements
Consultations and exploratory work for the planning of a new investigation on Austria’s agricul-ture practice has been started in 2015. The official project start was in spring 2016 and the questionnaires were sent to the farmers by the end of 2016. The evaluation of data is planned for spring 2017 and the implementation to Austria’s emission inventory is planned for submis-sion 2018. Additionally it is planned to fully implement the EMEP/EEA 2016 Guidebook into the agriculture inventory within this revision.
5.3 NFR 3.B Manure Management
The Austrian sectorial inventory model follows the N-flow concept (AMON & HÖRTENHUBER 2014). In current air emission inventory, Austria started with the implementation of new method-ologies and EFs provided in the EMEP/EEA GB 2016, published on 30th September 2016. The full implementation of the EMEP/EEA 2016 Guidebook is planned for submission 2018.
Data on animal husbandry and manure management systems all over Austria are based on the research project “Animal husbandry and manure management systems in Austria” (AMON et al. 2007) and led to a considerable improvement of the inventory quality (AMON & HÖRTENHUBER 2008 and AMON & HÖRTENHUBER 2010). An update of this study is scheduled for 2016–2017; the implementation of updated data on agricultural practice is planned for submission 2018.
5.3.1 Methodological Issues
NH3 emissions from Sector 3 Agriculture are estimated according to the EMEP/EEA Air Pollu-tant Emission Inventory Guidebook (EEA 2013, EEA 2016). Emissions from cattle and swine are estimated using a country specific methodology which requires detailed information on animal characteristics and the manner in which manure is managed. NH3 emissions from the non-key animal categories sheep, goats, poultry, horses and deer have been estimated using the de-tailed Tier 2 method following the current version of the EMEP/EEA Guidebook 2016. The Tier 2 method follows a mass flow analysis, which is more detailed and thus better reflects Austrian conditions.
NOx emissions from manure management have been estimated using the default Tier 1 emis-sion factors of the EMEP/EEA Guidebook 2016 (EEA 2016).
Austria’s Informative Inventory Report (IIR) 2017 – Agriculture (NFR Sector 3)
Umweltbundesamt REP-0609, Vienna 2017 301
Animal numbers The Austrian official statistics (STATISTIK AUSTRIA 2016b) provides national data of annual live-stock numbers on a very detailed level. These data are based on livestock counts held in De-cember each year123.
In Table 210 and Table 211 applied animal data are presented. Background information to the data is listed below: From 1990 onwards: The continuous decline of dairy cattle numbers is connected with the in-
creasing milk yield per cow: For the production of milk according to Austria’s milk quota every year a smaller number of cows is needed.
1991: A minimum counting threshold for poultry was introduced. Farms with less than 11 poul-try were not considered any more. However, the contribution of these small farms is negligible, both with respect to the total poultry number and to the trend. The increase of the soliped population between 1990 and 1991 is caused by a better data collection from riding clubs and horse breeding farms.
1993: New characteristics for swine and cattle categories were introduced in accordance with Austria’s entry into the European Economic Area and the EU guidelines for farm animal population categories. In 1993 part of the “Young cattle < 1 yr” category was included in the “Young cattle 1–2 yr” category. This shift is considered to be insignificant: no incon-sistency in the emission trend of “Non-Dairy Cattle” category was recorded. In the same year “Young swine < 50 kg” were shifted to “Fattening pigs > 50 kg” (before 1993 the limits were 6 months and not 50 kg which led to the shift) causing distinct in-consistencies in time series. Following a recommendation of the Centralized Review 2003, the age class split for swine categories of the years 1990–1992 was adjusted us-ing the split from 1993.
1993: For the first time other animals e.g. deer (but not wild living animals) were counted. Fol-lowing the recommendations of the Centralized Review 2004, to ensure consistency and completeness animal number of 1993 was used for the years 1990 to 1992.
1995: The financial support of suckling cow husbandry increased significantly in 1995 when Austria became a Member State of the European Union. The husbandry of suckling cows is used for the production of veal and beef; the milk yield of the cow is only pro-vided for the suckling calves. Especially in mountainous regions with unfavourable farm-ing conditions, suckling cow husbandry allows an extensive and economic reasonable utilisation of the pastures. Suckling cow husbandry contributes to the conservation of the traditional Austrian alpine landscape.
1996–1998: The market situation affected a decrease in veal and beef production, resulting in a declining suckling cow husbandry. Farmers partly used their former suckling cows for milk production. Thus, dairy cow numbers slightly increased at this time. Reasons are manifold: Changing market prices, BSE epidemic in Europe and change of consumer behaviour, milk quota etc.
1998–2000; 2006–2008: increasing/ decreasing swine numbers: The production of swine has a high elasticity to prices: Swine numbers are changing due to changing market prices very rapidly. Market prices change due to changes in costumer behaviour, saturation of swine production, epidemics etc.
123 For cattle livestock counts are also held in June, but seasonal changes are very small (between 0% and 2%). Live-
stock counts of sheep are only held in December (sheep is only a minor source for Austria and seasonal changes of the population are not considered relevant).
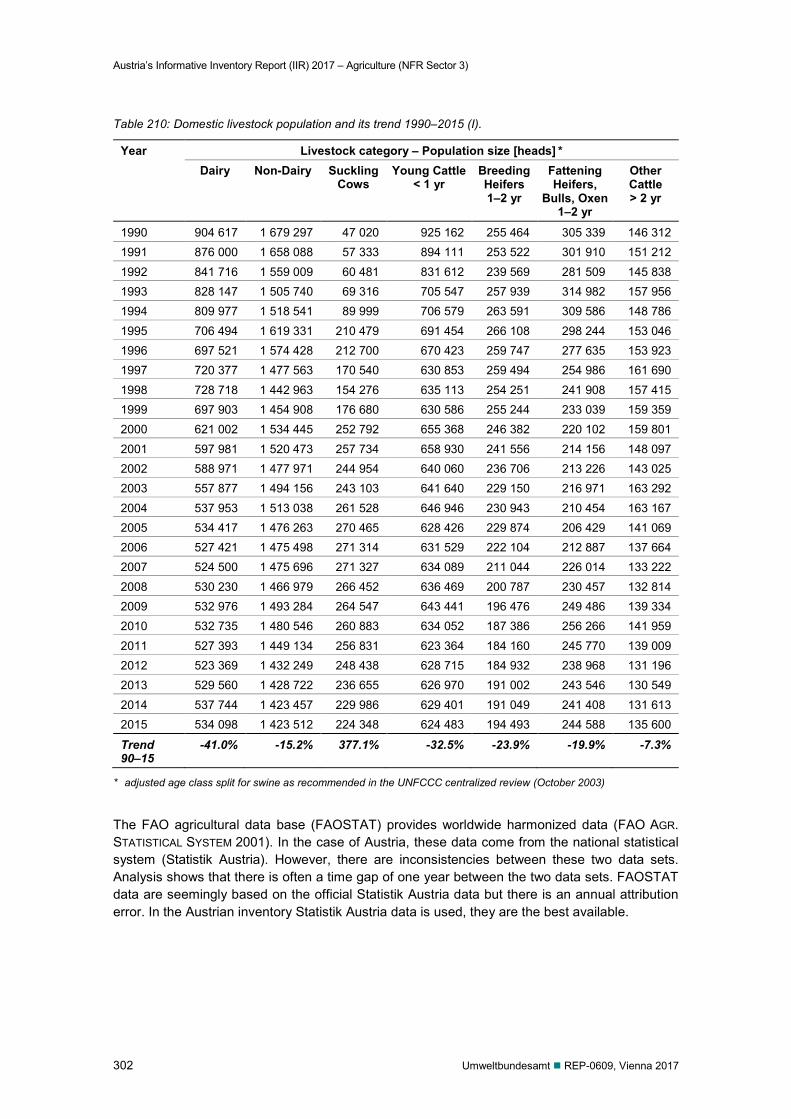
Austria’s Informative Inventory Report (IIR) 2017 – Agriculture (NFR Sector 3)
302 Umweltbundesamt REP-0609, Vienna 2017
Table 210: Domestic livestock population and its trend 1990–2015 (I).
Year Livestock category – Population size [heads] * Dairy Non-Dairy Suckling
Cows Young Cattle
< 1 yr Breeding Heifers 1–2 yr
Fattening Heifers,
Bulls, Oxen 1–2 yr
Other Cattle > 2 yr
1990 904 617 1 679 297 47 020 925 162 255 464 305 339 146 312 1991 876 000 1 658 088 57 333 894 111 253 522 301 910 151 212 1992 841 716 1 559 009 60 481 831 612 239 569 281 509 145 838 1993 828 147 1 505 740 69 316 705 547 257 939 314 982 157 956 1994 809 977 1 518 541 89 999 706 579 263 591 309 586 148 786 1995 706 494 1 619 331 210 479 691 454 266 108 298 244 153 046 1996 697 521 1 574 428 212 700 670 423 259 747 277 635 153 923 1997 720 377 1 477 563 170 540 630 853 259 494 254 986 161 690 1998 728 718 1 442 963 154 276 635 113 254 251 241 908 157 415 1999 697 903 1 454 908 176 680 630 586 255 244 233 039 159 359 2000 621 002 1 534 445 252 792 655 368 246 382 220 102 159 801 2001 597 981 1 520 473 257 734 658 930 241 556 214 156 148 097 2002 588 971 1 477 971 244 954 640 060 236 706 213 226 143 025 2003 557 877 1 494 156 243 103 641 640 229 150 216 971 163 292 2004 537 953 1 513 038 261 528 646 946 230 943 210 454 163 167 2005 534 417 1 476 263 270 465 628 426 229 874 206 429 141 069 2006 527 421 1 475 498 271 314 631 529 222 104 212 887 137 664 2007 524 500 1 475 696 271 327 634 089 211 044 226 014 133 222 2008 530 230 1 466 979 266 452 636 469 200 787 230 457 132 814 2009 532 976 1 493 284 264 547 643 441 196 476 249 486 139 334 2010 532 735 1 480 546 260 883 634 052 187 386 256 266 141 959 2011 527 393 1 449 134 256 831 623 364 184 160 245 770 139 009 2012 523 369 1 432 249 248 438 628 715 184 932 238 968 131 196 2013 529 560 1 428 722 236 655 626 970 191 002 243 546 130 549 2014 537 744 1 423 457 229 986 629 401 191 049 241 408 131 613 2015 534 098 1 423 512 224 348 624 483 194 493 244 588 135 600
Trend 90–15
-41.0% -15.2% 377.1% -32.5% -23.9% -19.9% -7.3%
* adjusted age class split for swine as recommended in the UNFCCC centralized review (October 2003)
The FAO agricultural data base (FAOSTAT) provides worldwide harmonized data (FAO AGR. STATISTICAL SYSTEM 2001). In the case of Austria, these data come from the national statistical system (Statistik Austria). However, there are inconsistencies between these two data sets. Analysis shows that there is often a time gap of one year between the two data sets. FAOSTAT data are seemingly based on the official Statistik Austria data but there is an annual attribution error. In the Austrian inventory Statistik Austria data is used, they are the best available.
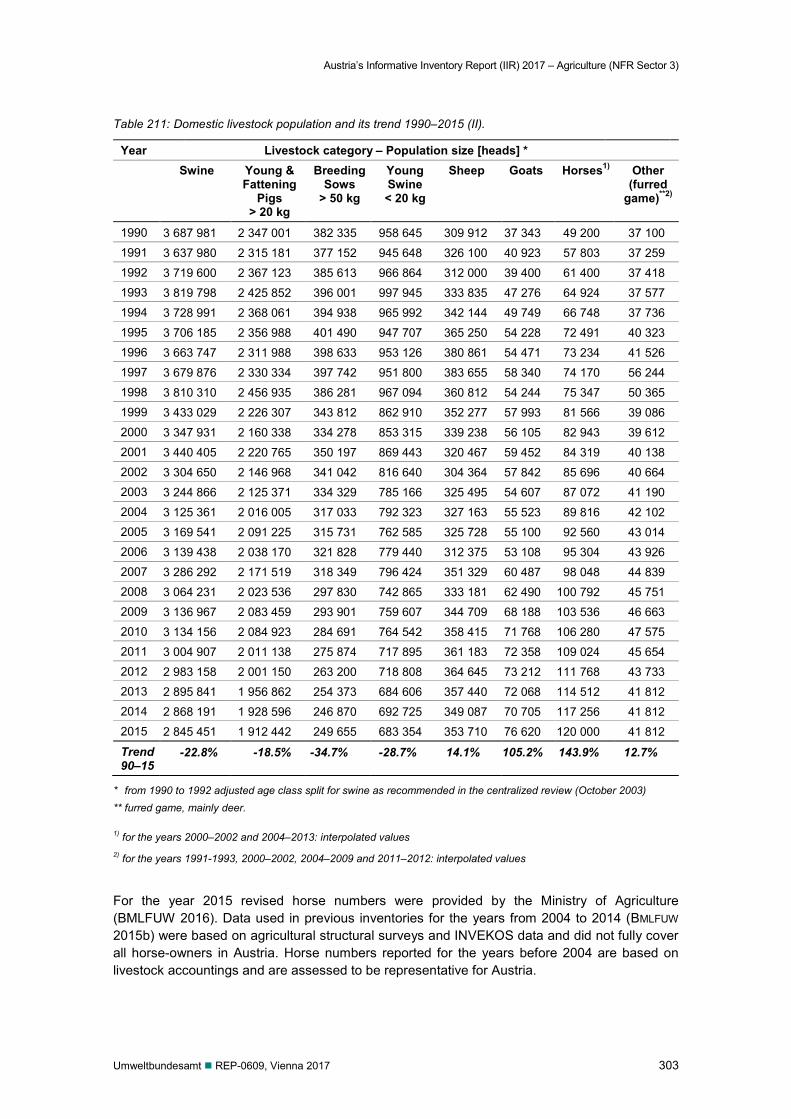
Austria’s Informative Inventory Report (IIR) 2017 – Agriculture (NFR Sector 3)
Umweltbundesamt REP-0609, Vienna 2017 303
Table 211: Domestic livestock population and its trend 1990–2015 (II).
Year Livestock category – Population size [heads] * Swine Young &
Fattening Pigs
> 20 kg
Breeding Sows
> 50 kg
Young Swine < 20 kg
Sheep Goats Horses1) Other (furred
game)**2)
1990 3 687 981 2 347 001 382 335 958 645 309 912 37 343 49 200 37 100 1991 3 637 980 2 315 181 377 152 945 648 326 100 40 923 57 803 37 259 1992 3 719 600 2 367 123 385 613 966 864 312 000 39 400 61 400 37 418 1993 3 819 798 2 425 852 396 001 997 945 333 835 47 276 64 924 37 577 1994 3 728 991 2 368 061 394 938 965 992 342 144 49 749 66 748 37 736 1995 3 706 185 2 356 988 401 490 947 707 365 250 54 228 72 491 40 323 1996 3 663 747 2 311 988 398 633 953 126 380 861 54 471 73 234 41 526 1997 3 679 876 2 330 334 397 742 951 800 383 655 58 340 74 170 56 244 1998 3 810 310 2 456 935 386 281 967 094 360 812 54 244 75 347 50 365 1999 3 433 029 2 226 307 343 812 862 910 352 277 57 993 81 566 39 086 2000 3 347 931 2 160 338 334 278 853 315 339 238 56 105 82 943 39 612 2001 3 440 405 2 220 765 350 197 869 443 320 467 59 452 84 319 40 138 2002 3 304 650 2 146 968 341 042 816 640 304 364 57 842 85 696 40 664 2003 3 244 866 2 125 371 334 329 785 166 325 495 54 607 87 072 41 190 2004 3 125 361 2 016 005 317 033 792 323 327 163 55 523 89 816 42 102 2005 3 169 541 2 091 225 315 731 762 585 325 728 55 100 92 560 43 014 2006 3 139 438 2 038 170 321 828 779 440 312 375 53 108 95 304 43 926 2007 3 286 292 2 171 519 318 349 796 424 351 329 60 487 98 048 44 839 2008 3 064 231 2 023 536 297 830 742 865 333 181 62 490 100 792 45 751 2009 3 136 967 2 083 459 293 901 759 607 344 709 68 188 103 536 46 663 2010 3 134 156 2 084 923 284 691 764 542 358 415 71 768 106 280 47 575 2011 3 004 907 2 011 138 275 874 717 895 361 183 72 358 109 024 45 654 2012 2 983 158 2 001 150 263 200 718 808 364 645 73 212 111 768 43 733 2013 2 895 841 1 956 862 254 373 684 606 357 440 72 068 114 512 41 812 2014 2 868 191 1 928 596 246 870 692 725 349 087 70 705 117 256 41 812 2015 2 845 451 1 912 442 249 655 683 354 353 710 76 620 120 000 41 812
Trend 90–15
-22.8% -18.5% -34.7% -28.7% 14.1% 105.2% 143.9% 12.7%
* from 1990 to 1992 adjusted age class split for swine as recommended in the centralized review (October 2003) ** furred game, mainly deer.
1) for the years 2000–2002 and 2004–2013: interpolated values 2) for the years 1991-1993, 2000–2002, 2004–2009 and 2011–2012: interpolated values
For the year 2015 revised horse numbers were provided by the Ministry of Agriculture (BMLFUW 2016). Data used in previous inventories for the years from 2004 to 2014 (BMLFUW 2015b) were based on agricultural structural surveys and INVEKOS data and did not fully cover all horse-owners in Austria. Horse numbers reported for the years before 2004 are based on livestock accountings and are assessed to be representative for Austria.
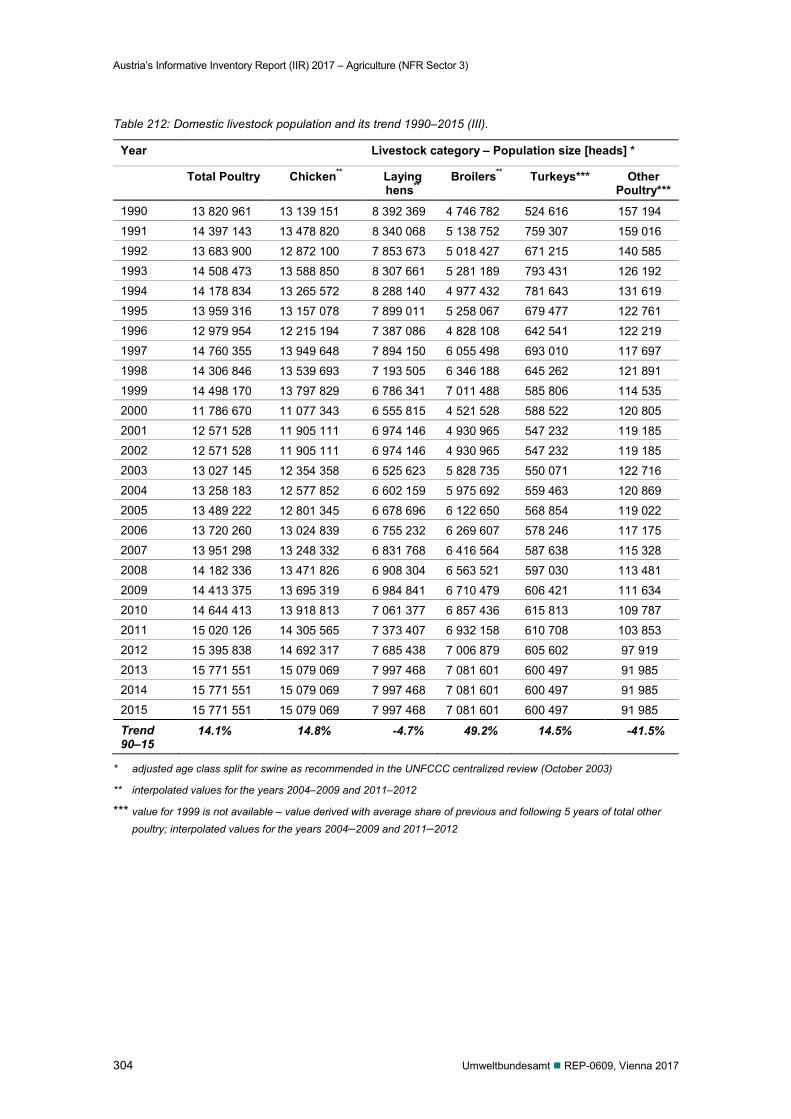
Austria’s Informative Inventory Report (IIR) 2017 – Agriculture (NFR Sector 3)
304 Umweltbundesamt REP-0609, Vienna 2017
Table 212: Domestic livestock population and its trend 1990–2015 (III).
Year Livestock category – Population size [heads] *
Total Poultry Chicken** Laying hens**
Broilers** Turkeys*** Other Poultry***
1990 13 820 961 13 139 151 8 392 369 4 746 782 524 616 157 194 1991 14 397 143 13 478 820 8 340 068 5 138 752 759 307 159 016 1992 13 683 900 12 872 100 7 853 673 5 018 427 671 215 140 585 1993 14 508 473 13 588 850 8 307 661 5 281 189 793 431 126 192 1994 14 178 834 13 265 572 8 288 140 4 977 432 781 643 131 619 1995 13 959 316 13 157 078 7 899 011 5 258 067 679 477 122 761 1996 12 979 954 12 215 194 7 387 086 4 828 108 642 541 122 219 1997 14 760 355 13 949 648 7 894 150 6 055 498 693 010 117 697 1998 14 306 846 13 539 693 7 193 505 6 346 188 645 262 121 891 1999 14 498 170 13 797 829 6 786 341 7 011 488 585 806 114 535 2000 11 786 670 11 077 343 6 555 815 4 521 528 588 522 120 805 2001 12 571 528 11 905 111 6 974 146 4 930 965 547 232 119 185 2002 12 571 528 11 905 111 6 974 146 4 930 965 547 232 119 185 2003 13 027 145 12 354 358 6 525 623 5 828 735 550 071 122 716 2004 13 258 183 12 577 852 6 602 159 5 975 692 559 463 120 869 2005 13 489 222 12 801 345 6 678 696 6 122 650 568 854 119 022 2006 13 720 260 13 024 839 6 755 232 6 269 607 578 246 117 175 2007 13 951 298 13 248 332 6 831 768 6 416 564 587 638 115 328 2008 14 182 336 13 471 826 6 908 304 6 563 521 597 030 113 481 2009 14 413 375 13 695 319 6 984 841 6 710 479 606 421 111 634 2010 14 644 413 13 918 813 7 061 377 6 857 436 615 813 109 787 2011 15 020 126 14 305 565 7 373 407 6 932 158 610 708 103 853 2012 15 395 838 14 692 317 7 685 438 7 006 879 605 602 97 919 2013 15 771 551 15 079 069 7 997 468 7 081 601 600 497 91 985 2014 15 771 551 15 079 069 7 997 468 7 081 601 600 497 91 985 2015 15 771 551 15 079 069 7 997 468 7 081 601 600 497 91 985
Trend 90–15
14.1% 14.8% -4.7% 49.2% 14.5% -41.5%
* adjusted age class split for swine as recommended in the UNFCCC centralized review (October 2003)
** interpolated values for the years 2004–2009 and 2011–2012
*** value for 1999 is not available – value derived with average share of previous and following 5 years of total other poultry; interpolated values for the years 2004–2009 and 2011–2012
Austria’s Informative Inventory Report (IIR) 2017 – Agriculture (NFR Sector 3)
Umweltbundesamt REP-0609, Vienna 2017 305
5.3.2 NH3 emissions from cattle (3.B.1) and swine (3.B.3)
Key Sources: NH3
5.3.2.1 Agricultural practice – cattle and swine
Animal Waste Management System Distribution (AWMS)
AWMS distribution data was obtained from the study ‘Animal husbandry and manure manage-ment systems in Austria (TIHALO)’ (AMON et al. 2007). In this research project a comprehensive survey on the agricultural practices in Austria has been carried out. Within this project, the Divi-sion of Agricultural Engineering (DAE) of the Department for Sustainable Agricultural Systems of the University of Natural Resources and Applied Life Sciences (BOKU) closely co-operated with the Swiss College of Agriculture, the Austrian Chamber of Agriculture, the Umweltbun-desamt, the Agricultural Research and Education Centre Raumberg-Gumpenstein and the Sta-tistics Austria. Firstly, a questionnaire was developed to assess animal housing, manure stor-age and manure application on typical Austrian farms. In November 2005, the questionnaire was sent to 5 000 Austrian farms. With the active assistance of the regional chambers of agri-culture, a rate of questionnaire return of 39% was achieved. The statistical sampling plan was set up with the assistance of the Statistics Austria to guarantee the selection of a representative sample of Austrian farms.
As a result of TIHALO, for 2005 new representative data on animal husbandry and manure management systems all over Austria is available. For the year 1990 AWMS data based on (KONRAD 1995) is available. In this study data on existing Austrian conditions were derived from a research survey carried out on 720 randomly-chosen agricultural enterprises in the years 1989–1992.
For the creation of a plausible time series the AWMS distribution of 1990 (based on KONRAD 1995) partly had to be adopted. Changes to the year 1990 were derived from the new study re-sults (AMON et al. 2007) and expert opinion carried out by DI Alfred Pöllinger (Agricultural Re-search and Education Centre Raumberg-Gumpenstein) in June 2008 (AMON & HÖRTENHUBER 2008). The AWMS data from 2005–2008 were derived by linear extrapolation. From 2008 on-wards the AWMS distribution is held constant in order to prevent implausible trends.
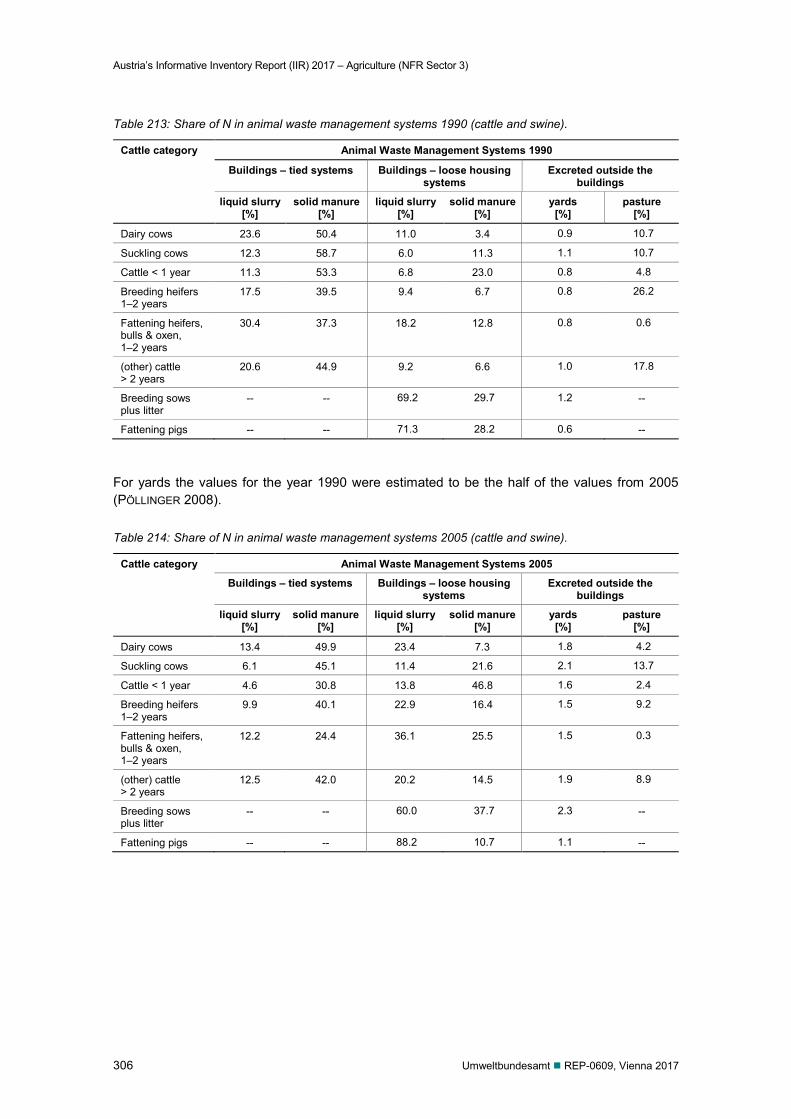
Austria’s Informative Inventory Report (IIR) 2017 – Agriculture (NFR Sector 3)
306 Umweltbundesamt REP-0609, Vienna 2017
Table 213: Share of N in animal waste management systems 1990 (cattle and swine).
Cattle category Animal Waste Management Systems 1990
Buildings – tied systems Buildings – loose housing systems
Excreted outside the buildings
liquid slurry [%]
solid manure [%]
liquid slurry [%]
solid manure [%]
yards [%]
pasture [%]
Dairy cows 23.6 50.4 11.0 3.4 0.9 10.7
Suckling cows 12.3 58.7 6.0 11.3 1.1 10.7
Cattle < 1 year 11.3 53.3 6.8 23.0 0.8 4.8
Breeding heifers 1–2 years
17.5 39.5 9.4 6.7 0.8 26.2
Fattening heifers, bulls & oxen, 1–2 years
30.4 37.3 18.2 12.8 0.8 0.6
(other) cattle > 2 years
20.6 44.9 9.2 6.6 1.0 17.8
Breeding sows plus litter
-- -- 69.2 29.7 1.2 --
Fattening pigs -- -- 71.3 28.2 0.6 --
For yards the values for the year 1990 were estimated to be the half of the values from 2005 (PÖLLINGER 2008).
Table 214: Share of N in animal waste management systems 2005 (cattle and swine).
Cattle category Animal Waste Management Systems 2005
Buildings – tied systems Buildings – loose housing systems
Excreted outside the buildings
liquid slurry [%]
solid manure [%]
liquid slurry [%]
solid manure [%]
yards [%]
pasture [%]
Dairy cows 13.4 49.9 23.4 7.3 1.8 4.2
Suckling cows 6.1 45.1 11.4 21.6 2.1 13.7
Cattle < 1 year 4.6 30.8 13.8 46.8 1.6 2.4
Breeding heifers 1–2 years
9.9 40.1 22.9 16.4 1.5 9.2
Fattening heifers, bulls & oxen, 1–2 years
12.2 24.4 36.1 25.5 1.5 0.3
(other) cattle > 2 years
12.5 42.0 20.2 14.5 1.9 8.9
Breeding sows plus litter
-- -- 60.0 37.7 2.3 --
Fattening pigs -- -- 88.2 10.7 1.1 --
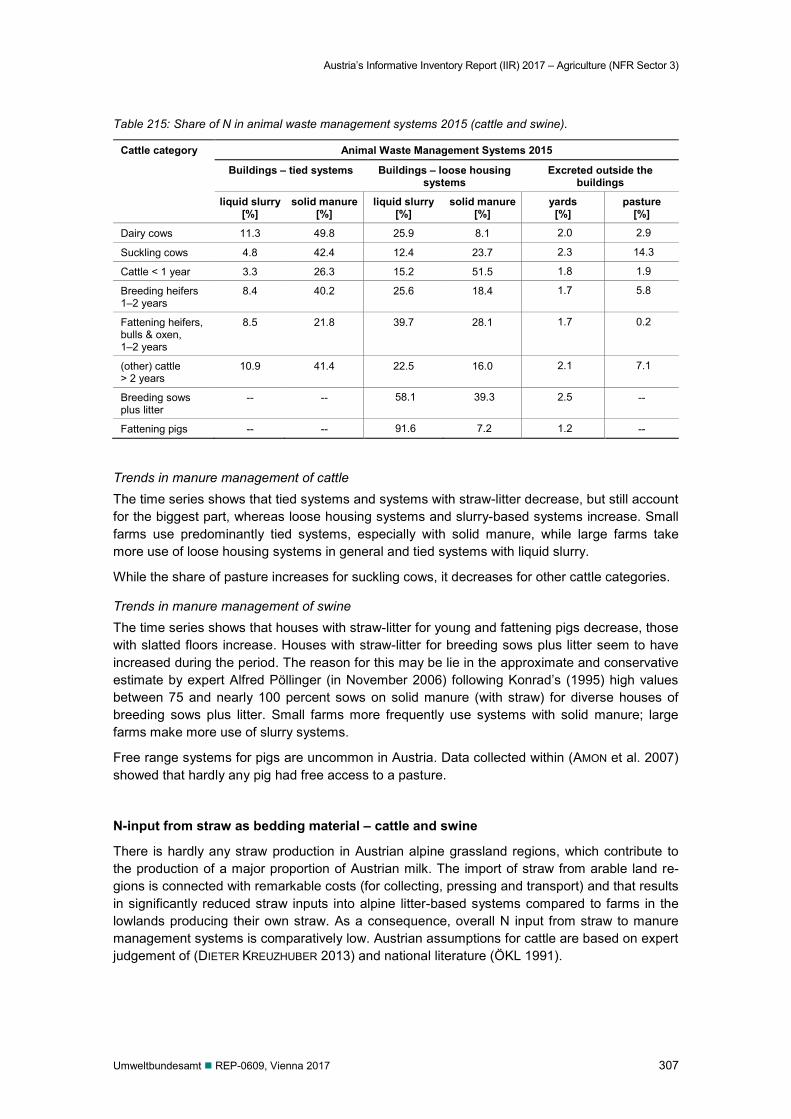
Austria’s Informative Inventory Report (IIR) 2017 – Agriculture (NFR Sector 3)
Umweltbundesamt REP-0609, Vienna 2017 307
Table 215: Share of N in animal waste management systems 2015 (cattle and swine).
Cattle category Animal Waste Management Systems 2015
Buildings – tied systems Buildings – loose housing systems
Excreted outside the buildings
liquid slurry [%]
solid manure [%]
liquid slurry [%]
solid manure [%]
yards [%]
pasture [%]
Dairy cows 11.3 49.8 25.9 8.1 2.0 2.9
Suckling cows 4.8 42.4 12.4 23.7 2.3 14.3
Cattle < 1 year 3.3 26.3 15.2 51.5 1.8 1.9
Breeding heifers 1–2 years
8.4 40.2 25.6 18.4 1.7 5.8
Fattening heifers, bulls & oxen, 1–2 years
8.5 21.8 39.7 28.1 1.7 0.2
(other) cattle > 2 years
10.9 41.4 22.5 16.0 2.1 7.1
Breeding sows plus litter
-- -- 58.1 39.3 2.5 --
Fattening pigs -- -- 91.6 7.2 1.2 --
Trends in manure management of cattle The time series shows that tied systems and systems with straw-litter decrease, but still account for the biggest part, whereas loose housing systems and slurry-based systems increase. Small farms use predominantly tied systems, especially with solid manure, while large farms take more use of loose housing systems in general and tied systems with liquid slurry.
While the share of pasture increases for suckling cows, it decreases for other cattle categories.
Trends in manure management of swine The time series shows that houses with straw-litter for young and fattening pigs decrease, those with slatted floors increase. Houses with straw-litter for breeding sows plus litter seem to have increased during the period. The reason for this may be lie in the approximate and conservative estimate by expert Alfred Pöllinger (in November 2006) following Konrad’s (1995) high values between 75 and nearly 100 percent sows on solid manure (with straw) for diverse houses of breeding sows plus litter. Small farms more frequently use systems with solid manure; large farms make more use of slurry systems.
Free range systems for pigs are uncommon in Austria. Data collected within (AMON et al. 2007) showed that hardly any pig had free access to a pasture.
N-input from straw as bedding material – cattle and swine
There is hardly any straw production in Austrian alpine grassland regions, which contribute to the production of a major proportion of Austrian milk. The import of straw from arable land re-gions is connected with remarkable costs (for collecting, pressing and transport) and that results in significantly reduced straw inputs into alpine litter-based systems compared to farms in the lowlands producing their own straw. As a consequence, overall N input from straw to manure management systems is comparatively low. Austrian assumptions for cattle are based on expert judgement of (DIETER KREUZHUBER 2013) and national literature (ÖKL 1991).
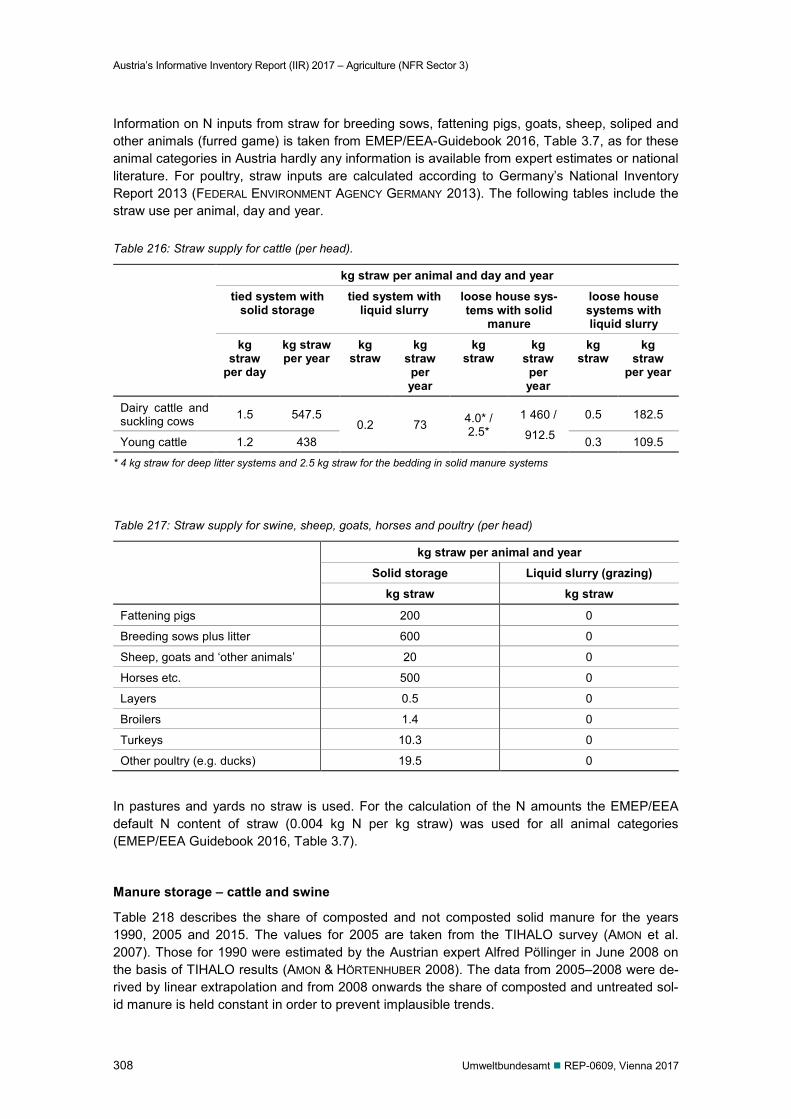
Austria’s Informative Inventory Report (IIR) 2017 – Agriculture (NFR Sector 3)
308 Umweltbundesamt REP-0609, Vienna 2017
Information on N inputs from straw for breeding sows, fattening pigs, goats, sheep, soliped and other animals (furred game) is taken from EMEP/EEA-Guidebook 2016, Table 3.7, as for these animal categories in Austria hardly any information is available from expert estimates or national literature. For poultry, straw inputs are calculated according to Germany’s National Inventory Report 2013 (FEDERAL ENVIRONMENT AGENCY GERMANY 2013). The following tables include the straw use per animal, day and year.
Table 216: Straw supply for cattle (per head).
kg straw per animal and day and year
tied system with solid storage
tied system with liquid slurry
loose house sys-tems with solid
manure
loose house systems with liquid slurry
kg straw
per day
kg straw per year
kg straw
kg straw per year
kg straw
kg straw per year
kg straw
kg straw
per year
Dairy cattle and suckling cows 1.5 547.5
0.2 73 4.0* / 2.5*
1 460 /
912.5
0.5 182.5
Young cattle 1.2 438 0.3 109.5
* 4 kg straw for deep litter systems and 2.5 kg straw for the bedding in solid manure systems
Table 217: Straw supply for swine, sheep, goats, horses and poultry (per head)
kg straw per animal and year Solid storage Liquid slurry (grazing)
kg straw kg straw
Fattening pigs 200 0
Breeding sows plus litter 600 0
Sheep, goats and ‘other animals’ 20 0
Horses etc. 500 0
Layers 0.5 0
Broilers 1.4 0
Turkeys 10.3 0
Other poultry (e.g. ducks) 19.5 0
In pastures and yards no straw is used. For the calculation of the N amounts the EMEP/EEA default N content of straw (0.004 kg N per kg straw) was used for all animal categories (EMEP/EEA Guidebook 2016, Table 3.7).
Manure storage – cattle and swine
Table 218 describes the share of composted and not composted solid manure for the years 1990, 2005 and 2015. The values for 2005 are taken from the TIHALO survey (AMON et al. 2007). Those for 1990 were estimated by the Austrian expert Alfred Pöllinger in June 2008 on the basis of TIHALO results (AMON & HÖRTENHUBER 2008). The data from 2005–2008 were de-rived by linear extrapolation and from 2008 onwards the share of composted and untreated sol-id manure is held constant in order to prevent implausible trends.
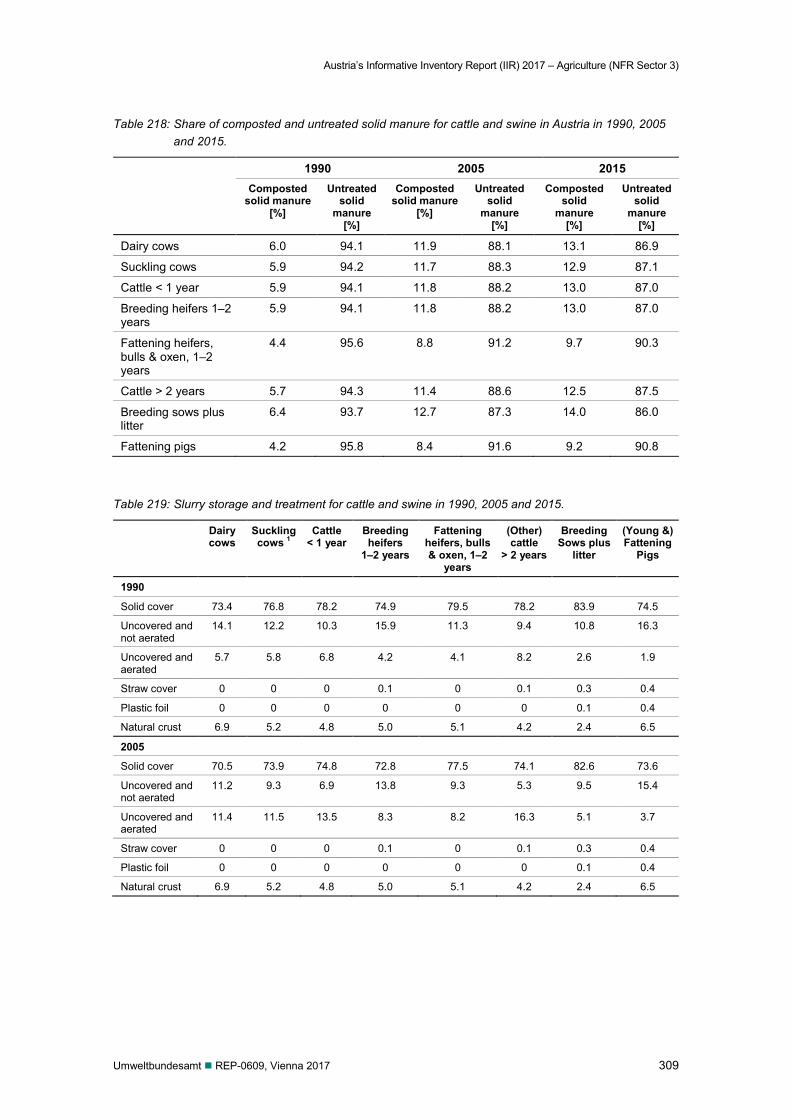
Austria’s Informative Inventory Report (IIR) 2017 – Agriculture (NFR Sector 3)
Umweltbundesamt REP-0609, Vienna 2017 309
Table 218: Share of composted and untreated solid manure for cattle and swine in Austria in 1990, 2005 and 2015.
1990 2005 2015 Composted
solid manure [%]
Untreated solid
manure [%]
Composted solid manure
[%]
Untreated solid
manure [%]
Composted solid
manure [%]
Untreated solid
manure [%]
Dairy cows 6.0 94.1 11.9 88.1 13.1 86.9
Suckling cows 5.9 94.2 11.7 88.3 12.9 87.1
Cattle < 1 year 5.9 94.1 11.8 88.2 13.0 87.0
Breeding heifers 1–2 years
5.9 94.1 11.8 88.2 13.0 87.0
Fattening heifers, bulls & oxen, 1–2 years
4.4 95.6 8.8 91.2 9.7 90.3
Cattle > 2 years 5.7 94.3 11.4 88.6 12.5 87.5
Breeding sows plus litter
6.4 93.7 12.7 87.3 14.0 86.0
Fattening pigs 4.2 95.8 8.4 91.6 9.2 90.8
Table 219: Slurry storage and treatment for cattle and swine in 1990, 2005 and 2015.
Dairy cows
Suckling cows 1
Cattle < 1 year
Breeding heifers
1–2 years
Fattening heifers, bulls & oxen, 1–2
years
(Other) cattle
> 2 years
Breeding Sows plus
litter
(Young &) Fattening
Pigs
1990
Solid cover 73.4 76.8 78.2 74.9 79.5 78.2 83.9 74.5
Uncovered and not aerated
14.1 12.2 10.3 15.9 11.3 9.4 10.8 16.3
Uncovered and aerated
5.7 5.8 6.8 4.2 4.1 8.2 2.6 1.9
Straw cover 0 0 0 0.1 0 0.1 0.3 0.4
Plastic foil 0 0 0 0 0 0 0.1 0.4
Natural crust 6.9 5.2 4.8 5.0 5.1 4.2 2.4 6.5
2005
Solid cover 70.5 73.9 74.8 72.8 77.5 74.1 82.6 73.6
Uncovered and not aerated
11.2 9.3 6.9 13.8 9.3 5.3 9.5 15.4
Uncovered and aerated
11.4 11.5 13.5 8.3 8.2 16.3 5.1 3.7
Straw cover 0 0 0 0.1 0 0.1 0.3 0.4
Plastic foil 0 0 0 0 0 0 0.1 0.4
Natural crust 6.9 5.2 4.8 5.0 5.1 4.2 2.4 6.5
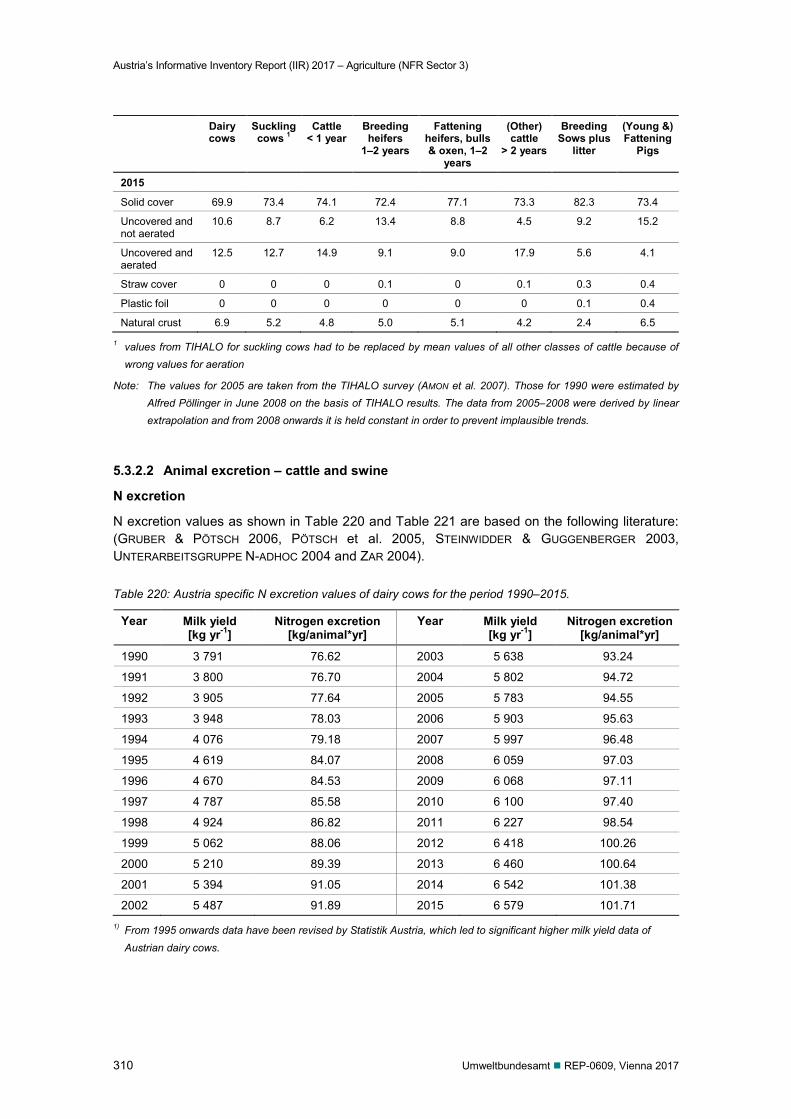
Austria’s Informative Inventory Report (IIR) 2017 – Agriculture (NFR Sector 3)
310 Umweltbundesamt REP-0609, Vienna 2017
Dairy cows
Suckling cows 1
Cattle < 1 year
Breeding heifers
1–2 years
Fattening heifers, bulls & oxen, 1–2
years
(Other) cattle
> 2 years
Breeding Sows plus
litter
(Young &) Fattening
Pigs
2015
Solid cover 69.9 73.4 74.1 72.4 77.1 73.3 82.3 73.4
Uncovered and not aerated
10.6 8.7 6.2 13.4 8.8 4.5 9.2 15.2
Uncovered and aerated
12.5 12.7 14.9 9.1 9.0 17.9 5.6 4.1
Straw cover 0 0 0 0.1 0 0.1 0.3 0.4
Plastic foil 0 0 0 0 0 0 0.1 0.4
Natural crust 6.9 5.2 4.8 5.0 5.1 4.2 2.4 6.5
1 values from TIHALO for suckling cows had to be replaced by mean values of all other classes of cattle because of wrong values for aeration
Note: The values for 2005 are taken from the TIHALO survey (AMON et al. 2007). Those for 1990 were estimated by Alfred Pöllinger in June 2008 on the basis of TIHALO results. The data from 2005–2008 were derived by linear extrapolation and from 2008 onwards it is held constant in order to prevent implausible trends.
5.3.2.2 Animal excretion – cattle and swine
N excretion
N excretion values as shown in Table 220 and Table 221 are based on the following literature: (GRUBER & PÖTSCH 2006, PÖTSCH et al. 2005, STEINWIDDER & GUGGENBERGER 2003, UNTERARBEITSGRUPPE N-ADHOC 2004 and ZAR 2004).
Table 220: Austria specific N excretion values of dairy cows for the period 1990–2015.
Year Milk yield [kg yr-1]
Nitrogen excretion [kg/animal*yr]
Year Milk yield [kg yr-1]
Nitrogen excretion [kg/animal*yr]
1990 3 791 76.62 2003 5 638 93.24
1991 3 800 76.70 2004 5 802 94.72
1992 3 905 77.64 2005 5 783 94.55
1993 3 948 78.03 2006 5 903 95.63
1994 4 076 79.18 2007 5 997 96.48
1995 4 619 84.07 2008 6 059 97.03
1996 4 670 84.53 2009 6 068 97.11
1997 4 787 85.58 2010 6 100 97.40
1998 4 924 86.82 2011 6 227 98.54
1999 5 062 88.06 2012 6 418 100.26
2000 5 210 89.39 2013 6 460 100.64
2001 5 394 91.05 2014 6 542 101.38
2002 5 487 91.89 2015 6 579 101.71 1) From 1995 onwards data have been revised by Statistik Austria, which led to significant higher milk yield data of
Austrian dairy cows.
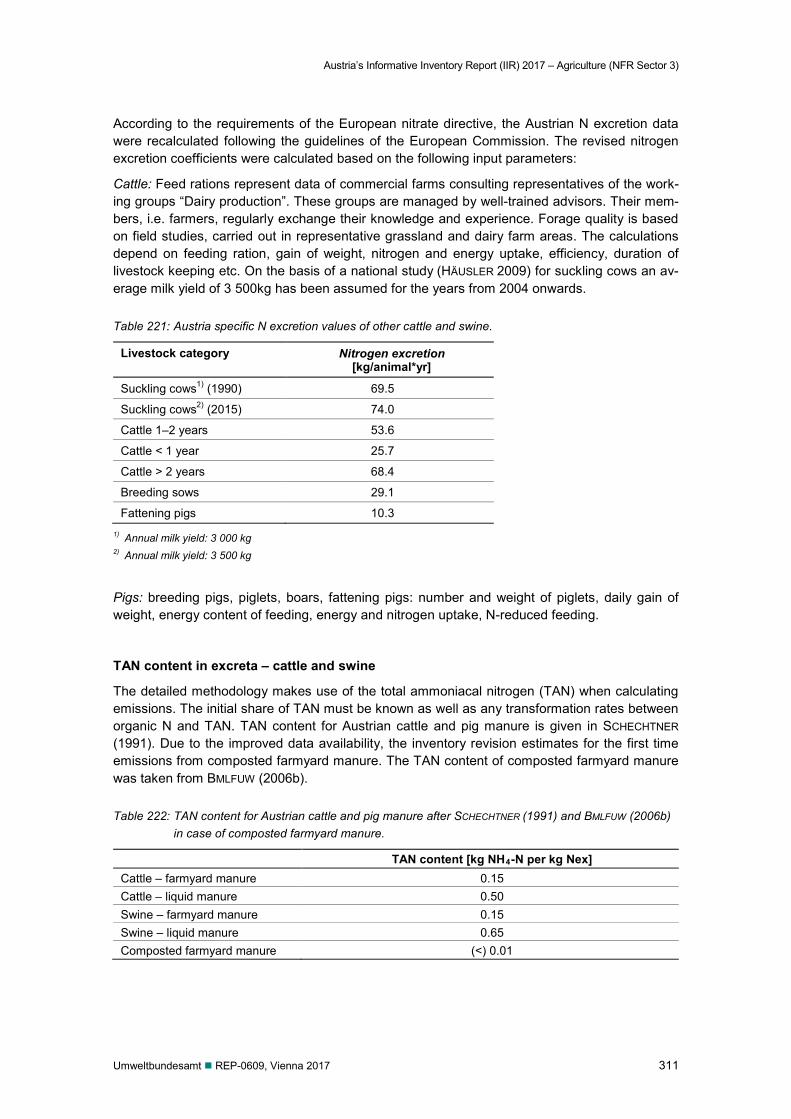
Austria’s Informative Inventory Report (IIR) 2017 – Agriculture (NFR Sector 3)
Umweltbundesamt REP-0609, Vienna 2017 311
According to the requirements of the European nitrate directive, the Austrian N excretion data were recalculated following the guidelines of the European Commission. The revised nitrogen excretion coefficients were calculated based on the following input parameters:
Cattle: Feed rations represent data of commercial farms consulting representatives of the work-ing groups “Dairy production”. These groups are managed by well-trained advisors. Their mem-bers, i.e. farmers, regularly exchange their knowledge and experience. Forage quality is based on field studies, carried out in representative grassland and dairy farm areas. The calculations depend on feeding ration, gain of weight, nitrogen and energy uptake, efficiency, duration of livestock keeping etc. On the basis of a national study (HÄUSLER 2009) for suckling cows an av-erage milk yield of 3 500kg has been assumed for the years from 2004 onwards.
Table 221: Austria specific N excretion values of other cattle and swine.
Livestock category Nitrogen excretion [kg/animal*yr]
Suckling cows1) (1990) 69.5
Suckling cows2) (2015) 74.0
Cattle 1–2 years 53.6
Cattle < 1 year 25.7
Cattle > 2 years 68.4
Breeding sows 29.1
Fattening pigs 10.3 1) Annual milk yield: 3 000 kg 2) Annual milk yield: 3 500 kg
Pigs: breeding pigs, piglets, boars, fattening pigs: number and weight of piglets, daily gain of weight, energy content of feeding, energy and nitrogen uptake, N-reduced feeding.
TAN content in excreta – cattle and swine
The detailed methodology makes use of the total ammoniacal nitrogen (TAN) when calculating emissions. The initial share of TAN must be known as well as any transformation rates between organic N and TAN. TAN content for Austrian cattle and pig manure is given in SCHECHTNER (1991). Due to the improved data availability, the inventory revision estimates for the first time emissions from composted farmyard manure. The TAN content of composted farmyard manure was taken from BMLFUW (2006b).
Table 222: TAN content for Austrian cattle and pig manure after SCHECHTNER (1991) and BMLFUW (2006b) in case of composted farmyard manure.
TAN content [kg NH4-N per kg Nex] Cattle – farmyard manure 0.15 Cattle – liquid manure 0.50 Swine – farmyard manure 0.15 Swine – liquid manure 0.65 Composted farmyard manure (<) 0.01
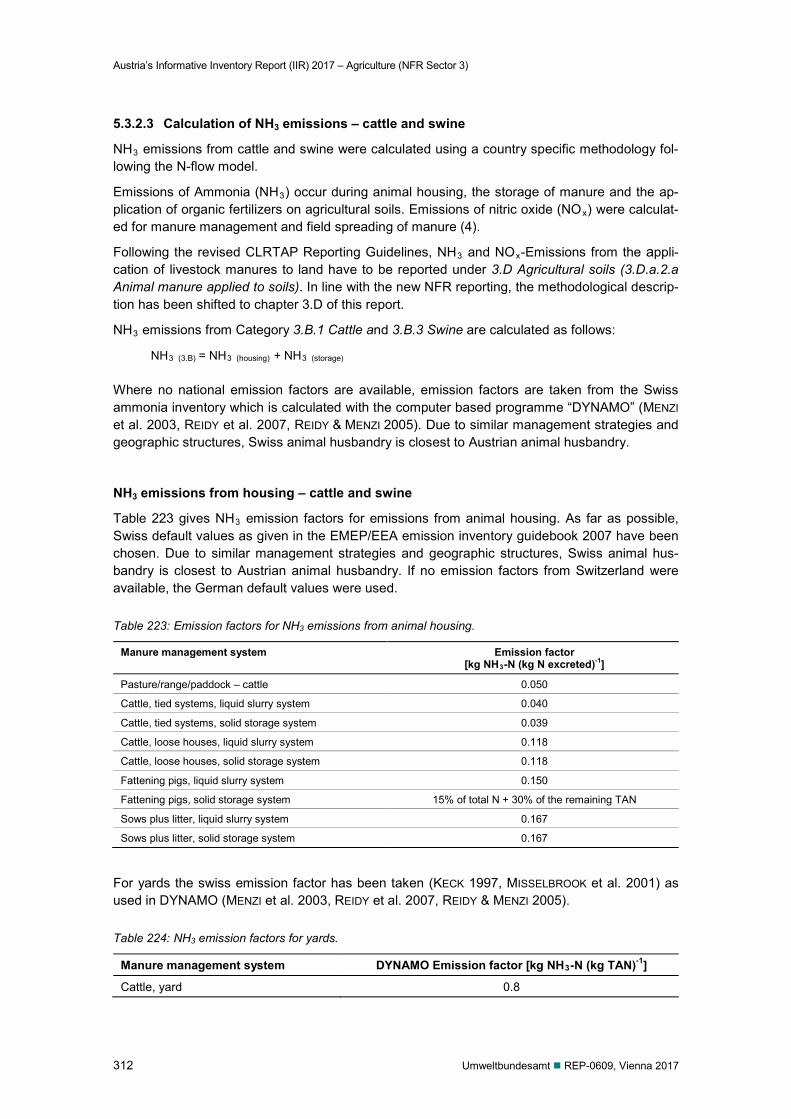
Austria’s Informative Inventory Report (IIR) 2017 – Agriculture (NFR Sector 3)
312 Umweltbundesamt REP-0609, Vienna 2017
5.3.2.3 Calculation of NH3 emissions – cattle and swine
NH3 emissions from cattle and swine were calculated using a country specific methodology fol-lowing the N-flow model.
Emissions of Ammonia (NH3) occur during animal housing, the storage of manure and the ap-plication of organic fertilizers on agricultural soils. Emissions of nitric oxide (NOx) were calculat-ed for manure management and field spreading of manure (4).
Following the revised CLRTAP Reporting Guidelines, NH3 and NOx-Emissions from the appli-cation of livestock manures to land have to be reported under 3.D Agricultural soils (3.D.a.2.a Animal manure applied to soils). In line with the new NFR reporting, the methodological descrip-tion has been shifted to chapter 3.D of this report.
NH3 emissions from Category 3.B.1 Cattle and 3.B.3 Swine are calculated as follows:
NH3 (3.B) = NH3 (housing) + NH3 (storage)
Where no national emission factors are available, emission factors are taken from the Swiss ammonia inventory which is calculated with the computer based programme “DYNAMO” (MENZI et al. 2003, REIDY et al. 2007, REIDY & MENZI 2005). Due to similar management strategies and geographic structures, Swiss animal husbandry is closest to Austrian animal husbandry.
NH3 emissions from housing – cattle and swine
Table 223 gives NH3 emission factors for emissions from animal housing. As far as possible, Swiss default values as given in the EMEP/EEA emission inventory guidebook 2007 have been chosen. Due to similar management strategies and geographic structures, Swiss animal hus-bandry is closest to Austrian animal husbandry. If no emission factors from Switzerland were available, the German default values were used.
Table 223: Emission factors for NH3 emissions from animal housing.
Manure management system Emission factor [kg NH3-N (kg N excreted)-1]
Pasture/range/paddock – cattle 0.050
Cattle, tied systems, liquid slurry system 0.040
Cattle, tied systems, solid storage system 0.039
Cattle, loose houses, liquid slurry system 0.118
Cattle, loose houses, solid storage system 0.118
Fattening pigs, liquid slurry system 0.150
Fattening pigs, solid storage system 15% of total N + 30% of the remaining TAN
Sows plus litter, liquid slurry system 0.167
Sows plus litter, solid storage system 0.167
For yards the swiss emission factor has been taken (KECK 1997, MISSELBROOK et al. 2001) as used in DYNAMO (MENZI et al. 2003, REIDY et al. 2007, REIDY & MENZI 2005).
Table 224: NH3 emission factors for yards.
Manure management system DYNAMO Emission factor [kg NH3-N (kg TAN)-1]
Cattle, yard 0.8
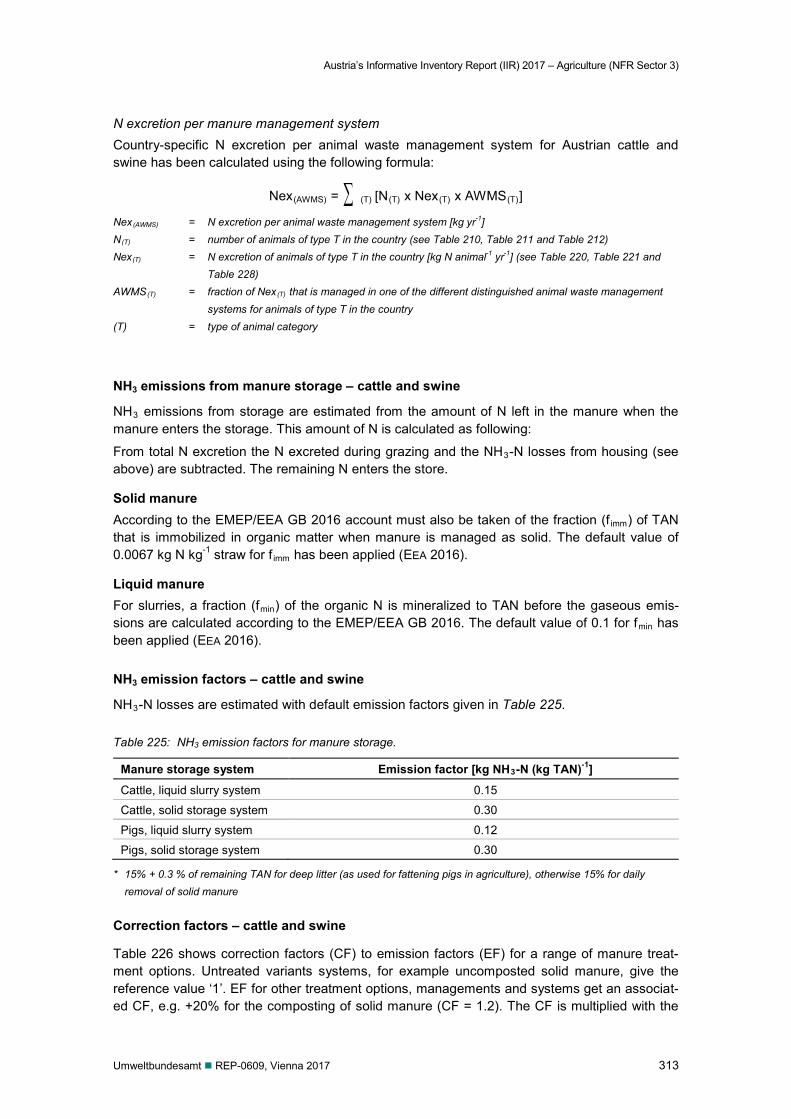
Austria’s Informative Inventory Report (IIR) 2017 – Agriculture (NFR Sector 3)
Umweltbundesamt REP-0609, Vienna 2017 313
N excretion per manure management system Country-specific N excretion per animal waste management system for Austrian cattle and swine has been calculated using the following formula:
Nex(AWMS) = ∑ (T) [N(T) x Nex(T) x AWMS(T)]
Nex(AWMS) = N excretion per animal waste management system [kg yr-1] N(T) = number of animals of type T in the country (see Table 210, Table 211 and Table 212) Nex(T) = N excretion of animals of type T in the country [kg N animal-1 yr-1] (see Table 220, Table 221 and
Table 228) AWMS(T) = fraction of Nex(T) that is managed in one of the different distinguished animal waste management
systems for animals of type T in the country (T) = type of animal category
NH3 emissions from manure storage – cattle and swine
NH3 emissions from storage are estimated from the amount of N left in the manure when the manure enters the storage. This amount of N is calculated as following:
From total N excretion the N excreted during grazing and the NH3-N losses from housing (see above) are subtracted. The remaining N enters the store.
Solid manure According to the EMEP/EEA GB 2016 account must also be taken of the fraction (f imm) of TAN that is immobilized in organic matter when manure is managed as solid. The default value of 0.0067 kg N kg-1 straw for f imm has been applied (EEA 2016).
Liquid manure For slurries, a fraction (fmin) of the organic N is mineralized to TAN before the gaseous emis-sions are calculated according to the EMEP/EEA GB 2016. The default value of 0.1 for fmin has been applied (EEA 2016). NH3 emission factors – cattle and swine
NH3-N losses are estimated with default emission factors given in Table 225.
Table 225: NH3 emission factors for manure storage.
Manure storage system Emission factor [kg NH3-N (kg TAN)-1]
Cattle, liquid slurry system 0.15
Cattle, solid storage system 0.30
Pigs, liquid slurry system 0.12
Pigs, solid storage system 0.30
* 15% + 0.3 % of remaining TAN for deep litter (as used for fattening pigs in agriculture), otherwise 15% for daily removal of solid manure
Correction factors – cattle and swine
Table 226 shows correction factors (CF) to emission factors (EF) for a range of manure treat-ment options. Untreated variants systems, for example uncomposted solid manure, give the reference value ‘1’. EF for other treatment options, managements and systems get an associat-ed CF, e.g. +20% for the composting of solid manure (CF = 1.2). The CF is multiplied with the
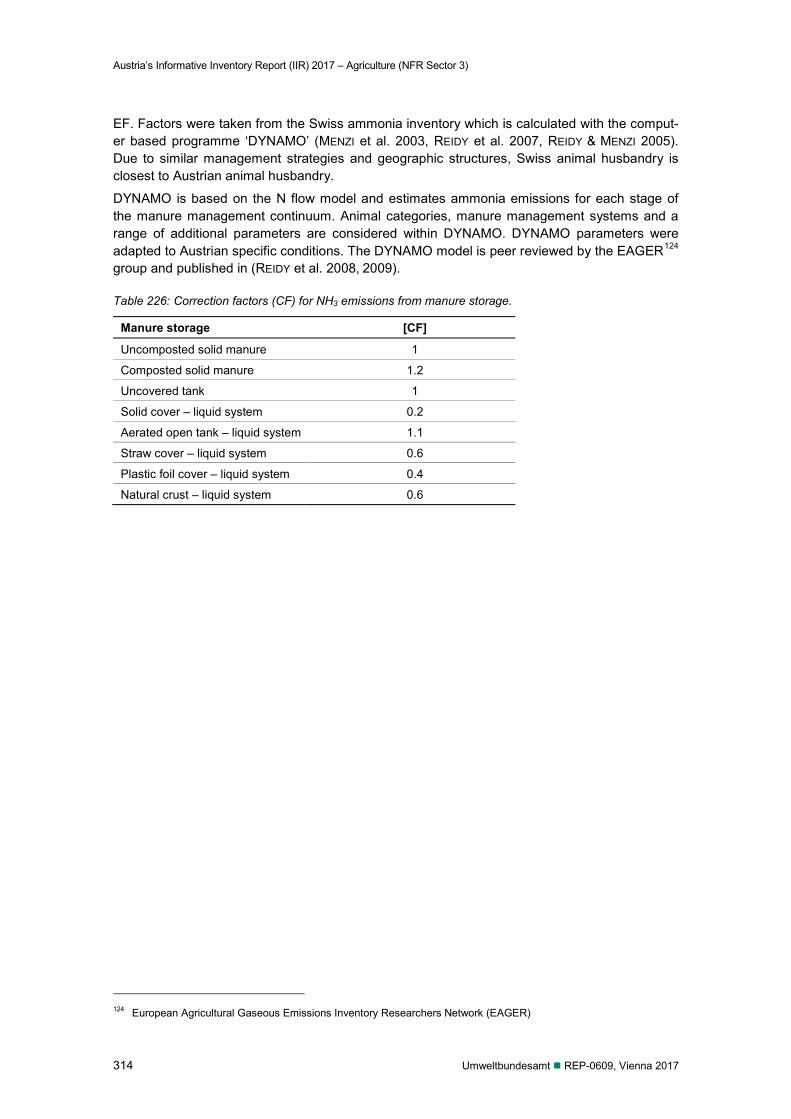
Austria’s Informative Inventory Report (IIR) 2017 – Agriculture (NFR Sector 3)
314 Umweltbundesamt REP-0609, Vienna 2017
EF. Factors were taken from the Swiss ammonia inventory which is calculated with the comput-er based programme ‘DYNAMO’ (MENZI et al. 2003, REIDY et al. 2007, REIDY & MENZI 2005). Due to similar management strategies and geographic structures, Swiss animal husbandry is closest to Austrian animal husbandry.
DYNAMO is based on the N flow model and estimates ammonia emissions for each stage of the manure management continuum. Animal categories, manure management systems and a range of additional parameters are considered within DYNAMO. DYNAMO parameters were adapted to Austrian specific conditions. The DYNAMO model is peer reviewed by the EAGER124 group and published in (REIDY et al. 2008, 2009).
Table 226: Correction factors (CF) for NH3 emissions from manure storage.
Manure storage [CF]
Uncomposted solid manure 1
Composted solid manure 1.2
Uncovered tank 1
Solid cover – liquid system 0.2
Aerated open tank – liquid system 1.1
Straw cover – liquid system 0.6
Plastic foil cover – liquid system 0.4
Natural crust – liquid system 0.6
124 European Agricultural Gaseous Emissions Inventory Researchers Network (EAGER)
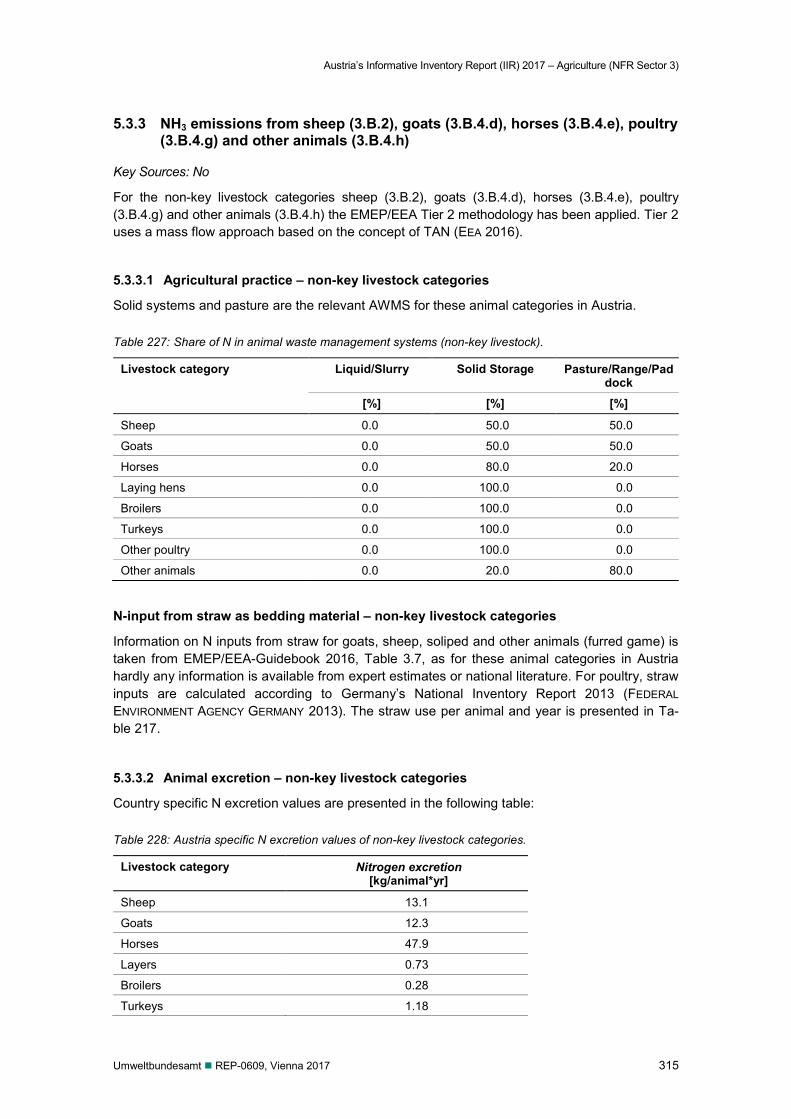
Austria’s Informative Inventory Report (IIR) 2017 – Agriculture (NFR Sector 3)
Umweltbundesamt REP-0609, Vienna 2017 315
5.3.3 NH3 emissions from sheep (3.B.2), goats (3.B.4.d), horses (3.B.4.e), poultry (3.B.4.g) and other animals (3.B.4.h)
Key Sources: No
For the non-key livestock categories sheep (3.B.2), goats (3.B.4.d), horses (3.B.4.e), poultry (3.B.4.g) and other animals (3.B.4.h) the EMEP/EEA Tier 2 methodology has been applied. Tier 2 uses a mass flow approach based on the concept of TAN (EEA 2016).
5.3.3.1 Agricultural practice – non-key livestock categories
Solid systems and pasture are the relevant AWMS for these animal categories in Austria.
Table 227: Share of N in animal waste management systems (non-key livestock).
Livestock category Liquid/Slurry Solid Storage Pasture/Range/Paddock
[%] [%] [%]
Sheep 0.0 50.0 50.0
Goats 0.0 50.0 50.0
Horses 0.0 80.0 20.0
Laying hens 0.0 100.0 0.0
Broilers 0.0 100.0 0.0
Turkeys 0.0 100.0 0.0
Other poultry 0.0 100.0 0.0
Other animals 0.0 20.0 80.0
N-input from straw as bedding material – non-key livestock categories
Information on N inputs from straw for goats, sheep, soliped and other animals (furred game) is taken from EMEP/EEA-Guidebook 2016, Table 3.7, as for these animal categories in Austria hardly any information is available from expert estimates or national literature. For poultry, straw inputs are calculated according to Germany’s National Inventory Report 2013 (FEDERAL ENVIRONMENT AGENCY GERMANY 2013). The straw use per animal and year is presented in Ta-ble 217.
5.3.3.2 Animal excretion – non-key livestock categories
Country specific N excretion values are presented in the following table:
Table 228: Austria specific N excretion values of non-key livestock categories.
Livestock category Nitrogen excretion [kg/animal*yr]
Sheep 13.1
Goats 12.3
Horses 47.9
Layers 0.73
Broilers 0.28
Turkeys 1.18
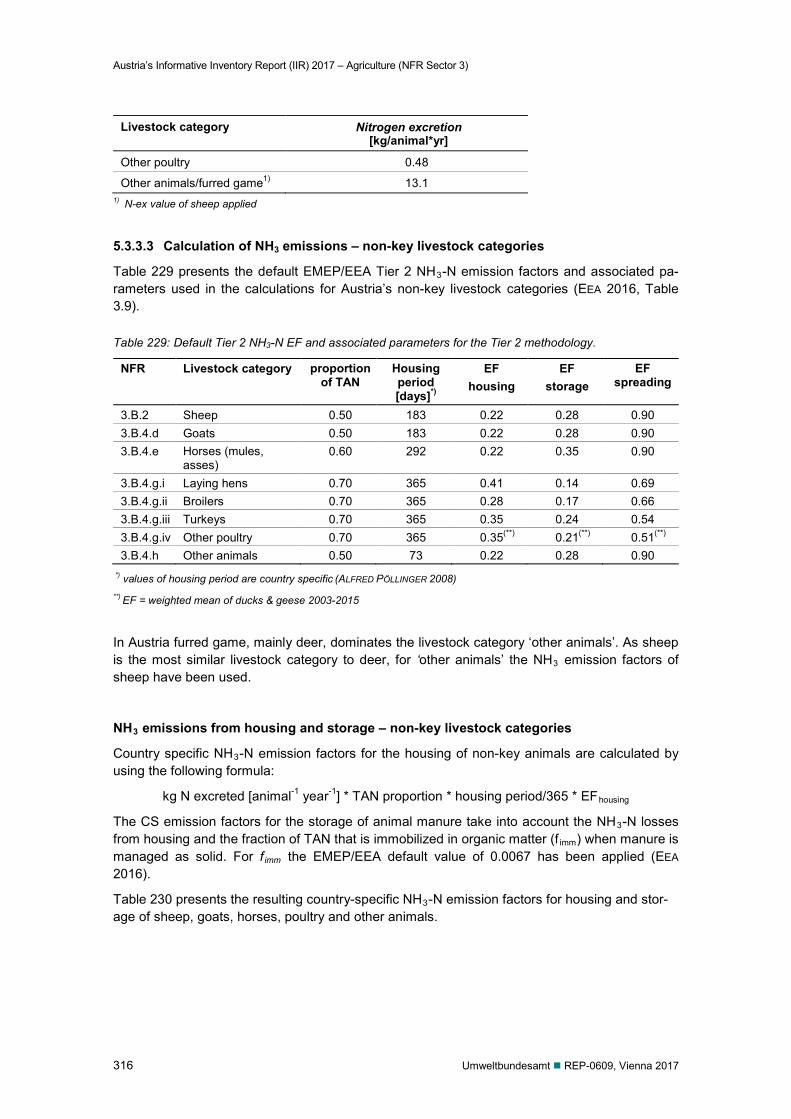
Austria’s Informative Inventory Report (IIR) 2017 – Agriculture (NFR Sector 3)
316 Umweltbundesamt REP-0609, Vienna 2017
Livestock category Nitrogen excretion [kg/animal*yr]
Other poultry 0.48
Other animals/furred game1) 13.1 1) N-ex value of sheep applied
5.3.3.3 Calculation of NH3 emissions – non-key livestock categories
Table 229 presents the default EMEP/EEA Tier 2 NH3-N emission factors and associated pa-rameters used in the calculations for Austria’s non-key livestock categories (EEA 2016, Table 3.9).
Table 229: Default Tier 2 NH3-N EF and associated parameters for the Tier 2 methodology.
NFR Livestock category proportion of TAN
Housing period [days]*)
EF housing
EF storage
EF spreading
3.B.2 Sheep 0.50 183 0.22 0.28 0.90 3.B.4.d Goats 0.50 183 0.22 0.28 0.90 3.B.4.e Horses (mules,
asses) 0.60 292 0.22 0.35 0.90
3.B.4.g.i Laying hens 0.70 365 0.41 0.14 0.69 3.B.4.g.ii Broilers 0.70 365 0.28 0.17 0.66 3.B.4.g.iii Turkeys 0.70 365 0.35 0.24 0.54 3.B.4.g.iv Other poultry 0.70 365 0.35(**) 0.21(**) 0.51(**) 3.B.4.h Other animals 0.50 73 0.22 0.28 0.90
*) values of housing period are country specific (ALFRED PÖLLINGER 2008) **) EF = weighted mean of ducks & geese 2003-2015
In Austria furred game, mainly deer, dominates the livestock category ‘other animals’. As sheep is the most similar livestock category to deer, for ‘other animals’ the NH3 emission factors of sheep have been used.
NH3 emissions from housing and storage – non-key livestock categories
Country specific NH3-N emission factors for the housing of non-key animals are calculated by using the following formula:
kg N excreted [animal-1 year-1] * TAN proportion * housing period/365 * EFhousing
The CS emission factors for the storage of animal manure take into account the NH3-N losses from housing and the fraction of TAN that is immobilized in organic matter (f imm) when manure is managed as solid. For f imm the EMEP/EEA default value of 0.0067 has been applied (EEA 2016).
Table 230 presents the resulting country-specific NH3-N emission factors for housing and stor-age of sheep, goats, horses, poultry and other animals.
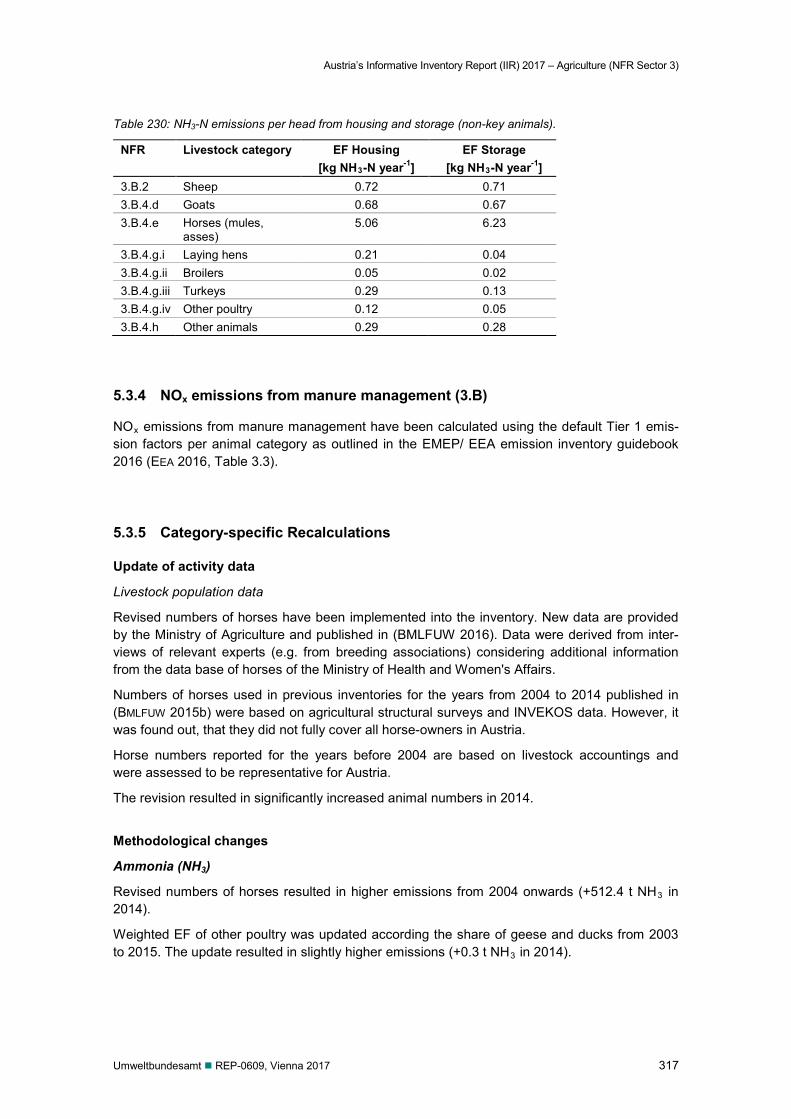
Austria’s Informative Inventory Report (IIR) 2017 – Agriculture (NFR Sector 3)
Umweltbundesamt REP-0609, Vienna 2017 317
Table 230: NH3-N emissions per head from housing and storage (non-key animals).
NFR Livestock category EF Housing [kg NH3-N year-1]
EF Storage [kg NH3-N year-1]
3.B.2 Sheep 0.72 0.71 3.B.4.d Goats 0.68 0.67 3.B.4.e Horses (mules,
asses) 5.06 6.23
3.B.4.g.i Laying hens 0.21 0.04 3.B.4.g.ii Broilers 0.05 0.02 3.B.4.g.iii Turkeys 0.29 0.13 3.B.4.g.iv Other poultry 0.12 0.05 3.B.4.h Other animals 0.29 0.28
5.3.4 NOx emissions from manure management (3.B)
NOx emissions from manure management have been calculated using the default Tier 1 emis-sion factors per animal category as outlined in the EMEP/ EEA emission inventory guidebook 2016 (EEA 2016, Table 3.3).
5.3.5 Category-specific Recalculations
Update of activity data
Livestock population data
Revised numbers of horses have been implemented into the inventory. New data are provided by the Ministry of Agriculture and published in (BMLFUW 2016). Data were derived from inter-views of relevant experts (e.g. from breeding associations) considering additional information from the data base of horses of the Ministry of Health and Women's Affairs.
Numbers of horses used in previous inventories for the years from 2004 to 2014 published in (BMLFUW 2015b) were based on agricultural structural surveys and INVEKOS data. However, it was found out, that they did not fully cover all horse-owners in Austria.
Horse numbers reported for the years before 2004 are based on livestock accountings and were assessed to be representative for Austria.
The revision resulted in significantly increased animal numbers in 2014.
Methodological changes
Ammonia (NH3)
Revised numbers of horses resulted in higher emissions from 2004 onwards (+512.4 t NH3 in 2014).
Weighted EF of other poultry was updated according the share of geese and ducks from 2003 to 2015. The update resulted in slightly higher emissions (+0.3 t NH3 in 2014).
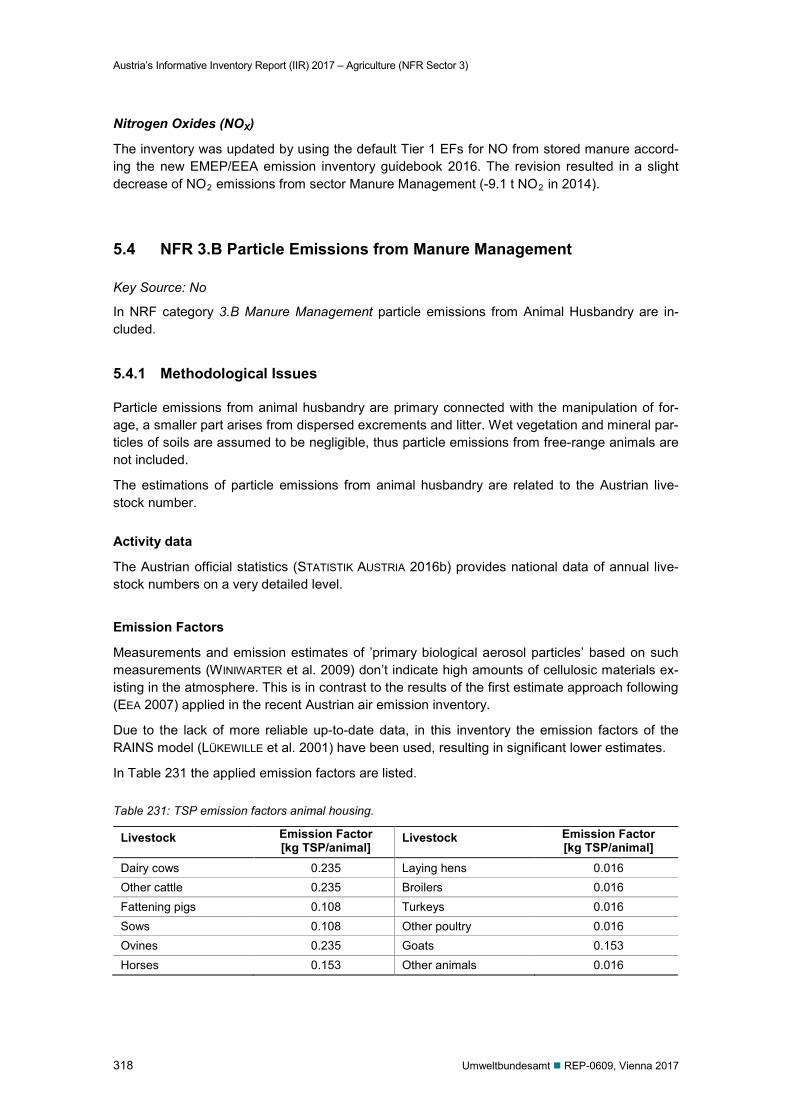
Austria’s Informative Inventory Report (IIR) 2017 – Agriculture (NFR Sector 3)
318 Umweltbundesamt REP-0609, Vienna 2017
Nitrogen Oxides (NOX)
The inventory was updated by using the default Tier 1 EFs for NO from stored manure accord-ing the new EMEP/EEA emission inventory guidebook 2016. The revision resulted in a slight decrease of NO2 emissions from sector Manure Management (-9.1 t NO2 in 2014).
5.4 NFR 3.B Particle Emissions from Manure Management
Key Source: No
In NRF category 3.B Manure Management particle emissions from Animal Husbandry are in-cluded.
5.4.1 Methodological Issues
Particle emissions from animal husbandry are primary connected with the manipulation of for-age, a smaller part arises from dispersed excrements and litter. Wet vegetation and mineral par-ticles of soils are assumed to be negligible, thus particle emissions from free-range animals are not included.
The estimations of particle emissions from animal husbandry are related to the Austrian live-stock number. Activity data
The Austrian official statistics (STATISTIK AUSTRIA 2016b) provides national data of annual live-stock numbers on a very detailed level.
Emission Factors
Measurements and emission estimates of ’primary biological aerosol particles’ based on such measurements (WINIWARTER et al. 2009) don’t indicate high amounts of cellulosic materials ex-isting in the atmosphere. This is in contrast to the results of the first estimate approach following (EEA 2007) applied in the recent Austrian air emission inventory.
Due to the lack of more reliable up-to-date data, in this inventory the emission factors of the RAINS model (LÜKEWILLE et al. 2001) have been used, resulting in significant lower estimates.
In Table 231 the applied emission factors are listed.
Table 231: TSP emission factors animal housing.
Livestock Emission Factor [kg TSP/animal]
Livestock Emission Factor [kg TSP/animal]
Dairy cows 0.235 Laying hens 0.016 Other cattle 0.235 Broilers 0.016 Fattening pigs 0.108 Turkeys 0.016 Sows 0.108 Other poultry 0.016 Ovines 0.235 Goats 0.153 Horses 0.153 Other animals 0.016
Austria’s Informative Inventory Report (IIR) 2017 – Agriculture (NFR Sector 3)
Umweltbundesamt REP-0609, Vienna 2017 319
Following (KLIMONT et al. 2002) the share of PM10 in TSP is assumed to be 45% and the share of PM2.5 in TSP is assumed to be 10%.
5.4.2 Category-specific Recalculations
In previous submissions PM emissions from animal husbandry were reported for all livestock categories under 3.I Other. Following a recommendation of the CLRTAP stage 3-review 2010 in the current submission PM emissions are reported for the respective livestock categories under 3.B Manure Management.
5.5 NFR 3.D Agricultural Soils
NFR sector 3.D Agricultural Soils includes emissions of ammonia (NH3), nitric oxide (NOx), NMVOC and particulate matter (TSP, PM). The methodology for estimating PM emissions is presented in a separate chapter (Chapter 5.6).
5.5.1 Methodological Issues
In the Austrian inventory source category 3.D Agricultural Soils comprises NH3 and NOx emis-sions from: Application of inorganic N fertilizers(3.D.a.1); Application of organic N fertilizers (3.D.a.2) including: Animal manure applied to soils (3.D.a.2.a). This emission source is reported under NFR cat-
egory 3.D Agricultural Soils in compliance with the revised CLRTAP Reporting Guidelines 2014. Up to submission 2015 NH3 emissions from this source were reported under source category 4.B Manure management.
Sewage sludge applied to soils (3.D.a.2.b) and Other organic fertilizers applied to soils (3.D.a.2.c), which comprises N inputs from digested
energy crops in biogas slurry and compost. NH3 emissions from: Urine and dung deposited by grazing animals (3.D.a.3) and NMVOC emissions from: Cultivated crops (3.D.e)
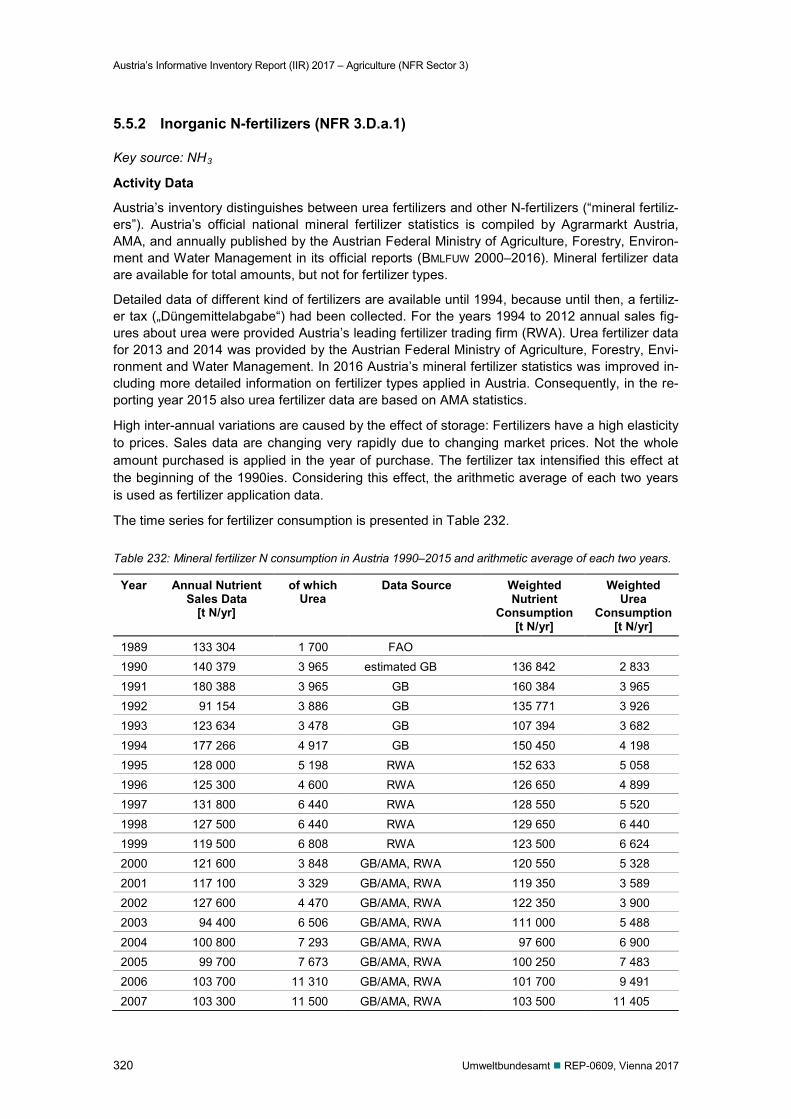
Austria’s Informative Inventory Report (IIR) 2017 – Agriculture (NFR Sector 3)
320 Umweltbundesamt REP-0609, Vienna 2017
5.5.2 Inorganic N-fertilizers (NFR 3.D.a.1)
Key source: NH3
Activity Data
Austria’s inventory distinguishes between urea fertilizers and other N-fertilizers (“mineral fertiliz-ers”). Austria’s official national mineral fertilizer statistics is compiled by Agrarmarkt Austria, AMA, and annually published by the Austrian Federal Ministry of Agriculture, Forestry, Environ-ment and Water Management in its official reports (BMLFUW 2000–2016). Mineral fertilizer data are available for total amounts, but not for fertilizer types.
Detailed data of different kind of fertilizers are available until 1994, because until then, a fertiliz-er tax („Düngemittelabgabe“) had been collected. For the years 1994 to 2012 annual sales fig-ures about urea were provided Austria’s leading fertilizer trading firm (RWA). Urea fertilizer data for 2013 and 2014 was provided by the Austrian Federal Ministry of Agriculture, Forestry, Envi-ronment and Water Management. In 2016 Austria’s mineral fertilizer statistics was improved in-cluding more detailed information on fertilizer types applied in Austria. Consequently, in the re-porting year 2015 also urea fertilizer data are based on AMA statistics.
High inter-annual variations are caused by the effect of storage: Fertilizers have a high elasticity to prices. Sales data are changing very rapidly due to changing market prices. Not the whole amount purchased is applied in the year of purchase. The fertilizer tax intensified this effect at the beginning of the 1990ies. Considering this effect, the arithmetic average of each two years is used as fertilizer application data.
The time series for fertilizer consumption is presented in Table 232.
Table 232: Mineral fertilizer N consumption in Austria 1990–2015 and arithmetic average of each two years.
Year Annual Nutrient Sales Data
[t N/yr]
of which Urea
Data Source Weighted Nutrient
Consumption [t N/yr]
Weighted Urea
Consumption [t N/yr]
1989 133 304 1 700 FAO 1990 140 379 3 965 estimated GB 136 842 2 833 1991 180 388 3 965 GB 160 384 3 965 1992 91 154 3 886 GB 135 771 3 926 1993 123 634 3 478 GB 107 394 3 682 1994 177 266 4 917 GB 150 450 4 198 1995 128 000 5 198 RWA 152 633 5 058 1996 125 300 4 600 RWA 126 650 4 899 1997 131 800 6 440 RWA 128 550 5 520 1998 127 500 6 440 RWA 129 650 6 440 1999 119 500 6 808 RWA 123 500 6 624 2000 121 600 3 848 GB/AMA, RWA 120 550 5 328 2001 117 100 3 329 GB/AMA, RWA 119 350 3 589 2002 127 600 4 470 GB/AMA, RWA 122 350 3 900 2003 94 400 6 506 GB/AMA, RWA 111 000 5 488 2004 100 800 7 293 GB/AMA, RWA 97 600 6 900 2005 99 700 7 673 GB/AMA, RWA 100 250 7 483 2006 103 700 11 310 GB/AMA, RWA 101 700 9 491 2007 103 300 11 500 GB/AMA, RWA 103 500 11 405
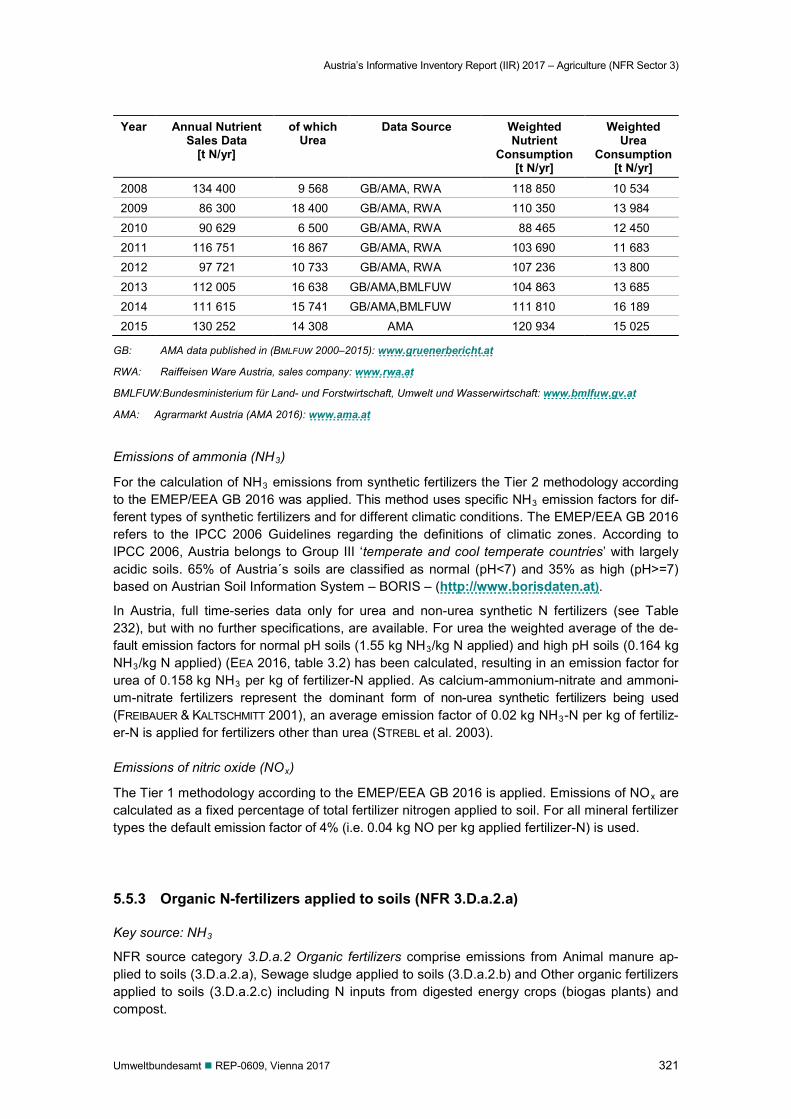
Austria’s Informative Inventory Report (IIR) 2017 – Agriculture (NFR Sector 3)
Umweltbundesamt REP-0609, Vienna 2017 321
Year Annual Nutrient Sales Data
[t N/yr]
of which Urea
Data Source Weighted Nutrient
Consumption [t N/yr]
Weighted Urea
Consumption [t N/yr]
2008 134 400 9 568 GB/AMA, RWA 118 850 10 534 2009 86 300 18 400 GB/AMA, RWA 110 350 13 984 2010 90 629 6 500 GB/AMA, RWA 88 465 12 450 2011 116 751 16 867 GB/AMA, RWA 103 690 11 683 2012 97 721 10 733 GB/AMA, RWA 107 236 13 800 2013 112 005 16 638 GB/AMA,BMLFUW 104 863 13 685 2014 111 615 15 741 GB/AMA,BMLFUW 111 810 16 189 2015 130 252 14 308 AMA 120 934 15 025
GB: AMA data published in (BMLFUW 2000–2015): www.gruenerbericht.at
RWA: Raiffeisen Ware Austria, sales company: www.rwa.at
BMLFUW:Bundesministerium für Land- und Forstwirtschaft, Umwelt und Wasserwirtschaft: www.bmlfuw.gv.at
AMA: Agrarmarkt Austria (AMA 2016): www.ama.at
Emissions of ammonia (NH3)
For the calculation of NH3 emissions from synthetic fertilizers the Tier 2 methodology according to the EMEP/EEA GB 2016 was applied. This method uses specific NH3 emission factors for dif-ferent types of synthetic fertilizers and for different climatic conditions. The EMEP/EEA GB 2016 refers to the IPCC 2006 Guidelines regarding the definitions of climatic zones. According to IPCC 2006, Austria belongs to Group III ‘temperate and cool temperate countries’ with largely acidic soils. 65% of Austria´s soils are classified as normal (pH<7) and 35% as high (pH>=7) based on Austrian Soil Information System – BORIS – (http://www.borisdaten.at).
In Austria, full time-series data only for urea and non-urea synthetic N fertilizers (see Table 232), but with no further specifications, are available. For urea the weighted average of the de-fault emission factors for normal pH soils (1.55 kg NH3/kg N applied) and high pH soils (0.164 kg NH3/kg N applied) (EEA 2016, table 3.2) has been calculated, resulting in an emission factor for urea of 0.158 kg NH3 per kg of fertilizer-N applied. As calcium-ammonium-nitrate and ammoni-um-nitrate fertilizers represent the dominant form of non-urea synthetic fertilizers being used (FREIBAUER & KALTSCHMITT 2001), an average emission factor of 0.02 kg NH3-N per kg of fertiliz-er-N is applied for fertilizers other than urea (STREBL et al. 2003). Emissions of nitric oxide (NOx)
The Tier 1 methodology according to the EMEP/EEA GB 2016 is applied. Emissions of NOx are calculated as a fixed percentage of total fertilizer nitrogen applied to soil. For all mineral fertilizer types the default emission factor of 4% (i.e. 0.04 kg NO per kg applied fertilizer-N) is used.
5.5.3 Organic N-fertilizers applied to soils (NFR 3.D.a.2.a)
Key source: NH3
NFR source category 3.D.a.2 Organic fertilizers comprise emissions from Animal manure ap-plied to soils (3.D.a.2.a), Sewage sludge applied to soils (3.D.a.2.b) and Other organic fertilizers applied to soils (3.D.a.2.c) including N inputs from digested energy crops (biogas plants) and compost.
Austria’s Informative Inventory Report (IIR) 2017 – Agriculture (NFR Sector 3)
322 Umweltbundesamt REP-0609, Vienna 2017
5.5.3.1 Animal manure applied to soils (NFR 3.D.a.2.a)
Emissions of ammonia (NH3) and nitric oxide (NOx) occur during the application of animal ma-nure on agricultural soils. Following the revised CLRTAP Reporting Guidelines, emissions are now reported under Agricultural Soils (NFR 3.D.a.2.a Animal manure applied to soils).
Activity Data
Livestock numbers and information on AWMS are described in chapter 5.3.
Nitrogen left for spreading
After housing and storage, manure is applied to agricultural soils. Manure application is con-nected with NH3-N, NOx-N and N2O-N losses that depend on the amount of manure N. With regard to a comprehensive treatment of the nitrogen budged, Austria established a link between the ammonia and nitrous oxide emissions inventory. A detailed description of the methods ap-plied for the calculation of N2O emissions is given in the report “Austria’s National Inventory Re-port 2017 – Submission under the United Nations Framework Convention on Climate Change and the Kyoto Protocol” (UMWELTBUNDESAMT 2017a).
From total N excretion the following losses were subtracted: N excreted during grazing NH3-N losses from housing NH3-N losses during manure storage NOx-N losses from manure management N2O-N losses from manure management The remaining N is applied to agricultural soils.
NH3 emissions from animal manure applied to soils – cattle and swine
A country specific methodology has been applied.
This method distinguishes between the types of waste produced by each animal sub category: solid manure and liquid slurry. This is relevant, because TAN contents and therefore NH3 emis-sions are highly dependent on the quality of waste and organic matter content in slurry. Accord-ing to the EMEP/EEA Emission Inventory Guidebook 2016 the N input from straw use in ma-nure management systems is taken into account.
NH3 emissions from manure nitrogen applied to soils have been calculated using the following formula:
NH3-Nspread = NexLFS * (FracSS * FTAN SS * EF-NH3-N spread SS + FracLS-bc * FTAN LS * EF-NH3-N spread LS +
FracLS-bs * FTAN LS * EF-NH3-N spread LS * CFbs)
NH3-N spread = NH3-N emissions driven by intentional spreading of animal waste from Manure Management systems on agricultural soils (droppings of grazing animals are not included!)
NexLFS = Annual amount of nitrogen in animal excreta left for spreading on agricultural soils, corrected for losses during manure management; it does not include nitrogen from grazing animals
FracSS = Fraction of nitrogen left for spreading produced as farmyard manure in a solid waste management system
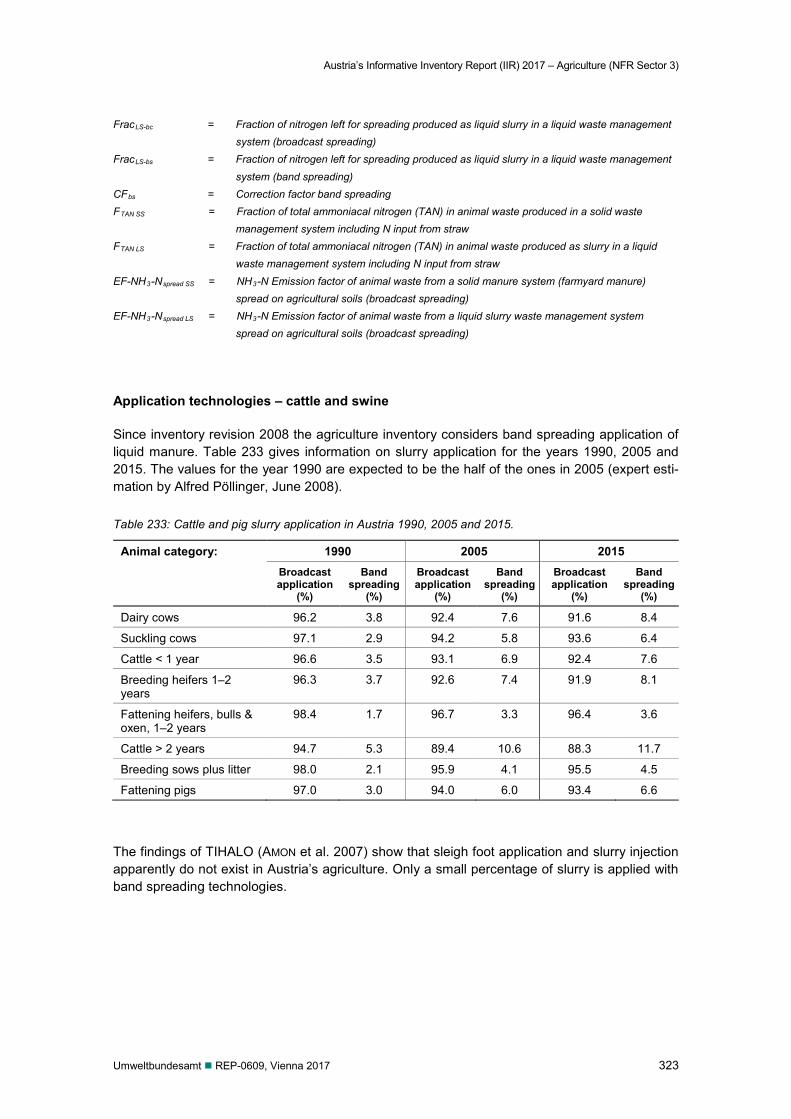
Austria’s Informative Inventory Report (IIR) 2017 – Agriculture (NFR Sector 3)
Umweltbundesamt REP-0609, Vienna 2017 323
FracLS-bc = Fraction of nitrogen left for spreading produced as liquid slurry in a liquid waste management system (broadcast spreading)
FracLS-bs = Fraction of nitrogen left for spreading produced as liquid slurry in a liquid waste management system (band spreading)
CFbs = Correction factor band spreading FTAN SS = Fraction of total ammoniacal nitrogen (TAN) in animal waste produced in a solid waste
management system including N input from straw FTAN LS = Fraction of total ammoniacal nitrogen (TAN) in animal waste produced as slurry in a liquid
waste management system including N input from straw EF-NH3-Nspread SS = NH3-N Emission factor of animal waste from a solid manure system (farmyard manure)
spread on agricultural soils (broadcast spreading) EF-NH3-Nspread LS = NH3-N Emission factor of animal waste from a liquid slurry waste management system
spread on agricultural soils (broadcast spreading)
Application technologies – cattle and swine
Since inventory revision 2008 the agriculture inventory considers band spreading application of liquid manure. Table 233 gives information on slurry application for the years 1990, 2005 and 2015. The values for the year 1990 are expected to be the half of the ones in 2005 (expert esti-mation by Alfred Pöllinger, June 2008).
Table 233: Cattle and pig slurry application in Austria 1990, 2005 and 2015.
Animal category: 1990 2005 2015 Broadcast application
(%)
Band spreading
(%)
Broadcast application
(%)
Band spreading
(%)
Broadcast application
(%)
Band spreading
(%)
Dairy cows 96.2 3.8 92.4 7.6 91.6 8.4
Suckling cows 97.1 2.9 94.2 5.8 93.6 6.4
Cattle < 1 year 96.6 3.5 93.1 6.9 92.4 7.6
Breeding heifers 1–2 years
96.3 3.7 92.6 7.4 91.9 8.1
Fattening heifers, bulls & oxen, 1–2 years
98.4 1.7 96.7 3.3 96.4 3.6
Cattle > 2 years 94.7 5.3 89.4 10.6 88.3 11.7
Breeding sows plus litter 98.0 2.1 95.9 4.1 95.5 4.5
Fattening pigs 97.0 3.0 94.0 6.0 93.4 6.6
The findings of TIHALO (AMON et al. 2007) show that sleigh foot application and slurry injection apparently do not exist in Austria’s agriculture. Only a small percentage of slurry is applied with band spreading technologies.
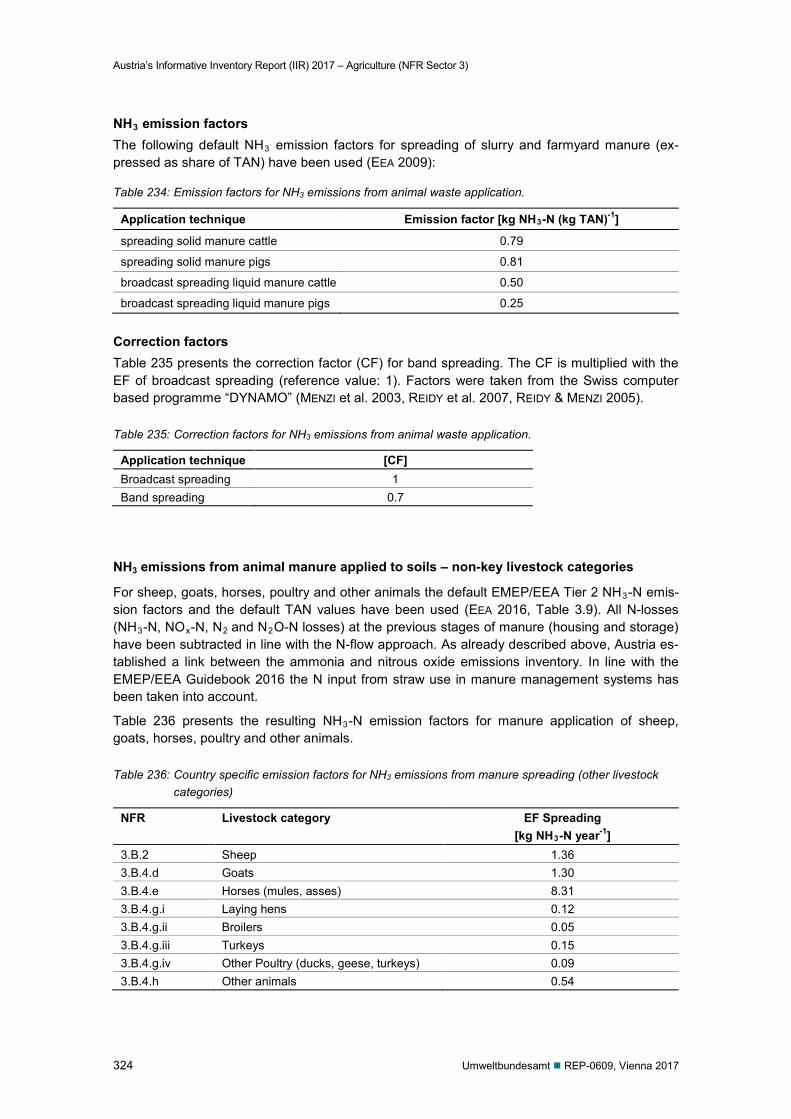
Austria’s Informative Inventory Report (IIR) 2017 – Agriculture (NFR Sector 3)
324 Umweltbundesamt REP-0609, Vienna 2017
NH3 emission factors The following default NH3 emission factors for spreading of slurry and farmyard manure (ex-pressed as share of TAN) have been used (EEA 2009):
Table 234: Emission factors for NH3 emissions from animal waste application.
Application technique Emission factor [kg NH3-N (kg TAN)-1]
spreading solid manure cattle 0.79
spreading solid manure pigs 0.81
broadcast spreading liquid manure cattle 0.50
broadcast spreading liquid manure pigs 0.25
Correction factors Table 235 presents the correction factor (CF) for band spreading. The CF is multiplied with the EF of broadcast spreading (reference value: 1). Factors were taken from the Swiss computer based programme “DYNAMO” (MENZI et al. 2003, REIDY et al. 2007, REIDY & MENZI 2005).
Table 235: Correction factors for NH3 emissions from animal waste application.
Application technique [CF] Broadcast spreading 1 Band spreading 0.7
NH3 emissions from animal manure applied to soils – non-key livestock categories
For sheep, goats, horses, poultry and other animals the default EMEP/EEA Tier 2 NH3-N emis-sion factors and the default TAN values have been used (EEA 2016, Table 3.9). All N-losses (NH3-N, NOx-N, N2 and N2O-N losses) at the previous stages of manure (housing and storage) have been subtracted in line with the N-flow approach. As already described above, Austria es-tablished a link between the ammonia and nitrous oxide emissions inventory. In line with the EMEP/EEA Guidebook 2016 the N input from straw use in manure management systems has been taken into account.
Table 236 presents the resulting NH3-N emission factors for manure application of sheep, goats, horses, poultry and other animals.
Table 236: Country specific emission factors for NH3 emissions from manure spreading (other livestock categories)
NFR Livestock category EF Spreading [kg NH3-N year-1]
3.B.2 Sheep 1.36 3.B.4.d Goats 1.30 3.B.4.e Horses (mules, asses) 8.31 3.B.4.g.i Laying hens 0.12 3.B.4.g.ii Broilers 0.05 3.B.4.g.iii Turkeys 0.15 3.B.4.g.iv Other Poultry (ducks, geese, turkeys) 0.09 3.B.4.h Other animals 0.54
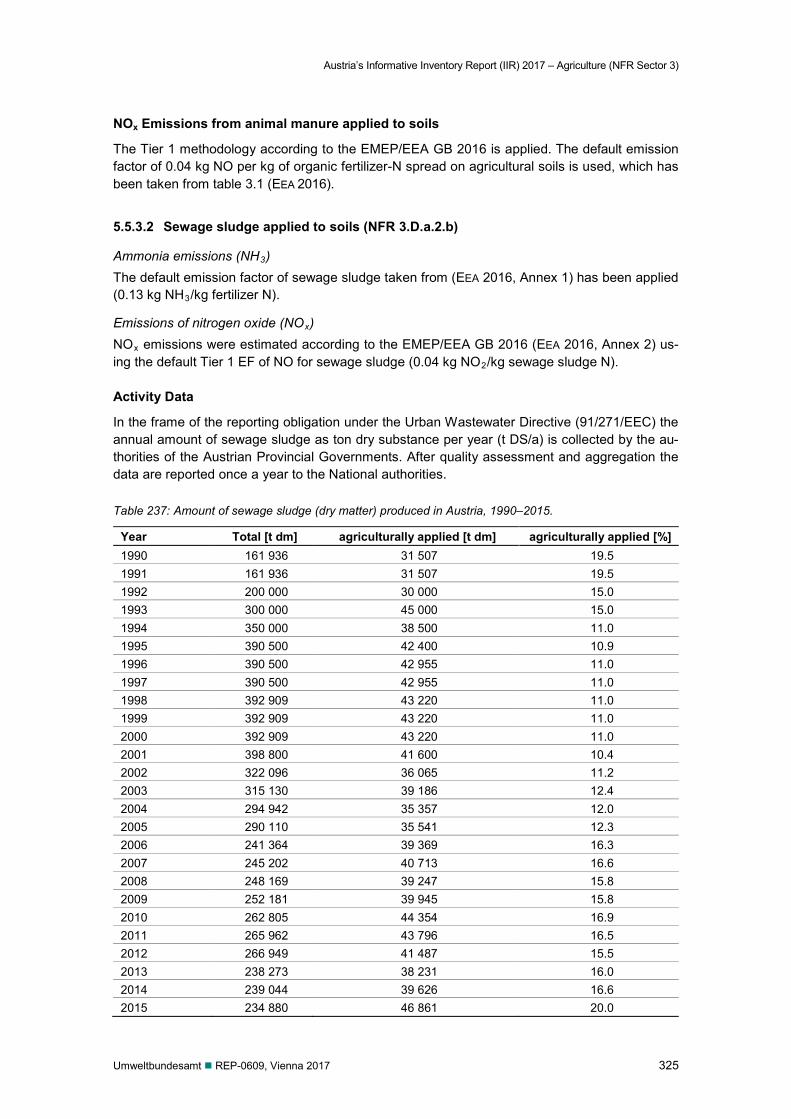
Austria’s Informative Inventory Report (IIR) 2017 – Agriculture (NFR Sector 3)
Umweltbundesamt REP-0609, Vienna 2017 325
NOx Emissions from animal manure applied to soils
The Tier 1 methodology according to the EMEP/EEA GB 2016 is applied. The default emission factor of 0.04 kg NO per kg of organic fertilizer-N spread on agricultural soils is used, which has been taken from table 3.1 (EEA 2016).
5.5.3.2 Sewage sludge applied to soils (NFR 3.D.a.2.b)
Ammonia emissions (NH3) The default emission factor of sewage sludge taken from (EEA 2016, Annex 1) has been applied (0.13 kg NH3/kg fertilizer N).
Emissions of nitrogen oxide (NOx) NOx emissions were estimated according to the EMEP/EEA GB 2016 (EEA 2016, Annex 2) us-ing the default Tier 1 EF of NO for sewage sludge (0.04 kg NO2/kg sewage sludge N). Activity Data
In the frame of the reporting obligation under the Urban Wastewater Directive (91/271/EEC) the annual amount of sewage sludge as ton dry substance per year (t DS/a) is collected by the au-thorities of the Austrian Provincial Governments. After quality assessment and aggregation the data are reported once a year to the National authorities.
Table 237: Amount of sewage sludge (dry matter) produced in Austria, 1990–2015.
Year Total [t dm] agriculturally applied [t dm] agriculturally applied [%] 1990 161 936 31 507 19.5 1991 161 936 31 507 19.5 1992 200 000 30 000 15.0 1993 300 000 45 000 15.0 1994 350 000 38 500 11.0 1995 390 500 42 400 10.9 1996 390 500 42 955 11.0 1997 390 500 42 955 11.0 1998 392 909 43 220 11.0 1999 392 909 43 220 11.0 2000 392 909 43 220 11.0 2001 398 800 41 600 10.4 2002 322 096 36 065 11.2 2003 315 130 39 186 12.4 2004 294 942 35 357 12.0 2005 290 110 35 541 12.3 2006 241 364 39 369 16.3 2007 245 202 40 713 16.6 2008 248 169 39 247 15.8 2009 252 181 39 945 15.8 2010 262 805 44 354 16.9 2011 265 962 43 796 16.5 2012 266 949 41 487 15.5 2013 238 273 38 231 16.0 2014 239 044 39 626 16.6 2015 234 880 46 861 20.0
Austria’s Informative Inventory Report (IIR) 2017 – Agriculture (NFR Sector 3)
326 Umweltbundesamt REP-0609, Vienna 2017
Amounts of agriculturally applied sewage sludge were obtained from: Water Quality Report 2000 (PHILIPPITSCH et al. 2001), Report on sewage sludge (UMWELTBUNDESAMT 1997), Austrian report on water pollution control (BMLFUW 2002a) and deliveries from Austria’s federal provinces to Umweltbundesamt (UMWELTBUNDESAMT 2011a, 2013a, 2014a, 2015a, 2016a).
Data on N content of sewage sludge was obtained from (UMWELTBUNDESAMT 1997). The study contains sewage sludge analyses carried out by the Umweltbundesamt. Digested sludge sam-ples from 17 municipal sewage sludge treatment plants taken in winter 1994/1995 were investi-gated with regard to more than one hundred inorganic, organic and biological parameters in or-der to get an idea of the quality of municipal sewage sludge. Following this study a mean value of 3.9% N in dry matter was taken.
In 2007 the N-content value of sewage sludge was re-examined. The comparison with national Studies (ZESSNER, M. 1999) and (ÖWAV-Regelblatt Nr. 17 – Landwirtschaftliche Verwertung von Klärschlamm 2004 – www.oewav.at) approved the value of 3.9% N/dm. The amount of nitrogen input from agriculturally applied sewage sludge was calculated accord-ing following formula:
FSslu = SsluN * Ssluagric
FSslu = Annual nitrogen input to soils by agriculturally applied sewage sludge [t N]
SsluN = Nitrogen content in dry matter [%] – 3.9%
Ssluagric = Annual amount of sewage sludge agriculturally applied [t/t] (see Table 237)
5.5.3.3 Other organic fertilizers applied to soils (NFR 3.D.a.2.c)
In addition to N from digested manure the N inputs from energy crops applied to soils as fertiliz-er after the digestion process in biogas plants (digestates) are reported as well. Furthermore, from submission 2017 onwards the N from compost applied on agricultural soils has been im-plemented.
Activity Data
Energy crops
The calculation of N from anaerobically digested energy crops (digestates) was done for the years 2007, 2009 and 2011 on the basis of three detailed raw material and energy balances re-ported by E-Control (E-CONTROL 2008, 2011 & 2013).
N content of digested energy crops was derived from specific literature (RESCH et al. 2006; DLG 1997; LANDESBETRIEB LANDWIRTSCHAFT HESSEN 2013).
Amounts of digested manure N are calculated in sector manure management. N amounts of di-gested energy crops for the years before 2007 were derived on the basis of digested manure N amounts and the share of energy crop N (digested manure N amount/ digested crop-N amount) in 2007. N amounts of digested energy crops for the years 2008 and 2010 were calculated by interpolation. For 2012 onwards the proportions of the 2011 balance were used.
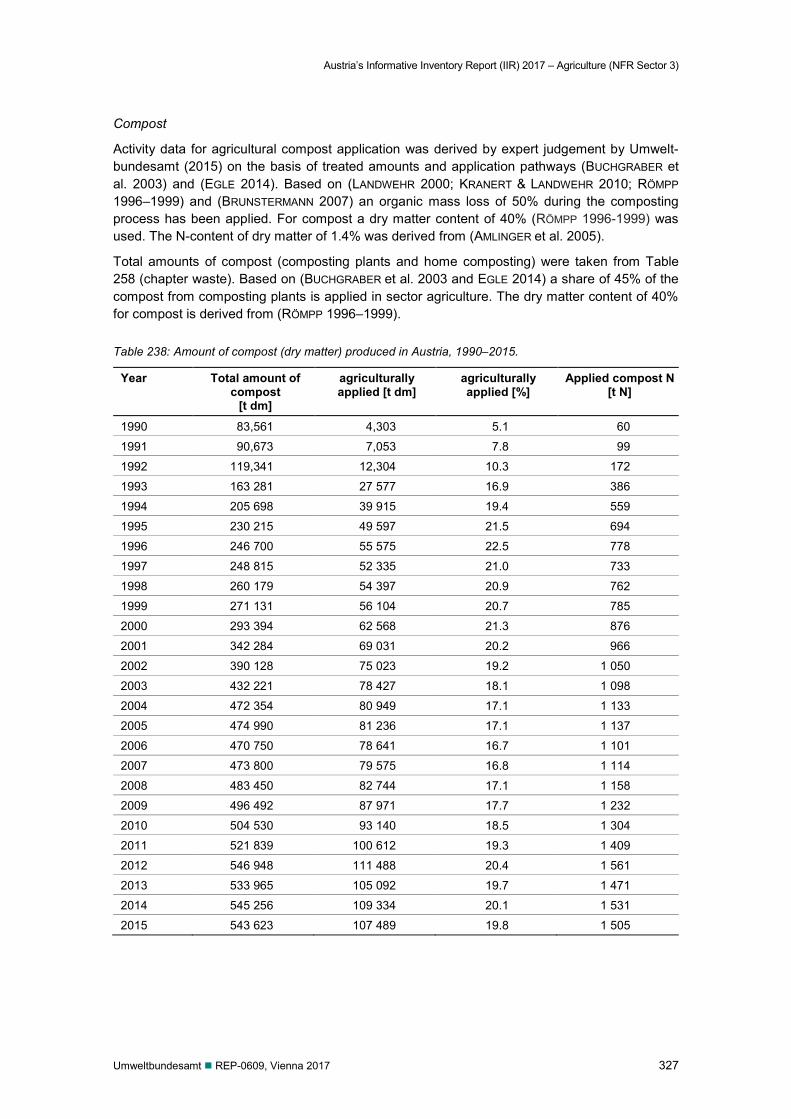
Austria’s Informative Inventory Report (IIR) 2017 – Agriculture (NFR Sector 3)
Umweltbundesamt REP-0609, Vienna 2017 327
Compost
Activity data for agricultural compost application was derived by expert judgement by Umwelt-bundesamt (2015) on the basis of treated amounts and application pathways (BUCHGRABER et al. 2003) and (EGLE 2014). Based on (LANDWEHR 2000; KRANERT & LANDWEHR 2010; RÖMPP 1996–1999) and (BRUNSTERMANN 2007) an organic mass loss of 50% during the composting process has been applied. For compost a dry matter content of 40% (RÖMPP 1996-1999) was used. The N-content of dry matter of 1.4% was derived from (AMLINGER et al. 2005).
Total amounts of compost (composting plants and home composting) were taken from Table 258 (chapter waste). Based on (BUCHGRABER et al. 2003 and EGLE 2014) a share of 45% of the compost from composting plants is applied in sector agriculture. The dry matter content of 40% for compost is derived from (RÖMPP 1996–1999).
Table 238: Amount of compost (dry matter) produced in Austria, 1990–2015.
Year Total amount of compost
[t dm]
agriculturally applied [t dm]
agriculturally applied [%]
Applied compost N [t N]
1990 83,561 4,303 5.1 60
1991 90,673 7,053 7.8 99
1992 119,341 12,304 10.3 172
1993 163 281 27 577 16.9 386
1994 205 698 39 915 19.4 559
1995 230 215 49 597 21.5 694
1996 246 700 55 575 22.5 778
1997 248 815 52 335 21.0 733
1998 260 179 54 397 20.9 762
1999 271 131 56 104 20.7 785
2000 293 394 62 568 21.3 876
2001 342 284 69 031 20.2 966
2002 390 128 75 023 19.2 1 050
2003 432 221 78 427 18.1 1 098
2004 472 354 80 949 17.1 1 133
2005 474 990 81 236 17.1 1 137
2006 470 750 78 641 16.7 1 101
2007 473 800 79 575 16.8 1 114
2008 483 450 82 744 17.1 1 158
2009 496 492 87 971 17.7 1 232
2010 504 530 93 140 18.5 1 304
2011 521 839 100 612 19.3 1 409
2012 546 948 111 488 20.4 1 561
2013 533 965 105 092 19.7 1 471
2014 545 256 109 334 20.1 1 531
2015 543 623 107 489 19.8 1 505
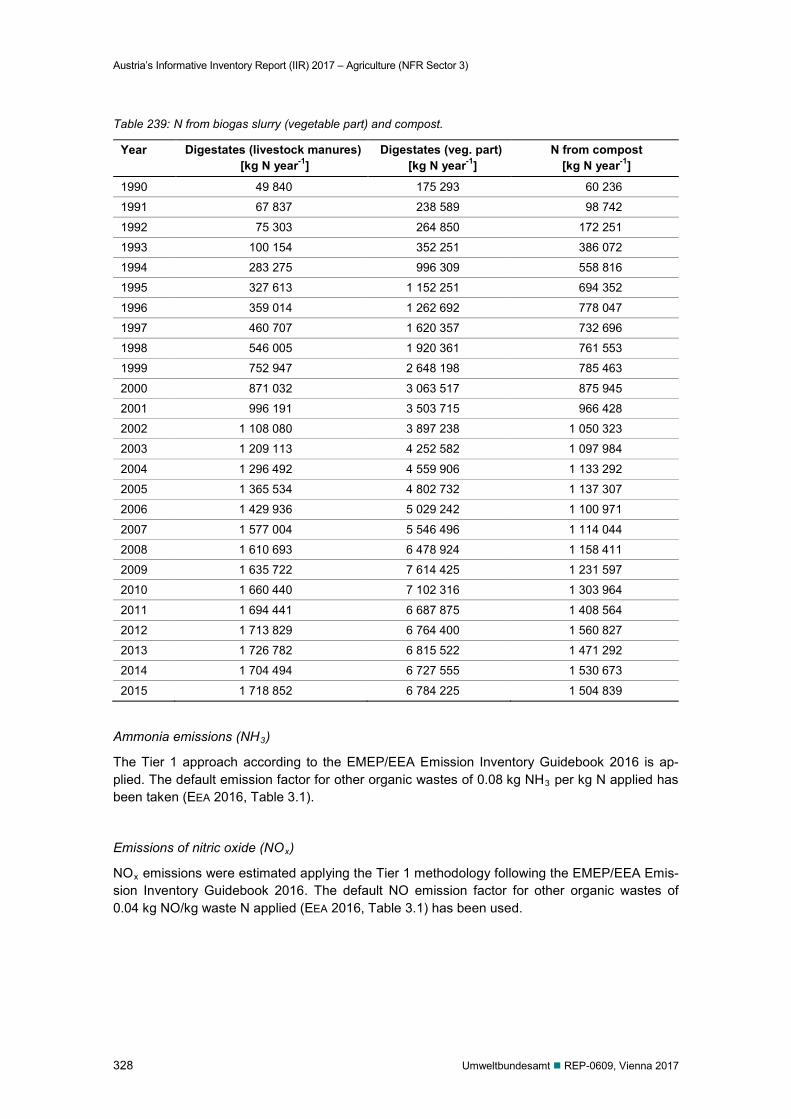
Austria’s Informative Inventory Report (IIR) 2017 – Agriculture (NFR Sector 3)
328 Umweltbundesamt REP-0609, Vienna 2017
Table 239: N from biogas slurry (vegetable part) and compost.
Year Digestates (livestock manures) [kg N year-1]
Digestates (veg. part) [kg N year-1]
N from compost [kg N year-1]
1990 49 840 175 293 60 236
1991 67 837 238 589 98 742
1992 75 303 264 850 172 251
1993 100 154 352 251 386 072
1994 283 275 996 309 558 816
1995 327 613 1 152 251 694 352
1996 359 014 1 262 692 778 047
1997 460 707 1 620 357 732 696
1998 546 005 1 920 361 761 553
1999 752 947 2 648 198 785 463
2000 871 032 3 063 517 875 945
2001 996 191 3 503 715 966 428
2002 1 108 080 3 897 238 1 050 323
2003 1 209 113 4 252 582 1 097 984
2004 1 296 492 4 559 906 1 133 292
2005 1 365 534 4 802 732 1 137 307
2006 1 429 936 5 029 242 1 100 971
2007 1 577 004 5 546 496 1 114 044
2008 1 610 693 6 478 924 1 158 411
2009 1 635 722 7 614 425 1 231 597
2010 1 660 440 7 102 316 1 303 964
2011 1 694 441 6 687 875 1 408 564
2012 1 713 829 6 764 400 1 560 827
2013 1 726 782 6 815 522 1 471 292
2014 1 704 494 6 727 555 1 530 673
2015 1 718 852 6 784 225 1 504 839
Ammonia emissions (NH3)
The Tier 1 approach according to the EMEP/EEA Emission Inventory Guidebook 2016 is ap-plied. The default emission factor for other organic wastes of 0.08 kg NH3 per kg N applied has been taken (EEA 2016, Table 3.1).
Emissions of nitric oxide (NOx)
NOx emissions were estimated applying the Tier 1 methodology following the EMEP/EEA Emis-sion Inventory Guidebook 2016. The default NO emission factor for other organic wastes of 0.04 kg NO/kg waste N applied (EEA 2016, Table 3.1) has been used.
Austria’s Informative Inventory Report (IIR) 2017 – Agriculture (NFR Sector 3)
Umweltbundesamt REP-0609, Vienna 2017 329
5.5.4 Urine and dung deposited by grazing animals (NFR 3.D.a.3)
Key source: No
Cattle and Swine
The emission factor of 0.05 kg NH3-N/ kg N excreted has been taken from (Eidgenössische Forschungsanstalt 1997).
The share of N excreted on pastures is presented in Table 213 to Table 215. Free range sys-tems for pigs are uncommon in Austria, there are no emissions occurring from that source.
Nitrogen excretion values of cattle and swine are presented in Table 221.
Sheeps, goats, horses, poultry and other animals
Tier 2 default NH3-N EFs have been taken (EEA 2016, Table 3.9). For other animals (furred game) the EF of sheep has been used. N-excretion values and TAN proportion are described in chapter 5.3.3.
5.5.5 Cultivated crops (3.D.e)
Key source: No
5.5.5.1 NMVOC emissions from vegetation
The Tier 1 methodology according to the EMEP/EEA GB 2016 has been applied. In line with assumptions used in previous inventories for simplification wheat has been considered to be representative for the vegetation cover of agricultural cropland (0.32 kg NMVOC/ha/yr following the EMEP/EEA GB 2016, Table 3.3). Austria has cold climate conditions. The average tempera-ture in Austria varies from 8.4°C in Klagenfurt to 10.5°C in Vienna. Grassland is predominately located in mountainous (cold) regions. Therefore, the emission factor for grass (15°C) of 0.41 kg NMVOC/ha/yr following the EMEP/EEA GB 2016, Table 3.3, has been taken. Emissions are calculated with the following formula.
ENMVOC_cl_gl = ΣAcl,gl * EFcl,gl
ENMVOC_cl,gl = annual NMVOC emission flux from cropland and grassland areas (kg NMVOC)
Acl,gl =annual cropland area, annual grassland area (ha)
EFcl,gl=EF of wheat for cropland and grass (15°C) for grassland (kg NMVOC/ha)
Activity data
Data of agricultural land use are taken from (STATISTIK AUSTRIA 1990–2016) and (BMLFUW 2000–2016). Land use areas (cropland, grassland, alpine grassland) are harmonized with sector Land Use, Land Use Change and Forestry (LULUCF) of Austria’s GHG inventory to be consistent within the Austrian Inventory and across all sectors. Cropland areas are based on data from the national FSS (Farm Structure Survey) and IACS (Integrated Administration and Control Sys-tem). As Farm Structure Survey (FSS) data are only available for the years 1990, 1995, 1999 and 2010 and complemented with random sample FSS which were undertaken in 1993, 1997, 2003, 2005, 2007 and 2013, adjusted IACS data has been used for the intermediate years. Al-
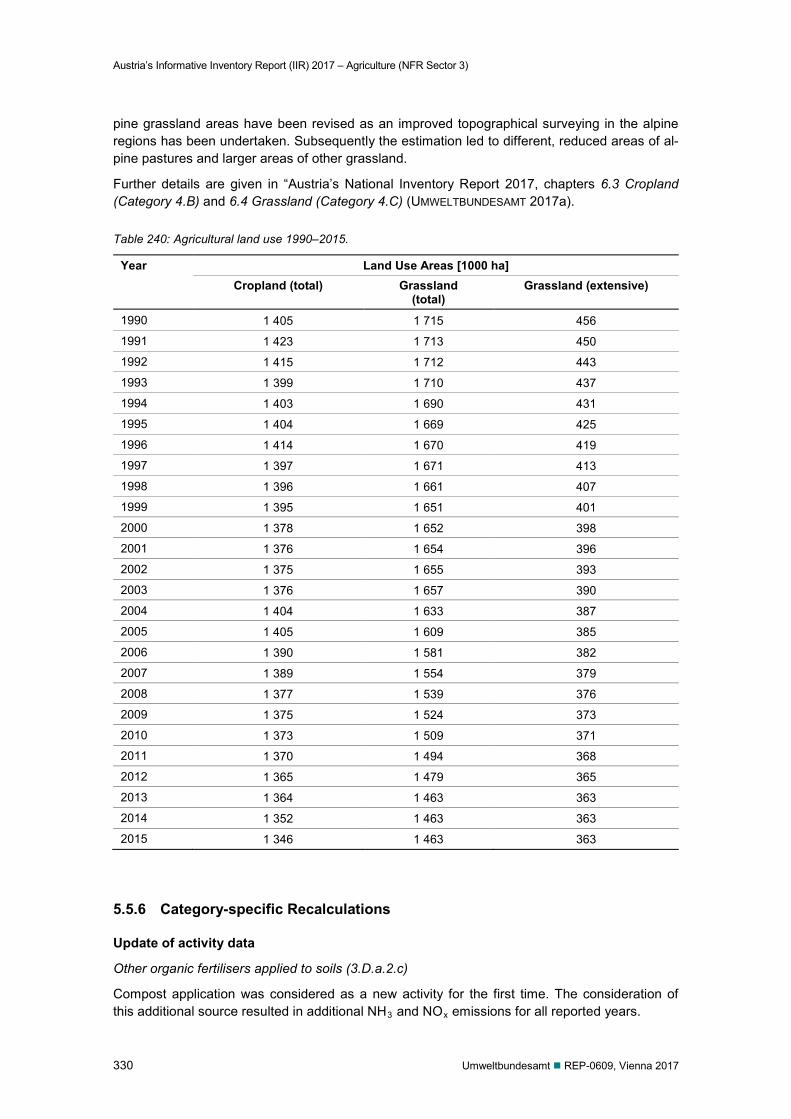
Austria’s Informative Inventory Report (IIR) 2017 – Agriculture (NFR Sector 3)
330 Umweltbundesamt REP-0609, Vienna 2017
pine grassland areas have been revised as an improved topographical surveying in the alpine regions has been undertaken. Subsequently the estimation led to different, reduced areas of al-pine pastures and larger areas of other grassland.
Further details are given in “Austria’s National Inventory Report 2017, chapters 6.3 Cropland (Category 4.B) and 6.4 Grassland (Category 4.C) (UMWELTBUNDESAMT 2017a).
Table 240: Agricultural land use 1990–2015.
Year Land Use Areas [1000 ha] Cropland (total) Grassland
(total) Grassland (extensive)
1990 1 405 1 715 456
1991 1 423 1 713 450
1992 1 415 1 712 443
1993 1 399 1 710 437
1994 1 403 1 690 431
1995 1 404 1 669 425
1996 1 414 1 670 419
1997 1 397 1 671 413
1998 1 396 1 661 407
1999 1 395 1 651 401
2000 1 378 1 652 398
2001 1 376 1 654 396
2002 1 375 1 655 393
2003 1 376 1 657 390
2004 1 404 1 633 387
2005 1 405 1 609 385
2006 1 390 1 581 382
2007 1 389 1 554 379
2008 1 377 1 539 376
2009 1 375 1 524 373
2010 1 373 1 509 371
2011 1 370 1 494 368
2012 1 365 1 479 365
2013 1 364 1 463 363
2014 1 352 1 463 363
2015 1 346 1 463 363
5.5.6 Category-specific Recalculations
Update of activity data
Other organic fertilisers applied to soils (3.D.a.2.c)
Compost application was considered as a new activity for the first time. The consideration of this additional source resulted in additional NH3 and NOx emissions for all reported years.
Austria’s Informative Inventory Report (IIR) 2017 – Agriculture (NFR Sector 3)
Umweltbundesamt REP-0609, Vienna 2017 331
Improvement of methodologies and emission factors
Ammonia (NH3)
Inorganic N-fertilizers including urea application (3.D.a.1)
The inventory was updated by using the default Tier 2 NH3 EF for urea fertilizer according the new EMEP/EEA emission inventory guidebook 2016. The revision resulted in a decrease of NH3 emissions (-388.4 t NH3 in 2014).
Animal manure applied to soils (3.D.a.2.a)
Revised numbers of horses resulted in higher emissions from 2004 onwards (+377.0 t NH3 in 2014).
Weighted EF of other poultry was updated according the share of geese and ducks from 2003 to 2015. The update resulted in slightly lower emissions.
Sewage sludge applied to soils (3.D.a.2.b) The inventory was updated by using the default Tier 1 NH3 EF for sewage sludge application according to the new EMEP/EEA emission inventory guidebook 2016. The revision resulted in a decrease of NH3 emissions (-80.6 t NH3 in 2014).
Other organic fertilisers applied to soils including digestate and compost (3.D.a.2.c) Additionally to digested energy crops already considered in previous submissions compost ap-plication was introduced as a new activity. For both activities (digestate and compost) the de-fault Tier 1 NH3 EF for other organic fertilisers according to the new EMEP/EEA emission inven-tory guidebook 2016 has been used. In previous submissions in a simple approach the EF of urea has been used for digestate. The revision resulted in a considerable decrease of emis-sions from source category other organic fertilisers applied to soils (-564.6 t NH3 in 2014).
Urine and dung deposited by grazing animals (3.D.a.3) Revised numbers of horses resulted in higher emissions from 2004 onwards (+75.2 t NH3 in 2014).
Cultivated Crops (3.D.e) In submission 2016 Austria reported an amount of 284 t NH3 emissions from legume cropland for 2014. Calculations followed the CORINAIR detailed methodology as provided in the EMEP/CORINAIR atmospheric emission inventory guidebook 1999.
However, due to the lack of evidence of emissions arising from the fixation process itself, the EMEP/EEA Guidebook 2016 (and the 2006 IPCC Guidelines) do not consider biological N fixa-tion as a source of emissions anymore. Source category and default methodologies were re-moved from the guidebooks and no specific category is provided for reporting in the NFR (and CRF). Consequently, when updating the inventory using the new EMEP/EEA Guidebook 2016, Austria removed estimates for biological N fixation based on the outdated default methodology.
In submission 2017 Austria reports ‘NA’ for NH3 in source category cultivated crops for all years. Following the EMEP/EEA Guidebook 2016, Table 2.1 no EFs are available for the esti-mation of ammonia emissions arising from standing or ‘cultivated’ crops.
Nitrogen Oxides (NO2)
Inorganic N-fertilizers including urea application (3.D.a.1) Inventory update with the default Tier 1 EF for NO from N applied in fertilisers according to the new EMEP/EEA emission inventory guidebook 2016 resulted in significantly increased emis-sions (+3 370.3 t NO2 in 2014).
Austria’s Informative Inventory Report (IIR) 2017 – Agriculture (NFR Sector 3)
332 Umweltbundesamt REP-0609, Vienna 2017
Animal manure applied to soils (3.D.a.2.a) The inventory was updated by using the default Tier 1 EF for NO from N applied in fertilisers ac-cording to the new EMEP/EEA emission inventory guidebook 2016. The revision resulted in significantly increased emissions (+976.5 t NO2 in 2014).
Sewage sludge applied to soils (3.D.a.2.b) The inventory was updated by using the default Tier 1 EF for NO from sewage sludge according to the new EMEP/EEA emission inventory guidebook 2016. The revision resulted in increased emissions (+11.0 t NO2 in 2014).
Other organic fertilisers applied to soils including digestate and compost (3.D.a.2.c) Additionally to digested energy crops already considered in previous submissions compost ap-plication was introduced as a new activity. For both activities (digestate and compost) the de-fault Tier 1 EF for NO according to the new EMEP/EEA emission inventory guidebook 2016 has been used. The revision resulted in a considerable increase of emissions from source category other organic fertilisers applied to soils (+109.3 t NO2 in 2014).
NMVOC
Cultivated Crops (3.D.e) The inventory was updated by using the default Tier 1 EF for NMVOC from agricultural crops according to the new EMEP/EEA emission inventory guidebook 2016. The revision resulted in decreased emissions (-764.9 t NMVOC in 2014).
5.6 NFR 3.D Particle Emissions from Agricultural Soils
Particle emissions reported under source category 3.D result from the following activities: Certain steps of farm work such as soil cultivation and harvesting (field operations). Calcula-
tions are based on (WINIWARTER et al. 2007). In accordance with the EMEP/EEA Guidebook 2013, chapter 3.2.2, emissions are allocated to NFR source category 3.D.a.1 Inorganic N-fertilizers.
Agricultural bulk material handling. These emissions are estimated under source category 2.A Mineral Products (see Chapter 4.3) and reported under NFR source category 3.D.d Off-farm storage, handling and transport of bulk agricultural products.
5.6.1 Methodological Issues
5.6.1.1 PM emissions from field operations
Emissions of particulate matter from field operations are linked with the usage of machines on agricultural soils. They are considered in relationship with the treated areas.
Activity Data
Agricultural land use data applied for the calculation of particle emissions are taken from (STATISTIK AUSTRIA 1990-2016) and (BMLFUW 2000-2016). Land use areas were harmonized with sector Land Use, Land Use Change and Forestry (LULUCF) of Austria’s GHG inventory to be consistent within the Austrian Inventory and across all sectors. Cropland areas are now based on data from the national FSS (Farm Structure Survey) and IACS (Integrated Administra-
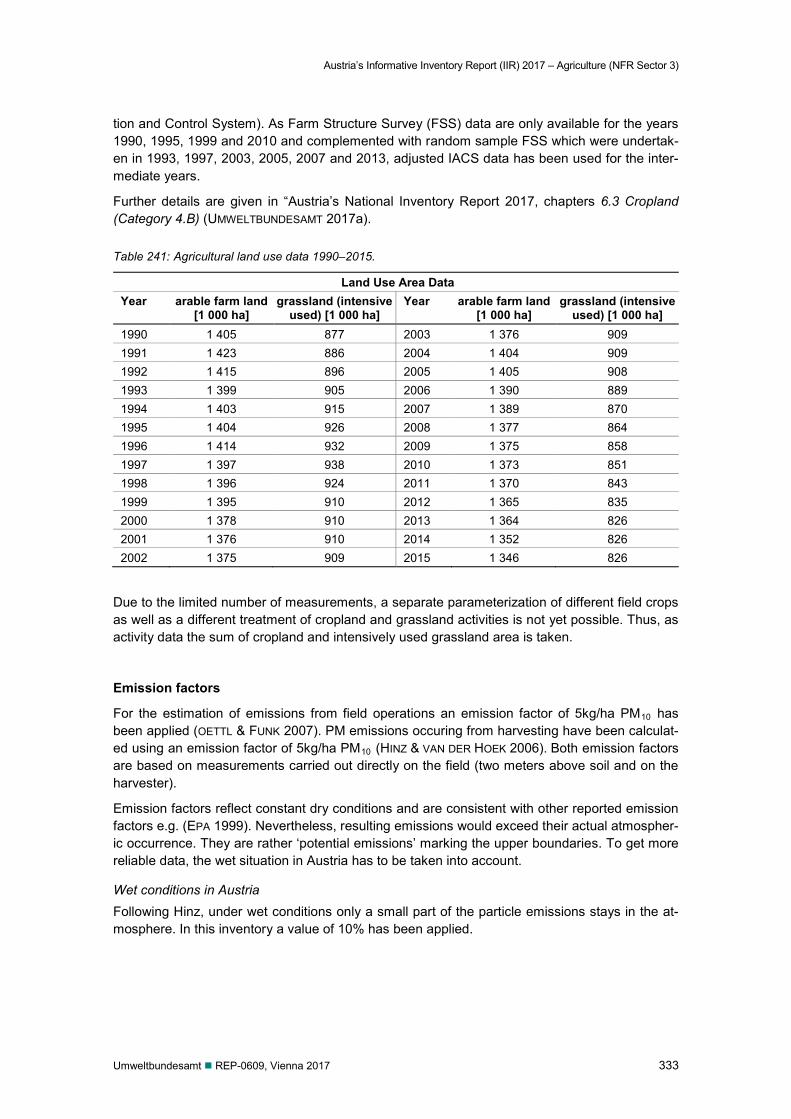
Austria’s Informative Inventory Report (IIR) 2017 – Agriculture (NFR Sector 3)
Umweltbundesamt REP-0609, Vienna 2017 333
tion and Control System). As Farm Structure Survey (FSS) data are only available for the years 1990, 1995, 1999 and 2010 and complemented with random sample FSS which were undertak-en in 1993, 1997, 2003, 2005, 2007 and 2013, adjusted IACS data has been used for the inter-mediate years.
Further details are given in “Austria’s National Inventory Report 2017, chapters 6.3 Cropland (Category 4.B) (UMWELTBUNDESAMT 2017a).
Table 241: Agricultural land use data 1990–2015.
Land Use Area Data Year arable farm land
[1 000 ha] grassland (intensive
used) [1 000 ha] Year arable farm land
[1 000 ha] grassland (intensive
used) [1 000 ha] 1990 1 405 877 2003 1 376 909 1991 1 423 886 2004 1 404 909 1992 1 415 896 2005 1 405 908 1993 1 399 905 2006 1 390 889 1994 1 403 915 2007 1 389 870 1995 1 404 926 2008 1 377 864 1996 1 414 932 2009 1 375 858 1997 1 397 938 2010 1 373 851 1998 1 396 924 2011 1 370 843 1999 1 395 910 2012 1 365 835 2000 1 378 910 2013 1 364 826 2001 1 376 910 2014 1 352 826 2002 1 375 909 2015 1 346 826
Due to the limited number of measurements, a separate parameterization of different field crops as well as a different treatment of cropland and grassland activities is not yet possible. Thus, as activity data the sum of cropland and intensively used grassland area is taken.
Emission factors
For the estimation of emissions from field operations an emission factor of 5kg/ha PM10 has been applied (OETTL & FUNK 2007). PM emissions occuring from harvesting have been calculat-ed using an emission factor of 5kg/ha PM10 (HINZ & VAN DER HOEK 2006). Both emission factors are based on measurements carried out directly on the field (two meters above soil and on the harvester).
Emission factors reflect constant dry conditions and are consistent with other reported emission factors e.g. (EPA 1999). Nevertheless, resulting emissions would exceed their actual atmospher-ic occurrence. They are rather ‘potential emissions’ marking the upper boundaries. To get more reliable data, the wet situation in Austria has to be taken into account.
Wet conditions in Austria Following Hinz, under wet conditions only a small part of the particle emissions stays in the at-mosphere. In this inventory a value of 10% has been applied.
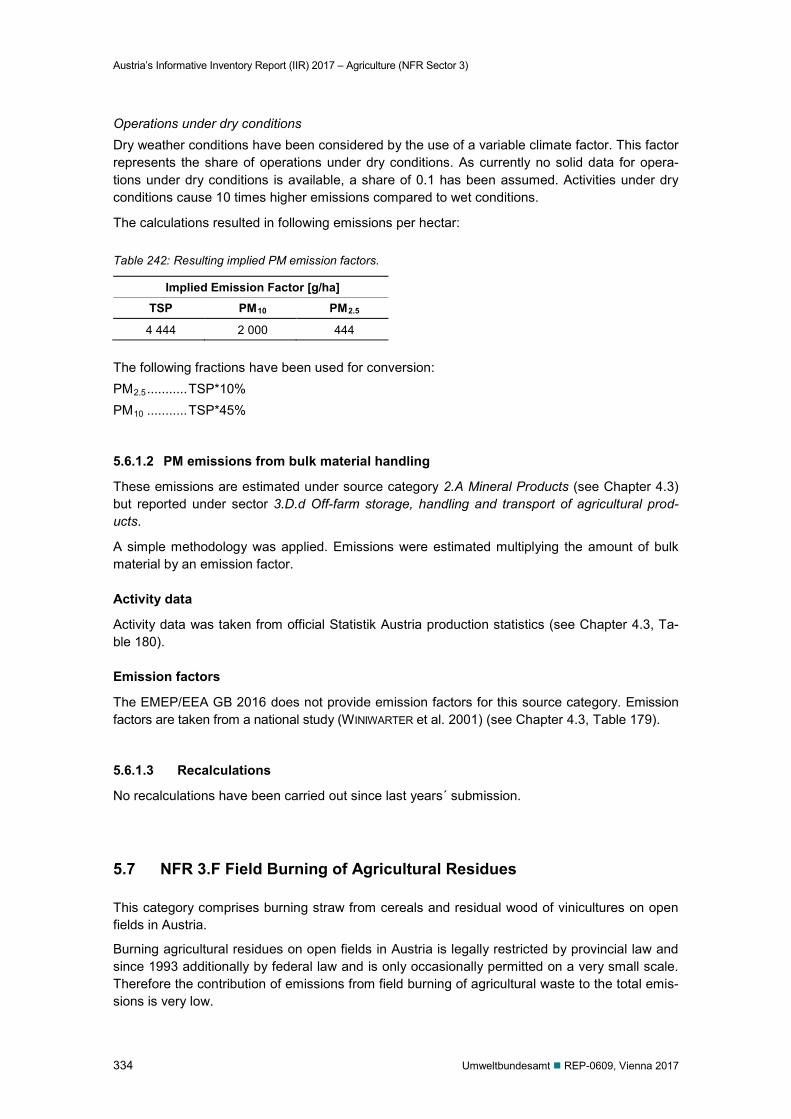
Austria’s Informative Inventory Report (IIR) 2017 – Agriculture (NFR Sector 3)
334 Umweltbundesamt REP-0609, Vienna 2017
Operations under dry conditions Dry weather conditions have been considered by the use of a variable climate factor. This factor represents the share of operations under dry conditions. As currently no solid data for opera-tions under dry conditions is available, a share of 0.1 has been assumed. Activities under dry conditions cause 10 times higher emissions compared to wet conditions.
The calculations resulted in following emissions per hectar:
Table 242: Resulting implied PM emission factors.
Implied Emission Factor [g/ha] TSP PM10 PM2.5
4 444 2 000 444
The following fractions have been used for conversion: PM2.5 ........... TSP*10% PM10 ........... TSP*45%
5.6.1.2 PM emissions from bulk material handling
These emissions are estimated under source category 2.A Mineral Products (see Chapter 4.3) but reported under sector 3.D.d Off-farm storage, handling and transport of agricultural prod-ucts.
A simple methodology was applied. Emissions were estimated multiplying the amount of bulk material by an emission factor. Activity data
Activity data was taken from official Statistik Austria production statistics (see Chapter 4.3, Ta-ble 180). Emission factors
The EMEP/EEA GB 2016 does not provide emission factors for this source category. Emission factors are taken from a national study (WINIWARTER et al. 2001) (see Chapter 4.3, Table 179).
5.6.1.3 Recalculations
No recalculations have been carried out since last years´ submission.
5.7 NFR 3.F Field Burning of Agricultural Residues
This category comprises burning straw from cereals and residual wood of vinicultures on open fields in Austria.
Burning agricultural residues on open fields in Austria is legally restricted by provincial law and since 1993 additionally by federal law and is only occasionally permitted on a very small scale. Therefore the contribution of emissions from field burning of agricultural waste to the total emis-sions is very low.
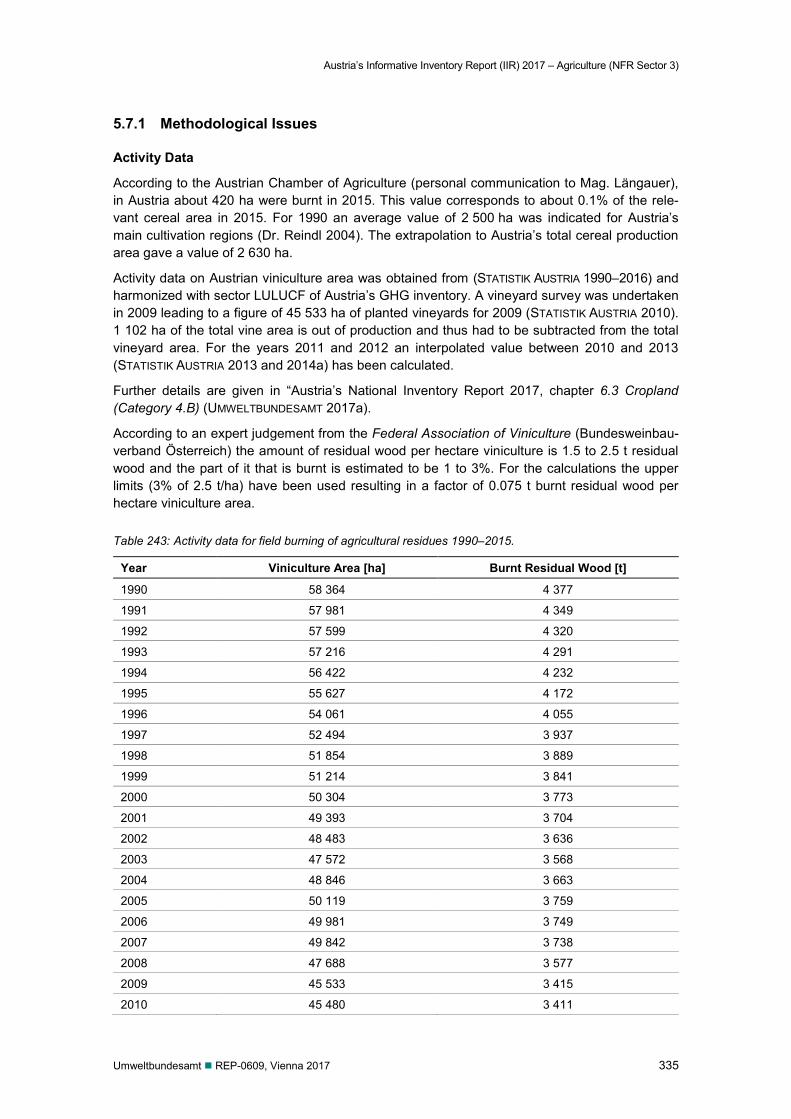
Austria’s Informative Inventory Report (IIR) 2017 – Agriculture (NFR Sector 3)
Umweltbundesamt REP-0609, Vienna 2017 335
5.7.1 Methodological Issues
Activity Data
According to the Austrian Chamber of Agriculture (personal communication to Mag. Längauer), in Austria about 420 ha were burnt in 2015. This value corresponds to about 0.1% of the rele-vant cereal area in 2015. For 1990 an average value of 2 500 ha was indicated for Austria’s main cultivation regions (Dr. Reindl 2004). The extrapolation to Austria’s total cereal production area gave a value of 2 630 ha.
Activity data on Austrian viniculture area was obtained from (STATISTIK AUSTRIA 1990–2016) and harmonized with sector LULUCF of Austria’s GHG inventory. A vineyard survey was undertaken in 2009 leading to a figure of 45 533 ha of planted vineyards for 2009 (STATISTIK AUSTRIA 2010). 1 102 ha of the total vine area is out of production and thus had to be subtracted from the total vineyard area. For the years 2011 and 2012 an interpolated value between 2010 and 2013 (STATISTIK AUSTRIA 2013 and 2014a) has been calculated.
Further details are given in “Austria’s National Inventory Report 2017, chapter 6.3 Cropland (Category 4.B) (UMWELTBUNDESAMT 2017a).
According to an expert judgement from the Federal Association of Viniculture (Bundesweinbau-verband Österreich) the amount of residual wood per hectare viniculture is 1.5 to 2.5 t residual wood and the part of it that is burnt is estimated to be 1 to 3%. For the calculations the upper limits (3% of 2.5 t/ha) have been used resulting in a factor of 0.075 t burnt residual wood per hectare viniculture area.
Table 243: Activity data for field burning of agricultural residues 1990–2015.
Year Viniculture Area [ha] Burnt Residual Wood [t]
1990 58 364 4 377
1991 57 981 4 349
1992 57 599 4 320
1993 57 216 4 291
1994 56 422 4 232
1995 55 627 4 172
1996 54 061 4 055
1997 52 494 3 937
1998 51 854 3 889
1999 51 214 3 841
2000 50 304 3 773
2001 49 393 3 704
2002 48 483 3 636
2003 47 572 3 568
2004 48 846 3 663
2005 50 119 3 759
2006 49 981 3 749
2007 49 842 3 738
2008 47 688 3 577
2009 45 533 3 415
2010 45 480 3 411
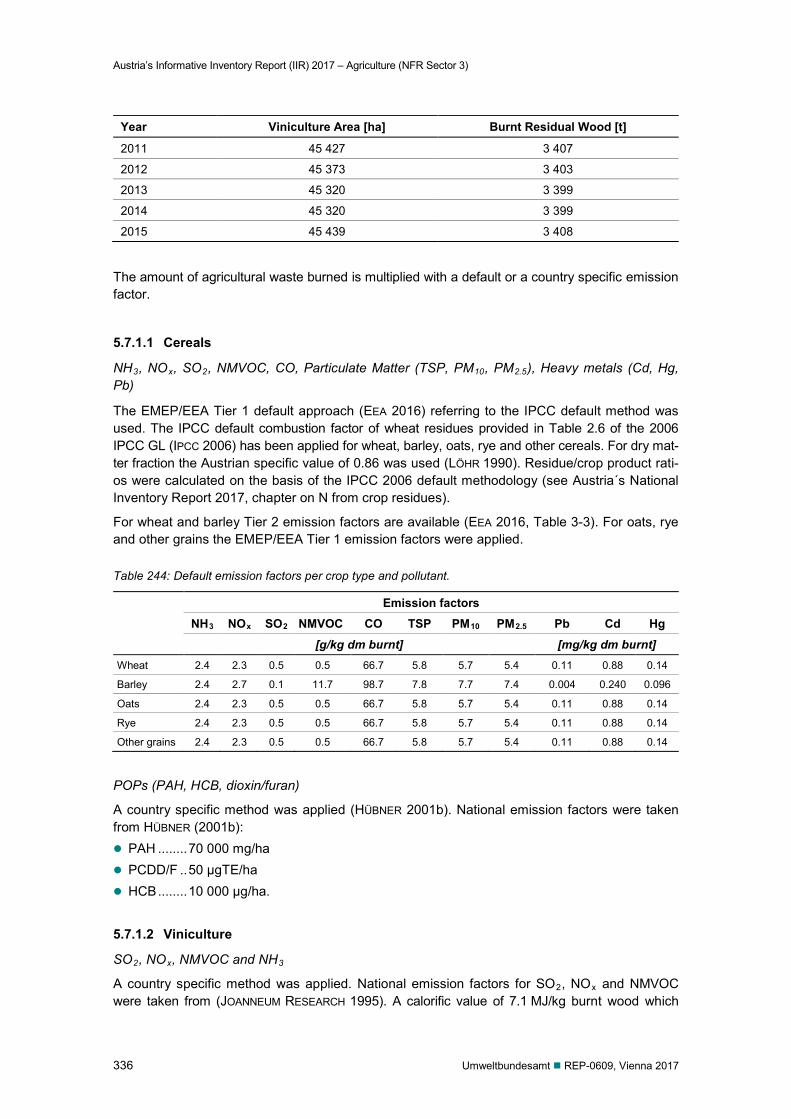
Austria’s Informative Inventory Report (IIR) 2017 – Agriculture (NFR Sector 3)
336 Umweltbundesamt REP-0609, Vienna 2017
Year Viniculture Area [ha] Burnt Residual Wood [t]
2011 45 427 3 407
2012 45 373 3 403
2013 45 320 3 399
2014 45 320 3 399
2015 45 439 3 408
The amount of agricultural waste burned is multiplied with a default or a country specific emission factor.
5.7.1.1 Cereals
NH3, NOx, SO2, NMVOC, CO, Particulate Matter (TSP, PM10, PM2.5), Heavy metals (Cd, Hg, Pb)
The EMEP/EEA Tier 1 default approach (EEA 2016) referring to the IPCC default method was used. The IPCC default combustion factor of wheat residues provided in Table 2.6 of the 2006 IPCC GL (IPCC 2006) has been applied for wheat, barley, oats, rye and other cereals. For dry mat-ter fraction the Austrian specific value of 0.86 was used (LÖHR 1990). Residue/crop product rati-os were calculated on the basis of the IPCC 2006 default methodology (see Austria´s National Inventory Report 2017, chapter on N from crop residues).
For wheat and barley Tier 2 emission factors are available (EEA 2016, Table 3-3). For oats, rye and other grains the EMEP/EEA Tier 1 emission factors were applied.
Table 244: Default emission factors per crop type and pollutant.
Emission factors NH3 NOx SO2 NMVOC CO TSP PM10 PM2.5 Pb Cd Hg
[g/kg dm burnt] [mg/kg dm burnt] Wheat 2.4 2.3 0.5 0.5 66.7 5.8 5.7 5.4 0.11 0.88 0.14
Barley 2.4 2.7 0.1 11.7 98.7 7.8 7.7 7.4 0.004 0.240 0.096
Oats 2.4 2.3 0.5 0.5 66.7 5.8 5.7 5.4 0.11 0.88 0.14
Rye 2.4 2.3 0.5 0.5 66.7 5.8 5.7 5.4 0.11 0.88 0.14
Other grains 2.4 2.3 0.5 0.5 66.7 5.8 5.7 5.4 0.11 0.88 0.14
POPs (PAH, HCB, dioxin/furan)
A country specific method was applied (HÜBNER 2001b). National emission factors were taken from HÜBNER (2001b): PAH ........ 70 000 mg/ha PCDD/F .. 50 µgTE/ha HCB ........ 10 000 µg/ha. 5.7.1.2 Viniculture
SO2, NOx, NMVOC and NH3
A country specific method was applied. National emission factors for SO2, NOx and NMVOC were taken from (JOANNEUM RESEARCH 1995). A calorific value of 7.1 MJ/kg burnt wood which
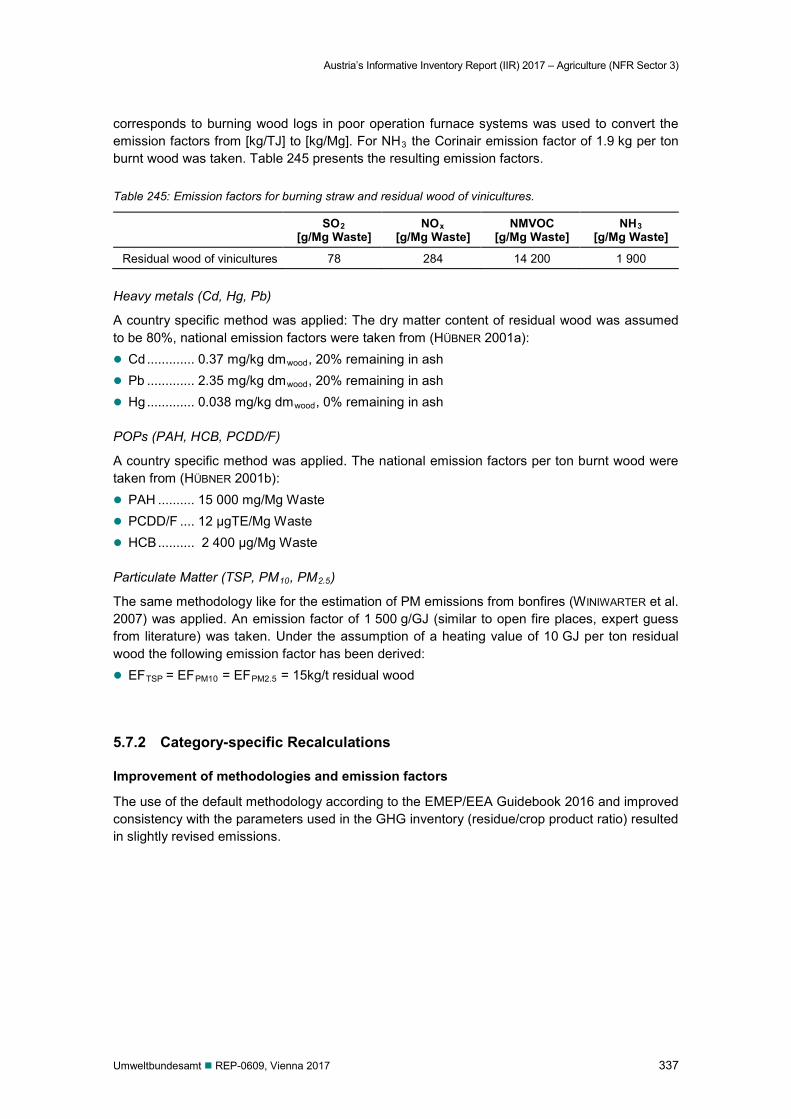
Austria’s Informative Inventory Report (IIR) 2017 – Agriculture (NFR Sector 3)
Umweltbundesamt REP-0609, Vienna 2017 337
corresponds to burning wood logs in poor operation furnace systems was used to convert the emission factors from [kg/TJ] to [kg/Mg]. For NH3 the Corinair emission factor of 1.9 kg per ton burnt wood was taken. Table 245 presents the resulting emission factors.
Table 245: Emission factors for burning straw and residual wood of vinicultures.
SO2 [g/Mg Waste]
NOx [g/Mg Waste]
NMVOC [g/Mg Waste]
NH3 [g/Mg Waste]
Residual wood of vinicultures 78 284 14 200 1 900
Heavy metals (Cd, Hg, Pb)
A country specific method was applied: The dry matter content of residual wood was assumed to be 80%, national emission factors were taken from (HÜBNER 2001a): Cd ............. 0.37 mg/kg dmwood, 20% remaining in ash Pb ............. 2.35 mg/kg dmwood, 20% remaining in ash Hg ............. 0.038 mg/kg dmwood, 0% remaining in ash POPs (PAH, HCB, PCDD/F)
A country specific method was applied. The national emission factors per ton burnt wood were taken from (HÜBNER 2001b): PAH .......... 15 000 mg/Mg Waste PCDD/F .... 12 µgTE/Mg Waste HCB .......... 2 400 µg/Mg Waste Particulate Matter (TSP, PM10, PM2.5)
The same methodology like for the estimation of PM emissions from bonfires (WINIWARTER et al. 2007) was applied. An emission factor of 1 500 g/GJ (similar to open fire places, expert guess from literature) was taken. Under the assumption of a heating value of 10 GJ per ton residual wood the following emission factor has been derived: EFTSP = EFPM10 = EFPM2.5 = 15kg/t residual wood
5.7.2 Category-specific Recalculations
Improvement of methodologies and emission factors
The use of the default methodology according to the EMEP/EEA Guidebook 2016 and improved consistency with the parameters used in the GHG inventory (residue/crop product ratio) resulted in slightly revised emissions.
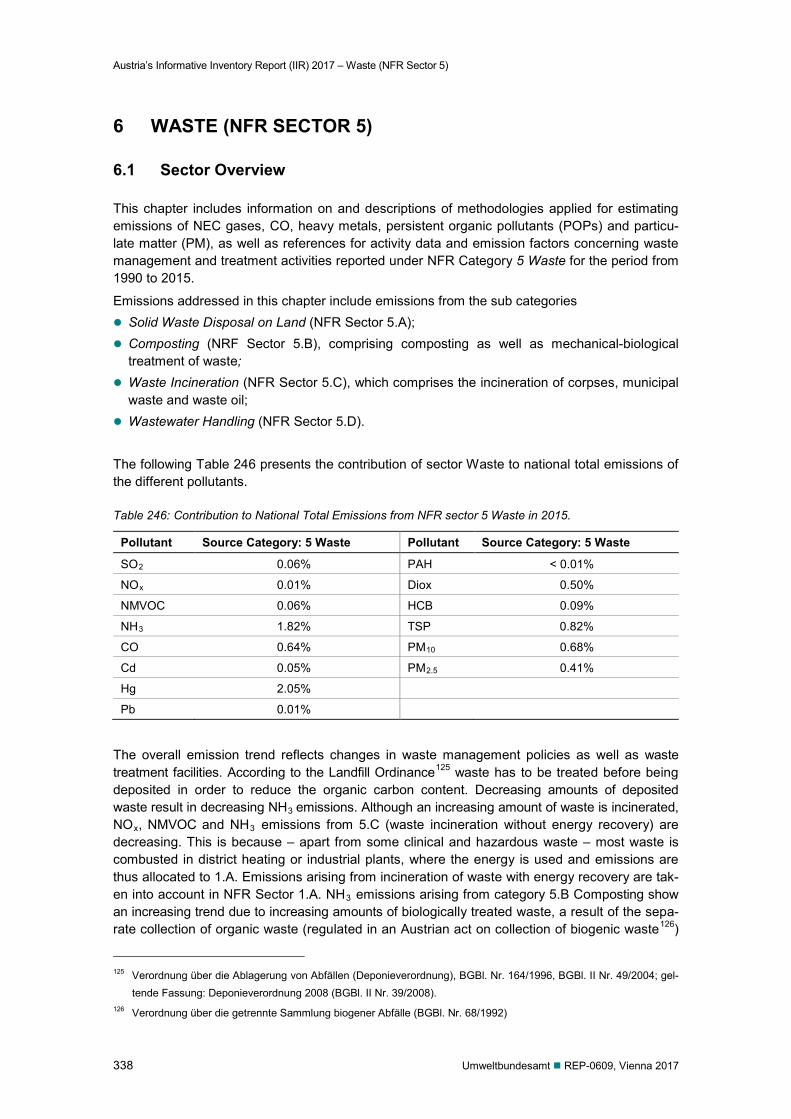
Austria’s Informative Inventory Report (IIR) 2017 – Waste (NFR Sector 5)
338 Umweltbundesamt REP-0609, Vienna 2017
6 WASTE (NFR SECTOR 5)
6.1 Sector Overview
This chapter includes information on and descriptions of methodologies applied for estimating emissions of NEC gases, CO, heavy metals, persistent organic pollutants (POPs) and particu-late matter (PM), as well as references for activity data and emission factors concerning waste management and treatment activities reported under NFR Category 5 Waste for the period from 1990 to 2015.
Emissions addressed in this chapter include emissions from the sub categories Solid Waste Disposal on Land (NFR Sector 5.A); Composting (NRF Sector 5.B), comprising composting as well as mechanical-biological
treatment of waste; Waste Incineration (NFR Sector 5.C), which comprises the incineration of corpses, municipal
waste and waste oil; Wastewater Handling (NFR Sector 5.D). The following Table 246 presents the contribution of sector Waste to national total emissions of the different pollutants.
Table 246: Contribution to National Total Emissions from NFR sector 5 Waste in 2015.
Pollutant Source Category: 5 Waste Pollutant Source Category: 5 Waste
SO2 0.06% PAH < 0.01%
NOx 0.01% Diox 0.50%
NMVOC 0.06% HCB 0.09%
NH3 1.82% TSP 0.82%
CO 0.64% PM10 0.68%
Cd 0.05% PM2.5 0.41%
Hg 2.05%
Pb 0.01%
The overall emission trend reflects changes in waste management policies as well as waste treatment facilities. According to the Landfill Ordinance125 waste has to be treated before being deposited in order to reduce the organic carbon content. Decreasing amounts of deposited waste result in decreasing NH3 emissions. Although an increasing amount of waste is incinerated, NOx, NMVOC and NH3 emissions from 5.C (waste incineration without energy recovery) are decreasing. This is because – apart from some clinical and hazardous waste – most waste is combusted in district heating or industrial plants, where the energy is used and emissions are thus allocated to 1.A. Emissions arising from incineration of waste with energy recovery are tak-en into account in NFR Sector 1.A. NH3 emissions arising from category 5.B Composting show an increasing trend due to increasing amounts of biologically treated waste, a result of the sepa-rate collection of organic waste (regulated in an Austrian act on collection of biogenic waste126)
125 Verordnung über die Ablagerung von Abfällen (Deponieverordnung), BGBl. Nr. 164/1996, BGBl. II Nr. 49/2004; gel-
tende Fassung: Deponieverordnung 2008 (BGBl. II Nr. 39/2008). 126 Verordnung über die getrennte Sammlung biogener Abfälle (BGBl. Nr. 68/1992)
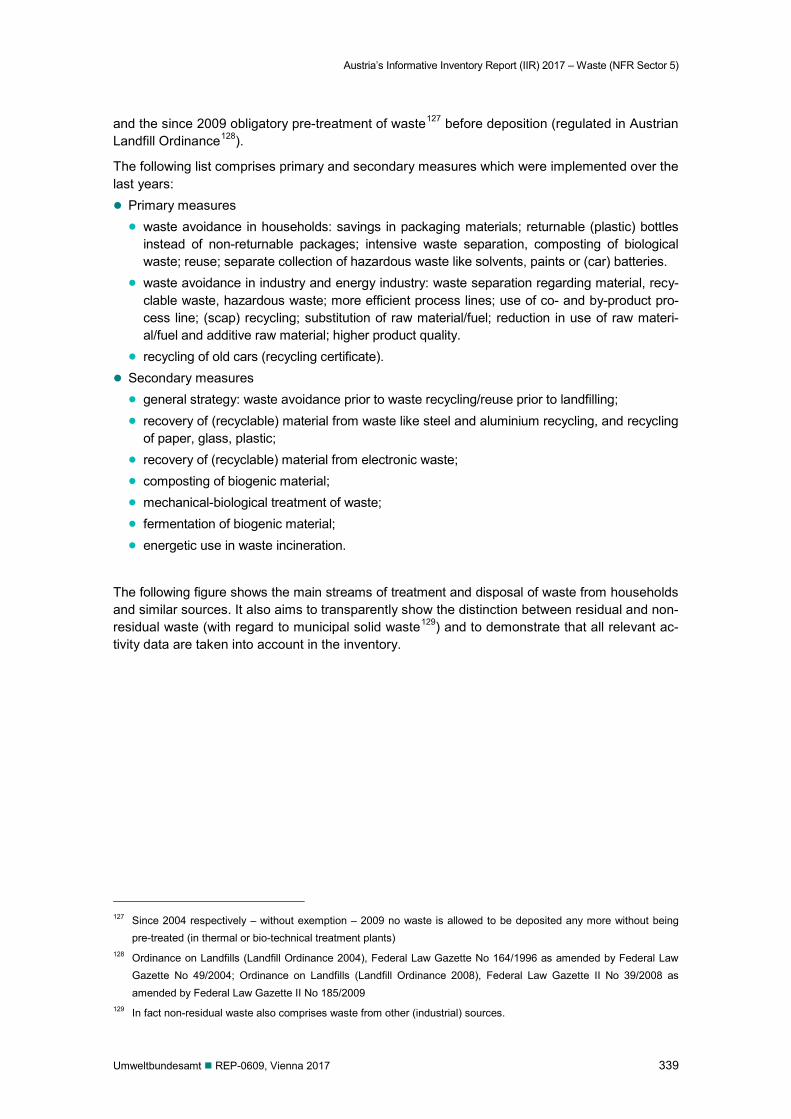
Austria’s Informative Inventory Report (IIR) 2017 – Waste (NFR Sector 5)
Umweltbundesamt REP-0609, Vienna 2017 339
and the since 2009 obligatory pre-treatment of waste127 before deposition (regulated in Austrian Landfill Ordinance128).
The following list comprises primary and secondary measures which were implemented over the last years: Primary measures waste avoidance in households: savings in packaging materials; returnable (plastic) bottles
instead of non-returnable packages; intensive waste separation, composting of biological waste; reuse; separate collection of hazardous waste like solvents, paints or (car) batteries.
waste avoidance in industry and energy industry: waste separation regarding material, recy-clable waste, hazardous waste; more efficient process lines; use of co- and by-product pro-cess line; (scap) recycling; substitution of raw material/fuel; reduction in use of raw materi-al/fuel and additive raw material; higher product quality.
recycling of old cars (recycling certificate). Secondary measures general strategy: waste avoidance prior to waste recycling/reuse prior to landfilling; recovery of (recyclable) material from waste like steel and aluminium recycling, and recycling
of paper, glass, plastic; recovery of (recyclable) material from electronic waste; composting of biogenic material; mechanical-biological treatment of waste; fermentation of biogenic material; energetic use in waste incineration.
The following figure shows the main streams of treatment and disposal of waste from households and similar sources. It also aims to transparently show the distinction between residual and non-residual waste (with regard to municipal solid waste129) and to demonstrate that all relevant ac-tivity data are taken into account in the inventory.
127 Since 2004 respectively – without exemption – 2009 no waste is allowed to be deposited any more without being
pre-treated (in thermal or bio-technical treatment plants) 128 Ordinance on Landfills (Landfill Ordinance 2004), Federal Law Gazette No 164/1996 as amended by Federal Law
Gazette No 49/2004; Ordinance on Landfills (Landfill Ordinance 2008), Federal Law Gazette II No 39/2008 as amended by Federal Law Gazette II No 185/2009
129 In fact non-residual waste also comprises waste from other (industrial) sources.
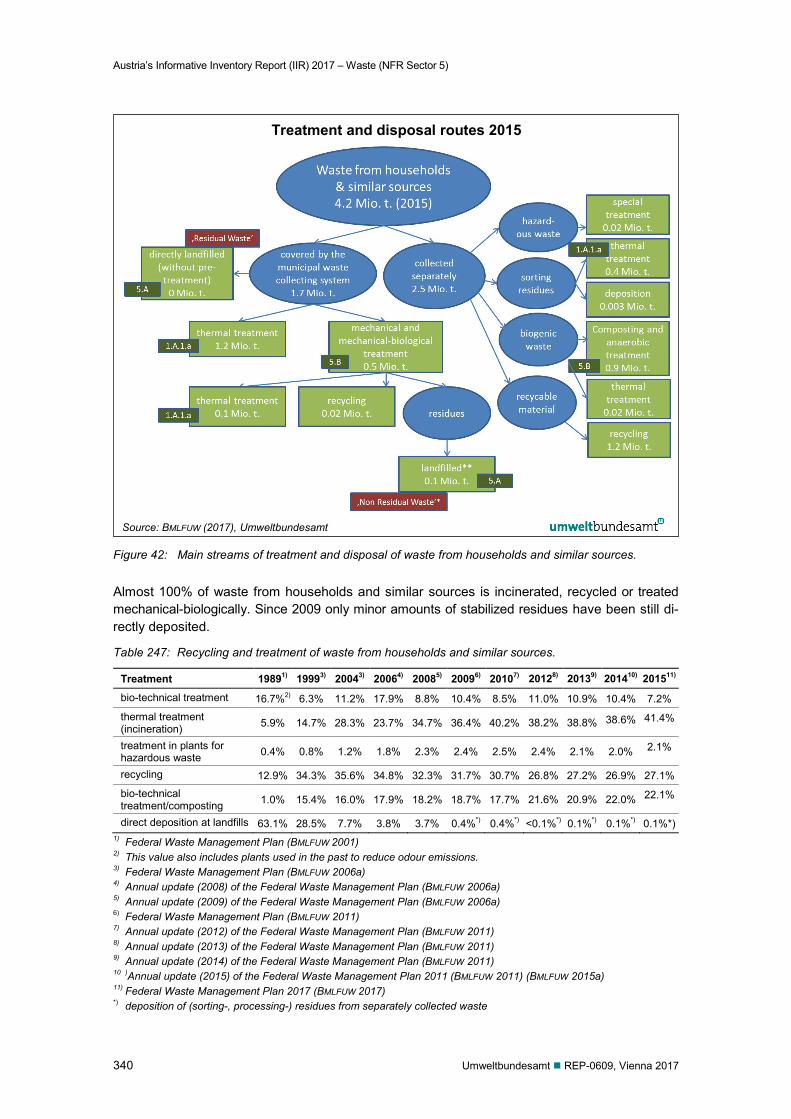
Austria’s Informative Inventory Report (IIR) 2017 – Waste (NFR Sector 5)
340 Umweltbundesamt REP-0609, Vienna 2017
Figure 42: Main streams of treatment and disposal of waste from households and similar sources.
Almost 100% of waste from households and similar sources is incinerated, recycled or treated mechanical-biologically. Since 2009 only minor amounts of stabilized residues have been still di-rectly deposited.
Table 247: Recycling and treatment of waste from households and similar sources.
Treatment 19891) 19993) 20043) 20064) 20085) 20096) 20107) 20128) 20139) 201410) 201511)
bio-technical treatment 16.7%2) 6.3% 11.2% 17.9% 8.8% 10.4% 8.5% 11.0% 10.9% 10.4% 7.2%
thermal treatment (incineration) 5.9% 14.7% 28.3% 23.7% 34.7% 36.4% 40.2% 38.2% 38.8% 38.6% 41.4%
treatment in plants for hazardous waste 0.4% 0.8% 1.2% 1.8% 2.3% 2.4% 2.5% 2.4% 2.1% 2.0% 2.1%
recycling 12.9% 34.3% 35.6% 34.8% 32.3% 31.7% 30.7% 26.8% 27.2% 26.9% 27.1%
bio-technical treatment/composting 1.0% 15.4% 16.0% 17.9% 18.2% 18.7% 17.7% 21.6% 20.9% 22.0% 22.1%
direct deposition at landfills 63.1% 28.5% 7.7% 3.8% 3.7% 0.4%*) 0.4%*) <0.1%*) 0.1%*) 0.1%*) 0.1%*) 1) Federal Waste Management Plan (BMLFUW 2001) 2) This value also includes plants used in the past to reduce odour emissions. 3) Federal Waste Management Plan (BMLFUW 2006a) 4) Annual update (2008) of the Federal Waste Management Plan (BMLFUW 2006a) 5) Annual update (2009) of the Federal Waste Management Plan (BMLFUW 2006a) 6) Federal Waste Management Plan (BMLFUW 2011) 7) Annual update (2012) of the Federal Waste Management Plan (BMLFUW 2011) 8) Annual update (2013) of the Federal Waste Management Plan (BMLFUW 2011) 9) Annual update (2014) of the Federal Waste Management Plan (BMLFUW 2011) 10 )Annual update (2015) of the Federal Waste Management Plan 2011 (BMLFUW 2011) (BMLFUW 2015a) 11) Federal Waste Management Plan 2017 (BMLFUW 2017) *) deposition of (sorting-, processing-) residues from separately collected waste
Treatment and disposal routes 2015
Source: BMLFUW (2017), Umweltbundesamt
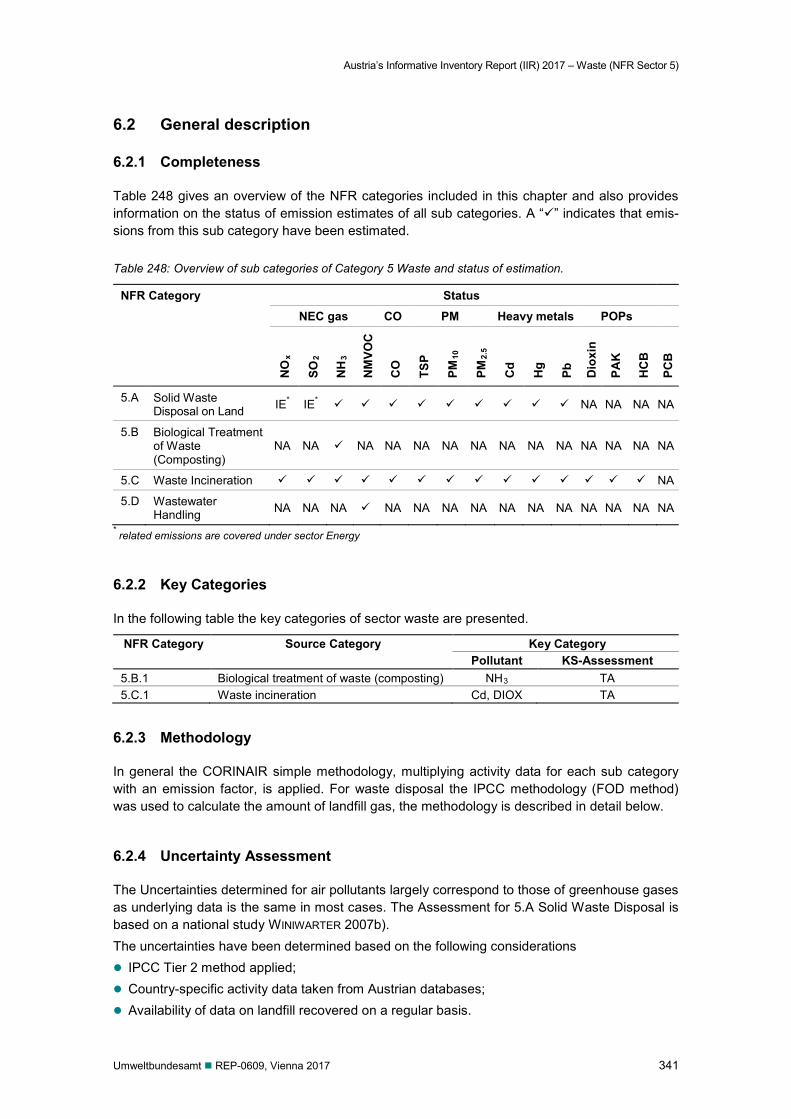
Austria’s Informative Inventory Report (IIR) 2017 – Waste (NFR Sector 5)
Umweltbundesamt REP-0609, Vienna 2017 341
6.2 General description
6.2.1 Completeness
Table 248 gives an overview of the NFR categories included in this chapter and also provides information on the status of emission estimates of all sub categories. A “” indicates that emis-sions from this sub category have been estimated.
Table 248: Overview of sub categories of Category 5 Waste and status of estimation.
NFR Category Status NEC gas CO PM Heavy metals POPs
NO
x
SO2
NH
3
NM
VOC
CO
TSP
PM10
PM2.
5
Cd
Hg
Pb
Dio
xin
PAK
HC
B
PCB
5.A Solid Waste Disposal on Land IE* IE* NA NA NA NA
5.B Biological Treatment of Waste (Composting)
NA NA NA NA NA NA NA NA NA NA NA NA NA NA
5.C Waste Incineration NA
5.D Wastewater Handling NA NA NA NA NA NA NA NA NA NA NA NA NA NA
* related emissions are covered under sector Energy
6.2.2 Key Categories
In the following table the key categories of sector waste are presented.
NFR Category Source Category Key Category Pollutant KS-Assessment
5.B.1 Biological treatment of waste (composting) NH3 TA 5.C.1 Waste incineration Cd, DIOX TA
6.2.3 Methodology
In general the CORINAIR simple methodology, multiplying activity data for each sub category with an emission factor, is applied. For waste disposal the IPCC methodology (FOD method) was used to calculate the amount of landfill gas, the methodology is described in detail below.
6.2.4 Uncertainty Assessment
The Uncertainties determined for air pollutants largely correspond to those of greenhouse gases as underlying data is the same in most cases. The Assessment for 5.A Solid Waste Disposal is based on a national study WINIWARTER 2007b). The uncertainties have been determined based on the following considerations IPCC Tier 2 method applied; Country-specific activity data taken from Austrian databases; Availability of data on landfill recovered on a regular basis.
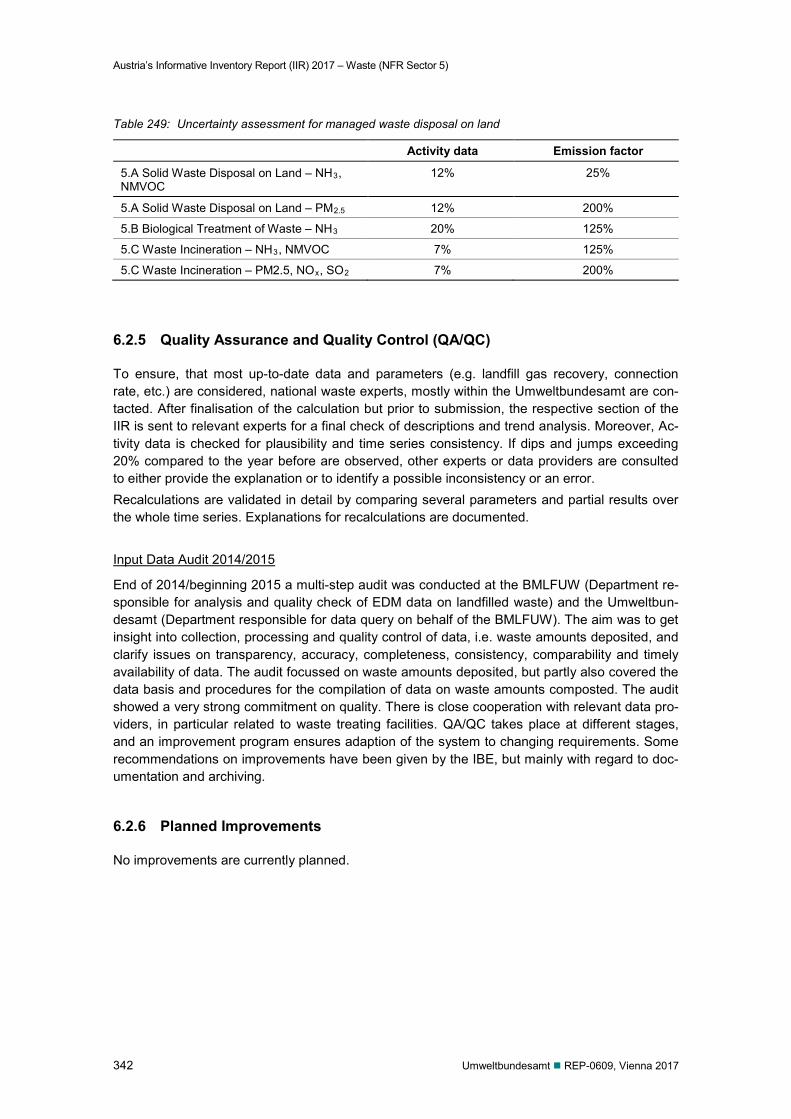
Austria’s Informative Inventory Report (IIR) 2017 – Waste (NFR Sector 5)
342 Umweltbundesamt REP-0609, Vienna 2017
Table 249: Uncertainty assessment for managed waste disposal on land
Activity data Emission factor
5.A Solid Waste Disposal on Land – NH3, NMVOC
12% 25%
5.A Solid Waste Disposal on Land – PM2.5 12% 200%
5.B Biological Treatment of Waste – NH3 20% 125%
5.C Waste Incineration – NH3, NMVOC 7% 125%
5.C Waste Incineration – PM2.5, NOx, SO2 7% 200%
6.2.5 Quality Assurance and Quality Control (QA/QC)
To ensure, that most up-to-date data and parameters (e.g. landfill gas recovery, connection rate, etc.) are considered, national waste experts, mostly within the Umweltbundesamt are con-tacted. After finalisation of the calculation but prior to submission, the respective section of the IIR is sent to relevant experts for a final check of descriptions and trend analysis. Moreover, Ac-tivity data is checked for plausibility and time series consistency. If dips and jumps exceeding 20% compared to the year before are observed, other experts or data providers are consulted to either provide the explanation or to identify a possible inconsistency or an error. Recalculations are validated in detail by comparing several parameters and partial results over the whole time series. Explanations for recalculations are documented.
Input Data Audit 2014/2015
End of 2014/beginning 2015 a multi-step audit was conducted at the BMLFUW (Department re-sponsible for analysis and quality check of EDM data on landfilled waste) and the Umweltbun-desamt (Department responsible for data query on behalf of the BMLFUW). The aim was to get insight into collection, processing and quality control of data, i.e. waste amounts deposited, and clarify issues on transparency, accuracy, completeness, consistency, comparability and timely availability of data. The audit focussed on waste amounts deposited, but partly also covered the data basis and procedures for the compilation of data on waste amounts composted. The audit showed a very strong commitment on quality. There is close cooperation with relevant data pro-viders, in particular related to waste treating facilities. QA/QC takes place at different stages, and an improvement program ensures adaption of the system to changing requirements. Some recommendations on improvements have been given by the IBE, but mainly with regard to doc-umentation and archiving.
6.2.6 Planned Improvements
No improvements are currently planned.
Austria’s Informative Inventory Report (IIR) 2017 – Waste (NFR Sector 5)
Umweltbundesamt REP-0609, Vienna 2017 343
6.3 NFR 5.A Waste Disposal on Land
6.3.1 NMVOC, NH3, CO and heavy metals emissions
6.3.1.1 Source Category Description
NFR 5.A.1 Managed waste disposal on land accounts for the main source of NH3 and NMVOC emissions of NFR Category 5 Waste. In Austria all waste disposal sites are managed landfills.
In the Austrian inventory two main categories of waste are distinguished: residual waste and non-residual waste. Residual waste refers only to the part of municipal solid waste130 collected by the municipal system (mixed composition) that is directly deposited without any pre-treatment. Non-residual waste comprises among others municipal solid waste having been pre-treated, sludges from wastewater treatment and waste from industrial sources.
‘Residual waste’ corresponds to waste: originating from households and similar sources (private households, administrative facilities
of commerce, industry and public administration, kindergartens, schools, hospitals, small en-terprises, agriculture, market places and other generation points)
remaining after separation of paper, glass, plastic etc. at the source covered by the municipal waste collecting system directly landfilled without having passed any pre-treatment
It has to be noted that from 2009 on no waste is allowed to be deposited any more without be-ing pre-treated (due to the Landfill Ordinance131), so since 2009 no disposal of ‘residual waste’ is reported by landfill operators and therefore no new depositions of residual waste is taken into account in the inventory. Emissions from this subcategory are therefore only affected by histori-cal depositions.
Waste from households and similar sources covered by the municipal waste collecting system but undergoing a pre-treatment before deposition is not included in this category, but in catego-ry “non-residual waste” (sub-category “sorting residues”, among others from mechanical-bio-logical treatment) and in sector “energy” respectively, as incineration is a pre-treatment option too.
‘Non-residual waste’: comprises pre-treated waste from households (e.g. residues from mechanical-biological
treatment) and waste with biodegradable lots from other (industrial) sources is divided into the categories wood, construction waste, paper, green waste, sludge, sorting
residues/stabilized material (incl. bulky waste), textiles and fats
Stabilized material and sorting residues remaining after mechanical, biological and mechanical-biological treatment and bulky waste are the main fraction deposited (98%). Some minor amounts of sludge, construction waste and paper with little TOC content (below the threshold for TOC disposal) are landfilled as well. Bio waste, paper and wood are mainly composted, re-cycled or reused due to the implementing of the Waste Management Law, fats and textiles are not deposited any more.
130 i.e. waste from households as well as other waste which, because of its nature or composition, is similar to waste
from household (Article 2 (b): Council Directive 1999/31/EC of 26.April 1999 on the landfill of waste). 131 Ordinance on Landfills (Landfill Ordinance 2004), Federal Law Gazette No 164/1996 as amended by Federal Law
Gazette No 49/2004; Ordinance on Landfills (Landfill Ordinance 2008), Federal Law Gazette II No 39/2008 as amended by Federal Law Gazette II No 185/2009
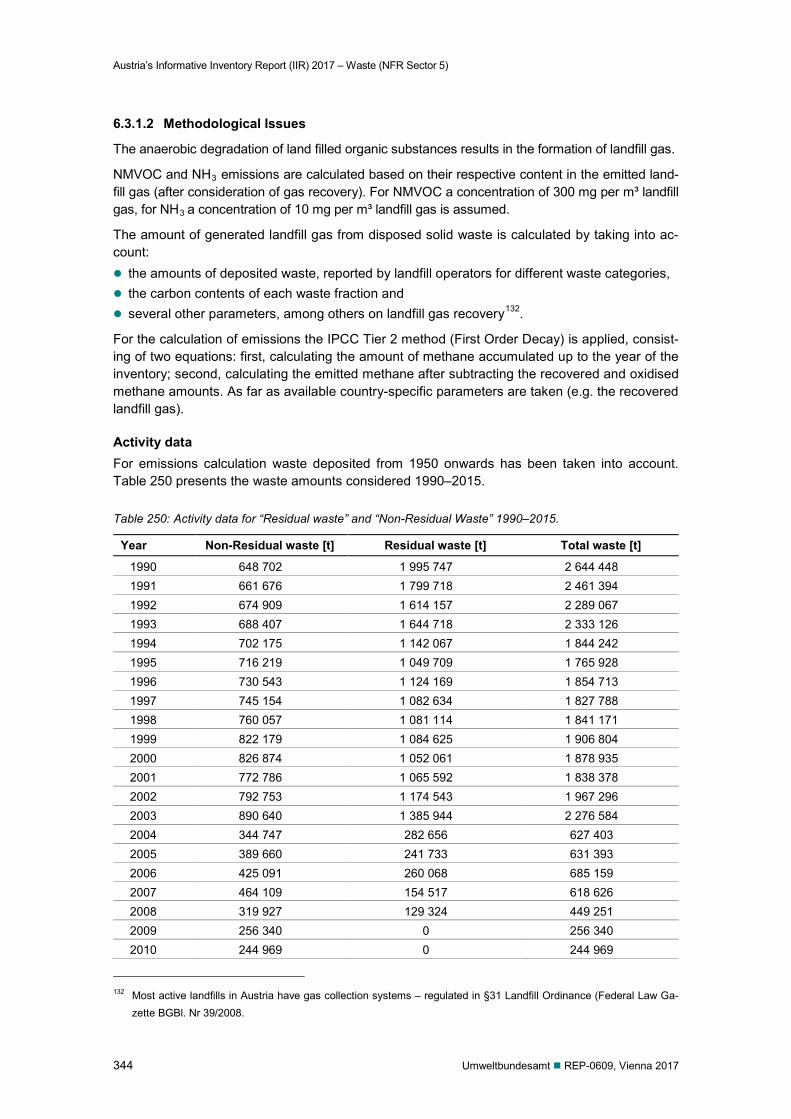
Austria’s Informative Inventory Report (IIR) 2017 – Waste (NFR Sector 5)
344 Umweltbundesamt REP-0609, Vienna 2017
6.3.1.2 Methodological Issues
The anaerobic degradation of land filled organic substances results in the formation of landfill gas.
NMVOC and NH3 emissions are calculated based on their respective content in the emitted land-fill gas (after consideration of gas recovery). For NMVOC a concentration of 300 mg per m³ landfill gas, for NH3 a concentration of 10 mg per m³ landfill gas is assumed.
The amount of generated landfill gas from disposed solid waste is calculated by taking into ac-count: the amounts of deposited waste, reported by landfill operators for different waste categories, the carbon contents of each waste fraction and several other parameters, among others on landfill gas recovery132.
For the calculation of emissions the IPCC Tier 2 method (First Order Decay) is applied, consist-ing of two equations: first, calculating the amount of methane accumulated up to the year of the inventory; second, calculating the emitted methane after subtracting the recovered and oxidised methane amounts. As far as available country-specific parameters are taken (e.g. the recovered landfill gas).
Activity data For emissions calculation waste deposited from 1950 onwards has been taken into account. Table 250 presents the waste amounts considered 1990–2015.
Table 250: Activity data for “Residual waste” and “Non-Residual Waste” 1990–2015.
Year Non-Residual waste [t] Residual waste [t] Total waste [t]
1990 648 702 1 995 747 2 644 448 1991 661 676 1 799 718 2 461 394 1992 674 909 1 614 157 2 289 067 1993 688 407 1 644 718 2 333 126 1994 702 175 1 142 067 1 844 242 1995 716 219 1 049 709 1 765 928 1996 730 543 1 124 169 1 854 713 1997 745 154 1 082 634 1 827 788 1998 760 057 1 081 114 1 841 171 1999 822 179 1 084 625 1 906 804 2000 826 874 1 052 061 1 878 935 2001 772 786 1 065 592 1 838 378 2002 792 753 1 174 543 1 967 296 2003 890 640 1 385 944 2 276 584 2004 344 747 282 656 627 403 2005 389 660 241 733 631 393 2006 425 091 260 068 685 159 2007 464 109 154 517 618 626 2008 319 927 129 324 449 251 2009 256 340 0 256 340 2010 244 969 0 244 969
132 Most active landfills in Austria have gas collection systems – regulated in §31 Landfill Ordinance (Federal Law Ga-
zette BGBl. Nr 39/2008.
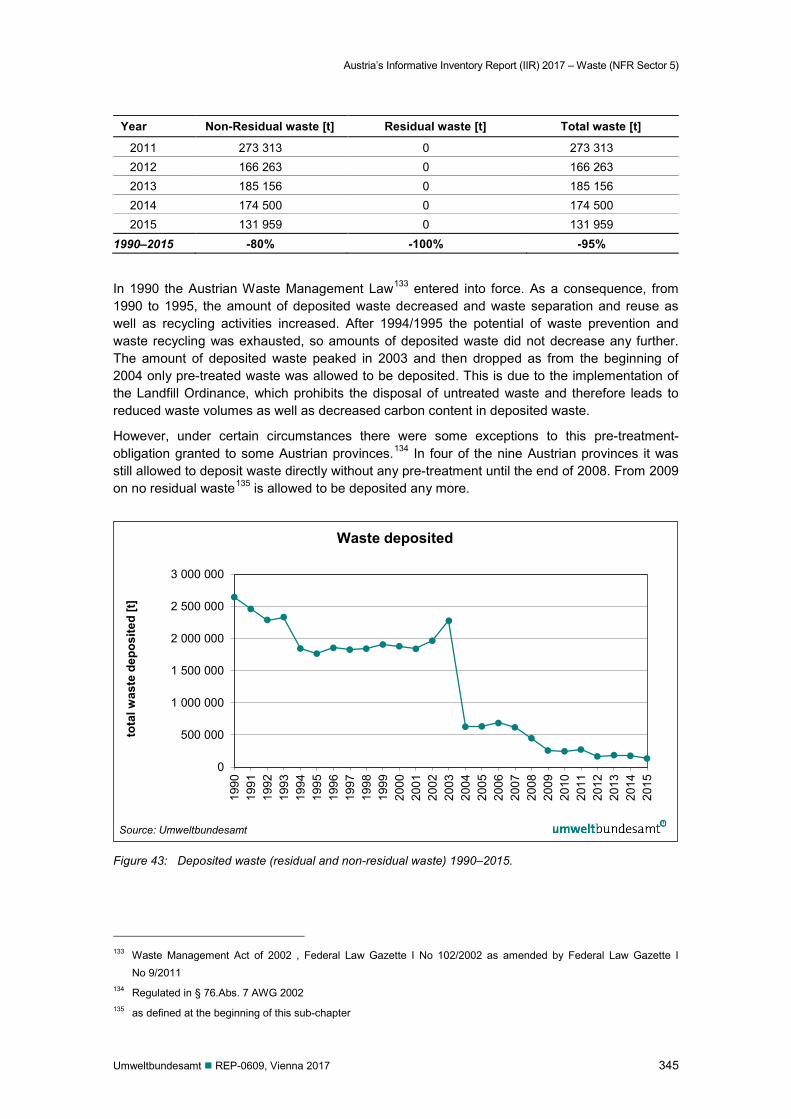
Austria’s Informative Inventory Report (IIR) 2017 – Waste (NFR Sector 5)
Umweltbundesamt REP-0609, Vienna 2017 345
Year Non-Residual waste [t] Residual waste [t] Total waste [t]
2011 273 313 0 273 313 2012 166 263 0 166 263 2013 185 156 0 185 156 2014 174 500 0 174 500 2015 131 959 0 131 959
1990–2015 -80% -100% -95%
In 1990 the Austrian Waste Management Law133 entered into force. As a consequence, from 1990 to 1995, the amount of deposited waste decreased and waste separation and reuse as well as recycling activities increased. After 1994/1995 the potential of waste prevention and waste recycling was exhausted, so amounts of deposited waste did not decrease any further. The amount of deposited waste peaked in 2003 and then dropped as from the beginning of 2004 only pre-treated waste was allowed to be deposited. This is due to the implementation of the Landfill Ordinance, which prohibits the disposal of untreated waste and therefore leads to reduced waste volumes as well as decreased carbon content in deposited waste.
However, under certain circumstances there were some exceptions to this pre-treatment-obligation granted to some Austrian provinces.134 In four of the nine Austrian provinces it was still allowed to deposit waste directly without any pre-treatment until the end of 2008. From 2009 on no residual waste135 is allowed to be deposited any more.
Figure 43: Deposited waste (residual and non-residual waste) 1990–2015.
133 Waste Management Act of 2002 , Federal Law Gazette I No 102/2002 as amended by Federal Law Gazette I
No 9/2011 134 Regulated in § 76.Abs. 7 AWG 2002 135 as defined at the beginning of this sub-chapter
0
500 000
1 000 000
1 500 000
2 000 000
2 500 000
3 000 000
1990
1991
1992
1993
1994
1995
1996
1997
1998
1999
2000
2001
2002
2003
2004
2005
2006
2007
2008
2009
2010
2011
2012
2013
2014
2015
tota
l was
te d
epos
ited
[t]
Waste deposited
Source: Umweltbundesamt
Austria’s Informative Inventory Report (IIR) 2017 – Waste (NFR Sector 5)
346 Umweltbundesamt REP-0609, Vienna 2017
The quantities of “residual waste” have been taken from the following sources: Data for 2008–2015 have been taken from the EDM136, an electronic database administered
by the BMLFUW. Since the beginning of 2009 landfill operators are obliged to register their data directly and electronically (per upload) at the portal of http://edm.gv.at138.
Data for 1998–2007 were taken from a database for solid waste disposals called “Deponie-datenbank” (‘Austrian landfill database’), a database administered and maintained by the Umweltbundesamt until the end of 2008.
Data for 1950–1997 on the amounts of deposited residual waste were taken from national studies (HACKL & MAUSCHITZ 1999, UMWELTBUNDESAMT 2001c) and the respective Federal Waste Management Plans (BUNDESABFALLWIRTSCHAFTPLAN 1995, 2001).
In the national study (HACKL & MAUSCHITZ 1999) as well as in the Federal Waste Management Plans the amounts of residual waste from administrative facilities of businesses and industries were not considered and therefore originally not included in the data of the years 1950 to 1999. Waste from these sources is however deposited and hence reported by the operators of landfill sites (therefore included in the Austrian landfill database) and thus considered in the time series from 1998 onwards. To achieve a consistent time series, data of the two overlapping years139 (1998 and 1999) were examined and the difference – which represents the residual waste from administrative facilities of industries and businesses – was calculated. This difference, relative to the change of residual waste from households, was then applied to the years 1950 to 1997 accordingly.
The quantities of “non-residual waste” from 1998 to 2007 were taken from the database for solid waste disposal “Deponiedatenbank” (“Austrian landfill database”), the values for 2008 onwards were taken from the EDM140 (Electronic Data Management). Only the amounts of waste with bi-odegradable lots were considered. Table 251 presents a summary of all considered waste types and the corresponding numbers (list of waste). For calculating the emissions of residual waste the waste types were aggregated to the categories wood, paper, sludge, other waste, bio waste, textiles, construction waste and fats. There are no data available for the years before 1998. Thus extrapolation was done using the Austrian GDP (gross domestic product) per inhabitant (KAUSEL 1998) as indicator using a 20 year average value in order to get a more robust esti-mate.
136 Electronic Data Management 137 According to § 41 (1) Landfill Ordinance, Federal Law Gazette BGBl. Nr 39/2008 138 According to §41 (1) Landfill Ordinance, Federal Law Gazette BGBl. Nr 39/2008 139 Data available from the Federal Waste Management Plan (Bundesabfallwirtschaftsplan - BAWP) as well as from the
Austrian landfill database. 140 Electronic Data Management (EDM): part of the eGovernment-strategy of the Austrian Government, registration re-
quirements and reports in the field of environment. https://secure.umweltbundesamt.at/edm_portal/home.do?wfjs_enabled=true&wfjs_orig_req=/home.do
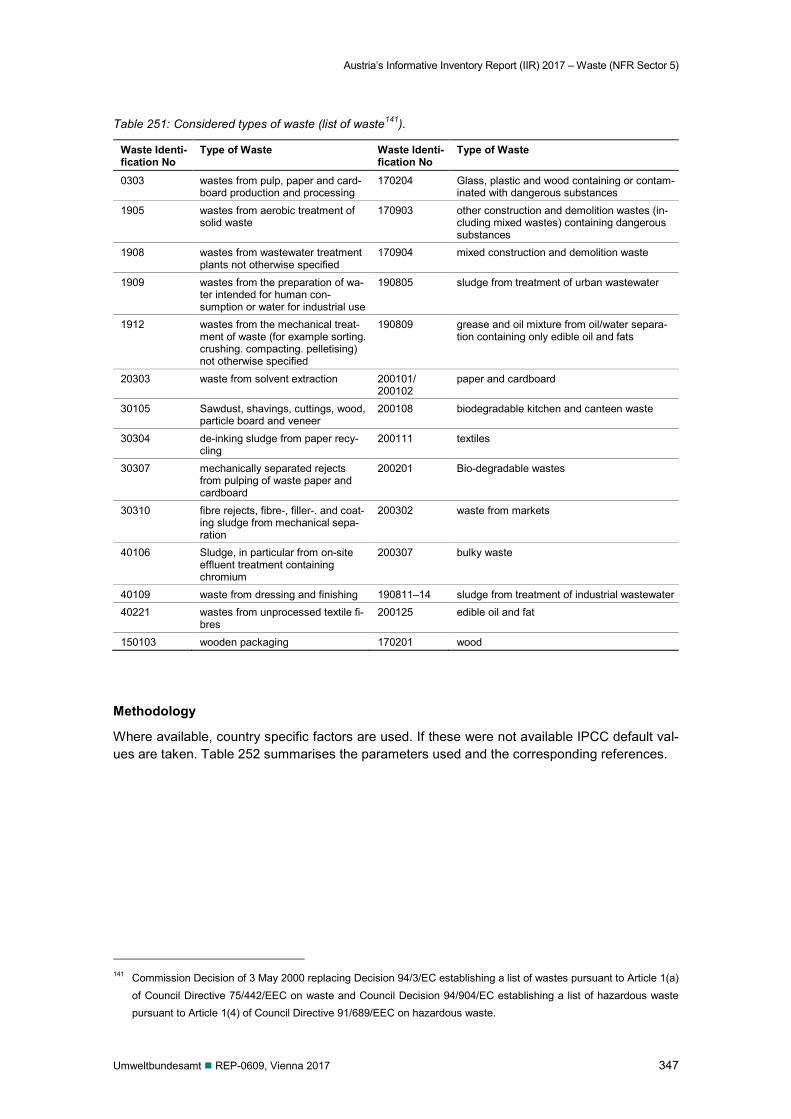
Austria’s Informative Inventory Report (IIR) 2017 – Waste (NFR Sector 5)
Umweltbundesamt REP-0609, Vienna 2017 347
Table 251: Considered types of waste (list of waste141).
Waste Identi-fication No
Type of Waste Waste Identi-fication No
Type of Waste
0303 wastes from pulp, paper and card-board production and processing
170204 Glass, plastic and wood containing or contam-inated with dangerous substances
1905 wastes from aerobic treatment of solid waste
170903 other construction and demolition wastes (in-cluding mixed wastes) containing dangerous substances
1908 wastes from wastewater treatment plants not otherwise specified
170904 mixed construction and demolition waste
1909 wastes from the preparation of wa-ter intended for human con-sumption or water for industrial use
190805 sludge from treatment of urban wastewater
1912 wastes from the mechanical treat-ment of waste (for example sorting. crushing. compacting. pelletising) not otherwise specified
190809 grease and oil mixture from oil/water separa-tion containing only edible oil and fats
20303 waste from solvent extraction 200101/ 200102
paper and cardboard
30105 Sawdust, shavings, cuttings, wood, particle board and veneer
200108 biodegradable kitchen and canteen waste
30304 de-inking sludge from paper recy-cling
200111 textiles
30307 mechanically separated rejects from pulping of waste paper and cardboard
200201 Bio-degradable wastes
30310 fibre rejects, fibre-, filler-. and coat-ing sludge from mechanical sepa-ration
200302 waste from markets
40106 Sludge, in particular from on-site effluent treatment containing chromium
200307 bulky waste
40109 waste from dressing and finishing 190811–14 sludge from treatment of industrial wastewater 40221 wastes from unprocessed textile fi-
bres 200125 edible oil and fat
150103 wooden packaging 170201 wood
Methodology
Where available, country specific factors are used. If these were not available IPCC default val-ues are taken. Table 252 summarises the parameters used and the corresponding references.
141 Commission Decision of 3 May 2000 replacing Decision 94/3/EC establishing a list of wastes pursuant to Article 1(a)
of Council Directive 75/442/EEC on waste and Council Decision 94/904/EC establishing a list of hazardous waste pursuant to Article 1(4) of Council Directive 91/689/EEC on hazardous waste.
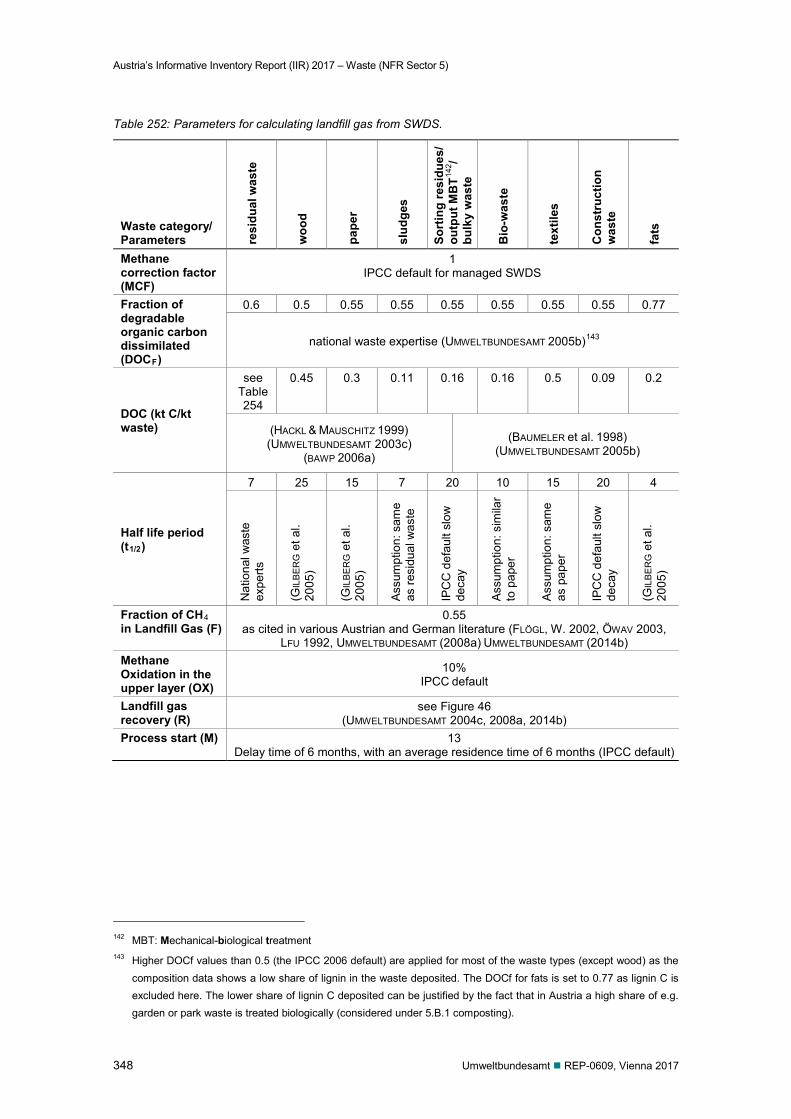
Austria’s Informative Inventory Report (IIR) 2017 – Waste (NFR Sector 5)
348 Umweltbundesamt REP-0609, Vienna 2017
Table 252: Parameters for calculating landfill gas from SWDS.
Waste category/ Parameters re
sidu
al w
aste
woo
d
pape
r
slud
ges
Sort
ing
resi
dues
/ ou
tput
MB
T142 /
bulk
y w
aste
Bio
-was
te
text
iles
Con
stru
ctio
n w
aste
fats
Methane correction factor (MCF)
1 IPCC default for managed SWDS
Fraction of degradable organic carbon dissimilated (DOCF)
0.6 0.5 0.55 0.55 0.55 0.55 0.55 0.55 0.77
national waste expertise (UMWELTBUNDESAMT 2005b)143
DOC (kt C/kt waste)
see Table 254
0.45 0.3 0.11 0.16 0.16 0.5 0.09 0.2
(HACKL & MAUSCHITZ 1999) (UMWELTBUNDESAMT 2003c)
(BAWP 2006a)
(BAUMELER et al. 1998) (UMWELTBUNDESAMT 2005b)
Half life period (t1/2)
7 25 15 7 20 10 15 20 4
Nat
iona
l was
te
expe
rts
(GIL
BE
RG
et a
l. 20
05)
(GIL
BE
RG
et a
l. 20
05)
Ass
umpt
ion:
sam
e as
resi
dual
was
te
IPC
C d
efau
lt sl
ow
deca
y
Ass
umpt
ion:
sim
ilar
to p
aper
Ass
umpt
ion:
sam
e as
pap
er
IPC
C d
efau
lt sl
ow
deca
y
(GIL
BE
RG
et a
l. 20
05)
Fraction of CH4 in Landfill Gas (F)
0.55 as cited in various Austrian and German literature (FLÖGL, W. 2002, ÖWAV 2003,
LFU 1992, UMWELTBUNDESAMT (2008a) UMWELTBUNDESAMT (2014b) Methane Oxidation in the upper layer (OX)
10% IPCC default
Landfill gas recovery (R)
see Figure 46 (UMWELTBUNDESAMT 2004c, 2008a, 2014b)
Process start (M) 13 Delay time of 6 months, with an average residence time of 6 months (IPCC default)
142 MBT: Mechanical-biological treatment 143 Higher DOCf values than 0.5 (the IPCC 2006 default) are applied for most of the waste types (except wood) as the
composition data shows a low share of lignin in the waste deposited. The DOCf for fats is set to 0.77 as lignin C is excluded here. The lower share of lignin C deposited can be justified by the fact that in Austria a high share of e.g. garden or park waste is treated biologically (considered under 5.B.1 composting).
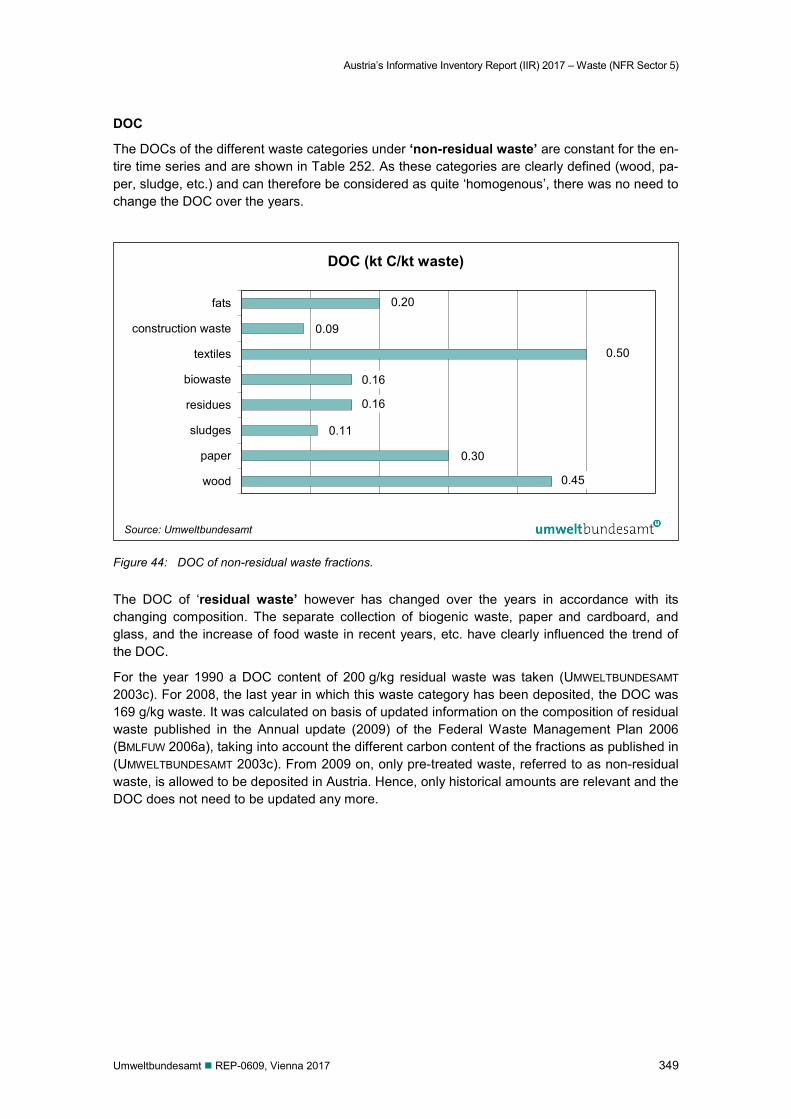
Austria’s Informative Inventory Report (IIR) 2017 – Waste (NFR Sector 5)
Umweltbundesamt REP-0609, Vienna 2017 349
DOC
The DOCs of the different waste categories under ‘non-residual waste’ are constant for the en-tire time series and are shown in Table 252. As these categories are clearly defined (wood, pa-per, sludge, etc.) and can therefore be considered as quite ‘homogenous’, there was no need to change the DOC over the years.
Figure 44: DOC of non-residual waste fractions.
The DOC of ‘residual waste’ however has changed over the years in accordance with its changing composition. The separate collection of biogenic waste, paper and cardboard, and glass, and the increase of food waste in recent years, etc. have clearly influenced the trend of the DOC.
For the year 1990 a DOC content of 200 g/kg residual waste was taken (UMWELTBUNDESAMT 2003c). For 2008, the last year in which this waste category has been deposited, the DOC was 169 g/kg waste. It was calculated on basis of updated information on the composition of residual waste published in the Annual update (2009) of the Federal Waste Management Plan 2006 (BMLFUW 2006a), taking into account the different carbon content of the fractions as published in (UMWELTBUNDESAMT 2003c). From 2009 on, only pre-treated waste, referred to as non-residual waste, is allowed to be deposited in Austria. Hence, only historical amounts are relevant and the DOC does not need to be updated any more.
0.45
0.30
0.11
0.16
0.16
0.50
0.09
0.20
wood
paper
sludges
residues
biowaste
textiles
construction waste
fats
DOC (kt C/kt waste)
Source: Umweltbundesamt
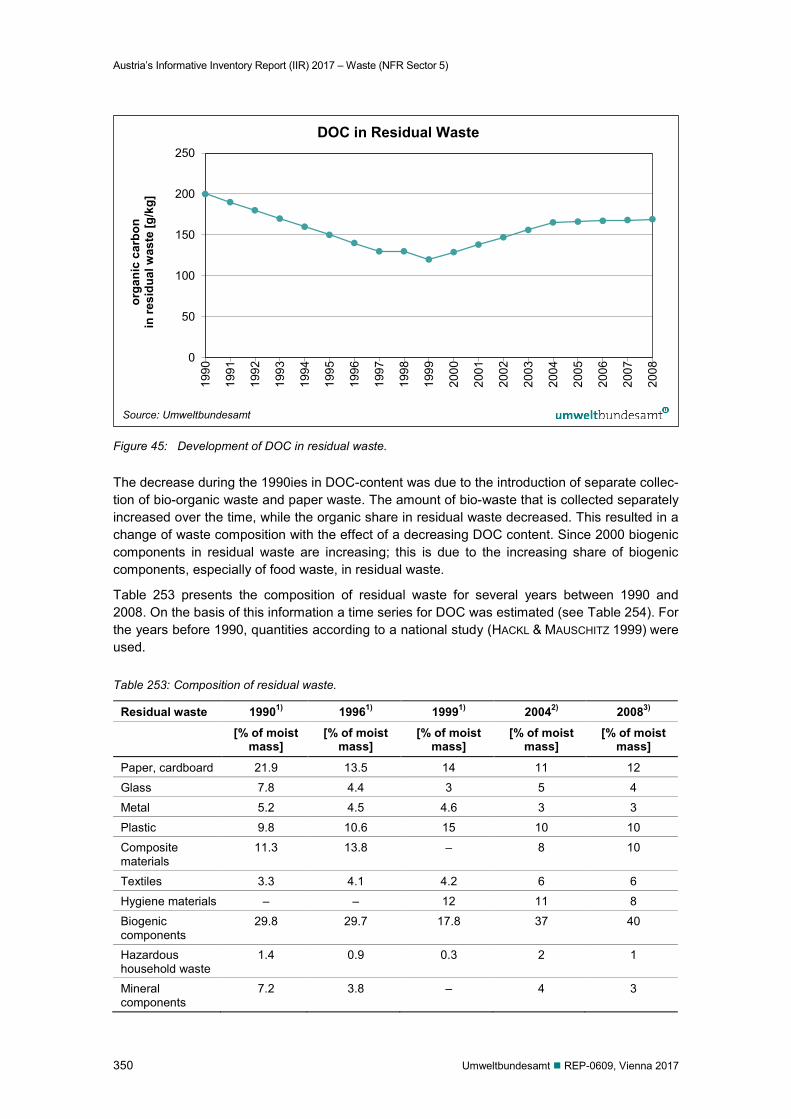
Austria’s Informative Inventory Report (IIR) 2017 – Waste (NFR Sector 5)
350 Umweltbundesamt REP-0609, Vienna 2017
Figure 45: Development of DOC in residual waste.
The decrease during the 1990ies in DOC-content was due to the introduction of separate collec-tion of bio-organic waste and paper waste. The amount of bio-waste that is collected separately increased over the time, while the organic share in residual waste decreased. This resulted in a change of waste composition with the effect of a decreasing DOC content. Since 2000 biogenic components in residual waste are increasing; this is due to the increasing share of biogenic components, especially of food waste, in residual waste.
Table 253 presents the composition of residual waste for several years between 1990 and 2008. On the basis of this information a time series for DOC was estimated (see Table 254). For the years before 1990, quantities according to a national study (HACKL & MAUSCHITZ 1999) were used.
Table 253: Composition of residual waste.
Residual waste 19901) 19961) 19991) 20042) 20083) [% of moist
mass] [% of moist
mass] [% of moist
mass] [% of moist
mass] [% of moist
mass]
Paper, cardboard 21.9 13.5 14 11 12
Glass 7.8 4.4 3 5 4
Metal 5.2 4.5 4.6 3 3
Plastic 9.8 10.6 15 10 10
Composite materials
11.3 13.8 – 8 10
Textiles 3.3 4.1 4.2 6 6
Hygiene materials – – 12 11 8
Biogenic components
29.8 29.7 17.8 37 40
Hazardous household waste
1.4 0.9 0.3 2 1
Mineral components
7.2 3.8 – 4 3
0
50
100
150
200
250
1990
1991
1992
1993
1994
1995
1996
1997
1998
1999
2000
2001
2002
2003
2004
2005
2006
2007
2008
orga
nic
carb
on
in re
sidu
al w
aste
[g/k
g]
DOC in Residual Waste
Source: Umweltbundesamt
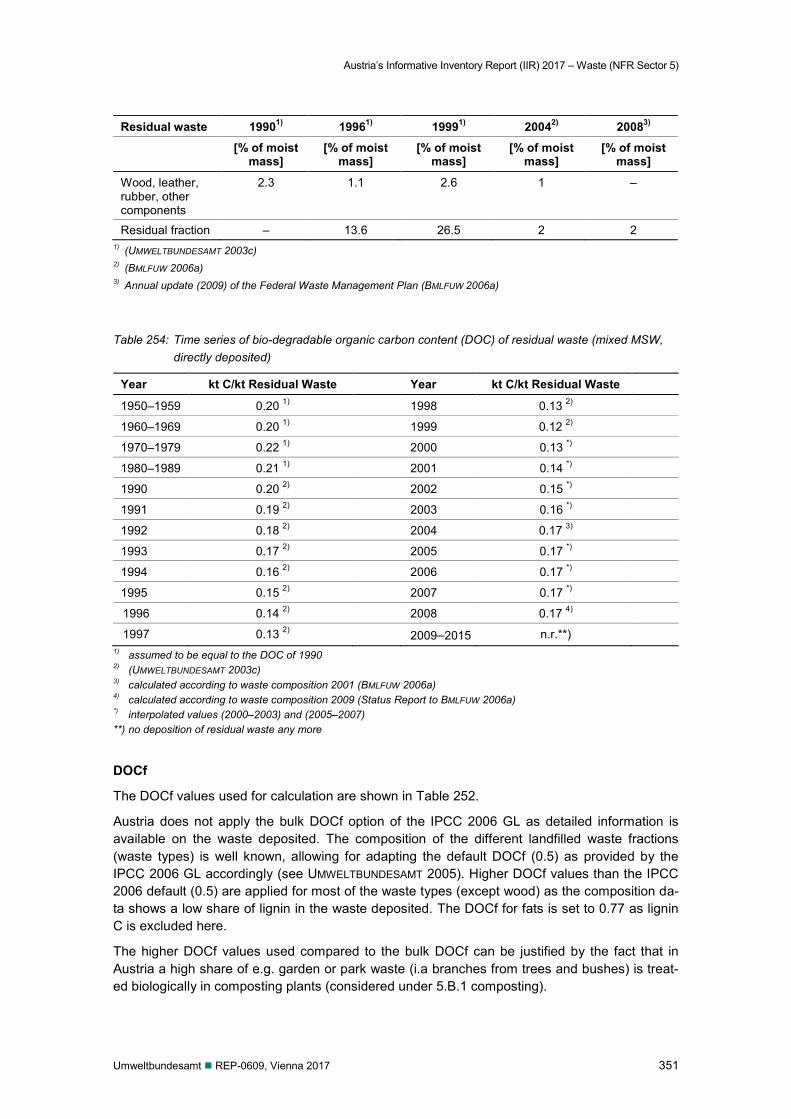
Austria’s Informative Inventory Report (IIR) 2017 – Waste (NFR Sector 5)
Umweltbundesamt REP-0609, Vienna 2017 351
Residual waste 19901) 19961) 19991) 20042) 20083) [% of moist
mass] [% of moist
mass] [% of moist
mass] [% of moist
mass] [% of moist
mass]
Wood, leather, rubber, other components
2.3 1.1 2.6 1 –
Residual fraction – 13.6 26.5 2 2 1) (UMWELTBUNDESAMT 2003c) 2) (BMLFUW 2006a) 3) Annual update (2009) of the Federal Waste Management Plan (BMLFUW 2006a)
Table 254: Time series of bio-degradable organic carbon content (DOC) of residual waste (mixed MSW, directly deposited)
Year kt C/kt Residual Waste Year kt C/kt Residual Waste
1950–1959 0.20 1) 1998 0.13 2)
1960–1969 0.20 1) 1999 0.12 2)
1970–1979 0.22 1) 2000 0.13 *)
1980–1989 0.21 1) 2001 0.14 *)
1990 0.20 2) 2002 0.15 *)
1991 0.19 2) 2003 0.16 *)
1992 0.18 2) 2004 0.17 3)
1993 0.17 2) 2005 0.17 *)
1994 0.16 2) 2006 0.17 *)
1995 0.15 2) 2007 0.17 *)
1996 0.14 2) 2008 0.17 4)
1997 0.13 2) 2009–2015 n.r.**) 1) assumed to be equal to the DOC of 1990 2) (UMWELTBUNDESAMT 2003c) 3) calculated according to waste composition 2001 (BMLFUW 2006a) 4) calculated according to waste composition 2009 (Status Report to BMLFUW 2006a) *) interpolated values (2000–2003) and (2005–2007) **) no deposition of residual waste any more
DOCf
The DOCf values used for calculation are shown in Table 252.
Austria does not apply the bulk DOCf option of the IPCC 2006 GL as detailed information is available on the waste deposited. The composition of the different landfilled waste fractions (waste types) is well known, allowing for adapting the default DOCf (0.5) as provided by the IPCC 2006 GL accordingly (see UMWELTBUNDESAMT 2005). Higher DOCf values than the IPCC 2006 default (0.5) are applied for most of the waste types (except wood) as the composition da-ta shows a low share of lignin in the waste deposited. The DOCf for fats is set to 0.77 as lignin C is excluded here.
The higher DOCf values used compared to the bulk DOCf can be justified by the fact that in Austria a high share of e.g. garden or park waste (i.a branches from trees and bushes) is treat-ed biologically in composting plants (considered under 5.B.1 composting).
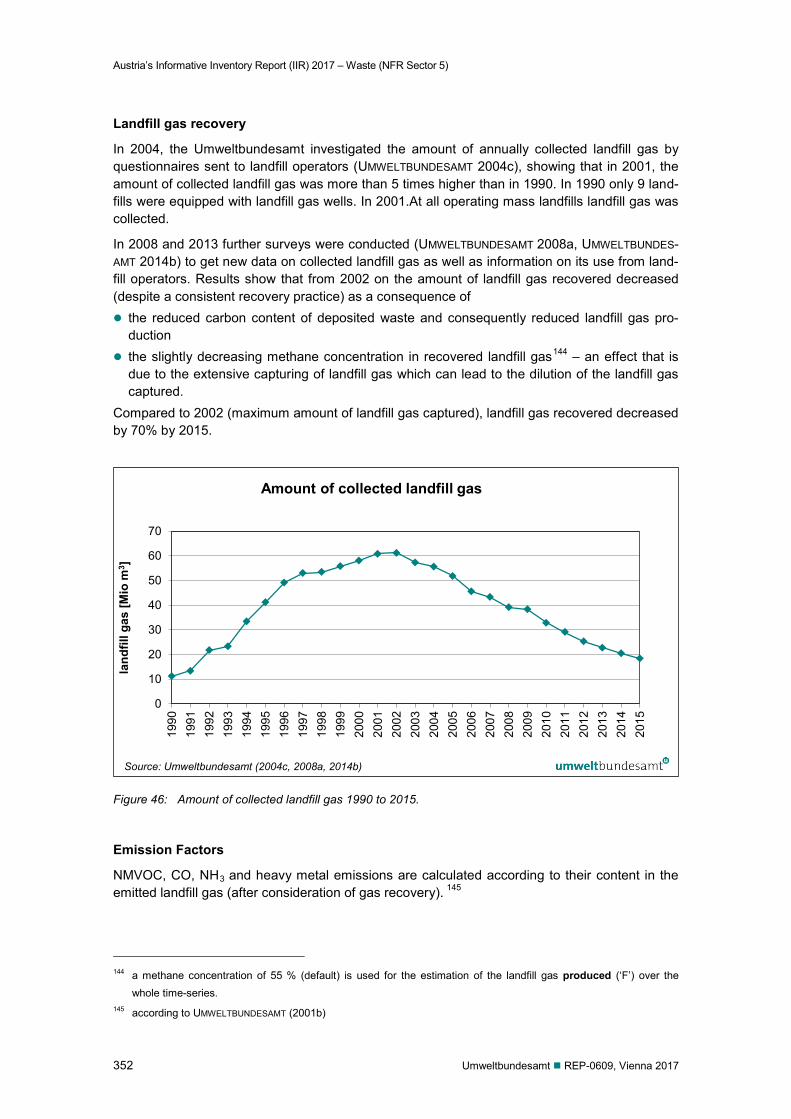
Austria’s Informative Inventory Report (IIR) 2017 – Waste (NFR Sector 5)
352 Umweltbundesamt REP-0609, Vienna 2017
Landfill gas recovery
In 2004, the Umweltbundesamt investigated the amount of annually collected landfill gas by questionnaires sent to landfill operators (UMWELTBUNDESAMT 2004c), showing that in 2001, the amount of collected landfill gas was more than 5 times higher than in 1990. In 1990 only 9 land-fills were equipped with landfill gas wells. In 2001.At all operating mass landfills landfill gas was collected.
In 2008 and 2013 further surveys were conducted (UMWELTBUNDESAMT 2008a, UMWELTBUNDES-AMT 2014b) to get new data on collected landfill gas as well as information on its use from land-fill operators. Results show that from 2002 on the amount of landfill gas recovered decreased (despite a consistent recovery practice) as a consequence of the reduced carbon content of deposited waste and consequently reduced landfill gas pro-
duction the slightly decreasing methane concentration in recovered landfill gas144 – an effect that is
due to the extensive capturing of landfill gas which can lead to the dilution of the landfill gas captured.
Compared to 2002 (maximum amount of landfill gas captured), landfill gas recovered decreased by 70% by 2015.
Figure 46: Amount of collected landfill gas 1990 to 2015.
Emission Factors
NMVOC, CO, NH3 and heavy metal emissions are calculated according to their content in the emitted landfill gas (after consideration of gas recovery). 145
144 a methane concentration of 55 % (default) is used for the estimation of the landfill gas produced (‘F’) over the
whole time-series. 145 according to UMWELTBUNDESAMT (2001b)
0
10
20
30
40
50
60
70
1990
1991
1992
1993
1994
1995
1996
1997
1998
1999
2000
2001
2002
2003
2004
2005
2006
2007
2008
2009
2010
2011
2012
2013
2014
2015
land
fill g
as [M
io m
3 ]
Amount of collected landfill gas
Source: Umweltbundesamt (2004c, 2008a, 2014b)
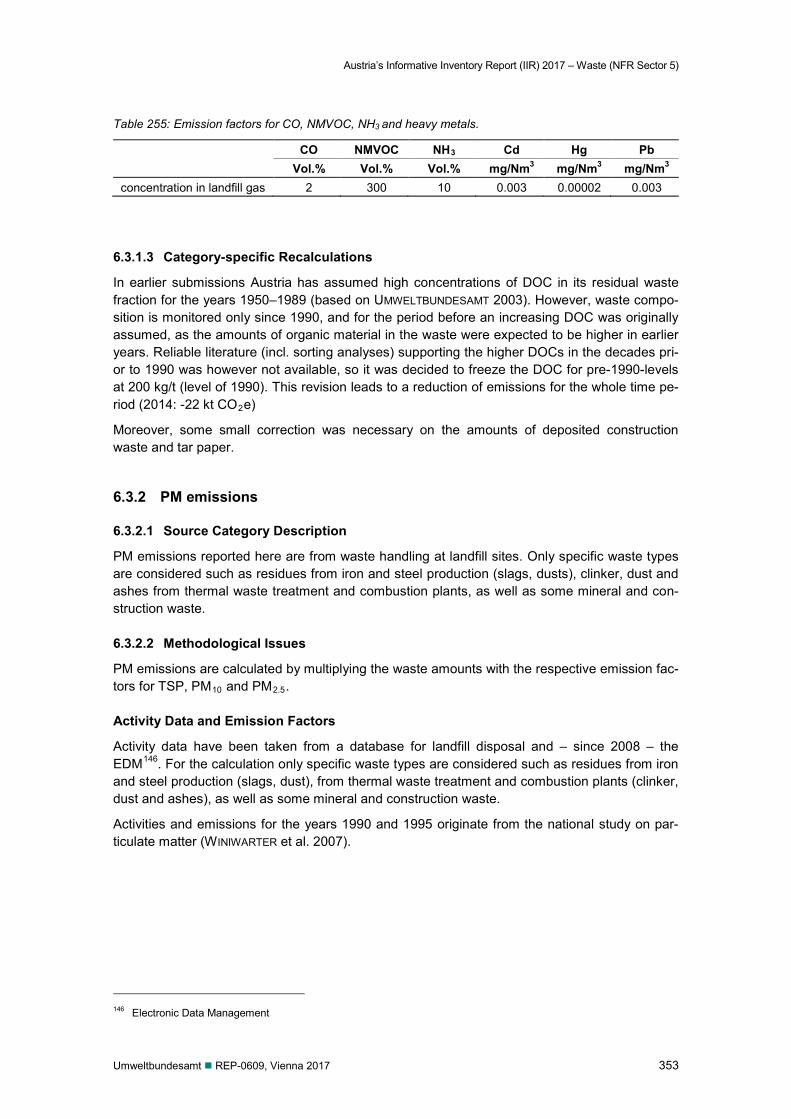
Austria’s Informative Inventory Report (IIR) 2017 – Waste (NFR Sector 5)
Umweltbundesamt REP-0609, Vienna 2017 353
Table 255: Emission factors for CO, NMVOC, NH3 and heavy metals.
CO NMVOC NH3 Cd Hg Pb Vol.% Vol.% Vol.% mg/Nm3 mg/Nm3 mg/Nm3
concentration in landfill gas 2 300 10 0.003 0.00002 0.003
6.3.1.3 Category-specific Recalculations
In earlier submissions Austria has assumed high concentrations of DOC in its residual waste fraction for the years 1950–1989 (based on UMWELTBUNDESAMT 2003). However, waste compo-sition is monitored only since 1990, and for the period before an increasing DOC was originally assumed, as the amounts of organic material in the waste were expected to be higher in earlier years. Reliable literature (incl. sorting analyses) supporting the higher DOCs in the decades pri-or to 1990 was however not available, so it was decided to freeze the DOC for pre-1990-levels at 200 kg/t (level of 1990). This revision leads to a reduction of emissions for the whole time pe-riod (2014: -22 kt CO2e)
Moreover, some small correction was necessary on the amounts of deposited construction waste and tar paper.
6.3.2 PM emissions
6.3.2.1 Source Category Description
PM emissions reported here are from waste handling at landfill sites. Only specific waste types are considered such as residues from iron and steel production (slags, dusts), clinker, dust and ashes from thermal waste treatment and combustion plants, as well as some mineral and con-struction waste. 6.3.2.2 Methodological Issues
PM emissions are calculated by multiplying the waste amounts with the respective emission fac-tors for TSP, PM10 and PM2.5. Activity Data and Emission Factors
Activity data have been taken from a database for landfill disposal and – since 2008 – the EDM146. For the calculation only specific waste types are considered such as residues from iron and steel production (slags, dust), from thermal waste treatment and combustion plants (clinker, dust and ashes), as well as some mineral and construction waste.
Activities and emissions for the years 1990 and 1995 originate from the national study on par-ticulate matter (WINIWARTER et al. 2007).
146 Electronic Data Management
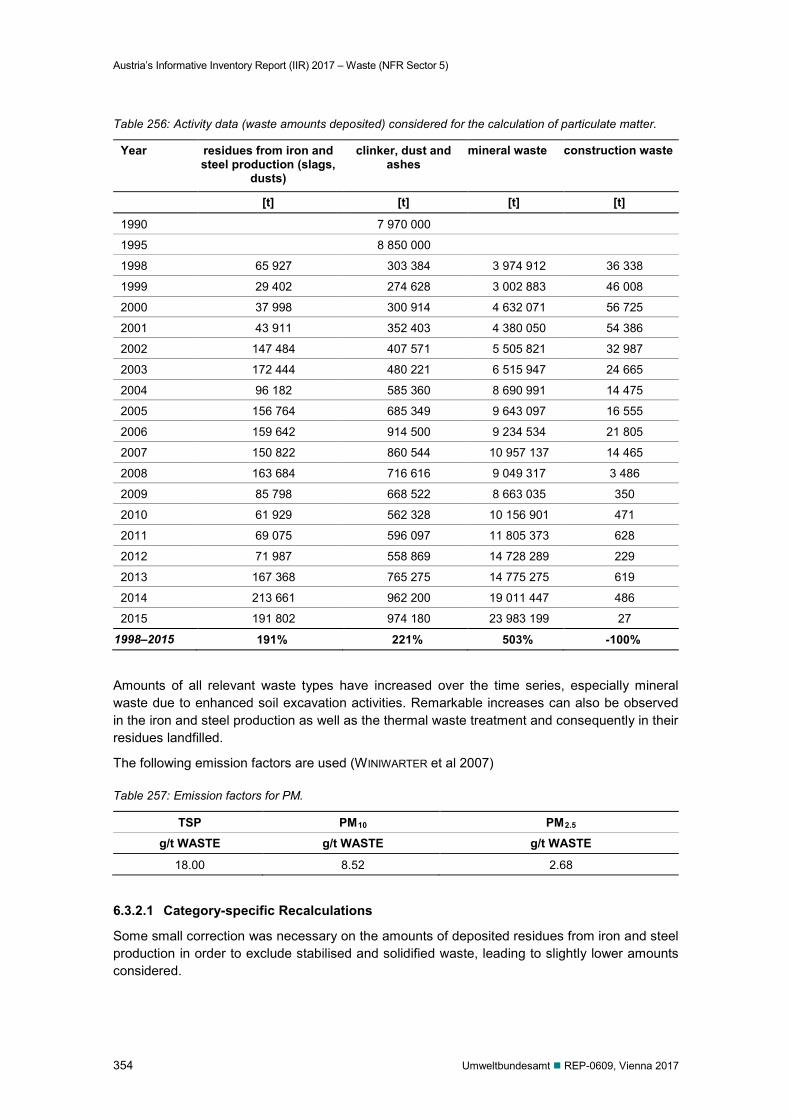
Austria’s Informative Inventory Report (IIR) 2017 – Waste (NFR Sector 5)
354 Umweltbundesamt REP-0609, Vienna 2017
Table 256: Activity data (waste amounts deposited) considered for the calculation of particulate matter.
Year residues from iron and steel production (slags,
dusts)
clinker, dust and ashes
mineral waste
construction waste
[t] [t] [t] [t]
1990 7 970 000
1995 8 850 000
1998 65 927 303 384 3 974 912 36 338
1999 29 402 274 628 3 002 883 46 008
2000 37 998 300 914 4 632 071 56 725
2001 43 911 352 403 4 380 050 54 386
2002 147 484 407 571 5 505 821 32 987
2003 172 444 480 221 6 515 947 24 665
2004 96 182 585 360 8 690 991 14 475
2005 156 764 685 349 9 643 097 16 555
2006 159 642 914 500 9 234 534 21 805
2007 150 822 860 544 10 957 137 14 465
2008 163 684 716 616 9 049 317 3 486
2009 85 798 668 522 8 663 035 350
2010 61 929 562 328 10 156 901 471
2011 69 075 596 097 11 805 373 628
2012 71 987 558 869 14 728 289 229
2013 167 368 765 275 14 775 275 619
2014 213 661 962 200 19 011 447 486
2015 191 802 974 180 23 983 199 27
1998–2015 191% 221% 503% -100%
Amounts of all relevant waste types have increased over the time series, especially mineral waste due to enhanced soil excavation activities. Remarkable increases can also be observed in the iron and steel production as well as the thermal waste treatment and consequently in their residues landfilled.
The following emission factors are used (WINIWARTER et al 2007)
Table 257: Emission factors for PM.
TSP PM10 PM2.5 g/t WASTE g/t WASTE g/t WASTE
18.00 8.52 2.68
6.3.2.1 Category-specific Recalculations
Some small correction was necessary on the amounts of deposited residues from iron and steel production in order to exclude stabilised and solidified waste, leading to slightly lower amounts considered.
Austria’s Informative Inventory Report (IIR) 2017 – Waste (NFR Sector 5)
Umweltbundesamt REP-0609, Vienna 2017 355
6.4 NFR 5.B Composting
6.4.1 Source Category Description
In this category NH3 emissions from mechanical-biological treatment and composting of waste is addressed. NH3 emissions arising from this subcategory increased over the time period as a result of the increasing amount of biologically treated waste.
6.4.2 Methodological Issues
Emissions were estimated using a simple methodology based on EMEP/EEA Guidebook. Two different fractions were considered: mixed waste treated in Mechanical-Biological Treatment (MBT) plants, covering waste from
households and similar sources covered by the municipal waste collecting system, but also significant amounts of waste from waste water treatment (e.g. sewage sludge) or smaller amounts of waste from industrial sources (e.g. residues from processing of recovered paper) are included).
biogenic waste composted, comprising green/biogenic waste collected and treated in com-posting plants147 (centralised composting) and biogenic waste composted at the place it is generated (home composting).
NH3 emissions were calculated by multiplying an emission factor with the quantity of waste.
NH3 Emissions = Mi * EFi Where:
Mi mass of organic waste treated by biological treatment type i (composting, MBT) EFi emission factor for treatment i (MBT, composting)
Activity data
Historical activity data were taken from national publications and regional sources as listed in Table 258.
In most recent years the ‘Electronic Data Management’ (EDM) is the primary data basis148, providing data for the ‘Federal Waste Management Plan’ ‘BAWP’ (BMLFUW 2006a, BMLFUW 2011, BMLFUW 2017), which is (in part) updated annually (‘Status Reports’ 2007, 2008, 2009, 2012, 2013, 2014, 2015). For years where no reliable data were available inter- or extrapolation was done.
The EDM is an information network operated by the Environment Agency Austria. It is a central eGovernment initiative by the Austrian Federal Ministry of Agriculture, Forestry, Environment and Water Management (www.edm.gv.at) enabling enterprises, waste collectors and condi-tioners as well as authorities to handle registration, notification and reporting obligations in the waste and environment sectors online. Waste amounts collected and treated (input-output rec-ords) have to be reported on an annual basis via this electronic tool.
Home composted amounts are calculated based on a per-capita value of 215 kg/person/a, whereas for Vienna only 15% of the population is considered due to the lower number of gar-dens in this urban area. This approach is in line with the method applied for the BAWP (BMLFUW 2011).
147 A certain part of this waste undergoes an anaerobic treatment (digestion), but currently all bio waste generated is
assumed to be treated aerobically (composted). 148 In subcategory 5.A Solid Waste Disposal waste amounts have been taken from EDM reports already since 2008.
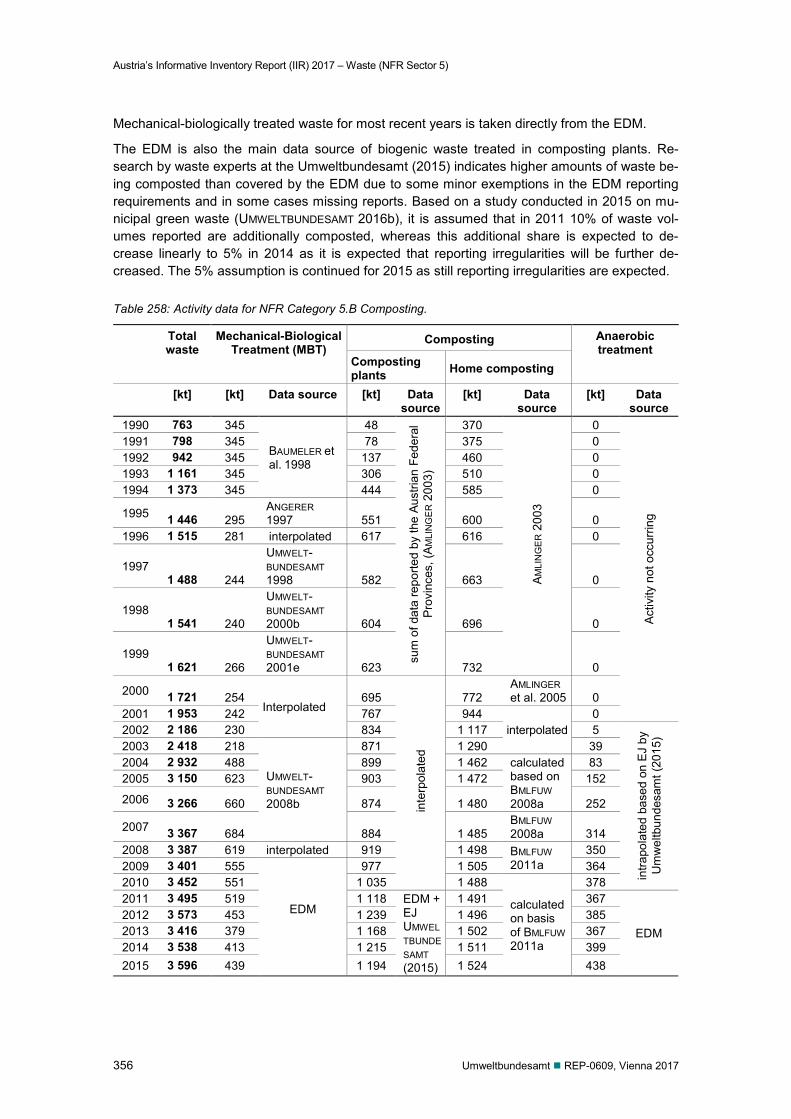
Austria’s Informative Inventory Report (IIR) 2017 – Waste (NFR Sector 5)
356 Umweltbundesamt REP-0609, Vienna 2017
Mechanical-biologically treated waste for most recent years is taken directly from the EDM.
The EDM is also the main data source of biogenic waste treated in composting plants. Re-search by waste experts at the Umweltbundesamt (2015) indicates higher amounts of waste be-ing composted than covered by the EDM due to some minor exemptions in the EDM reporting requirements and in some cases missing reports. Based on a study conducted in 2015 on mu-nicipal green waste (UMWELTBUNDESAMT 2016b), it is assumed that in 2011 10% of waste vol-umes reported are additionally composted, whereas this additional share is expected to de-crease linearly to 5% in 2014 as it is expected that reporting irregularities will be further de-creased. The 5% assumption is continued for 2015 as still reporting irregularities are expected.
Table 258: Activity data for NFR Category 5.B Composting.
Total waste
Mechanical-Biological Treatment (MBT)
Composting Anaerobic treatment
Composting plants Home composting
[kt] [kt] Data source [kt] Data source
[kt] Data source
[kt] Data source
1990 763 345
BAUMELER et al. 1998
48 su
m o
f dat
a re
porte
d by
the
Aust
rian
Fede
ral
Pro
vinc
es, (
AM
LIN
GE
R 2
003)
370
AM
LIN
GE
R 2
003
0
Act
ivity
not
occ
urrin
g
1991 798 345 78 375 0 1992 942 345 137 460 0 1993 1 161 345 306 510 0 1994 1 373 345 444 585 0
1995 1 446 295 ANGERER 1997 551 600 0
1996 1 515 281 interpolated 617 616 0
1997 1 488 244
UMWELT-BUNDESAMT 1998 582 663 0
1998 1 541 240
UMWELT-BUNDESAMT 2000b 604 696 0
1999 1 621 266
UMWELT-BUNDESAMT 2001e 623 732 0
2000 1 721 254 Interpolated
695
inte
rpol
ated
772 AMLINGER et al. 2005 0
2001 1 953 242 767 944 interpolated
0 2002 2 186 230 834 1 117 5
intra
pola
ted
base
d on
EJ
by
Um
wel
tbun
desa
mt (
2015
)
2003 2 418 218
UMWELT-BUNDESAMT 2008b
871 1 290 39 2004 2 932 488 899 1 462 calculated
based on BMLFUW 2008a
83 2005 3 150 623 903 1 472 152
2006 3 266 660 874 1 480 252
2007 3 367 684 884 1 485 BMLFUW 2008a 314
2008 3 387 619 interpolated 919 1 498 BMLFUW 2011a
350 2009 3 401 555
EDM
977 1 505 364 2010 3 452 551 1 035 1 488
calculated on basis of BMLFUW 2011a
378 2011 3 495 519 1 118 EDM +
EJ UMWELTBUNDESAMT (2015)
1 491 367
EDM 2012 3 573 453 1 239 1 496 385 2013 3 416 379 1 168 1 502 367 2014 3 538 413 1 215 1 511 399 2015 3 596 439 1 194 1 524 438
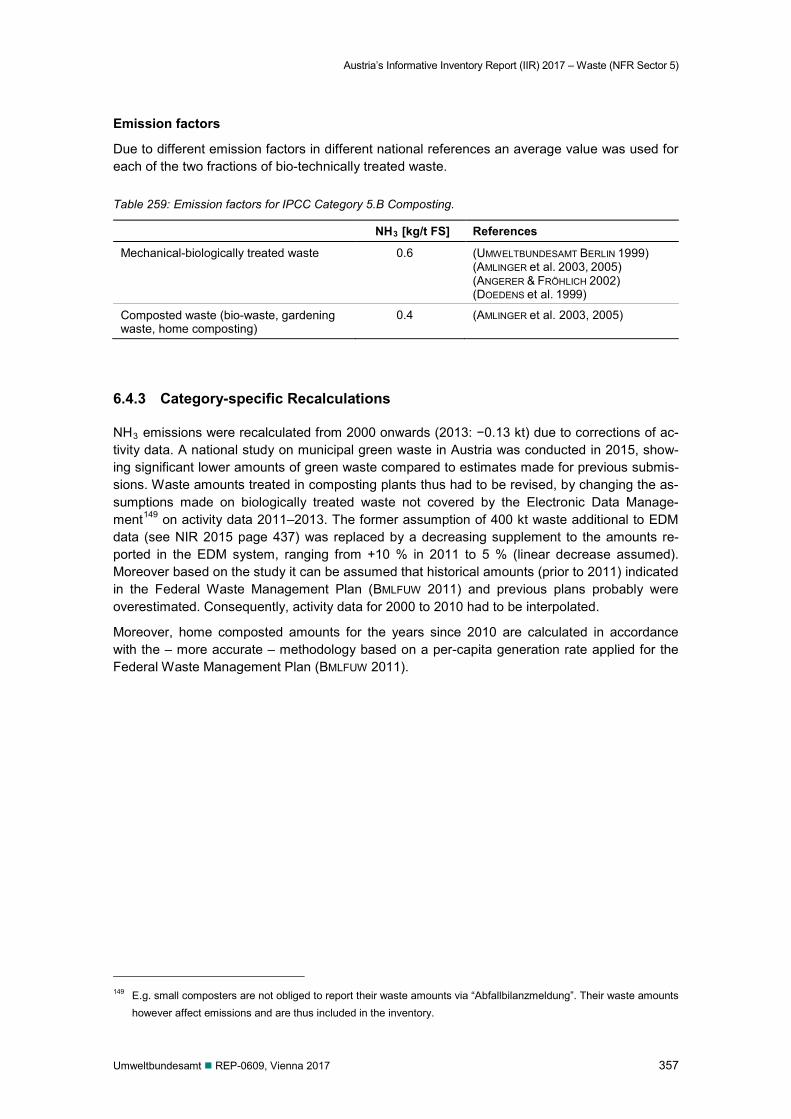
Austria’s Informative Inventory Report (IIR) 2017 – Waste (NFR Sector 5)
Umweltbundesamt REP-0609, Vienna 2017 357
Emission factors
Due to different emission factors in different national references an average value was used for each of the two fractions of bio-technically treated waste.
Table 259: Emission factors for IPCC Category 5.B Composting.
NH3 [kg/t FS] References
Mechanical-biologically treated waste 0.6 (UMWELTBUNDESAMT BERLIN 1999) (AMLINGER et al. 2003, 2005) (ANGERER & FRÖHLICH 2002) (DOEDENS et al. 1999)
Composted waste (bio-waste, gardening waste, home composting)
0.4 (AMLINGER et al. 2003, 2005)
6.4.3 Category-specific Recalculations
NH3 emissions were recalculated from 2000 onwards (2013: −0.13 kt) due to corrections of ac-tivity data. A national study on municipal green waste in Austria was conducted in 2015, show-ing significant lower amounts of green waste compared to estimates made for previous submis-sions. Waste amounts treated in composting plants thus had to be revised, by changing the as-sumptions made on biologically treated waste not covered by the Electronic Data Manage-ment149 on activity data 2011–2013. The former assumption of 400 kt waste additional to EDM data (see NIR 2015 page 437) was replaced by a decreasing supplement to the amounts re-ported in the EDM system, ranging from +10 % in 2011 to 5 % (linear decrease assumed). Moreover based on the study it can be assumed that historical amounts (prior to 2011) indicated in the Federal Waste Management Plan (BMLFUW 2011) and previous plans probably were overestimated. Consequently, activity data for 2000 to 2010 had to be interpolated.
Moreover, home composted amounts for the years since 2010 are calculated in accordance with the – more accurate – methodology based on a per-capita generation rate applied for the Federal Waste Management Plan (BMLFUW 2011).
149 E.g. small composters are not obliged to report their waste amounts via “Abfallbilanzmeldung”. Their waste amounts
however affect emissions and are thus included in the inventory.
Austria’s Informative Inventory Report (IIR) 2017 – Waste (NFR Sector 5)
358 Umweltbundesamt REP-0609, Vienna 2017
6.5 NFR 5.C Incineration and open burning of waste
6.5.1 Source Description
In this category emissions are included from incineration of corpses (NFR 5.C.1.b.5), hospital waste (NFR 5.C.1.b.3), waste oil (NFR 5.C.1.b.i), incineration of domestic or municipal solid waste without energy recovery (NFR 5.C.1.a).
Additionally heavy metal and POPs emissions of a single plant without emission control 1990 to 1991 are included here. From 1992 the plant was equipped with ESP. Emissions 1992 to 2000 are included in category 1.A.4.a and from 2001 on in category 1.A.1.a. Emissions from incinera-tion of carcasses are not estimated. Waste incineration plants are allocated to category 1.A.4.a if heat is recovered for own usage but not used for generation of public electricity or heat or if the plant operator claims that the main economic activity (NACE code 38) of the plant is treat-ment of waste rather than the production of heat or electricity. This approach is consistent with national energy statistics.
In Austria waste oil is incinerated in especially designed so called “USK-facilities“ (Umweltschutz-komponenten). The emissions of waste oil combustion for energy use (e.g. in cement industry) are reported under NFR sector 1.A Fuel Combustion.
In general, municipal, industrial and hazardous waste are combusted in district heating plants or in industrial sites and the energy is used. Therefore their emissions are reported in NFR category 1.A Fuel Combustion. There is only one waste incineration plant which has been operated until 1991 with a capacity of 22 000 tons of waste per year without energy recovery and emission con-trols. This plant has been rebuilt as a district heating plant starting operation in 1996. Therefore the emissions of this plant are reported under NFR category 1.A Fuel Combustion from 1996 onwards. Small scale waste burning
Emissions from wood waste are considered in categories 3.F. It is assumed that other (illegal) small scale residential combustion occurs in heatings or stoves (included in category 1.A.4). Especially when considering POPs emissions from this source the national emission factors consider this issue due to the fact that POP emission factors are derived from field measure-ments which consider the “memory effect” of illegal waste co-incineration. Residential biomass heatings are widely used in Austria and wood use is based on a bottom up model by using household census data. It is assumed that illegal waste incineration just replaces other solid fuels and therefore other pollutants such as TSP, heavy metals and NOx from wood waste are also expected to be included in category 1.A.4.
6.5.2 Methodology
The simple CORINAIR methodology is used. Emission factors are specific to type of waste and combustion technology. Activity data
For municipal solid waste the capacity (22 000 tons of waste per year) of one operating waste incineration plant without energy recovery was used.
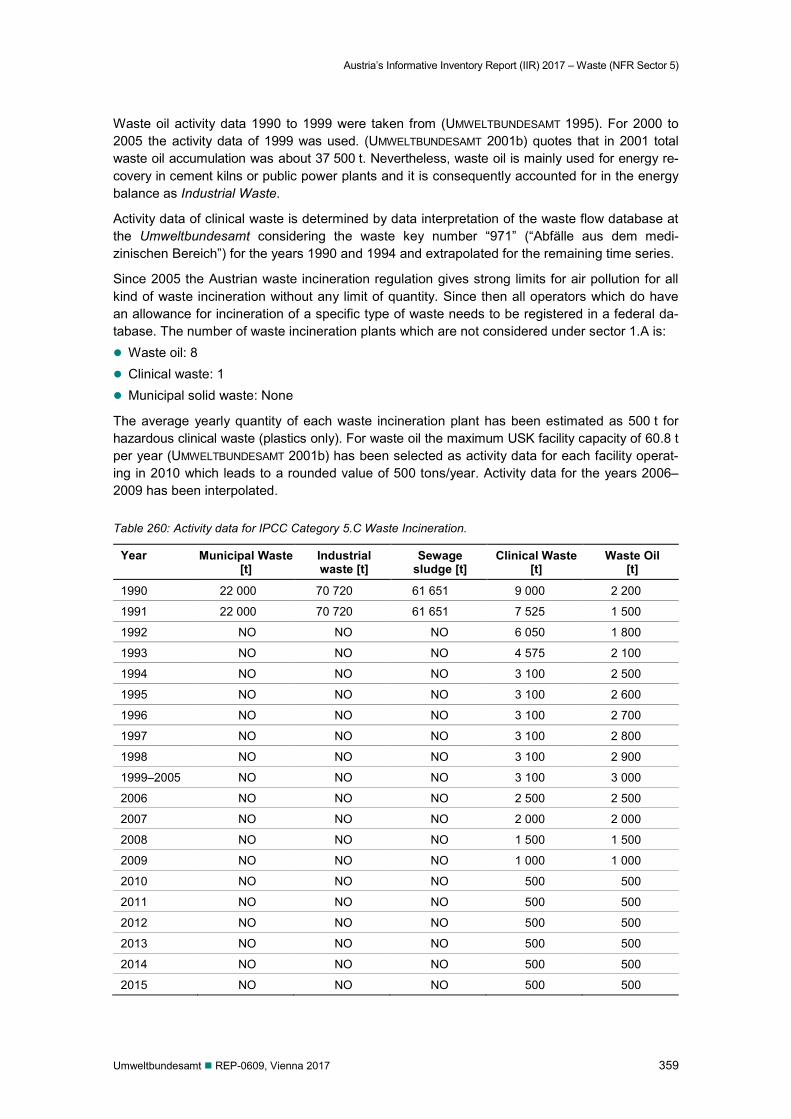
Austria’s Informative Inventory Report (IIR) 2017 – Waste (NFR Sector 5)
Umweltbundesamt REP-0609, Vienna 2017 359
Waste oil activity data 1990 to 1999 were taken from (UMWELTBUNDESAMT 1995). For 2000 to 2005 the activity data of 1999 was used. (UMWELTBUNDESAMT 2001b) quotes that in 2001 total waste oil accumulation was about 37 500 t. Nevertheless, waste oil is mainly used for energy re-covery in cement kilns or public power plants and it is consequently accounted for in the energy balance as Industrial Waste.
Activity data of clinical waste is determined by data interpretation of the waste flow database at the Umweltbundesamt considering the waste key number “971” (“Abfälle aus dem medi-zinischen Bereich”) for the years 1990 and 1994 and extrapolated for the remaining time series.
Since 2005 the Austrian waste incineration regulation gives strong limits for air pollution for all kind of waste incineration without any limit of quantity. Since then all operators which do have an allowance for incineration of a specific type of waste needs to be registered in a federal da-tabase. The number of waste incineration plants which are not considered under sector 1.A is: Waste oil: 8 Clinical waste: 1 Municipal solid waste: None
The average yearly quantity of each waste incineration plant has been estimated as 500 t for hazardous clinical waste (plastics only). For waste oil the maximum USK facility capacity of 60.8 t per year (UMWELTBUNDESAMT 2001b) has been selected as activity data for each facility operat-ing in 2010 which leads to a rounded value of 500 tons/year. Activity data for the years 2006–2009 has been interpolated.
Table 260: Activity data for IPCC Category 5.C Waste Incineration.
Year Municipal Waste [t]
Industrial waste [t]
Sewage sludge [t]
Clinical Waste [t]
Waste Oil [t]
1990 22 000 70 720 61 651 9 000 2 200
1991 22 000 70 720 61 651 7 525 1 500
1992 NO NO NO 6 050 1 800
1993 NO NO NO 4 575 2 100
1994 NO NO NO 3 100 2 500
1995 NO NO NO 3 100 2 600
1996 NO NO NO 3 100 2 700
1997 NO NO NO 3 100 2 800
1998 NO NO NO 3 100 2 900
1999–2005 NO NO NO 3 100 3 000
2006 NO NO NO 2 500 2 500
2007 NO NO NO 2 000 2 000
2008 NO NO NO 1 500 1 500
2009 NO NO NO 1 000 1 000
2010 NO NO NO 500 500
2011 NO NO NO 500 500
2012 NO NO NO 500 500
2013 NO NO NO 500 500
2014 NO NO NO 500 500
2015 NO NO NO 500 500
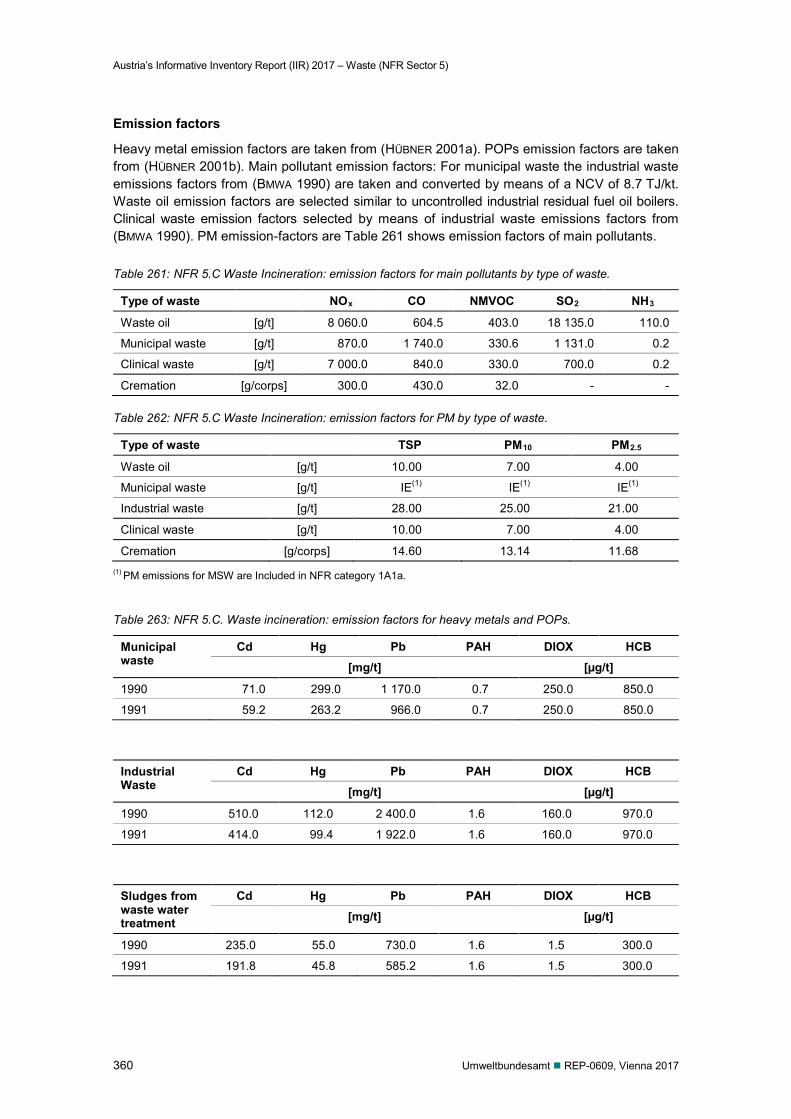
Austria’s Informative Inventory Report (IIR) 2017 – Waste (NFR Sector 5)
360 Umweltbundesamt REP-0609, Vienna 2017
Emission factors
Heavy metal emission factors are taken from (HÜBNER 2001a). POPs emission factors are taken from (HÜBNER 2001b). Main pollutant emission factors: For municipal waste the industrial waste emissions factors from (BMWA 1990) are taken and converted by means of a NCV of 8.7 TJ/kt. Waste oil emission factors are selected similar to uncontrolled industrial residual fuel oil boilers. Clinical waste emission factors selected by means of industrial waste emissions factors from (BMWA 1990). PM emission-factors are Table 261 shows emission factors of main pollutants.
Table 261: NFR 5.C Waste Incineration: emission factors for main pollutants by type of waste.
Type of waste NOx CO NMVOC SO2 NH3
Waste oil [g/t] 8 060.0 604.5 403.0 18 135.0 110.0
Municipal waste [g/t] 870.0 1 740.0 330.6 1 131.0 0.2
Clinical waste [g/t] 7 000.0 840.0 330.0 700.0 0.2
Cremation [g/corps] 300.0 430.0 32.0 - -
Table 262: NFR 5.C Waste Incineration: emission factors for PM by type of waste.
Type of waste TSP PM10 PM2.5
Waste oil [g/t] 10.00 7.00 4.00
Municipal waste [g/t] IE(1) IE(1) IE(1)
Industrial waste [g/t] 28.00 25.00 21.00
Clinical waste [g/t] 10.00 7.00 4.00
Cremation [g/corps] 14.60 13.14 11.68 (1) PM emissions for MSW are Included in NFR category 1A1a.
Table 263: NFR 5.C. Waste incineration: emission factors for heavy metals and POPs.
Municipal waste
Cd Hg Pb PAH DIOX HCB [mg/t] [µg/t]
1990 71.0 299.0 1 170.0 0.7 250.0 850.0
1991 59.2 263.2 966.0 0.7 250.0 850.0
Industrial Waste
Cd Hg Pb PAH DIOX HCB [mg/t] [µg/t]
1990 510.0 112.0 2 400.0 1.6 160.0 970.0
1991 414.0 99.4 1 922.0 1.6 160.0 970.0
Sludges from waste water treatment
Cd Hg Pb PAH DIOX HCB [mg/t] [µg/t]
1990 235.0 55.0 730.0 1.6 1.5 300.0
1991 191.8 45.8 585.2 1.6 1.5 300.0
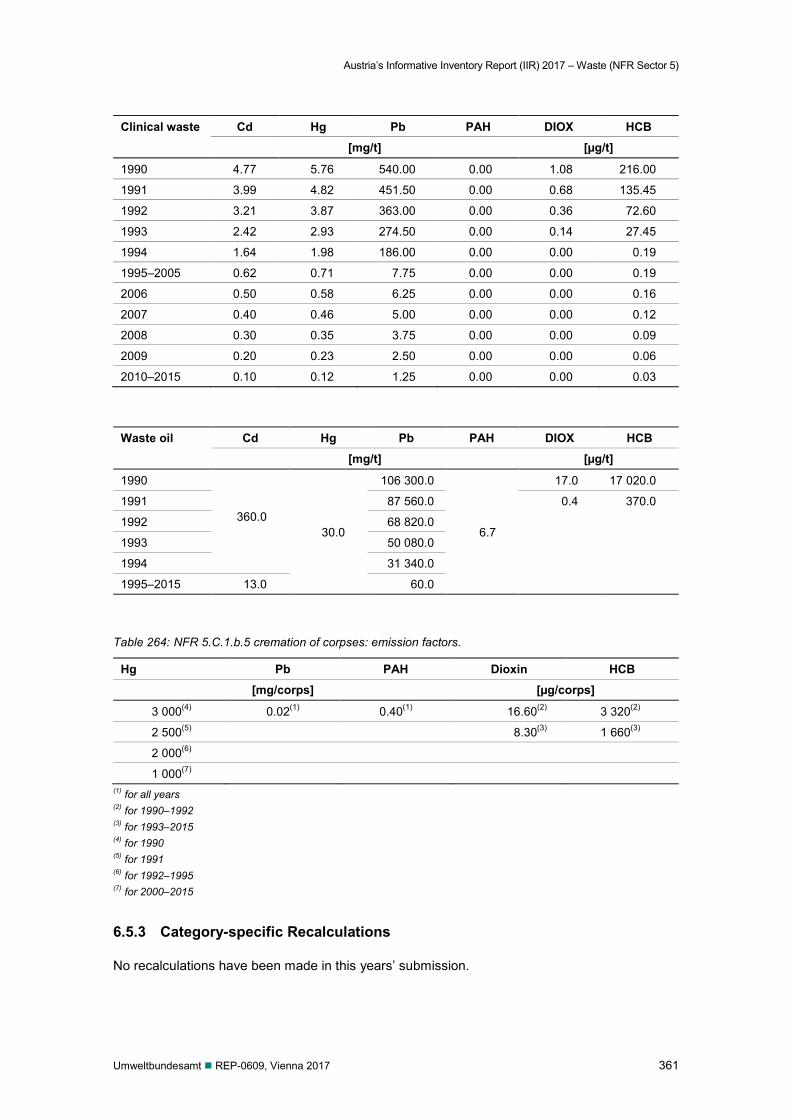
Austria’s Informative Inventory Report (IIR) 2017 – Waste (NFR Sector 5)
Umweltbundesamt REP-0609, Vienna 2017 361
Clinical waste Cd Hg Pb PAH DIOX HCB [mg/t] [µg/t]
1990 4.77 5.76 540.00 0.00 1.08 216.00
1991 3.99 4.82 451.50 0.00 0.68 135.45
1992 3.21 3.87 363.00 0.00 0.36 72.60
1993 2.42 2.93 274.50 0.00 0.14 27.45
1994 1.64 1.98 186.00 0.00 0.00 0.19
1995–2005 0.62 0.71 7.75 0.00 0.00 0.19
2006 0.50 0.58 6.25 0.00 0.00 0.16
2007 0.40 0.46 5.00 0.00 0.00 0.12
2008 0.30 0.35 3.75 0.00 0.00 0.09
2009 0.20 0.23 2.50 0.00 0.00 0.06
2010–2015 0.10 0.12 1.25 0.00 0.00 0.03
Waste oil Cd Hg Pb PAH DIOX HCB [mg/t] [µg/t]
1990
360.0 30.0
106 300.0
6.7
17.0 17 020.0
1991 87 560.0 0.4 370.0
1992 68 820.0
1993 50 080.0
1994 31 340.0
1995–2015 13.0 60.0
Table 264: NFR 5.C.1.b.5 cremation of corpses: emission factors.
Hg Pb PAH Dioxin HCB [mg/corps] [µg/corps]
3 000(4) 0.02(1) 0.40(1) 16.60(2) 3 320(2)
2 500(5) 8.30(3) 1 660(3)
2 000(6)
1 000(7) (1) for all years (2) for 1990–1992 (3) for 1993–2015 (4) for 1990 (5) for 1991 (6) for 1992–1995 (7) for 2000–2015
6.5.3 Category-specific Recalculations
No recalculations have been made in this years’ submission.
Austria’s Informative Inventory Report (IIR) 2017 – Waste (NFR Sector 5)
362 Umweltbundesamt REP-0609, Vienna 2017
6.6 NFR 5.D Wastewater handling
6.6.1 Source Category Description
In this category NMVOC emissions from domestic wastewater handling (5.D.1) are included, covering wastewater of domestic origin – treated in municipal wastewater treatment plants, do-mestic wastewater treatment plants and cesspools – as well as commercial and industrial wastewater treated together with domestic wastewater in municipal wastewater treatment plants.
6.6.2 Methodological Issues
Emissions were calculated following the Tier 1 approach by multiplying the wastewater amounts with the emission factor taken from the EMEP/EEA 2016 Guidebook (15 mg/m3 wastewater). NMVOC Emissions = AD * EF
Where: AD activity data / volume of total wastewater treated in municipal wastewater treatment plants (m3) EF emission factor
Activity data
Most recent data (2010–2015) on the volumes of wastewater treated in municipal wastewater treatment plants are retrieved from the Electronic Emission Register of Surface Water ies (“Emissionsregister – Oberflächenwasserkörper”, abbreviated “EMREG-OW”150), an elec-tronic register of material emissions to surface water bodies from point sources, especially mu-nicipal sewage treatment plants. It is administered by the Austrian Federal Ministry of Agricul-ture, Forestry, Environment and Water Management (BMLFUW) and serves the collection of in-formation for the National Water Management Plan and for management plans for international river catchment areas. Data for 2006–2008 were taken from the Austrian sewage sludge data-base administered by the Umweltbundesamt. Historical data (1991, 1995, 1998, 2001, 2003) were obtained from the Water Quality Reports (BMLFUW 1993–2002); data in between were in-terpolated.
Data on volumes of wastewater collected in domestic wastewater treatment plants and cess-pools are calculated based on the Austrian population not connected to municipal wastewater treatment plants and the factor 135 litre per population equivalent per day (ÖWAV 2015). Data on wastewater disposal routes and connection rates were taken from the situation reports on municipal wastewater (BMLFUW 2006C, BMLFUW 2008b, BMLFUW 2010, BMLFUW 2012, BMLFUW 2014C, BMLFUW 2016d).
150 BGBl. II Nr. 29/2009: Verordnung des Bundesministers für Land- und Forstwirtschaft, Umwelt und Wasserwirtschaft
über ein elektronisches Register zur Erfassung aller wesentlichen Belastungen von Oberflächenwasserkörpern durch Emissionen von Stoffen aus Punktquellen (EmRegV-OW)
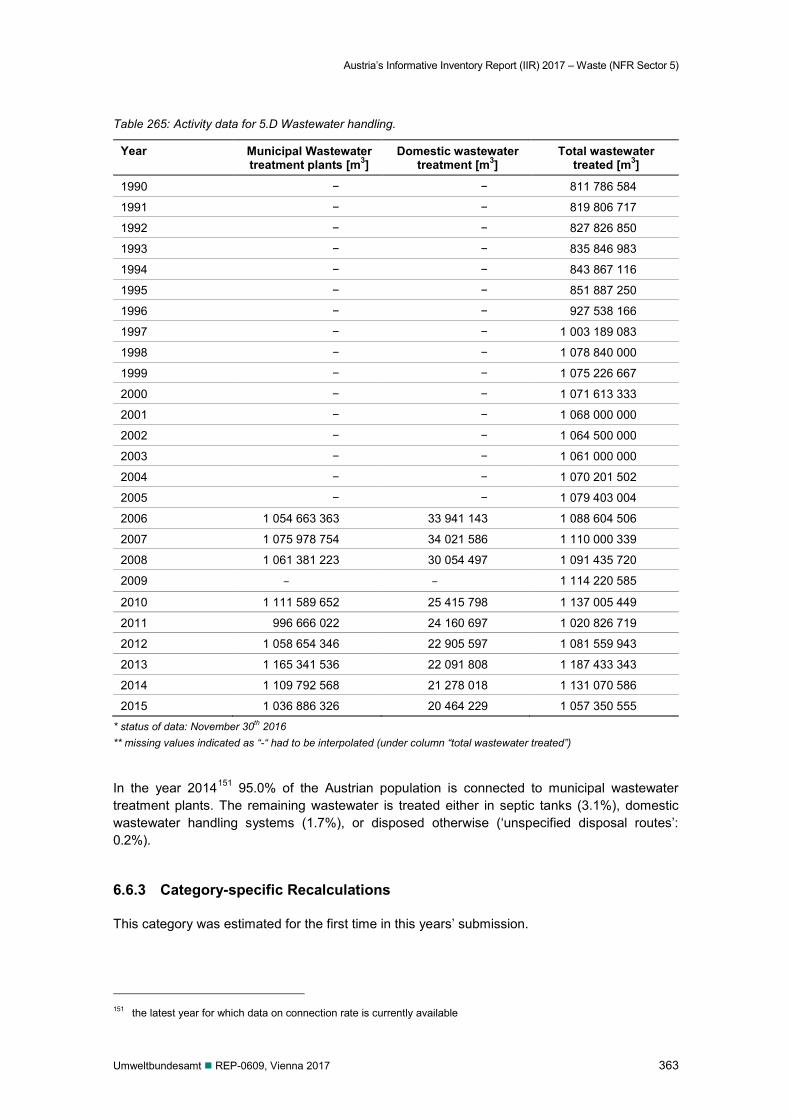
Austria’s Informative Inventory Report (IIR) 2017 – Waste (NFR Sector 5)
Umweltbundesamt REP-0609, Vienna 2017 363
Table 265: Activity data for 5.D Wastewater handling.
Year Municipal Wastewater treatment plants [m3]
Domestic wastewater treatment [m3]
Total wastewater treated [m3]
1990 − − 811 786 584
1991 − − 819 806 717
1992 − − 827 826 850
1993 − − 835 846 983
1994 − − 843 867 116
1995 − − 851 887 250
1996 − − 927 538 166
1997 − − 1 003 189 083
1998 − − 1 078 840 000
1999 − − 1 075 226 667
2000 − − 1 071 613 333
2001 − − 1 068 000 000
2002 − − 1 064 500 000
2003 − − 1 061 000 000
2004 − − 1 070 201 502
2005 − − 1 079 403 004
2006 1 054 663 363 33 941 143 1 088 604 506
2007 1 075 978 754 34 021 586 1 110 000 339
2008 1 061 381 223 30 054 497 1 091 435 720
2009 − − 1 114 220 585
2010 1 111 589 652 25 415 798 1 137 005 449
2011 996 666 022 24 160 697 1 020 826 719
2012 1 058 654 346 22 905 597 1 081 559 943
2013 1 165 341 536 22 091 808 1 187 433 343
2014 1 109 792 568 21 278 018 1 131 070 586
2015 1 036 886 326 20 464 229 1 057 350 555
* status of data: November 30th 2016 ** missing values indicated as “-“ had to be interpolated (under column “total wastewater treated”)
In the year 2014151 95.0% of the Austrian population is connected to municipal wastewater treatment plants. The remaining wastewater is treated either in septic tanks (3.1%), domestic wastewater handling systems (1.7%), or disposed otherwise (‘unspecified disposal routes’: 0.2%).
6.6.3 Category-specific Recalculations
This category was estimated for the first time in this years’ submission.
151 the latest year for which data on connection rate is currently available
Austria’s Informative Inventory Report (IIR) 2017 – Recalculations and Improvements
364 Umweltbundesamt REP-0609, Vienna 2017
7 RECALCULATIONS AND IMPROVEMENTS
7.1 Relation to data reported earlier
As a result of the continuous improvement of Austria’s National Air Emission Inventory, emis-sions of some sources have been recalculated based on updated data or revised methodolo-gies, thus emission data for 1990 to 2014 submitted this year might differ from data reported pre-viously.
The stage 1 review (initial check of submissions for timeliness, completeness and formats) and stage 2 review (check of consistency, comparability, KCA, trends and IEFs) are carried out an-nually. The last in-depth (stage 3) review of the Austrian Inventory took place in 2010 (UNITED NATIONS 2010); the findings are summarized in Table 280. The next stage 3 review will take place in 2017. In addition to the CLRTAP review, from 2017 onwards the national emission in-ventory data will be also checked by the European Commission as set out in Article 10 of Di-rective 2016/2284 (NEC Directive). The inventories will be reviewed to verify the transparency, accuracy, consistency, comparability and completeness of information submitted and to identify possible inconsistencies with the requirements set out under international law, in particular un-der the LRTAP Convention.
The figures presented in this report replace data reported earlier by the Umweltbundesamt un-der the reporting framework of the UNECE/LRTAP Convention and NEC Directive of the Euro-pean Union.
7.2 Explanations and Justifications for Recalculations, including in response to the review process
Explanations for recalculations per sector are given in the respective chapters, the tables indi-cating the recalculations can be found in the Chapter 7.3.
Compiling an emission inventory includes data collecting, data transfer and data processing. Data has to be collected from different sources, for instance national statistics, associations, plant operators, studies, personal information, other publications.
The provided data must be transferred from different data formats and units into a unique elec-tronic format to be processed further. The calculation of emissions by applying methodologies on the collected data and the final computing of time series into a predefined format (NFR) are fur-ther steps in the preparation of the final submission. Finally the submission must be delivered in due time. Even though a QA/QC system gives assistance so that potential error sources are avoided as far as possible it is necessary to make some revisions – so called recalculations – under the following circumstances: An emission source was not considered in the previous inventory. A source/data supplier has delivered new data because previous data were preliminary data
only (by estimation, extrapolation) or the methodology has been improved.
Austria’s Informative Inventory Report (IIR) 2017 – Recalculations and Improvements
Umweltbundesamt REP-0609, Vienna 2017 365
Occurrence of errors in data transfer or processing: wrong data, unit-conversion, software er-rors etc.
Methodological changes: a new methodology must be applied to fulfill the reporting require-ments because one of the following reasons: to decrease uncertainties; an emission source becomes a key source; consistent input data needed for applying the methodology is no longer accessible; input data for more detailed methodology is now available; the methodology is no longer appropriate.
The following sections describe the methodological changes made to the inventory since the previous submission (for each sector).
7.2.1 ENERGY (NFR sector 1)
Activity data has been updated with data from the new edition of the energy balance, affecting emissions of all pollutants.
Revision of the energy balance Gross natural gas consumption has been revised for the years 1999 (+0.7 PJ) and for
2002−2008 (between −0.8 to −5.9 PJ). The revision was due to harmonisation with official to-tal natural gas consumption as published by the Austrian Energy regulator (e-Control). The revision affected the ‘own use’ of the energy sector as well as the ‘final energy consumption’.
For liquid fuels minor revisions were made for the whole time series because of a switch from national energy balance to the Eurostat/IEA dataset which has rounded values. Larger shifts of gasoil between 1.A.4.a and 1.A.4.b categories were carried out for the years 2002–2003 (0.6–0.7 PJ) and 2005-2006 (8.7–4.6 PJ). For the year 2014 about 0.5 PJ of gasoil was shift-ed from manufacturing industries to the residential sector.
For solid fuels minor revisions were made for the years 2002−2014 with the largest change in 2011 (-0.03 PJ).
For ‘other fuels’ the major revision took place for the year 2014 where a shift of ‘industrial waste’ to municipal solid waste’ was reported by energy statistics.
For biomass the major revision took place for the years 2005 and 2007–2014. For NFR 1.A.1.a biomass was revised downwards by -3.2 PJ in the year 2015. For NFR 1.A.4 sub categories bi-omass was revised downwards for the years 2007–2014 (between -1.1 to -2.6 PJ). For NFR 1.A.2.g.8 biomass was revised downwards by -1 PJ for the year 2013 and by -5.5 PJ for the year 2014.
Public Electricity and Heat Production (1.A.1.a)
Update and error correction of large combustion plants emissions declarations 2007-2014. For the year 2014 the update results in revisions for SO2, NOx, CO and PM10, e.g. -0.07 kt SO2, -0.8 kt NOx and -0.01 kt PM10 emissions.
Austria’s Informative Inventory Report (IIR) 2017 – Recalculations and Improvements
366 Umweltbundesamt REP-0609, Vienna 2017
Manufacture of Solid fuels and Other Energy Industries (1.A.1.c)
Recalculations 1999 to 2012 follow the revisions of the energy balance and result in updates for all relevant air emissions, e.g. lower NOx emissions in the range from +0.1 kt to -1.2 kt.
Updates of activity data and of NCVs follow the updates of the IEA-compliant energy balance compiled by the federal statistics authority Statistik Austria (Chapter 3.1.10).
Manufacturing Industries and Construction (1.A.2)
The changes in this category mainly resulted from the revisions of the energy balance. There-fore, recalculations have been carried out for all relevant air pollutants. The largest recalcula-tions took place for category 1.A.2.g with e.g. -0.8 kt lower NOx, -0.7 kt lower SO2 and -0.4 kt lower CO emissions in 2014.
Households and Institutional/Commercial sector (1.A.4.a.i, 1.A.4.b.i)
Revisions are mainly following the minor revisions of the energy balance affecting all relevant air pollutants. For the year 2014, NOx emissions of the commercial sector (1.A.4.a.i) were re-vised by +0.08 kt, NOx emissions of the residential sector (1.A.4.b.i) were revised by +0.01 kt and NOx emissions of the agriculture sector (1.A.4.c.i) were revised by -0.16 kt. NMVOC emis-sions were revised by +0.59 kt for all of 1.A.4 stationary sources and PM2.5 emissions by -0.003 kt.
Updates of activity data and of NCVs follow the updates of the IEA-compliant energy balance compiled by the federal statistics authority Statistik Austria (Chapter 3.1.10).
Road Transport (1.A.3.b)
Minor changes occur in all emission components by using the most recent version of the emis-sion calculation model “NEMO”. Domestic consumption on the road has been slightly revised upwards for 2012-2014. In the model this results in a reduction in energy consumption of fuel export. Since the fuel export is mainly characterised by truck traffic which has by now low spe-cific NOx emissions, the absolute values for NOx are marginally lower during these years. In addition, the LPG and biogas fuel quantities for individual years were revised according to the national energy balance. The main emissions changes for 2014 are: -0.6 kt NOx, -0.02 kt NMVOC.
Rail transport (1.A.3.c)
The year 2014 was revised due to the revised use of diesel according to the current national energy balance. These changes have an effect on all relevant air pollutants. The main emis-sions changes for 2014 are: +0.01 kt NOx, +0.01 kt SO2, +0.01 kt CO.
Austria’s Informative Inventory Report (IIR) 2017 – Recalculations and Improvements
Umweltbundesamt REP-0609, Vienna 2017 367
7.2.2 INDUSTRIAL PROCESSES AND PRODUCT USE (NFR sector 2)
Mineral Products (2.A)
NFR 2.A.5.b, SNAP 040617 Other – Construction and demolition: Emissions changed, due to changes of the building-cost index. The activity for 2012 until 2014 of the following categories provided by the Austrian mining handbook have changed (BMWFW 2016) NFR 2.A.5.a, SNAP 04 06 17 Other – X4F NFR 2.A.5.a, SNAP 040617 Other – X4G Other chemical industry (2.B.10.)
An update of the calculation sheet leads to a decrease of emissions from 2001 until 2009. One plant closed in 2009, which lead to a further reduction of SO2 emission. For 2015 measured da-ta became available, thus emissions were interpolated between 2015 and 2009, which led to a decrease of emissions in 2014 (-0.37 kt SO2).
Metal Production (2.C)
NFR 2.C.5, SNAP 030307 Lead Production: activity data for 2013 until 2014 have changed due to a correction of the Austrian mining handbook (BMWFW 2016) NFR 2.C.3, SNAP 030310 Aluminium production: data for 2014 have been updated with ETS data Wood Processing (2.I)
Emissions from 2005 have been recalculated due to changes in the energy balances.
7.2.3 AGRICULTURE (NFR sector 3)
Update of activity data
Livestock population data
Revised numbers of horses have been implemented into the inventory. New data are provided by the Ministry of Agriculture and published in (BMLFUW 2016). Data were derived from inter-views of relevant experts (e.g. from breeding associations) considering additional information from the data base of horses of the Ministry of Health and Women's Affairs.
Numbers of horses used in previous inventories for the years from 2004 to 2014 published in (BMLFUW 2015b) were based on agricultural structural surveys and INVEKOS data. However, it was found out, that they did not fully cover all horse-owners in Austria.
Horse numbers reported for the years before 2004 are based on livestock accountings and were assessed to be representative for Austria.
The revision resulted in significantly increased animal numbers in 2014.
Other organic fertilisers applied to soils (3.D.a.2.c)
Compost application was considered as a new activity for the first time in Austria’s air emission inventory. The consideration of this additional source resulted in additional emissions of NH3 and NOx for all reported years.
Austria’s Informative Inventory Report (IIR) 2017 – Recalculations and Improvements
368 Umweltbundesamt REP-0609, Vienna 2017
Methodological changes
Manure Management (3.B) – NH3
Revised numbers of horses resulted in higher emissions from 2004 onwards (+512.4 t NH3 in 2014).
Weighted EF of other poultry was updated according the share of geese and ducks from 2003 to 2015. The update resulted in slightly higher emissions (+0.3 t NH3 in 2014).
Manure Management (3.B) – NOX
The inventory was updated by using the default Tier 1 EFs for NO from stored manure accord-ing the new EMEP/EEA emission inventory guidebook 2016. The revision resulted in a slight decrease of NO2 emissions from sector management (-9.1 t NO2 in 2014).
Manure Management (3.B) – Particulate matter (TSP, PM10, PM2.5)
In previous years total PM Emissions for all livestock categories from animal husbandry were reported under 3.I Other. In the current submission the PM emissions were calculated and re-ported for the respective livestock categories and reported under 3.B Manure Management.
Agricultural Soils (3.D) – NH3
Inorganic N-fertilizers including urea application (3.D.a.1)
The inventory was updated by using the default Tier 2 NH3 EF for urea fertilizer according the new EMEP/EEA emission inventory guidebook 2016. The revision resulted in a decrease of NH3 emissions (-388.4 t NH3 in 2014).
Animal manure applied to soils (3.D.a.2.a) Revised numbers of horses resulted in higher emissions from 2004 onwards (+377.0 t NH3 in 2014).
Weighted EF of other poultry was updated according the share of geese and ducks from 2003 to 2015. The update resulted in slightly lower emissions.
Sewage sludge applied to soils (3.D.a.2.b)
The inventory was updated by using the default Tier 1 NH3 EF for sewage sludge application according to the new EMEP/EEA emission inventory guidebook 2016. The revision resulted in a decrease of NH3 emissions (-80.6 t NH3 in 2014).
Other organic fertilisers applied to soils including digestate and compost (3.D.a.2.c) Additionally to digested energy crops already considered in previous submissions compost ap-plication was introduced as a new activity. For both activities (digestate and compost) the de-fault Tier 1 NH3 EF for other organic fertilisers according to the new EMEP/EEA emission inven-tory guidebook 2016 has been used. In previous submissions in a simple approach the EF of urea has been used for digestate. The revision resulted in a considerable decrease of emis-sions from source category other organic fertilisers applied to soils (-564.6 t NH3 in 2014).
Urine and dung deposited by grazing animals (3.D.a.3) Revised numbers of horses resulted in higher emissions from 2004 onwards (+75.2 t NH3 in 2014).
Austria’s Informative Inventory Report (IIR) 2017 – Recalculations and Improvements
Umweltbundesamt REP-0609, Vienna 2017 369
Cultivated Crops (3.D.e) In submission 2016 Austria reported an amount of 284 t NH3 emissions from legume cropland for 2014. Calculations followed the CORINAIR detailed methodology as provided in the EMEP/CORINAIR atmospheric emission inventory guidebook 1999.
However, due to the lack of evidence of emissions arising from the fixation process itself, the EMEP/EEA Guidebook 2016 (and the 2006 IPCC Guidelines) do not consider biological N fixa-tion as a source of emissions anymore. Source category and default methodologies were re-moved from the guidebooks and no specific category is provided for reporting in the NFR (and CRF). Consequently, when updating the inventory using the new EMEP/EEA Guidebook 2016, Austria removed estimates for biological N fixation based on the outdated default methodology.
In submission 2017 Austria reports ‘NA’ under source category cultivated crops for all years. Following the EMEP/EEA Guidebook 2016, Table 2.1 no EFs are available for the estimation of ammonia emissions arising from standing or ‘cultivated’ crops.
Agricultural Soils (3.D) – NO2
Inorganic N-fertilizers including urea application (3.D.a.1) Inventory update with the default Tier 1 EF for NO from N applied in fertilisers according to the new EMEP/EEA emission inventory guidebook 2016 resulted in significantly increased emis-sions (+3 370.3 t NO2 in 2014).
Animal manure applied to soils (3.D.a.2.a) The inventory was updated by using the default Tier 1 EF for NO from N applied in fertilisers ac-cording to the new EMEP/EEA emission inventory guidebook 2016. The revision resulted in significantly increased emissions (+976.5 t NO2 in 2014).
Sewage sludge applied to soils (3.D.a.2.b)
The inventory was updated by using the default Tier 1 EF for NO from sewage sludge according to the new EMEP/EEA emission inventory guidebook 2016. The revision resulted in increased emissions (+11.0 t NO2 in 2014).
Other organic fertilisers applied to soils including digestate and compost (3.D.a.2.c) Additionally to digested energy crops already considered in previous submissions compost ap-plication was introduced as a new activity. For both activities (digestate and compost) the de-fault Tier 1 EF for NO according to the new EMEP/EEA emission inventory guidebook 2016 has been used. The revision resulted in a considerable increase of emissions from source category other organic fertilisers applied to soils (+109.3 t NO2 in 2014).
Agricultural Soils (3.D) – NMVOC
Cultivated Crops (3.D.e) The inventory was updated by using the default Tier 1 EF for NMVOC from agricultural crops according to the new EMEP/EEA emission inventory guidebook 2016. The revision resulted in decreased emissions (-764.9 t NMVOC in 2014).
Field burning of agricultural residues (3.F)
The use of the default methodology according to the EMEP/EEA Guidebook 2016 and improved consistency with the parameters used in the GHG inventory (residue/crop product ratio) resulted in slightly revised emissions (NOx, SO2, NH3, NMVOC, CO, PM, Cd, Hg and Pb).
Austria’s Informative Inventory Report (IIR) 2017 – Recalculations and Improvements
370 Umweltbundesamt REP-0609, Vienna 2017
7.2.4 WASTE (NFR sector 5)
Update of activity data
5.A Solid Waste Disposal A small correction was made on the amounts of deposited construction waste and tar paper for the year 2010, having a slightly increasing effect on emissions from 2011 onwards.
Improvements of methodologies and emission factors
5.A Solid Waste Disposal Austria has adapted its DOC of residual waste for the historical years 1950–1989 in response to the recommendation by the Technical Expert Review Team (TERT) in the course of the ESD152 comprehensive review on greenhouse gases in 2016. This has affected the amount of landfill gas generated and thus also the emission value for NMVOC and NH3 (revision downwards by 0.8 t NMVOC and 0.03 t NH3 in 2014).
5.D Wastewater Treatment and Discharge NMVOC emissions were estimated and reported for the first time in this years’ submission. This was done in response to the latest CLRTAP Stage 3 Review.
152 Effort-Sharing Decision
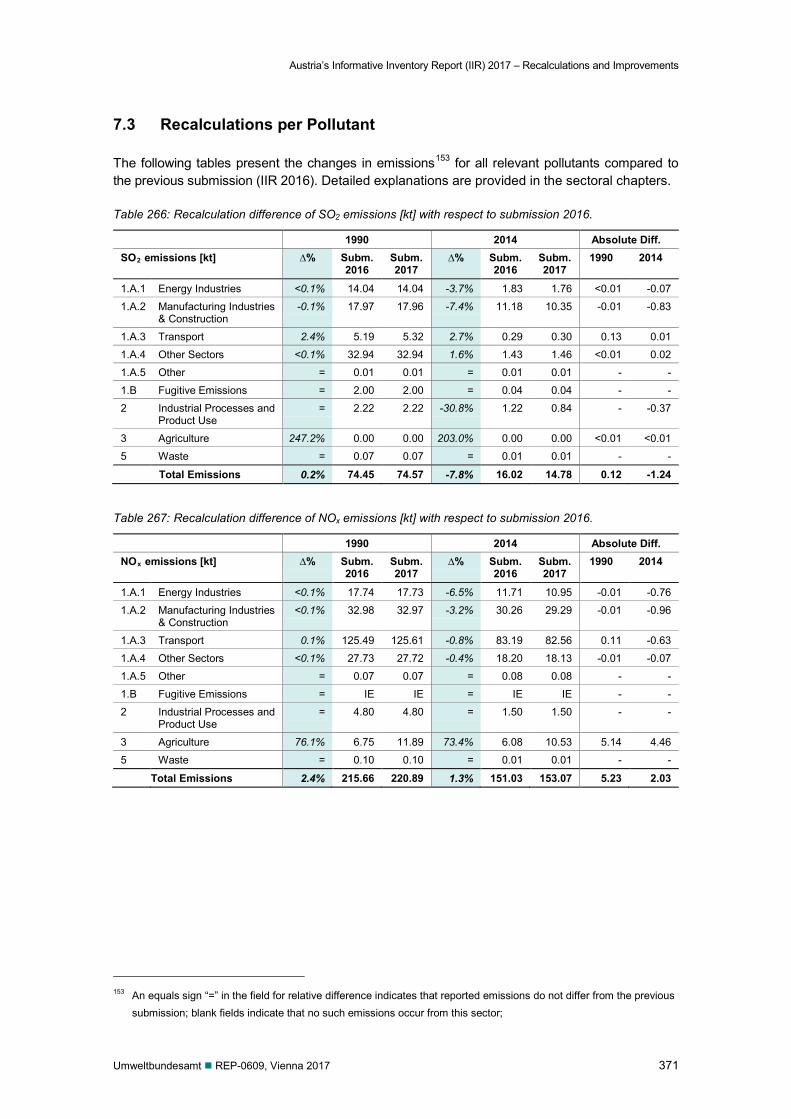
Austria’s Informative Inventory Report (IIR) 2017 – Recalculations and Improvements
Umweltbundesamt REP-0609, Vienna 2017 371
7.3 Recalculations per Pollutant
The following tables present the changes in emissions153 for all relevant pollutants compared to the previous submission (IIR 2016). Detailed explanations are provided in the sectoral chapters.
Table 266: Recalculation difference of SO2 emissions [kt] with respect to submission 2016.
1990 2014 Absolute Diff. SO2 emissions [kt] ∆% Subm.
2016 Subm. 2017
∆% Subm. 2016
Subm. 2017
1990 2014
1.A.1 Energy Industries <0.1% 14.04 14.04 -3.7% 1.83 1.76 <0.01 -0.07
1.A.2 Manufacturing Industries & Construction
-0.1% 17.97 17.96 -7.4% 11.18 10.35 -0.01 -0.83
1.A.3 Transport 2.4% 5.19 5.32 2.7% 0.29 0.30 0.13 0.01
1.A.4 Other Sectors <0.1% 32.94 32.94 1.6% 1.43 1.46 <0.01 0.02
1.A.5 Other = 0.01 0.01 = 0.01 0.01 - -
1.B Fugitive Emissions = 2.00 2.00 = 0.04 0.04 - -
2 Industrial Processes and Product Use
= 2.22 2.22 -30.8% 1.22 0.84 - -0.37
3 Agriculture 247.2% 0.00 0.00 203.0% 0.00 0.00 <0.01 <0.01
5 Waste = 0.07 0.07 = 0.01 0.01 - -
Total Emissions 0.2% 74.45 74.57 -7.8% 16.02 14.78 0.12 -1.24
Table 267: Recalculation difference of NOx emissions [kt] with respect to submission 2016.
1990 2014 Absolute Diff. NOx emissions [kt] ∆% Subm.
2016 Subm. 2017
∆% Subm. 2016
Subm. 2017
1990 2014
1.A.1 Energy Industries <0.1% 17.74 17.73 -6.5% 11.71 10.95 -0.01 -0.76
1.A.2 Manufacturing Industries & Construction
<0.1% 32.98 32.97 -3.2% 30.26 29.29 -0.01 -0.96
1.A.3 Transport 0.1% 125.49 125.61 -0.8% 83.19 82.56 0.11 -0.63
1.A.4 Other Sectors <0.1% 27.73 27.72 -0.4% 18.20 18.13 -0.01 -0.07
1.A.5 Other = 0.07 0.07 = 0.08 0.08 - -
1.B Fugitive Emissions = IE IE = IE IE - -
2 Industrial Processes and Product Use
= 4.80 4.80 = 1.50 1.50 - -
3 Agriculture 76.1% 6.75 11.89 73.4% 6.08 10.53 5.14 4.46
5 Waste = 0.10 0.10 = 0.01 0.01 - -
Total Emissions 2.4% 215.66 220.89 1.3% 151.03 153.07 5.23 2.03
153 An equals sign “=” in the field for relative difference indicates that reported emissions do not differ from the previous
submission; blank fields indicate that no such emissions occur from this sector;
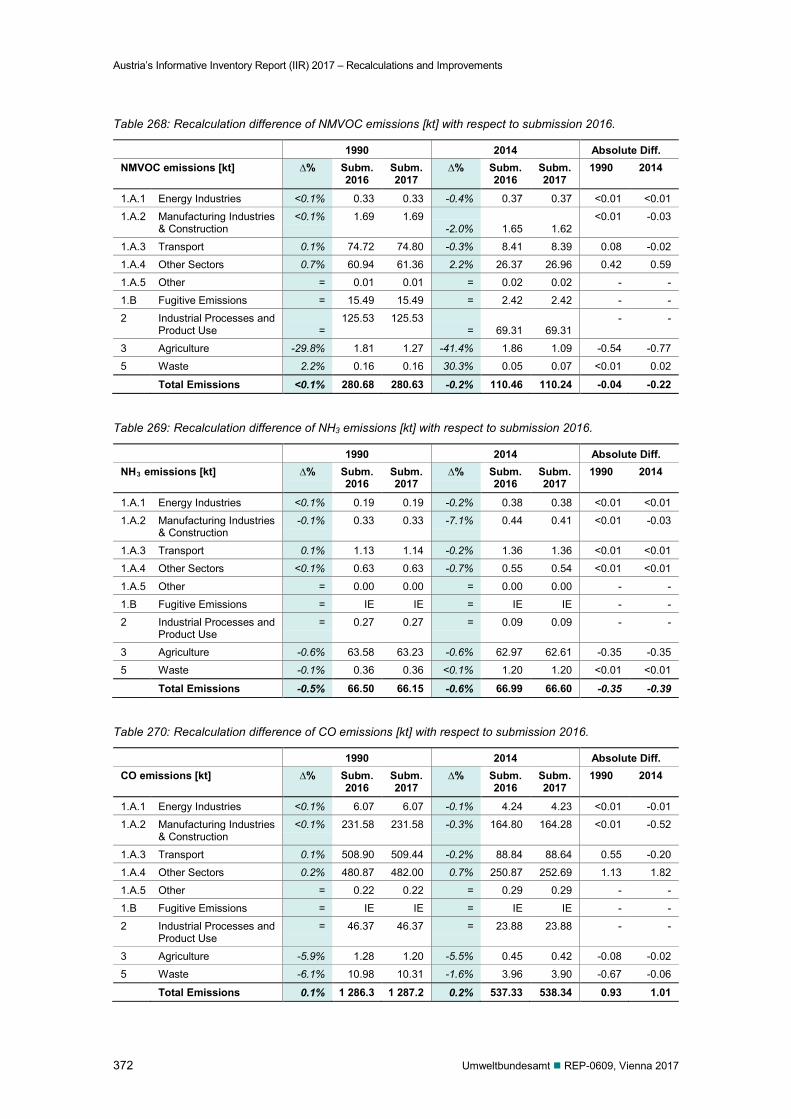
Austria’s Informative Inventory Report (IIR) 2017 – Recalculations and Improvements
372 Umweltbundesamt REP-0609, Vienna 2017
Table 268: Recalculation difference of NMVOC emissions [kt] with respect to submission 2016.
1990 2014 Absolute Diff. NMVOC emissions [kt] ∆% Subm.
2016 Subm. 2017
∆% Subm. 2016
Subm. 2017
1990 2014
1.A.1 Energy Industries <0.1% 0.33 0.33 -0.4% 0.37 0.37 <0.01 <0.01
1.A.2 Manufacturing Industries & Construction
<0.1% 1.69 1.69 -2.0% 1.65 1.62
<0.01 -0.03
1.A.3 Transport 0.1% 74.72 74.80 -0.3% 8.41 8.39 0.08 -0.02
1.A.4 Other Sectors 0.7% 60.94 61.36 2.2% 26.37 26.96 0.42 0.59
1.A.5 Other = 0.01 0.01 = 0.02 0.02 - -
1.B Fugitive Emissions = 15.49 15.49 = 2.42 2.42 - -
2 Industrial Processes and Product Use =
125.53 125.53 = 69.31 69.31
- -
3 Agriculture -29.8% 1.81 1.27 -41.4% 1.86 1.09 -0.54 -0.77
5 Waste 2.2% 0.16 0.16 30.3% 0.05 0.07 <0.01 0.02
Total Emissions <0.1% 280.68 280.63 -0.2% 110.46 110.24 -0.04 -0.22
Table 269: Recalculation difference of NH3 emissions [kt] with respect to submission 2016.
1990 2014 Absolute Diff. NH3 emissions [kt] ∆% Subm.
2016 Subm. 2017
∆% Subm. 2016
Subm. 2017
1990 2014
1.A.1 Energy Industries <0.1% 0.19 0.19 -0.2% 0.38 0.38 <0.01 <0.01
1.A.2 Manufacturing Industries & Construction
-0.1% 0.33 0.33 -7.1% 0.44 0.41 <0.01 -0.03
1.A.3 Transport 0.1% 1.13 1.14 -0.2% 1.36 1.36 <0.01 <0.01
1.A.4 Other Sectors <0.1% 0.63 0.63 -0.7% 0.55 0.54 <0.01 <0.01
1.A.5 Other = 0.00 0.00 = 0.00 0.00 - -
1.B Fugitive Emissions = IE IE = IE IE - -
2 Industrial Processes and Product Use
= 0.27 0.27 = 0.09 0.09 - -
3 Agriculture -0.6% 63.58 63.23 -0.6% 62.97 62.61 -0.35 -0.35
5 Waste -0.1% 0.36 0.36 <0.1% 1.20 1.20 <0.01 <0.01
Total Emissions -0.5% 66.50 66.15 -0.6% 66.99 66.60 -0.35 -0.39
Table 270: Recalculation difference of CO emissions [kt] with respect to submission 2016.
1990 2014 Absolute Diff. CO emissions [kt] ∆% Subm.
2016 Subm. 2017
∆% Subm. 2016
Subm. 2017
1990 2014
1.A.1 Energy Industries <0.1% 6.07 6.07 -0.1% 4.24 4.23 <0.01 -0.01
1.A.2 Manufacturing Industries & Construction
<0.1% 231.58 231.58 -0.3% 164.80 164.28 <0.01 -0.52
1.A.3 Transport 0.1% 508.90 509.44 -0.2% 88.84 88.64 0.55 -0.20
1.A.4 Other Sectors 0.2% 480.87 482.00 0.7% 250.87 252.69 1.13 1.82
1.A.5 Other = 0.22 0.22 = 0.29 0.29 - -
1.B Fugitive Emissions = IE IE = IE IE - -
2 Industrial Processes and Product Use
= 46.37 46.37 = 23.88 23.88 - -
3 Agriculture -5.9% 1.28 1.20 -5.5% 0.45 0.42 -0.08 -0.02
5 Waste -6.1% 10.98 10.31 -1.6% 3.96 3.90 -0.67 -0.06
Total Emissions 0.1% 1 286.3 1 287.2 0.2% 537.33 538.34 0.93 1.01
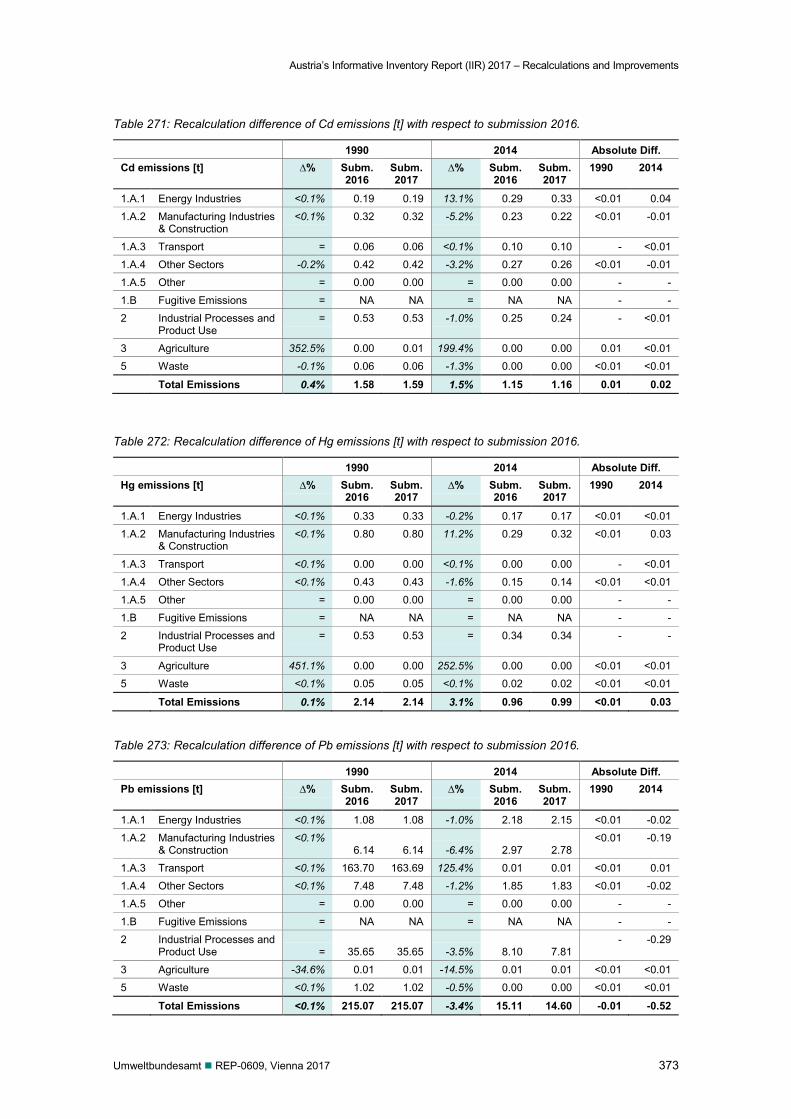
Austria’s Informative Inventory Report (IIR) 2017 – Recalculations and Improvements
Umweltbundesamt REP-0609, Vienna 2017 373
Table 271: Recalculation difference of Cd emissions [t] with respect to submission 2016.
1990 2014 Absolute Diff. Cd emissions [t] ∆% Subm.
2016 Subm. 2017
∆% Subm. 2016
Subm. 2017
1990 2014
1.A.1 Energy Industries <0.1% 0.19 0.19 13.1% 0.29 0.33 <0.01 0.04
1.A.2 Manufacturing Industries & Construction
<0.1% 0.32 0.32 -5.2% 0.23 0.22 <0.01 -0.01
1.A.3 Transport = 0.06 0.06 <0.1% 0.10 0.10 - <0.01
1.A.4 Other Sectors -0.2% 0.42 0.42 -3.2% 0.27 0.26 <0.01 -0.01
1.A.5 Other = 0.00 0.00 = 0.00 0.00 - -
1.B Fugitive Emissions = NA NA = NA NA - -
2 Industrial Processes and Product Use
= 0.53 0.53 -1.0% 0.25 0.24 - <0.01
3 Agriculture 352.5% 0.00 0.01 199.4% 0.00 0.00 0.01 <0.01
5 Waste -0.1% 0.06 0.06 -1.3% 0.00 0.00 <0.01 <0.01
Total Emissions 0.4% 1.58 1.59 1.5% 1.15 1.16 0.01 0.02
Table 272: Recalculation difference of Hg emissions [t] with respect to submission 2016.
1990 2014 Absolute Diff. Hg emissions [t] ∆% Subm.
2016 Subm. 2017
∆% Subm. 2016
Subm. 2017
1990 2014
1.A.1 Energy Industries <0.1% 0.33 0.33 -0.2% 0.17 0.17 <0.01 <0.01
1.A.2 Manufacturing Industries & Construction
<0.1% 0.80 0.80 11.2% 0.29 0.32 <0.01 0.03
1.A.3 Transport <0.1% 0.00 0.00 <0.1% 0.00 0.00 - <0.01
1.A.4 Other Sectors <0.1% 0.43 0.43 -1.6% 0.15 0.14 <0.01 <0.01
1.A.5 Other = 0.00 0.00 = 0.00 0.00 - -
1.B Fugitive Emissions = NA NA = NA NA - -
2 Industrial Processes and Product Use
= 0.53 0.53 = 0.34 0.34 - -
3 Agriculture 451.1% 0.00 0.00 252.5% 0.00 0.00 <0.01 <0.01
5 Waste <0.1% 0.05 0.05 <0.1% 0.02 0.02 <0.01 <0.01
Total Emissions 0.1% 2.14 2.14 3.1% 0.96 0.99 <0.01 0.03
Table 273: Recalculation difference of Pb emissions [t] with respect to submission 2016.
1990 2014 Absolute Diff. Pb emissions [t] ∆% Subm.
2016 Subm. 2017
∆% Subm. 2016
Subm. 2017
1990 2014
1.A.1 Energy Industries <0.1% 1.08 1.08 -1.0% 2.18 2.15 <0.01 -0.02
1.A.2 Manufacturing Industries & Construction
<0.1% 6.14 6.14 -6.4% 2.97 2.78
<0.01 -0.19
1.A.3 Transport <0.1% 163.70 163.69 125.4% 0.01 0.01 <0.01 0.01
1.A.4 Other Sectors <0.1% 7.48 7.48 -1.2% 1.85 1.83 <0.01 -0.02
1.A.5 Other = 0.00 0.00 = 0.00 0.00 - -
1.B Fugitive Emissions = NA NA = NA NA - -
2 Industrial Processes and Product Use = 35.65 35.65 -3.5% 8.10 7.81
- -0.29
3 Agriculture -34.6% 0.01 0.01 -14.5% 0.01 0.01 <0.01 <0.01
5 Waste <0.1% 1.02 1.02 -0.5% 0.00 0.00 <0.01 <0.01
Total Emissions <0.1% 215.07 215.07 -3.4% 15.11 14.60 -0.01 -0.52
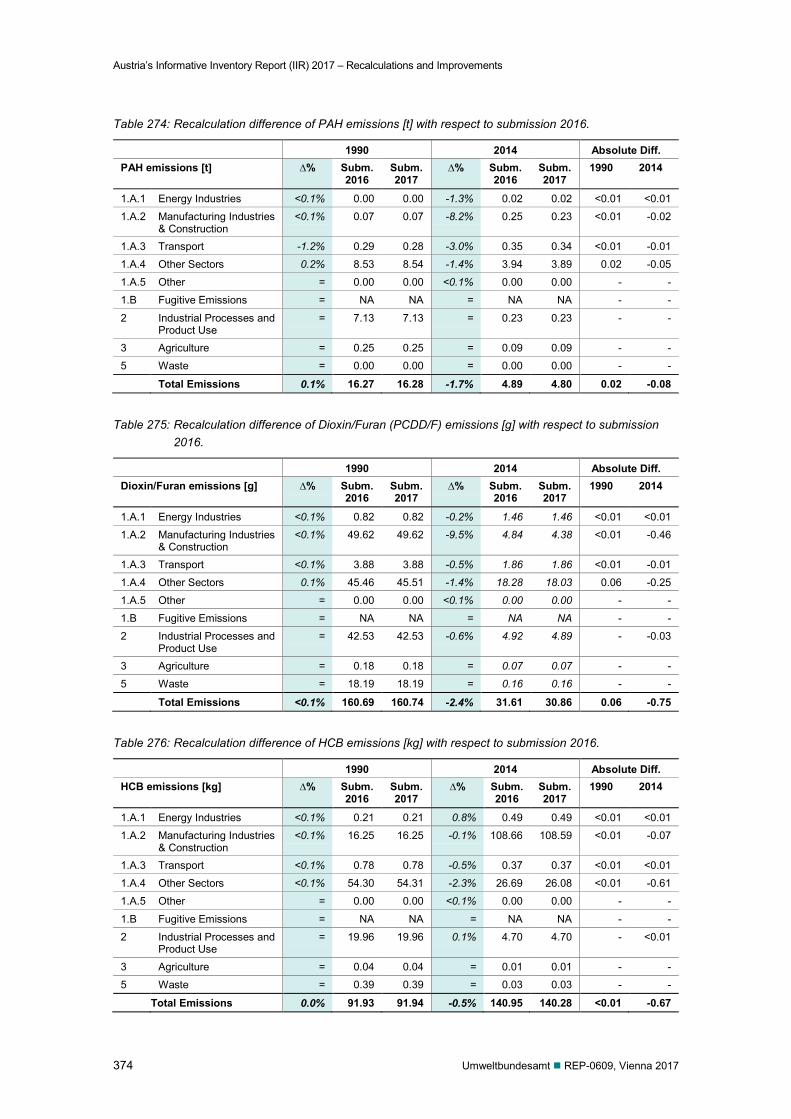
Austria’s Informative Inventory Report (IIR) 2017 – Recalculations and Improvements
374 Umweltbundesamt REP-0609, Vienna 2017
Table 274: Recalculation difference of PAH emissions [t] with respect to submission 2016.
1990 2014 Absolute Diff. PAH emissions [t] ∆% Subm.
2016 Subm. 2017
∆% Subm. 2016
Subm. 2017
1990 2014
1.A.1 Energy Industries <0.1% 0.00 0.00 -1.3% 0.02 0.02 <0.01 <0.01
1.A.2 Manufacturing Industries & Construction
<0.1% 0.07 0.07 -8.2% 0.25 0.23 <0.01 -0.02
1.A.3 Transport -1.2% 0.29 0.28 -3.0% 0.35 0.34 <0.01 -0.01
1.A.4 Other Sectors 0.2% 8.53 8.54 -1.4% 3.94 3.89 0.02 -0.05
1.A.5 Other = 0.00 0.00 <0.1% 0.00 0.00 - -
1.B Fugitive Emissions = NA NA = NA NA - -
2 Industrial Processes and Product Use
= 7.13 7.13 = 0.23 0.23 - -
3 Agriculture = 0.25 0.25 = 0.09 0.09 - -
5 Waste = 0.00 0.00 = 0.00 0.00 - -
Total Emissions 0.1% 16.27 16.28 -1.7% 4.89 4.80 0.02 -0.08
Table 275: Recalculation difference of Dioxin/Furan (PCDD/F) emissions [g] with respect to submission 2016.
1990 2014 Absolute Diff. Dioxin/Furan emissions [g] ∆% Subm.
2016 Subm. 2017
∆% Subm. 2016
Subm. 2017
1990 2014
1.A.1 Energy Industries <0.1% 0.82 0.82 -0.2% 1.46 1.46 <0.01 <0.01
1.A.2 Manufacturing Industries & Construction
<0.1% 49.62 49.62 -9.5% 4.84 4.38 <0.01 -0.46
1.A.3 Transport <0.1% 3.88 3.88 -0.5% 1.86 1.86 <0.01 -0.01
1.A.4 Other Sectors 0.1% 45.46 45.51 -1.4% 18.28 18.03 0.06 -0.25
1.A.5 Other = 0.00 0.00 <0.1% 0.00 0.00 - -
1.B Fugitive Emissions = NA NA = NA NA - -
2 Industrial Processes and Product Use
= 42.53 42.53 -0.6% 4.92 4.89 - -0.03
3 Agriculture = 0.18 0.18 = 0.07 0.07 - -
5 Waste = 18.19 18.19 = 0.16 0.16 - -
Total Emissions <0.1% 160.69 160.74 -2.4% 31.61 30.86 0.06 -0.75
Table 276: Recalculation difference of HCB emissions [kg] with respect to submission 2016.
1990 2014 Absolute Diff. HCB emissions [kg] ∆% Subm.
2016 Subm. 2017
∆% Subm. 2016
Subm. 2017
1990 2014
1.A.1 Energy Industries <0.1% 0.21 0.21 0.8% 0.49 0.49 <0.01 <0.01
1.A.2 Manufacturing Industries & Construction
<0.1% 16.25 16.25 -0.1% 108.66 108.59 <0.01 -0.07
1.A.3 Transport <0.1% 0.78 0.78 -0.5% 0.37 0.37 <0.01 <0.01
1.A.4 Other Sectors <0.1% 54.30 54.31 -2.3% 26.69 26.08 <0.01 -0.61
1.A.5 Other = 0.00 0.00 <0.1% 0.00 0.00 - -
1.B Fugitive Emissions = NA NA = NA NA - -
2 Industrial Processes and Product Use
= 19.96 19.96 0.1% 4.70 4.70 - <0.01
3 Agriculture = 0.04 0.04 = 0.01 0.01 - -
5 Waste = 0.39 0.39 = 0.03 0.03 - -
Total Emissions 0.0% 91.93 91.94 -0.5% 140.95 140.28 <0.01 -0.67
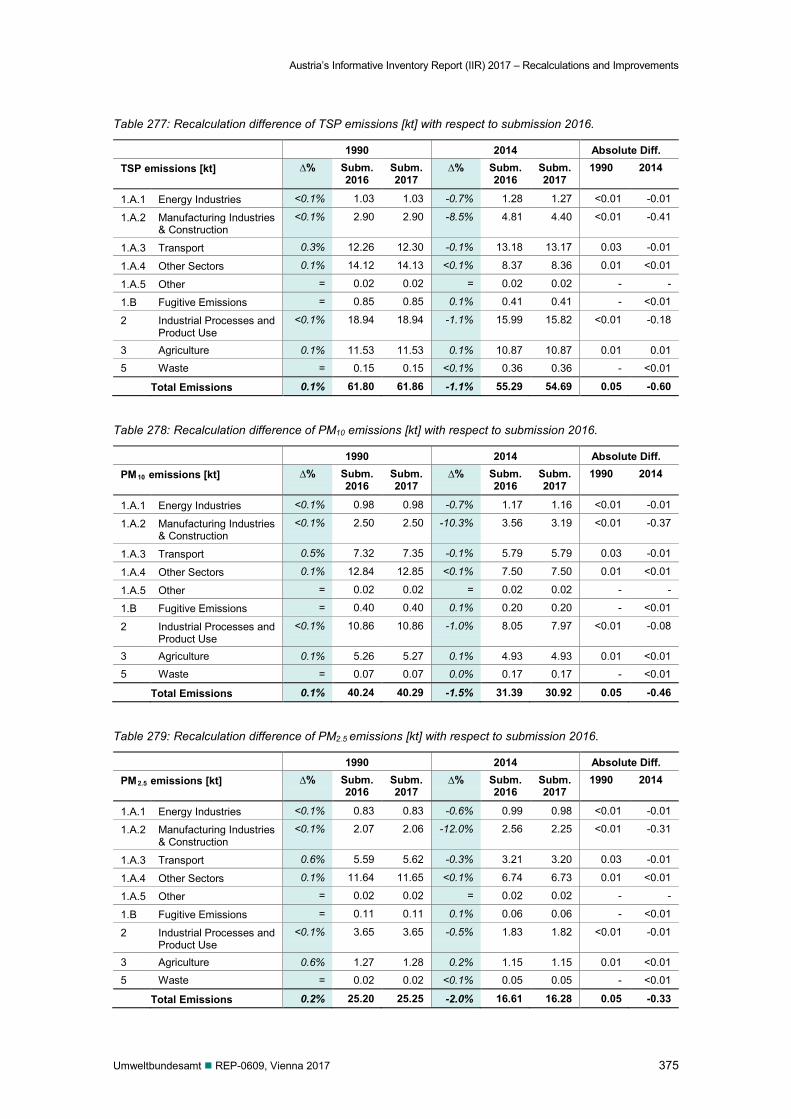
Austria’s Informative Inventory Report (IIR) 2017 – Recalculations and Improvements
Umweltbundesamt REP-0609, Vienna 2017 375
Table 277: Recalculation difference of TSP emissions [kt] with respect to submission 2016.
1990 2014 Absolute Diff. TSP emissions [kt] ∆% Subm.
2016 Subm. 2017
∆% Subm. 2016
Subm. 2017
1990 2014
1.A.1 Energy Industries <0.1% 1.03 1.03 -0.7% 1.28 1.27 <0.01 -0.01
1.A.2 Manufacturing Industries & Construction
<0.1% 2.90 2.90 -8.5% 4.81 4.40 <0.01 -0.41
1.A.3 Transport 0.3% 12.26 12.30 -0.1% 13.18 13.17 0.03 -0.01
1.A.4 Other Sectors 0.1% 14.12 14.13 <0.1% 8.37 8.36 0.01 <0.01
1.A.5 Other = 0.02 0.02 = 0.02 0.02 - -
1.B Fugitive Emissions = 0.85 0.85 0.1% 0.41 0.41 - <0.01
2 Industrial Processes and Product Use
<0.1% 18.94 18.94 -1.1% 15.99 15.82 <0.01 -0.18
3 Agriculture 0.1% 11.53 11.53 0.1% 10.87 10.87 0.01 0.01
5 Waste = 0.15 0.15 <0.1% 0.36 0.36 - <0.01
Total Emissions 0.1% 61.80 61.86 -1.1% 55.29 54.69 0.05 -0.60
Table 278: Recalculation difference of PM10 emissions [kt] with respect to submission 2016.
1990 2014 Absolute Diff. PM10 emissions [kt] ∆% Subm.
2016 Subm. 2017
∆% Subm. 2016
Subm. 2017
1990 2014
1.A.1 Energy Industries <0.1% 0.98 0.98 -0.7% 1.17 1.16 <0.01 -0.01
1.A.2 Manufacturing Industries & Construction
<0.1% 2.50 2.50 -10.3% 3.56 3.19 <0.01 -0.37
1.A.3 Transport 0.5% 7.32 7.35 -0.1% 5.79 5.79 0.03 -0.01
1.A.4 Other Sectors 0.1% 12.84 12.85 <0.1% 7.50 7.50 0.01 <0.01
1.A.5 Other = 0.02 0.02 = 0.02 0.02 - -
1.B Fugitive Emissions = 0.40 0.40 0.1% 0.20 0.20 - <0.01
2 Industrial Processes and Product Use
<0.1% 10.86 10.86 -1.0% 8.05 7.97 <0.01 -0.08
3 Agriculture 0.1% 5.26 5.27 0.1% 4.93 4.93 0.01 <0.01
5 Waste = 0.07 0.07 0.0% 0.17 0.17 - <0.01
Total Emissions 0.1% 40.24 40.29 -1.5% 31.39 30.92 0.05 -0.46
Table 279: Recalculation difference of PM2.5 emissions [kt] with respect to submission 2016.
1990 2014 Absolute Diff. PM2.5 emissions [kt] ∆% Subm.
2016 Subm. 2017
∆% Subm. 2016
Subm. 2017
1990 2014
1.A.1 Energy Industries <0.1% 0.83 0.83 -0.6% 0.99 0.98 <0.01 -0.01
1.A.2 Manufacturing Industries & Construction
<0.1% 2.07 2.06 -12.0% 2.56 2.25 <0.01 -0.31
1.A.3 Transport 0.6% 5.59 5.62 -0.3% 3.21 3.20 0.03 -0.01
1.A.4 Other Sectors 0.1% 11.64 11.65 <0.1% 6.74 6.73 0.01 <0.01
1.A.5 Other = 0.02 0.02 = 0.02 0.02 - -
1.B Fugitive Emissions = 0.11 0.11 0.1% 0.06 0.06 - <0.01
2 Industrial Processes and Product Use
<0.1% 3.65 3.65 -0.5% 1.83 1.82 <0.01 -0.01
3 Agriculture 0.6% 1.27 1.28 0.2% 1.15 1.15 0.01 <0.01
5 Waste = 0.02 0.02 <0.1% 0.05 0.05 - <0.01
Total Emissions 0.2% 25.20 25.25 -2.0% 16.61 16.28 0.05 -0.33
Austria’s Informative Inventory Report (IIR) 2017 – Recalculations and Improvements
376 Umweltbundesamt REP-0609, Vienna 2017
7.4 Planned improvements, including in response to the review process, and planned improvements to the inventory
Improvements made in response to the review process
Improvements made in response to the issues raised in the last CLRTAP stage 3 review pro-cess (UNITED NATIONS 2010) are summarized in Table 280.
Planned improvements
Planned improvements on sectoral level are presented in the respective sectoral Chapters 3–6.
Goals
The overall goal is to produce emission inventories which are fully consistent with the 2014 CLRTAP Reporting Guidelines and the EMEP/EEA Air Pollutant Emission Inventory Guidebook. An improvement programme has been established to help meet this goal.
Linkages
The improvement programme is driven by the results of the various review processes, as e.g. the internal Austrian review, review under the European Union Monitoring Mechanism, under the UNFCCC and/or under the Kyoto Protocol, under the UNECE/LRTAP Convention and under Directive (EU) 2016/2284 on the reduction of national emissions of certain atmospheric pollu-tants. Improvement is triggered by the improvement programme that plans improvements sector by sector and also identifies actions outside the Umweltbundesamt.
The improvement programme is supported by the QA/QC programme based on the internation-al standard EN ISO/IEC 17020:2012.
Updating
The improvement programme is updated every year after each review.
Responsibilities
The Umweltbundesamt is responsible for the management of the improvement programme.
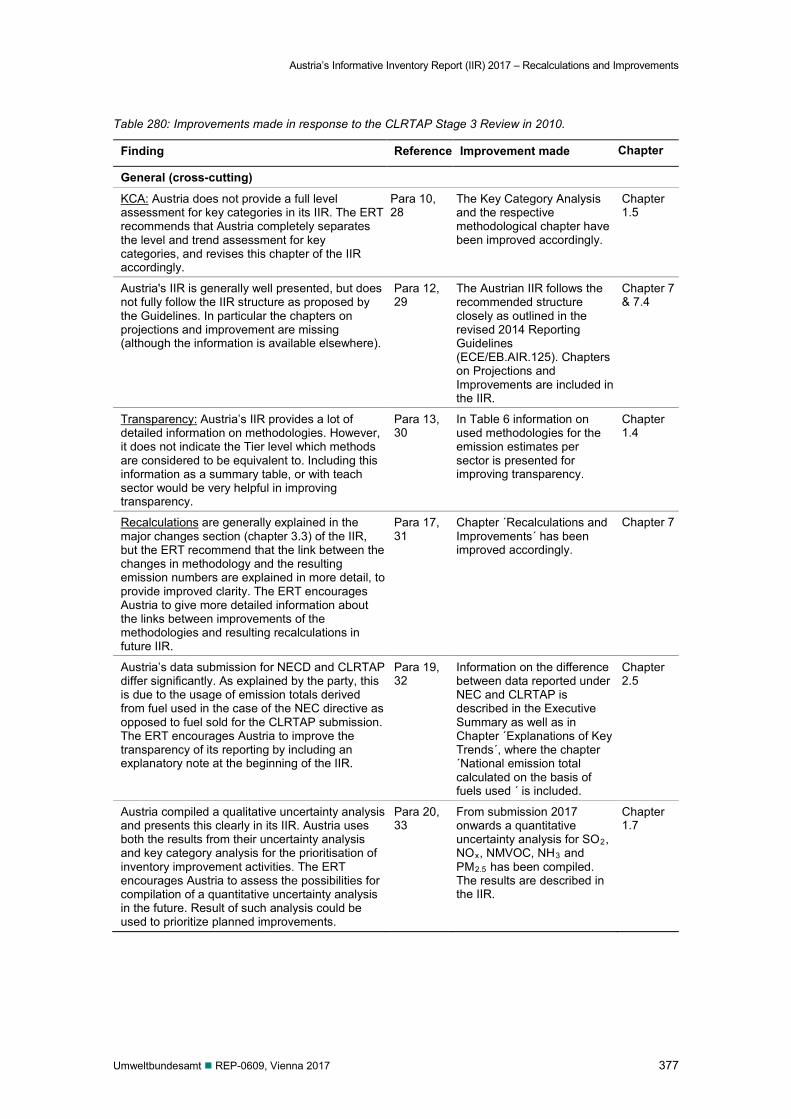
Austria’s Informative Inventory Report (IIR) 2017 – Recalculations and Improvements
Umweltbundesamt REP-0609, Vienna 2017 377
Table 280: Improvements made in response to the CLRTAP Stage 3 Review in 2010.
Finding Reference Improvement made Chapter
General (cross-cutting)
KCA: Austria does not provide a full level assessment for key categories in its IIR. The ERT recommends that Austria completely separates the level and trend assessment for key categories, and revises this chapter of the IIR accordingly.
Para 10, 28
The Key Category Analysis and the respective methodological chapter have been improved accordingly.
Chapter 1.5
Austria's IIR is generally well presented, but does not fully follow the IIR structure as proposed by the Guidelines. In particular the chapters on projections and improvement are missing (although the information is available elsewhere).
Para 12, 29
The Austrian IIR follows the recommended structure closely as outlined in the revised 2014 Reporting Guidelines (ECE/EB.AIR.125). Chapters on Projections and Improvements are included in the IIR.
Chapter 7 & 7.4
Transparency: Austria’s IIR provides a lot of detailed information on methodologies. However, it does not indicate the Tier level which methods are considered to be equivalent to. Including this information as a summary table, or with teach sector would be very helpful in improving transparency.
Para 13, 30
In Table 6 information on used methodologies for the emission estimates per sector is presented for improving transparency.
Chapter 1.4
Recalculations are generally explained in the major changes section (chapter 3.3) of the IIR, but the ERT recommend that the link between the changes in methodology and the resulting emission numbers are explained in more detail, to provide improved clarity. The ERT encourages Austria to give more detailed information about the links between improvements of the methodologies and resulting recalculations in future IIR.
Para 17, 31
Chapter ´Recalculations and Improvements´ has been improved accordingly.
Chapter 7
Austria’s data submission for NECD and CLRTAP differ significantly. As explained by the party, this is due to the usage of emission totals derived from fuel used in the case of the NEC directive as opposed to fuel sold for the CLRTAP submission. The ERT encourages Austria to improve the transparency of its reporting by including an explanatory note at the beginning of the IIR.
Para 19, 32
Information on the difference between data reported under NEC and CLRTAP is described in the Executive Summary as well as in Chapter ´Explanations of Key Trends´, where the chapter ´National emission total calculated on the basis of fuels used ´ is included.
Chapter 2.5
Austria compiled a qualitative uncertainty analysis and presents this clearly in its IIR. Austria uses both the results from their uncertainty analysis and key category analysis for the prioritisation of inventory improvement activities. The ERT encourages Austria to assess the possibilities for compilation of a quantitative uncertainty analysis in the future. Result of such analysis could be used to prioritize planned improvements.
Para 20, 33
From submission 2017 onwards a quantitative uncertainty analysis for SO2, NOx, NMVOC, NH3 and PM2.5 has been compiled. The results are described in the IIR.
Chapter 1.7
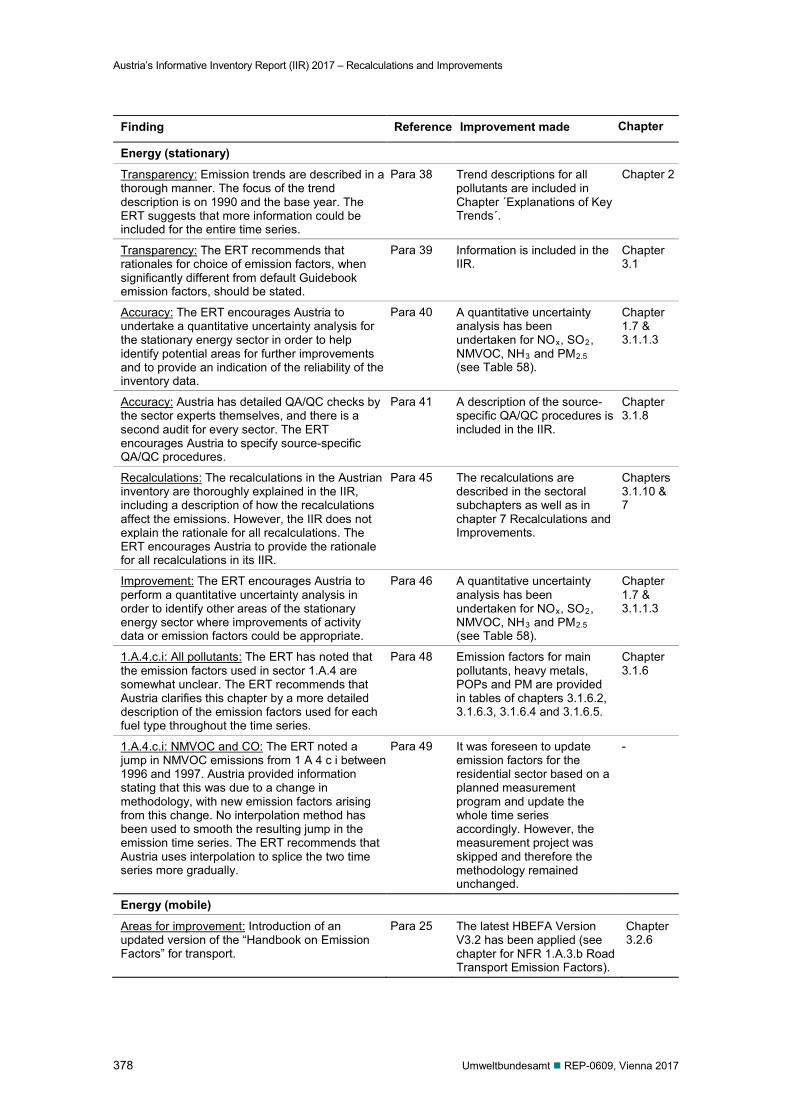
Austria’s Informative Inventory Report (IIR) 2017 – Recalculations and Improvements
378 Umweltbundesamt REP-0609, Vienna 2017
Finding Reference Improvement made Chapter
Energy (stationary)
Transparency: Emission trends are described in a thorough manner. The focus of the trend description is on 1990 and the base year. The ERT suggests that more information could be included for the entire time series.
Para 38 Trend descriptions for all pollutants are included in Chapter ´Explanations of Key Trends´.
Chapter 2
Transparency: The ERT recommends that rationales for choice of emission factors, when significantly different from default Guidebook emission factors, should be stated.
Para 39 Information is included in the IIR.
Chapter 3.1
Accuracy: The ERT encourages Austria to undertake a quantitative uncertainty analysis for the stationary energy sector in order to help identify potential areas for further improvements and to provide an indication of the reliability of the inventory data.
Para 40 A quantitative uncertainty analysis has been undertaken for NOx, SO2, NMVOC, NH3 and PM2.5 (see Table 58).
Chapter 1.7 & 3.1.1.3
Accuracy: Austria has detailed QA/QC checks by the sector experts themselves, and there is a second audit for every sector. The ERT encourages Austria to specify source-specific QA/QC procedures.
Para 41 A description of the source-specific QA/QC procedures is included in the IIR.
Chapter 3.1.8
Recalculations: The recalculations in the Austrian inventory are thoroughly explained in the IIR, including a description of how the recalculations affect the emissions. However, the IIR does not explain the rationale for all recalculations. The ERT encourages Austria to provide the rationale for all recalculations in its IIR.
Para 45 The recalculations are described in the sectoral subchapters as well as in chapter 7 Recalculations and Improvements.
Chapters 3.1.10 & 7
Improvement: The ERT encourages Austria to perform a quantitative uncertainty analysis in order to identify other areas of the stationary energy sector where improvements of activity data or emission factors could be appropriate.
Para 46 A quantitative uncertainty analysis has been undertaken for NOx, SO2, NMVOC, NH3 and PM2.5 (see Table 58).
Chapter 1.7 & 3.1.1.3
1.A.4.c.i: All pollutants: The ERT has noted that the emission factors used in sector 1.A.4 are somewhat unclear. The ERT recommends that Austria clarifies this chapter by a more detailed description of the emission factors used for each fuel type throughout the time series.
Para 48 Emission factors for main pollutants, heavy metals, POPs and PM are provided in tables of chapters 3.1.6.2, 3.1.6.3, 3.1.6.4 and 3.1.6.5.
Chapter 3.1.6
1.A.4.c.i: NMVOC and CO: The ERT noted a jump in NMVOC emissions from 1 A 4 c i between 1996 and 1997. Austria provided information stating that this was due to a change in methodology, with new emission factors arising from this change. No interpolation method has been used to smooth the resulting jump in the emission time series. The ERT recommends that Austria uses interpolation to splice the two time series more gradually.
Para 49 It was foreseen to update emission factors for the residential sector based on a planned measurement program and update the whole time series accordingly. However, the measurement project was skipped and therefore the methodology remained unchanged.
-
Energy (mobile)
Areas for improvement: Introduction of an updated version of the “Handbook on Emission Factors” for transport.
Para 25 The latest HBEFA Version V3.2 has been applied (see chapter for NFR 1.A.3.b Road Transport Emission Factors).
Chapter 3.2.6
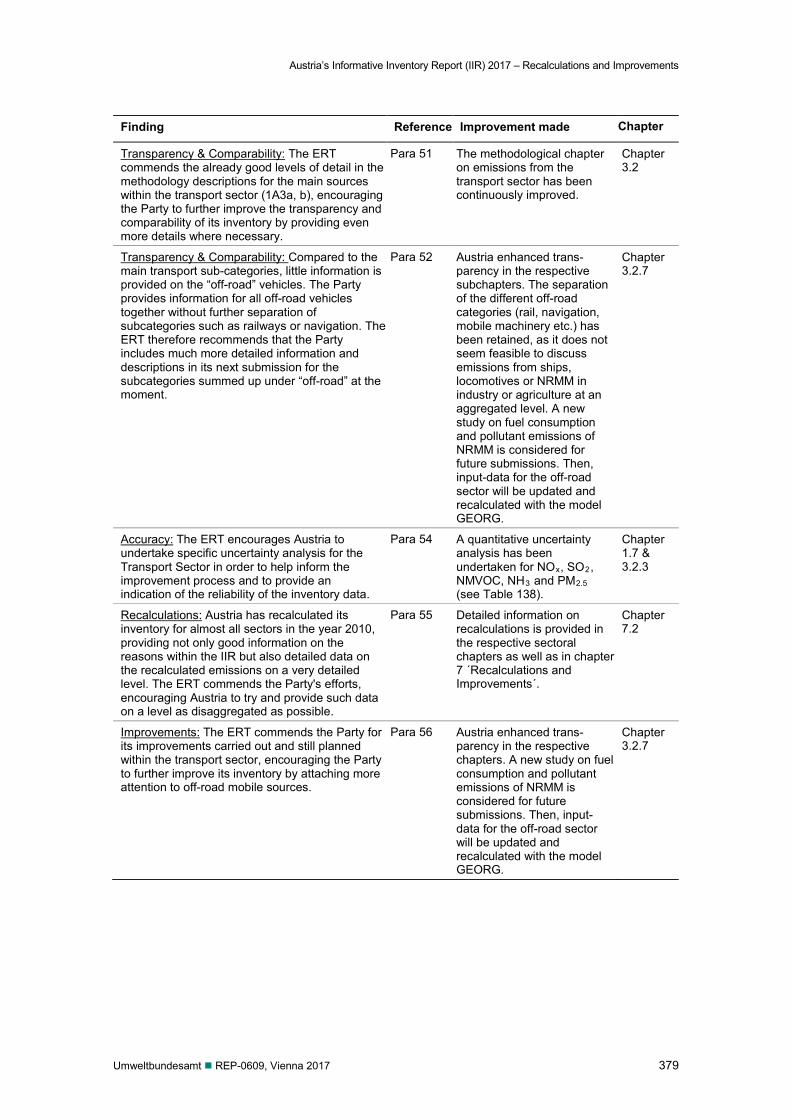
Austria’s Informative Inventory Report (IIR) 2017 – Recalculations and Improvements
Umweltbundesamt REP-0609, Vienna 2017 379
Finding Reference Improvement made Chapter
Transparency & Comparability: The ERT commends the already good levels of detail in the methodology descriptions for the main sources within the transport sector (1A3a, b), encouraging the Party to further improve the transparency and comparability of its inventory by providing even more details where necessary.
Para 51 The methodological chapter on emissions from the transport sector has been continuously improved.
Chapter 3.2
Transparency & Comparability: Compared to the main transport sub-categories, little information is provided on the “off-road” vehicles. The Party provides information for all off-road vehicles together without further separation of subcategories such as railways or navigation. The ERT therefore recommends that the Party includes much more detailed information and descriptions in its next submission for the subcategories summed up under “off-road” at the moment.
Para 52 Austria enhanced trans-parency in the respective subchapters. The separation of the different off-road categories (rail, navigation, mobile machinery etc.) has been retained, as it does not seem feasible to discuss emissions from ships, locomotives or NRMM in industry or agriculture at an aggregated level. A new study on fuel consumption and pollutant emissions of NRMM is considered for future submissions. Then, input-data for the off-road sector will be updated and recalculated with the model GEORG.
Chapter 3.2.7
Accuracy: The ERT encourages Austria to undertake specific uncertainty analysis for the Transport Sector in order to help inform the improvement process and to provide an indication of the reliability of the inventory data.
Para 54 A quantitative uncertainty analysis has been undertaken for NOx, SO2, NMVOC, NH3 and PM2.5 (see Table 138).
Chapter 1.7 & 3.2.3
Recalculations: Austria has recalculated its inventory for almost all sectors in the year 2010, providing not only good information on the reasons within the IIR but also detailed data on the recalculated emissions on a very detailed level. The ERT commends the Party's efforts, encouraging Austria to try and provide such data on a level as disaggregated as possible.
Para 55 Detailed information on recalculations is provided in the respective sectoral chapters as well as in chapter 7 ´Recalculations and Improvements´.
Chapter 7.2
Improvements: The ERT commends the Party for its improvements carried out and still planned within the transport sector, encouraging the Party to further improve its inventory by attaching more attention to off-road mobile sources.
Para 56 Austria enhanced trans-parency in the respective chapters. A new study on fuel consumption and pollutant emissions of NRMM is considered for future submissions. Then, input-data for the off-road sector will be updated and recalculated with the model GEORG.
Chapter 3.2.7
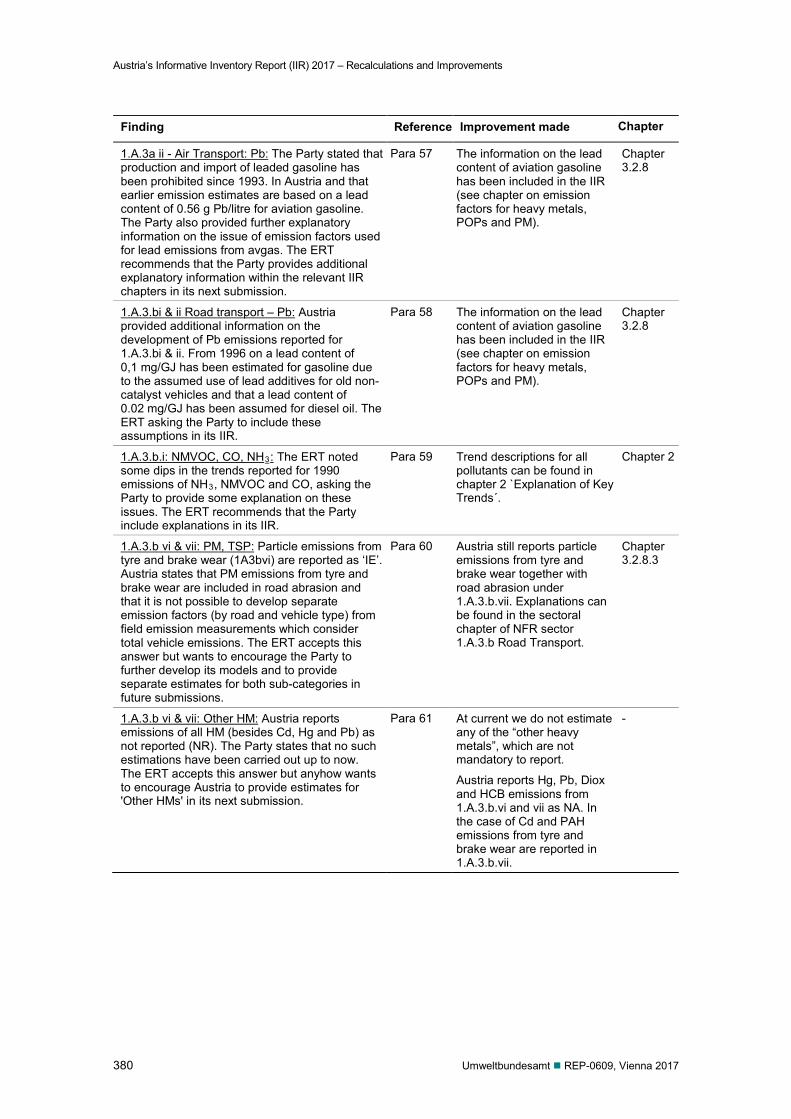
Austria’s Informative Inventory Report (IIR) 2017 – Recalculations and Improvements
380 Umweltbundesamt REP-0609, Vienna 2017
Finding Reference Improvement made Chapter
1.A.3a ii - Air Transport: Pb: The Party stated that production and import of leaded gasoline has been prohibited since 1993. In Austria and that earlier emission estimates are based on a lead content of 0.56 g Pb/litre for aviation gasoline. The Party also provided further explanatory information on the issue of emission factors used for lead emissions from avgas. The ERT recommends that the Party provides additional explanatory information within the relevant IIR chapters in its next submission.
Para 57 The information on the lead content of aviation gasoline has been included in the IIR (see chapter on emission factors for heavy metals, POPs and PM).
Chapter 3.2.8
1.A.3.bi & ii Road transport – Pb: Austria provided additional information on the development of Pb emissions reported for 1.A.3.bi & ii. From 1996 on a lead content of 0,1 mg/GJ has been estimated for gasoline due to the assumed use of lead additives for old non-catalyst vehicles and that a lead content of 0.02 mg/GJ has been assumed for diesel oil. The ERT asking the Party to include these assumptions in its IIR.
Para 58 The information on the lead content of aviation gasoline has been included in the IIR (see chapter on emission factors for heavy metals, POPs and PM).
Chapter 3.2.8
1.A.3.b.i: NMVOC, CO, NH3: The ERT noted some dips in the trends reported for 1990 emissions of NH3, NMVOC and CO, asking the Party to provide some explanation on these issues. The ERT recommends that the Party include explanations in its IIR.
Para 59 Trend descriptions for all pollutants can be found in chapter 2 `Explanation of Key Trends´.
Chapter 2
1.A.3.b vi & vii: PM, TSP: Particle emissions from tyre and brake wear (1A3bvi) are reported as ‘IE’. Austria states that PM emissions from tyre and brake wear are included in road abrasion and that it is not possible to develop separate emission factors (by road and vehicle type) from field emission measurements which consider total vehicle emissions. The ERT accepts this answer but wants to encourage the Party to further develop its models and to provide separate estimates for both sub-categories in future submissions.
Para 60 Austria still reports particle emissions from tyre and brake wear together with road abrasion under 1.A.3.b.vii. Explanations can be found in the sectoral chapter of NFR sector 1.A.3.b Road Transport.
Chapter 3.2.8.3
1.A.3.b vi & vii: Other HM: Austria reports emissions of all HM (besides Cd, Hg and Pb) as not reported (NR). The Party states that no such estimations have been carried out up to now. The ERT accepts this answer but anyhow wants to encourage Austria to provide estimates for 'Other HMs' in its next submission.
Para 61 At current we do not estimate any of the “other heavy metals”, which are not mandatory to report.
Austria reports Hg, Pb, Diox and HCB emissions from 1.A.3.b.vi and vii as NA. In the case of Cd and PAH emissions from tyre and brake wear are reported in 1.A.3.b.vii.
-
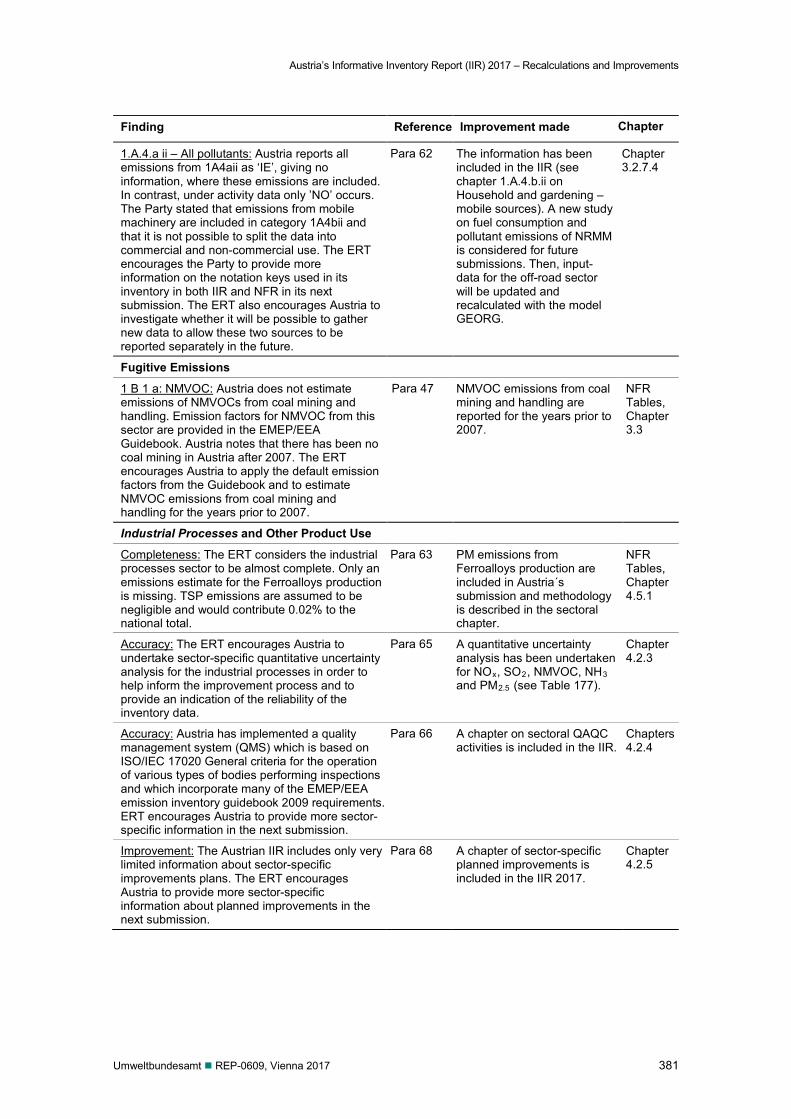
Austria’s Informative Inventory Report (IIR) 2017 – Recalculations and Improvements
Umweltbundesamt REP-0609, Vienna 2017 381
Finding Reference Improvement made Chapter
1.A.4.a ii – All pollutants: Austria reports all emissions from 1A4aii as ‘IE’, giving no information, where these emissions are included. In contrast, under activity data only ’NO’ occurs. The Party stated that emissions from mobile machinery are included in category 1A4bii and that it is not possible to split the data into commercial and non-commercial use. The ERT encourages the Party to provide more information on the notation keys used in its inventory in both IIR and NFR in its next submission. The ERT also encourages Austria to investigate whether it will be possible to gather new data to allow these two sources to be reported separately in the future.
Para 62 The information has been included in the IIR (see chapter 1.A.4.b.ii on Household and gardening – mobile sources). A new study on fuel consumption and pollutant emissions of NRMM is considered for future submissions. Then, input-data for the off-road sector will be updated and recalculated with the model GEORG.
Chapter 3.2.7.4
Fugitive Emissions
1 B 1 a: NMVOC: Austria does not estimate emissions of NMVOCs from coal mining and handling. Emission factors for NMVOC from this sector are provided in the EMEP/EEA Guidebook. Austria notes that there has been no coal mining in Austria after 2007. The ERT encourages Austria to apply the default emission factors from the Guidebook and to estimate NMVOC emissions from coal mining and handling for the years prior to 2007.
Para 47 NMVOC emissions from coal mining and handling are reported for the years prior to 2007.
NFR Tables, Chapter 3.3
Industrial Processes and Other Product Use
Completeness: The ERT considers the industrial processes sector to be almost complete. Only an emissions estimate for the Ferroalloys production is missing. TSP emissions are assumed to be negligible and would contribute 0.02% to the national total.
Para 63 PM emissions from Ferroalloys production are included in Austria´s submission and methodology is described in the sectoral chapter.
NFR Tables, Chapter 4.5.1
Accuracy: The ERT encourages Austria to undertake sector-specific quantitative uncertainty analysis for the industrial processes in order to help inform the improvement process and to provide an indication of the reliability of the inventory data.
Para 65 A quantitative uncertainty analysis has been undertaken for NOx, SO2, NMVOC, NH3 and PM2.5 (see Table 177).
Chapter 4.2.3
Accuracy: Austria has implemented a quality management system (QMS) which is based on ISO/IEC 17020 General criteria for the operation of various types of bodies performing inspections and which incorporate many of the EMEP/EEA emission inventory guidebook 2009 requirements. ERT encourages Austria to provide more sector-specific information in the next submission.
Para 66 A chapter on sectoral QAQC activities is included in the IIR.
Chapters 4.2.4
Improvement: The Austrian IIR includes only very limited information about sector-specific improvements plans. The ERT encourages Austria to provide more sector-specific information about planned improvements in the next submission.
Para 68 A chapter of sector-specific planned improvements is included in the IIR 2017.
Chapter 4.2.5
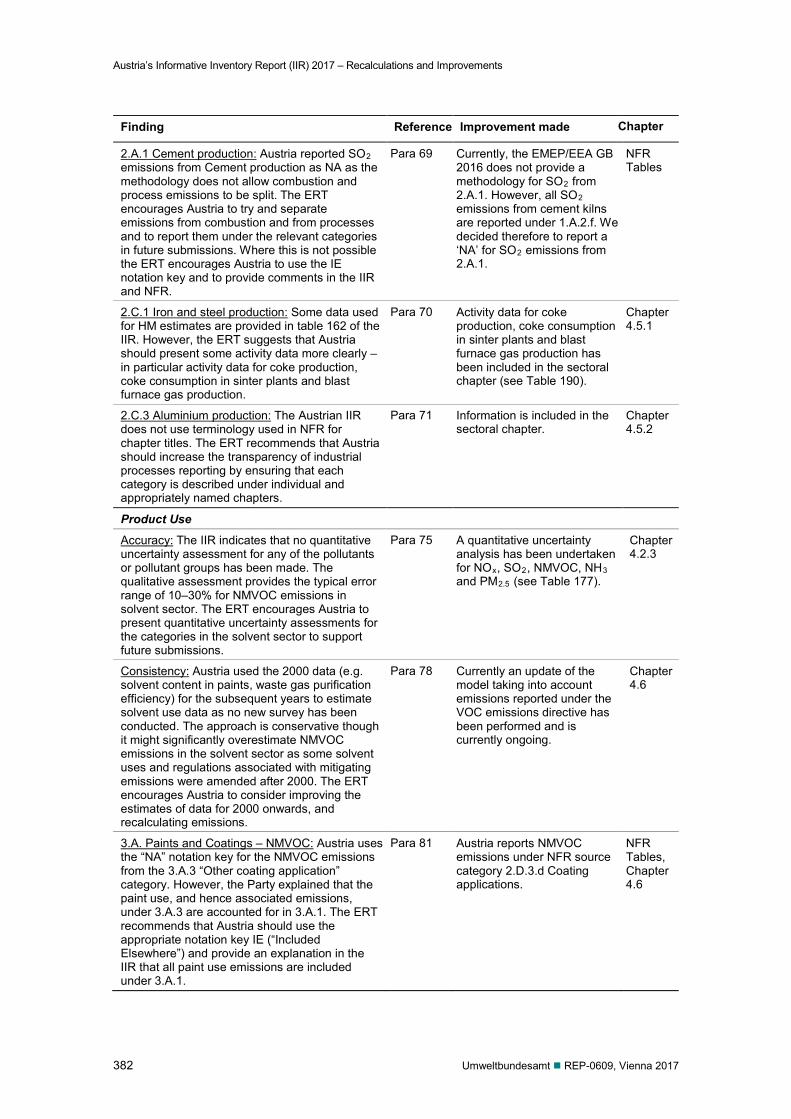
Austria’s Informative Inventory Report (IIR) 2017 – Recalculations and Improvements
382 Umweltbundesamt REP-0609, Vienna 2017
Finding Reference Improvement made Chapter
2.A.1 Cement production: Austria reported SO2 emissions from Cement production as NA as the methodology does not allow combustion and process emissions to be split. The ERT encourages Austria to try and separate emissions from combustion and from processes and to report them under the relevant categories in future submissions. Where this is not possible the ERT encourages Austria to use the IE notation key and to provide comments in the IIR and NFR.
Para 69 Currently, the EMEP/EEA GB 2016 does not provide a methodology for SO2 from 2.A.1. However, all SO2 emissions from cement kilns are reported under 1.A.2.f. We decided therefore to report a ‘NA’ for SO2 emissions from 2.A.1.
NFR Tables
2.C.1 Iron and steel production: Some data used for HM estimates are provided in table 162 of the IIR. However, the ERT suggests that Austria should present some activity data more clearly – in particular activity data for coke production, coke consumption in sinter plants and blast furnace gas production.
Para 70 Activity data for coke production, coke consumption in sinter plants and blast furnace gas production has been included in the sectoral chapter (see Table 190).
Chapter 4.5.1
2.C.3 Aluminium production: The Austrian IIR does not use terminology used in NFR for chapter titles. The ERT recommends that Austria should increase the transparency of industrial processes reporting by ensuring that each category is described under individual and appropriately named chapters.
Para 71 Information is included in the sectoral chapter.
Chapter 4.5.2
Product Use
Accuracy: The IIR indicates that no quantitative uncertainty assessment for any of the pollutants or pollutant groups has been made. The qualitative assessment provides the typical error range of 10–30% for NMVOC emissions in solvent sector. The ERT encourages Austria to present quantitative uncertainty assessments for the categories in the solvent sector to support future submissions.
Para 75 A quantitative uncertainty analysis has been undertaken for NOx, SO2, NMVOC, NH3 and PM2.5 (see Table 177).
Chapter 4.2.3
Consistency: Austria used the 2000 data (e.g. solvent content in paints, waste gas purification efficiency) for the subsequent years to estimate solvent use data as no new survey has been conducted. The approach is conservative though it might significantly overestimate NMVOC emissions in the solvent sector as some solvent uses and regulations associated with mitigating emissions were amended after 2000. The ERT encourages Austria to consider improving the estimates of data for 2000 onwards, and recalculating emissions.
Para 78 Currently an update of the model taking into account emissions reported under the VOC emissions directive has been performed and is currently ongoing.
Chapter 4.6
3.A. Paints and Coatings – NMVOC: Austria uses the “NA” notation key for the NMVOC emissions from the 3.A.3 “Other coating application” category. However, the Party explained that the paint use, and hence associated emissions, under 3.A.3 are accounted for in 3.A.1. The ERT recommends that Austria should use the appropriate notation key IE (“Included Elsewhere”) and provide an explanation in the IIR that all paint use emissions are included under 3.A.1.
Para 81 Austria reports NMVOC emissions under NFR source category 2.D.3.d Coating applications.
NFR Tables, Chapter 4.6
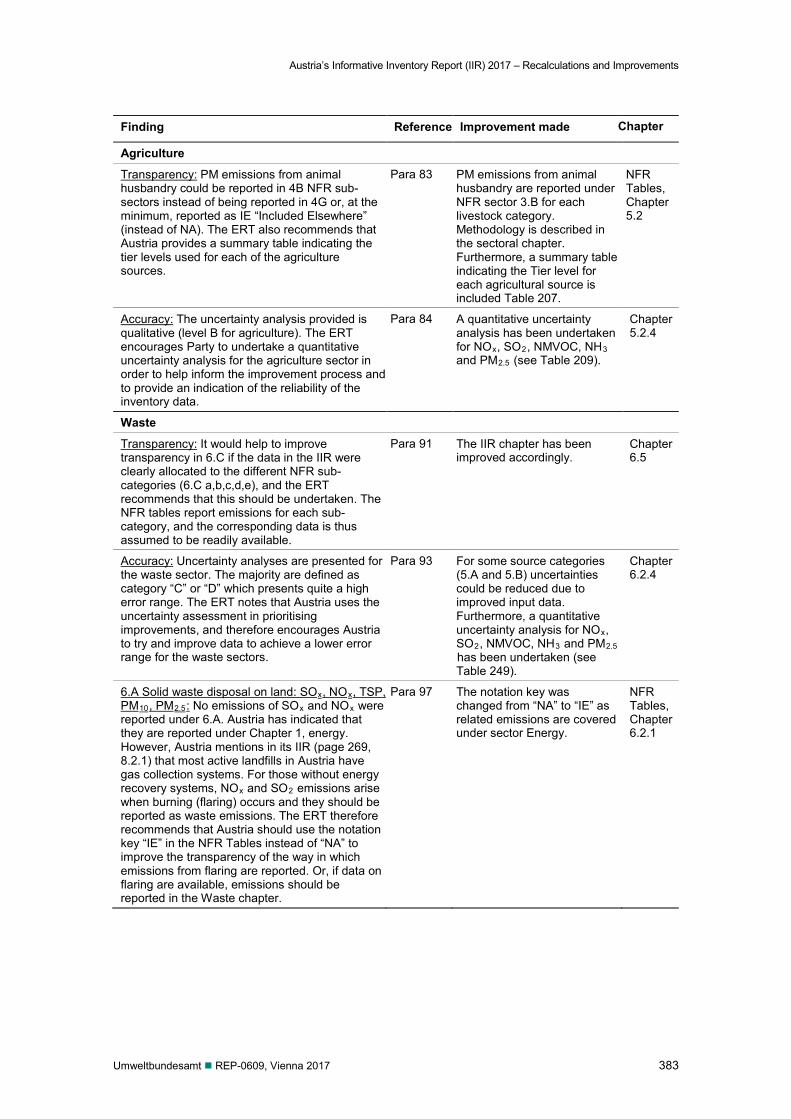
Austria’s Informative Inventory Report (IIR) 2017 – Recalculations and Improvements
Umweltbundesamt REP-0609, Vienna 2017 383
Finding Reference Improvement made Chapter
Agriculture
Transparency: PM emissions from animal husbandry could be reported in 4B NFR sub-sectors instead of being reported in 4G or, at the minimum, reported as IE “Included Elsewhere” (instead of NA). The ERT also recommends that Austria provides a summary table indicating the tier levels used for each of the agriculture sources.
Para 83 PM emissions from animal husbandry are reported under NFR sector 3.B for each livestock category. Methodology is described in the sectoral chapter. Furthermore, a summary table indicating the Tier level for each agricultural source is included Table 207.
NFR Tables, Chapter 5.2
Accuracy: The uncertainty analysis provided is qualitative (level B for agriculture). The ERT encourages Party to undertake a quantitative uncertainty analysis for the agriculture sector in order to help inform the improvement process and to provide an indication of the reliability of the inventory data.
Para 84 A quantitative uncertainty analysis has been undertaken for NOx, SO2, NMVOC, NH3 and PM2.5 (see Table 209).
Chapter 5.2.4
Waste
Transparency: It would help to improve transparency in 6.C if the data in the IIR were clearly allocated to the different NFR sub-categories (6.C a,b,c,d,e), and the ERT recommends that this should be undertaken. The NFR tables report emissions for each sub-category, and the corresponding data is thus assumed to be readily available.
Para 91 The IIR chapter has been improved accordingly.
Chapter 6.5
Accuracy: Uncertainty analyses are presented for the waste sector. The majority are defined as category “C” or “D” which presents quite a high error range. The ERT notes that Austria uses the uncertainty assessment in prioritising improvements, and therefore encourages Austria to try and improve data to achieve a lower error range for the waste sectors.
Para 93 For some source categories (5.A and 5.B) uncertainties could be reduced due to improved input data. Furthermore, a quantitative uncertainty analysis for NOx, SO2, NMVOC, NH3 and PM2.5 has been undertaken (see Table 249).
Chapter 6.2.4
6.A Solid waste disposal on land: SOx, NOx, TSP, PM10, PM2.5: No emissions of SOx and NOx were reported under 6.A. Austria has indicated that they are reported under Chapter 1, energy. However, Austria mentions in its IIR (page 269, 8.2.1) that most active landfills in Austria have gas collection systems. For those without energy recovery systems, NOx and SO2 emissions arise when burning (flaring) occurs and they should be reported as waste emissions. The ERT therefore recommends that Austria should use the notation key “IE” in the NFR Tables instead of “NA” to improve the transparency of the way in which emissions from flaring are reported. Or, if data on flaring are available, emissions should be reported in the Waste chapter.
Para 97 The notation key was changed from “NA” to “IE” as related emissions are covered under sector Energy.
NFR Tables, Chapter 6.2.1
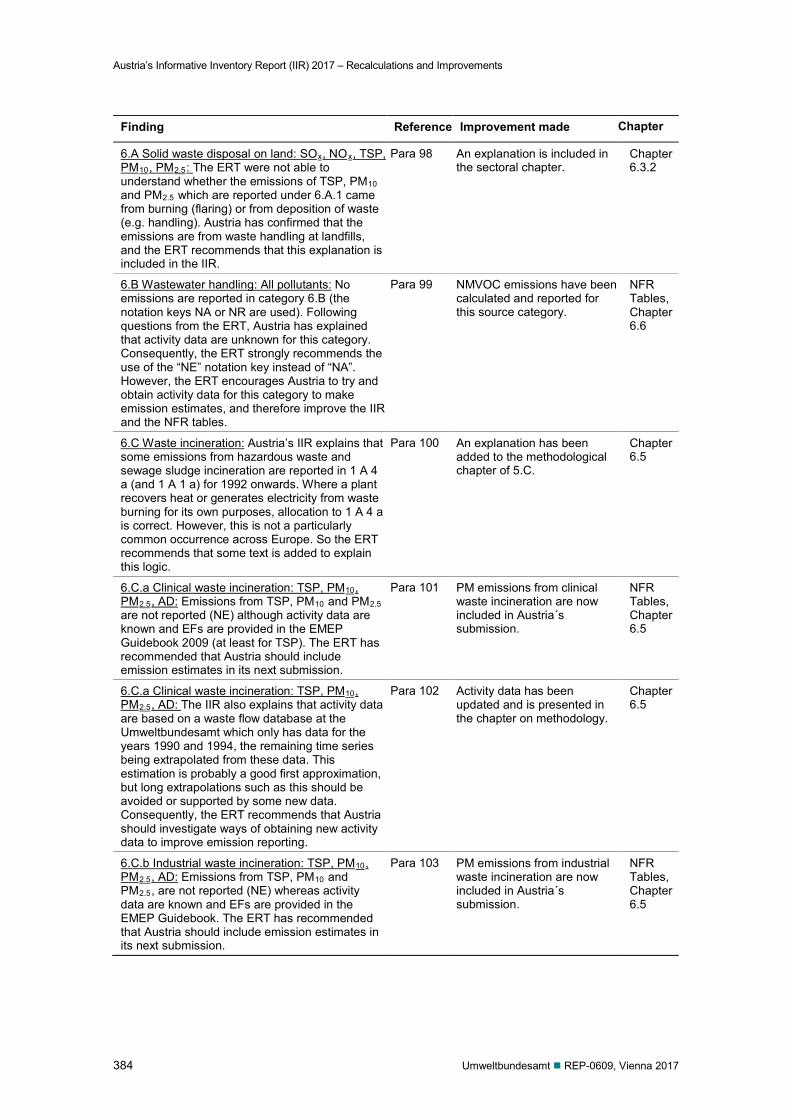
Austria’s Informative Inventory Report (IIR) 2017 – Recalculations and Improvements
384 Umweltbundesamt REP-0609, Vienna 2017
Finding Reference Improvement made Chapter
6.A Solid waste disposal on land: SOx, NOx, TSP, PM10, PM2.5: The ERT were not able to understand whether the emissions of TSP, PM10 and PM2.5 which are reported under 6.A.1 came from burning (flaring) or from deposition of waste (e.g. handling). Austria has confirmed that the emissions are from waste handling at landfills, and the ERT recommends that this explanation is included in the IIR.
Para 98 An explanation is included in the sectoral chapter.
Chapter 6.3.2
6.B Wastewater handling: All pollutants: No emissions are reported in category 6.B (the notation keys NA or NR are used). Following questions from the ERT, Austria has explained that activity data are unknown for this category. Consequently, the ERT strongly recommends the use of the “NE” notation key instead of “NA”. However, the ERT encourages Austria to try and obtain activity data for this category to make emission estimates, and therefore improve the IIR and the NFR tables.
Para 99 NMVOC emissions have been calculated and reported for this source category.
NFR Tables, Chapter 6.6
6.C Waste incineration: Austria’s IIR explains that some emissions from hazardous waste and sewage sludge incineration are reported in 1 A 4 a (and 1 A 1 a) for 1992 onwards. Where a plant recovers heat or generates electricity from waste burning for its own purposes, allocation to 1 A 4 a is correct. However, this is not a particularly common occurrence across Europe. So the ERT recommends that some text is added to explain this logic.
Para 100 An explanation has been added to the methodological chapter of 5.C.
Chapter 6.5
6.C.a Clinical waste incineration: TSP, PM10, PM2.5, AD: Emissions from TSP, PM10 and PM2.5 are not reported (NE) although activity data are known and EFs are provided in the EMEP Guidebook 2009 (at least for TSP). The ERT has recommended that Austria should include emission estimates in its next submission.
Para 101 PM emissions from clinical waste incineration are now included in Austria´s submission.
NFR Tables, Chapter 6.5
6.C.a Clinical waste incineration: TSP, PM10, PM2.5, AD: The IIR also explains that activity data are based on a waste flow database at the Umweltbundesamt which only has data for the years 1990 and 1994, the remaining time series being extrapolated from these data. This estimation is probably a good first approximation, but long extrapolations such as this should be avoided or supported by some new data. Consequently, the ERT recommends that Austria should investigate ways of obtaining new activity data to improve emission reporting.
Para 102 Activity data has been updated and is presented in the chapter on methodology.
Chapter 6.5
6.C.b Industrial waste incineration: TSP, PM10, PM2.5, AD: Emissions from TSP, PM10 and PM2.5, are not reported (NE) whereas activity data are known and EFs are provided in the EMEP Guidebook. The ERT has recommended that Austria should include emission estimates in its next submission.
Para 103 PM emissions from industrial waste incineration are now included in Austria´s submission.
NFR Tables, Chapter 6.5
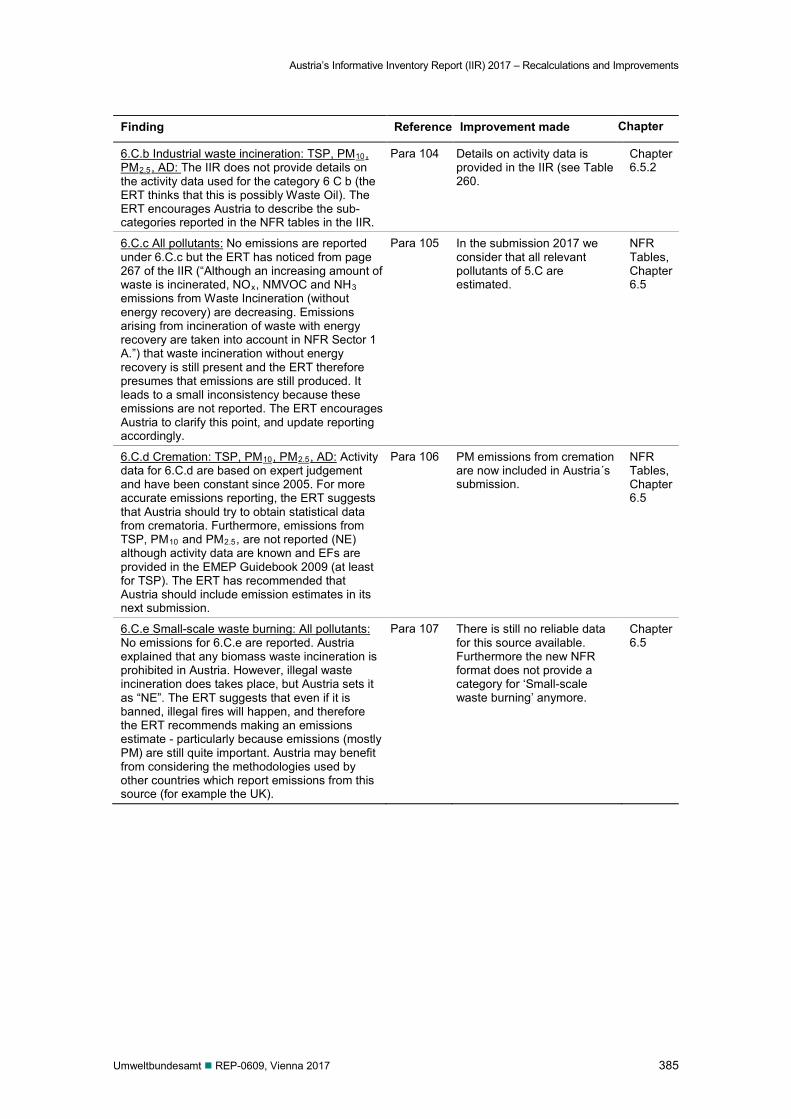
Austria’s Informative Inventory Report (IIR) 2017 – Recalculations and Improvements
Umweltbundesamt REP-0609, Vienna 2017 385
Finding Reference Improvement made Chapter
6.C.b Industrial waste incineration: TSP, PM10, PM2.5, AD: The IIR does not provide details on the activity data used for the category 6 C b (the ERT thinks that this is possibly Waste Oil). The ERT encourages Austria to describe the sub-categories reported in the NFR tables in the IIR.
Para 104 Details on activity data is provided in the IIR (see Table 260.
Chapter 6.5.2
6.C.c All pollutants: No emissions are reported under 6.C.c but the ERT has noticed from page 267 of the IIR (“Although an increasing amount of waste is incinerated, NOx, NMVOC and NH3 emissions from Waste Incineration (without energy recovery) are decreasing. Emissions arising from incineration of waste with energy recovery are taken into account in NFR Sector 1 A.”) that waste incineration without energy recovery is still present and the ERT therefore presumes that emissions are still produced. It leads to a small inconsistency because these emissions are not reported. The ERT encourages Austria to clarify this point, and update reporting accordingly.
Para 105 In the submission 2017 we consider that all relevant pollutants of 5.C are estimated.
NFR Tables, Chapter 6.5
6.C.d Cremation: TSP, PM10, PM2.5, AD: Activity data for 6.C.d are based on expert judgement and have been constant since 2005. For more accurate emissions reporting, the ERT suggests that Austria should try to obtain statistical data from crematoria. Furthermore, emissions from TSP, PM10 and PM2.5, are not reported (NE) although activity data are known and EFs are provided in the EMEP Guidebook 2009 (at least for TSP). The ERT has recommended that Austria should include emission estimates in its next submission.
Para 106 PM emissions from cremation are now included in Austria´s submission.
NFR Tables, Chapter 6.5
6.C.e Small-scale waste burning: All pollutants: No emissions for 6.C.e are reported. Austria explained that any biomass waste incineration is prohibited in Austria. However, illegal waste incineration does takes place, but Austria sets it as “NE”. The ERT suggests that even if it is banned, illegal fires will happen, and therefore the ERT recommends making an emissions estimate - particularly because emissions (mostly PM) are still quite important. Austria may benefit from considering the methodologies used by other countries which report emissions from this source (for example the UK).
Para 107 There is still no reliable data for this source available. Furthermore the new NFR format does not provide a category for ‘Small-scale waste burning’ anymore.
Chapter 6.5
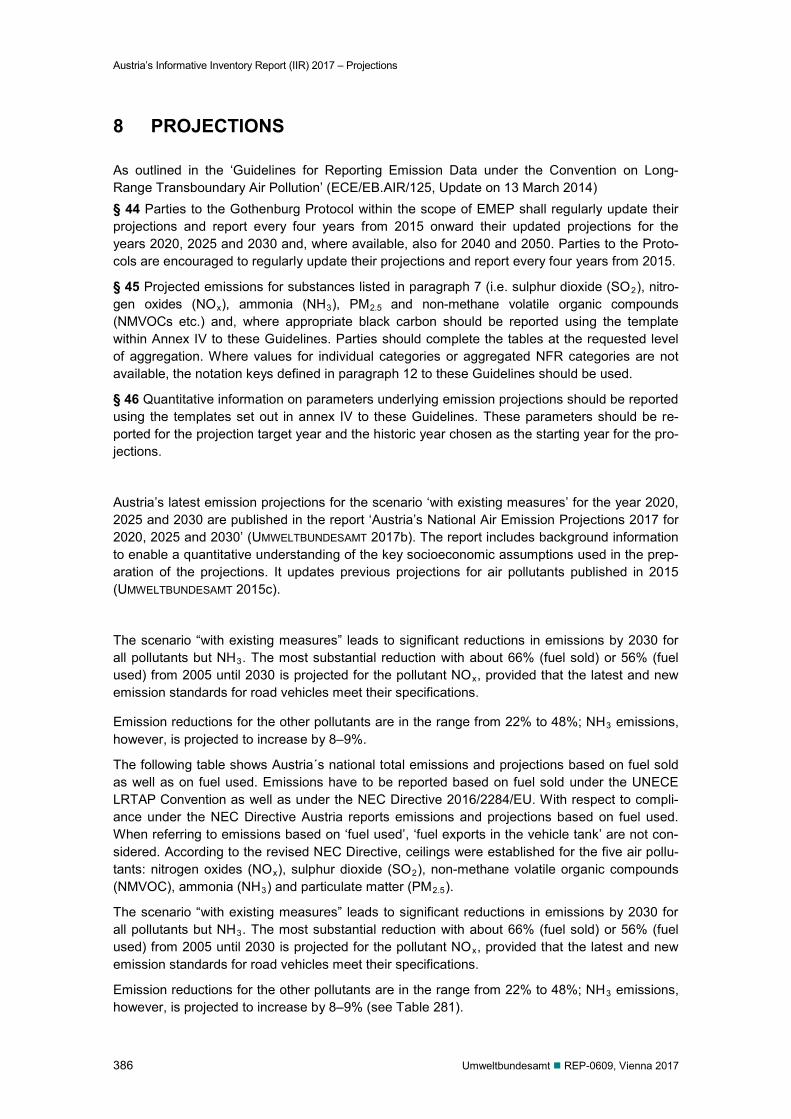
Austria’s Informative Inventory Report (IIR) 2017 – Projections
386 Umweltbundesamt REP-0609, Vienna 2017
8 PROJECTIONS
As outlined in the ‘Guidelines for Reporting Emission Data under the Convention on Long-Range Transboundary Air Pollution’ (ECE/EB.AIR/125, Update on 13 March 2014) § 44 Parties to the Gothenburg Protocol within the scope of EMEP shall regularly update their projections and report every four years from 2015 onward their updated projections for the years 2020, 2025 and 2030 and, where available, also for 2040 and 2050. Parties to the Proto-cols are encouraged to regularly update their projections and report every four years from 2015.
§ 45 Projected emissions for substances listed in paragraph 7 (i.e. sulphur dioxide (SO2), nitro-gen oxides (NOx), ammonia (NH3), PM2.5 and non-methane volatile organic compounds (NMVOCs etc.) and, where appropriate black carbon should be reported using the template within Annex IV to these Guidelines. Parties should complete the tables at the requested level of aggregation. Where values for individual categories or aggregated NFR categories are not available, the notation keys defined in paragraph 12 to these Guidelines should be used.
§ 46 Quantitative information on parameters underlying emission projections should be reported using the templates set out in annex IV to these Guidelines. These parameters should be re-ported for the projection target year and the historic year chosen as the starting year for the pro-jections.
Austria’s latest emission projections for the scenario ‘with existing measures’ for the year 2020, 2025 and 2030 are published in the report ‘Austria’s National Air Emission Projections 2017 for 2020, 2025 and 2030’ (UMWELTBUNDESAMT 2017b). The report includes background information to enable a quantitative understanding of the key socioeconomic assumptions used in the prep-aration of the projections. It updates previous projections for air pollutants published in 2015 (UMWELTBUNDESAMT 2015c).
The scenario “with existing measures” leads to significant reductions in emissions by 2030 for all pollutants but NH3. The most substantial reduction with about 66% (fuel sold) or 56% (fuel used) from 2005 until 2030 is projected for the pollutant NOx, provided that the latest and new emission standards for road vehicles meet their specifications.
Emission reductions for the other pollutants are in the range from 22% to 48%; NH3 emissions, however, is projected to increase by 8–9%.
The following table shows Austria´s national total emissions and projections based on fuel sold as well as on fuel used. Emissions have to be reported based on fuel sold under the UNECE LRTAP Convention as well as under the NEC Directive 2016/2284/EU. With respect to compli-ance under the NEC Directive Austria reports emissions and projections based on fuel used. When referring to emissions based on ‘fuel used’, ‘fuel exports in the vehicle tank’ are not con-sidered. According to the revised NEC Directive, ceilings were established for the five air pollu-tants: nitrogen oxides (NOx), sulphur dioxide (SO2), non-methane volatile organic compounds (NMVOC), ammonia (NH3) and particulate matter (PM2.5).
The scenario “with existing measures” leads to significant reductions in emissions by 2030 for all pollutants but NH3. The most substantial reduction with about 66% (fuel sold) or 56% (fuel used) from 2005 until 2030 is projected for the pollutant NOx, provided that the latest and new emission standards for road vehicles meet their specifications.
Emission reductions for the other pollutants are in the range from 22% to 48%; NH3 emissions, however, is projected to increase by 8–9% (see Table 281).
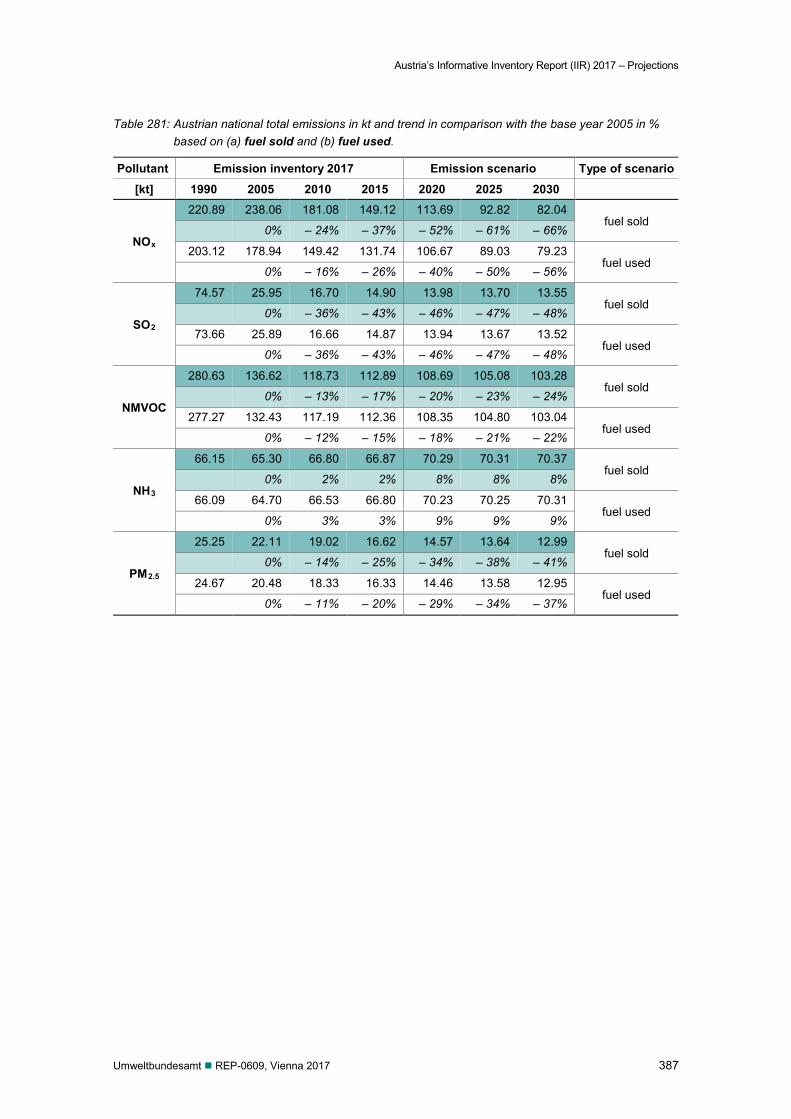
Austria’s Informative Inventory Report (IIR) 2017 – Projections
Umweltbundesamt REP-0609, Vienna 2017 387
Table 281: Austrian national total emissions in kt and trend in comparison with the base year 2005 in % based on (a) fuel sold and (b) fuel used.
Pollutant Emission inventory 2017 Emission scenario Type of scenario
[kt] 1990 2005 2010 2015 2020 2025 2030
NOx
220.89 238.06 181.08 149.12 113.69 92.82 82.04 fuel sold
0% – 24% – 37% – 52% – 61% – 66%
203.12 178.94 149.42 131.74 106.67 89.03 79.23 fuel used
0% – 16% – 26% – 40% – 50% – 56%
SO2
74.57 25.95 16.70 14.90 13.98 13.70 13.55 fuel sold
0% – 36% – 43% – 46% – 47% – 48%
73.66 25.89 16.66 14.87 13.94 13.67 13.52 fuel used
0% – 36% – 43% – 46% – 47% – 48%
NMVOC
280.63 136.62 118.73 112.89 108.69 105.08 103.28 fuel sold
0% – 13% – 17% – 20% – 23% – 24%
277.27 132.43 117.19 112.36 108.35 104.80 103.04 fuel used
0% – 12% – 15% – 18% – 21% – 22%
NH3
66.15 65.30 66.80 66.87 70.29 70.31 70.37 fuel sold
0% 2% 2% 8% 8% 8%
66.09 64.70 66.53 66.80 70.23 70.25 70.31 fuel used
0% 3% 3% 9% 9% 9%
PM2.5
25.25 22.11 19.02 16.62 14.57 13.64 12.99 fuel sold
0% – 14% – 25% – 34% – 38% – 41%
24.67 20.48 18.33 16.33 14.46 13.58 12.95 fuel used
0% – 11% – 20% – 29% – 34% – 37%
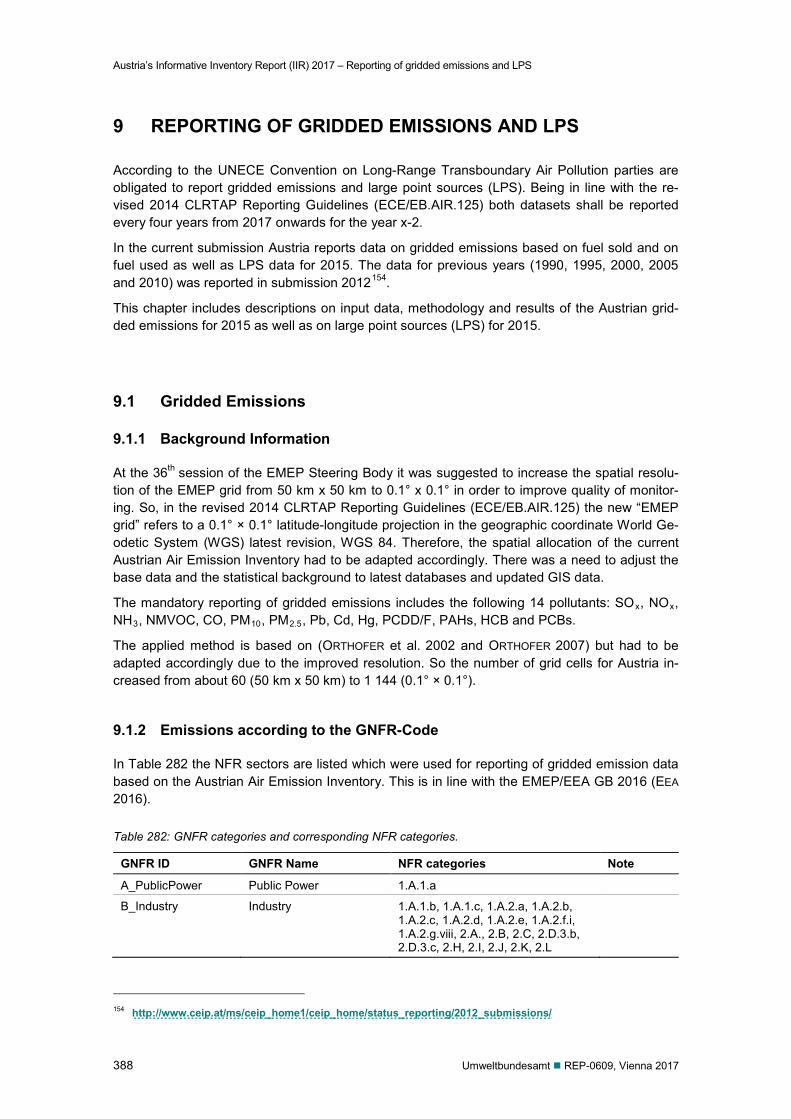
Austria’s Informative Inventory Report (IIR) 2017 – Reporting of gridded emissions and LPS
388 Umweltbundesamt REP-0609, Vienna 2017
9 REPORTING OF GRIDDED EMISSIONS AND LPS
According to the UNECE Convention on Long-Range Transboundary Air Pollution parties are obligated to report gridded emissions and large point sources (LPS). Being in line with the re-vised 2014 CLRTAP Reporting Guidelines (ECE/EB.AIR.125) both datasets shall be reported every four years from 2017 onwards for the year x-2.
In the current submission Austria reports data on gridded emissions based on fuel sold and on fuel used as well as LPS data for 2015. The data for previous years (1990, 1995, 2000, 2005 and 2010) was reported in submission 2012154.
This chapter includes descriptions on input data, methodology and results of the Austrian grid-ded emissions for 2015 as well as on large point sources (LPS) for 2015.
9.1 Gridded Emissions
9.1.1 Background Information
At the 36th session of the EMEP Steering Body it was suggested to increase the spatial resolu-tion of the EMEP grid from 50 km x 50 km to 0.1° x 0.1° in order to improve quality of monitor-ing. So, in the revised 2014 CLRTAP Reporting Guidelines (ECE/EB.AIR.125) the new “EMEP grid” refers to a 0.1° × 0.1° latitude-longitude projection in the geographic coordinate World Ge-odetic System (WGS) latest revision, WGS 84. Therefore, the spatial allocation of the current Austrian Air Emission Inventory had to be adapted accordingly. There was a need to adjust the base data and the statistical background to latest databases and updated GIS data.
The mandatory reporting of gridded emissions includes the following 14 pollutants: SOx, NOx, NH3, NMVOC, CO, PM10, PM2.5, Pb, Cd, Hg, PCDD/F, PAHs, HCB and PCBs.
The applied method is based on (ORTHOFER et al. 2002 and ORTHOFER 2007) but had to be adapted accordingly due to the improved resolution. So the number of grid cells for Austria in-creased from about 60 (50 km x 50 km) to 1 144 (0.1° × 0.1°).
9.1.2 Emissions according to the GNFR-Code
In Table 282 the NFR sectors are listed which were used for reporting of gridded emission data based on the Austrian Air Emission Inventory. This is in line with the EMEP/EEA GB 2016 (EEA 2016).
Table 282: GNFR categories and corresponding NFR categories.
GNFR ID GNFR Name NFR categories Note
A_PublicPower Public Power 1.A.1.a
B_Industry Industry 1.A.1.b, 1.A.1.c, 1.A.2.a, 1.A.2.b, 1.A.2.c, 1.A.2.d, 1.A.2.e, 1.A.2.f.i, 1.A.2.g.viii, 2.A., 2.B, 2.C, 2.D.3.b, 2.D.3.c, 2.H, 2.I, 2.J, 2.K, 2.L
154 http://www.ceip.at/ms/ceip_home1/ceip_home/status_reporting/2012_submissions/
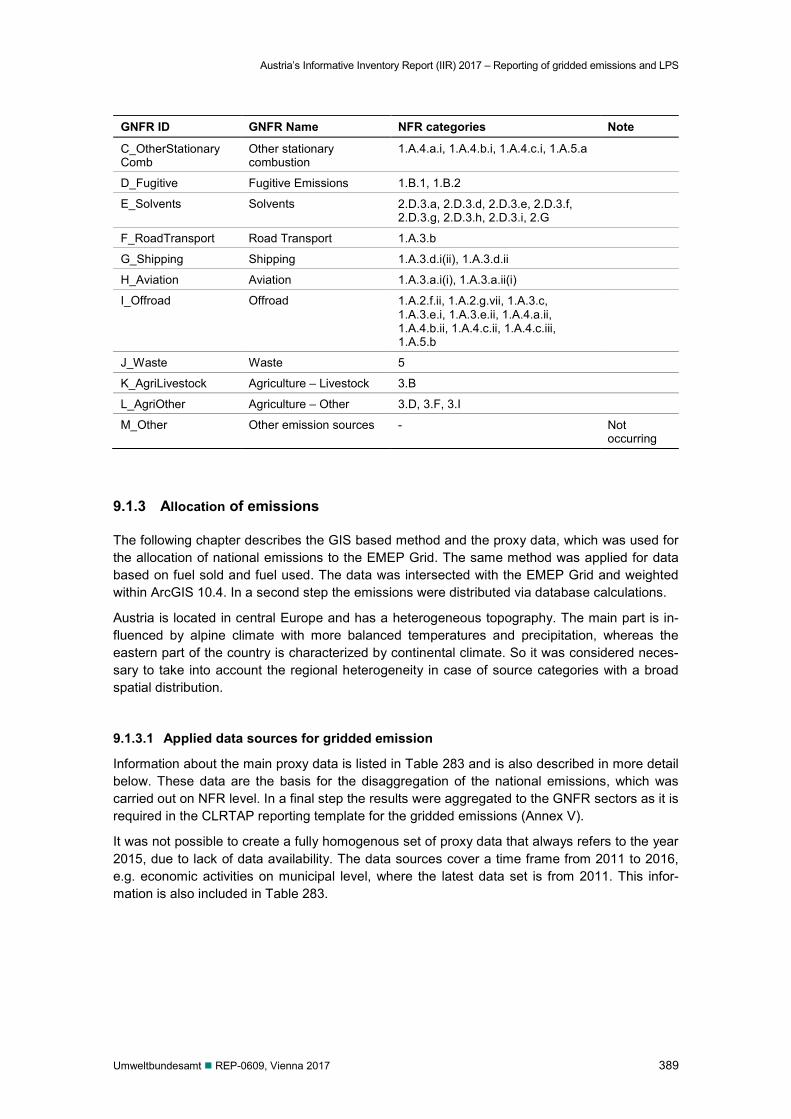
Austria’s Informative Inventory Report (IIR) 2017 – Reporting of gridded emissions and LPS
Umweltbundesamt REP-0609, Vienna 2017 389
GNFR ID GNFR Name NFR categories Note
C_OtherStationary Comb
Other stationary combustion
1.A.4.a.i, 1.A.4.b.i, 1.A.4.c.i, 1.A.5.a
D_Fugitive Fugitive Emissions 1.B.1, 1.B.2
E_Solvents Solvents 2.D.3.a, 2.D.3.d, 2.D.3.e, 2.D.3.f, 2.D.3.g, 2.D.3.h, 2.D.3.i, 2.G
F_RoadTransport Road Transport 1.A.3.b
G_Shipping Shipping 1.A.3.d.i(ii), 1.A.3.d.ii
H_Aviation Aviation 1.A.3.a.i(i), 1.A.3.a.ii(i)
I_Offroad Offroad 1.A.2.f.ii, 1.A.2.g.vii, 1.A.3.c, 1.A.3.e.i, 1.A.3.e.ii, 1.A.4.a.ii, 1.A.4.b.ii, 1.A.4.c.ii, 1.A.4.c.iii, 1.A.5.b
J_Waste Waste 5
K_AgriLivestock Agriculture – Livestock 3.B
L_AgriOther Agriculture – Other 3.D, 3.F, 3.I
M_Other Other emission sources - Not occurring
9.1.3 Allocation of emissions
The following chapter describes the GIS based method and the proxy data, which was used for the allocation of national emissions to the EMEP Grid. The same method was applied for data based on fuel sold and fuel used. The data was intersected with the EMEP Grid and weighted within ArcGIS 10.4. In a second step the emissions were distributed via database calculations.
Austria is located in central Europe and has a heterogeneous topography. The main part is in-fluenced by alpine climate with more balanced temperatures and precipitation, whereas the eastern part of the country is characterized by continental climate. So it was considered neces-sary to take into account the regional heterogeneity in case of source categories with a broad spatial distribution.
9.1.3.1 Applied data sources for gridded emission
Information about the main proxy data is listed in Table 283 and is also described in more detail below. These data are the basis for the disaggregation of the national emissions, which was carried out on NFR level. In a final step the results were aggregated to the GNFR sectors as it is required in the CLRTAP reporting template for the gridded emissions (Annex V).
It was not possible to create a fully homogenous set of proxy data that always refers to the year 2015, due to lack of data availability. The data sources cover a time frame from 2011 to 2016, e.g. economic activities on municipal level, where the latest data set is from 2011. This infor-mation is also included in Table 283.
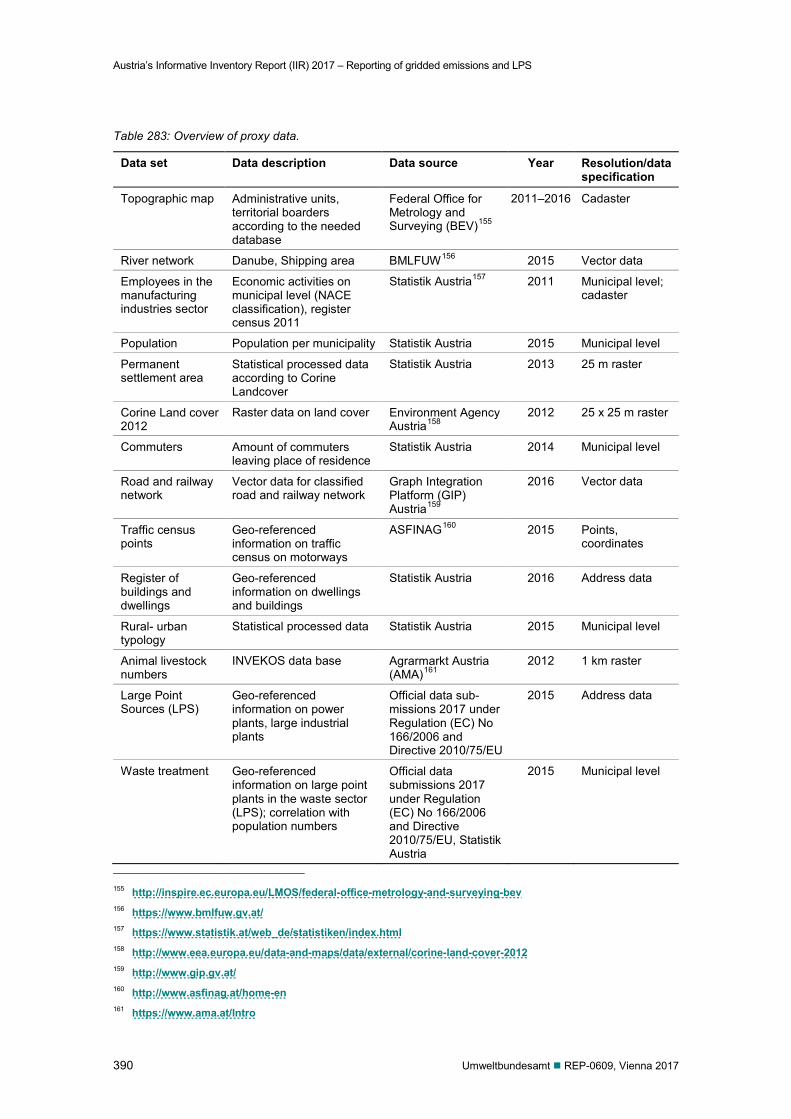
Austria’s Informative Inventory Report (IIR) 2017 – Reporting of gridded emissions and LPS
390 Umweltbundesamt REP-0609, Vienna 2017
Table 283: Overview of proxy data.
Data set Data description Data source Year Resolution/data specification
Topographic map Administrative units, territorial boarders according to the needed database
Federal Office for Metrology and Surveying (BEV)155
2011–2016 Cadaster
River network Danube, Shipping area BMLFUW156 2015 Vector data
Employees in the manufacturing industries sector
Economic activities on municipal level (NACE classification), register census 2011
Statistik Austria157 2011 Municipal level; cadaster
Population Population per municipality Statistik Austria 2015 Municipal level
Permanent settlement area
Statistical processed data according to Corine Landcover
Statistik Austria 2013 25 m raster
Corine Land cover 2012
Raster data on land cover Environment Agency Austria158
2012 25 x 25 m raster
Commuters Amount of commuters leaving place of residence
Statistik Austria 2014 Municipal level
Road and railway network
Vector data for classified road and railway network
Graph Integration Platform (GIP) Austria159
2016 Vector data
Traffic census points
Geo-referenced information on traffic census on motorways
ASFINAG160 2015 Points, coordinates
Register of buildings and dwellings
Geo-referenced information on dwellings and buildings
Statistik Austria 2016 Address data
Rural- urban typology
Statistical processed data Statistik Austria 2015 Municipal level
Animal livestock numbers
INVEKOS data base Agrarmarkt Austria (AMA)161
2012 1 km raster
Large Point Sources (LPS)
Geo-referenced information on power plants, large industrial plants
Official data sub-missions 2017 under Regulation (EC) No 166/2006 and Directive 2010/75/EU
2015 Address data
Waste treatment Geo-referenced information on large point plants in the waste sector (LPS); correlation with population numbers
Official data submissions 2017 under Regulation (EC) No 166/2006 and Directive 2010/75/EU, Statistik Austria
2015 Municipal level
155 http://inspire.ec.europa.eu/LMOS/federal-office-metrology-and-surveying-bev 156 https://www.bmlfuw.gv.at/ 157 https://www.statistik.at/web_de/statistiken/index.html 158 http://www.eea.europa.eu/data-and-maps/data/external/corine-land-cover-2012 159 http://www.gip.gv.at/ 160 http://www.asfinag.at/home-en 161 https://www.ama.at/Intro
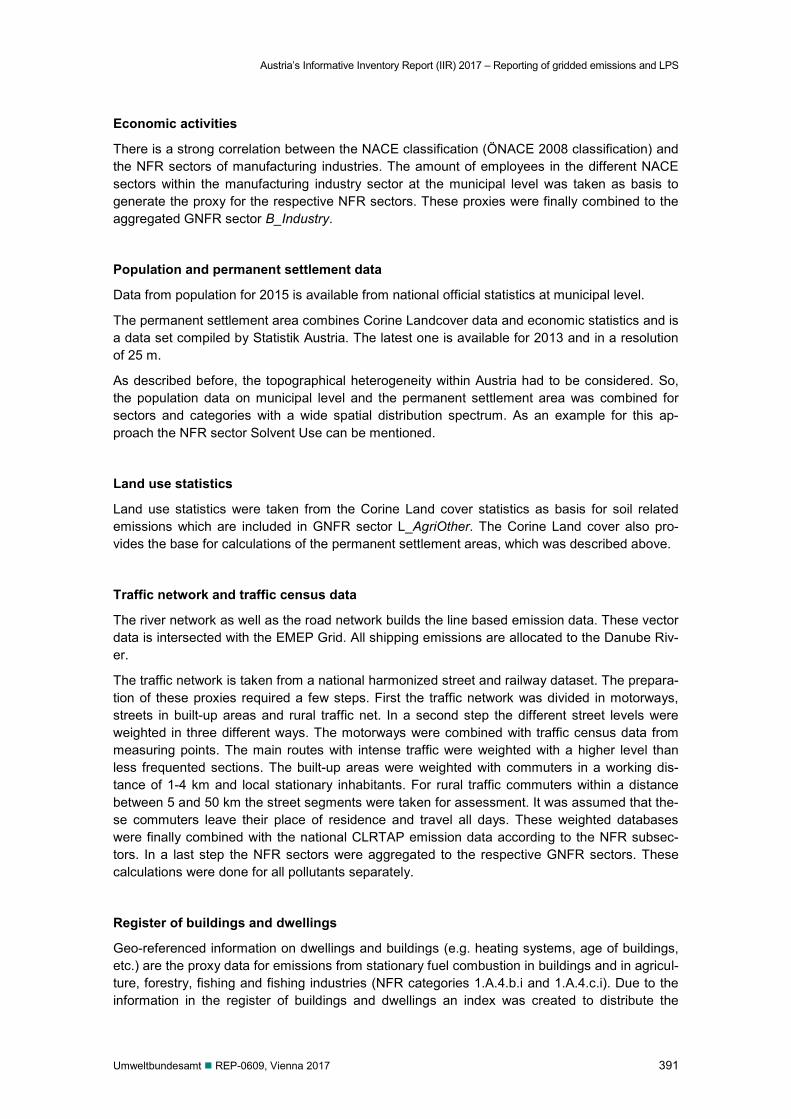
Austria’s Informative Inventory Report (IIR) 2017 – Reporting of gridded emissions and LPS
Umweltbundesamt REP-0609, Vienna 2017 391
Economic activities
There is a strong correlation between the NACE classification (ÖNACE 2008 classification) and the NFR sectors of manufacturing industries. The amount of employees in the different NACE sectors within the manufacturing industry sector at the municipal level was taken as basis to generate the proxy for the respective NFR sectors. These proxies were finally combined to the aggregated GNFR sector B_Industry.
Population and permanent settlement data
Data from population for 2015 is available from national official statistics at municipal level.
The permanent settlement area combines Corine Landcover data and economic statistics and is a data set compiled by Statistik Austria. The latest one is available for 2013 and in a resolution of 25 m.
As described before, the topographical heterogeneity within Austria had to be considered. So, the population data on municipal level and the permanent settlement area was combined for sectors and categories with a wide spatial distribution spectrum. As an example for this ap-proach the NFR sector Solvent Use can be mentioned.
Land use statistics
Land use statistics were taken from the Corine Land cover statistics as basis for soil related emissions which are included in GNFR sector L_AgriOther. The Corine Land cover also pro-vides the base for calculations of the permanent settlement areas, which was described above.
Traffic network and traffic census data
The river network as well as the road network builds the line based emission data. These vector data is intersected with the EMEP Grid. All shipping emissions are allocated to the Danube Riv-er.
The traffic network is taken from a national harmonized street and railway dataset. The prepara-tion of these proxies required a few steps. First the traffic network was divided in motorways, streets in built-up areas and rural traffic net. In a second step the different street levels were weighted in three different ways. The motorways were combined with traffic census data from measuring points. The main routes with intense traffic were weighted with a higher level than less frequented sections. The built-up areas were weighted with commuters in a working dis-tance of 1-4 km and local stationary inhabitants. For rural traffic commuters within a distance between 5 and 50 km the street segments were taken for assessment. It was assumed that the-se commuters leave their place of residence and travel all days. These weighted databases were finally combined with the national CLRTAP emission data according to the NFR subsec-tors. In a last step the NFR sectors were aggregated to the respective GNFR sectors. These calculations were done for all pollutants separately.
Register of buildings and dwellings
Geo-referenced information on dwellings and buildings (e.g. heating systems, age of buildings, etc.) are the proxy data for emissions from stationary fuel combustion in buildings and in agricul-ture, forestry, fishing and fishing industries (NFR categories 1.A.4.b.i and 1.A.4.c.i). Due to the information in the register of buildings and dwellings an index was created to distribute the
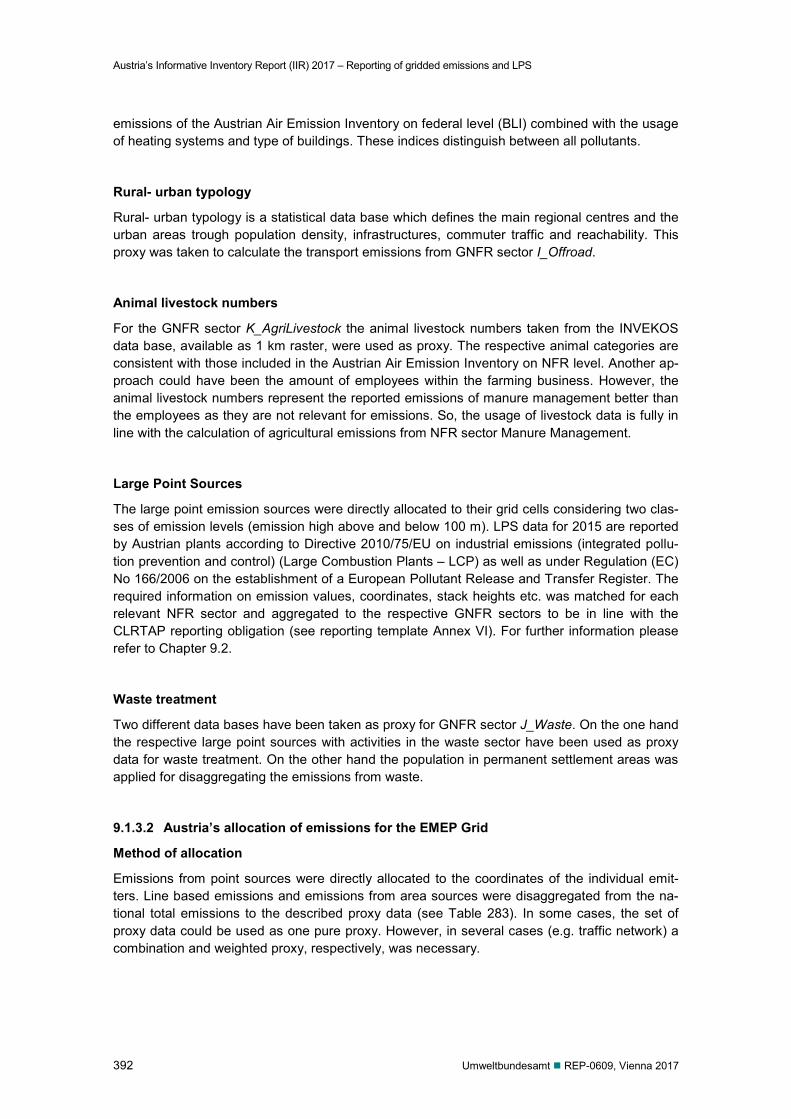
Austria’s Informative Inventory Report (IIR) 2017 – Reporting of gridded emissions and LPS
392 Umweltbundesamt REP-0609, Vienna 2017
emissions of the Austrian Air Emission Inventory on federal level (BLI) combined with the usage of heating systems and type of buildings. These indices distinguish between all pollutants.
Rural- urban typology
Rural- urban typology is a statistical data base which defines the main regional centres and the urban areas trough population density, infrastructures, commuter traffic and reachability. This proxy was taken to calculate the transport emissions from GNFR sector I_Offroad.
Animal livestock numbers
For the GNFR sector K_AgriLivestock the animal livestock numbers taken from the INVEKOS data base, available as 1 km raster, were used as proxy. The respective animal categories are consistent with those included in the Austrian Air Emission Inventory on NFR level. Another ap-proach could have been the amount of employees within the farming business. However, the animal livestock numbers represent the reported emissions of manure management better than the employees as they are not relevant for emissions. So, the usage of livestock data is fully in line with the calculation of agricultural emissions from NFR sector Manure Management.
Large Point Sources
The large point emission sources were directly allocated to their grid cells considering two clas-ses of emission levels (emission high above and below 100 m). LPS data for 2015 are reported by Austrian plants according to Directive 2010/75/EU on industrial emissions (integrated pollu-tion prevention and control) (Large Combustion Plants – LCP) as well as under Regulation (EC) No 166/2006 on the establishment of a European Pollutant Release and Transfer Register. The required information on emission values, coordinates, stack heights etc. was matched for each relevant NFR sector and aggregated to the respective GNFR sectors to be in line with the CLRTAP reporting obligation (see reporting template Annex VI). For further information please refer to Chapter 9.2.
Waste treatment
Two different data bases have been taken as proxy for GNFR sector J_Waste. On the one hand the respective large point sources with activities in the waste sector have been used as proxy data for waste treatment. On the other hand the population in permanent settlement areas was applied for disaggregating the emissions from waste.
9.1.3.2 Austria’s allocation of emissions for the EMEP Grid
Method of allocation
Emissions from point sources were directly allocated to the coordinates of the individual emit-ters. Line based emissions and emissions from area sources were disaggregated from the na-tional total emissions to the described proxy data (see Table 283). In some cases, the set of proxy data could be used as one pure proxy. However, in several cases (e.g. traffic network) a combination and weighted proxy, respectively, was necessary.
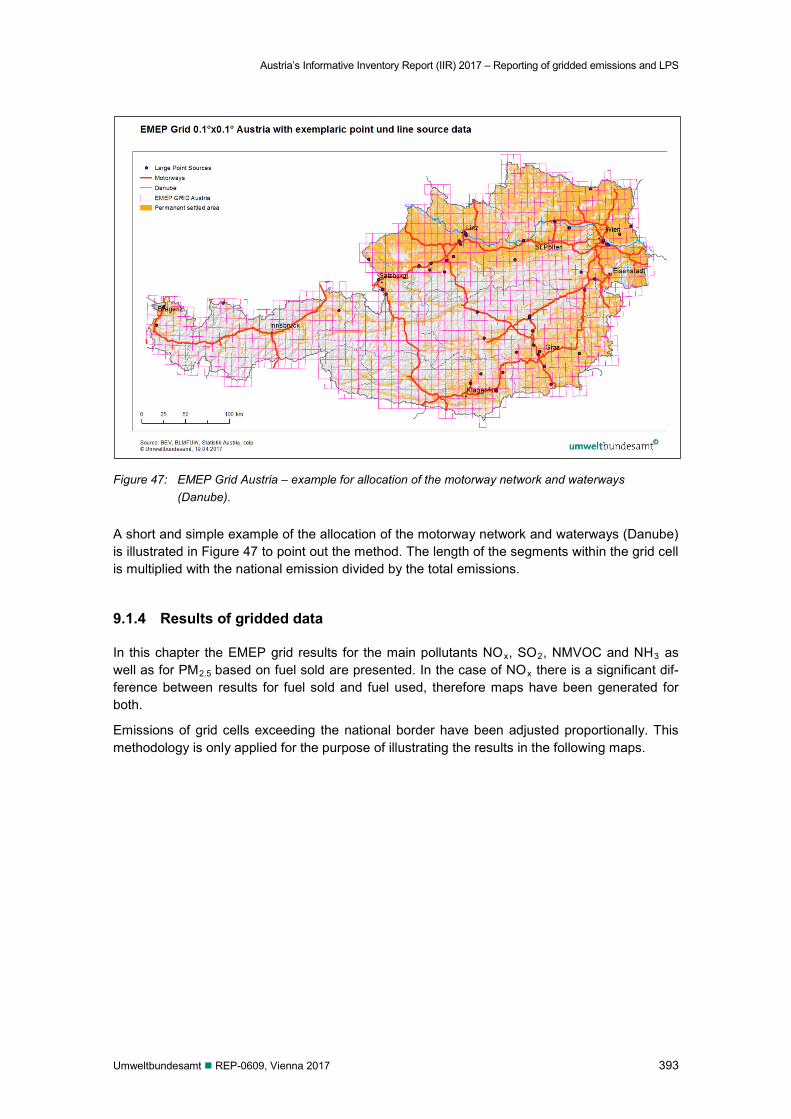
Austria’s Informative Inventory Report (IIR) 2017 – Reporting of gridded emissions and LPS
Umweltbundesamt REP-0609, Vienna 2017 393
Figure 47: EMEP Grid Austria – example for allocation of the motorway network and waterways (Danube).
A short and simple example of the allocation of the motorway network and waterways (Danube) is illustrated in Figure 47 to point out the method. The length of the segments within the grid cell is multiplied with the national emission divided by the total emissions.
9.1.4 Results of gridded data
In this chapter the EMEP grid results for the main pollutants NOx, SO2, NMVOC and NH3 as well as for PM2.5 based on fuel sold are presented. In the case of NOx there is a significant dif-ference between results for fuel sold and fuel used, therefore maps have been generated for both.
Emissions of grid cells exceeding the national border have been adjusted proportionally. This methodology is only applied for the purpose of illustrating the results in the following maps.
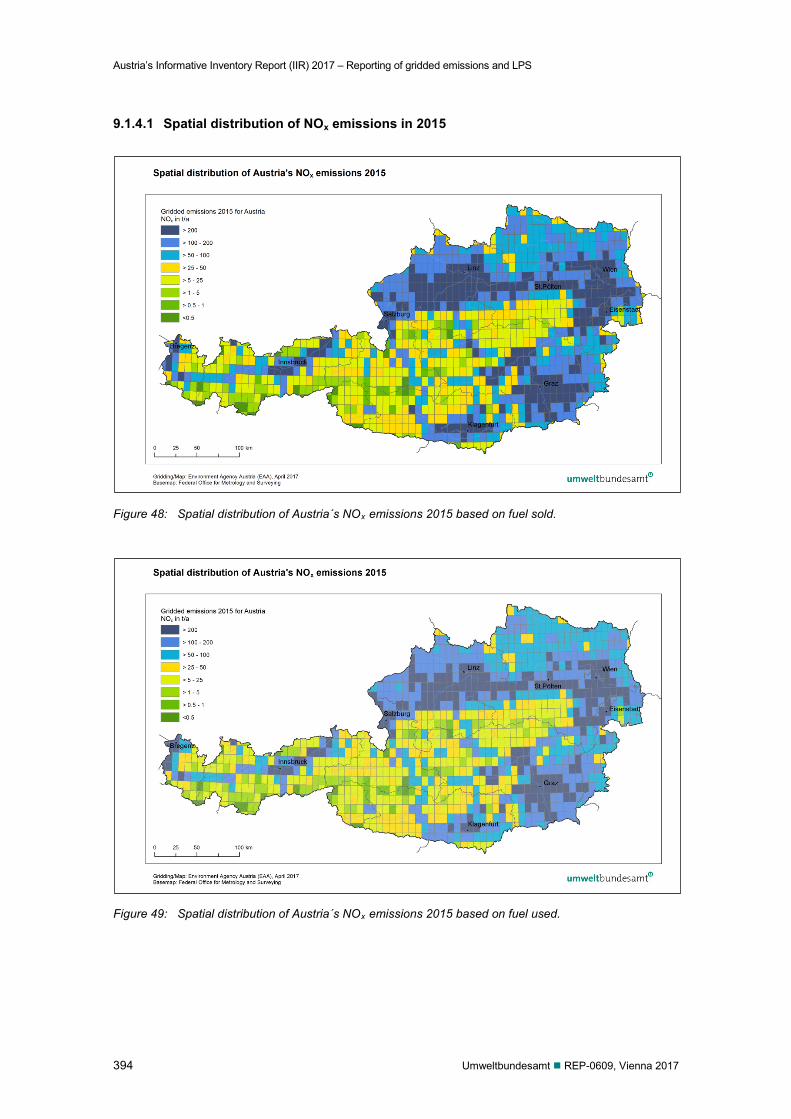
Austria’s Informative Inventory Report (IIR) 2017 – Reporting of gridded emissions and LPS
394 Umweltbundesamt REP-0609, Vienna 2017
9.1.4.1 Spatial distribution of NOx emissions in 2015
Figure 48: Spatial distribution of Austria´s NOx emissions 2015 based on fuel sold.
Figure 49: Spatial distribution of Austria´s NOx emissions 2015 based on fuel used.
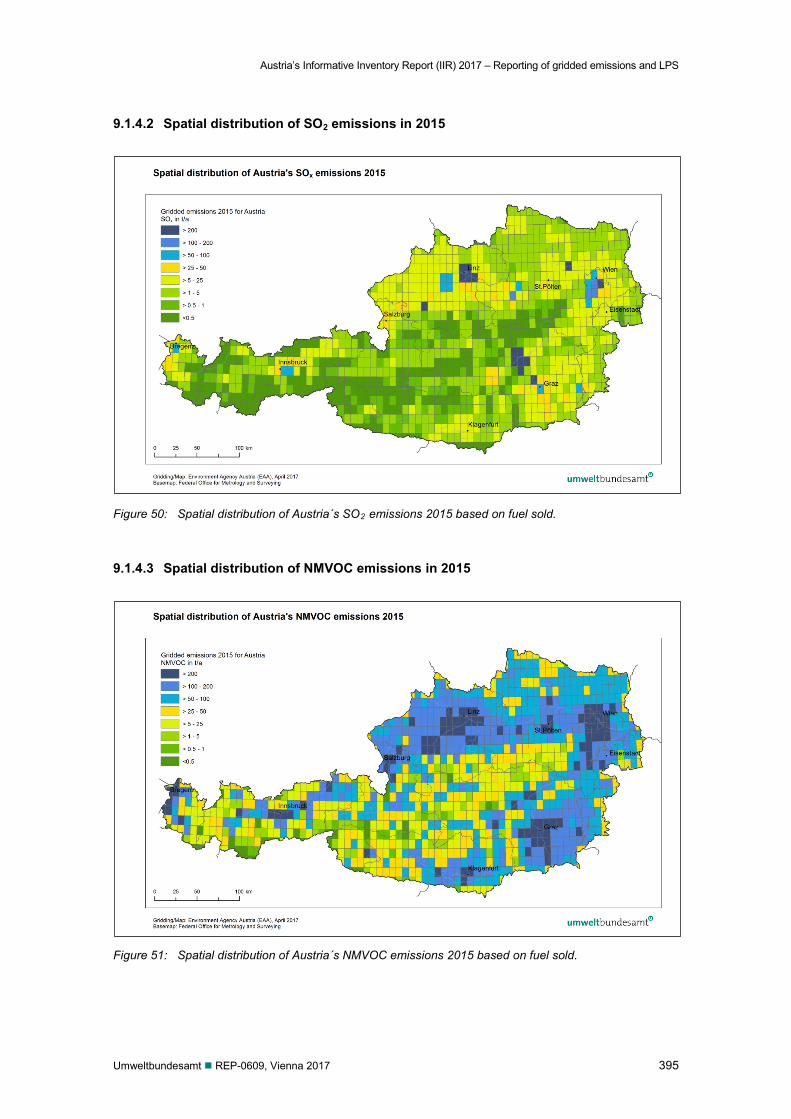
Austria’s Informative Inventory Report (IIR) 2017 – Reporting of gridded emissions and LPS
Umweltbundesamt REP-0609, Vienna 2017 395
9.1.4.2 Spatial distribution of SO2 emissions in 2015
Figure 50: Spatial distribution of Austria´s SO2 emissions 2015 based on fuel sold.
9.1.4.3 Spatial distribution of NMVOC emissions in 2015
Figure 51: Spatial distribution of Austria´s NMVOC emissions 2015 based on fuel sold.
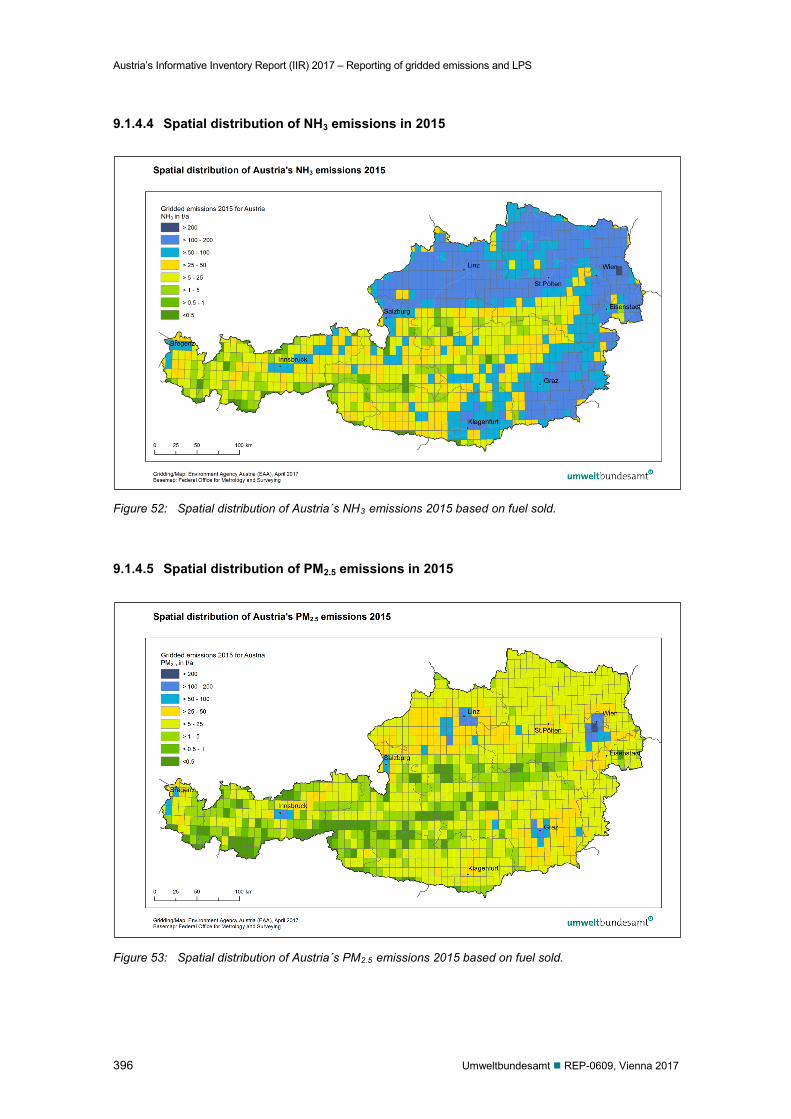
Austria’s Informative Inventory Report (IIR) 2017 – Reporting of gridded emissions and LPS
396 Umweltbundesamt REP-0609, Vienna 2017
9.1.4.4 Spatial distribution of NH3 emissions in 2015
Figure 52: Spatial distribution of Austria´s NH3 emissions 2015 based on fuel sold.
9.1.4.5 Spatial distribution of PM2.5 emissions in 2015
Figure 53: Spatial distribution of Austria´s PM2.5 emissions 2015 based on fuel sold.
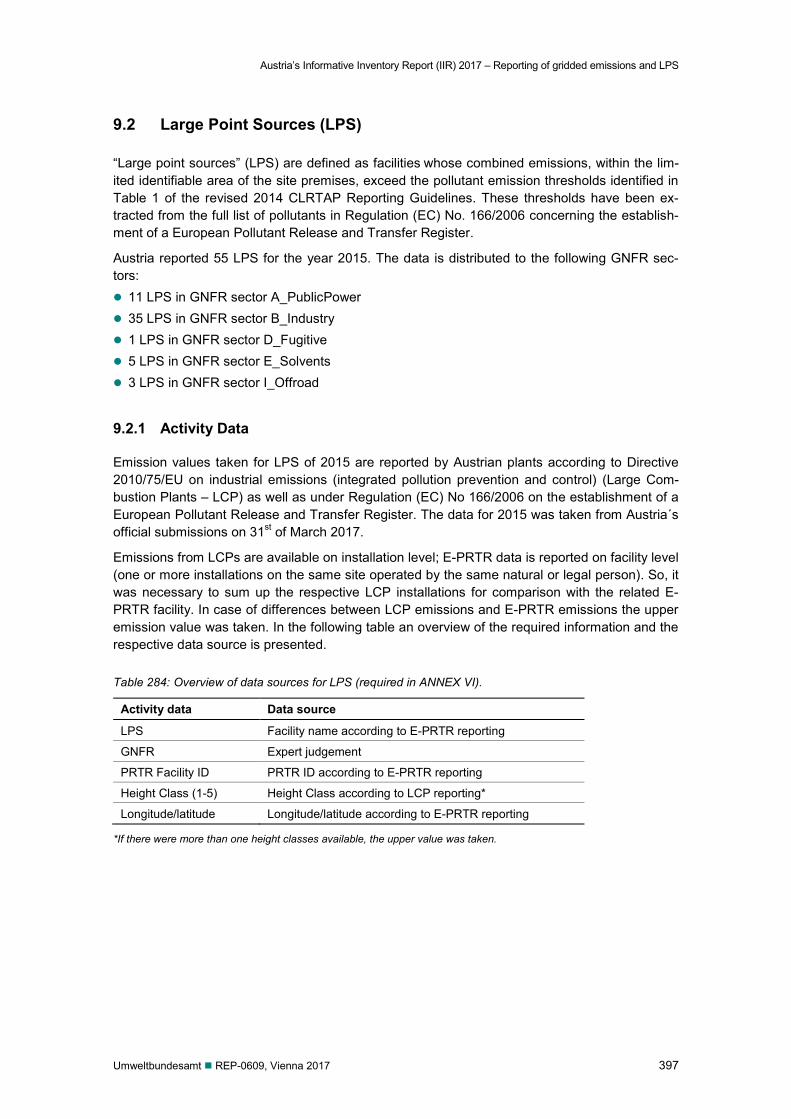
Austria’s Informative Inventory Report (IIR) 2017 – Reporting of gridded emissions and LPS
Umweltbundesamt REP-0609, Vienna 2017 397
9.2 Large Point Sources (LPS)
“Large point sources” (LPS) are defined as facilities whose combined emissions, within the lim-ited identifiable area of the site premises, exceed the pollutant emission thresholds identified in Table 1 of the revised 2014 CLRTAP Reporting Guidelines. These thresholds have been ex-tracted from the full list of pollutants in Regulation (EC) No. 166/2006 concerning the establish-ment of a European Pollutant Release and Transfer Register.
Austria reported 55 LPS for the year 2015. The data is distributed to the following GNFR sec-tors: 11 LPS in GNFR sector A_PublicPower 35 LPS in GNFR sector B_Industry 1 LPS in GNFR sector D_Fugitive 5 LPS in GNFR sector E_Solvents 3 LPS in GNFR sector I_Offroad
9.2.1 Activity Data
Emission values taken for LPS of 2015 are reported by Austrian plants according to Directive 2010/75/EU on industrial emissions (integrated pollution prevention and control) (Large Com-bustion Plants – LCP) as well as under Regulation (EC) No 166/2006 on the establishment of a European Pollutant Release and Transfer Register. The data for 2015 was taken from Austria´s official submissions on 31st of March 2017.
Emissions from LCPs are available on installation level; E-PRTR data is reported on facility level (one or more installations on the same site operated by the same natural or legal person). So, it was necessary to sum up the respective LCP installations for comparison with the related E-PRTR facility. In case of differences between LCP emissions and E-PRTR emissions the upper emission value was taken. In the following table an overview of the required information and the respective data source is presented.
Table 284: Overview of data sources for LPS (required in ANNEX VI).
Activity data Data source
LPS Facility name according to E-PRTR reporting
GNFR Expert judgement
PRTR Facility ID PRTR ID according to E-PRTR reporting
Height Class (1-5) Height Class according to LCP reporting*
Longitude/latitude Longitude/latitude according to E-PRTR reporting
*If there were more than one height classes available, the upper value was taken.
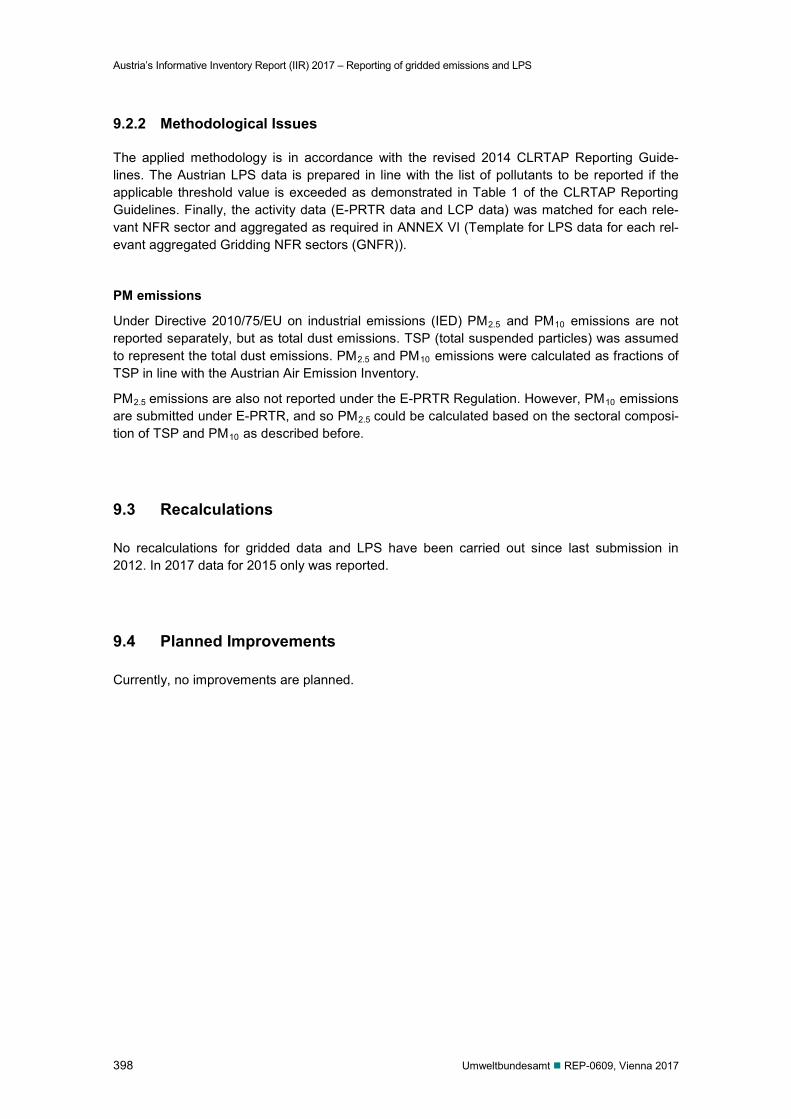
Austria’s Informative Inventory Report (IIR) 2017 – Reporting of gridded emissions and LPS
398 Umweltbundesamt REP-0609, Vienna 2017
9.2.2 Methodological Issues
The applied methodology is in accordance with the revised 2014 CLRTAP Reporting Guide-lines. The Austrian LPS data is prepared in line with the list of pollutants to be reported if the applicable threshold value is exceeded as demonstrated in Table 1 of the CLRTAP Reporting Guidelines. Finally, the activity data (E-PRTR data and LCP data) was matched for each rele-vant NFR sector and aggregated as required in ANNEX VI (Template for LPS data for each rel-evant aggregated Gridding NFR sectors (GNFR)).
PM emissions
Under Directive 2010/75/EU on industrial emissions (IED) PM2.5 and PM10 emissions are not reported separately, but as total dust emissions. TSP (total suspended particles) was assumed to represent the total dust emissions. PM2.5 and PM10 emissions were calculated as fractions of TSP in line with the Austrian Air Emission Inventory.
PM2.5 emissions are also not reported under the E-PRTR Regulation. However, PM10 emissions are submitted under E-PRTR, and so PM2.5 could be calculated based on the sectoral composi-tion of TSP and PM10 as described before.
9.3 Recalculations
No recalculations for gridded data and LPS have been carried out since last submission in 2012. In 2017 data for 2015 only was reported.
9.4 Planned Improvements
Currently, no improvements are planned.
Austria’s Informative Inventory Report (IIR) 2017 – References
Umweltbundesamt REP-0609, Vienna 2017 399
10 REFERENCES
AGRICULTURAL RESEARCH AND EDUCATION CENTRE GUMPENSTEIN (2002): Dipl.-Ing. Alfred Pöllinger: Estimation of manure management system distribution of sows, HBLFA Gumpenstein 2002.
AMA (2016): Auswertung zum Mineraldüngerverbrauch in Österreich für 2015. Agrarmarkt Austria. Dezember 2016.
AMANN, A. & DÄMON, M. (2011): Emissionsinventur für Festgesteinstagebaue in Österreich. Vertraulicher Endbericht. Fachverband Steine-Keramik, Bergbau-Stahl, Maria Enzersdorf/Bad Aussee.
AMLINGER (2003): information from Dipl. Ing. Florian Amlinger – Compost Consulting & Development. Hochbergstrasse A-2380, Perchtoldsdorf.
AMLINGER, F.; PEYR, S.; HILDEBRANDT, U.; MÜSKEN, J.; CUHLS, C. & CLEMENS, J. (2005): Stand der Technik der Kompostierung. Grundlagenstudie. Bundesministerium für Land- und Forstwirtschaft, Umwelt und Wasserwirtschaft, Wien. http://www.umweltnet.at/article/articleview/30919/1/6954.
AMON, B.; FRÖHLICH, M.; WEIßENSTEINER, R.; ZABLATNIK, B. & AMON, T. (2007): Tierhaltung und Wirtschaftsdüngermanagement in Österreich. Endbericht Projekt Nr. 1441.Auftraggeber: Bundesministerium für Land- und Forstwirtschaft, Umwelt- und Wasserwirtschaft, Wien.
AMON, B. & HÖRTENHUBER, S. (2008): Revision der österreichischen Luftschadstoff-Inventur (OLI) für NH3, NMVOC und NOx; Sektor Landwirtschaft. Universität für Bodenkultur, Institut für Landtechnik im Auftrag vom Umweltbundesamt. Wien.
AMON, B. & HÖRTENHUBER, S. (2010): Revision of Austria’s National Greenhouse Gas Inventory, Sector Agriculture. Final Report. Division of Agricultural Engineering (DAE) of the Department for Sustainable Agricultural Systems of the University of Natural Resources and Applied Life Sciences (BOKU), study on behalf of Umweltbundesamt GmbH. Wien (unpublished).
AMON, B. & HÖRTENHUBER, S. (2014): Implementierung der 2006 IPCC Guidelines und Aktualisierung von Daten zur landwirtschaftlichen Praxis in der Österreichischen Luftschadstoffinventur (OLI), Sektor Landwirtschaft. Endbericht. Universität für Bodenkultur, Institut für Landtechnik im Auftrag vom Umweltbundesamt. Wien 2014 (unveröffentlicht).
ANGERER, T. (1997): Stand der Mechanisch-Biologischen Restabfallbehandlung vor der Deponierung (MBRVD) in Österreich – November 1997 – MUL, Leoben.
ANGERER, T. & FRÖHLICH, M. (2002): Thermisch Regenerative Oxidation als Verfahren der Abluftreinigung bei mechanisch-biologischen Anlagen zur Behandlung von Abfällen. Schriftenreihe des BMLFUW.162
ASFINAG (2016): Analysis of mileage on Austrian highways for the years 2011–2015 – nonstandard. analysis (not published). ASFINAG data edited by Austrian Federal Ministry of Transport (bmvit), Wien, 2016.
AUSTRIAN CHAMBER OF AGRICULTURE (2014): Statistical data of burning straw. Mag. Längauer (email), November 2014.
AUSTRO CONTROL (2007, 2008, 2009, 2010, 2011, 2012, 2013, 2014, 2015, 2016): Flight movements Austria – nonstandard analysis (not published). Austro Control.
AUSTROPAPIER (2002–2015): Jahresbericht Papierindustrie 2002 bis 2015. Fachverband der Österreichischen Papierindustrie. Internetdownloads. www.austropapier.at.
BAAS, J. et al. (1995): Technical Paper to the OSPARCOM-HELCOM-UN/ECE Emission Inventory of Heavy Metals and Persistent Organic Pollutants. TNO-Report TNO-MEP-R 95/247, Delft/Berlin 1995.
162 Study has not been published but can be made available upon request.
Austria’s Informative Inventory Report (IIR) 2017 – References
400 Umweltbundesamt REP-0609, Vienna 2017
BARNERT (1998): Möglichkeiten und Grenzen umweltverträglicher Beschichtung (Lacke, Klebstoffe, Bautenschutzmittel, Holzschutzmittel). Österreichisches Lackinstitut, Wien.
BAUMELER; BRUNNER; FEHRINGER; KISLIAKOVA & SCHACHMAYER (1998): Reduktion von Treibhausgasen durch Optimierung der Abfallwirtschaft (CH4). Schriftenreihe der Energieforschungsgemeinschaft im Verband der E-Werke Österreichs, Wien 1998.
BAYERISCHES LANDESAMT FÜR UMWELT (2008): Polychlorierte Biphenyle (PCB). http://www.lfu.bayern.de/umweltwissen/doc/uw_53_polychlorierte_biphenyle_pcb.pdf
BICHLER (2001): CORINAIR Emissionsinventur 1985–1999. FTU Forschungsgesellschaft Technischer Umweltschutz GmbH. Interner Bericht, Bd. IB-650. Umweltbundesamt, Wien.
BMLFUW – Bundesministerium für Land- und Forstwirtschaft, Umwelt und Wasserwirtschaft (2001): Bundesabfallwirtschaftsplan. Bundesabfallbericht 2001 , Wien.
BMLFUW – Bundesministerium für Land- und Forstwirtschaft, Umwelt und Wasserwirtschaft (2002a): Gewässerschutzbericht 2002.Gemäß § 33e Wasserrechtsgesetz BGBl. Nr. 215/1959 in der Fassung BGBl. I Nr. 156/2002, Wien.
BMLFUW – Bundesministerium für Land- und Forstwirtschaft, Umwelt und Wasserwirtschaft (2002b): Stubenvoll, J., Böhmer, S. & Szednyi, I.: Stand der der Technik in Abfallverbrennungsanlagen. Schriftenreihe des BMLFUW, Band 24/2002, Wien.
BMLFUW – Bundesministerium für Land- und Forstwirtschaft, Umwelt und Wasserwirtschaft (1993–2002): Gewässerschutzbericht gemäß § 33e Wasserrechtsgesetz BGBl. Nr. 215/1959 i.d.F. BGBl. I Nr. 156/2002. Bundesministerium für Land- und Forstwirtschaft, Umwelt und Wasserwirtschaft, Wien.
BMLFUW – Bundesministerium für Land- und Forstwirtschaft, Umwelt und Wasserwirtschaft (2006a): Bundesabfallwirtschaftsplan (BAWP) (2006), Wien. www.bundesabfallwirtschaftsplan.at.
BMLFUW – Bundesministerium für Land- und Forstwirtschaft, Umwelt und Wasserwirtschaft (2006b): Richtlinien für die sachgerechte Düngung. 6. Auflage Fachbeirat für Bodenfruchtbarkeit und Bodenschutz. Wien.
BMLFUW – Bundesministerium für Land- und Forstwirtschaft, Umwelt und Wasserwirtschaft (2006c): Kommunale Abwasserrichtlinie der EU – 91/271 EWG, Österreichischer Bericht 2006. Wien.
BMLFUW – Bundesministerium für Land- und Forstwirtschaft, Umwelt und Wasserwirtschaft (2007): Sonderrichtlinie des Bundesministers für Land- und Forstwirtschaft, Umwelt und Wasserwirtschaft (BMLFUW) für das Österreichische Programm zur Förderung einer umweltgerechten, extensiven und den natürlichen Lebensraum schützenden Landwirtschaft. Anlage I, Anhänge zum Agrarumweltprogramm und zur Tierschutzmaßnahme (ÖPUL 2007).
BMLFLUW – Bundesministerium für Land- und Forstwirtschaft, Umwelt und Wasserwirtschaft (2008a): Die Bestandsaufnahme der Abfallwirtschaft in Österreich. Statusbericht 2008. Wien.
BMLFUW – Bundesministerium für Land- und Forstwirtschaft, Umwelt und Wasserwirtschaft (2008b): Kommunale Abwasserrichtlinie der EU – 91/271/EWG. Österreichischer Bericht 2008. Wien.
BMLFUW – Bundesministerium für Land- und Forstwirtschaft, Umwelt und Wasserwirtschaft (2010): Kommunale Abwasserrichtlinie der EU – 91/271/EWG. Österreichischer Bericht 2010. Wien
BMLFUW – Bundesministerium für Land- und Forstwirtschaft, Umwelt und Wasserwirtschaft (2011): Bundes-Abfallwirtschaftsplan 2011. Wien. http://www.bundesabfallwirtschaftsplan.at/
BMLFUW – Bundesministerium für Land- und Forstwirtschaft, Umwelt und Wasserwirtschaft (2012): Kommunale Abwasserrichtlinie der EU – 91/271/EWG. Österreichischer Bericht 2012. Wien.
BMLFUW – Bundesministerium für Land- und Forstwirtschaft, Umwelt und Wasserwirtschaft (2013): Die Bestandsaufnahme der Abfallwirtschaft in Österreich. Statusbericht 2012. Wien
Austria’s Informative Inventory Report (IIR) 2017 – References
Umweltbundesamt REP-0609, Vienna 2017 401
BMLFUW – Bundesministerium für Land- und Forstwirtschaft, Umwelt und Wasserwirtschaft (2014a): Winter, R.; Biokraftstoffe im Verkehrssektor 2014. Daten zu Biokraftstoffen in Österreich für das Berichtsjahr 2013, BMFLUW, Wien 2014. http://www.bmlfuw.gv.at/umwelt/luft-laerm-verkehr/biokraftstoffbericht.html
BMLFUW – Bundesministerium für Land- und Forstwirtschaft, Umwelt und Wasserwirtschaft (2014b): CO2-Monitoring Pkw 2014. Zusammenfassung der Daten der Neuzulassungen von Pkw der Republik Österreich gemäß Entscheidung Nr. 1753/2000/EG für das Berichtsjahr 2013. Wien, 2014. http://www.lebensministerium.at/publikationen/umwelt/laerm_verkehr_mobilitaet/co2monitoring.html
BMLFUW – Bundesministerium für Land- und Forstwirtschaft, Umwelt und Wasserwirtschaft (2014c): Stork, C.; Windhofer, G. & Zieritz, I.: Kommunales Abwasser: Österreichischer Bericht 2014. Kombinierter Bericht gemäß Artikel 15 und Artikel 16 der Richtlinie 91/271/EWG für den Zeitraum 2011 – 2012. Wien, Juni 2014. http://www.bmlfuw.gv.at/wasser/wasserqualitaet/abwasserreinigung/Lagebericht2014.html.
BMLFUW – Bundesministerium für Land- und Forstwirtschaft, Umwelt und Wasserwirtschaft (2014d): Die Bestandsaufnahme der Abfallwirtschaft in Österreich. Statusbericht 2013. Wien
BMLFUW – Bundesministerium für Land- und Forstwirtschaft, Umwelt und Wasserwirtschaft (2015a): Die Bestandsaufnahme der Abfallwirtschaft in Österreich. Statusbericht 2015. Wien, Dezember 2015. http://www.bundesabfallwirtschaftsplan.at/dms/bawp/AW_Statusbericht_2015_final.pdf
BMLFUW – Bundesministerium für Land- und Forstwirtschaft, Umwelt und Wasserwirtschaft (2015b): Grüner Bericht 2015. Bericht über die Situation der österreichischen Land- und Forstwirtschaft. Grüner Bericht gemäß § 9 des Landwirtschaftsgesetzes BGBl. Nr. 375/1992. Bundesministerium für Land- und Forstwirtschaft, Umwelt und Wasserwirtschaft, Wien. www.gruenerbericht.at.
BMLFUW – Bundesministerium für Land- und Forstwirtschaft, Umwelt und Wasserwirtschaft (2016a): Winter, R.; Biokraftstoffe im Verkehrssektor 2016. Daten zu Biokraftstoffen in Österreich für das Berichtsjahr 2015, BMFLUW, Wien 2016. http://www.lebensministerium.at/umwelt/luft-laerm-verkehr/biokraftstoffbericht.html
BMLFUW – Bundesministerium für Land- und Forstwirtschaft, Umwelt und Wasserwirtschaft (2016b): Schodl, B.: CO2-Monitoring Pkw 2016 – Bericht über die CO2 Emissionen neu zugelassener Pkw in Österreich; im Auftrag des BMLFUW, Wien 2016. https://www.bmlfuw.gv.at/umwelt/luft-laerm-verkehr/co2-monitoringPKW1.html
BMLFUW – Bundesministerium für Land- und Forstwirtschaft, Umwelt und Wasserwirtschaft (2016c): Schodl, B.: CO2-Monitoring LNF 2016 - Bericht über die CO2-Emissionen neu zugelassener LNF in Österreich; im Auftrag des BMLFUW, Wien 2016. https://www.bmlfuw.gv.at/umwelt/luft-laerm-verkehr/co2-monitoringLNF.html
BMLFUW – Bundesministerium für Land- und Forstwirtschaft, Umwelt und Wasserwirtschaft (2016d): Kommunales Abwasser. Österreichischer Bericht 2016. Wien. https://www.bmlfuw.gv.at/wasser/wasser-eu-international/europaeische_wasserpolitik/Lagebericht-2016.html
BMLFUW – Bundesministerium für Land- und Forstwirtschaft, Umwelt und Wasserwirtschaft (2000–2016): Grüner Bericht 1999, 2000, 2002, 2005, 2006, 2007, 2008, 2009, 2010, 2011, 2012, 2013, 2014, 2015, 2016. Bericht über die Situation der österreichischen Land- und Forstwirtschaft. Grüner Bericht gemäß § 9 des Landwirtschaftsgesetzes BGBl. Nr. 375/1992. Bundesministerium für Land- und Forstwirtschaft, Umwelt und Wasserwirtschaft, Wien. www.gruenerbericht.at.
Austria’s Informative Inventory Report (IIR) 2017 – References
402 Umweltbundesamt REP-0609, Vienna 2017
BMLFUW – Bundesministerium für Land- und Forstwirtschaft, Umwelt und Wasserwirtschaft (2017): Bundes-Abfallwirtschaftsplan 2017 (Entwurf BAWP 2017). Wien. http://www.bundesabfallwirtschaftsplan.at/
BMUJF – Bundesministerium für Umwelt, Jugend und Familie (1995): Bundesabfallwirtschaftsplan (BAWP) – Bundesabfallbericht 1995, Wien.
BMUJF – Bundesministerium für Umwelt, Jugend und Familie (1998): Bundesabfallwirtschaftsplan (BAWP) – Bundesabfallbericht 1998, Wien.
BMWA – Bundesministerium für wirtschaftliche Angelegenheiten (1990): Energiebericht (EB) der Österreichischen Bundesregierung, Wien. (BMWA–EB).
BMWA – Bundesministerium für wirtschaftliche Angelegenheiten (1996): Energiebericht (EB) der Österreichischen Bundesregierung, Wien. (BMWA–EB).
BMWFJ – Bundesministerium für Wirtschaft und Arbeit (1991-2014): Österreichisches Montan-Handbuch 1991-2014. Bergbau - Rohstoffe – Grundstoffe – Energie, Wien 2014.
BMWFW – Bundesministerium für Wissenschaft, Forschung und Wirtschaft (2015): Österreichisches Montanhandbuch 2015. Wien.
BMWFW – Bundesministerium für Wissenschaft, Forschung und Wirtschaft (2016): Österreichisches Montanhandbuch 2016. Wien.
BRUNSTERMANN, R. (2007): Übung Biologische Abfallbehandlung Teil 1; Universität Essen. https://www.uni-due.de/imperia/md/content/abfall/__bungbiologie1bsc2007.pdf
BUCHGRABER, K.; AMLINGER, F.; TULNIK, R. (2003) Produktion und Einsatz von Kompost in der Landwirtschaft und im Gemüsebau; Landwirt Heft 12/2003 Sonderbeilage.
BUNDESANSTALT FÜR AGRARWIRTSCHAFT (2016): Federal Institute of Agricultural Economics. Download from data pool. http://www.awi.bmlfuw.gv.at.
BUWAL – Bundesamt für Umwelt, Wald und Landschaft (1995): Emissionsfaktoren für stationäre Quellen, Bern.
DIPPOLD, M.; REXEIS, M. & HAUSBERGER, S. (2012): NEMO – A Universal and Flexible Model for Assessment of Emissions on Road Networks. 19th International Conference „Transport and Air Pollution“, 26.–27.11.2012, Thessaloniki.
DLG – Deutsche Landwirtschafts-Gesellschaft (1997): DLG-Futterwerttabelle für Wiederkäuer. 7. erweiterte und überarbeitete Auflage. DLG-Verlag, Frankfurt/Main, Germany.
DOEDENS, H.; CUHLS, C.; MÖNKEBERG, F.; LEVSEN, K.; KRUPPA, J.; SÄNGER, U. & KOCK, H. (1999): Bilanzierung von Umweltchemikalien bei der biologischen Vorbehandlung von Restabfällen, Phase 2: Emissionen, Schadstoffbilanzen und Abluftbehandlung. BMB+F Verbundvorhaben: Mechanisch-biologische Vorbehandlung von zu deponierenden Abfällen.
DÖHLER, H.; EURICH-MENDEN, B.; DÄMMGEN, U.; OSTERBURG, B.; LÜTTICH, M.; BERGSCHMIDT, A.; BERG, W. &
BRUNSCH, R. (2002): BMVEL/UBA-Ammoniak-Emissionsinventar der deutschen Landwirtschaft und Minderungsszenarien bis zum Jahre 2010. Texte 05/02. Umweltbundesamt, Berlin.
E-CONTROL (2008): Ökostrombericht 2008. Bericht der Energie-Control GmbH gemäß § 25 Abs 1 Ökostromgesetz. Oktober 2008. Wien.
E-CONTROL (2010): Ökostrombericht 2010. Bericht der Energie-Control GmbH gemäß § 25 Abs 1 Ökostromgesetz. Juli 2009. Wien.
E-CONTROL (2011): Ökostrombericht 2011. Bericht der Energie-Control GmbH gemäß § 25 Abs 1 Ökostromgesetz. November 2011. Wien.
Austria’s Informative Inventory Report (IIR) 2017 – References
Umweltbundesamt REP-0609, Vienna 2017 403
E-CONTROL (2013): Ökostrombericht 2013. Bericht der Energie-Control GmbH gemäß § 25 Abs 1 Ökostromgesetz. November 2013. Wien.
E-CONTROL (2013): Rohstoffbilanzen für 2011. Personal communication by DI Michael Sorger, 18.09.2013.
E-CONTROL (2014): http://www.e-control.at/portal/page/portal/medienbibliothek/publikationen/dokumente/pdfs/Oekostrombericht2014_final.pdf, accessed October 2014.
E-CONTROL (2015): http://www.e-control.at/portal/page/portal/medienbibliothek/publikationen/dokumente/pdfs/Oekostrombericht2014_final.pdf, accessed January 2016.
E-CONTROL (2016): https://www.e-control.at/documents/20903/388512/e-control-oekostrombericht-2016.pdf/bbd26620-e1a3-4243-aed7-33c95e317d7a, accessed in December 2016.
EEA – European Environment Agency (2007): EMEP/CORINAIR Emission Inventory Guidebook – 2006. Technical Report No. 11. Copenhagen 2007.
EEA – European Environment Agency (2009): EMEP/EEA air pollutant emission inventory guidebook — 2009. Technical report No 9/2009. Copenhagen 2009.
EEA – European Environment Agency (2013): EMEP/EEA air pollutant emission inventory guidebook – 2013. EEA Technical report No. 12/2013. http://www.eea.europa.eu/publications/emep-eea-guidebook-2013
EEA – European Environment Agency (2016): EMEP/EEA air pollutant emission inventory guidebook – 2016. EEA Technical report No. 21/2016. http://www.eea.europa.eu/publications/emep-eea-guidebook-2016
EIDGENÖSSISCHE FORSCHUNGSANSTALT FÜR AGRARÖKOLOGIE UND LANDBAU ZÜRICH-RECKENHOLZ, INSTITUT FÜR
UMWELTSCHUTZ UND LANDWIRTSCHAFT LIEBEFELD (1997): Ammoniak-Emissionen in der Schweiz: Ausmass und technische Beurteilung des Reduktionspotentials. Schriftenreihe FAL 26. Eidgenössische Forschungsanstalt für Agrarökologie und Landbau, Zürich.
EGLE, L.; RECHBERGER, H.; ZESSNER, M. (2004): Phosphorbilanz Österreich Grundlage für ein nachhaltiges Phosphormanagement – gegenwärtige Situation und zukünftige Entwicklung; Hrsg. Bundesministerium für Land- und Forstwirtschaft, Umwelt und Wasserwirtschaft, Sektion VII Wasser.
EMPA – Eidgenössische Materialprüfungs- und Forschungsanstalt (2004): Fischer, A.; Emmenegger, L. & Künninger, T.: PM10-Emissionen bei Anlagen der Holzbearbeitung in der Schweiz, Forschungsbericht 115/53, Eidgenössische Materialprüfungs- und Forschungsanstalt (EMPA), Dübendorf.
EPA – U.S. Environmental Protection Agency (1999): AP-42. Compilation of Air Pollutant Emission Factors, 5th edition. Chapter 13.2 fugitive dust sources. U.S. Environmental Protection Agency, Research Triangle Park, NC. http://www.epa.gov/otaq/ap42.htm
EUROPEAN COMMISSION IPPC BUREAU (2000): BAT-Reference Document in the Non Ferrous Metals Industries. Final Report, May 2000.
FLÖGL, W. (2002): Klimarelevanz der Deponien in Oberösterreich. Hydro Consulting Engineers. Erstellt im Auftrag für das Amt der OÖ Landesregierung. Abteilung Umweltschutz, UA Abfallwirtschaft. Linz.
FVMI – Fachverband der Mineralölindustrie (2015): Erhebungen zur Österreichischen Luftschadstoff-Inventur (OLI) 2015 – Emissionen der Mineralölkette (personal communication; Email 24.11.2015).
FAO AGR. STATISTICAL SYSTEM (2001): FAO Agricultural Statistical System. http://faostat.fao.org/site/339/default.aspx
Austria’s Informative Inventory Report (IIR) 2017 – References
404 Umweltbundesamt REP-0609, Vienna 2017
FEDERAL ASSOCIATION OF VINICULTURE (Bundesweinbauverband Österreich) (2001): Expert Judgement. Dr. Johannes Schima and DI Glatt. Presidential Conference of Austrian Agricultural Chambers (email).
FEDERAL ENVIRONMENT AGENCY GERMANY (2013): Submission under the United Nations Framework Convention on Climate Change and the Kyoto Protocol 2013. National Inventory Report for the German Greenhouse Gas Inventory 1990-2011. Dessau, 15.05.2013.
FREIBAUER, A. & KALTSCHMITT, M. (2001): Biogenic greenhouse gas emissions from agriculture in Europe. European Summary Report (Project Report Task 3) of the EU-Concerted Action FAIR3-CT96-1877 “Biogenic Emissions of Greenhouse Gases Caused by Arable and Animal Agriculture“.
FTU – Forschungsgesellschaft Technischer Umweltschutz (2000): measurements at Austrian plants by FTU. (not published).
GEBETSROITHER, E.; STREBEL, F. & ORTHOFER, R. (2002): Greenhouse Gas Emissions from Enteric Fermentation in Austria; ARC Seibersdorf research, July 2002.
GILBERG et al. (2005): Waste management in Europe and the Landfill Directive. Background paper from the ETC/RWM to the ETC/ACC workshop “Inventories and Projections of Greenhouse Gas Emissions from Waste“. European Environment Agency, 2005.
GRUBER, L. & PÖTSCH, E. M. (2006): Calculation of nitrogen excretion of dairy cows in Austria. Die Bodenkultur, 2006, Vol. 57, Heft 1-4, Vienna.
HACKL, A. & MAUSCHITZ, G. (1995): Emissionen aus Anlagen der österreichischen Zementindustrie. Zweite Fassung. Verfahrens-, Brennstoff- und Umwelttechnik TU-Wien, Wien.
HACKL, A. & MAUSCHITZ, G. (1997): Emissionen aus Anlagen der österreichischen Zementindustrie. Jahres-zeitreihe 1994–1996. Institut für Verfahrens-, Brennstoff- und Umwelttechnik TU-Wien, Wien.
HACKL, A. & MAUSCHITZ, G. (1999): Beiträge zum Klimaschutz durch nachhaltige Restmüllbehandlung. Studie im Auftrag des Bundesministeriums für Umwelt, Jugend und Familie, Weitra.
HACKL, A. & MAUSCHITZ, G. (2001): Emissionen aus Anlagen der österreichischen Zementindustrie. Jahres-zeitreihe 1997–1999. Institut für Verfahrens-, Brennstoff- und Umwelttechnik TU-Wien, Wien.
HACKL, A. & MAUSCHITZ, G. (2003): Emissionen aus Anlagen der österreichischen Zementindustrie. Jahres-zeitreihe 2000–2002. Institut für Verfahrenstechnik, Umwelttechnik und Technische Biowissenschaften TU-Wien, Wien.
HACKL, A. & MAUSCHITZ, G. (2007): Emissionen aus Anlagen der österreichischen Zementindustrie. Institut für Verfahrenstechnik, Umwelttechnik und Technische Biowissenschaften TU-Wien, Wien.
HAUSBERGER, S. (1997): GLOBEMI – Globale Modellbildung für Emissions- und Verbrauchsszenarien im Verkehrssektor; Institute for Internal Combustion and Thermodynamics. University of Technology Graz; Volume 71; Graz.
HAUSBERGER, S. & KELLER, M. et al. (1998): Handbuch der Emissionsfaktoren des Straßenverkehrs in Österreich. Im Auftrag des Umweltbundesamtes; BMLFUW und BMVIT. Wien.
HAUSBERGER, S. (1998): GLOBEMI – Globale Modellbildung für Emissions- und Verbrauchsszenarien im Verkehrssektor; Institute for Internal Combustion and Thermodynamics. University of Technology Graz; Volume 71; Graz.
HAUSBERGER, S. (2000): Emissionen des Off-Road-Verkehrs im Bundesgebiet Österreich für die Bezugsjahre 1990 bis 1999. Institut für Verbrennungskraftmaschinen und Thermodynamik TU Graz, Graz. Unveröffentlicht.
Austria’s Informative Inventory Report (IIR) 2017 – References
Umweltbundesamt REP-0609, Vienna 2017 405
HAUSBERGER, S.; SCHWINGSHACKL, M. & REXEIS, M. (2014): Straßenverkehrsemissionen und Emissionen sonstiger mobiler Quellen Österreichs für die Jahre 1990 bis 2012. FVT – Forschungsgesellschaft für Verbrennungskraftmaschinen und Thermodynamik mbH. Erstellt im Auftrag der Umweltbundesamt GmbH. Graz 2014.
HAUSBERGER, S.; SCHWINGSHACKL, M. & REXEIS, M. (2015a): Straßenverkehrsemissionen und Emissionen sonstiger mobiler Quellen Österreichs für die Jahre 1990 bis 2013. FVT – Forschungsgesellschaft für Verbrennungskraftmaschinen und Thermodynamik mbH. Erstellt im Auftrag der Umweltbundesamt GmbH. Graz 2015.
HAUSBERGER, S.; SCHWINGSHACKL, M. & REXEIS, M. (2015b): NEMO Methodenbericht im Rahmen des Projekts NEMO4U. Erstellt im Auftrag der Umweltbundesamt GmbH. Graz 2015.
HAUSBERGER, S.; SCHWINGSHACKL, M. & REXEIS, M. (2015c): Straßenverkehrsemissionen und Emissionen sonstiger mobiler Quellen Österreichs für die Jahre 1990 bis 2014. FVT – Forschungsgesellschaft für Verbrennungskraftmaschinen und Thermodynamik mbH. Erstellt im Auftrag der Umweltbundesamt GmbH. Graz 2015.
HÄUSLER, J. (2009): Das Leistungspotenzial von Fleckviehmutterkühen – Versuchsergebnisse des LFZ Raumberg-Gumpenstein. Fachtag „Erfolgreiche Mutterkuhhaltung“ Fachschule Warth.
HEDMAN, B.; NÄSLUND, M. & MARKLUND, S. (2006): Emission of PCDD/F, PCB and HCB from Combustion of Firewood and Pellets in Residential Stoves and Boilers, Environmental Science & Technology, 2006, 40.
HINZ, T. & VAN DER HOEK, K. (2006): PM Emissions from Arable Agriculture. Paper presented at the Agriculture and Nature expert Panel, 7th Joint Task Force & EIONET Meeting on emission Inventories and Projections, Thessaloniki, Oct. 30 to Nov. 2, 2006.
HÜBNER, C. (2000): CORINAIR Dioxin-Emissionsinventur 1990. Studie im Auftrag des Umweltbundesamt, Wien.
HÜBNER, C. (2001a): Österreichische Emissionsinventur für Cadmium, Quecksilber und Blei 1995–2000. Studie im Auftrag des Umweltbundesamtes. FTU – Forschungsgesellschaft Technischer Umweltschutz GmbH, Wien.
HÜBNER, C. (2001b): Österreichische Emissionsinventur für POPs 1985–1999. Studie im Auftrag des Umweltbundesamt. Interner Bericht, Bd. IB-650. FTU – Forschungsgesellschaft Technischer Umweltschutz GmbH, Wien.
HÜBNER, C. et al. (1996): Emissionen aus mit Heizölen befeuerten Praxisanlagen im stationären Betriebszustand. Teil 1: Kleinfeuerungsanlagen bis 350 kW mit Heizöl Extraleicht, Erdöl, Erdgas, Kohle. 112/4. pp.170–174.
HÜBNER, C.; KUNA, R.; KRENAUER, A. & ÖLLER, F. (2002): HCB-Emissionen aus mit Festbrennstoffen betriebenen Kleinfeuerungsanlagen (≤ 50 kW). FTU – Forschungsgesellschaft Technischer Umweltschutz GmbH, Wien.
IEA – International Energy Agency (2016): IEA/EUROSTAT Joint Questionnaire (IEA JQ 2016). Submission 2016. Statistik Austria, Wien.
IPCC GUIDELINES (1997): Revised 1996 IPCC Guidelines for Natinal Greenhouse Gas Inventories, Vol. 1: Reporting Instructions, Vol. 2: Workbook, Vol. 3: Reference Manual. Intergovernmental Panel on Climate Change, Edited by J.T. Houghton, L.G. Meira Filho, B. Lim, K. Tréanton, I. Mamaty, Y. Bonduki, D.J. Griggs and B.A. Callander, Genf.
Austria’s Informative Inventory Report (IIR) 2017 – References
406 Umweltbundesamt REP-0609, Vienna 2017
IPCC-GPG (2000): Report on Good Practice Guidance and Uncertainty Management in National Greenhouse Gas Inventories (IPCC Good Practice Report). Edited by J. Penman, D. Kruger, I. Galbally, T. Hiraishi, B. Nyenzi, S. Emmanuel, L. Buendia, R. Hoppaus, T. Martinsen, J. Meijer, K. Miwa and K. Tanabe, Japan.
IPCC – Intergovernmental Panel on Climate Change (2006): 2006 IPCC Guidelines for National Greenhouse Gas Inventories, Prepared by the National Greenhouse Gas Inventories Programme, Eggleston H.S., Buendia L., Miwa K., Ngara T. and anabe K. (eds). Published: IGES, Japan. http://www.ipcc-nggip.iges.or.jp/public/2006gl/
JENKINS, B.M. (1996): Atmospheric Pollutant Emission Factors from Open Burning of Agricultural and Forest Biomass by Wind Tunnel Simulations; Final Report (3 Vols.); CARB Project A932-126; California Air Resources Board, Sacramento, California.
JOANNEUM RESEARCH (1995): Stanzel, W.; Jungmeier, G.; Spitzer, J.: Emissionsfaktoren und energietechnische Parameter für die Erstellung von Energie- und Emissionsbilanzen im Bereich Raumwärmeversorgung. Joanneum Research, Institut für Energieforschung, Graz.
KALIVODA, M. & KUDRNA, M. (1997): MEET – Methodology for calculating transport emissions and energy consumption. European Commission, DG VII, Belgium, Perchtoldsdorf/Vienna, 1997.
KALIVODA, M. & KUDRNA, M. (2002): Air Traffic Emission Calculation for Austria 1990–2000, study commissioned by Umweltbundesamt GmbH, Perchtoldsdorf, 2002. Study has not been published, but can be made available upon request.
KAKAREKA, S.; KUKHARCHYK, T. & KHOMICH, V. (2004): Research for HCB and PCB Emission Inventory Improvement in the CIS Countries (on an Example of Belarus) / Belarusian Contribution to EMEP. Annual report 2003. Minsk, 2004.
KAUSEL, A. (1998): Ein halbes Jahrhundert des Erfolges, Der ökonomische Aufstieg Österreichs im OECD-Raum seit 1950. Österreichische Nationalbank, Wien 1998.
KECK, M. (1997): Ammonia emission and odour thresholds of cattle houses with exer-cise yards, In: Voermans, J And Monteny, G (Eds): “Ammonia and odour emissions from animal production facilities”, Proc. International Symposium, Vinkeloord, NL, 6–10. Oktober 1997, 349–354.
KLIMONT, Z.; J. COFALA, I.; BERTOK, M.; AMANN, C.; HEYES & GYARFAS, F. (2002): Modelling Particulate Emissions in Europe. A Framework to Estimate Reduction Potential and Control Costs, Interim Report IR-02-076, IIASA, Laxenburg.
KONRAD, S. (1995): Die Rinder-, Schweine- und Legehennenhaltung in Österreich aus ethologischer Sicht. WUV Universitätsverlag, Wien.
KRANERT, M. & CORD-LANDWEHR, K. (2010): Einführung in die Abfallwirtschaft; 4 vollständig aktualisierte und erweiterte Auflage; S. 226.
KREUZHUBER, D. (2013): Personal communications, 11.11.2013, 12.11.2013.
KUPIAINEN, K. & KLIMONT, Z. (2004): Primary Emissions of Submicron and Carbonaceous Particles in Europe and the Potential for their Control. Interim Report IR-04-079, IIASA, Laxenburg.
LANDESBETRIEB LANDWIRTSCHAFT HESSEN (2013): Nährstoffgehalte pflanzlicher Produkte zum Nährstoffvergleich. http://www.llh-hessen.de/pflanzenproduktion/duengung-boden/n-duengung/155-landwirtschaft/pflanzenproduktion/duengung-boden/567-naehrstoffgehalte-pflanzlicher-produkte-zum-naehrstoffvergleich.html (accessed 04.06.2014)
LANG, G.; LEUTGÖB, K. & LUTTER, E. (2003): Abschätzung der Entwicklung der NMVOC-Emissionen im Bereich der Kleinverbraucher. Energieverwertungsagentur, Wien.
Austria’s Informative Inventory Report (IIR) 2017 – References
Umweltbundesamt REP-0609, Vienna 2017 407
LAUNHARDT, T. et al. (1998): PCDD/F- and PAH-Emission from House Heating Systems. Chemosphere Vol. 37. pp. 2013–2020.
LAUNHARDT, T.; HARTMANN, H. & LINK, H. (2000): Domestic Wood Chip Boilers – Emissions from Test Stand and Practise Measurements. In: Proceedings 1st World Conference on Biomass for Energy and Industry. 5–9 June 2000.
LEO, C. (2014): personal communication. Email 04.12.2013. Vienna.
LEUTGÖB, K.; LANG, G.; LUTTER, E. & BENKE, G. (2003): Entwicklung der NOx- und SO2-Emissionen im Hausbrand. Energieverwertungsagentur, Wien.
LFU – Landesanstalt für Umweltschutz Baden-Württemberg (1992): Der Deponiegashaushalt in Altablagerungen – Leitfaden Deponiegas. Materialien zur Altlastenbearbeitung. Handbuch Altlasten und Grundwasserschadensfälle. Baden-Württemberg.
LÖHR, L. (1990): Faustzahlen für den Landwirt. 7. durchgesehene Auflage. Leopold Stocker Verlag, Graz-Stuttgart.
LÜKEWILLE, A.; BERTOK, I.; AMANN, M.; COFALA, J.; GYARFAS, F.; HEYES, C.; KARVOSENOJA, N.; KLIMONT, Z. &
SCHOEPP, W. (2001): A Framework to Estimate the Potential and Costs for the Control of Fine Particulate Emissions in Europe. Interim Report IR-01-023, IIASA, Laxenburg.
MAGISTRAT DER LANDESHAUPTSTADT (MA) LINZ (1995): Bilanz der Quecksilberemissionen aus Quellen im Linzer Stadtgebiet. Amt für Umweltschutz, Linz.
MAUSCHITZ, G. (2004): Emissionen aus Anlagen der österreichischen Zementindustrie. Berichtsjahr 2003. Institut für Verfahrenstechnik. Umwelttechnik und Technische Biowissenschaften TU-Wien, Wien.
MEET – Methodology for calculating transport emissions and energy consumption (1999): European Commission, DG VII, Belgium.
MEISTERHOFER (1986): Reduktion der Kohlenwasserstoffemissionen aus Räucheranlagen (Selchanlagen). Studie im Auftrag des Umweltfonds. BmfGU.
MENZI, H.; RUETTIMANN, L. & REIDY, B. (2003): DYNAMO: A new calculation model for dynamic emission inventories for ammonia Proc Internat Symposium "Gaseous and odour emissions from animal production facilities", Horsens, Denmark, June 1-4 2.
MISSELBROOK, T.; WEBB, J.; CHADWICK, D.; ELIIS, S. & PAIN, B. (2001): Gaseous emissions from outdoor concrete yards used by livestock. Atmospheric Environment 35, 5331–5338.
MOLITOR, R.; HAUSBERGER, S.; BENKE, G. et al. (2004) Abschätzung der Auswirkungen des Tanktourismus auf den Kraftstoffverbrauch und die Entwicklung der CO2-Emissionen in Österreich, Bericht im Auftrag von Bundesministerium für Land- und Forstwirtschaft, Umwelt und Wasserwirtschaft, Trafico, Wien 2004.
MOLITOR, R; SCHÖNFELDER, S.; HAUSBERGER, S.; BENKE, G. et al. (2009) Abschätzung der Auswirkungen des Kraftstoffexports im Tank auf den Kraftstoffabsatz und die Entwicklung der CO2- und Luftschadstoffemissionen in Österreich – Aktualisierung 2007 und Prognose 2030. Bericht im Auftrag von Bundesministerium für Land- und Forstwirtschaft, Umwelt und Wasserwirtschaft und Bundesministerium für Verkehr, Innovation und Technologie. Wien 2009. Study has not been published, but can be made available upon request.
OETTL, D. & FUNK, R. (2007): PM emission factors for farming activities by means of dispersion modeling. Paper presented at the International Conference “Particulate Matter in and from Agriculture” 2007, Braunschweig.
Austria’s Informative Inventory Report (IIR) 2017 – References
408 Umweltbundesamt REP-0609, Vienna 2017
ÖFZS – Österreichisches Forschungszentrum Seibersdorf (1991): Orthofer, R.; Knoflacher, M.; Loibl, W. et al.: Abschätzung der Methan-Emissionen in Österreich. Studie im Auftrag des Bundesministeriums für Umwelt, Jugend und Familie (unpubl.), Seibersdorf 1991.
ÖWAV – Österreichischer Wasser- und Abfallwirtschaftsverband (2003): ÖWAV Arbeitsbehelf EPER. Arbeitsbehelf zur Abschätzung von Emissionen in Luft und Wasser. Reststoff- und Massenabfalldeponie gemäß EPER-V (BGBl. II Nr. 300/2002). Wien 2003.
ÖWAV – Österreichischer Wasser- und Abfallwirtschaftsverband (2004): ÖWAV-Regelblatt Nr. 17 – Landwirtschaftliche Verwertung von Klärschlamm 2004 – www.oewav.at
ÖWAV – Österreichischer Wasser- und Abfallwirtschaftsverband (2015): Branchenbild der österreichischen Abwasserwirtschaft 2016. Wien. 2015. https://www.publicconsulting.at/fileadmin/user_upload/media/umweltfoerderung/Dokumente_Betriebe/Wasser_Betriebe/Studien_Wasserwirtschaft/Branchenbild_2016.pdf
ORTHOFER, R. & VESELY, A. (1990): Abschätzung von toxischen Emissionen (PCDD, PCDF, PAK, BaP) aus Verbrennungsprozessen in Österreich. Österreichisches Forschungszentrum Seibersdorf. ÖSTAT Industrie- und Gewerbestatistik: Teil 1, Hefte 850, 948, 1036, 1115, 1188.
ORTHOFER, R.; LOIBL, W. & KÖSTL, M. (2002): Räumliche Disaggregationder österreichischen Luftschadstoffinventur (OLI) für die Jahre 1990, 1995 und 2000 auf das EMEP 50 x 50 km2 Raster. ARC Seibersdorf research Report, ARC S-0166, 66 pp., Juni 2002. Unpublished.
ORTHOFER, R. (2007): Räumliche Disaggregationder österreichischen Luftschadstoffinventur (OLI) für die Jahre 1990, 1995, 2000 und 2005 auf das EMEP 50 x 50 km2 Raster. ARC Seibersdorf research Report, ARC--sys-0125, 90 pp., April 2007. Projektendbericht. Unpublished.
PFEIFFER, F.; STRUSCHKA, M. & BAUMBACH, G. (2000): Ermittlung der mittleren Emissionsfaktoren zur Darstellung der Emissionsentwicklung aus Feuerungsanlagen im Bereich Haushalte und Kleinverbraucher. UBA Forschungsbericht 295 46 364.
PISCHINGER, R. (2000): Emissionen des Off-Road-Verkehrs im Bundesgebiet Österreich für die Bezugsjahre 1990 bis 1999. Institut für Verbrennungskraftmaschinen und Thermodynamik TU Graz, Graz. Unveröffentlicht.
PHILIPPITSCH, R.; GRATH, J.; SCHIMON, W.; GMEINER, C.; DEUTSCH, K.; GRUBER, D.; TOMEK, H.; BONANI, M. &
LASSNIG, M. (2001): Wassergüte in Österreich. Jahresbericht 2000 (“Austrian water protection report”). Erhebung der Wassergüte gemäß Hydrographiegesetz (BGBl. Nr. 252/90, i.d.g.F.). Bundesministerium für Land- und Forstwirtschaft, Umwelt und Wasserwirtschaft in Zusammenarbeit mit der Umweltbundesamt GmbH, Wien.
PÖTSCH, E.M.; GRUBER, L. & STEINWIDDER, A. (2005): Answers and comments on the additional questions, following the meeting in Bruxelles. Internal statement. HBLFA Raumberg-Gumpenstein.
PÖLLINGER, A. (2008): National expert at the Agricultural Research and Education Centre Raumberg-Gum-penstein. Expert judgement to AWMS distribution 1990–2008 carried out in June 2008. Vienna.
PRESIDENTIAL CONFERENCE OF AUSTRIAN AGRICULTURAL CHAMBERS (2004): Judgement based on of the experts of Austria’s agricultural chambers. E-mail from Dr. Reindl, Vienna.
PRESIDENTIAL CONFERENCE OF THE AUSTRIAN CHAMBERS OF AGRICULTURE (2006): Judgement based on of the experts of Austria’s agricultural chambers. E-mail from Dr. Reindl, Vienna.
PULLES, T. & VAN AARDENNE, J. (2001): Good Practice Guidance for CLRTAP Emission Inventories – Draft chapter for the UNECE Corinair Guidebook on Emissions inventories. European Topic centre on air and climate change (ETC/ACC), November 2001. Copenhagen.
Austria’s Informative Inventory Report (IIR) 2017 – References
Umweltbundesamt REP-0609, Vienna 2017 409
REIDY, B. & MENZI, H. (2005): Ammoniakemissionen in der Schweiz: Neues Emissionsinventar 1990 bis 2000 mit Hochrechungen bis 2003 Technischer Schlussbericht Schweizerische Hochschule für Zollikofen.
REIDY, B.; RIHM, B. & MENZI, H. (2007): A new Swiss inventory of ammonia emissions from agriculture based on a survey on farm and manure management and farm-specific model calculations, Reference: AEA7495, IN Journal: Atmospheric Environment.
REIDY, B.; DÄMMGEN, U.; DÖHLER, H.; EURICH-MENDEN, B.; EVERT, F. K. VAN; HUTCHINGS, N. J.; LUESINK, H. H.; MENZI, H.; MISSELBROOK, T. H.; MONTENY, G.J. & WEBB, J. (2008): Comparison of models used for national agricultural ammonia emission inventories in Europe : liquid manure systems. Atmospheric environment, Band 42, Heft 14, Seite 3452–3464, englisch. ISSN: 0004-6981.
REIDY, B.; WEBB, J.; MISSELBROOK, T.H.; MENZI, H.; LUESINK, H.H.; HUTCHINGS, N.J.; EURICH-MENDEN, B.; DÖHLER, H. & DÄMMGEN, U. (2009): Comparison of models used for national agricultural ammonia emission inventories in Europe: Litter-based manure systems. Atmospheric environment, Band 43, Heft 9, Seite 1632–1640, englisch. ISSN: 0004-6981.
RESCH, R.; GUGGENBERGER, T.; WIEDNER, G.; KASAL, A.; WURM, K.; GRUBER, L.; RINGDORFER, F. &
BUCHGRABER, K. (2006): Futterwerttabellen im Jahr 2006 für das Grundfutter im Alpenraum. Available from Website http://www.gumpenstein.at
REXEIS, M. et al. (2013): Emissionen aus Kalt- und Kühlstarts sowie aus AdBlue-Verwendung in SCR-Katalysatoren von Lkw, LNF, 2-Rädern sowie von mobilen Maschinen. Erstellt im Auftrag des Umweltbundesamtes GmbH. Graz, 2013.
RÖMPP LEXIKON CHEMIE (1996-1999): 10. Auflage, Band 3: H – L.
SCHECHTNER (1991): Wirtschaftsdünger – Richtige Gewinnung und Anwendung. Sonderausgabe des Förderungsdienst 1991. BMLF, Wien.
SCHEIDL, K. (1996): Österreichische Emissionsinventur für Luftschadstoffe PAH. Studie im Auftrag des Umweltbundesamtes, Wien.
SCHMIDT, A.; VITOVEC, W.; PUXBAUM, H. & KNIERIDER, R. (1998): Die ökologischen Auswirkungen der Lösungsmittelverordnung 1991 und 1995. TU Wien. Gesellschaft Österreichischer Chemiker, Wien.
SORGER, A. (1993): Emissionen aus Heizungsanlagen in Österreich. Dissertation BOKU-Wien.
STANZEL, G.; JUNHMEUER, J. & SPITZER, J. (1995): Emissionsfaktoren und Energetische Parameter für die Erstellung von Energie und Emissionsbilanzen im Bereich Raumwärmeversorgung. Joanneum Research Graz, Graz.
STATISIK AUSTRIA (div. Jahre) Wien: Statistisches Jahrbuch Österreich 1990–2016; Industrie und Gewerbestatistik (1. Teil) 1990–1995; Konjunkturerhebung im Produzierenden Bereich (Band 2.Bzw. 3) 1997–2016; Der Außenhandel Österreichs 1. bis 4. Vierteljahr 1980–2016, Spezialhandel nach Waren und Ländern.
STATSTIK AUSTRIA (1990–2014): Agrarstrukturerhebungen 1990–2013. Schnellbericht. Statistik Austria. Wien 2014 http://www.statistik.at/web_de/services/publikationen/8/index.html
STATISTIK AUSTRIA (2002): Mikrozensus Sonderprogramm. Energieeinsatz der Haushalte 1999/2000 – Grunddaten mengen- u. wertmäßig nach allen Energieträgern. Statistik Austria, personal communication.
STATISTIK AUSTRIA (2010): Weingartengrunderhebung 2009. Schnellbericht 1.19. Wien.
STATISTIK AUSTRIA (2013): Agrarstrukturerhebung 2010. Gesamtergebnisse. Wien.
STATISTIK AUSTRIA (2014a): Agrarstrukturerhebung 2013. Schnellbericht 1.17. Wien.
Austria’s Informative Inventory Report (IIR) 2017 – References
410 Umweltbundesamt REP-0609, Vienna 2017
STATISTIK AUSTRIA (2014b): Sonderauswertung des Mikrozensus 2012 (MZ 2012): Energieeinsatz der Haushalte. Wien.
STATISTIK AUSTRIA (2008a, 2009a, 2010a, 2011a, 2012a, 2013a, 2014a, 2015a, 2016a): Flight movements per aircraft type and airport (national and international) - nonstandard analysis (not published). Statistik Austria. Wien.
STATISTIK AUSTRIA (2016b): Allgemeine Viehzählung am 1. Dezember 2015. National livestock counting December 2015 published in: BMLFUW 2016.
STATISTIK AUSTRIA (2016c): IEA/EUROSTAT joint questionnaire submission 2016 (IEA JQ 2016). Wien.
STATISTIK AUSTRIA (2016d): Austrian Transport Statistics 2015. Statistik Austria 2016. Wien.
STATSTIK AUSTRIA (2016e): Binnenschifffahrtsstatistik 2015. Statistik Austria 2016. Wien.
STEINWIDDER, A. & GUGGENBERGER, T. (2003): Erhebungen zur Futteraufnahme und Nährstoffversorgung von Milchkühen sowie Nährstoffbilanzierung auf Grünlandbetrieben in Österreich. Die Bodenkultur 54 (1). 49–66.
STEINWIDDER, A; HÄUSLER, J.; SCHAUER, A.; MAIERHOFER, G.; GRUBER, L.; GASTEINER, J. & PODSTATZKY, L. (2006): Einfluss des Absetztermins auf die Milchleistung und Körpermasse von Mutterkühen sowie die Zuwachsleistung von Mutterkuh-Jungrindern. Versuchsbericht. Extensively managed beef cows – Effects on animal health, reproductive success, performance of calves and economics. Experiment 2004 to 2008. Interim report. Agricultural Research and Education Centre, HBLFA Raumberg-Gumpenstein.
STREBL, F.; GEBETSROITHER, E. & ORTHOFER, R. (2003): Greenhouse Gas Emissions from Cropland & Grassland Management in Austria. Report ARC-S-0221.
THAYER, R. (2014): personal communication. Email 19.11.2014. Vienna.
UMWELTBUNDESAMT (1993): Knoflacher, M.; Haunhold, E.; Loibl, W. et al.: Ammoniak-Emissionen in Österreich 1990. Berechnung und Abschätzung sowie Regionalisierung auf Basis politischer Bezirke. Reports, Bd. 92-068, Umweltbundesamt, Wien.
UMWELTBUNDESAMT (1995): Boos, R.; Neubacher, F.; Reiter, B.; Schindlbauer, H. & Twrdik, F.: Zusammensetzung und Behandlung von Altölen in Österreich. Monographien, Bd. M-54. Umweltbundesamt, Wien.
UMWELTBUNDESAMT (1996a): Hobinger G. & Maderner W.: PCB-Stoffbilanz Österreich. Monographien, Bd. M-079.Umweltbundesamt. Wien.
UMWELTBUNDESAMT (1997): Scharf, S.; Schneider, M. & Zethner, G.: Zur Situation der Verwertung und Entsorgung des kommunalen Klärschlamms in Österreich. Monographien, Bd. M-095. Umweltbundesamt, Wien.
UMWELTBUNDESAMT (1998a): GÖTZ, B.: Stickstoffbilanz der österreichischen Landwirtschaft nach den Vorgaben der OECD. Aktualisierte und erweiterte Fassung. Berichte, Bd. BE-087a. Umweltbundesamt, Wien.
UMWELTBUNDESAMT (1998b): Lahl, U.; Zeschmar-Lahl, B. & Scheidl, K. : Abluftemissionen aus der mechanisch-biologischen Abfallbehandlung in Österreich. Klagenfurt.
UMWELTBUNDESAMT (2000a): Ecker, A. & Winter, B.: Stand der Technik bei Raffinerien im Hinblick auf die IPPC-Richtlinie. Monographien, Bd. M-119. Umweltbundesamt, Wien.
UMWELTBUNDESAMT (2000b): Boin, U.; Linsmeyer, T. et al: Stand der Technik in der Sekundäraluminiumerzeugung im Hinblick auf die IPPC-Richtlinie. Monographien, Bd. M-120. Umweltbundesamt, Wien.
Austria’s Informative Inventory Report (IIR) 2017 – References
Umweltbundesamt REP-0609, Vienna 2017 411
UMWELTBUNDESAMT (2000C): Lahl, U.; Zeschmar-Lahl, B. & Angerer, T.: Entwicklungspotentiale der mechanisch-biologischen Abfallbehandlung. Eine ökologische Analyse. Wien.
UMWELTBUNDESAMT (2001a): Emissionsfaktoren als Grundlage für die Österreichische Luftschadstoff-Inventur. Stand 1999. Interner Bericht, Bd. IB-614. Umweltbundesamt, Wien.
UMWELTBUNDESAMT (2001b): Häusler, G.: Emissionen aus österreichischen Abfalldeponien in den Jahren 1980 bis 1998. Interner Bericht. Umweltbundesamt, Wien.
UMWELTBUNDESAMT (2001c): Wiesenberger, H.: State-of-the-art for the production of nitric acid with regard to the IPPC directive. Monographien, Bd. M-150. Umweltbundesamt, Wien.
UMWELTBUNDESAMT (2001d): Grech, H. & Rolland, C.: Stand der Abfallbehandlung in Österreich im Hinblick auf das Jahr 2004. Berichte, Bd. BE-182. Umweltbundesamt, Wien.
UMWELTBUNDESAMT (2003a): Böhmer, S.; Wiesenberger, H.; Krutzler, T. et al.: NOx-Emissionen: Minderungs-potenziale in ausgewählten Sektoren und Szenarien 2010. Berichte, Bd. BE-233. Umweltbundesamt, Wien.
UMWELTBUNDESAMT (2003b): Böhmer, S.; Schindler, I.; Szednyj I.: Stand der Technik bei Kalorischen Kraftwerken und Referenzanlagen in Österreich. Monographien, Bd. M-162. Umweltbundesamt, Wien.
UMWELTBUNDESAMT (2003c): Rolland, C., Scheibengraf, M.: Biologisch abbaubarer Kohlenstoff im Restmüll. Berichte, Bd. BE-236. Umweltbundesamt, Wien.
UMWELTBUNDESAMT (2004a): Siebenter Umweltkontrollbericht. Umweltbundesamt, Wien.
UMWELTBUNDESAMT (2004b): Wieser, M.; Kurzweil, A.: Emissionsfaktoren als Grundlage für die Österreichische Luftschadstoffinventur Stand 2003. Berichte, Bd. BE-254. Umweltbundesamt, Wien.
UMWELTBUNDESAMT (2004c): Rolland, C. & Oliva, J.: Erfassung von Deponiegas – Statusbericht von österreichischen Deponien. Berichte, Bd. BE-238. Umweltbundesamt, Wien.
UMWELTBUNDESAMT (2004d): Schindler, I.; Kutschera, U. & Wiesenberger, H.: Medienübergreifende Umweltkontrolle in ausgewählten Gebieten. Umweltbundesamt, Wien.
UMWELTBUNDESAMT (2005a): Stubenvoll, J.; Holzerbauer, E.; Böhmer, S. et al.: Technische Maßnahmen zur Minderung der Staub- und NOx-Emissionen bei Wirbelschichtkesseln und Laugenverbrennungskesseln. Umweltbundesamt, Wien.
UMWELTBUNDESAMT (2005b): Schachermayer, E.: Vergleich und Evaluierung verschiedener Modelle zur Berechnung der Methanemissionen aus Deponien. Umweltbundesamt, Wien 2005. (not published).
UMWELTBUNDESAMT (2006a): Gager, M.: Emissionen Österreichischer Großfeuerungsanlagen 1990–2004. Reports, Bd. REP-0006. Umweltbundesamt, Wien.
UMWELTBUNDESAMT (2006b): Krutzler, T.; Böhmer, S.; Szednyj, I.; Wiesenberger, H. & Poupa, S.: NOx-Emissionen 2003–2020. Emissionsprognose und Minderungspotenziale für Energieumwandlung und ausgewählte industrielle Sektoren. Report, Bd. REP-0040. Umweltbundesamt, Wien. (unpublished).
UMWELTBUNDESAMT (2006c): Neubauer C. & Öhlinger A.: Ist-Stand der mechanisch biologischen Abfallbehandlung (MBA) in Österreich, Zustandsbericht 2006. Reports, Bd. REP-0071. Umweltbundesamt, Wien.
UMWELTBUNDESAMT (2006d): Salchenegger, S.: Biokraftstoffe im Verkehrssektor in Österreich 2006, Zusammenfassung der Daten der Republik Österreich gemäß Art. 4, Abs. 1 der Richtlinie 2003/30/EG für das Berichtsjahr 2005. Reports, Bd. REP-0068. Umweltbundesamt, Wien.
Austria’s Informative Inventory Report (IIR) 2017 – References
412 Umweltbundesamt REP-0609, Vienna 2017
UMWELTBUNDESAMT (2007): Böhmer, S.; Fröhlich, M.; Köther, T.; Krutzler, T.; Nagl, C.; Pölz, W.; Poupa, S.; Rigler, E.; Storch, A. & Thanner, G.: Aktualisierung von Emissionsfaktoren als Grundlage für den Anhang des Energieberichts. Reports, Bd. REP-0075. Umweltbundesamt, Wien.
UMWELTBUNDESAMT (2008a): Schachermayer, E. & Lampert, C.: Deponiegaserfassung auf österreichischen Deponien. Reports, Bd. REP-0100. Umweltbundesamt, Wien.
UMWELTBUNDESAMT (2008b): Neubauer C. & Walter, B.: Behandlung von gemischten Siedlungs- und Gewerbeabfällen in Österreich – Betrachtungszeitraum 2003–2008. Umweltbundesamt, Wien.
UMWELTBUNDESAMT (2011a): Query of data from the National Austrian Waste Water Database. Vienna 2011.
UMWELTBUNDESAMT (2011b): Köther, T.; Anderl, M.; Haider, S.; Pazdernik, K.; Poupa, S.; Purzner, M.; Stranner, G.; Wieser, M. & Zechmeister, A.: Austria’s Informative Inventory Report 2011. Submission under the UNECE Convention on Long-range Transboundary Air Pollution. Reports, Bd. REP-0307. Umweltbundesamt, Wien.
UMWELTBUNDESAMT (2012): National Action Plan pursuant to Article 5 of the Stockholm Convention on POPs and Article 6 of the EU-POP Regulation. First review, 2012. Report, REP-0395, Umweltbundesamt, Wien.
UMWELTBUNDESAMT (2013a): Data on sewage sludge application provided by the provincial governments. Vienna 2013.
UMWELTBUNDESAMT (2014a): Data on sewage sludge application provided by the provincial governments. Vienna 2014.
UMWELTBUNDESAMT (2014b): LAMPERT, C.: Stand der temporären Abdeckung von Deponien und Deponiegaserfassung. Bericht. REP-0484. Umweltbundesamt, Wien.
UMWELTBUNDESAMT (2014c): Zechmeister, A.; Anderl, M.; Köther, T.; Krutzler, T.; Lampert, C.; Pazdernik, K.; Poupa, S.; Schindlbacher, S.; Schmid, C. & Stranner, G.: Austria’s National Air Emission Projections 2013 for 2015, 2020 and 2030, Bd. REP-0456. Umweltbundesamt, Wien.
UMWELTBUNDESAMT (2014d): Haider, S.; Anderl, M.; Jobstmann, H.; Köther, T.; Lampert, C.; Moosmann, L.; Pazdernik, K.; Pinterits, M.; Poupa, S.; Stranner, G. & Zechmeister, A.: Austria’s Informative Inventory Report 2014. Submission under the UNECE Convention on Long-range Transboundary Air Pollution. Reports, Bd. REP-0474 Umweltbundesamt, Wien.
UMWELTBUNDESAMT (2015a): Data on sewage sludge application provided by the provincial governments. Vienna 2015.
UMWELTBUNDESAMT (2015b): Query of data from the Electronic Data Management for the BAWP. May 2014. Vienna. http://www.edm.gv.at
UMWELTBUNDESAMT (2015c): Zechmeister, A.; Anderl, M.; Krutzler, T.; Lampert, C.; Pazdernik, K.; Poupa, S.; Purzner, M.; Schieder, W.; Storch, A.; Stranner, G. & Wieser, M.: Austria’s National Air Emission Projections 2015 for 2015, 2020 and 2030, Bd. REP-0556. Umweltbundesamt, Wien.
UMWELTBUNDESAMT (2016a): Data on sewage sludge application provided by the provincial governments. Vienna 2016.
UMWELTBUNDESAMT (2016b): Lampert, C.; Neubauer, M. & Bernhardt A.: Kommunale Grünabfälle (KoGa). Report. unpublished. Vienna.
UMWELTBUNDESAMT (2017a): Anderl, M.; Friedrich, A.; Haider, S.; Kriech, M.; Lampert, Ch.; Moosmann, L.; Pazdernik, K.; Pfaff, G.; Pinterits, M.; Poupa, S.; Purzner, M.; Schmid, C.; Schmidt, G.; Schodl, B.; Stranner, G.; Schwaiger, E.; Schwarzl, B.; Titz, M.; Weiss, P. & Zechmeister, A.: Austria's National Inventory Report 2017. Submission under the United Nations Framework Convention on Climate Change. Reports, REP-0608. Umweltbundesamt. Vienna 2017.
Austria’s Informative Inventory Report (IIR) 2017 – References
Umweltbundesamt REP-0609, Vienna 2017 413
UMWELTBUNDESAMT (2017b): Zechmeister, A.; Anderl, M.; Haider, S.; Krutzler, T.; Lampert, C.; Pazdernik, K.; Poupa, S.; Purzner, M.; Schieder, W.; Storch, A. & Stranner, G.: Austria’s National Air Emission Projections 2017 for 2020, 2025 and 2030, Bd. REP-0611. Umweltbundesamt, Wien 2017.
UMWELTBUNDESAMT BERLIN (UBA) (1998): Ermittlung von Emissionen und Minderungsmaßnahmen für POPs in Deutschland. UBA-Texte 74/98, Berlin.
UMWELTBUNDESAMT BERLIN (UBA) (1999): MBA Bericht: Ökologische Vertretbarkeit mechanisch-biologischer Vorbehandlung von Restabfällen. Berlin.
UNITED NATIONS (2010): Report for the Stage 3 in-depth review of emission inventories submitted under the UNECE LRTAP Convention and EU National Emissions Ceilings Directive for: AUSTRIA.
UNTERARBEITSGRUPPE N-ADHOC (2004): Überprüfung und Überarbeitung der N-Anfallswerte für einzelne Tierkategorien. Unterlagen ausgearbeitet vom Fachbeirat für Bodenfruchtbarkeit und Bodenschutz des BMLFUW.
WARTHA (2005) – Life Cycle Inventory Austria 2000 – Review, C. Wartha, Fachhochschulstudiengänge Burgenland GmbH, Pinkafeld 2005.
WIFO – Österreichisches Institut für Wirtschaftsforschung (1996): Volkswirtschaftliche Datenbank. Energiebilanzen 1986–1994. Österreichisches Institut für Wirtschaftsforschung, Wien.
WINDSPERGER, A. & HINTERMEIER, G. (2003): Entschwefelungstechnologien – Die Situation in Österreich. Studie im Auftrag der Umweltbundesamt GmbH. Institut für Industrielle Ökologie, St. Pölten.
WINDSPERGER, A.; MAYR, B.; SCHMIDT-STEJSKAL, H.; ORTHOFER, R. & WINIWARTER, W. (1999): Entwicklung der Schwermetallemissionen – Abschätzung der Emissionen von Blei, Cadmium und Quecksilber für die Jahre 1985, 1990 und 1995 gemäß der CORINAIR-Systematik. Institut für Industrielle Ökologie und Österreichisches Forschungszentrum Seibersdorf, Wien. (not published).
WINDSPERGER, A.; SCHMIDTH-STEJSKAL, H. & STEINLECHNER, S. (2003): Erhebung der IST-Situation und der Struktur der NOx-Emissionen für bestimmte Sektoren der Industrie und Erstellung eines Maßnahmenplanes zur Reduktion der NOx-Emissionen bis 2010. Institut für Industrielle Ökologie, St. Pölten.
WINDSPERGER, A. & TURI, K. (1997): Emissionserhebung der Industrie für 1993 und 1994. Technische Universität Wien. Forschungsinstitut für Chemie und Umwelt, Wien.
WINDSPERGER, S.; STEINLECHNER, H.; SCHMIDT-STEJSKAL, H.; DRAXLER, S.; FISTER, G.; SCHÖNSTEIN, R. &
SCHÖRNER, G. (2002a): Gegenüberstellung und Abgleich der Daten von Top-down zu Bottom-up für Lösungsmittel im Jahr 2000. Institut für Industrielle Ökologie (IIÖ) und Forschungsinstitut für Energie und Umweltplanung. Wirtschaft- und Marktanalysen GmbH (FIEU). Studie im Auftrag des Lebensministeriums und Bundesministeriums für Wirtschaft und Arbeit, Wien.
WINDSPERGER, S.; STEINLECHNER, H.; SCHMIDT-STEJSKAL, H.; DRAXLER, S.; FISTER, G.; SCHÖNSTEIN, R. &
SCHÖRNER, G. (2002b): Verbesserung von Emissionsdaten (Inventur und Projektion bis 2010 für den Bereich Lösungsmittel in Österreich. Institut für Industrielle Ökologie (IIÖ) und Forschungsinstitut für Energie und Umweltplanung. Wirtschaft- und Marktanalysen GmbH (FIEU). Studie im Auftrag des Lebensministeriums und Bundesministeriums für Wirtschaft und Arbeit, Wien.
WINDSPERGER, S.; STEINLECHNER, H.; SCHMIDT-STEJSKAL, H.; DRAXLER, S.; FISTER, G.; SCHÖNSTEIN, R. &
SCHÖRNER, G. (2004): Studie zur Anpassung der Zeitreihe der Lösungsmittelemissionen der österreichischen Luftschadstoffinventur (OLI) 1980–2002. Institut für Industrielle Ökologie (IIÖ) und Forschungsinstitut für Energie und Umweltplanung. Wirtschaft- und Marktanalysen GmbH (FIEU). Studie im Auftrag des Umweltbundesamt, Wien.
Austria’s Informative Inventory Report (IIR) 2017 – References
414 Umweltbundesamt REP-0609, Vienna 2017
WINDSPERGER, S. & SCHMIDT-STEJSKAL, H. (2008): Austria’s Emission Inventory from solvent use 2009. Institut für Industrielle Ökologie (IIÖ). Studie im Auftrag des Umweltbundesamt. Wien. Study has not been published, but can be made available upon request.
WINIWARTER, W.; SCHMIDT-STEJSKAL, H. & WINDSPERGER, A. (2007a): Aktualisierung und methodische Verbesserung der österreichischen Luftschadstoffinventur für Schwebstaub im Auftrag des Umweltbundesamt. ARC–sys–0149, Wien.
WINIWARTER, W. (2007b): Quantifying Uncertainties of the Austrian Greenhouse Gas Inventory, ARC (Austrian Research Centers) Seibersdorf. Research Report ARC-sys-0154. Final report contracted by Umweltbundesamt.
WINIWARTER, W.; BAUER, H.; CASEIRO, A. & PUXBAUM, H. (2009): Quantifying emissions of Primary Biological Aerosol Particle mass in Europe. Atmos. Environ. 43, 1403–1409 (2009).
WINIWARTER, W. & RYPDAL, K. (2001): Assessing the Uncertainty Associated with National Greenhouse Gas Emission Inventories: A Case Study for Austria. Accepted for publication in Atmospheric Environment.
WINIWARTER, W.; SCHMIDT-STEJSKAL, H. & WINDSPERGER, A. (2007): Aktualisierung und methodische Verbesserung der österreichischen Luftschadstoffinventur für Schwebstaub im Auftrag des Umweltbundesamt. ARC–sys–0149, Wien.
WINIWARTER, W. & SCHNEIDER, M. (1995): Abschätzung der Schwermetallemissionen in Österreich. Reports, Bd. UBA-95-108. Umweltbundesamt, Wien.
WINIWARTER, W.; TRENKER, C. & HÖFLINGER, W. (2001): Österreichische Emissionsinventur für Staub. Österreichisches Forschungszentrum Seibersdorf, Wien.
WURST, F. & HÜBNER, C. (1997): Erhebung des PCDD/F-Emissionspotentials für Österreich. Studie im Auftrag des BMWFA.
WURST, F.; PREY, T. & TWRDIK, F. (1994): Studie zum emissionstechnischen Stand der österreichischen Span-plattenindustrie. Umweltbundesamt, Wien.
ZAR – Zentrale Arbeitsgemeinschaft österreichischer Rinderzüchter (2004): Cattle Breeding in Austria. 148pp.
ZESSNER, M. (1999): Bedeutung und Steuerung von Nährstoff- und Schwermetallflüssen des Abwassers. Wiener Mitteilung Band 157. Wien.
Austria’s Informative Inventory Report (IIR) 2017 – Abbreviations
Umweltbundesamt REP-0609, Vienna 2017 415
11 ABBREVIATIONS
AMA ...................... Agrarmarkt Austria
ASFINAG .............. Autobahnen- und Schnellstraßen-Finanzierungs-Aktiengesellschaft
AWMS ................... Animal Waste Management System
BAWP ................... Bundes-Abfallwirtschaftsplan (Federal Waste Management Plan)
BLI ........................ Austrian Air Emission Inventory on federal level (“Bundesländer Luftschadstoff-inventur”)
BMLFUW .............. Bundesministerium für Land- und Forstwirtschaft, Umwelt und Wasserwirtschaft (Federal Ministry for Agriculture, Forestry, Environment and Water Management)
BMUJF .................. Bundesministerium für Umwelt, Jugend und Familie (Federal Ministry for Environment, Youth and Family (before 2000, now domain of Environment: BMLFUW))
BUWAL ................. Bundesamt für Umwelt, Wald und Landschaft. Bern (The Swiss Agency for the Environment, Forests and Landscape (SAEFL), Bern)
CAN ...................... Calcium Ammonium Nitrate (Fertilizer)
CORINAIR ............ Core Inventory Air
CORINE ................ Coordination d´information Environmentale
CRF ...................... Common Reporting Format
DKDB .................... Dampfkesseldatenbank (Austrian annual steam boiler inventory)
EC ......................... European Community
EDM ...................... Electronic Data Management
EEA ....................... European Environment Agency
EIONET ................ European Environment Information and Observation NETwork
EMEP .................... Cooperative Programme for Monitoring and Evaluation of the Long-range Transmission of Air Pollutants in Europe
ETS ....................... Emission Trading System
EPER .................... European Pollutant Emission Register
E-PRTR ................ European Pollutant Release and Transfer Register
GDP ...................... Gross Domestic Product
GLOBEMI ............. Globale Modellbildung für Emissions- und Verbrauchsszenarien im Verkehrssektor ((Global Modelling for Emission- and Fuel consumption Scenarios of the Transport Sector) see (Hausberger 1998))
GPG ...................... Good Practice Guidance (of the IPCC)
HBEFA .................. “Handbook of Emission Factors”
HM ........................ Heavy Metals
IEA ........................ International Energy Agency
IEF ........................ Implied emission factor
IFR ........................ Instrument Flight Rules
IIR ......................... Informative Inventory Report
IPCC ..................... Intergovernmental Panel on Climate Change
Austria’s Informative Inventory Report (IIR) 2017 – Abbreviations
416 Umweltbundesamt REP-0609, Vienna 2017
LTO ....................... Landing/Take-Off cycle
MCF ...................... Methane Conversion Factor
MEET .................... MEET – Methodology for calculating transport emissions and energy consumption
NACE .................... Nomenclature des activites economiques de la Communaute Europeenne
NAPFUE ............... Nomenclature for Air Pollution Fuels
NEC ...................... National Emissions Ceiling (Directive 2001/81/EC of The European Parliament and of the Council of 23 October 2001 on national emission ceilings for certain atmospheric pollutants – NEC Directive)
NEMO ................... Network Emission Model
NFR ...................... Nomenclature for Reporting (Format of Reporting under the UNECE/LRTAP Conven-tion)
NIR ........................ National Inventory Report (Submission under the United Nations Framework Conven-tion on Climate Change)
NISA ..................... National Inventory System Austria
NPK.......................Nitrogen (N) Phosphorus (P) and Potassium (K) (Fertilizer)
OECD ................... Organisation for Economic Co-operation and Development
ODS ...................... Ozone depleting substances
OLI ........................ Österreichische Luftschadstoff InventurAustrian Air Emission Inventory
PHARE ................. Phare is the acronym of the Programme’s original name: ’Poland and Hungary: Action for the Restructuring of the Economy’. It covers now 14 partner countries: Albania, Bosnia and Herzegovina, Bulgaria, Croatia, the Czech Republic, Estonia, the Former Yugoslav Republic of Macedonia (FYROM), Hungary, Latvia, Lithuania, Poland, Ro-mania, Slovakia and Slovenia, (However, Croatia was suspended from the Phare Pro-gramme in July 1995.)
PM ........................ Particulate Matter
POP ...................... Persistent Organic Pollutants
PRTR .................... Pollutant Release and Transfer Register
QA/QC .................. Quality Assurance/Quality Control
QMS ...................... Quality Management System
RWA ..................... Raiffeisen Ware Austria (see www.rwa.at)
SNAP .................... Selected Nomenclature on Air Pollutants
SOP ...................... Standard Operation Procedure
TAN ....................... Total ammoniacal nitrogen
Umweltbundesamt..Umweltbundesamt (Environment Agency Austria)
UNECE/LRTAP ..... United Nations Economic Commission for Europe.Convention on Long-range Trans-boundary Air Pollution
UNFCCC ............... United Nations Framework Convention on Climate Change
VFR ....................... Visual Flight Rules
VRF ....................... Variable Refrigerant Flow
VMOe .................... Verkehrs-Mengenmodell-Oesterreich
WIFO .................... Wirtschaftsforschungsinstitut (Austrian Institute for Economic Research)
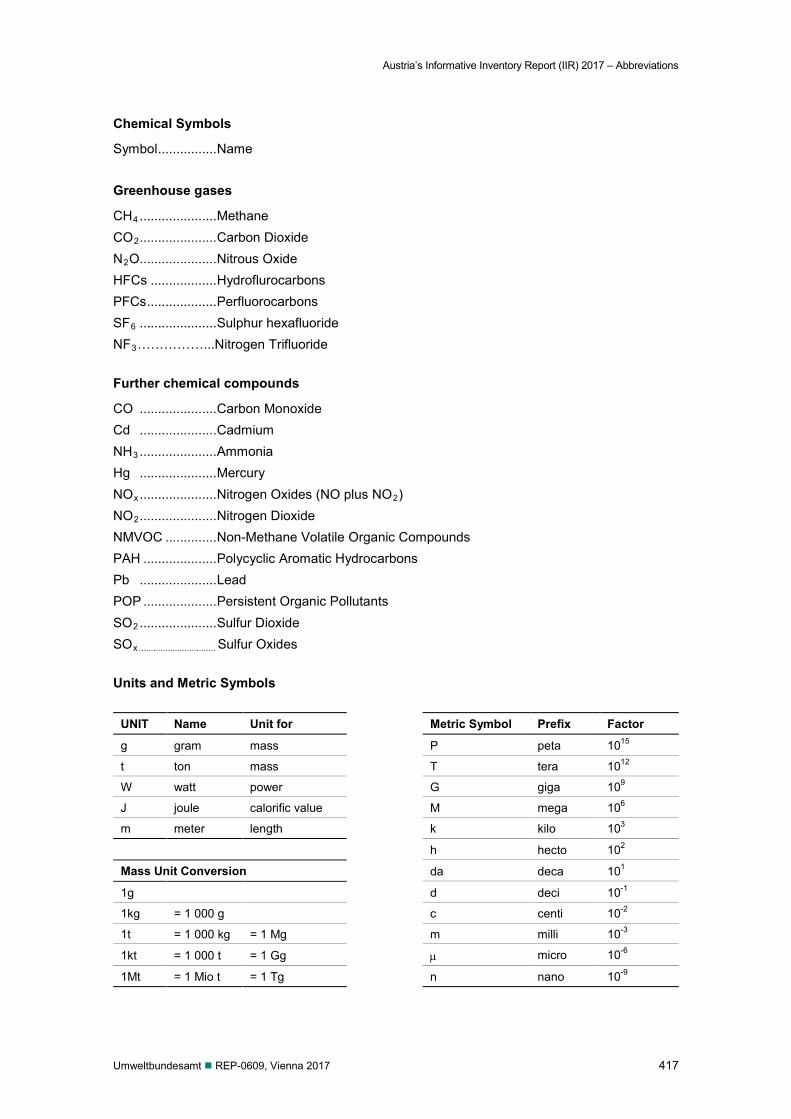
Austria’s Informative Inventory Report (IIR) 2017 – Abbreviations
Umweltbundesamt REP-0609, Vienna 2017 417
Chemical Symbols
Symbol ................ Name
Greenhouse gases
CH4 ..................... Methane CO2..................... Carbon Dioxide N2O..................... Nitrous Oxide HFCs .................. Hydroflurocarbons PFCs ................... Perfluorocarbons SF6 ..................... Sulphur hexafluoride NF3……………...Nitrogen Trifluoride Further chemical compounds
CO ..................... Carbon Monoxide Cd ..................... Cadmium NH3 ..................... Ammonia Hg ..................... Mercury NOx ..................... Nitrogen Oxides (NO plus NO2) NO2..................... Nitrogen Dioxide NMVOC .............. Non-Methane Volatile Organic Compounds PAH .................... Polycyclic Aromatic Hydrocarbons Pb ..................... Lead POP .................... Persistent Organic Pollutants SO2 ..................... Sulfur Dioxide SOx ................................ Sulfur Oxides Units and Metric Symbols
UNIT Name Unit for Metric Symbol Prefix Factor
g gram mass P peta 1015
t ton mass T tera 1012
W watt power G giga 109
J joule calorific value M mega 106
m meter length k kilo 103
h hecto 102
Mass Unit Conversion da deca 101
1g d deci 10-1
1kg = 1 000 g c centi 10-2
1t = 1 000 kg = 1 Mg m milli 10-3
1kt = 1 000 t = 1 Gg µ micro 10-6
1Mt = 1 Mio t = 1 Tg n nano 10-9
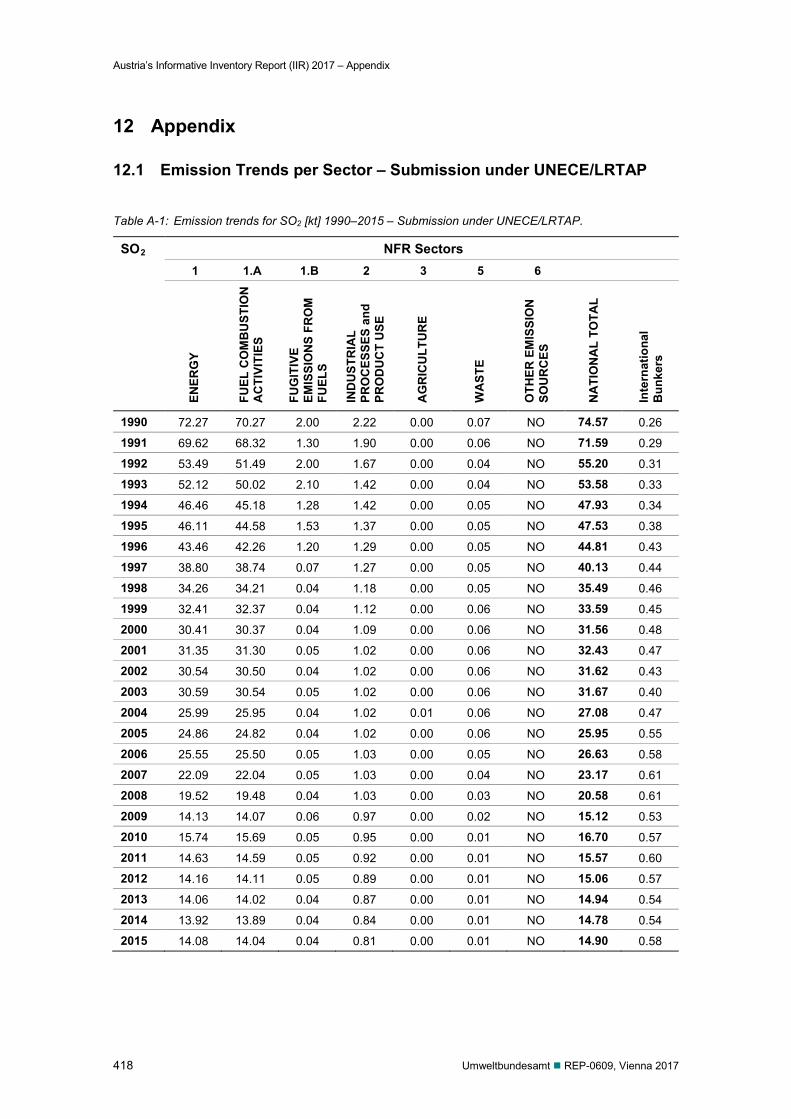
Austria’s Informative Inventory Report (IIR) 2017 – Appendix
418 Umweltbundesamt REP-0609, Vienna 2017
12 Appendix
12.1 Emission Trends per Sector – Submission under UNECE/LRTAP
Table A-1: Emission trends for SO2 [kt] 1990–2015 – Submission under UNECE/LRTAP.
SO2 NFR Sectors 1 1.A 1.B 2 3 5 6
ENER
GY
FUEL
CO
MB
UST
ION
A
CTI
VITI
ES
FUG
ITIV
E EM
ISSI
ON
S FR
OM
FU
ELS
IND
UST
RIA
L PR
OC
ESSE
S an
d PR
OD
UC
T U
SE
AG
RIC
ULT
UR
E
WA
STE
OTH
ER E
MIS
SIO
N
SOU
RC
ES
NA
TIO
NA
L TO
TAL
Inte
rnat
iona
l B
unke
rs
1990 72.27 70.27 2.00 2.22 0.00 0.07 NO 74.57 0.26
1991 69.62 68.32 1.30 1.90 0.00 0.06 NO 71.59 0.29
1992 53.49 51.49 2.00 1.67 0.00 0.04 NO 55.20 0.31
1993 52.12 50.02 2.10 1.42 0.00 0.04 NO 53.58 0.33
1994 46.46 45.18 1.28 1.42 0.00 0.05 NO 47.93 0.34
1995 46.11 44.58 1.53 1.37 0.00 0.05 NO 47.53 0.38
1996 43.46 42.26 1.20 1.29 0.00 0.05 NO 44.81 0.43
1997 38.80 38.74 0.07 1.27 0.00 0.05 NO 40.13 0.44
1998 34.26 34.21 0.04 1.18 0.00 0.05 NO 35.49 0.46
1999 32.41 32.37 0.04 1.12 0.00 0.06 NO 33.59 0.45
2000 30.41 30.37 0.04 1.09 0.00 0.06 NO 31.56 0.48
2001 31.35 31.30 0.05 1.02 0.00 0.06 NO 32.43 0.47
2002 30.54 30.50 0.04 1.02 0.00 0.06 NO 31.62 0.43
2003 30.59 30.54 0.05 1.02 0.00 0.06 NO 31.67 0.40
2004 25.99 25.95 0.04 1.02 0.01 0.06 NO 27.08 0.47
2005 24.86 24.82 0.04 1.02 0.00 0.06 NO 25.95 0.55
2006 25.55 25.50 0.05 1.03 0.00 0.05 NO 26.63 0.58
2007 22.09 22.04 0.05 1.03 0.00 0.04 NO 23.17 0.61
2008 19.52 19.48 0.04 1.03 0.00 0.03 NO 20.58 0.61
2009 14.13 14.07 0.06 0.97 0.00 0.02 NO 15.12 0.53
2010 15.74 15.69 0.05 0.95 0.00 0.01 NO 16.70 0.57
2011 14.63 14.59 0.05 0.92 0.00 0.01 NO 15.57 0.60
2012 14.16 14.11 0.05 0.89 0.00 0.01 NO 15.06 0.57
2013 14.06 14.02 0.04 0.87 0.00 0.01 NO 14.94 0.54
2014 13.92 13.89 0.04 0.84 0.00 0.01 NO 14.78 0.54
2015 14.08 14.04 0.04 0.81 0.00 0.01 NO 14.90 0.58
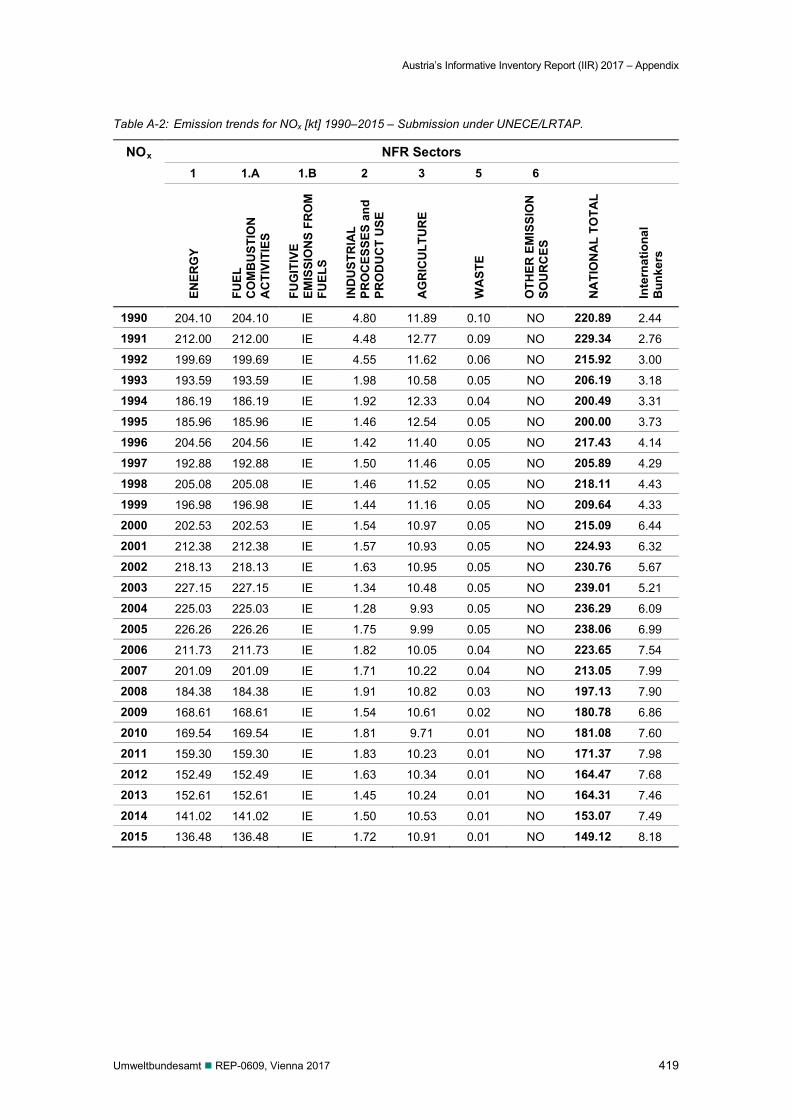
Austria’s Informative Inventory Report (IIR) 2017 – Appendix
Umweltbundesamt REP-0609, Vienna 2017 419
Table A-2: Emission trends for NOx [kt] 1990–2015 – Submission under UNECE/LRTAP.
NOx NFR Sectors 1 1.A 1.B 2 3 5 6
ENER
GY
FUEL
C
OM
BU
STIO
N
AC
TIVI
TIES
FUG
ITIV
E EM
ISSI
ON
S FR
OM
FU
ELS
IND
UST
RIA
L PR
OC
ESSE
S an
d PR
OD
UC
T U
SE
AG
RIC
ULT
UR
E
WA
STE
OTH
ER E
MIS
SIO
N
SOU
RC
ES
NA
TIO
NA
L TO
TAL
Inte
rnat
iona
l
Bun
kers
1990 204.10 204.10 IE 4.80 11.89 0.10 NO 220.89 2.44
1991 212.00 212.00 IE 4.48 12.77 0.09 NO 229.34 2.76
1992 199.69 199.69 IE 4.55 11.62 0.06 NO 215.92 3.00
1993 193.59 193.59 IE 1.98 10.58 0.05 NO 206.19 3.18
1994 186.19 186.19 IE 1.92 12.33 0.04 NO 200.49 3.31
1995 185.96 185.96 IE 1.46 12.54 0.05 NO 200.00 3.73
1996 204.56 204.56 IE 1.42 11.40 0.05 NO 217.43 4.14
1997 192.88 192.88 IE 1.50 11.46 0.05 NO 205.89 4.29
1998 205.08 205.08 IE 1.46 11.52 0.05 NO 218.11 4.43
1999 196.98 196.98 IE 1.44 11.16 0.05 NO 209.64 4.33
2000 202.53 202.53 IE 1.54 10.97 0.05 NO 215.09 6.44
2001 212.38 212.38 IE 1.57 10.93 0.05 NO 224.93 6.32
2002 218.13 218.13 IE 1.63 10.95 0.05 NO 230.76 5.67
2003 227.15 227.15 IE 1.34 10.48 0.05 NO 239.01 5.21
2004 225.03 225.03 IE 1.28 9.93 0.05 NO 236.29 6.09
2005 226.26 226.26 IE 1.75 9.99 0.05 NO 238.06 6.99
2006 211.73 211.73 IE 1.82 10.05 0.04 NO 223.65 7.54
2007 201.09 201.09 IE 1.71 10.22 0.04 NO 213.05 7.99
2008 184.38 184.38 IE 1.91 10.82 0.03 NO 197.13 7.90
2009 168.61 168.61 IE 1.54 10.61 0.02 NO 180.78 6.86
2010 169.54 169.54 IE 1.81 9.71 0.01 NO 181.08 7.60
2011 159.30 159.30 IE 1.83 10.23 0.01 NO 171.37 7.98
2012 152.49 152.49 IE 1.63 10.34 0.01 NO 164.47 7.68
2013 152.61 152.61 IE 1.45 10.24 0.01 NO 164.31 7.46
2014 141.02 141.02 IE 1.50 10.53 0.01 NO 153.07 7.49
2015 136.48 136.48 IE 1.72 10.91 0.01 NO 149.12 8.18
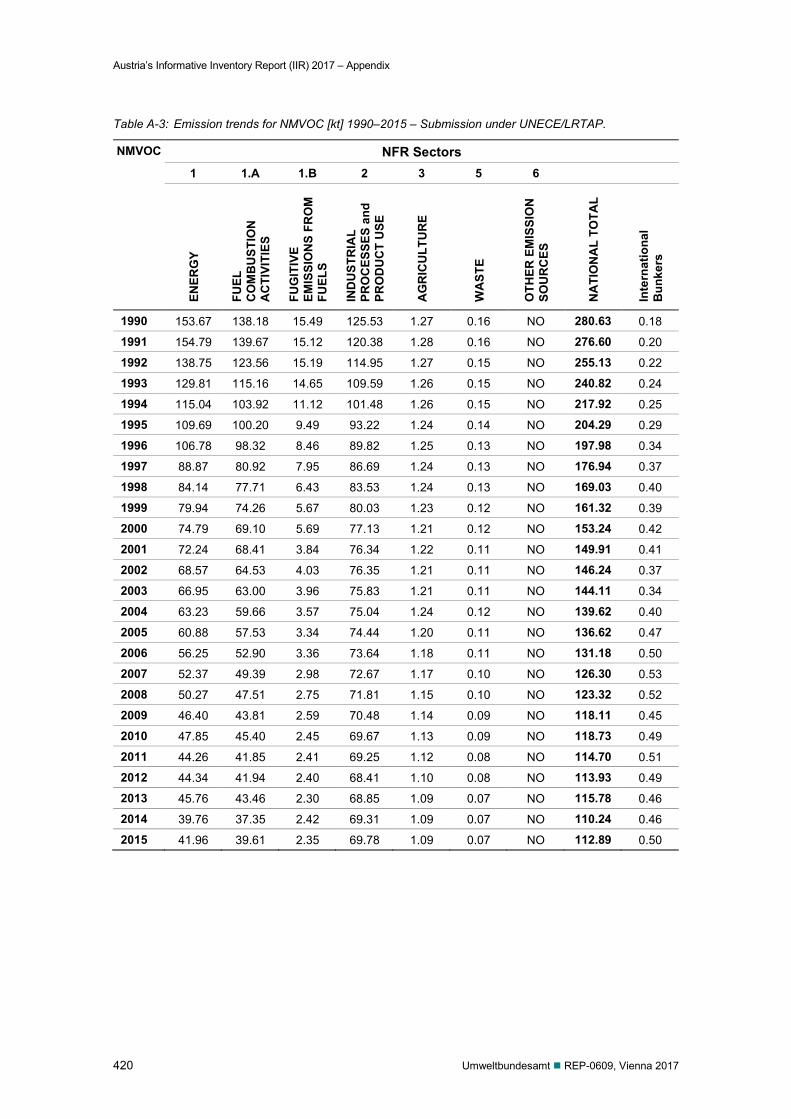
Austria’s Informative Inventory Report (IIR) 2017 – Appendix
420 Umweltbundesamt REP-0609, Vienna 2017
Table A-3: Emission trends for NMVOC [kt] 1990–2015 – Submission under UNECE/LRTAP.
NMVOC NFR Sectors 1 1.A 1.B 2 3 5 6
ENER
GY
FUEL
C
OM
BU
STIO
N
AC
TIVI
TIES
FUG
ITIV
E EM
ISSI
ON
S FR
OM
FU
ELS
IND
UST
RIA
L PR
OC
ESSE
S an
d PR
OD
UC
T U
SE
AG
RIC
ULT
UR
E
WA
STE
OTH
ER E
MIS
SIO
N
SOU
RC
ES
NA
TIO
NA
L TO
TAL
Inte
rnat
iona
l
Bun
kers
1990 153.67 138.18 15.49 125.53 1.27 0.16 NO 280.63 0.18
1991 154.79 139.67 15.12 120.38 1.28 0.16 NO 276.60 0.20
1992 138.75 123.56 15.19 114.95 1.27 0.15 NO 255.13 0.22
1993 129.81 115.16 14.65 109.59 1.26 0.15 NO 240.82 0.24
1994 115.04 103.92 11.12 101.48 1.26 0.15 NO 217.92 0.25
1995 109.69 100.20 9.49 93.22 1.24 0.14 NO 204.29 0.29
1996 106.78 98.32 8.46 89.82 1.25 0.13 NO 197.98 0.34
1997 88.87 80.92 7.95 86.69 1.24 0.13 NO 176.94 0.37
1998 84.14 77.71 6.43 83.53 1.24 0.13 NO 169.03 0.40
1999 79.94 74.26 5.67 80.03 1.23 0.12 NO 161.32 0.39
2000 74.79 69.10 5.69 77.13 1.21 0.12 NO 153.24 0.42
2001 72.24 68.41 3.84 76.34 1.22 0.11 NO 149.91 0.41
2002 68.57 64.53 4.03 76.35 1.21 0.11 NO 146.24 0.37
2003 66.95 63.00 3.96 75.83 1.21 0.11 NO 144.11 0.34
2004 63.23 59.66 3.57 75.04 1.24 0.12 NO 139.62 0.40
2005 60.88 57.53 3.34 74.44 1.20 0.11 NO 136.62 0.47
2006 56.25 52.90 3.36 73.64 1.18 0.11 NO 131.18 0.50
2007 52.37 49.39 2.98 72.67 1.17 0.10 NO 126.30 0.53
2008 50.27 47.51 2.75 71.81 1.15 0.10 NO 123.32 0.52
2009 46.40 43.81 2.59 70.48 1.14 0.09 NO 118.11 0.45
2010 47.85 45.40 2.45 69.67 1.13 0.09 NO 118.73 0.49
2011 44.26 41.85 2.41 69.25 1.12 0.08 NO 114.70 0.51
2012 44.34 41.94 2.40 68.41 1.10 0.08 NO 113.93 0.49
2013 45.76 43.46 2.30 68.85 1.09 0.07 NO 115.78 0.46
2014 39.76 37.35 2.42 69.31 1.09 0.07 NO 110.24 0.46
2015 41.96 39.61 2.35 69.78 1.09 0.07 NO 112.89 0.50
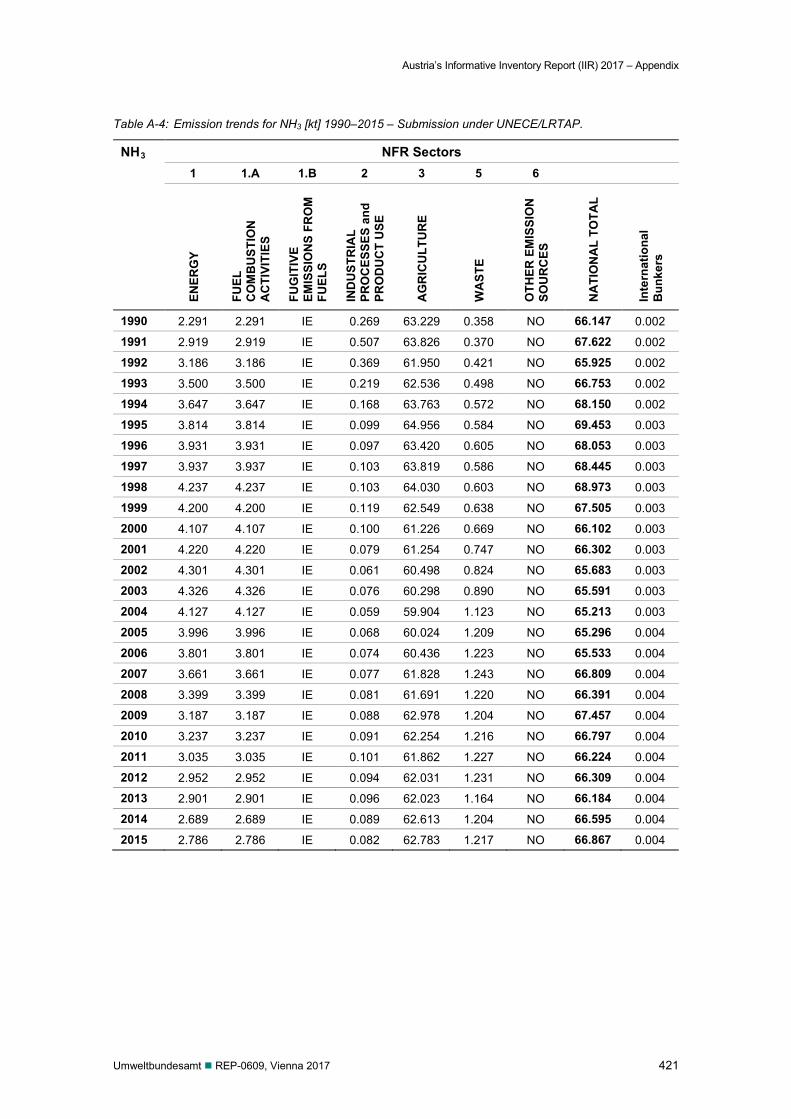
Austria’s Informative Inventory Report (IIR) 2017 – Appendix
Umweltbundesamt REP-0609, Vienna 2017 421
Table A-4: Emission trends for NH3 [kt] 1990–2015 – Submission under UNECE/LRTAP.
NH3 NFR Sectors 1 1.A 1.B 2 3 5 6
ENER
GY
FUEL
C
OM
BU
STIO
N
AC
TIVI
TIES
FUG
ITIV
E EM
ISSI
ON
S FR
OM
FU
ELS
IND
UST
RIA
L PR
OC
ESSE
S an
d PR
OD
UC
T U
SE
AG
RIC
ULT
UR
E
WA
STE
OTH
ER E
MIS
SIO
N
SOU
RC
ES
NA
TIO
NA
L TO
TAL
Inte
rnat
iona
l
Bun
kers
1990 2.291 2.291 IE 0.269 63.229 0.358 NO 66.147 0.002
1991 2.919 2.919 IE 0.507 63.826 0.370 NO 67.622 0.002
1992 3.186 3.186 IE 0.369 61.950 0.421 NO 65.925 0.002
1993 3.500 3.500 IE 0.219 62.536 0.498 NO 66.753 0.002
1994 3.647 3.647 IE 0.168 63.763 0.572 NO 68.150 0.002
1995 3.814 3.814 IE 0.099 64.956 0.584 NO 69.453 0.003
1996 3.931 3.931 IE 0.097 63.420 0.605 NO 68.053 0.003
1997 3.937 3.937 IE 0.103 63.819 0.586 NO 68.445 0.003
1998 4.237 4.237 IE 0.103 64.030 0.603 NO 68.973 0.003
1999 4.200 4.200 IE 0.119 62.549 0.638 NO 67.505 0.003
2000 4.107 4.107 IE 0.100 61.226 0.669 NO 66.102 0.003
2001 4.220 4.220 IE 0.079 61.254 0.747 NO 66.302 0.003
2002 4.301 4.301 IE 0.061 60.498 0.824 NO 65.683 0.003
2003 4.326 4.326 IE 0.076 60.298 0.890 NO 65.591 0.003
2004 4.127 4.127 IE 0.059 59.904 1.123 NO 65.213 0.003
2005 3.996 3.996 IE 0.068 60.024 1.209 NO 65.296 0.004
2006 3.801 3.801 IE 0.074 60.436 1.223 NO 65.533 0.004
2007 3.661 3.661 IE 0.077 61.828 1.243 NO 66.809 0.004
2008 3.399 3.399 IE 0.081 61.691 1.220 NO 66.391 0.004
2009 3.187 3.187 IE 0.088 62.978 1.204 NO 67.457 0.004
2010 3.237 3.237 IE 0.091 62.254 1.216 NO 66.797 0.004
2011 3.035 3.035 IE 0.101 61.862 1.227 NO 66.224 0.004
2012 2.952 2.952 IE 0.094 62.031 1.231 NO 66.309 0.004
2013 2.901 2.901 IE 0.096 62.023 1.164 NO 66.184 0.004
2014 2.689 2.689 IE 0.089 62.613 1.204 NO 66.595 0.004
2015 2.786 2.786 IE 0.082 62.783 1.217 NO 66.867 0.004
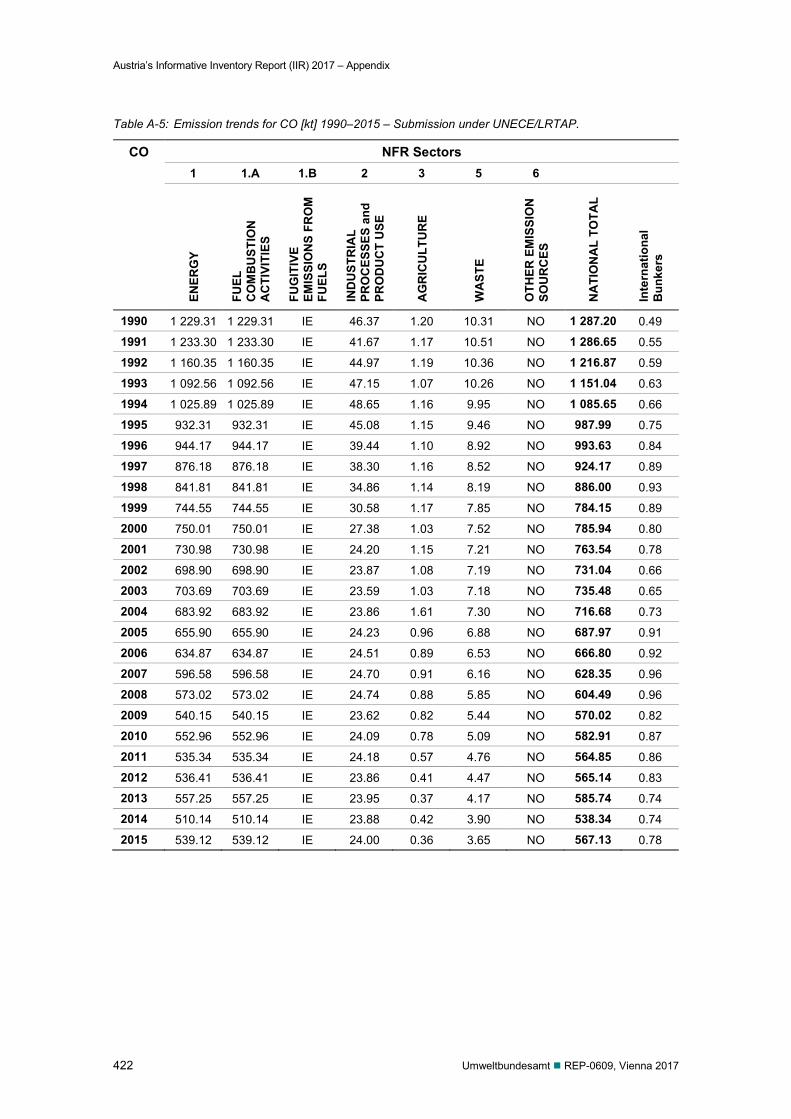
Austria’s Informative Inventory Report (IIR) 2017 – Appendix
422 Umweltbundesamt REP-0609, Vienna 2017
Table A-5: Emission trends for CO [kt] 1990–2015 – Submission under UNECE/LRTAP.
CO NFR Sectors 1 1.A 1.B 2 3 5 6
ENER
GY
FUEL
C
OM
BU
STIO
N
AC
TIVI
TIES
FUG
ITIV
E EM
ISSI
ON
S FR
OM
FU
ELS
IND
UST
RIA
L PR
OC
ESSE
S an
d PR
OD
UC
T U
SE
AG
RIC
ULT
UR
E
WA
STE
OTH
ER E
MIS
SIO
N
SOU
RC
ES
NA
TIO
NA
L TO
TAL
Inte
rnat
iona
l
Bun
kers
1990 1 229.31 1 229.31 IE 46.37 1.20 10.31 NO 1 287.20 0.49
1991 1 233.30 1 233.30 IE 41.67 1.17 10.51 NO 1 286.65 0.55
1992 1 160.35 1 160.35 IE 44.97 1.19 10.36 NO 1 216.87 0.59
1993 1 092.56 1 092.56 IE 47.15 1.07 10.26 NO 1 151.04 0.63
1994 1 025.89 1 025.89 IE 48.65 1.16 9.95 NO 1 085.65 0.66
1995 932.31 932.31 IE 45.08 1.15 9.46 NO 987.99 0.75
1996 944.17 944.17 IE 39.44 1.10 8.92 NO 993.63 0.84
1997 876.18 876.18 IE 38.30 1.16 8.52 NO 924.17 0.89
1998 841.81 841.81 IE 34.86 1.14 8.19 NO 886.00 0.93
1999 744.55 744.55 IE 30.58 1.17 7.85 NO 784.15 0.89
2000 750.01 750.01 IE 27.38 1.03 7.52 NO 785.94 0.80
2001 730.98 730.98 IE 24.20 1.15 7.21 NO 763.54 0.78
2002 698.90 698.90 IE 23.87 1.08 7.19 NO 731.04 0.66
2003 703.69 703.69 IE 23.59 1.03 7.18 NO 735.48 0.65
2004 683.92 683.92 IE 23.86 1.61 7.30 NO 716.68 0.73
2005 655.90 655.90 IE 24.23 0.96 6.88 NO 687.97 0.91
2006 634.87 634.87 IE 24.51 0.89 6.53 NO 666.80 0.92
2007 596.58 596.58 IE 24.70 0.91 6.16 NO 628.35 0.96
2008 573.02 573.02 IE 24.74 0.88 5.85 NO 604.49 0.96
2009 540.15 540.15 IE 23.62 0.82 5.44 NO 570.02 0.82
2010 552.96 552.96 IE 24.09 0.78 5.09 NO 582.91 0.87
2011 535.34 535.34 IE 24.18 0.57 4.76 NO 564.85 0.86
2012 536.41 536.41 IE 23.86 0.41 4.47 NO 565.14 0.83
2013 557.25 557.25 IE 23.95 0.37 4.17 NO 585.74 0.74
2014 510.14 510.14 IE 23.88 0.42 3.90 NO 538.34 0.74
2015 539.12 539.12 IE 24.00 0.36 3.65 NO 567.13 0.78
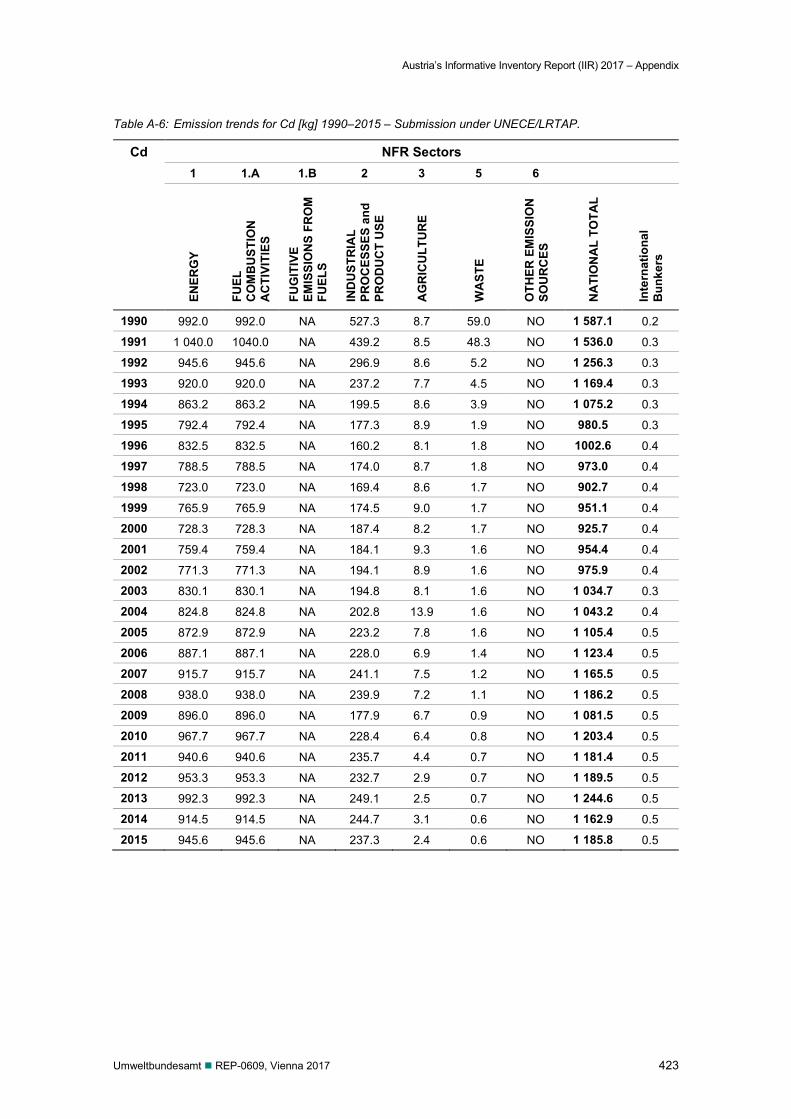
Austria’s Informative Inventory Report (IIR) 2017 – Appendix
Umweltbundesamt REP-0609, Vienna 2017 423
Table A-6: Emission trends for Cd [kg] 1990–2015 – Submission under UNECE/LRTAP.
Cd NFR Sectors 1 1.A 1.B 2 3 5 6
ENER
GY
FUEL
C
OM
BU
STIO
N
AC
TIVI
TIES
FUG
ITIV
E EM
ISSI
ON
S FR
OM
FU
ELS
IND
UST
RIA
L PR
OC
ESSE
S an
d PR
OD
UC
T U
SE
AG
RIC
ULT
UR
E
WA
STE
OTH
ER E
MIS
SIO
N
SOU
RC
ES
NA
TIO
NA
L TO
TAL
Inte
rnat
iona
l
Bun
kers
1990 992.0 992.0 NA 527.3 8.7 59.0 NO 1 587.1 0.2
1991 1 040.0 1040.0 NA 439.2 8.5 48.3 NO 1 536.0 0.3
1992 945.6 945.6 NA 296.9 8.6 5.2 NO 1 256.3 0.3
1993 920.0 920.0 NA 237.2 7.7 4.5 NO 1 169.4 0.3
1994 863.2 863.2 NA 199.5 8.6 3.9 NO 1 075.2 0.3
1995 792.4 792.4 NA 177.3 8.9 1.9 NO 980.5 0.3
1996 832.5 832.5 NA 160.2 8.1 1.8 NO 1002.6 0.4
1997 788.5 788.5 NA 174.0 8.7 1.8 NO 973.0 0.4
1998 723.0 723.0 NA 169.4 8.6 1.7 NO 902.7 0.4
1999 765.9 765.9 NA 174.5 9.0 1.7 NO 951.1 0.4
2000 728.3 728.3 NA 187.4 8.2 1.7 NO 925.7 0.4
2001 759.4 759.4 NA 184.1 9.3 1.6 NO 954.4 0.4
2002 771.3 771.3 NA 194.1 8.9 1.6 NO 975.9 0.4
2003 830.1 830.1 NA 194.8 8.1 1.6 NO 1 034.7 0.3
2004 824.8 824.8 NA 202.8 13.9 1.6 NO 1 043.2 0.4
2005 872.9 872.9 NA 223.2 7.8 1.6 NO 1 105.4 0.5
2006 887.1 887.1 NA 228.0 6.9 1.4 NO 1 123.4 0.5
2007 915.7 915.7 NA 241.1 7.5 1.2 NO 1 165.5 0.5
2008 938.0 938.0 NA 239.9 7.2 1.1 NO 1 186.2 0.5
2009 896.0 896.0 NA 177.9 6.7 0.9 NO 1 081.5 0.5
2010 967.7 967.7 NA 228.4 6.4 0.8 NO 1 203.4 0.5
2011 940.6 940.6 NA 235.7 4.4 0.7 NO 1 181.4 0.5
2012 953.3 953.3 NA 232.7 2.9 0.7 NO 1 189.5 0.5
2013 992.3 992.3 NA 249.1 2.5 0.7 NO 1 244.6 0.5
2014 914.5 914.5 NA 244.7 3.1 0.6 NO 1 162.9 0.5
2015 945.6 945.6 NA 237.3 2.4 0.6 NO 1 185.8 0.5
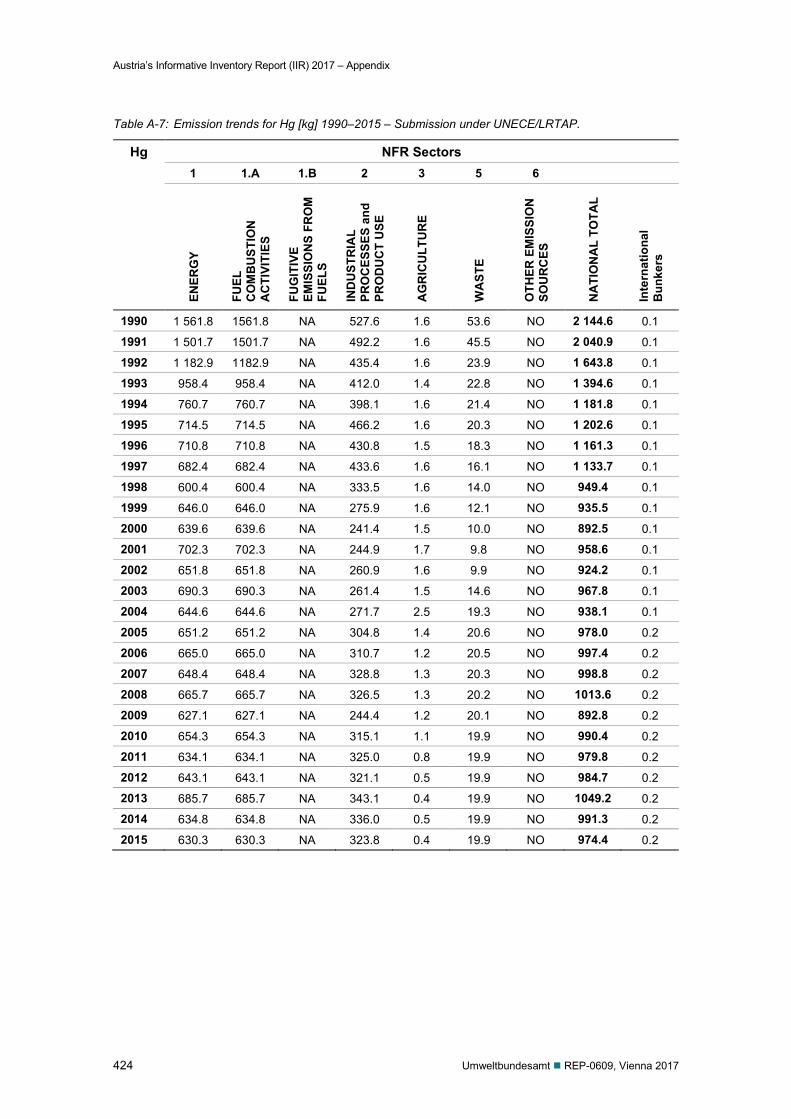
Austria’s Informative Inventory Report (IIR) 2017 – Appendix
424 Umweltbundesamt REP-0609, Vienna 2017
Table A-7: Emission trends for Hg [kg] 1990–2015 – Submission under UNECE/LRTAP.
Hg NFR Sectors 1 1.A 1.B 2 3 5 6
ENER
GY
FUEL
C
OM
BU
STIO
N
AC
TIVI
TIES
FUG
ITIV
E EM
ISSI
ON
S FR
OM
FU
ELS
IND
UST
RIA
L PR
OC
ESSE
S an
d PR
OD
UC
T U
SE
AG
RIC
ULT
UR
E
WA
STE
OTH
ER E
MIS
SIO
N
SOU
RC
ES
NA
TIO
NA
L TO
TAL
Inte
rnat
iona
l
Bun
kers
1990 1 561.8 1561.8 NA 527.6 1.6 53.6 NO 2 144.6 0.1
1991 1 501.7 1501.7 NA 492.2 1.6 45.5 NO 2 040.9 0.1
1992 1 182.9 1182.9 NA 435.4 1.6 23.9 NO 1 643.8 0.1
1993 958.4 958.4 NA 412.0 1.4 22.8 NO 1 394.6 0.1
1994 760.7 760.7 NA 398.1 1.6 21.4 NO 1 181.8 0.1
1995 714.5 714.5 NA 466.2 1.6 20.3 NO 1 202.6 0.1
1996 710.8 710.8 NA 430.8 1.5 18.3 NO 1 161.3 0.1
1997 682.4 682.4 NA 433.6 1.6 16.1 NO 1 133.7 0.1
1998 600.4 600.4 NA 333.5 1.6 14.0 NO 949.4 0.1
1999 646.0 646.0 NA 275.9 1.6 12.1 NO 935.5 0.1
2000 639.6 639.6 NA 241.4 1.5 10.0 NO 892.5 0.1
2001 702.3 702.3 NA 244.9 1.7 9.8 NO 958.6 0.1
2002 651.8 651.8 NA 260.9 1.6 9.9 NO 924.2 0.1
2003 690.3 690.3 NA 261.4 1.5 14.6 NO 967.8 0.1
2004 644.6 644.6 NA 271.7 2.5 19.3 NO 938.1 0.1
2005 651.2 651.2 NA 304.8 1.4 20.6 NO 978.0 0.2
2006 665.0 665.0 NA 310.7 1.2 20.5 NO 997.4 0.2
2007 648.4 648.4 NA 328.8 1.3 20.3 NO 998.8 0.2
2008 665.7 665.7 NA 326.5 1.3 20.2 NO 1013.6 0.2
2009 627.1 627.1 NA 244.4 1.2 20.1 NO 892.8 0.2
2010 654.3 654.3 NA 315.1 1.1 19.9 NO 990.4 0.2
2011 634.1 634.1 NA 325.0 0.8 19.9 NO 979.8 0.2
2012 643.1 643.1 NA 321.1 0.5 19.9 NO 984.7 0.2
2013 685.7 685.7 NA 343.1 0.4 19.9 NO 1049.2 0.2
2014 634.8 634.8 NA 336.0 0.5 19.9 NO 991.3 0.2
2015 630.3 630.3 NA 323.8 0.4 19.9 NO 974.4 0.2
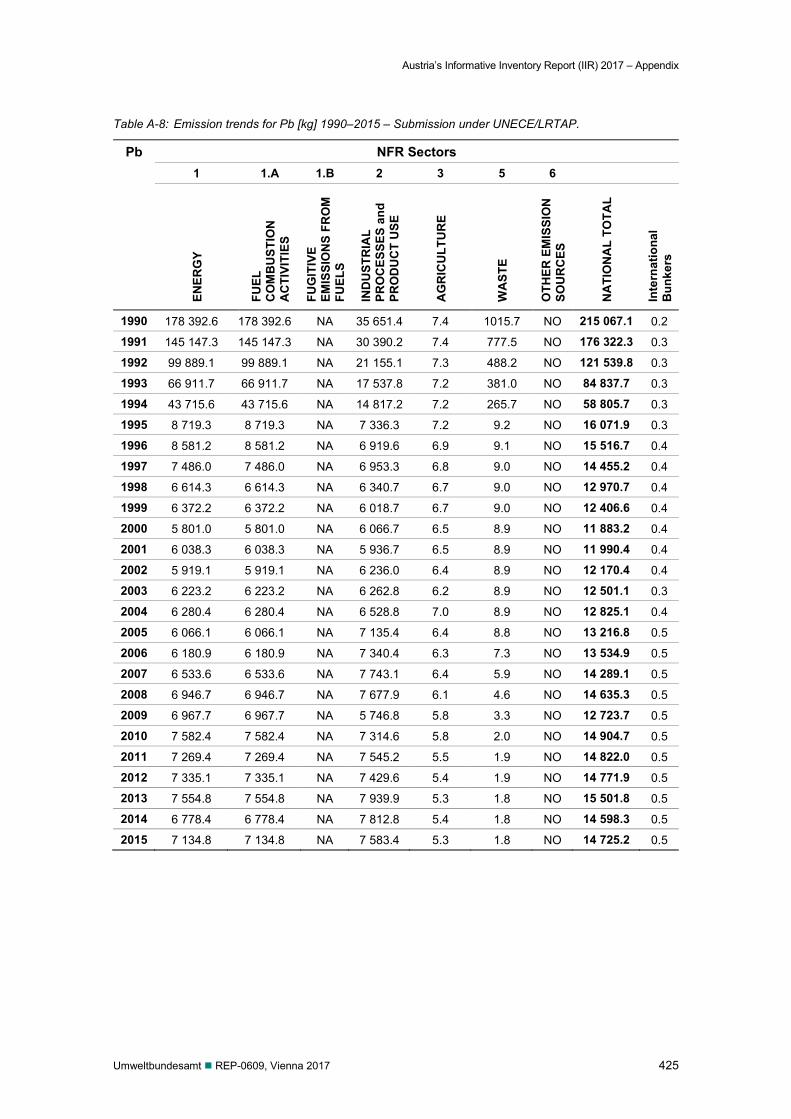
Austria’s Informative Inventory Report (IIR) 2017 – Appendix
Umweltbundesamt REP-0609, Vienna 2017 425
Table A-8: Emission trends for Pb [kg] 1990–2015 – Submission under UNECE/LRTAP.
Pb NFR Sectors 1 1.A 1.B 2 3 5 6
ENER
GY
FUEL
C
OM
BU
STIO
N
AC
TIVI
TIES
FUG
ITIV
E EM
ISSI
ON
S FR
OM
FU
ELS
IND
UST
RIA
L PR
OC
ESSE
S an
d PR
OD
UC
T U
SE
AG
RIC
ULT
UR
E
WA
STE
OTH
ER E
MIS
SIO
N
SOU
RC
ES
NA
TIO
NA
L TO
TAL
Inte
rnat
iona
l
Bun
kers
1990 178 392.6 178 392.6 NA 35 651.4 7.4 1015.7 NO 215 067.1 0.2
1991 145 147.3 145 147.3 NA 30 390.2 7.4 777.5 NO 176 322.3 0.3
1992 99 889.1 99 889.1 NA 21 155.1 7.3 488.2 NO 121 539.8 0.3
1993 66 911.7 66 911.7 NA 17 537.8 7.2 381.0 NO 84 837.7 0.3
1994 43 715.6 43 715.6 NA 14 817.2 7.2 265.7 NO 58 805.7 0.3
1995 8 719.3 8 719.3 NA 7 336.3 7.2 9.2 NO 16 071.9 0.3
1996 8 581.2 8 581.2 NA 6 919.6 6.9 9.1 NO 15 516.7 0.4
1997 7 486.0 7 486.0 NA 6 953.3 6.8 9.0 NO 14 455.2 0.4
1998 6 614.3 6 614.3 NA 6 340.7 6.7 9.0 NO 12 970.7 0.4
1999 6 372.2 6 372.2 NA 6 018.7 6.7 9.0 NO 12 406.6 0.4
2000 5 801.0 5 801.0 NA 6 066.7 6.5 8.9 NO 11 883.2 0.4
2001 6 038.3 6 038.3 NA 5 936.7 6.5 8.9 NO 11 990.4 0.4
2002 5 919.1 5 919.1 NA 6 236.0 6.4 8.9 NO 12 170.4 0.4
2003 6 223.2 6 223.2 NA 6 262.8 6.2 8.9 NO 12 501.1 0.3
2004 6 280.4 6 280.4 NA 6 528.8 7.0 8.9 NO 12 825.1 0.4
2005 6 066.1 6 066.1 NA 7 135.4 6.4 8.8 NO 13 216.8 0.5
2006 6 180.9 6 180.9 NA 7 340.4 6.3 7.3 NO 13 534.9 0.5
2007 6 533.6 6 533.6 NA 7 743.1 6.4 5.9 NO 14 289.1 0.5
2008 6 946.7 6 946.7 NA 7 677.9 6.1 4.6 NO 14 635.3 0.5
2009 6 967.7 6 967.7 NA 5 746.8 5.8 3.3 NO 12 723.7 0.5
2010 7 582.4 7 582.4 NA 7 314.6 5.8 2.0 NO 14 904.7 0.5
2011 7 269.4 7 269.4 NA 7 545.2 5.5 1.9 NO 14 822.0 0.5
2012 7 335.1 7 335.1 NA 7 429.6 5.4 1.9 NO 14 771.9 0.5
2013 7 554.8 7 554.8 NA 7 939.9 5.3 1.8 NO 15 501.8 0.5
2014 6 778.4 6 778.4 NA 7 812.8 5.4 1.8 NO 14 598.3 0.5
2015 7 134.8 7 134.8 NA 7 583.4 5.3 1.8 NO 14 725.2 0.5
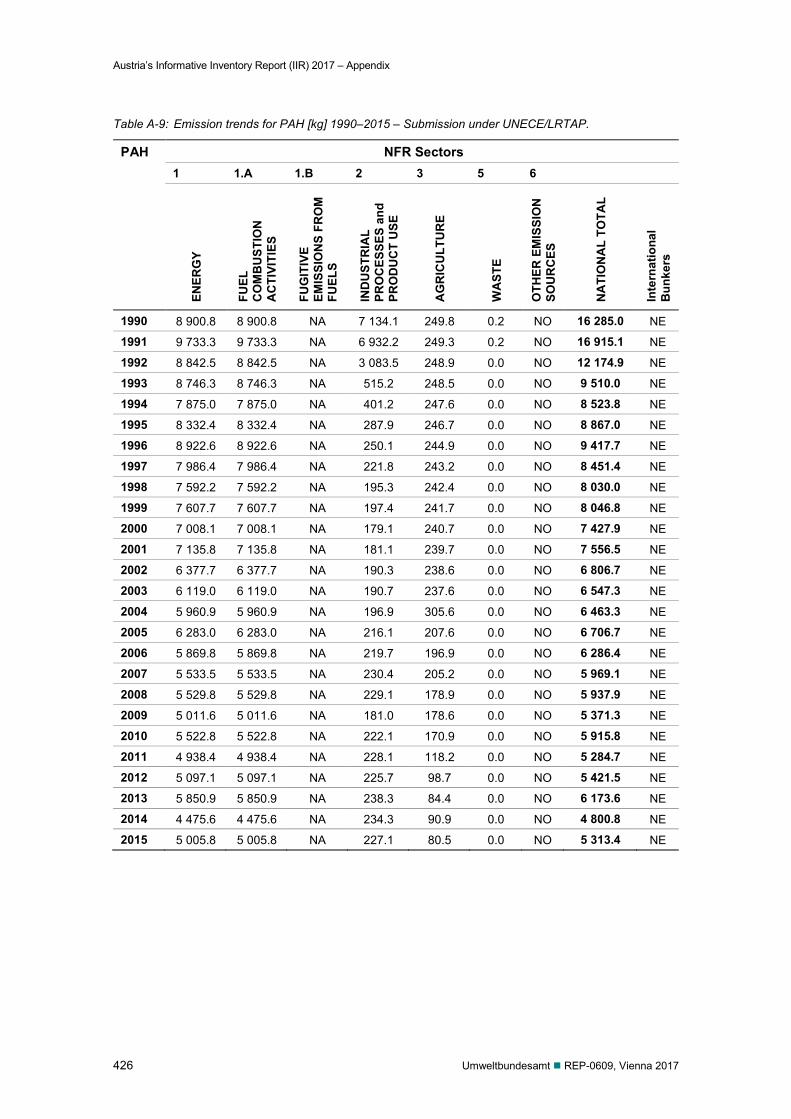
Austria’s Informative Inventory Report (IIR) 2017 – Appendix
426 Umweltbundesamt REP-0609, Vienna 2017
Table A-9: Emission trends for PAH [kg] 1990–2015 – Submission under UNECE/LRTAP.
PAH NFR Sectors 1 1.A 1.B 2 3 5 6
ENER
GY
FUEL
C
OM
BU
STIO
N
AC
TIVI
TIES
FUG
ITIV
E EM
ISSI
ON
S FR
OM
FU
ELS
IND
UST
RIA
L PR
OC
ESSE
S an
d PR
OD
UC
T U
SE
AG
RIC
ULT
UR
E
WA
STE
OTH
ER E
MIS
SIO
N
SOU
RC
ES
NA
TIO
NA
L TO
TAL
Inte
rnat
iona
l B
unke
rs
1990 8 900.8 8 900.8 NA 7 134.1 249.8 0.2 NO 16 285.0 NE
1991 9 733.3 9 733.3 NA 6 932.2 249.3 0.2 NO 16 915.1 NE
1992 8 842.5 8 842.5 NA 3 083.5 248.9 0.0 NO 12 174.9 NE
1993 8 746.3 8 746.3 NA 515.2 248.5 0.0 NO 9 510.0 NE
1994 7 875.0 7 875.0 NA 401.2 247.6 0.0 NO 8 523.8 NE
1995 8 332.4 8 332.4 NA 287.9 246.7 0.0 NO 8 867.0 NE
1996 8 922.6 8 922.6 NA 250.1 244.9 0.0 NO 9 417.7 NE
1997 7 986.4 7 986.4 NA 221.8 243.2 0.0 NO 8 451.4 NE
1998 7 592.2 7 592.2 NA 195.3 242.4 0.0 NO 8 030.0 NE
1999 7 607.7 7 607.7 NA 197.4 241.7 0.0 NO 8 046.8 NE
2000 7 008.1 7 008.1 NA 179.1 240.7 0.0 NO 7 427.9 NE
2001 7 135.8 7 135.8 NA 181.1 239.7 0.0 NO 7 556.5 NE
2002 6 377.7 6 377.7 NA 190.3 238.6 0.0 NO 6 806.7 NE
2003 6 119.0 6 119.0 NA 190.7 237.6 0.0 NO 6 547.3 NE
2004 5 960.9 5 960.9 NA 196.9 305.6 0.0 NO 6 463.3 NE
2005 6 283.0 6 283.0 NA 216.1 207.6 0.0 NO 6 706.7 NE
2006 5 869.8 5 869.8 NA 219.7 196.9 0.0 NO 6 286.4 NE
2007 5 533.5 5 533.5 NA 230.4 205.2 0.0 NO 5 969.1 NE
2008 5 529.8 5 529.8 NA 229.1 178.9 0.0 NO 5 937.9 NE
2009 5 011.6 5 011.6 NA 181.0 178.6 0.0 NO 5 371.3 NE
2010 5 522.8 5 522.8 NA 222.1 170.9 0.0 NO 5 915.8 NE
2011 4 938.4 4 938.4 NA 228.1 118.2 0.0 NO 5 284.7 NE
2012 5 097.1 5 097.1 NA 225.7 98.7 0.0 NO 5 421.5 NE
2013 5 850.9 5 850.9 NA 238.3 84.4 0.0 NO 6 173.6 NE
2014 4 475.6 4 475.6 NA 234.3 90.9 0.0 NO 4 800.8 NE
2015 5 005.8 5 005.8 NA 227.1 80.5 0.0 NO 5 313.4 NE
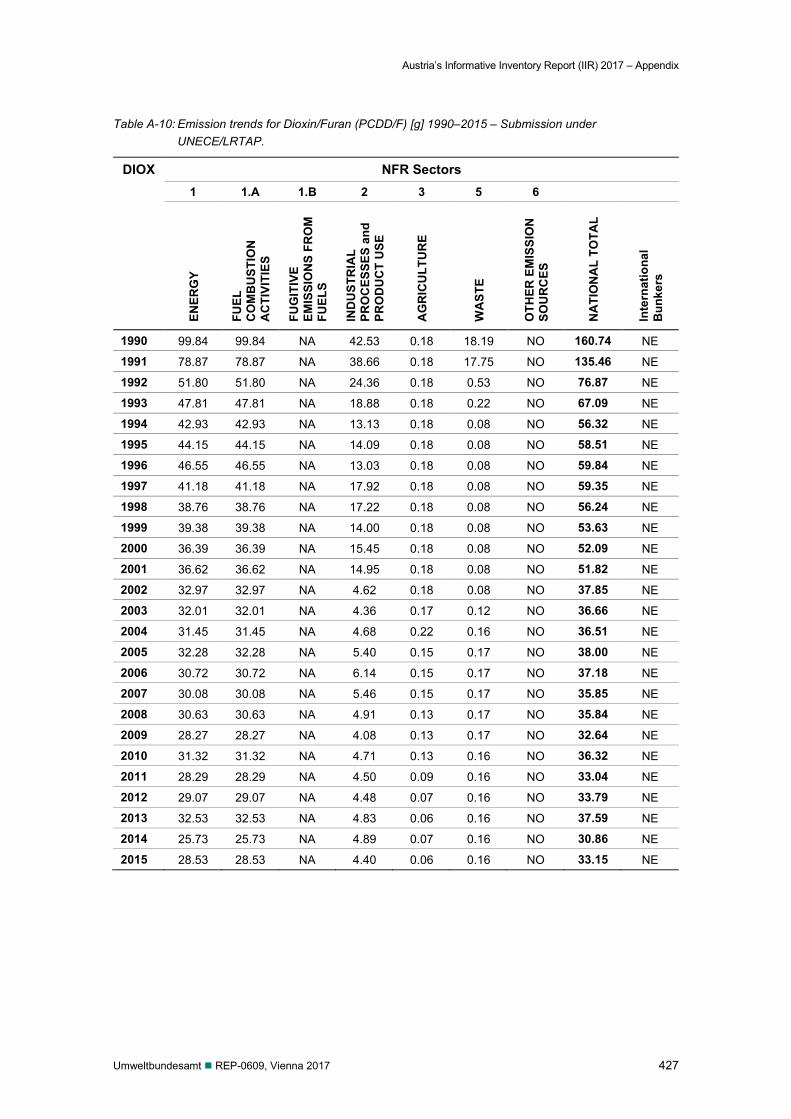
Austria’s Informative Inventory Report (IIR) 2017 – Appendix
Umweltbundesamt REP-0609, Vienna 2017 427
Table A-10: Emission trends for Dioxin/Furan (PCDD/F) [g] 1990–2015 – Submission under UNECE/LRTAP.
DIOX NFR Sectors 1 1.A 1.B 2 3 5 6
ENER
GY
FUEL
C
OM
BU
STIO
N
AC
TIVI
TIES
FUG
ITIV
E EM
ISSI
ON
S FR
OM
FU
ELS
IND
UST
RIA
L PR
OC
ESSE
S an
d PR
OD
UC
T U
SE
AG
RIC
ULT
UR
E
WA
STE
OTH
ER E
MIS
SIO
N
SOU
RC
ES
NA
TIO
NA
L TO
TAL
Inte
rnat
iona
l
Bun
kers
1990 99.84 99.84 NA 42.53 0.18 18.19 NO 160.74 NE
1991 78.87 78.87 NA 38.66 0.18 17.75 NO 135.46 NE
1992 51.80 51.80 NA 24.36 0.18 0.53 NO 76.87 NE
1993 47.81 47.81 NA 18.88 0.18 0.22 NO 67.09 NE
1994 42.93 42.93 NA 13.13 0.18 0.08 NO 56.32 NE
1995 44.15 44.15 NA 14.09 0.18 0.08 NO 58.51 NE
1996 46.55 46.55 NA 13.03 0.18 0.08 NO 59.84 NE
1997 41.18 41.18 NA 17.92 0.18 0.08 NO 59.35 NE
1998 38.76 38.76 NA 17.22 0.18 0.08 NO 56.24 NE
1999 39.38 39.38 NA 14.00 0.18 0.08 NO 53.63 NE
2000 36.39 36.39 NA 15.45 0.18 0.08 NO 52.09 NE
2001 36.62 36.62 NA 14.95 0.18 0.08 NO 51.82 NE
2002 32.97 32.97 NA 4.62 0.18 0.08 NO 37.85 NE
2003 32.01 32.01 NA 4.36 0.17 0.12 NO 36.66 NE
2004 31.45 31.45 NA 4.68 0.22 0.16 NO 36.51 NE
2005 32.28 32.28 NA 5.40 0.15 0.17 NO 38.00 NE
2006 30.72 30.72 NA 6.14 0.15 0.17 NO 37.18 NE
2007 30.08 30.08 NA 5.46 0.15 0.17 NO 35.85 NE
2008 30.63 30.63 NA 4.91 0.13 0.17 NO 35.84 NE
2009 28.27 28.27 NA 4.08 0.13 0.17 NO 32.64 NE
2010 31.32 31.32 NA 4.71 0.13 0.16 NO 36.32 NE
2011 28.29 28.29 NA 4.50 0.09 0.16 NO 33.04 NE
2012 29.07 29.07 NA 4.48 0.07 0.16 NO 33.79 NE
2013 32.53 32.53 NA 4.83 0.06 0.16 NO 37.59 NE
2014 25.73 25.73 NA 4.89 0.07 0.16 NO 30.86 NE
2015 28.53 28.53 NA 4.40 0.06 0.16 NO 33.15 NE
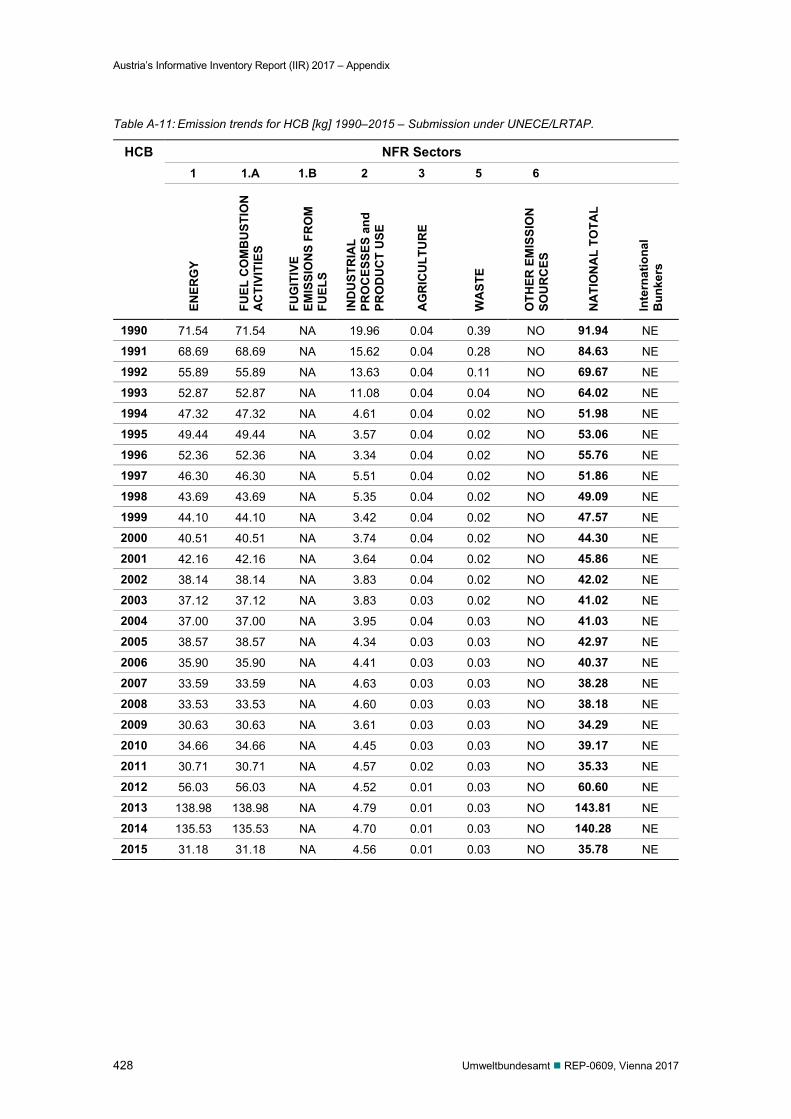
Austria’s Informative Inventory Report (IIR) 2017 – Appendix
428 Umweltbundesamt REP-0609, Vienna 2017
Table A-11: Emission trends for HCB [kg] 1990–2015 – Submission under UNECE/LRTAP.
HCB NFR Sectors 1 1.A 1.B 2 3 5 6
ENER
GY
FUEL
CO
MB
UST
ION
A
CTI
VITI
ES
FUG
ITIV
E EM
ISSI
ON
S FR
OM
FU
ELS
IND
UST
RIA
L PR
OC
ESSE
S an
d PR
OD
UC
T U
SE
AG
RIC
ULT
UR
E
WA
STE
OTH
ER E
MIS
SIO
N
SOU
RC
ES
NA
TIO
NA
L TO
TAL
Inte
rnat
iona
l
B
unke
rs
1990 71.54 71.54 NA 19.96 0.04 0.39 NO 91.94 NE
1991 68.69 68.69 NA 15.62 0.04 0.28 NO 84.63 NE
1992 55.89 55.89 NA 13.63 0.04 0.11 NO 69.67 NE
1993 52.87 52.87 NA 11.08 0.04 0.04 NO 64.02 NE
1994 47.32 47.32 NA 4.61 0.04 0.02 NO 51.98 NE
1995 49.44 49.44 NA 3.57 0.04 0.02 NO 53.06 NE
1996 52.36 52.36 NA 3.34 0.04 0.02 NO 55.76 NE
1997 46.30 46.30 NA 5.51 0.04 0.02 NO 51.86 NE
1998 43.69 43.69 NA 5.35 0.04 0.02 NO 49.09 NE
1999 44.10 44.10 NA 3.42 0.04 0.02 NO 47.57 NE
2000 40.51 40.51 NA 3.74 0.04 0.02 NO 44.30 NE
2001 42.16 42.16 NA 3.64 0.04 0.02 NO 45.86 NE
2002 38.14 38.14 NA 3.83 0.04 0.02 NO 42.02 NE
2003 37.12 37.12 NA 3.83 0.03 0.02 NO 41.02 NE
2004 37.00 37.00 NA 3.95 0.04 0.03 NO 41.03 NE
2005 38.57 38.57 NA 4.34 0.03 0.03 NO 42.97 NE
2006 35.90 35.90 NA 4.41 0.03 0.03 NO 40.37 NE
2007 33.59 33.59 NA 4.63 0.03 0.03 NO 38.28 NE
2008 33.53 33.53 NA 4.60 0.03 0.03 NO 38.18 NE
2009 30.63 30.63 NA 3.61 0.03 0.03 NO 34.29 NE
2010 34.66 34.66 NA 4.45 0.03 0.03 NO 39.17 NE
2011 30.71 30.71 NA 4.57 0.02 0.03 NO 35.33 NE
2012 56.03 56.03 NA 4.52 0.01 0.03 NO 60.60 NE
2013 138.98 138.98 NA 4.79 0.01 0.03 NO 143.81 NE
2014 135.53 135.53 NA 4.70 0.01 0.03 NO 140.28 NE
2015 31.18 31.18 NA 4.56 0.01 0.03 NO 35.78 NE
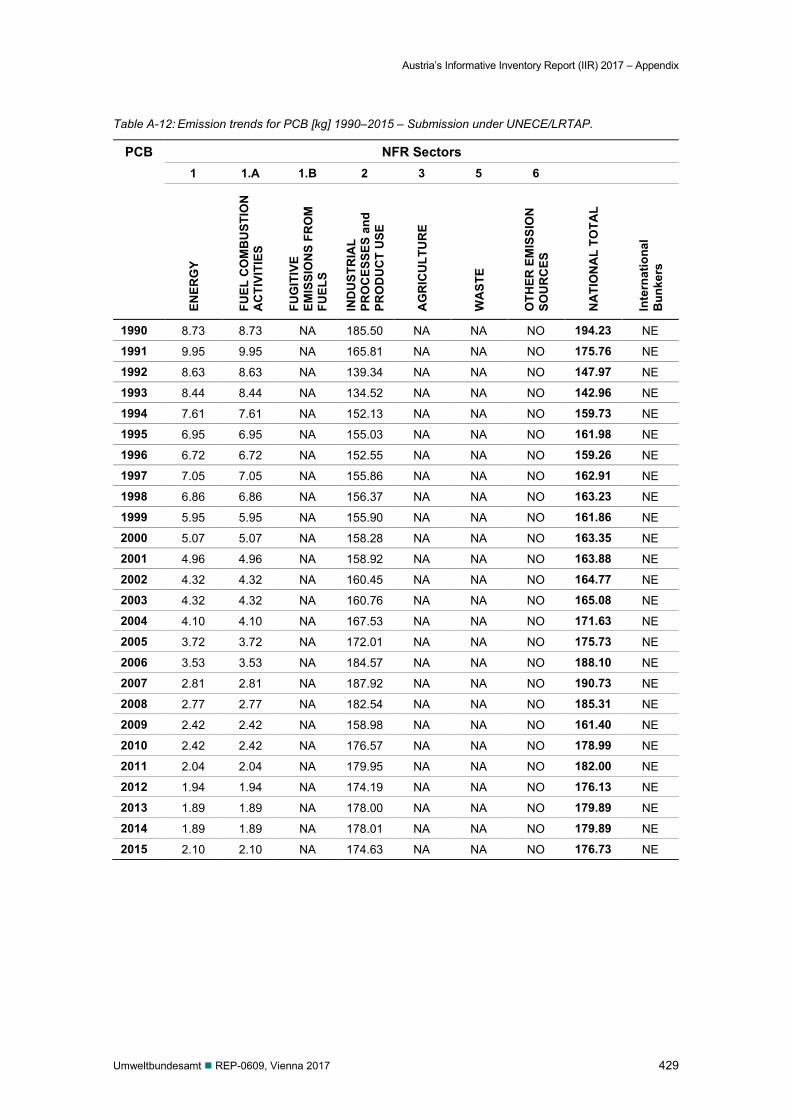
Austria’s Informative Inventory Report (IIR) 2017 – Appendix
Umweltbundesamt REP-0609, Vienna 2017 429
Table A-12: Emission trends for PCB [kg] 1990–2015 – Submission under UNECE/LRTAP.
PCB NFR Sectors 1 1.A 1.B 2 3 5 6
ENER
GY
FUEL
CO
MB
UST
ION
A
CTI
VITI
ES
FUG
ITIV
E EM
ISSI
ON
S FR
OM
FU
ELS
IND
UST
RIA
L PR
OC
ESSE
S an
d PR
OD
UC
T U
SE
AG
RIC
ULT
UR
E
WA
STE
OTH
ER E
MIS
SIO
N
SOU
RC
ES
NA
TIO
NA
L TO
TAL
Inte
rnat
iona
l
B
unke
rs
1990 8.73 8.73 NA 185.50 NA NA NO 194.23 NE
1991 9.95 9.95 NA 165.81 NA NA NO 175.76 NE
1992 8.63 8.63 NA 139.34 NA NA NO 147.97 NE
1993 8.44 8.44 NA 134.52 NA NA NO 142.96 NE
1994 7.61 7.61 NA 152.13 NA NA NO 159.73 NE
1995 6.95 6.95 NA 155.03 NA NA NO 161.98 NE
1996 6.72 6.72 NA 152.55 NA NA NO 159.26 NE
1997 7.05 7.05 NA 155.86 NA NA NO 162.91 NE
1998 6.86 6.86 NA 156.37 NA NA NO 163.23 NE
1999 5.95 5.95 NA 155.90 NA NA NO 161.86 NE
2000 5.07 5.07 NA 158.28 NA NA NO 163.35 NE
2001 4.96 4.96 NA 158.92 NA NA NO 163.88 NE
2002 4.32 4.32 NA 160.45 NA NA NO 164.77 NE
2003 4.32 4.32 NA 160.76 NA NA NO 165.08 NE
2004 4.10 4.10 NA 167.53 NA NA NO 171.63 NE
2005 3.72 3.72 NA 172.01 NA NA NO 175.73 NE
2006 3.53 3.53 NA 184.57 NA NA NO 188.10 NE
2007 2.81 2.81 NA 187.92 NA NA NO 190.73 NE
2008 2.77 2.77 NA 182.54 NA NA NO 185.31 NE
2009 2.42 2.42 NA 158.98 NA NA NO 161.40 NE
2010 2.42 2.42 NA 176.57 NA NA NO 178.99 NE
2011 2.04 2.04 NA 179.95 NA NA NO 182.00 NE
2012 1.94 1.94 NA 174.19 NA NA NO 176.13 NE
2013 1.89 1.89 NA 178.00 NA NA NO 179.89 NE
2014 1.89 1.89 NA 178.01 NA NA NO 179.89 NE
2015 2.10 2.10 NA 174.63 NA NA NO 176.73 NE
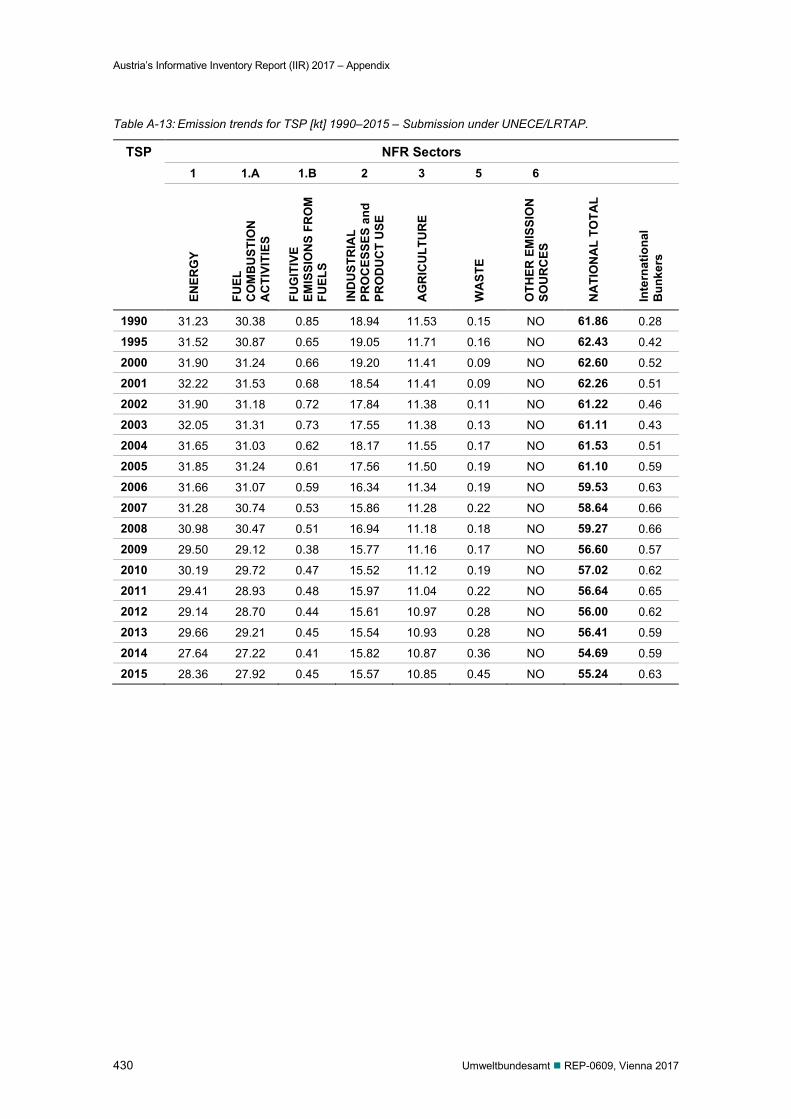
Austria’s Informative Inventory Report (IIR) 2017 – Appendix
430 Umweltbundesamt REP-0609, Vienna 2017
Table A-13: Emission trends for TSP [kt] 1990–2015 – Submission under UNECE/LRTAP.
TSP NFR Sectors 1 1.A 1.B 2 3 5 6
ENER
GY
FUEL
C
OM
BU
STIO
N
AC
TIVI
TIES
FUG
ITIV
E EM
ISSI
ON
S FR
OM
FU
ELS
IND
UST
RIA
L PR
OC
ESSE
S an
d PR
OD
UC
T U
SE
AG
RIC
ULT
UR
E
WA
STE
OTH
ER E
MIS
SIO
N
SOU
RC
ES
NA
TIO
NA
L TO
TAL
Inte
rnat
iona
l
Bun
kers
1990 31.23 30.38 0.85 18.94 11.53 0.15 NO 61.86 0.28
1995 31.52 30.87 0.65 19.05 11.71 0.16 NO 62.43 0.42
2000 31.90 31.24 0.66 19.20 11.41 0.09 NO 62.60 0.52
2001 32.22 31.53 0.68 18.54 11.41 0.09 NO 62.26 0.51
2002 31.90 31.18 0.72 17.84 11.38 0.11 NO 61.22 0.46
2003 32.05 31.31 0.73 17.55 11.38 0.13 NO 61.11 0.43
2004 31.65 31.03 0.62 18.17 11.55 0.17 NO 61.53 0.51
2005 31.85 31.24 0.61 17.56 11.50 0.19 NO 61.10 0.59
2006 31.66 31.07 0.59 16.34 11.34 0.19 NO 59.53 0.63
2007 31.28 30.74 0.53 15.86 11.28 0.22 NO 58.64 0.66
2008 30.98 30.47 0.51 16.94 11.18 0.18 NO 59.27 0.66
2009 29.50 29.12 0.38 15.77 11.16 0.17 NO 56.60 0.57
2010 30.19 29.72 0.47 15.52 11.12 0.19 NO 57.02 0.62
2011 29.41 28.93 0.48 15.97 11.04 0.22 NO 56.64 0.65
2012 29.14 28.70 0.44 15.61 10.97 0.28 NO 56.00 0.62
2013 29.66 29.21 0.45 15.54 10.93 0.28 NO 56.41 0.59
2014 27.64 27.22 0.41 15.82 10.87 0.36 NO 54.69 0.59
2015 28.36 27.92 0.45 15.57 10.85 0.45 NO 55.24 0.63
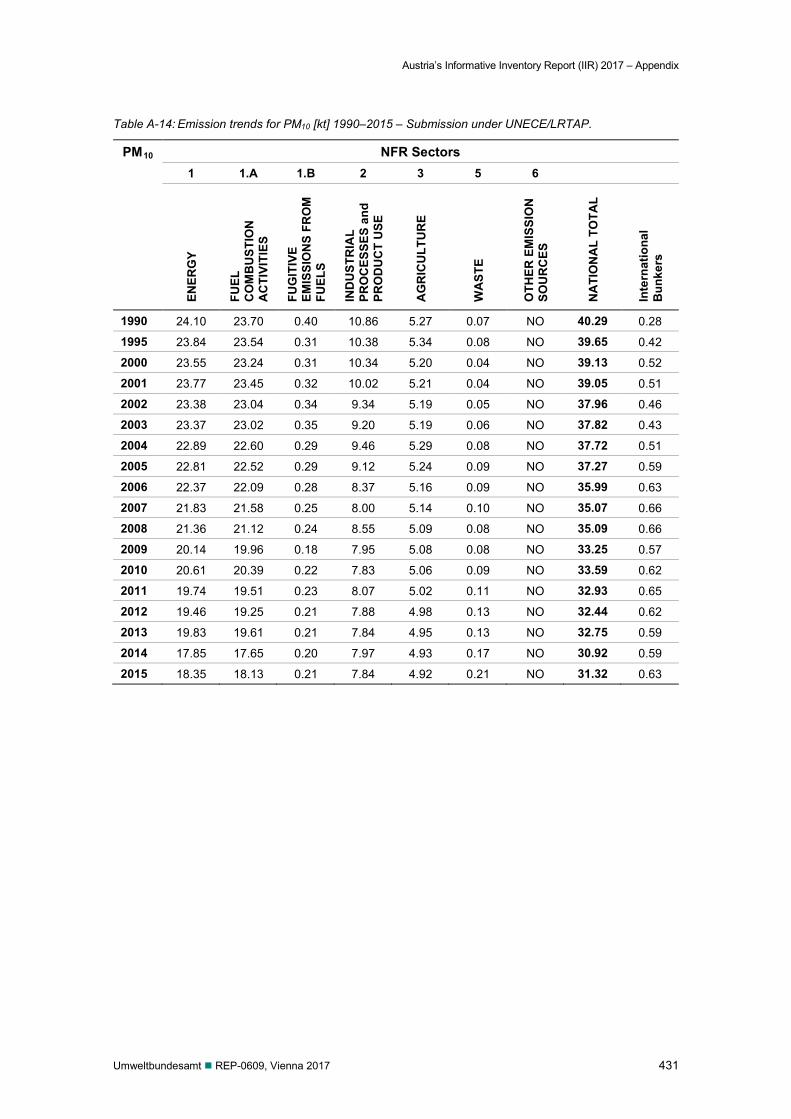
Austria’s Informative Inventory Report (IIR) 2017 – Appendix
Umweltbundesamt REP-0609, Vienna 2017 431
Table A-14: Emission trends for PM10 [kt] 1990–2015 – Submission under UNECE/LRTAP.
PM10 NFR Sectors 1 1.A 1.B 2 3 5 6
ENER
GY
FUEL
C
OM
BU
STIO
N
AC
TIVI
TIES
FUG
ITIV
E EM
ISSI
ON
S FR
OM
FU
ELS
IND
UST
RIA
L PR
OC
ESSE
S an
d PR
OD
UC
T U
SE
AG
RIC
ULT
UR
E
WA
STE
OTH
ER E
MIS
SIO
N
SOU
RC
ES
NA
TIO
NA
L TO
TAL
Inte
rnat
iona
l
Bun
kers
1990 24.10 23.70 0.40 10.86 5.27 0.07 NO 40.29 0.28
1995 23.84 23.54 0.31 10.38 5.34 0.08 NO 39.65 0.42
2000 23.55 23.24 0.31 10.34 5.20 0.04 NO 39.13 0.52
2001 23.77 23.45 0.32 10.02 5.21 0.04 NO 39.05 0.51
2002 23.38 23.04 0.34 9.34 5.19 0.05 NO 37.96 0.46
2003 23.37 23.02 0.35 9.20 5.19 0.06 NO 37.82 0.43
2004 22.89 22.60 0.29 9.46 5.29 0.08 NO 37.72 0.51
2005 22.81 22.52 0.29 9.12 5.24 0.09 NO 37.27 0.59
2006 22.37 22.09 0.28 8.37 5.16 0.09 NO 35.99 0.63
2007 21.83 21.58 0.25 8.00 5.14 0.10 NO 35.07 0.66
2008 21.36 21.12 0.24 8.55 5.09 0.08 NO 35.09 0.66
2009 20.14 19.96 0.18 7.95 5.08 0.08 NO 33.25 0.57
2010 20.61 20.39 0.22 7.83 5.06 0.09 NO 33.59 0.62
2011 19.74 19.51 0.23 8.07 5.02 0.11 NO 32.93 0.65
2012 19.46 19.25 0.21 7.88 4.98 0.13 NO 32.44 0.62
2013 19.83 19.61 0.21 7.84 4.95 0.13 NO 32.75 0.59
2014 17.85 17.65 0.20 7.97 4.93 0.17 NO 30.92 0.59
2015 18.35 18.13 0.21 7.84 4.92 0.21 NO 31.32 0.63
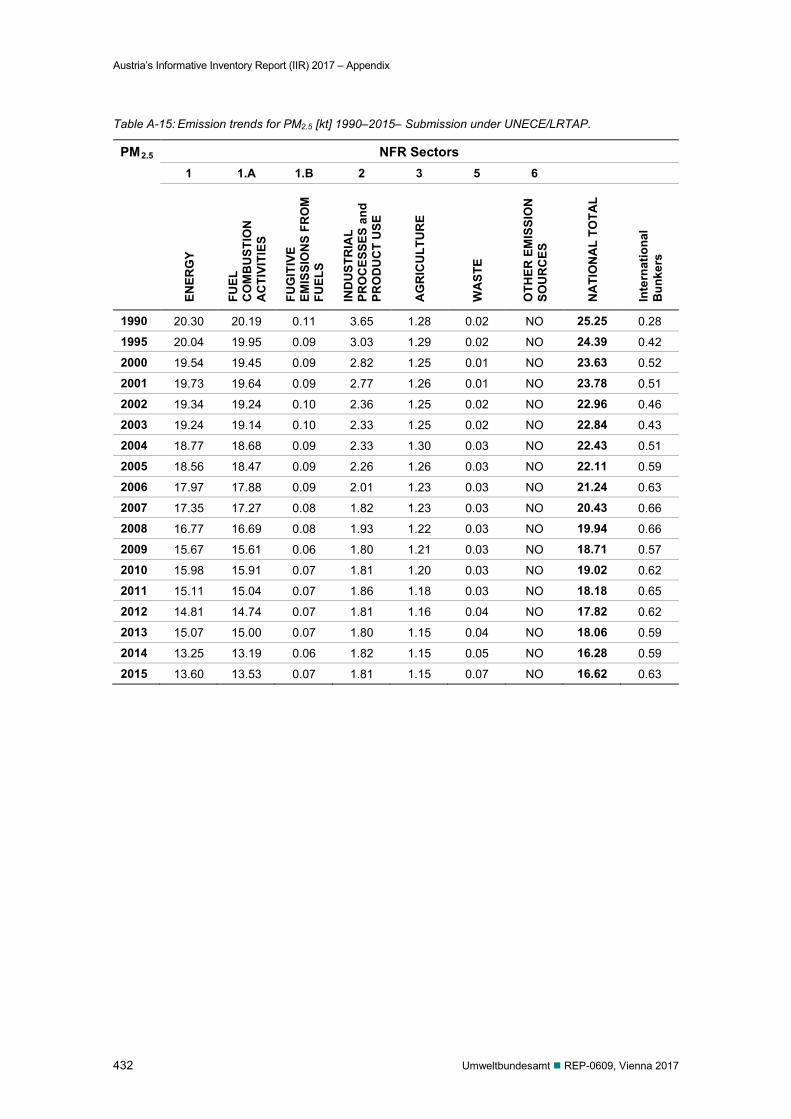
Austria’s Informative Inventory Report (IIR) 2017 – Appendix
432 Umweltbundesamt REP-0609, Vienna 2017
Table A-15: Emission trends for PM2.5 [kt] 1990–2015– Submission under UNECE/LRTAP.
PM2.5 NFR Sectors 1 1.A 1.B 2 3 5 6
ENER
GY
FUEL
C
OM
BU
STIO
N
AC
TIVI
TIES
FUG
ITIV
E EM
ISSI
ON
S FR
OM
FU
ELS
IND
UST
RIA
L PR
OC
ESSE
S an
d PR
OD
UC
T U
SE
AG
RIC
ULT
UR
E
WA
STE
OTH
ER E
MIS
SIO
N
SOU
RC
ES
NA
TIO
NA
L TO
TAL
Inte
rnat
iona
l
Bun
kers
1990 20.30 20.19 0.11 3.65 1.28 0.02 NO 25.25 0.28
1995 20.04 19.95 0.09 3.03 1.29 0.02 NO 24.39 0.42
2000 19.54 19.45 0.09 2.82 1.25 0.01 NO 23.63 0.52
2001 19.73 19.64 0.09 2.77 1.26 0.01 NO 23.78 0.51
2002 19.34 19.24 0.10 2.36 1.25 0.02 NO 22.96 0.46
2003 19.24 19.14 0.10 2.33 1.25 0.02 NO 22.84 0.43
2004 18.77 18.68 0.09 2.33 1.30 0.03 NO 22.43 0.51
2005 18.56 18.47 0.09 2.26 1.26 0.03 NO 22.11 0.59
2006 17.97 17.88 0.09 2.01 1.23 0.03 NO 21.24 0.63
2007 17.35 17.27 0.08 1.82 1.23 0.03 NO 20.43 0.66
2008 16.77 16.69 0.08 1.93 1.22 0.03 NO 19.94 0.66
2009 15.67 15.61 0.06 1.80 1.21 0.03 NO 18.71 0.57
2010 15.98 15.91 0.07 1.81 1.20 0.03 NO 19.02 0.62
2011 15.11 15.04 0.07 1.86 1.18 0.03 NO 18.18 0.65
2012 14.81 14.74 0.07 1.81 1.16 0.04 NO 17.82 0.62
2013 15.07 15.00 0.07 1.80 1.15 0.04 NO 18.06 0.59
2014 13.25 13.19 0.06 1.82 1.15 0.05 NO 16.28 0.59
2015 13.60 13.53 0.07 1.81 1.15 0.07 NO 16.62 0.63
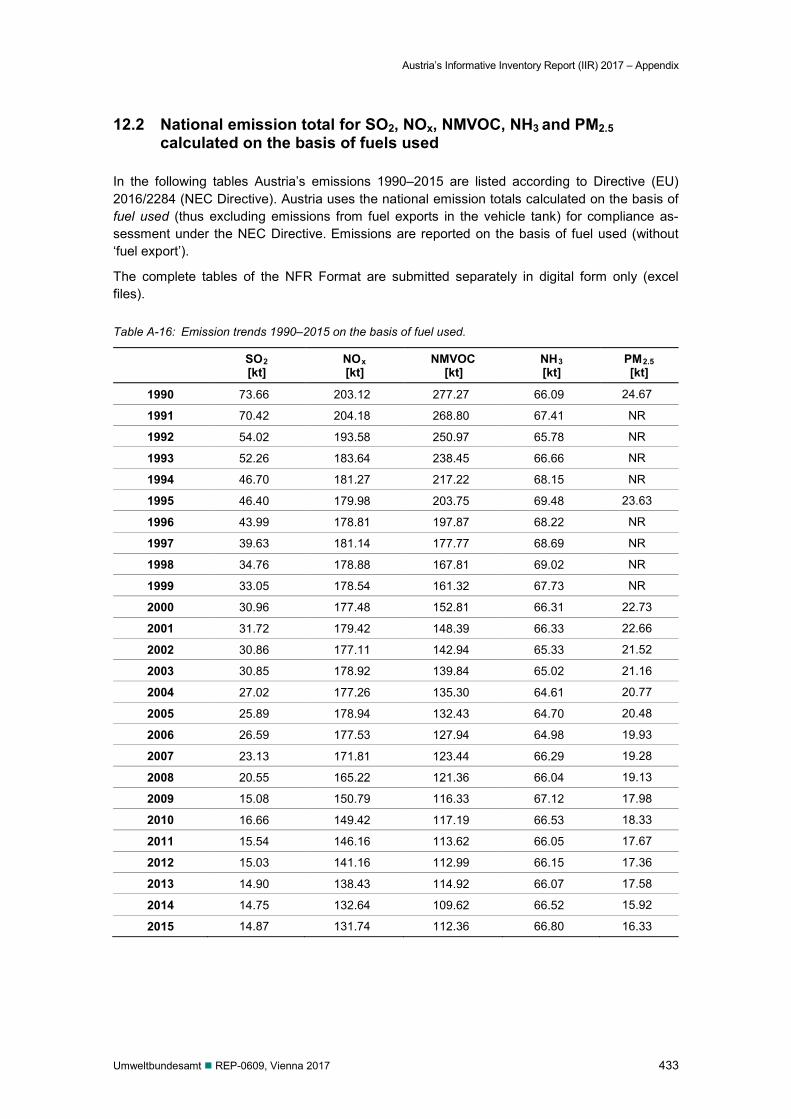
Austria’s Informative Inventory Report (IIR) 2017 – Appendix
Umweltbundesamt REP-0609, Vienna 2017 433
12.2 National emission total for SO2, NOx, NMVOC, NH3 and PM2.5 calculated on the basis of fuels used
In the following tables Austria’s emissions 1990–2015 are listed according to Directive (EU) 2016/2284 (NEC Directive). Austria uses the national emission totals calculated on the basis of fuel used (thus excluding emissions from fuel exports in the vehicle tank) for compliance as-sessment under the NEC Directive. Emissions are reported on the basis of fuel used (without ‘fuel export’).
The complete tables of the NFR Format are submitted separately in digital form only (excel files).
Table A-16: Emission trends 1990–2015 on the basis of fuel used.
SO2 [kt]
NOx [kt]
NMVOC [kt]
NH3 [kt]
PM2.5 [kt]
1990 73.66 203.12 277.27 66.09 24.67
1991 70.42 204.18 268.80 67.41 NR
1992 54.02 193.58 250.97 65.78 NR
1993 52.26 183.64 238.45 66.66 NR
1994 46.70 181.27 217.22 68.15 NR
1995 46.40 179.98 203.75 69.48 23.63
1996 43.99 178.81 197.87 68.22 NR
1997 39.63 181.14 177.77 68.69 NR
1998 34.76 178.88 167.81 69.02 NR
1999 33.05 178.54 161.32 67.73 NR
2000 30.96 177.48 152.81 66.31 22.73
2001 31.72 179.42 148.39 66.33 22.66
2002 30.86 177.11 142.94 65.33 21.52
2003 30.85 178.92 139.84 65.02 21.16
2004 27.02 177.26 135.30 64.61 20.77
2005 25.89 178.94 132.43 64.70 20.48
2006 26.59 177.53 127.94 64.98 19.93
2007 23.13 171.81 123.44 66.29 19.28
2008 20.55 165.22 121.36 66.04 19.13
2009 15.08 150.79 116.33 67.12 17.98
2010 16.66 149.42 117.19 66.53 18.33
2011 15.54 146.16 113.62 66.05 17.67
2012 15.03 141.16 112.99 66.15 17.36
2013 14.90 138.43 114.92 66.07 17.58
2014 14.75 132.64 109.62 66.52 15.92
2015 14.87 131.74 112.36 66.80 16.33
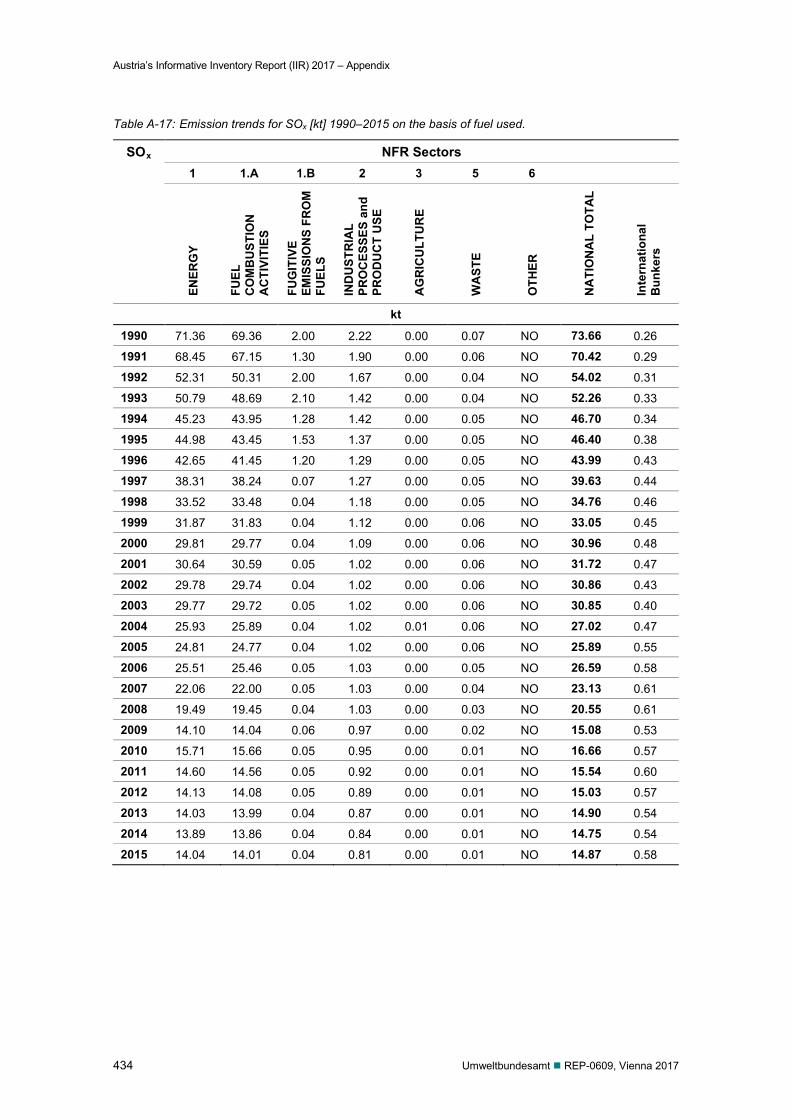
Austria’s Informative Inventory Report (IIR) 2017 – Appendix
434 Umweltbundesamt REP-0609, Vienna 2017
Table A-17: Emission trends for SOx [kt] 1990–2015 on the basis of fuel used.
SOx NFR Sectors 1 1.A 1.B 2 3 5 6
ENER
GY
FUEL
C
OM
BU
STIO
N
AC
TIVI
TIES
FUG
ITIV
E EM
ISSI
ON
S FR
OM
FU
ELS
IND
UST
RIA
L PR
OC
ESSE
S an
d PR
OD
UC
T U
SE
AG
RIC
ULT
UR
E
WA
STE
OTH
ER
NA
TIO
NA
L TO
TAL
Inte
rnat
iona
l B
unke
rs
kt
1990 71.36 69.36 2.00 2.22 0.00 0.07 NO 73.66 0.26
1991 68.45 67.15 1.30 1.90 0.00 0.06 NO 70.42 0.29
1992 52.31 50.31 2.00 1.67 0.00 0.04 NO 54.02 0.31
1993 50.79 48.69 2.10 1.42 0.00 0.04 NO 52.26 0.33
1994 45.23 43.95 1.28 1.42 0.00 0.05 NO 46.70 0.34
1995 44.98 43.45 1.53 1.37 0.00 0.05 NO 46.40 0.38
1996 42.65 41.45 1.20 1.29 0.00 0.05 NO 43.99 0.43
1997 38.31 38.24 0.07 1.27 0.00 0.05 NO 39.63 0.44
1998 33.52 33.48 0.04 1.18 0.00 0.05 NO 34.76 0.46
1999 31.87 31.83 0.04 1.12 0.00 0.06 NO 33.05 0.45
2000 29.81 29.77 0.04 1.09 0.00 0.06 NO 30.96 0.48
2001 30.64 30.59 0.05 1.02 0.00 0.06 NO 31.72 0.47
2002 29.78 29.74 0.04 1.02 0.00 0.06 NO 30.86 0.43
2003 29.77 29.72 0.05 1.02 0.00 0.06 NO 30.85 0.40
2004 25.93 25.89 0.04 1.02 0.01 0.06 NO 27.02 0.47
2005 24.81 24.77 0.04 1.02 0.00 0.06 NO 25.89 0.55
2006 25.51 25.46 0.05 1.03 0.00 0.05 NO 26.59 0.58
2007 22.06 22.00 0.05 1.03 0.00 0.04 NO 23.13 0.61
2008 19.49 19.45 0.04 1.03 0.00 0.03 NO 20.55 0.61
2009 14.10 14.04 0.06 0.97 0.00 0.02 NO 15.08 0.53
2010 15.71 15.66 0.05 0.95 0.00 0.01 NO 16.66 0.57
2011 14.60 14.56 0.05 0.92 0.00 0.01 NO 15.54 0.60
2012 14.13 14.08 0.05 0.89 0.00 0.01 NO 15.03 0.57
2013 14.03 13.99 0.04 0.87 0.00 0.01 NO 14.90 0.54
2014 13.89 13.86 0.04 0.84 0.00 0.01 NO 14.75 0.54
2015 14.04 14.01 0.04 0.81 0.00 0.01 NO 14.87 0.58
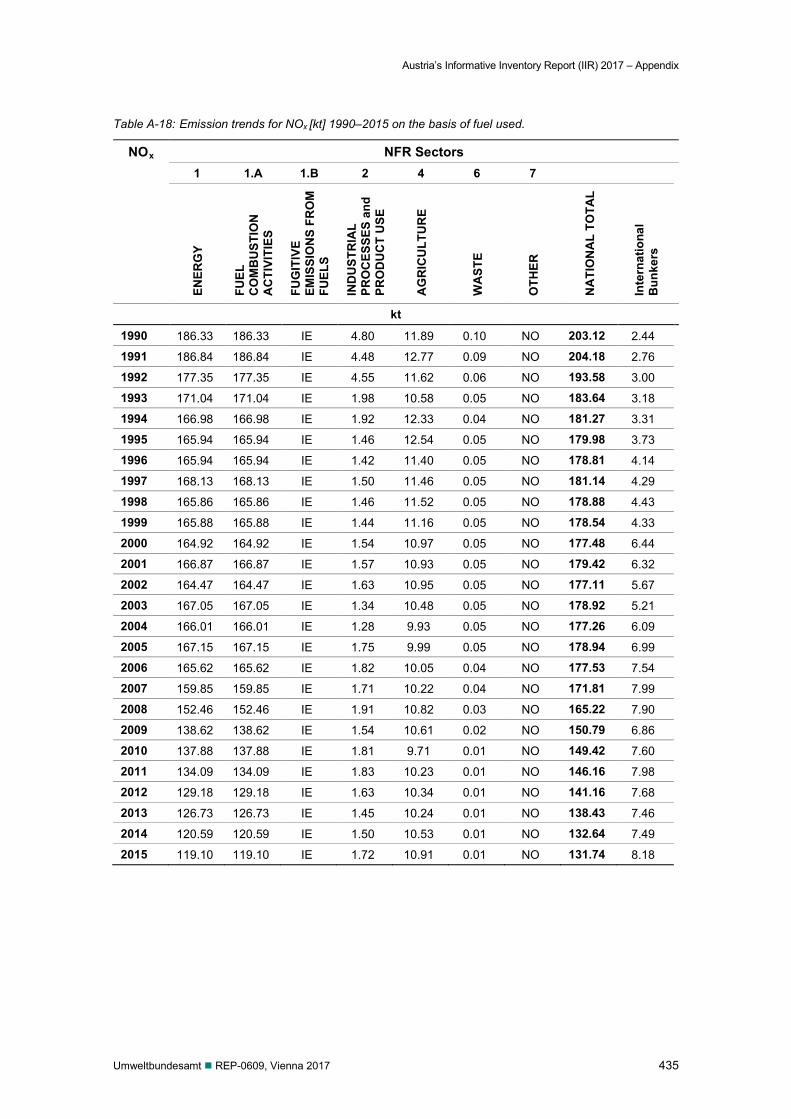
Austria’s Informative Inventory Report (IIR) 2017 – Appendix
Umweltbundesamt REP-0609, Vienna 2017 435
Table A-18: Emission trends for NOx [kt] 1990–2015 on the basis of fuel used.
NOx NFR Sectors 1 1.A 1.B 2 4 6 7
ENER
GY
FUEL
C
OM
BU
STIO
N
AC
TIVI
TIES
FUG
ITIV
E EM
ISSI
ON
S FR
OM
FU
ELS
IND
UST
RIA
L PR
OC
ESSE
S an
d PR
OD
UC
T U
SE
AG
RIC
ULT
UR
E
WA
STE
OTH
ER
NA
TIO
NA
L TO
TAL
Inte
rnat
iona
l B
unke
rs
kt
1990 186.33 186.33 IE 4.80 11.89 0.10 NO 203.12 2.44
1991 186.84 186.84 IE 4.48 12.77 0.09 NO 204.18 2.76
1992 177.35 177.35 IE 4.55 11.62 0.06 NO 193.58 3.00
1993 171.04 171.04 IE 1.98 10.58 0.05 NO 183.64 3.18
1994 166.98 166.98 IE 1.92 12.33 0.04 NO 181.27 3.31
1995 165.94 165.94 IE 1.46 12.54 0.05 NO 179.98 3.73
1996 165.94 165.94 IE 1.42 11.40 0.05 NO 178.81 4.14
1997 168.13 168.13 IE 1.50 11.46 0.05 NO 181.14 4.29
1998 165.86 165.86 IE 1.46 11.52 0.05 NO 178.88 4.43
1999 165.88 165.88 IE 1.44 11.16 0.05 NO 178.54 4.33
2000 164.92 164.92 IE 1.54 10.97 0.05 NO 177.48 6.44
2001 166.87 166.87 IE 1.57 10.93 0.05 NO 179.42 6.32
2002 164.47 164.47 IE 1.63 10.95 0.05 NO 177.11 5.67
2003 167.05 167.05 IE 1.34 10.48 0.05 NO 178.92 5.21
2004 166.01 166.01 IE 1.28 9.93 0.05 NO 177.26 6.09
2005 167.15 167.15 IE 1.75 9.99 0.05 NO 178.94 6.99
2006 165.62 165.62 IE 1.82 10.05 0.04 NO 177.53 7.54
2007 159.85 159.85 IE 1.71 10.22 0.04 NO 171.81 7.99
2008 152.46 152.46 IE 1.91 10.82 0.03 NO 165.22 7.90
2009 138.62 138.62 IE 1.54 10.61 0.02 NO 150.79 6.86
2010 137.88 137.88 IE 1.81 9.71 0.01 NO 149.42 7.60
2011 134.09 134.09 IE 1.83 10.23 0.01 NO 146.16 7.98
2012 129.18 129.18 IE 1.63 10.34 0.01 NO 141.16 7.68
2013 126.73 126.73 IE 1.45 10.24 0.01 NO 138.43 7.46
2014 120.59 120.59 IE 1.50 10.53 0.01 NO 132.64 7.49
2015 119.10 119.10 IE 1.72 10.91 0.01 NO 131.74 8.18
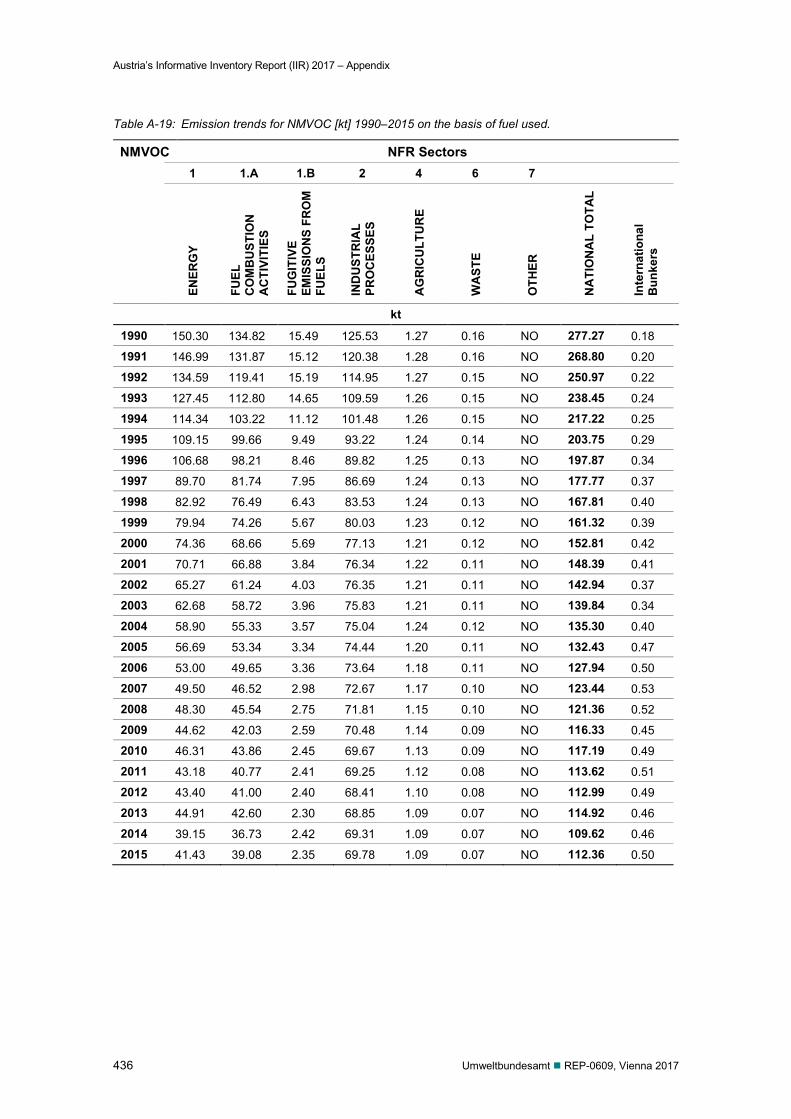
Austria’s Informative Inventory Report (IIR) 2017 – Appendix
436 Umweltbundesamt REP-0609, Vienna 2017
Table A-19: Emission trends for NMVOC [kt] 1990–2015 on the basis of fuel used.
NMVOC NFR Sectors 1 1.A 1.B 2 4 6 7
ENER
GY
FUEL
C
OM
BU
STIO
N
AC
TIVI
TIES
FUG
ITIV
E EM
ISSI
ON
S FR
OM
FU
ELS
IND
UST
RIA
L PR
OC
ESSE
S
AG
RIC
ULT
UR
E
WA
STE
OTH
ER
NA
TIO
NA
L TO
TAL
Inte
rnat
iona
l B
unke
rs
kt
1990 150.30 134.82 15.49 125.53 1.27 0.16 NO 277.27 0.18
1991 146.99 131.87 15.12 120.38 1.28 0.16 NO 268.80 0.20
1992 134.59 119.41 15.19 114.95 1.27 0.15 NO 250.97 0.22
1993 127.45 112.80 14.65 109.59 1.26 0.15 NO 238.45 0.24
1994 114.34 103.22 11.12 101.48 1.26 0.15 NO 217.22 0.25
1995 109.15 99.66 9.49 93.22 1.24 0.14 NO 203.75 0.29
1996 106.68 98.21 8.46 89.82 1.25 0.13 NO 197.87 0.34
1997 89.70 81.74 7.95 86.69 1.24 0.13 NO 177.77 0.37
1998 82.92 76.49 6.43 83.53 1.24 0.13 NO 167.81 0.40
1999 79.94 74.26 5.67 80.03 1.23 0.12 NO 161.32 0.39
2000 74.36 68.66 5.69 77.13 1.21 0.12 NO 152.81 0.42
2001 70.71 66.88 3.84 76.34 1.22 0.11 NO 148.39 0.41
2002 65.27 61.24 4.03 76.35 1.21 0.11 NO 142.94 0.37
2003 62.68 58.72 3.96 75.83 1.21 0.11 NO 139.84 0.34
2004 58.90 55.33 3.57 75.04 1.24 0.12 NO 135.30 0.40
2005 56.69 53.34 3.34 74.44 1.20 0.11 NO 132.43 0.47
2006 53.00 49.65 3.36 73.64 1.18 0.11 NO 127.94 0.50
2007 49.50 46.52 2.98 72.67 1.17 0.10 NO 123.44 0.53
2008 48.30 45.54 2.75 71.81 1.15 0.10 NO 121.36 0.52
2009 44.62 42.03 2.59 70.48 1.14 0.09 NO 116.33 0.45
2010 46.31 43.86 2.45 69.67 1.13 0.09 NO 117.19 0.49
2011 43.18 40.77 2.41 69.25 1.12 0.08 NO 113.62 0.51
2012 43.40 41.00 2.40 68.41 1.10 0.08 NO 112.99 0.49
2013 44.91 42.60 2.30 68.85 1.09 0.07 NO 114.92 0.46
2014 39.15 36.73 2.42 69.31 1.09 0.07 NO 109.62 0.46
2015 41.43 39.08 2.35 69.78 1.09 0.07 NO 112.36 0.50
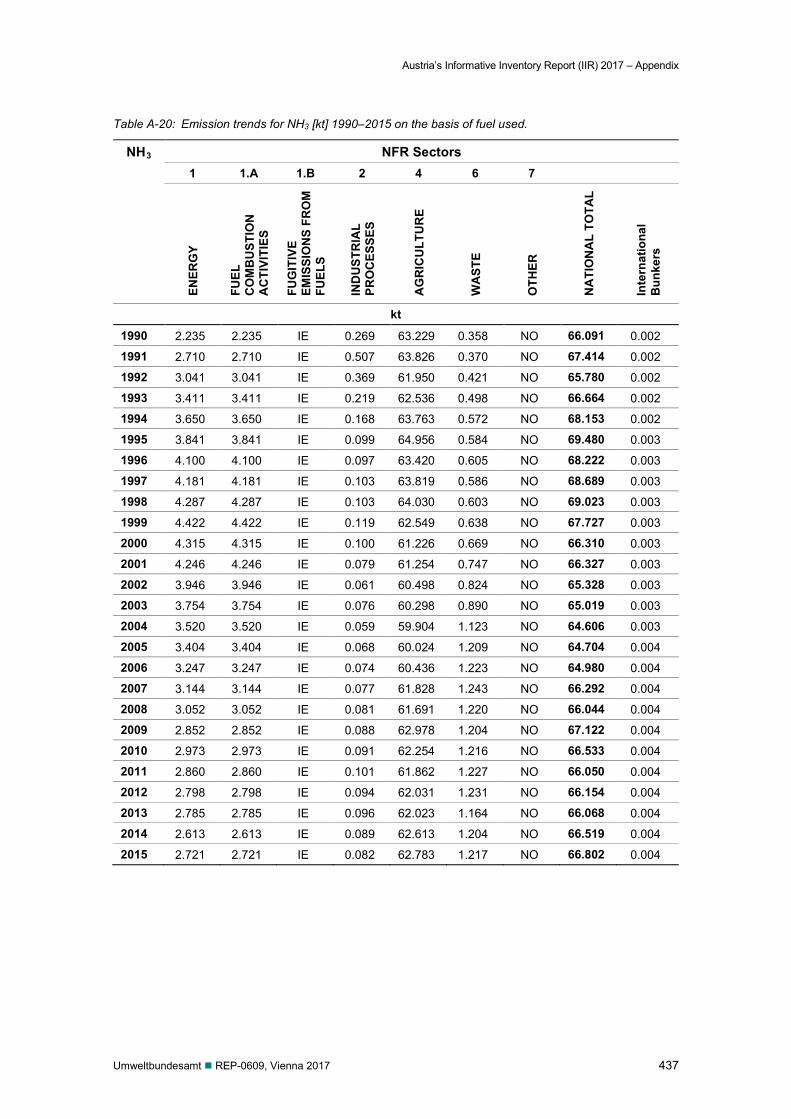
Austria’s Informative Inventory Report (IIR) 2017 – Appendix
Umweltbundesamt REP-0609, Vienna 2017 437
Table A-20: Emission trends for NH3 [kt] 1990–2015 on the basis of fuel used.
NH3 NFR Sectors 1 1.A 1.B 2 4 6 7
ENER
GY
FUEL
C
OM
BU
STIO
N
AC
TIVI
TIES
FUG
ITIV
E EM
ISSI
ON
S FR
OM
FU
ELS
IND
UST
RIA
L PR
OC
ESSE
S
AG
RIC
ULT
UR
E
WA
STE
OTH
ER
NA
TIO
NA
L TO
TAL
Inte
rnat
iona
l B
unke
rs
kt
1990 2.235 2.235 IE 0.269 63.229 0.358 NO 66.091 0.002
1991 2.710 2.710 IE 0.507 63.826 0.370 NO 67.414 0.002
1992 3.041 3.041 IE 0.369 61.950 0.421 NO 65.780 0.002
1993 3.411 3.411 IE 0.219 62.536 0.498 NO 66.664 0.002
1994 3.650 3.650 IE 0.168 63.763 0.572 NO 68.153 0.002
1995 3.841 3.841 IE 0.099 64.956 0.584 NO 69.480 0.003
1996 4.100 4.100 IE 0.097 63.420 0.605 NO 68.222 0.003
1997 4.181 4.181 IE 0.103 63.819 0.586 NO 68.689 0.003
1998 4.287 4.287 IE 0.103 64.030 0.603 NO 69.023 0.003
1999 4.422 4.422 IE 0.119 62.549 0.638 NO 67.727 0.003
2000 4.315 4.315 IE 0.100 61.226 0.669 NO 66.310 0.003
2001 4.246 4.246 IE 0.079 61.254 0.747 NO 66.327 0.003
2002 3.946 3.946 IE 0.061 60.498 0.824 NO 65.328 0.003
2003 3.754 3.754 IE 0.076 60.298 0.890 NO 65.019 0.003
2004 3.520 3.520 IE 0.059 59.904 1.123 NO 64.606 0.003
2005 3.404 3.404 IE 0.068 60.024 1.209 NO 64.704 0.004
2006 3.247 3.247 IE 0.074 60.436 1.223 NO 64.980 0.004
2007 3.144 3.144 IE 0.077 61.828 1.243 NO 66.292 0.004
2008 3.052 3.052 IE 0.081 61.691 1.220 NO 66.044 0.004
2009 2.852 2.852 IE 0.088 62.978 1.204 NO 67.122 0.004
2010 2.973 2.973 IE 0.091 62.254 1.216 NO 66.533 0.004
2011 2.860 2.860 IE 0.101 61.862 1.227 NO 66.050 0.004
2012 2.798 2.798 IE 0.094 62.031 1.231 NO 66.154 0.004
2013 2.785 2.785 IE 0.096 62.023 1.164 NO 66.068 0.004
2014 2.613 2.613 IE 0.089 62.613 1.204 NO 66.519 0.004
2015 2.721 2.721 IE 0.082 62.783 1.217 NO 66.802 0.004
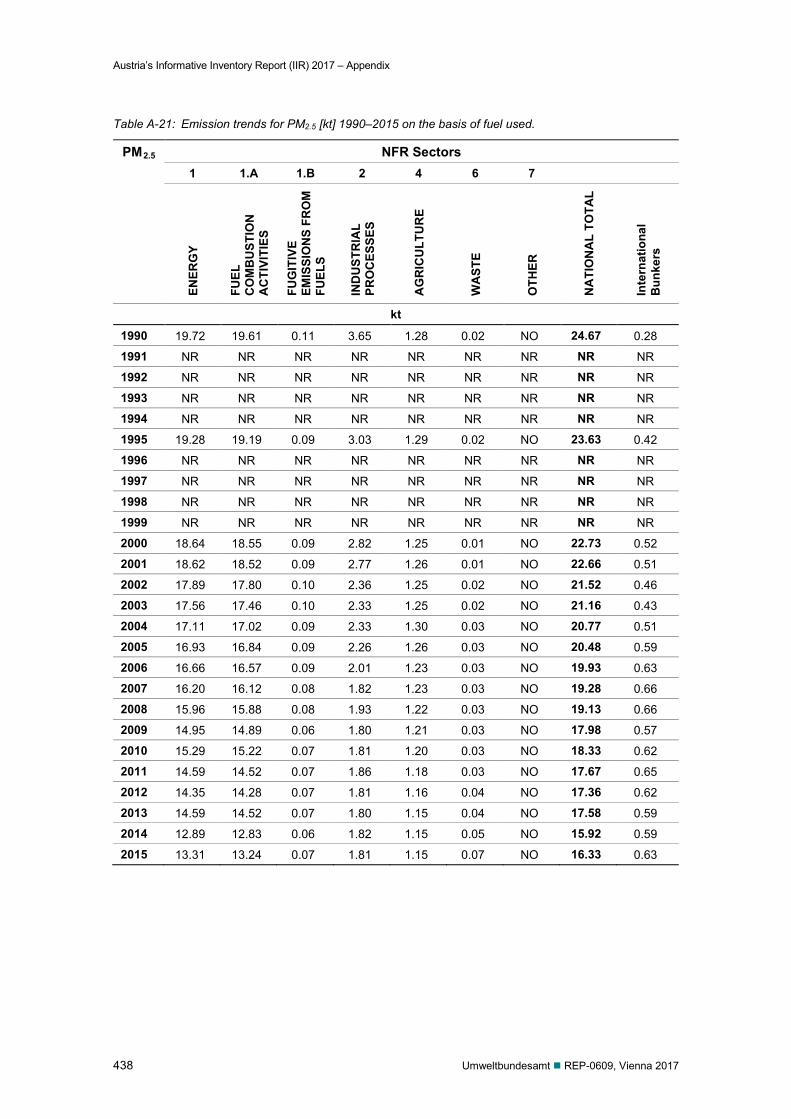
Austria’s Informative Inventory Report (IIR) 2017 – Appendix
438 Umweltbundesamt REP-0609, Vienna 2017
Table A-21: Emission trends for PM2.5 [kt] 1990–2015 on the basis of fuel used.
PM2.5 NFR Sectors 1 1.A 1.B 2 4 6 7
ENER
GY
FUEL
C
OM
BU
STIO
N
AC
TIVI
TIES
FUG
ITIV
E EM
ISSI
ON
S FR
OM
FU
ELS
IND
UST
RIA
L PR
OC
ESSE
S
AG
RIC
ULT
UR
E
WA
STE
OTH
ER
NA
TIO
NA
L TO
TAL
Inte
rnat
iona
l B
unke
rs
kt
1990 19.72 19.61 0.11 3.65 1.28 0.02 NO 24.67 0.28
1991 NR NR NR NR NR NR NR NR NR
1992 NR NR NR NR NR NR NR NR NR
1993 NR NR NR NR NR NR NR NR NR
1994 NR NR NR NR NR NR NR NR NR
1995 19.28 19.19 0.09 3.03 1.29 0.02 NO 23.63 0.42
1996 NR NR NR NR NR NR NR NR NR
1997 NR NR NR NR NR NR NR NR NR
1998 NR NR NR NR NR NR NR NR NR
1999 NR NR NR NR NR NR NR NR NR
2000 18.64 18.55 0.09 2.82 1.25 0.01 NO 22.73 0.52
2001 18.62 18.52 0.09 2.77 1.26 0.01 NO 22.66 0.51
2002 17.89 17.80 0.10 2.36 1.25 0.02 NO 21.52 0.46
2003 17.56 17.46 0.10 2.33 1.25 0.02 NO 21.16 0.43
2004 17.11 17.02 0.09 2.33 1.30 0.03 NO 20.77 0.51
2005 16.93 16.84 0.09 2.26 1.26 0.03 NO 20.48 0.59
2006 16.66 16.57 0.09 2.01 1.23 0.03 NO 19.93 0.63
2007 16.20 16.12 0.08 1.82 1.23 0.03 NO 19.28 0.66
2008 15.96 15.88 0.08 1.93 1.22 0.03 NO 19.13 0.66
2009 14.95 14.89 0.06 1.80 1.21 0.03 NO 17.98 0.57
2010 15.29 15.22 0.07 1.81 1.20 0.03 NO 18.33 0.62
2011 14.59 14.52 0.07 1.86 1.18 0.03 NO 17.67 0.65
2012 14.35 14.28 0.07 1.81 1.16 0.04 NO 17.36 0.62
2013 14.59 14.52 0.07 1.80 1.15 0.04 NO 17.58 0.59
2014 12.89 12.83 0.06 1.82 1.15 0.05 NO 15.92 0.59
2015 13.31 13.24 0.07 1.81 1.15 0.07 NO 16.33 0.63

The Informative Inventory Report (IIR) 2017 presents a comprehensive
and detailed description of trends and methodologies applied in the
Austrian Air Emission Inventory for the air pollutants
• sulphur dioxide (SO2), nitrogen oxides (NOx), non-methane volatile
organic compounds (NMVOCs), ammonia (NH3)
• carbon monoxide (CO) and
• particulate matter (TSP, PM10, PM2.5)
as well as the air pollutant groups such as
• heavy metals: cadmium (Cd), mercury (Hg), lead (Pb) and
• persistent organic pollutants (POPs): polycyclic aromatic hydrocar-
bons (PAHs), dioxins and furans (PCDD/Fs), hexachlorobenzene (HCB)
as well as polychlorinated biphenyls (PCB).
With the IIR 2017, Austria complies with its reporting obligations
under the UNECE Convention on Long-range Transboundary Air
Pollution (LRTAP) and Directive (EU) 2016/2284 on the reduction of
national emissions of certain atmospheric pollutants.
ISBN 978-3-99004-423-0
Umweltbundesamt GmbHSpittelauer Lände 51090 Vienna/Austria
Tel.: +43-(0)1-313 04Fax: +43-(0)1-313 04/5400