Embed Size (px)
Citation preview
S t a t i s t i k e n
Austr ia ’s Internat ional Investment Posit ion
in 2006
S p e c i a l I s s u e
November 07Stab i l i t y and Secur i ty.
Irregular special issues of the “Statistiken – Daten & Analysen” series provide detailed information on special statistical topics.
Editors in chief Aurel Schubert, Gerhard Kaltenbeck, Michael Pfeiffer
Coordination Patrick Thienel, Isabel Winkler
Editorial processing Karin Fischer, Susanne Pelz
Translation Ingrid Haussteiner, Rena Mühldorf
Technical production Peter Buchegger (design) Susanne Sapik (layout, typesetting) OeNB Printing Office (printing and production)
Inquiries Oesterreichische Nationalbank Statistics Section/Statistics Hotline or Communications Division Postal address: PO Box 61, 1011 Vienna, Austria Phone: Statistics Hotline (+43-1) 404 20-5555 Communications Division (+43-1) 404 20-6666 Fax: Statistics Hotline (+43-1) 404 20-5499 Communications Division (+43-1) 404 20-6698 E-mail: [email protected] or [email protected]
Orders/address management Oesterreichische Nationalbank Documentation Management and Communications Services Postal address: PO Box 61, 1011 Vienna, Austria Phone: (+43-1) 404 20-2345 Fax: (+43-1) 404 20-2398 E-mail: [email protected]
Imprint Publisher and editor: Oesterreichische Nationalbank Otto-Wagner-Platz 3, 1090 Vienna, Austria Günther Thonabauer, Communications Division Internet: www.oenb.at Printed by: Oesterreichische Nationalbank, 1090 Vienna, Austria © Oesterreichische Nationalbank, 2008 All rights reserved. May be reproduced for noncommercial and educational purposes with appropriate credit.
DVR 0031577
Vienna, 2008 REG.NO. AT- 000311
Statistiken Special Is sue November 07 ◊ 3
Contents
Preface 4
1 Results for 2006 5 1.1 Overview 5 1.1.1 Global Framework 5 1.1.2 Wiener Börse’s Performance Remains Powerful 5 1.1.3 Austria’s Financial Integration Continues at a Rapid Pace 5 1.2 Austrian Investors’ External Financial Assets 8 1.2.1 The Euro Area Predominates Austria’s International Financial Relations
despite the Strong Concentration of Investment in Eastern Europe 8 1.2.2 Securities Still Represent a Growing Share of Austrian
External Financial Activities 10 1.2.3 Positive Environment for Stocks Encourages Austrian Investors 11 1.3 Austrian External Financial Liabilities 12 1.3.1 Bank Deposits: An Alternative to Securities Financing 12 1.3.2 Bullish Performance of Austrian Stocks Continues 12 1.4 References 13
2 Notes 14 2.1 Compilation Method for and Analytical Value of the
International Investment Position 14 2.2 Links between the International Investment Position, the Balance of Payments
and the Financial Accounts 14 2.2.1 Balance of Payments and International Investment Position 15 2.2.2 Financial Accounts and International Investment Position 15
3 Glossary 16
4 Tables 18
5 Overview of Special Issues 26
4 ◊ Statistiken Special Is sue November 07
Preface
International financial markets have grown enormously in the past two decades; not only have trading vol-umes skyrocketed, but financial mar-ket complexity has also increased tremendously. In the face of a finan-cial industry that keeps launching innovative products irrespective of real economic processes, it is becom-ing increasingly harder for amateur and expert investors alike to properly assess such products and their implica-tions. As we move toward a more and more interdependent global financial marketplace, individual market par-ticipants may reap numerous benefits, such as better ways to diversify risk and declining transaction costs. At the same time, investors face grow-ing risks resulting from the increas-ingly complex and integrated finan-cial markets. As a case in point, the recent developments in the U.S. real estate markets have once again dem-onstrated that local disturbances on key financial markets more or less in-evitably produce global spillover ef-fects. Hence, maintaining financial stability cannot be limited to national mechanisms, but has instead in many respects evolved into an international challenge. Cross-border cooperation has come to play an important role
especially in producing and providing sound financial data, as such data are crucial for identifying and under-standing economic developments. Given their expertise, central banks, in particular, are called upon to ad-dress this need for information.
The Oesterreichische National-bank (OeNB) compiles and makes available a wide range of financial statistics both in the Internet and in the form of numerous print products. This publication on the international investment position (IIP) analyzes recent developments in Austria’s investment and financing activities in the international capital markets. Compared with the balance of pay-ments statistics, which are also pub-lished regularly by the OeNB, this IIP analysis not only sheds light on transaction-based changes, but also on valuation effects, such as exchange rate and equity price developments. Such changes in stocks on account of wealth effects are becoming increa-singly significant, given the rapidly rising importance of securities for the Austrian financial sector.
The annex of tables provides detailed information about regional and sectoral aspects of the IIP. A glossary defines key concepts.
Statistiken Special Is sue November 07 ◊ 5
1 Results for 2006 1
1.1 Overview1.1.1 Global Framework
World economic growth temporarily peaked in 2006 at 5.4%2 annual GDP growth. Next to China, which has been posting double-digit growth for some time now, other important eco-nomic regions – the U.S.A., Japan and Europe – experienced robust economic activity. Not even the mas-sive rise in oil prices could crimp eco-nomic growth. The development of international capital flows was marked by this highly favorable eco-nomic environment as well as by in-creasing interest rates, bullish equity markets and the sustained rise in the value of the euro against the U.S. dollar (+11%) and the Japanese yen (+12%).
1.1.2 Wiener Börse’s Performance
Remains Powerful
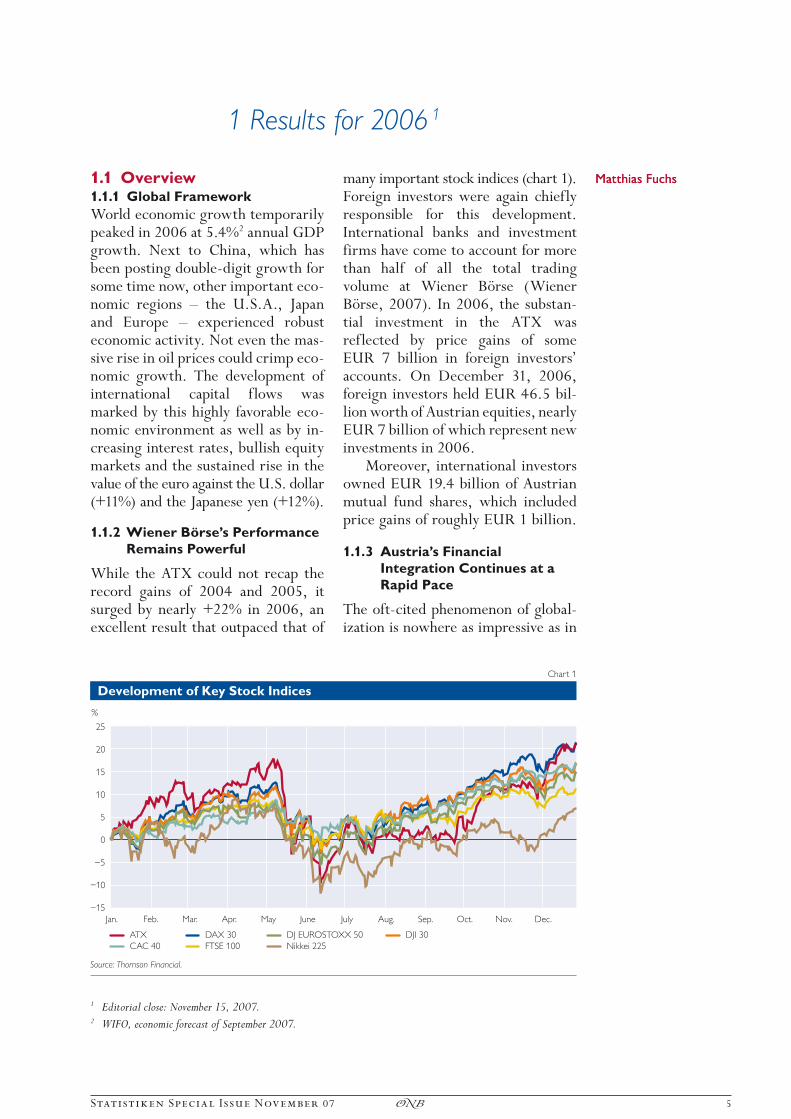
While the ATX could not recap the record gains of 2004 and 2005, it surged by nearly +22% in 2006, an excellent result that outpaced that of
many important stock indices (chart 1). Foreign investors were again chiefly responsible for this development. Inter national banks and investment firms have come to account for more than half of all the total trading volume at Wiener Börse (Wiener Börse, 2007). In 2006, the substan-tial investment in the ATX was reflected by price gains of some EUR 7 billion in foreign investors’ accounts. On December 31, 2006, foreign investors held EUR 46.5 bil-lion worth of Austrian equities, nearly EUR 7 billion of which represent new investments in 2006.
Moreover, international investors owned EUR 19.4 billion of Austrian mutual fund shares, which included price gains of roughly EUR 1 billion.
1.1.3 Austria’s Financial
Integration Continues at a
Rapid Pace
The oft-cited phenomenon of global-ization is nowhere as impressive as in
Matthias FuchsMatthias Fuchs
1 Editorial close: November 15, 2007.2 WIFO, economic forecast of September 2007.
Development of Key Stock Indices
25
20
15
10
5
0
–5
–10
–15
%
ATX
Jan.
DAX 30
Feb. Mar. Apr. May June July Aug. Sep. Oct. Nov. Dec.
DJ EUROSTOXX 50 DJI 30
CAC 40 FTSE 100 Nikkei 225
Chart 1
Source: Thomson Financial.

Results for 2006
6 ◊ Statistiken Special Is sue November 07
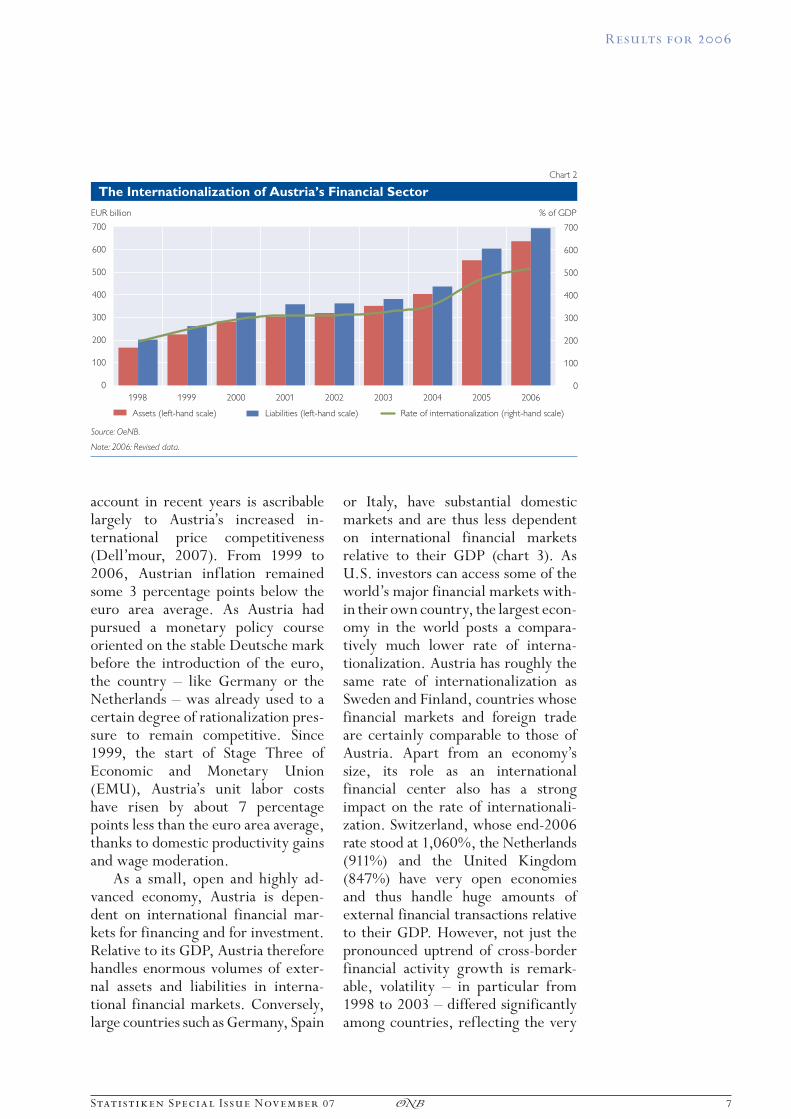
the financial markets. It is conven-tional wisdom that national borders have long stopped playing a role for raising and investing capital in ad-vanced industrialized economies. How ever, the change in volumes of international financial transactions is striking. Capital flows are increas-ingly unrelated to real economic de-velopments, and foreign trade repre-sents a shrinking share of industrial-ized economies’ cross-border finan-cial transactions (IMF, 2006). This trend is true of Austria as well, where, at the end of 2006, total financial as-sets and liabilities came to five times the volume of annual economic out-put in Austria. Since 1999, the rate of internationalization (ratio of total ex-ternal assets and liabilities to GDP) has more than doubled (chart 2). By the end of 2006, Austria’s external assets had expanded to EUR 636 bil-lion, external liabilities to EUR 693 billion. The dip in the growth of in-ternationalization from 2001 to 2003 is linked to the bursting of the New Economy bubble. Widespread inse-curity among international investors led to substantial asset price losses and a considerable decline in transac-tions in the international financial markets.
Austria has traditionally been a net debtor vis-à-vis nonresidents. In 2006, the gap between external assets and external liabilities widened to EUR 57 billion (2005: EUR 51 billion), reflecting international investors’ ro-bust demand for Austrian securities. At the end of 2006, external liabili-ties from total portfolio liabilities came to EUR 338 billion, more than EUR 40 billion above the comparable 2005 value. Some 40% of this rise is
attributable to sales of equities and mutual fund shares. The appetite foreign investors have shown for Austrian securities is a sign of their confidence in the Austrian capital market and illustrates their willing-ness to provide the Austrian economy with funds that would otherwise be hard to raise given the relatively small size of the Austrian capital market. From this perspective, Austria’s net debtor status should not be seen as principally negative, as long as the capital inflows are put to productive use. As a rule, though, a long-term external net debtor position comes at the price of net income payments abroad, because when external lia-bilities outpace external assets, out-flows of income on securities exceed inflows in the same category.3 Austria’s net debtor position is partly attributable to the history of the country’s current account, which was generally in deficit until the end of the 1990s. Net capital imports were needed to finance these deficits; over time, these imports accrued to pro-duce Austria’s net debtor position. The shift into surplus of Austria’s cur-rent account that has been observable for some years counteracts this trend, however. Since 2004, Austria has been a net exporter of capital, while at the same time posting current ac-count surpluses. Therefore, analyzed in isolation, the real capital compo-nent of the financial account indicates a debt reduction. In 2006, this de-velopment was more than offset by price gains on foreign investors’ assets in Austria, not least on ATX invest ments, resulting in an overall deterioration of the net debtor posi-tion. The improvement of the current
3 Under exceptional conditions, however, net debtor countries may generate a positive return on net assets (Fuchs, 2005).
Results for 2006
Statistiken Special Is sue November 07 ◊ 7
account in recent years is ascribable largely to Austria’s increased in-ternational price competitiveness (Dell’mour, 2007). From 1999 to 2006, Austrian inflation remained some 3 percentage points below the euro area average. As Austria had pursued a monetary policy course oriented on the stable Deutsche mark before the introduction of the euro, the country – like Germany or the Netherlands – was already used to a certain degree of rationalization pres-sure to remain competitive. Since 1999, the start of Stage Three of Economic and Monetary Union (EMU), Austria’s unit labor costs have risen by about 7 percentage points less than the euro area average, thanks to domestic productivity gains and wage moderation.
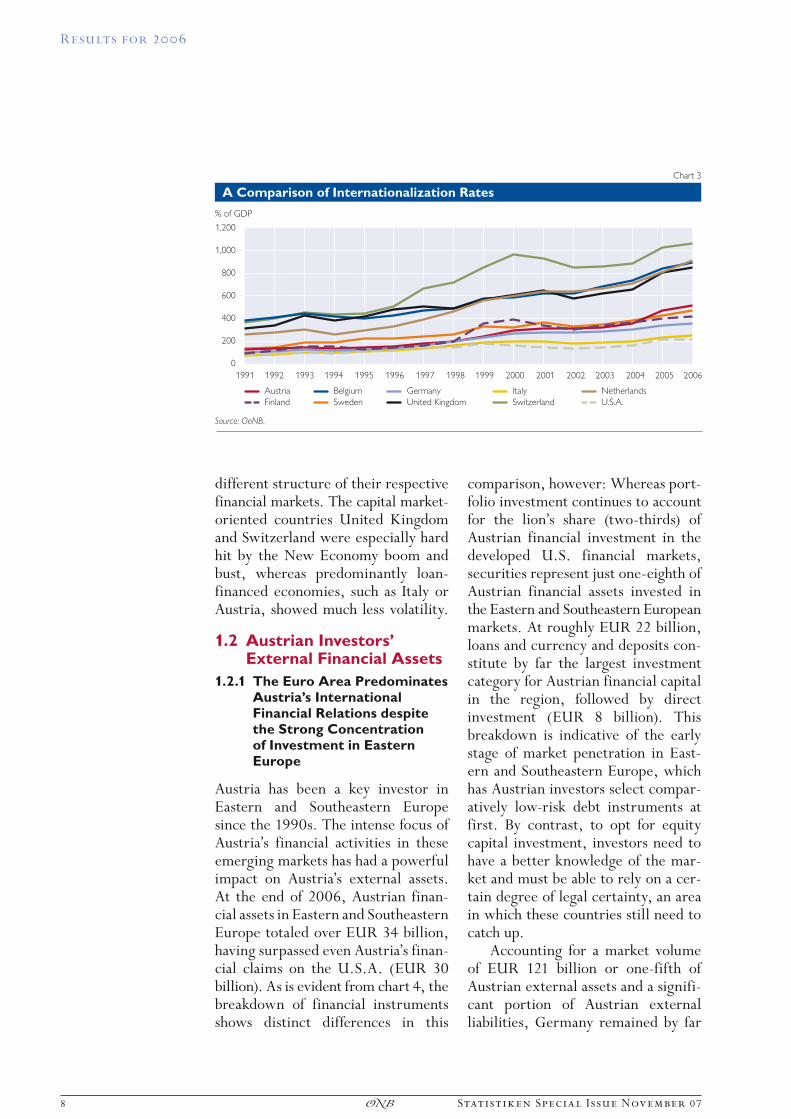
As a small, open and highly ad-vanced economy, Austria is depen-dent on international financial mar-kets for financing and for investment. Relative to its GDP, Austria therefore handles enormous volumes of exter-nal assets and liabilities in interna-tional financial markets. Conversely, large countries such as Germany, Spain
or Italy, have substantial domestic markets and are thus less dependent on international financial markets rel ative to their GDP (chart 3). As U.S. investors can access some of the world’s major financial markets with-in their own country, the largest econ-omy in the world posts a compara-tively much lower rate of interna-tionalization. Austria has roughly the same rate of internationalization as Sweden and Finland, countries whose financial markets and foreign trade are certainly comparable to those of Austria. Apart from an economy’s size, its role as an international financial center also has a strong impact on the rate of international i-zation. Switzerland, whose end-2006 rate stood at 1,060%, the Netherlands (911%) and the United Kingdom (847%) have very open economies and thus handle huge amounts of external financial transactions relative to their GDP. However, not just the pronounced uptrend of cross-border financial activity growth is remark-able, volatility – in particular from 1998 to 2003 – differed significantly among countries, reflecting the very
700
600
500
400
300
200
100
0
Assets (left-hand scale)
Source: OeNB.
Note: 2006: Revised data.
700
600
500
400
300
200
100
0
% of GDP
1998 1999 2000 2001 2002 2003 2004 2005 2006
Liabilities (left-hand scale) Rate of internationalization (right-hand scale)
Chart 2
The Internationalization of Austria’s Financial Sector
EUR billion
Results for 2006
8 ◊ Statistiken Special Is sue November 07
different structure of their respective financial markets. The capital market-oriented countries United Kingdom and Switzerland were especially hard hit by the New Economy boom and bust, whereas predominantly loan- financed economies, such as Italy or Austria, showed much less volatility.
1.2 Austrian Investors’ External Financial Assets
1.2.1 The Euro Area Predominates Austria’s International Financial Relations despite the Strong Concentration of Investment in Eastern Europe
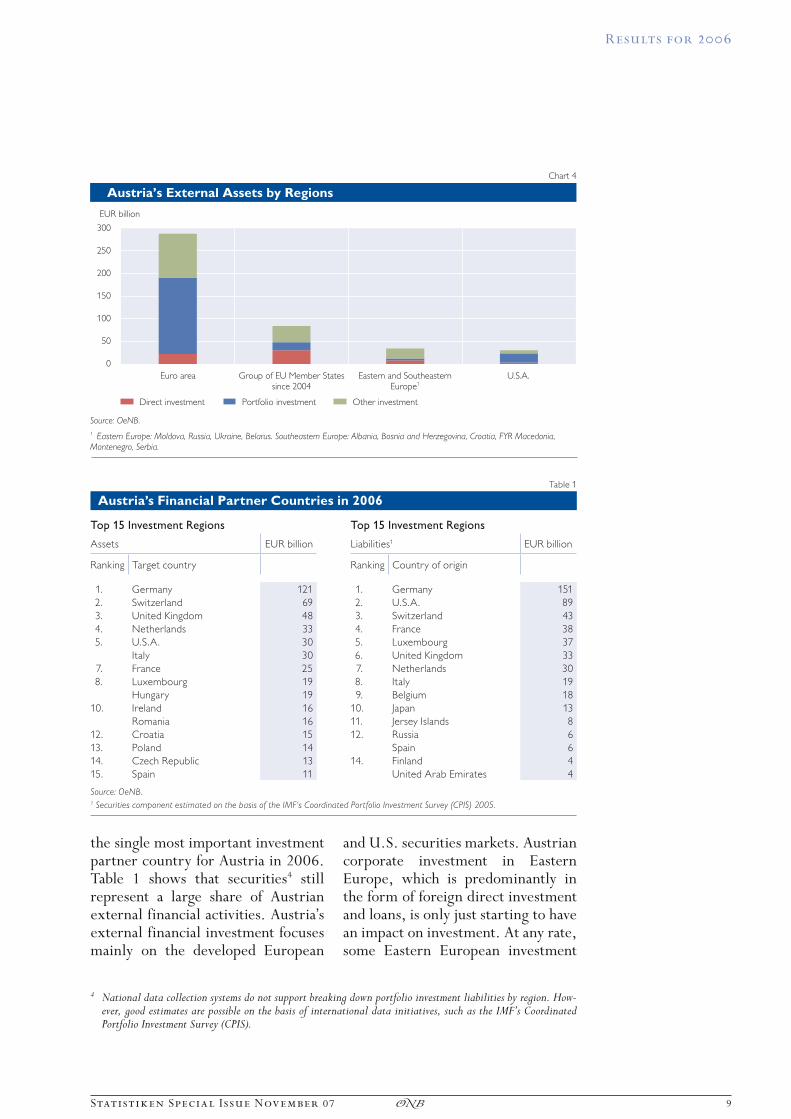
Austria has been a key investor in Eastern and Southeastern Europe since the 1990s. The intense focus of Austria’s financial activities in these emerging markets has had a powerful impact on Austria’s external assets. At the end of 2006, Austrian finan-cial assets in Eastern and South eastern Europe totaled over EUR 34 billion, having surpassed even Austria’s finan-cial claims on the U.S.A. (EUR 30 billion). As is evident from chart 4, the breakdown of financial instruments shows distinct differences in this
comparison, however: Whereas port-folio investment continues to account for the lion’s share (two-thirds) of Austrian financial investment in the developed U.S. financial markets, securities represent just one-eighth of Austrian financial assets invested in the Eastern and Southeastern European markets. At roughly EUR 22 billion, loans and currency and deposits con-stitute by far the largest investment category for Austrian financial capital in the region, followed by direct invest ment (EUR 8 billion). This breakdown is indicative of the early stage of market penetration in East-ern and Southeastern Europe, which has Austrian investors select compar-atively low-risk debt instruments at first. By contrast, to opt for equity capital investment, investors need to have a better knowledge of the mar-ket and must be able to rely on a cer-tain degree of legal certainty, an area in which these countries still need to catch up.
Accounting for a market volume of EUR 121 billion or one-fifth of Austrian external assets and a signifi-cant portion of Austrian external liabilities, Germany remained by far
1992
1,200
1,000
800
600
400
200
0
% of GDP
Austria Belgium Germany Italy Netherlands
1993 1994 1995 1996 1997 1998 1999 2000 2001 2002 2003 2004 20051991
Finland Sweden United Kingdom Switzerland U.S.A.
2006
Chart 3
A Comparison of Internationalization Rates
Source: OeNB.
Results for 2006
Statistiken Special Is sue November 07 ◊ 9
the single most important investment partner country for Austria in 2006. Table 1 shows that securities4 still represent a large share of Austrian external financial activities. Austria’s external financial investment focuses mainly on the developed European
and U.S. securities markets. Austrian corporate investment in Eastern Europe, which is predominantly in the form of foreign direct investment and loans, is only just starting to have an impact on investment. At any rate, some Eastern European investment
Euro area
300
250
200
150
100
50
0
EUR billion
Group of EU Member Statessince 2004
Eastern and SoutheasternEurope1
Direct investment Portfolio investment Other investment
U.S.A.
Source: OeNB.
1 Eastern Europe: Moldova, Russia, Ukraine, Belarus. Southeastern Europe: Albania, Bosnia and Herzegovina, Croatia, FYR Macedonia, Montenegro, Serbia.
Chart 4
Austria’s External Assets by Regions
Table 1
Austria’s Financial Partner Countries in 2006
Top 15 Investment Regions Top 15 Investment Regions
Assets EUR billion Liabilities1 EUR billion
Ranking Target country Ranking Country of origin
1. Germany 121 1. Germany 151
2. Switzerland 69 2. U.S.A. 89
3. United Kingdom 48 3. Switzerland 43
4. Netherlands 33 4. France 38
5. U.S.A. 30 5. Luxembourg 37
Italy 30 6. United Kingdom 33
7. France 25 7. Netherlands 30
8. Luxembourg 19 8. Italy 19
Hungary 19 9. Belgium 18
10. Ireland 16 10. Japan 13
Romania 16 11. Jersey Islands 8
12. Croatia 15 12. Russia 6
13. Poland 14 Spain 6
14. Czech Republic 13 14. Finland 4
15. Spain 11 United Arab Emirates 4
Source: OeNB.1 Securities component estimated on the basis of the IMF‘s Coordinated Portfolio Investment Survey (CPIS) 2005.
4 National data collection systems do not support breaking down portfolio investment liabilities by region. How-ever, good estimates are possible on the basis of international data initiatives, such as the IMF’s Coordinated Portfolio Investment Survey (CPIS).
Results for 2006
10 ◊ Statistiken Special Is sue November 07
target countries – such as Hungary, Poland, Romania or Croatia – have already surpassed several more tradi-tional investment targets, such as Japan, Spain and Belgium, in terms of investment volumes.
1.2.2 Securities Still Represent
a Growing Share of
Austrian External
Financial Activities
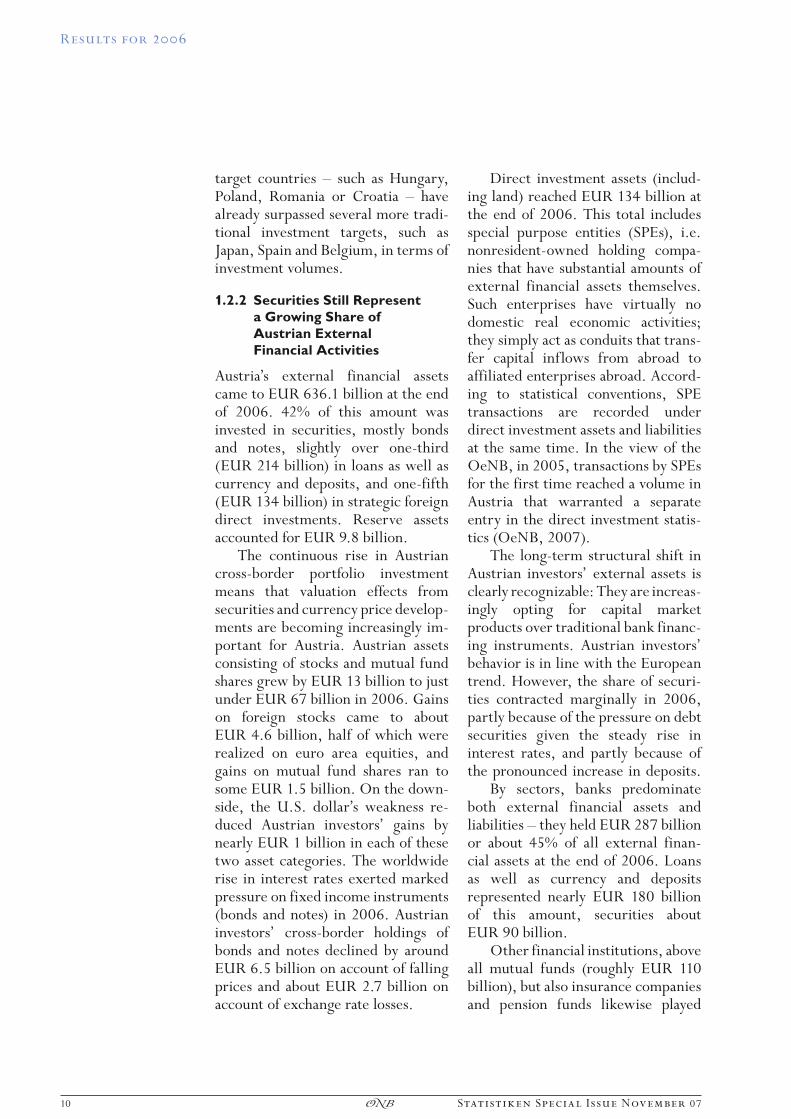
Austria’s external financial assets came to EUR 636.1 billion at the end of 2006. 42% of this amount was invested in securities, mostly bonds and notes, slightly over one-third (EUR 214 billion) in loans as well as currency and deposits, and one-fifth (EUR 134 billion) in strategic foreign direct investments. Reserve assets accounted for EUR 9.8 billion.
The continuous rise in Austrian cross-border portfolio investment means that valuation effects from securities and currency price develop-ments are becoming increasingly im-portant for Austria. Austrian assets consisting of stocks and mutual fund shares grew by EUR 13 billion to just under EUR 67 billion in 2006. Gains on foreign stocks came to about EUR 4.6 billion, half of which were realized on euro area equities, and gains on mutual fund shares ran to some EUR 1.5 billion. On the down-side, the U.S. dollar’s weakness re-duced Austrian investors’ gains by nearly EUR 1 billion in each of these two asset categories. The worldwide rise in interest rates exerted marked pressure on fixed income instruments (bonds and notes) in 2006. Austrian investors’ cross-border holdings of bonds and notes declined by around EUR 6.5 billion on account of falling prices and about EUR 2.7 billion on account of exchange rate losses.
Direct investment assets (includ-ing land) reached EUR 134 billion at the end of 2006. This total includes special purpose entities (SPEs), i.e. nonresident-owned holding compa-nies that have substantial amounts of external financial assets themselves. Such enterprises have virtually no domestic real economic activities; they simply act as conduits that trans-fer capital inflows from abroad to affiliated enterprises abroad. Accord-ing to statistical conventions, SPE transactions are recorded under direct investment assets and liabilities at the same time. In the view of the OeNB, in 2005, transactions by SPEs for the first time reached a volume in Austria that warranted a separate entry in the direct investment statis-tics (OeNB, 2007).
The long-term structural shift in Austrian investors’ external assets is clearly recognizable: They are increas-ingly opting for capital market products over traditional bank financ-ing instruments. Austrian investors’ behavior is in line with the European trend. However, the share of securi-ties contracted marginally in 2006, partly because of the pressure on debt securities given the steady rise in interest rates, and partly because of the pronounced increase in deposits.
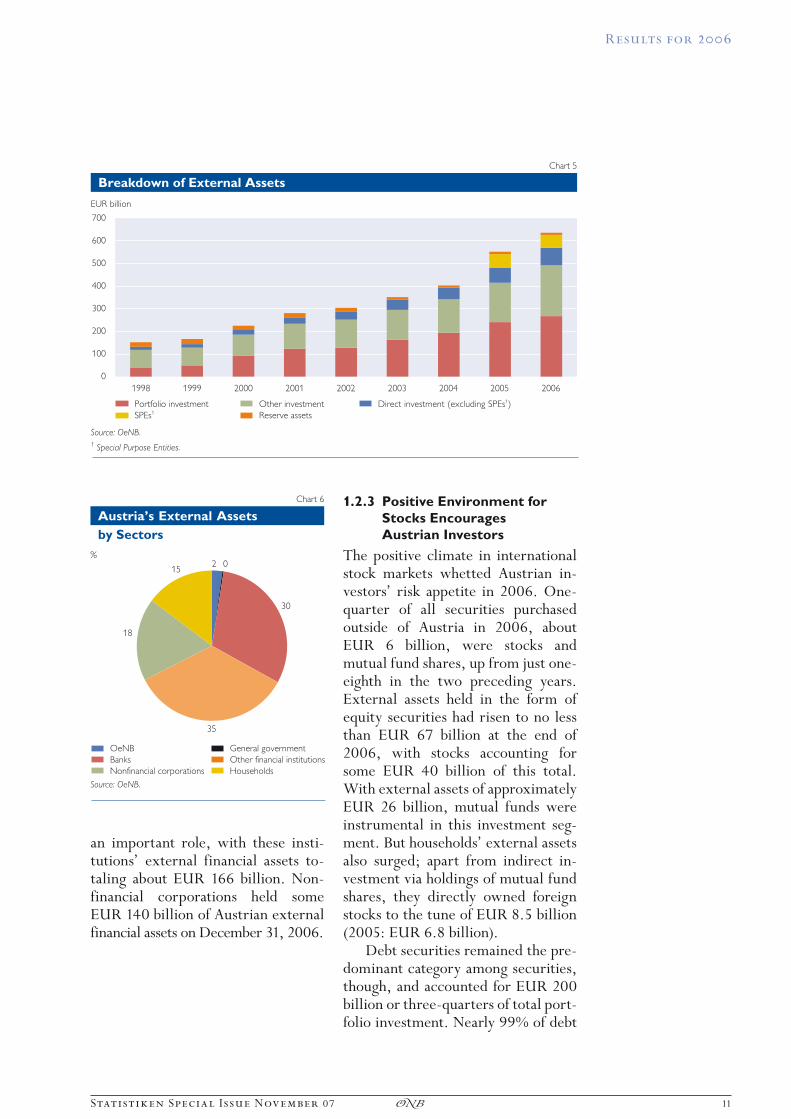
By sectors, banks predominate both external financial assets and liabilities – they held EUR 287 billion or about 45% of all external finan-cial assets at the end of 2006. Loans as well as currency and deposits represented nearly EUR 180 billion of this amount, securities about EUR 90 billion.
Other financial institutions, above all mutual funds (roughly EUR 110 billion), but also insurance companies and pension funds likewise played
Results for 2006
Statistiken Special Is sue November 07 ◊ 11
an important role, with these insti-tutions’ external financial assets to-taling about EUR 166 billion. Non-financial corporations held some EUR 140 billion of Austrian external financial assets on December 31, 2006.
1.2.3 Positive Environment for
Stocks Encourages
Austrian Investors
The positive climate in international stock markets whetted Austrian in-vestors’ risk appetite in 2006. One-quarter of all securities purchased outside of Austria in 2006, about EUR 6 billion, were stocks and mutual fund shares, up from just one-eighth in the two preceding years. External assets held in the form of equity securities had risen to no less than EUR 67 billion at the end of 2006, with stocks accounting for some EUR 40 billion of this total. With external assets of approximately EUR 26 billion, mutual funds were instrumental in this investment seg-ment. But households’ external assets also surged; apart from indirect in-vestment via holdings of mutual fund shares, they directly owned foreign stocks to the tune of EUR 8.5 billion (2005: EUR 6.8 billion).
Debt securities remained the pre-dominant category among securities, though, and accounted for EUR 200 billion or three-quarters of total port-folio investment. Nearly 99% of debt
1998
700
600
500
400
300
200
100
0
EUR billion
1999 2000
Portfolio investment Other investment Direct investment (excluding SPEs1)
2001 2002 2003 2004 2005 2006
SPEs1 Reserve assets
Source: OeNB.
1 Special Purpose Entities.
Chart 5
Breakdown of External Assets
OeNB General government
Banks Other financial institutions
18
35
30
152
Nonfinancial corporations Households
%0
Source: OeNB.
Austria’s External Assets
by Sectors
Chart 6
Results for 2006
12 ◊ Statistiken Special Is sue November 07
securities had an original maturity of over one year.
1.3 Austrian External Financial Liabilities
1.3.1 Bank Deposits: An Alterna-tive to Securities Financing
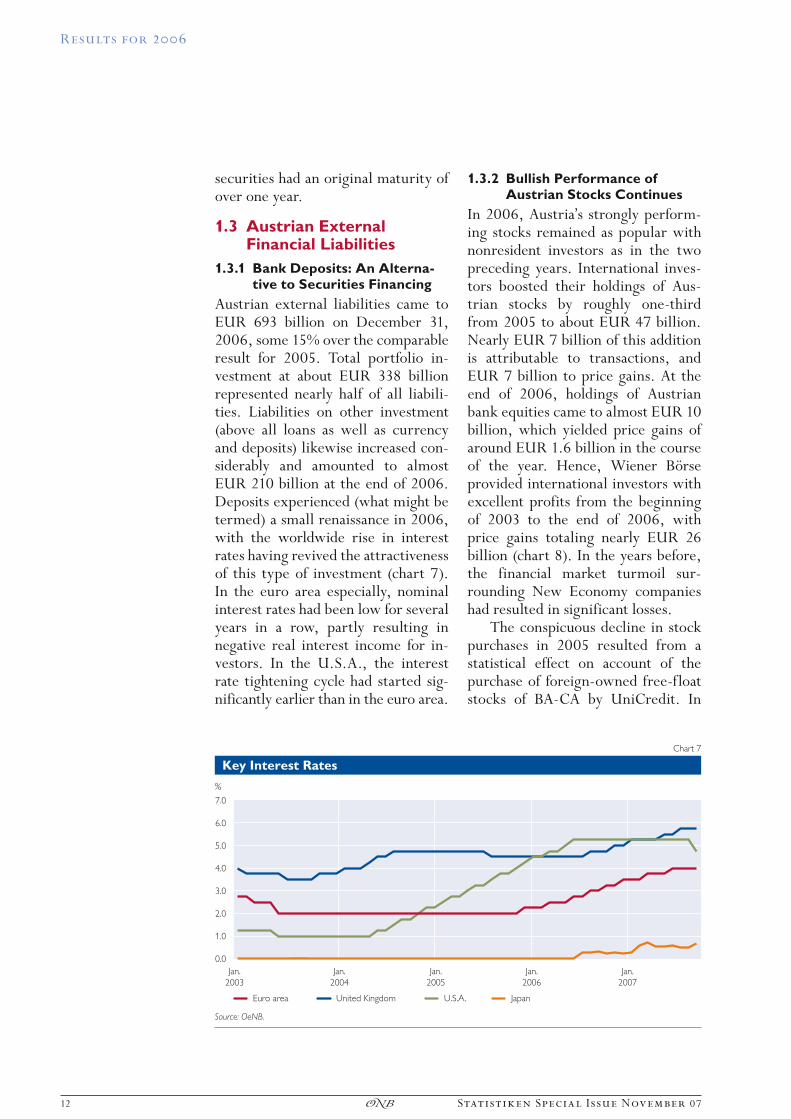
Austrian external liabilities came to EUR 693 billion on December 31, 2006, some 15% over the comparable result for 2005. Total portfolio in-vestment at about EUR 338 billion represented nearly half of all liabili-ties. Liabilities on other investment (above all loans as well as currency and deposits) likewise increased con-siderably and amounted to almost EUR 210 billion at the end of 2006. Deposits experienced (what might be termed) a small renaissance in 2006, with the worldwide rise in interest rates having revived the attractiveness of this type of investment (chart 7). In the euro area especially, nominal interest rates had been low for several years in a row, partly resulting in negative real interest income for in-vestors. In the U.S.A., the interest rate tightening cycle had started sig-nificantly earlier than in the euro area.
1.3.2 Bullish Performance of Austrian Stocks Continues
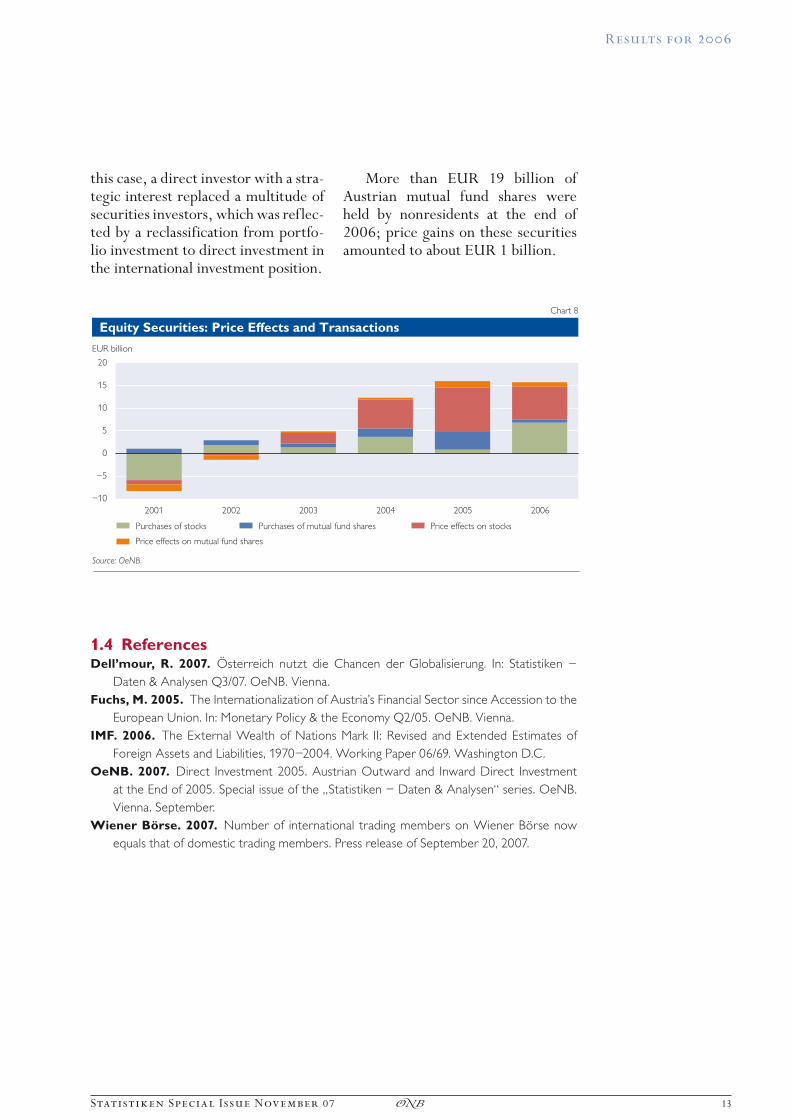
In 2006, Austria’s strongly perform-ing stocks remained as popular with nonresident investors as in the two preceding years. International inves-tors boosted their holdings of Aus-trian stocks by roughly one-third from 2005 to about EUR 47 billion. Nearly EUR 7 billion of this addition is attributable to transactions, and EUR 7 billion to price gains. At the end of 2006, holdings of Austrian bank equities came to almost EUR 10 billion, which yielded price gains of around EUR 1.6 billion in the course of the year. Hence, Wiener Börse provided international investors with excellent profits from the beginning of 2003 to the end of 2006, with price gains totaling nearly EUR 26 billion (chart 8). In the years before, the financial market turmoil sur-rounding New Economy companies had resulted in significant losses.
The conspicuous decline in stock purchases in 2005 resulted from a statistical effect on account of the purchase of foreign-owned free-float stocks of BA-CA by UniCredit. In
Source: OeNB.
Jan.
2003
Jan.
2004
Jan.
2005
Jan.
2006
Jan.
2007
Euro area
7.0
6.0
5.0
4.0
3.0
2.0
1.0
0.0
United Kingdom U.S.A. Japan
Chart 7
Key Interest Rates
%
Results for 2006
Statistiken Special Is sue November 07 ◊ 13
this case, a direct investor with a stra-tegic interest replaced a multitude of securities investors, which was reflec-ted by a reclassification from portfo-lio investment to direct investment in the international investment position.
More than EUR 19 billion of Austrian mutual fund shares were held by nonresidents at the end of 2006; price gains on these securities amounted to about EUR 1 billion.
2001
20
15
10
5
0
–5
–10
EUR billion
2002 2003
Purchases of stocks Purchases of mutual fund shares Price effects on stocks
2004 2005 2006
Price effects on mutual fund shares
Source: OeNB.
Chart 8
Equity Securities: Price Effects and Transactions
1.4 ReferencesDell’mour, R. 2007. Österreich nutzt die Chancen der Globalisierung. In: Statistiken –
Daten & Analysen Q3/07. OeNB. Vienna.
Fuchs, M. 2005. The Internationalization of Austria’s Financial Sector since Accession to the
European Union. In: Monetary Policy & the Economy Q2/05. OeNB. Vienna.
IMF. 2006. The External Wealth of Nations Mark II: Revised and Extended Estimates of
Foreign Assets and Liabilities, 1970–2004. Working Paper 06/69. Washington D.C.
OeNB. 2007. Direct Investment 2005. Austrian Outward and Inward Direct Investment
at the End of 2005. Special issue of the „Statistiken – Daten & Analysen“ series. OeNB.
Vienna. September.
Wiener Börse. 2007. Number of international trading members on Wiener Börse now
equals that of domestic trading members. Press release of September 20, 2007.
14 ◊ Statistiken Special Is sue November 07
2 Notes
2.1 Compilation Method for and Analytical Value of the International Investment Position
Austria’s IIP is drawn up on the basis of the specifications laid down in the fifth edition of the IMF’s Balance of Payments Manual. The IIP is the balance sheet of the stock of Austrian external financial assets and liabilities on a specific date; the difference be-tween the stock of financial assets and the stock of financial liabilities is the net IIP (net position).
Additionally, the IIP provides a full explanation of the net changes in the stock of external financial assets between two reporting dates. This net change is the result of transac-tions (increase and decrease in stocks of assets and liabilities) and non-trans-action-related changes. The latter in-clude differences (exchange rate or price changes) in the value of stocks at two dates and accounting changes, such as writedowns.
The IIP is subclassified by func-tion – direct investment, portfolio investment, other investment and re-serve assets – by analogy to the ba-lance of payments financial account. The regional breakdown of external assets and liabilities provides insight into the financial links to specific economic areas. Within a national reporting system, a regional break-down may be made for all asset cate-gories, and for liabilities under direct investment and other investment. Addi tional information is required for the breakdown of liabilities from securities investment, as the country of residence of the holders of Austrian-
issued securities cannot be immedia-tely determined. Using an interna-tional data exchange system such as the CPIS5 framework allows for a good approximation, though.
Stock data are more stable and therefore provide much more reliable structural information than trans-action data alone, which are fre-quently subject to large fluctuations over time. Hence, IIP data are espe-cially suitable for answering questions about the long-term changes in the external financing structure of an economy. Classifying financial ins-truments into equity and debt secu-rities provides valuable analytical infor mation, in particular in assessing default risk and future investment income opportunities on external assets. Judging the significance of an economy’s net international invest-ment position certainly requires an in-depth analysis of IIP developments. A persistent net debtor position resulting from the financing of con-sumption must be seen in a more cri-tical light than a net debtor position resulting from the financing of pro-ductive fixed capital formation.
2.2 Links between the International Investment Position, the Balance of Payments and the Financial Accounts
The international investment position, the balance of payments and the financial accounts are indicators of an economy’s national wealth and financ-ing situation, and, based on common definitions, represent its external eco n omic relations.
5 Coordinated Portfolio Investment Survey of the IMF. Within the framework of this survey, currently some 70 countries, including all major industrial countries, provide a breakdown of their stock of portfolio invest-ment assets by the country of residency of the nonresident issuer. A country-by-country breakdown of regional portfolio liabilities is possible using the consolidated survey data.
Notes
Statistiken Special Is sue November 07 ◊ 15
2.2.1 Balance of Payments and International Investment Position
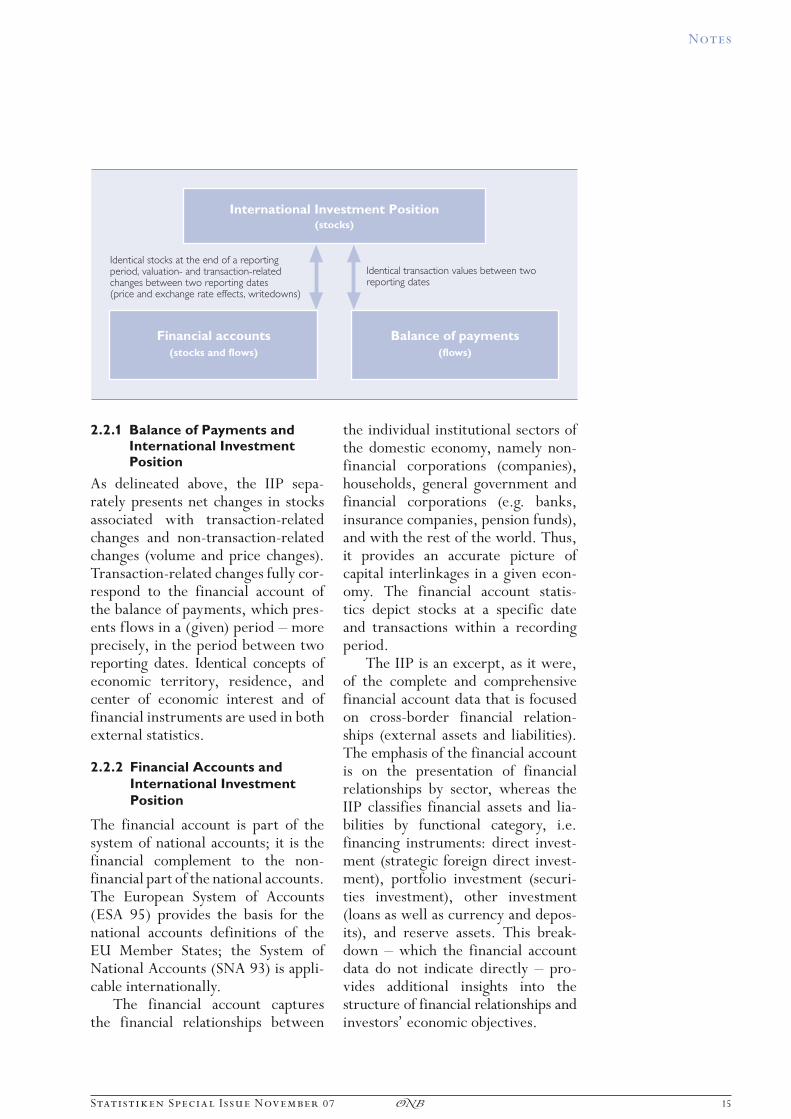
As delineated above, the IIP sepa-rately presents net changes in stocks associated with transaction-related changes and non-transaction-related changes (volume and price changes). Transaction-related changes fully cor-respond to the financial account of the balance of payments, which pres-ents flows in a (given) period – more precisely, in the period between two reporting dates. Identical concepts of economic territory, residence, and center of economic interest and of financial instruments are used in both external statistics.
2.2.2 Financial Accounts and
International Investment
Position
The financial account is part of the system of national accounts; it is the financial complement to the non-financial part of the national accounts. The European System of Accounts (ESA 95) provides the basis for the national accounts definitions of the EU Member States; the System of National Accounts (SNA 93) is appli-cable internationally.
The financial account captures the financial relationships between
the individual institutional sectors of the domestic economy, namely non-financial corporations (companies), households, general government and financial corporations (e.g. banks, insurance companies, pension funds), and with the rest of the world. Thus, it provides an accurate picture of capi tal interlinkages in a given econ-omy. The financial account statis -tics depict stocks at a specific date and transactions within a recording period.
The IIP is an excerpt, as it were, of the complete and comprehensive financial account data that is focused on cross-border financial relation-ships (external assets and liabilities). The emphasis of the financial account is on the presentation of financial relationships by sector, whereas the IIP classifies financial assets and lia-bilities by functional category, i.e. financ ing instruments: direct invest-ment (strategic foreign direct invest-ment), portfolio investment (securi-ties investment), other investment (loans as well as currency and depos-its), and reserve assets. This break-down – which the financial account data do not indicate directly – pro-vides additional insights into the structure of financial relationships and investors’ economic objectives.
International Investment Position(stocks)
Financial accounts
(stocks and flows)
Identical stocks at the end of a reportingperiod, valuation- and transaction-relatedchanges between two reporting dates(price and exchange rate effects, writedowns)
Identical transaction values between tworeporting dates
Balance of payments
(flows)
16 ◊ Statistiken Special Is sue November 07
Banks: All financial corporations (except the OeNB) and quasi-corpora-tions which are principally engaged in financial intermediation and whose business is to receive deposits and/or close substitutes for deposits from in-stitutional units other than monetary financial institutions, and, for their own account, to grant loans and/or to make investments in securities.Bonds and notes: Debt securities with an original maturity of more than one year.Currency and deposits: Bank notes, base metal coins, bimetallic coins, silver coins, transferable deposits with banks (personal checking accounts, sight deposits), time de posits, saving deposits and cash pooling accounts.Direct investment: International investment that reflects the objective of a resident entity in one economy to obtain a lasting interest in an entity resident in an economy other than that of the investor, and supplies of other capital to further enterprise operations. The lasting interest im-plies the existence of a long-term relationship between the direct inves-tor and the enterprise and a signi-ficant degree of influence on the management of the enterprise. This distinguishes direct investment, which is motivated primarily by the objec-tive of exercising a significant influ-ence through an effective voice in management, from portfolio invest-ment, which is motivated prima rily by financial gain. Direct investment must represent ownership of at least 10% of the ordinary shares or voting power. Holdings totaling EUR 72,000 and over must be reported. Direct investment comprises equity capital and reinvested earnings as well as other capital (intercompany debt transactions).
Equity securities: Stocks and mu-tual fund shares.General government: Central gov-ernment, regional governments, local governments, social security funds as well as public trade associations and organizations.Households: Individuals (including own-account workers) and nonprofit institutions with a separate legal per-sonality that are principally engaged in the production of nonmarket goods and services and serve households (in Austria, e.g. trade unions, churches and private foundations).International investment position (IIP): A financial statement that pres-ents an economy’s stock of external financial assets and liabilities on a specific date. The net international investment position is the stock of external financial assets minus the stock of external liabilities and com-prises the categories direct invest-ment, portfolio investment, other investment and reserve assets. Addi-tionally, the IIP is the complete statis-tical statement of stocks of external assets and liabilities on the basis of current market values including detailed breakdowns by regions, sec-tors and instruments.Money market instruments: Debt securities with an original term to maturity of one year or less.Nonfinancial corporations: Ac-cording to the European System of Accounts (ESA 95), institutional units whose distributive and financial transactions are distinct from those of their owners and which are market producers whose principal activity is the production of goods and non-financial services.Other financial institutions: In particular, mutual funds, pension funds and insurance corporations.
3 Glossary
Glossary
Statistiken Special Is sue November 07 ◊ 17
Other investment: All investment not classified under direct invest-ment, portfolio investment, financial derivatives or reserve assets. This includes, in particular, currency and deposits, and long- and short-term loans.Other sectors: Comprises other financial intermediaries, nonfinancial corporations, and households.Portfolio investment: Cross-border investment in equity securities and debt securities in the form of bonds and notes, and money market instru-ments. Rate of internationalization: Ratio of total external assets and liabilities to GDP. This ratio serves as an indi-cator of an economy’s degree of inter-nationalization.Reserve assets: External assets that are readily available to an economy. They must be under the effective control of the relevant monetary
authority, and comprise highly liquid, marketable and creditworthy foreign currency-denominated claims on non-monetary area residents, plus gold, SDRs and the reserve position in the IMF.Special Drawing Rights (SDRs): An international reserve asset of IMF member countries that may be used e.g. to acquire foreign exchange in case of balance of payments difficulties. The IMF’s website (www.imf.org) provides detailed information about SDRs.Special Purpose Entities (SPEs): In OeNB external statistics, SPEs denote holdings owned by nonresidents that in turn hold shares of nonresident enterprises and that engage in only minimal economic activity in Austria. SPE transactions are to be statistically represented both as inward and as outward direct investment.
18 ◊ Statistiken Special Is sue November 07
4 Tables
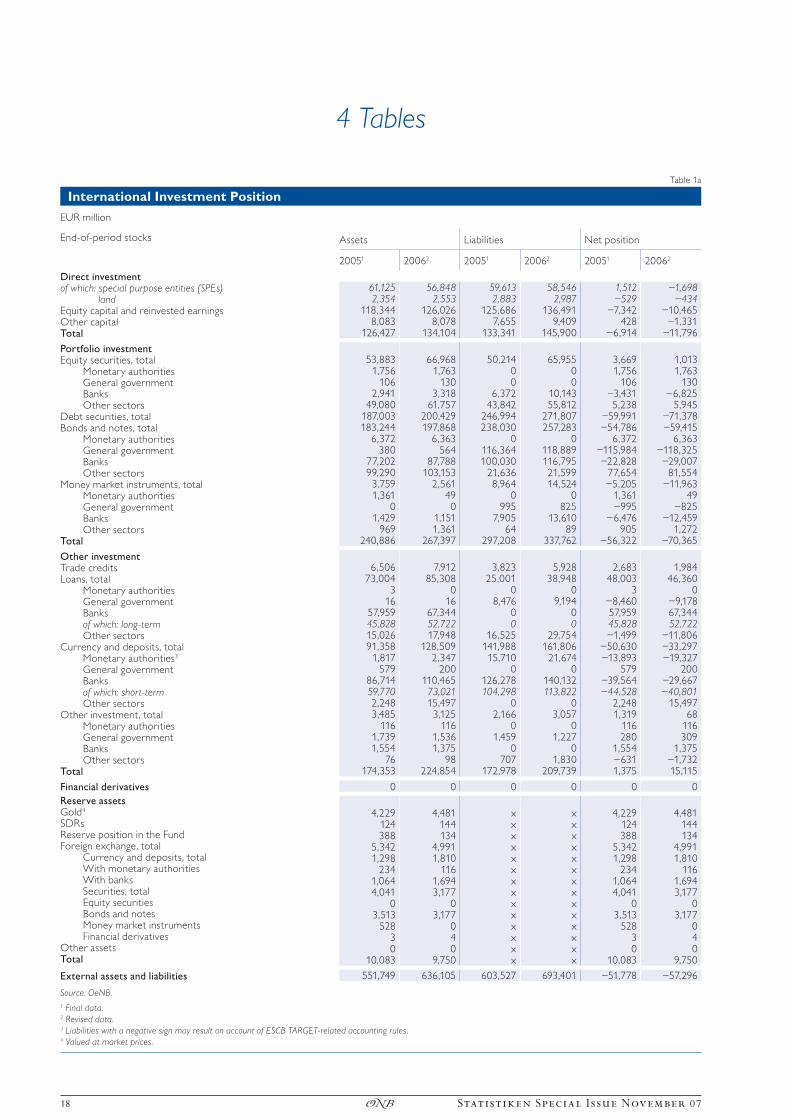
Table 1a
International Investment Position
EUR million
End-of-period stocks Assets Liabilities Net position
20051 20062 20051 20062 20051 20062
Direct investmentof which: special purpose entities (SPEs) 61,125 56,848 59,613 58,546 1,512 –1,698
land 2,354 2,553 2,883 2,987 –529 –434 Equity capital and reinvested earnings 118,344 126,026 125,686 136,491 –7,342 –10,465 Other capital 8,083 8,078 7,655 9,409 428 –1,331 Total 126,427 134,104 133,341 145,900 –6,914 –11,796
Portfolio investmentEquity securities, total 53,883 66,968 50,214 65,955 3,669 1,013
Monetary authorities 1,756 1,763 0 0 1,756 1,763 General government 106 130 0 0 106 130 Banks 2,941 3,318 6,372 10,143 –3,431 –6,825 Other sectors 49,080 61,757 43,842 55,812 5,238 5,945
Debt securities, total 187,003 200,429 246,994 271,807 –59,991 –71,378 Bonds and notes, total 183,244 197,868 238,030 257,283 –54,786 –59,415
Monetary authorities 6,372 6,363 0 0 6,372 6,363 General government 380 564 116,364 118,889 –115,984 –118,325 Banks 77,202 87,788 100,030 116,795 –22,828 –29,007 Other sectors 99,290 103,153 21,636 21,599 77,654 81,554
Money market instruments, total 3,759 2,561 8,964 14,524 –5,205 –11,963 Monetary authorities 1,361 49 0 0 1,361 49 General government 0 0 995 825 –995 –825 Banks 1,429 1,151 7,905 13,610 –6,476 –12,459 Other sectors 969 1,361 64 89 905 1,272
Total 240,886 267,397 297,208 337,762 –56,322 –70,365
Other investmentTrade credits 6,506 7,912 3,823 5,928 2,683 1,984 Loans, total 73,004 85,308 25,001 38,948 48,003 46,360
Monetary authorities 3 0 0 0 3 0 General government 16 16 8,476 9,194 –8,460 –9,178 Banks 57,959 67,344 0 0 57,959 67,344 of which: long-term 45,828 52,722 0 0 45,828 52,722 Other sectors 15,026 17,948 16,525 29,754 –1,499 –11,806
Currency and deposits, total 91,358 128,509 141,988 161,806 –50,630 –33,297 Monetary authorities3 1,817 2,347 15,710 21,674 –13,893 –19,327 General government 579 200 0 0 579 200 Banks 86,714 110,465 126,278 140,132 –39,564 –29,667 of which: short-term 59,770 73,021 104,298 113,822 –44,528 –40,801 Other sectors 2,248 15,497 0 0 2,248 15,497
Other investment, total 3,485 3,125 2,166 3,057 1,319 68 Monetary authorities 116 116 0 0 116 116 General government 1,739 1,536 1,459 1,227 280 309 Banks 1,554 1,375 0 0 1,554 1,375 Other sectors 76 98 707 1,830 –631 –1,732
Total 174,353 224,854 172,978 209,739 1,375 15,115
Financial derivatives 0 0 0 0 0 0
Reserve assetsGold4 4,229 4,481 x x 4,229 4,481 SDRs 124 144 x x 124 144 Reserve position in the Fund 388 134 x x 388 134 Foreign exchange, total 5,342 4,991 x x 5,342 4,991
Currency and deposits, total 1,298 1,810 x x 1,298 1,810 With monetary authorities 234 116 x x 234 116 With banks 1,064 1,694 x x 1,064 1,694 Securities, total 4,041 3,177 x x 4,041 3,177 Equity securities 0 0 x x 0 0 Bonds and notes 3,513 3,177 x x 3,513 3,177 Money market instruments 528 0 x x 528 0 Financial derivatives 3 4 x x 3 4
Other assets 0 0 x x 0 0 Total 10,083 9,750 x x 10,083 9,750
External assets and liabilities 551,749 636,105 603,527 693,401 –51,778 –57,296
Source: OeNB.
1 Final data.2 Revised data.3 Liabilities with a negative sign may result on account of ESCB TARGET-related accounting rules.4 Valued at market prices.
Tables
Statistiken Special Is sue November 07 ◊ 19
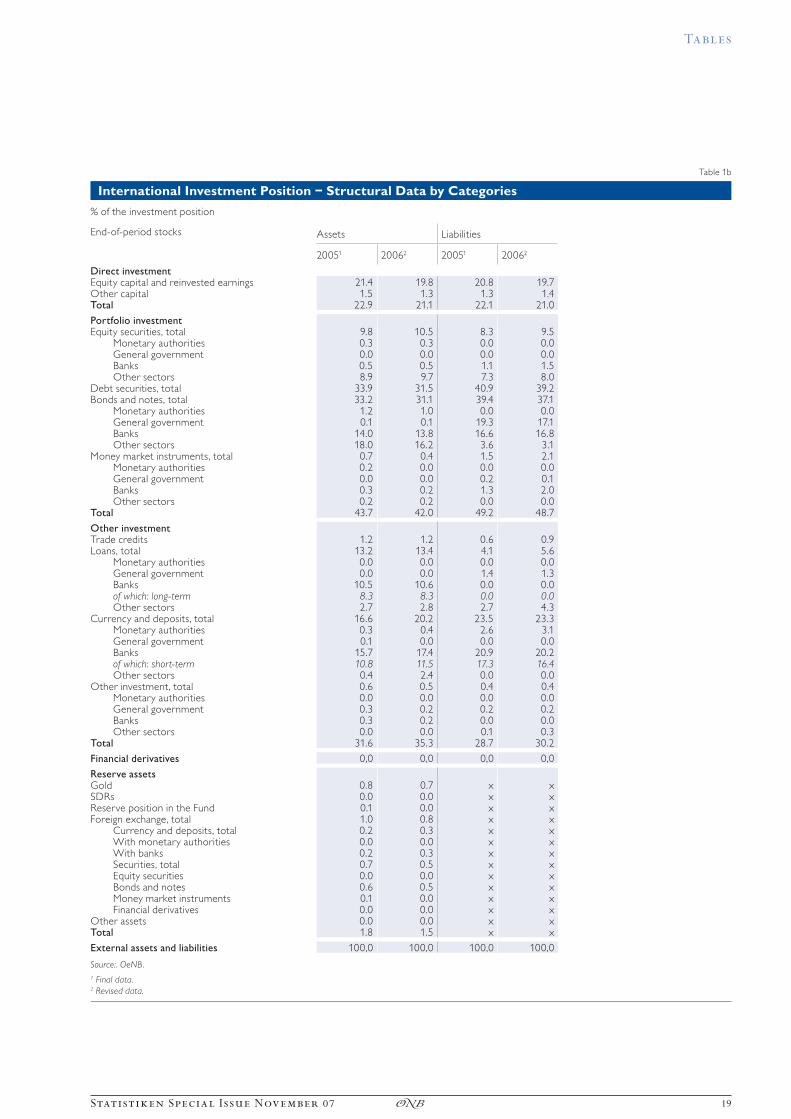
Table 1b
International Investment Position – Structural Data by Categories
% of the investment position
End-of-period stocks Assets Liabilities
20051 20062 20051 20062
Direct investmentEquity capital and reinvested earnings 21.4 19.8 20.8 19.7Other capital 1.5 1.3 1.3 1.4Total 22.9 21.1 22.1 21.0
Portfolio investmentEquity securities, total 9.8 10.5 8.3 9.5
Monetary authorities 0.3 0.3 0.0 0.0General government 0.0 0.0 0.0 0.0Banks 0.5 0.5 1.1 1.5Other sectors 8.9 9.7 7.3 8.0
Debt securities, total 33.9 31.5 40.9 39.2Bonds and notes, total 33.2 31.1 39.4 37.1
Monetary authorities 1.2 1.0 0.0 0.0General government 0.1 0.1 19.3 17.1Banks 14.0 13.8 16.6 16.8Other sectors 18.0 16.2 3.6 3.1
Money market instruments, total 0.7 0.4 1.5 2.1Monetary authorities 0.2 0.0 0.0 0.0General government 0.0 0.0 0.2 0.1Banks 0.3 0.2 1.3 2.0Other sectors 0.2 0.2 0.0 0.0
Total 43.7 42.0 49.2 48.7
Other investmentTrade credits 1.2 1.2 0.6 0.9Loans, total 13.2 13.4 4.1 5.6
Monetary authorities 0.0 0.0 0.0 0.0General government 0.0 0.0 1.4 1.3Banks 10.5 10.6 0.0 0.0of which: long-term 8.3 8.3 0.0 0.0Other sectors 2.7 2.8 2.7 4.3
Currency and deposits, total 16.6 20.2 23.5 23.3Monetary authorities 0.3 0.4 2.6 3.1General government 0.1 0.0 0.0 0.0Banks 15.7 17.4 20.9 20.2of which: short-term 10.8 11.5 17.3 16.4Other sectors 0.4 2.4 0.0 0.0
Other investment, total 0.6 0.5 0.4 0.4Monetary authorities 0.0 0.0 0.0 0.0General government 0.3 0.2 0.2 0.2Banks 0.3 0.2 0.0 0.0Other sectors 0.0 0.0 0.1 0.3
Total 31.6 35.3 28.7 30.2
Financial derivatives 0,0 0,0 0,0 0,0
Reserve assetsGold 0.8 0.7 x xSDRs 0.0 0.0 x xReserve position in the Fund 0.1 0.0 x xForeign exchange, total 1.0 0.8 x x
Currency and deposits, total 0.2 0.3 x xWith monetary authorities 0.0 0.0 x xWith banks 0.2 0.3 x xSecurities, total 0.7 0.5 x xEquity securities 0.0 0.0 x xBonds and notes 0.6 0.5 x xMoney market instruments 0.1 0.0 x xFinancial derivatives 0.0 0.0 x x
Other assets 0.0 0.0 x xTotal 1.8 1.5 x x
External assets and liabilities 100,0 100,0 100,0 100,0
Source:. OeNB.
1 Final data.2 Revised data.
Tables
20 ◊ Statistiken Special Is sue November 07
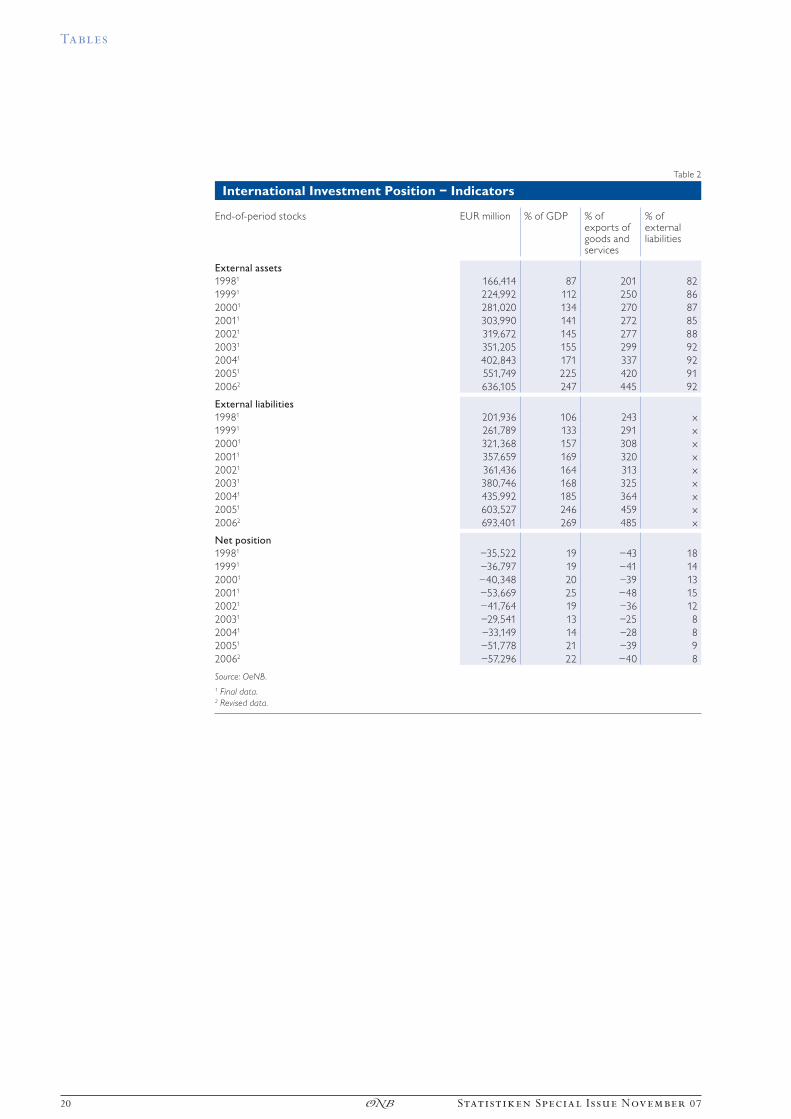
Table 2
International Investment Position – Indicators
End-of-period stocks EUR million % of GDP % of exports of goods and services
% of external liabilities
External assets
19981 166,414 87 201 82
19991 224,992 112 250 86
20001 281,020 134 270 87
20011 303,990 141 272 85
20021 319,672 145 277 88
20031 351,205 155 299 92
20041 402,843 171 337 92
20051 551,749 225 420 91
20062 636,105 247 445 92
External liabilities
19981 201,936 106 243 x
19991 261,789 133 291 x
20001 321,368 157 308 x
20011 357,659 169 320 x
20021 361,436 164 313 x
20031 380,746 168 325 x
20041 435,992 185 364 x
20051 603,527 246 459 x
20062 693,401 269 485 x
Net position
19981 –35,522 19 –43 18
19991 –36,797 19 –41 14
20001 –40,348 20 –39 13
20011 –53,669 25 –48 15
20021 –41,764 19 –36 12
20031 –29,541 13 –25 8
20041 –33,149 14 –28 8
20051 –51,778 21 –39 9
20062 –57,296 22 –40 8
Source: OeNB.
1 Final data.2 Revised data.

Tables
Statistiken Special Is sue November 07 ◊ 21
Table 3
International Investment Position – Breakdown of Change
EUR million
End-of-period stocks20051
Change in positions in 2006 End-of-period stocks20062
total transactions non-transaction-related change
Direct investment 126,427 +7,677 +3,258 +4,419 134,104
Portfolio investment 240,886 +26,511 +25,273 +1,238 267,397
Equity securities 53,883 +13,085 +6,253 +6,832 66,968
Debt securities 187,003 +13,426 +19,020 –5,594 200,429
Other investment 174,353 +50,501 +52,983 –2,482 224,854
Financial derivatives 0 +0 +0 +0 0
Reserve assets 10,083 –333 –507 +174 9,750
External assets 551,749 +84,356 +81,007 +3,349 636,105
Direct investment 133,341 +12,559 +198 +12,361 145,900
Portfolio investment 297,208 +40,554 +34,975 +5,579 337,762
Equity securities 50,214 +15,741 +7,457 +8,284 65,955
Debt securities 246,994 +24,813 +27,518 –2,705 271,807
Other investment 172,978 +36,761 +39,940 –3,179 209,739
Financial derivatives 0 +0 +0 +0 0
External liabilities 603,527 +89,874 +75,113 +14,761 693,401
Direct investment –6,914 –4,882 +3,060 –7,942 –11,796
Portfolio investment –56,322 –14,043 –9,702 –4,341 –70,365
Equity securities 3,669 –2,656 –1,204 –1,452 1,013
Debt securities –59,991 –11,387 –8,498 –2,889 –71,378
Other investment 1,375 +13,740 +13,043 +697 15,115
Financial derivatives 0 +0 +0 +0 0
Reserve assets 10,083 –333 –507 +174 9,750
Net position –51,778 –5,518 +5,894 –11,412 –57,296
Source: OeNB.
1 Final data.2 Revised data.
Tables
22 ◊ Statistiken Special Is sue November 07
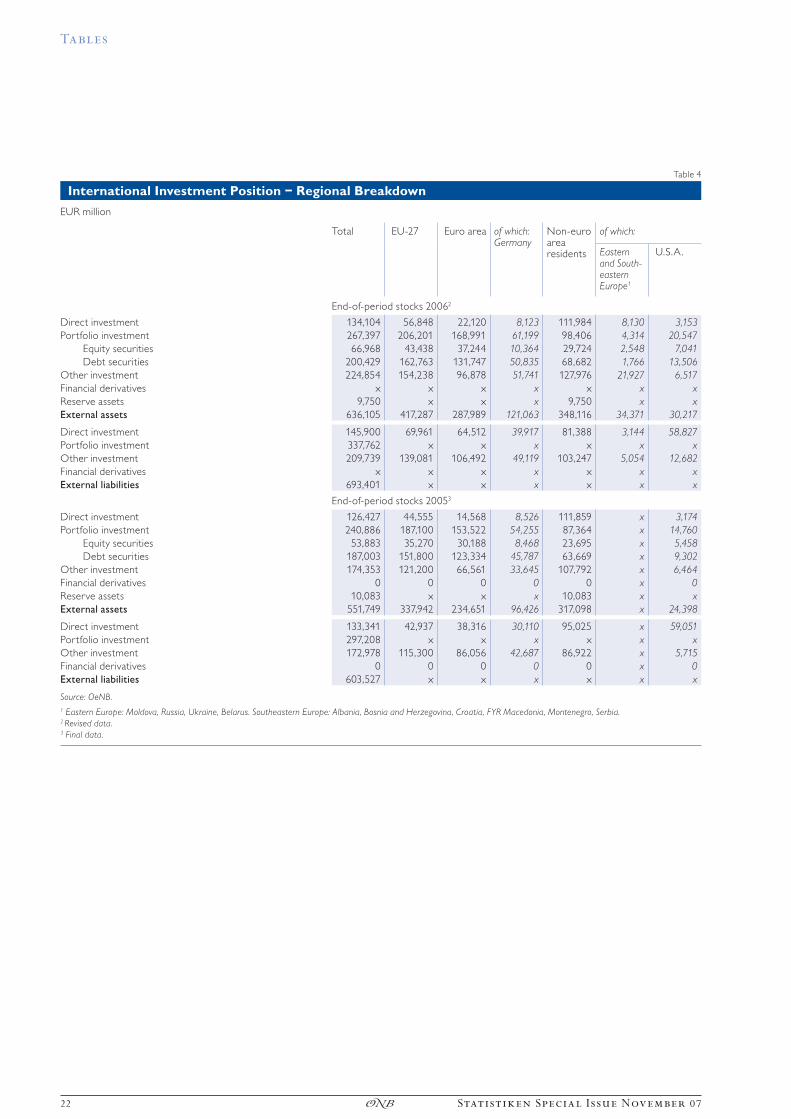
Table 4
International Investment Position – Regional Breakdown
EUR million
Total EU-27 Euro area of which: Germany
Non-euro area residents
of which:
Eastern and South-eastern Europe1
U.S.A.
End-of-period stocks 20062
Direct investment 134,104 56,848 22,120 8,123 111,984 8,130 3,153
Portfolio investment 267,397 206,201 168,991 61,199 98,406 4,314 20,547
Equity securities 66,968 43,438 37,244 10,364 29,724 2,548 7,041
Debt securities 200,429 162,763 131,747 50,835 68,682 1,766 13,506
Other investment 224,854 154,238 96,878 51,741 127,976 21,927 6,517
Financial derivatives x x x x x x x
Reserve assets 9,750 x x x 9,750 x x
External assets 636,105 417,287 287,989 121,063 348,116 34,371 30,217
Direct investment 145,900 69,961 64,512 39,917 81,388 3,144 58,827
Portfolio investment 337,762 x x x x x x
Other investment 209,739 139,081 106,492 49,119 103,247 5,054 12,682
Financial derivatives x x x x x x x
External liabilities 693,401 x x x x x x
End-of-period stocks 20053
Direct investment 126,427 44,555 14,568 8,526 111,859 x 3,174
Portfolio investment 240,886 187,100 153,522 54,255 87,364 x 14,760
Equity securities 53,883 35,270 30,188 8,468 23,695 x 5,458
Debt securities 187,003 151,800 123,334 45,787 63,669 x 9,302
Other investment 174,353 121,200 66,561 33,645 107,792 x 6,464
Financial derivatives 0 0 0 0 0 x 0
Reserve assets 10,083 x x x 10,083 x x
External assets 551,749 337,942 234,651 96,426 317,098 x 24,398
Direct investment 133,341 42,937 38,316 30,110 95,025 x 59,051
Portfolio investment 297,208 x x x x x x
Other investment 172,978 115,300 86,056 42,687 86,922 x 5,715
Financial derivatives 0 0 0 0 0 x 0
External liabilities 603,527 x x x x x x
Source: OeNB.
1 Eastern Europe: Moldova, Russia, Ukraine, Belarus. Southeastern Europe: Albania, Bosnia and Herzegovina, Croatia, FYR Macedonia, Montenegro, Serbia.2 Revised data.3 Final data.
Tables
Statistiken Special Is sue November 07 ◊ 23
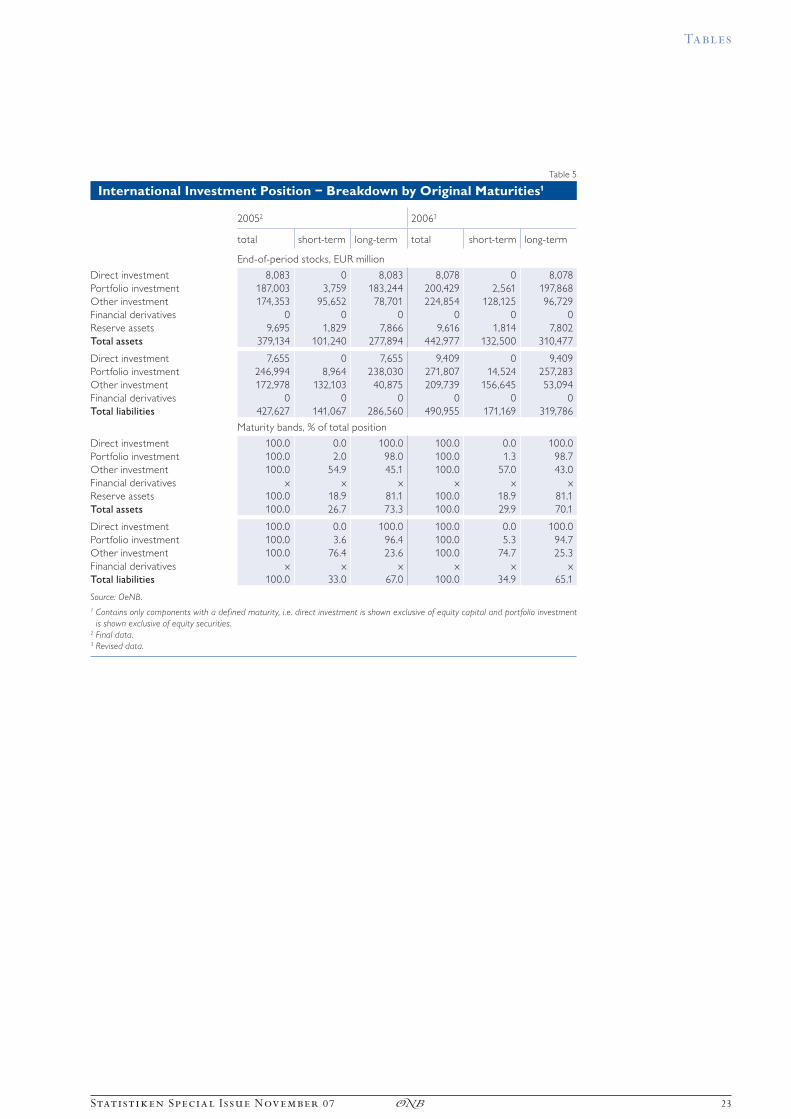
Table 5
International Investment Position – Breakdown by Original Maturities1
20052 20063
total short-term long-term total short-term long-term
End-of-period stocks, EUR million
Direct investment 8,083 0 8,083 8,078 0 8,078
Portfolio investment 187,003 3,759 183,244 200,429 2,561 197,868
Other investment 174,353 95,652 78,701 224,854 128,125 96,729
Financial derivatives 0 0 0 0 0 0
Reserve assets 9,695 1,829 7,866 9,616 1,814 7,802
Total assets 379,134 101,240 277,894 442,977 132,500 310,477
Direct investment 7,655 0 7,655 9,409 0 9,409
Portfolio investment 246,994 8,964 238,030 271,807 14,524 257,283
Other investment 172,978 132,103 40,875 209,739 156,645 53,094
Financial derivatives 0 0 0 0 0 0
Total liabilities 427,627 141,067 286,560 490,955 171,169 319,786
Maturity bands, % of total position
Direct investment 100.0 0.0 100.0 100.0 0.0 100.0
Portfolio investment 100.0 2.0 98.0 100.0 1.3 98.7
Other investment 100.0 54.9 45.1 100.0 57.0 43.0
Financial derivatives x x x x x x
Reserve assets 100.0 18.9 81.1 100.0 18.9 81.1
Total assets 100.0 26.7 73.3 100.0 29.9 70.1
Direct investment 100.0 0.0 100.0 100.0 0.0 100.0
Portfolio investment 100.0 3.6 96.4 100.0 5.3 94.7
Other investment 100.0 76.4 23.6 100.0 74.7 25.3
Financial derivatives x x x x x x
Total liabilities 100.0 33.0 67.0 100.0 34.9 65.1
Source: OeNB.
1 Contains only components with a def ined maturity, i.e. direct investment is shown exclusive of equity capital and portfolio investment
is shown exclusive of equity securities.2 Final data.3 Revised data.
Tables
24 ◊ Statistiken Special Is sue November 07
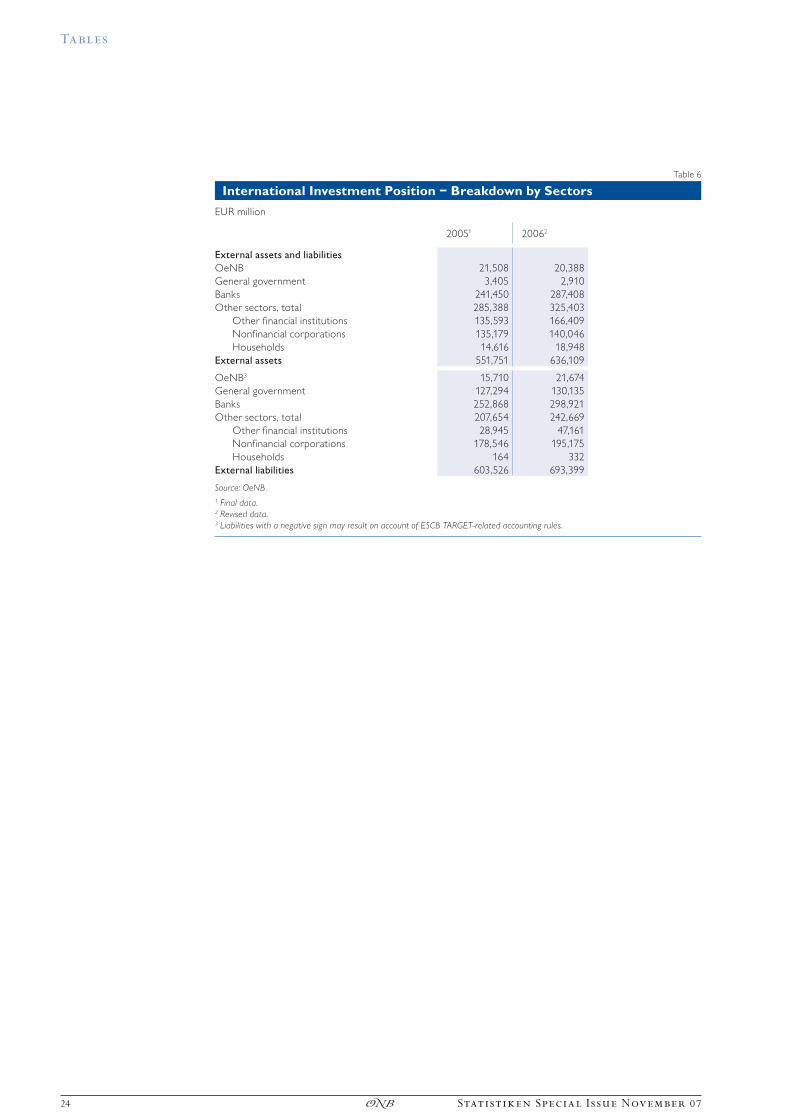
Table 6
International Investment Position – Breakdown by Sectors
EUR million
20051 20062
External assets and liabilities
OeNB 21,508 20,388
General government 3,405 2,910
Banks 241,450 287,408
Other sectors, total 285,388 325,403
Other financial institutions 135,593 166,409
Nonfinancial corporations 135,179 140,046
Households 14,616 18,948
External assets 551,751 636,109
OeNB3 15,710 21,674
General government 127,294 130,135
Banks 252,868 298,921
Other sectors, total 207,654 242,669
Other financial institutions 28,945 47,161
Nonfinancial corporations 178,546 195,175
Households 164 332
External liabilities 603,526 693,399
Source: OeNB.
1 Final data.2 Revised data.3 Liabilities with a negative sign may result on account of ESCB TARGET-related accounting rules.
Tables
Statistiken Special Is sue November 07 ◊ 25
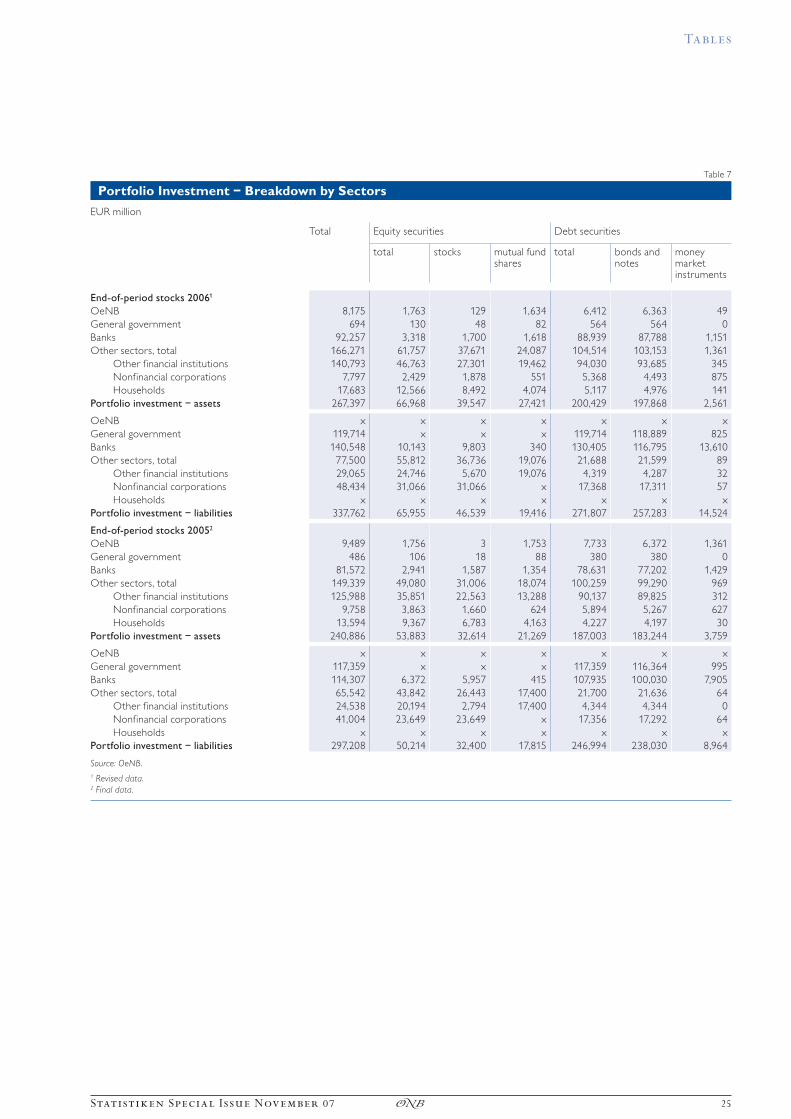
Table 7
Portfolio Investment – Breakdown by Sectors
EUR million
Total Equity securities Debt securities
total stocks mutual fund shares
total bonds and notes
money market instruments
End-of-period stocks 20061
OeNB 8,175 1,763 129 1,634 6,412 6,363 49
General government 694 130 48 82 564 564 0
Banks 92,257 3,318 1,700 1,618 88,939 87,788 1,151
Other sectors, total 166,271 61,757 37,671 24,087 104,514 103,153 1,361
Other financial institutions 140,793 46,763 27,301 19,462 94,030 93,685 345
Nonfinancial corporations 7,797 2,429 1,878 551 5,368 4,493 875
Households 17,683 12,566 8,492 4,074 5,117 4,976 141
Portfolio investment – assets 267,397 66,968 39,547 27,421 200,429 197,868 2,561
OeNB x x x x x x x
General government 119,714 x x x 119,714 118,889 825
Banks 140,548 10,143 9,803 340 130,405 116,795 13,610
Other sectors, total 77,500 55,812 36,736 19,076 21,688 21,599 89
Other financial institutions 29,065 24,746 5,670 19,076 4,319 4,287 32
Nonfinancial corporations 48,434 31,066 31,066 x 17,368 17,311 57
Households x x x x x x x
Portfolio investment – liabilities 337,762 65,955 46,539 19,416 271,807 257,283 14,524
End-of-period stocks 20052
OeNB 9,489 1,756 3 1,753 7,733 6,372 1,361
General government 486 106 18 88 380 380 0
Banks 81,572 2,941 1,587 1,354 78,631 77,202 1,429
Other sectors, total 149,339 49,080 31,006 18,074 100,259 99,290 969
Other financial institutions 125,988 35,851 22,563 13,288 90,137 89,825 312
Nonfinancial corporations 9,758 3,863 1,660 624 5,894 5,267 627
Households 13,594 9,367 6,783 4,163 4,227 4,197 30
Portfolio investment – assets 240,886 53,883 32,614 21,269 187,003 183,244 3,759
OeNB x x x x x x x
General government 117,359 x x x 117,359 116,364 995
Banks 114,307 6,372 5,957 415 107,935 100,030 7,905
Other sectors, total 65,542 43,842 26,443 17,400 21,700 21,636 64
Other financial institutions 24,538 20,194 2,794 17,400 4,344 4,344 0
Nonfinancial corporations 41,004 23,649 23,649 x 17,356 17,292 64
Households x x x x x x x
Portfolio investment – liabilities 297,208 50,214 32,400 17,815 246,994 238,030 8,964
Source: OeNB.
1 Revised data.2 Final data.
26 ◊ Statistiken Special Is sue November 07
5 Overview of Special Issues
October 2004
Finanzvermögen 2003/Financial Accounts 2003
June 2005
Finanzvermögen 2004/Financial Accounts 2004
June 2006
Finanzvermögen 2005/Financial Accounts 2005
June 2007
Austrian Financial Accounts 2006
September 2007
Direct Investment 2005
November 2007
Austria’s International Investment Position in 2006