Embed Size (px)
Citation preview

AUSTRALIAN UNIVERSITY STAFF DATA: A COMPARISON OF DATA COLLECTION
AND REPORTING
(Work in progress)
JULIE ARTHUR and DON JOHNSTON
OFFICE OF PLANNING QUALITY AND REVIEW SOUTHERN CROSS UNIVERSITY
www.scu.edu.au
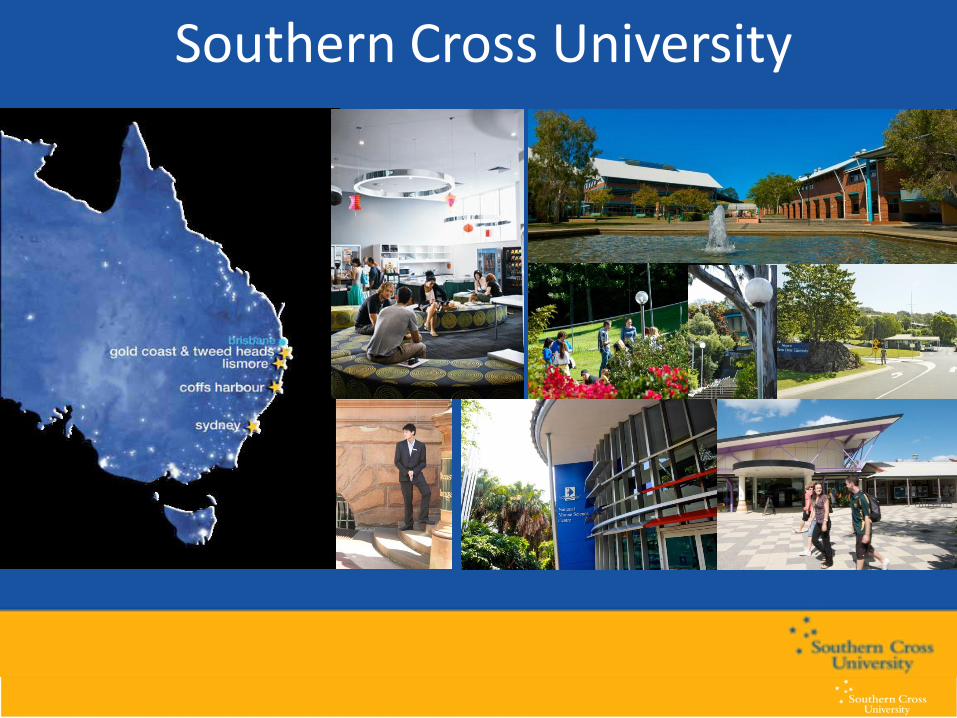
Southern Cross University
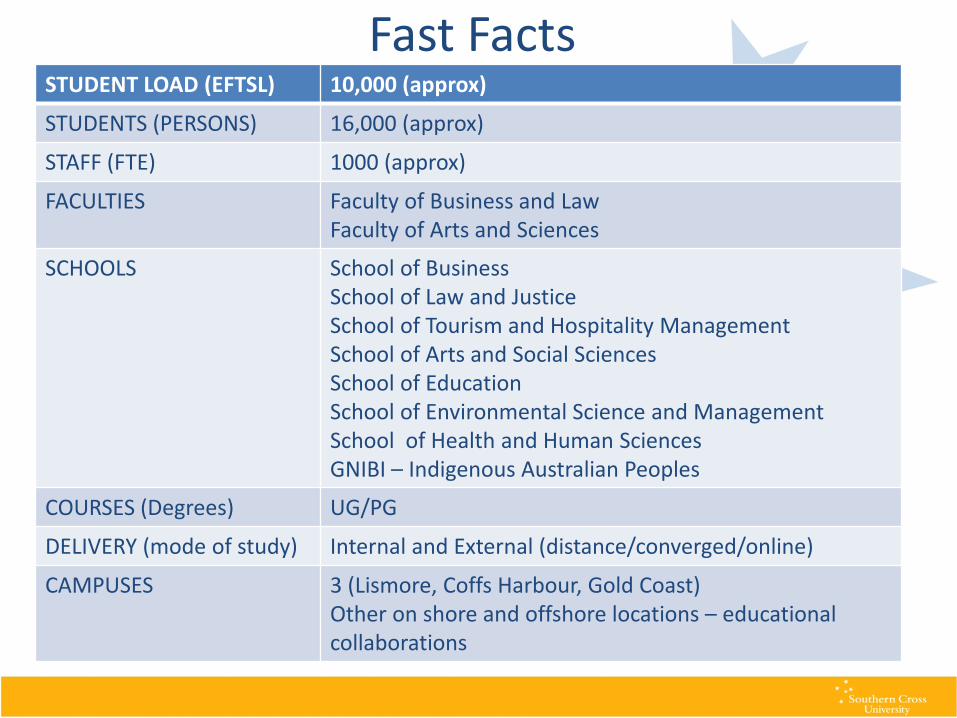
Fast Facts STUDENT LOAD (EFTSL) 10,000 (approx)
STUDENTS (PERSONS) 16,000 (approx)
STAFF (FTE) 1000 (approx)
FACULTIES Faculty of Business and Law Faculty of Arts and Sciences
SCHOOLS School of Business School of Law and Justice School of Tourism and Hospitality Management School of Arts and Social Sciences School of Education School of Environmental Science and Management School of Health and Human Sciences GNIBI – Indigenous Australian Peoples
COURSES (Degrees) UG/PG
DELIVERY (mode of study) Internal and External (distance/converged/online)
CAMPUSES 3 (Lismore, Coffs Harbour, Gold Coast) Other on shore and offshore locations – educational collaborations

Higher Education in Australia
Political oversight Federal Government
Regulator (planned) Tertiary Education Qualifications Standards Authority (TEQSA)
Number of Universities 38
Government Funding Commonwealth Government Supported places – Undergraduate and limited post graduate course work and post graduate research degrees
Full Fees Post graduate course work International undergraduate and post graduate
Reporting Demands Student data (applications and offers, enrolments, courses, locations, completions) Research data (HDR, publications, grants) Staff data (academic and professional employees, qualifications) (Demographics across all)

Research question
• What is the impact of changed data collection timelines and subsequent FTE reporting on the key metrics related to staff data?

Background-Staff data as performance indicators
• Government quality assurance metrics (staff-student ratio; research outputs) used for performance funding
• Internal metrics (staff per EFTSL; research outputs) used for institutional review
• Staff qualifications as quality teaching indicator
• Academic to professional staff ratio as performance indicator
• Equity target monitoring (Gender equity; Women in leadership; Indigenous Peoples)
• Government “My University” website
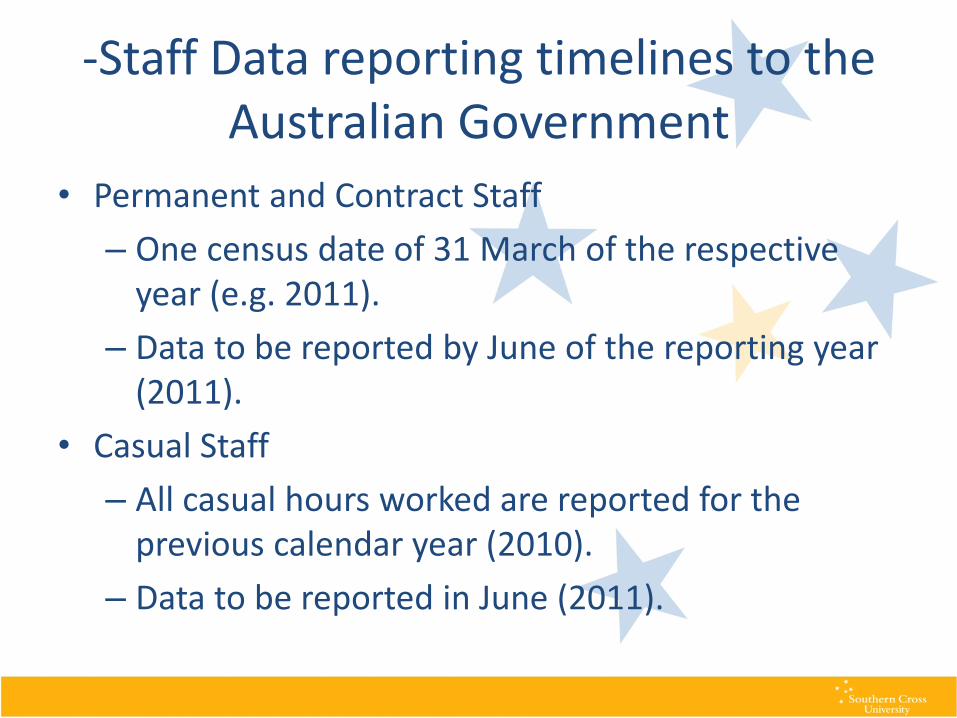
-Staff Data reporting timelines to the Australian Government
• Permanent and Contract Staff
– One census date of 31 March of the respective year (e.g. 2011).
– Data to be reported by June of the reporting year (2011).
• Casual Staff
– All casual hours worked are reported for the previous calendar year (2010).
– Data to be reported in June (2011).
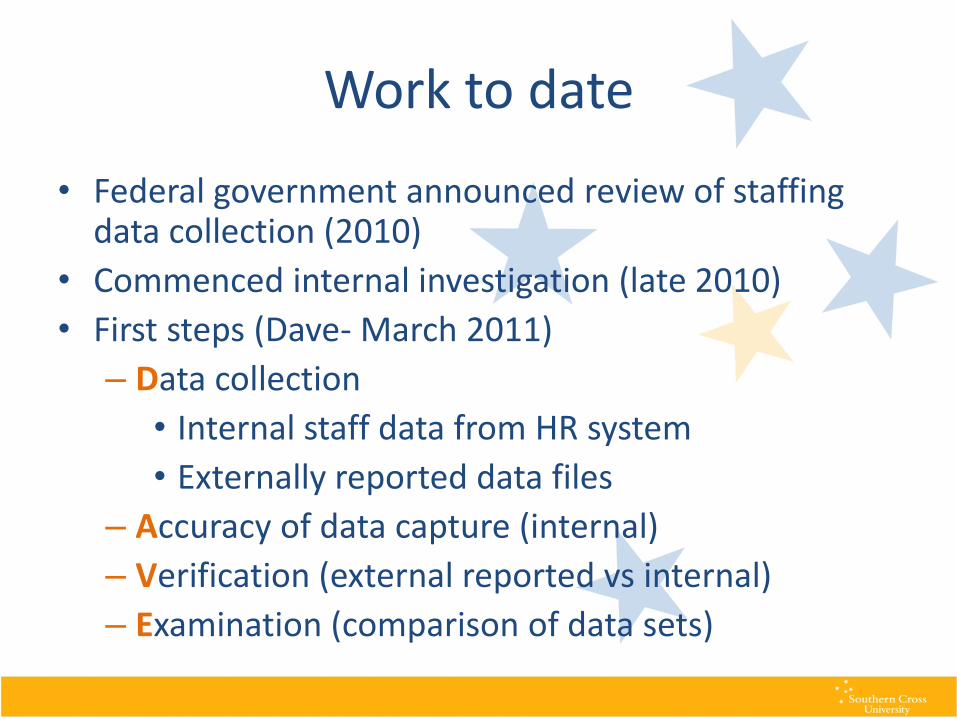
Work to date
• Federal government announced review of staffing data collection (2010)
• Commenced internal investigation (late 2010)
• First steps (Dave- March 2011)
– Data collection
• Internal staff data from HR system
• Externally reported data files
– Accuracy of data capture (internal)
– Verification (external reported vs internal)
– Examination (comparison of data sets)

Progressive Findings - Key Issues
Issue 1 Metrics mean money
Issue 2 Metrics impact public perception
Issue 3 Traditional perspective on university no longer relevant
Issue 4 Census date vs whole year
Issue 5 Disparate data sets based on employment categories
Issue 6 Problematic employment classifications
Issue 7 Impact of changed employment practices
Issue 8 Organisational change impact
Issue 9 Initial data analysis

Issue #1 Metrics mean money
• The Australian Higher Education sector is reliant on national government funding Relationship between the government and institutions based on a “compact” with agreed targets against student load, research and teaching quality indicators. Both research and teaching quality indicators rely on staff data e.g. staff student ratio and publications per
academic staff member.
Issue #2 Metrics impact public perception
• Staff data used for
– Staff student ratio (high/low)
– Reporting research outputs (publications per FTE; research $ per FTE)
– MyUniversity reporting numbers of students and staff from data submitted to government
– Benchmarking

Issue #3 traditional perspective of university no longer applies to all
Formulae used to calculate FTE are historical and based on traditional teaching approaches in standard academic calendar (2 semesters)
Therefore
• If University uses 3 session calendar
• Staff Full-time Equivalence (FTE) is based on a formula which includes the number of teaching weeks in each year which is open to interpretation.
• Not all casual academic staff are “teaching”- may be employed to undertake a specific task – not hours based(curriculum development)

Issue #4 Census dates vs whole year
• Permanent and contract staff employed after 31 March of the reporting year not included in the census.
Therefore
Internal and external reporting do not align
Point in time benchmarked metrics subject to variation
True FTE under-reported and over emphasised
Issue #5 Disparate data sets
• Mismatch between permanent/contract and casual staff data sets
Therefore
Total staff FTE for a single year has 12 month lag
Joining permanent/contract data with casual data problematic (two distinct collection methods - census date vs whole year)
= creating one whole from two different halves
Issue #6 Problematic employment classifications
Who is in (and in what category) and who is out (and why)?
DEEWR Staff Categories
Research
Research and Teaching
Teaching Only
Other
• Who to include as “staff”
– Practicum supervisors (for teaching and nursing courses) be included?
– Exam supervisors?

Issue #7 Impact of changed employment practices
• Enterprising Bargaining Agreement 2010 enforces change to contractual arrangements at SCU
• Limited fixed term contracts possibly lead to increased casual employment
Issue #8 Organisational change impact
• Changes in organisational structures (new schools/work units)
• Historical data not changed at capture point resulting in compounding data errors
• Stress point for data warehouse (internal reporting) and external reporting centre
• Confusion in reporting and reliance on retained corporate knowledge
Issue #9 Initial Data Analysis
• Calculation of staffing FTE across the whole year results in an increase of 60 FTE (7% apparent increase on reported figures)
• Student staff ratio would be lower than currently reported
• Unless increase is in “teaching only” research outputs will decrease

Where to from here?
• Review findings of data analysis with Dave
• Conduct work shop with data custodians and stewards
• Identify “low hanging fruit” for improvement in data collection and categorisation
• Engage with sector through AAIR Special Interest Group
• Lobby Federal government as part of current review
• Conduct further analysis….