Embed Size (px)
Citation preview
2020 FULL YEAR
FINANCIAL RESULTS13 AUGUST 2020
J A K E K L E I N – E X E C U T I V E C H A I R M A N
L A W R I E C O N W A Y – F I N A N C E D I R E C T O R A N D C F O
For
per
sona
l use
onl
y
FORWARD LOOKING STATEMENT
These materials prepared by Evolution Mining Limited (or “the Company”) include forward looking statements. Often, but not always, forward looking statements can generally be identified by the use of forward looking words such as “may”, “will”, “expect”, “intend”, “plan”, “estimate”, “anticipate”, “continue”, and “guidance”, or other similar words and may include, without limitation, statements regarding plans, strategies and objectives of management, anticipated production or construction commencement dates and expected costs or production outputs.
Forward looking statements inherently involve known and unknown risks, uncertainties and other factors that may cause the Company’s actual results, performance and achievements to differ materially from any future results, performance or achievements. Relevant factors may include, but are not limited to, changes in commodity prices, foreign exchange fluctuations and general economic conditions, increased costs and demand for production inputs, the speculative nature of exploration and project development, including the risks of obtaining necessary licenses and permits and diminishing quantities or grades of reserves, political and social risks, changes to the regulatory framework within which the Company operates or may in the future operate, environmental conditions including extreme weather conditions, recruitment and retention of personnel, industrial relations issues and litigation.
Forward looking statements are based on the Company and its management’s good faith assumptions relating to the financial, market, regulatory and other relevant environments that will exist and affect the Company’s business and operations in the future. The Company does not give any assurance that the assumptions on which forward looking statements are based will prove to be correct, or that the Company’s business or operations will not be affected in any material manner by these or other factors not foreseen or foreseeable by the Company or management or beyond the Company’s control.
Although the Company attempts and has attempted to identify factors that would cause actual actions, events or results to differ materially from those disclosed in forward looking statements, there may be other factors that could cause actual results, performance, achievements or events not to be as anticipated, estimated or intended, and many events are beyond the reasonable control of the Company. Accordingly, readers are cautioned not to place undue reliance on forward looking statements. Forward looking statements in these materials speak only at the date of issue. Subject to any continuing obligations under applicable law or any relevant stock exchange listing rules, in providing this information the Company does not undertake any obligation to publicly update or revise any of the forward looking statements or to advise of any change in events, conditions or circumstances on which any such statement is based.
Non-IFRS Financial InformationThe Company results are reported under International Financial Reporting Standards (IFRS). This presentation also includes non-IFRS information including EBITDA and Underlying Profit. The non-IFRS information has not been subject to audit or review by the Company’s external auditor and should be used in addition to IFRS information.
ReleaseThis presentation has been approved for release by the Board of Directors.
2
For
per
sona
l use
onl
y

Three-Year
OutlookFY21 FY22 FY23
Production
(oz)670,000 – 730,000 700,000 – 770,000 790,000 – 850,000
AISC
(A$/oz)21,240 – 1,300 1,220 – 1,280 1,125 – 1,185
Sustaining
Capex (A$/M)112.5 – 137.5 110.0 – 135.0 95.0 – 120.0
Major Capital
(A$M)260.0 – 290.0 250.0 – 280.0 220.0 – 260.0
Discovery
(A$M)75.0 – 100.0 70.0 – 100.0 70.0 – 100.0
Cautionary statement concerning the proportion of Exploration Targets1
Of Evolution’s Production Outlook, 1.8% is comprised of Exploration Targets. The potential quantity
and grade of this exploration target is conceptual in nature and there has been insufficient
exploration to determine a Mineral Resource and there is no certainty that further exploration work
will result in the determination of Mineral Resources or that production target itself will be realised.
Cautionary statement concerning the proportion of Inferred Mineral Resources
There is a low level of geological confidence associated with Inferred Mineral Resources and there
is no certainty that further exploration work will result in the determination of Indicated Mineral
Resources or that the production target itself will be realised. The stated production target is based
on the Company’s current expectations of future results or events and should not be solely relied
upon by investors when making investment decisions. Further evaluation work and appropriate
studies are required to establish sufficient confidence that this target will be met.
Material Assumptions
The material assumptions on which the Production Target is based are presented in ASX release
Annual Mineral Resources and Ore Reserves Statement” released to the ASX on 12 February 2020
and available to view at www.evolutionmining.com.au.
The material assumptions upon which the forecast financial information is based are:
Gold A$1,450/oz Silver A$20/oz
Copper A$6,000/t Diesel A$80/bbl
Competent Persons Statement
The estimated Mineral Resources and Ore Reserves underpinning the Production Target have been
prepared by Competent Persons in accordance with the requirements in Appendix 5A (JORC Code).
Relevant proportions of Mineral Resources and Ore Reserves underpinning the Production
Target
The Production Target comprises 20.8% Proved Ore Reserves, 61.4% Probable Ore Reserves,
1.7% Indicated Mineral Resources, 14.2% Inferred Mineral Resources and 1.8% Exploration
Targets.
3
PRODUCTION TARGET & FORECAST FINANCIALS
1 For information on the Exploration Targets, refer to ASX release entitled “FY20 Financial
Results, Final Dividend and Three-Year Outlook” released to the ASX on 13 August 2020 and
available to view at www.evolutionmining.com.au
2. AISC assumes A$2,200/oz Au and A$8,400/t Cu for royalties and by-products
For
per
sona
l use
onl
y
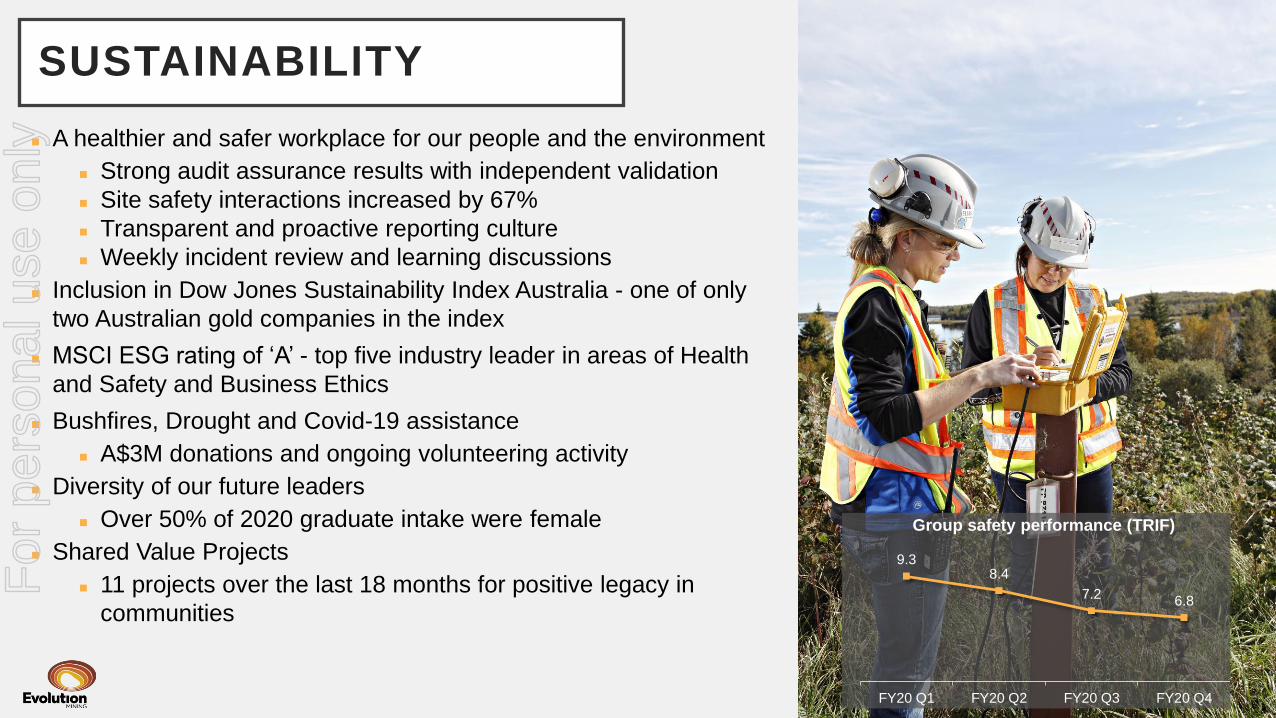
◼ A healthier and safer workplace for our people and the environment
◼ Strong audit assurance results with independent validation
◼ Site safety interactions increased by 67%
◼ Transparent and proactive reporting culture
◼ Weekly incident review and learning discussions
◼ Inclusion in Dow Jones Sustainability Index Australia - one of only
two Australian gold companies in the index
◼ MSCI ESG rating of ‘A’ - top five industry leader in areas of Health
and Safety and Business Ethics
◼ Bushfires, Drought and Covid-19 assistance
◼ A$3M donations and ongoing volunteering activity
◼ Diversity of our future leaders
◼ Over 50% of 2020 graduate intake were female
◼ Shared Value Projects
◼ 11 projects over the last 18 months for positive legacy in
communities
4
SUSTAINABILITY
9.38.4
7.26.8
FY20 Q1 FY20 Q2 FY20 Q3 FY20 Q4
Group safety performance (TRIF)
For
per
sona
l use
onl
y

Mt Rawdon
Mt Carlton
Mungari Cowal
Ernest Henry
CLEAR AND CONSISTENT STRATEGY
5
Red Lake
A portfolio of 6 to 8 assets generating superior returns with
an average mine life of at least 10 years
Build a reputation for sustainability, reliability and transparency
Embed financial discipline across the business
An active pipeline of quality exploration and development projects
Open to all quality gold, silver and copper-gold
value accretive investments
For
per
sona
l use
onl
y
6
HIGHLIGHTS
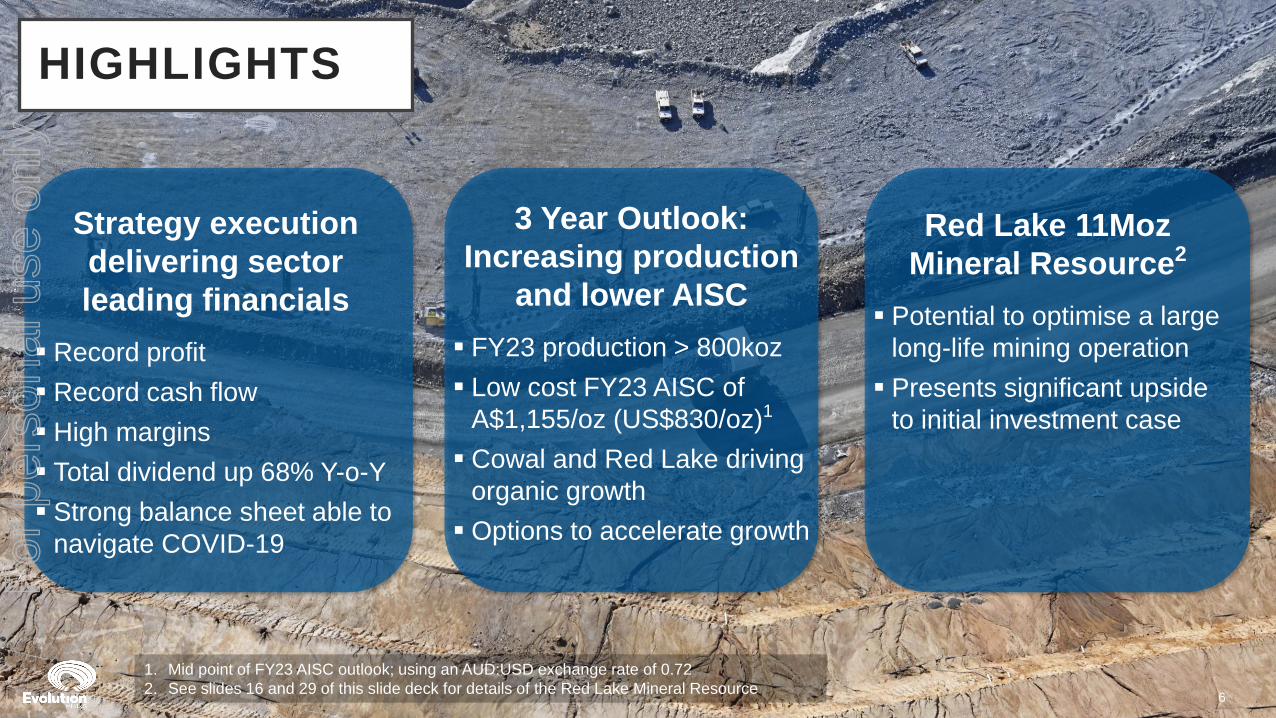
3 Year Outlook:
Increasing production
and lower AISC
▪ FY23 production > 800koz
▪ Low cost FY23 AISC of
A$1,155/oz (US$830/oz)1
▪ Cowal and Red Lake driving
organic growth
▪ Options to accelerate growth
Red Lake 11Moz
Mineral Resource2
▪ Potential to optimise a large
long-life mining operation
▪ Presents significant upside
to initial investment case
Strategy execution
delivering sector
leading financials
▪ Record profit
▪ Record cash flow
▪ High margins
▪ Total dividend up 68% Y-o-Y
▪ Strong balance sheet able to
navigate COVID-19
1. Mid point of FY23 AISC outlook; using an AUD:USD exchange rate of 0.72
2. See slides 16 and 29 of this slide deck for details of the Red Lake Mineral Resource
For
per
sona
l use
onl
y

FINANCIALHIGHLIGHTS
7
Financials Units FY20 FY19 Change
Statutory Profit after tax A$M 301.6 218.2 38%
Underlying Profit after tax A$M 405.4 218.2 86%
EBITDA A$M 1,029.4 730.3 41%
Operating Mine Cash Flow A$M 1,121.4 771.5 45%
Net Mine Cash Flow A$M 736.0 497.8 48%
Group Cash Flow1 A$M 541.8 291.6 86%
EBITDA Margin % 53 48 10%
Underlying EPS cents 23.8 12.9 84%
Final dividend (fully franked) cps 9.0 6.0 50%
1. Cash flow before dividends, debt repayments and M&A costs
For
per
sona
l use
onl
y

RECORD UNDERLYING NET PROFIT
8
◼ Record underlying profit up 86% to A$405.4M
◼ Revenue up 29% and royalties up 20% due to higher metal prices and increased metal sold
◼ Operating costs well controlled with an increase of only 1.2%1
◼ Inventory movements were due to planned stockpile drawdowns at Cowal and Mt Rawdon
◼ Exploration expense relates predominantly to Tennant Creek (A$16.4M)
218.2 44.6 15.6
303.0
8.0 9.8 48.6 10.7 16.5 7.9
74.5
405.4
Statutory and
Underlying
Profit
June 2019
Cracow - Sold Red Lake - Part
Year
Gold Revenue Operating
Costs
Royalties Inventory
Movements
Depreciation &
Amortisation
Exploration Corporate /
Interest / Other
Tax Underlying
Profit
June 2020
Underlying Net Profit After Tax A$M
1. Excludes Red Lake which was only owned for June 2020 quarter (A$48.3 million) and Cracow (up 3%) which was sold in June 2020
For
per
sona
l use
onl
y
9
HIGH EBITDA MARGINS AND MINE CASH FLOW
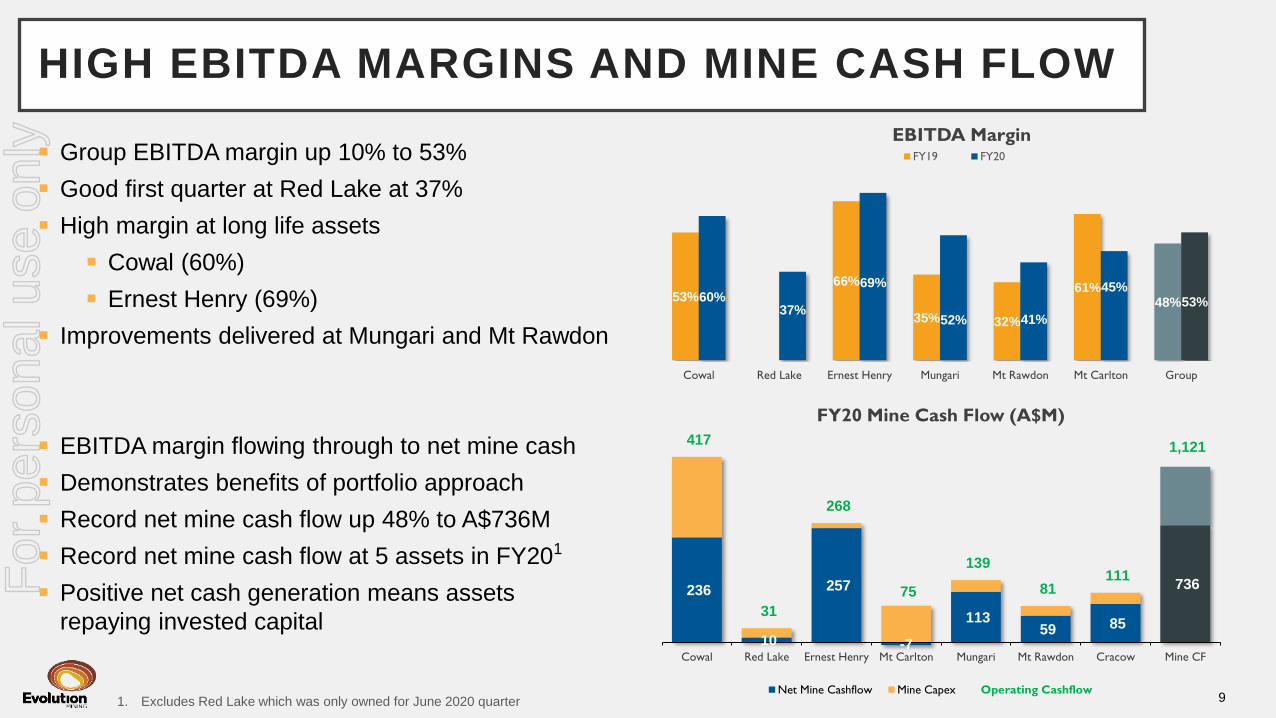
◼ Group EBITDA margin up 10% to 53%
◼ Good first quarter at Red Lake at 37%
◼ High margin at long life assets
◼ Cowal (60%)
◼ Ernest Henry (69%)
◼ Improvements delivered at Mungari and Mt Rawdon
◼ EBITDA margin flowing through to net mine cash
◼ Demonstrates benefits of portfolio approach
◼ Record net mine cash flow up 48% to A$736M
◼ Record net mine cash flow at 5 assets in FY201
◼ Positive net cash generation means assets
repaying invested capital
236
10
257
-7
113 59 85
736
417
31
268
75
139
81 111
1,121
-140
60
260
460
660
860
1060
1260
-50
-
50
100
150
200
250
300
350
400
450
Cowal Red Lake Ernest Henry Mt Carlton Mungari Mt Rawdon Cracow Mine CF
FY20 Mine Cash Flow (A$M)
Net Mine Cashflow Mine Capex Operating Cashflow
53%
0%
66%
35% 32%
61%48%60%
37%
69%
52% 41%
45%53%
Cowal Red Lake Ernest Henry Mungari Mt Rawdon Mt Carlton Group
EBITDA MarginFY19 FY20
1. Excludes Red Lake which was only owned for June 2020 quarter
For
per
sona
l use
onl
y
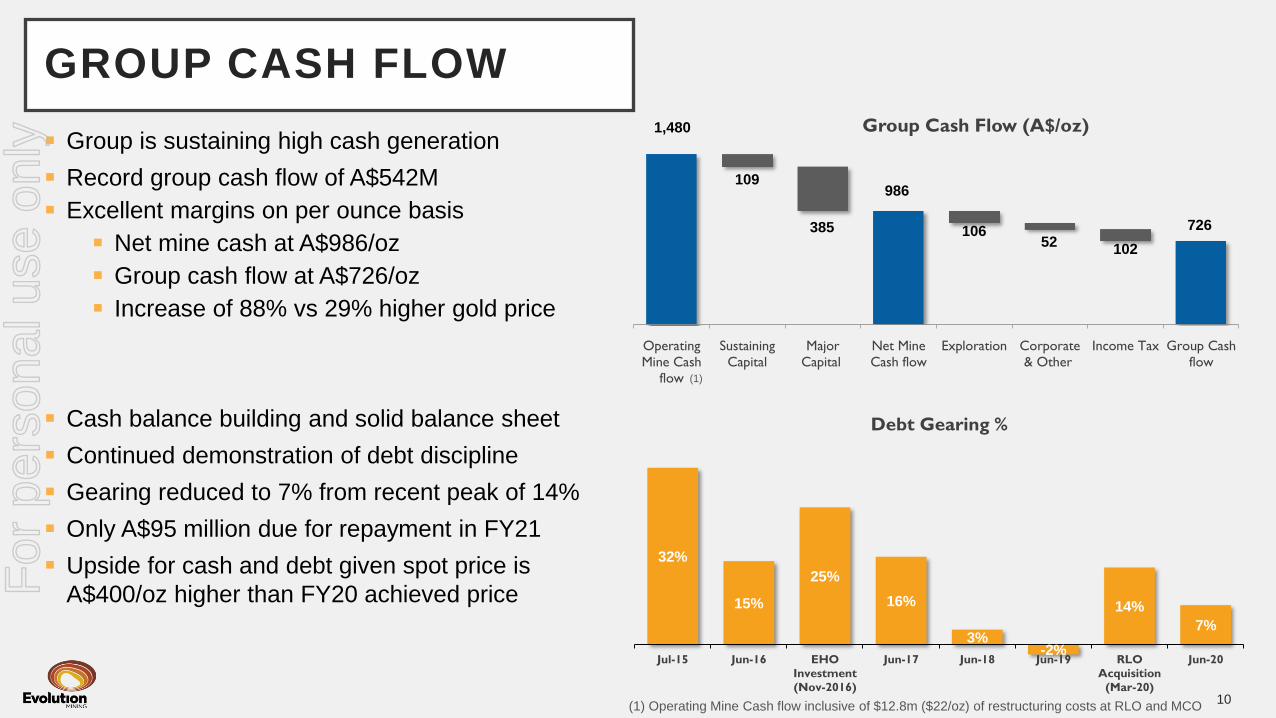
◼ Group is sustaining high cash generation
◼ Record group cash flow of A$542M
◼ Excellent margins on per ounce basis
◼ Net mine cash at A$986/oz
◼ Group cash flow at A$726/oz
◼ Increase of 88% vs 29% higher gold price
◼ Cash balance building and solid balance sheet
◼ Continued demonstration of debt discipline
◼ Gearing reduced to 7% from recent peak of 14%
◼ Only A$95 million due for repayment in FY21
◼ Upside for cash and debt given spot price is
A$400/oz higher than FY20 achieved price
GROUP CASH FLOW
10(1) Operating Mine Cash flow inclusive of $12.8m ($22/oz) of restructuring costs at RLO and MCO
32%
15%
25%
16%
3%-2%
14%
7%
Jul-15 Jun-16 EHO
Investment
(Nov-2016)
Jun-17 Jun-18 Jun-19 RLO
Acquisition
(Mar-20)
Jun-20
Debt Gearing %
1,480
109
385
986
106 52
102
726
Operating
Mine Cash
flow
Sustaining
Capital
Major
Capital
Net Mine
Cash flow
Exploration Corporate
& Other
Income Tax Group Cash
flow
Group Cash Flow (A$/oz)
(1)
For
per
sona
l use
onl
y

◼ Final dividend:
◼ Fully franked at 9 cents (A$153M)
◼ Payment date: 25 September 2020
◼ Record date: 25 August 2020
◼ Full year dividend:
◼ Up 68% to 16 cents fully franked
◼ Equal to 14% of revenue
◼ Strong yield at 2.9%(1)
◼ Returns for shareholders:
◼ Paying based on cash flow targeting 50%
◼ Returning A$365/oz produced in dividends
◼ A$732M via 15 consecutive dividends
DIVIDENDS
11
(1) Based on share price of A$5.54 at 12 August 2020
49 55 100
158 214
365
FY15 FY16 FY17 FY18 FY19 FY20
Dividends declared per ounce produced (A$)
1 1 23.5 3.5
7
1 23
46
9
3% 3%
6%
8%
11%
14%
0
2
4
6
8
10
12
14
16
18
20
0
0.02
0.04
0.06
0.08
0.1
0.12
0.14
0.16
FY15 FY16 FY17 FY18 FY19 FY20
Dividends
(% of Revenue vs cents per share declared)
Interim (cps) Final (cps) % of Revenue
For
per
sona
l use
onl
y

12
FY21 GUIDANCE: PRODUCTION AND COST
FY21
GuidanceGold Production AISC (A$/oz)
Cowal 205,000 – 230,000 990 – 1,040
Red Lake 125,000 – 135,000 2,050 – 2,100
Mungari 120,000 – 130,000 1,320 – 1,370
Mt Rawdon 87,500 – 92,500 1,290 – 1,340
Mt Carlton 47,500 – 52,500 1,700 – 1,750
Ernest Henry 85,000 – 90,000 (350) – (300)
Corporate 65 – 70
Group 670,000 – 730,000 1,240 – 1,300
*AISC is based on Gold price of A$2,200/oz (royalties) and Copper price of A$8,400/t (By-
product credits)
PRODUCTION
◼ Cowal processing low grade stockpiles to end of FY21
◼ Full year at Red Lake offsets removal of Cracow
◼ Mungari slightly lower as open pit grade declines
partially offset by sustained higher throughput (2Mtpa)
◼ Higher production at Mt Rawdon offset by lower
production at Mt Carlton and Ernest Henry (grade
related)
COSTS
◼ Red Lake initially increases group AISC by A$200-
215/oz then trends lower as benefits of transformation
plan realised
◼ No material increases in operating costs expected
◼ Lower grade impacting AISC at most sites
◼ Lower copper production increases AISC by A$30-
35/oz
For
per
sona
l use
onl
y
13
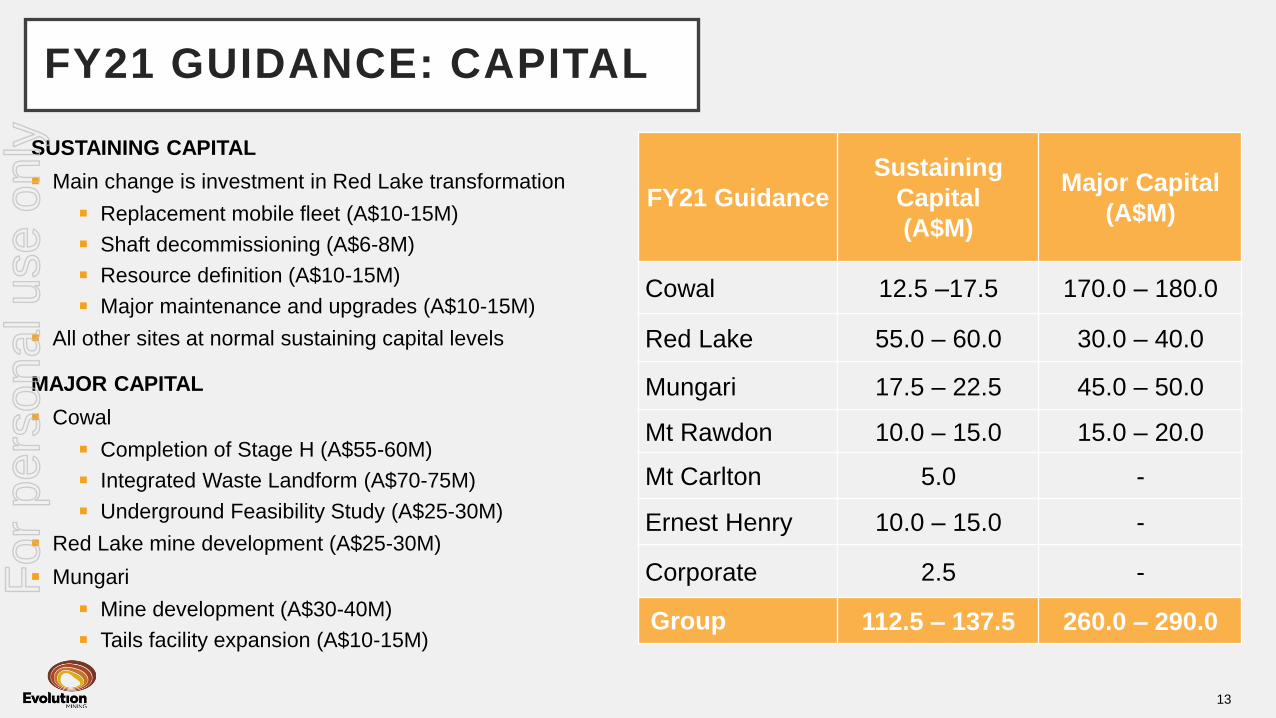
FY21 GUIDANCE: CAPITAL
FY21 Guidance
Sustaining
Capital
(A$M)
Major Capital
(A$M)
Cowal 12.5 –17.5 170.0 – 180.0
Red Lake 55.0 – 60.0 30.0 – 40.0
Mungari 17.5 – 22.5 45.0 – 50.0
Mt Rawdon 10.0 – 15.0 15.0 – 20.0
Mt Carlton 5.0 -
Ernest Henry 10.0 – 15.0 -
Corporate 2.5 -
Group 112.5 – 137.5 260.0 – 290.0
SUSTAINING CAPITAL
◼ Main change is investment in Red Lake transformation
◼ Replacement mobile fleet (A$10-15M)
◼ Shaft decommissioning (A$6-8M)
◼ Resource definition (A$10-15M)
◼ Major maintenance and upgrades (A$10-15M)
◼ All other sites at normal sustaining capital levels
MAJOR CAPITAL
◼ Cowal
◼ Completion of Stage H (A$55-60M)
◼ Integrated Waste Landform (A$70-75M)
◼ Underground Feasibility Study (A$25-30M)
◼ Red Lake mine development (A$25-30M)
◼ Mungari
◼ Mine development (A$30-40M)
◼ Tails facility expansion (A$10-15M)
For
per
sona
l use
onl
y
670-730 700-770790-850
FY21 FY22 FY23
Production (koz)
14
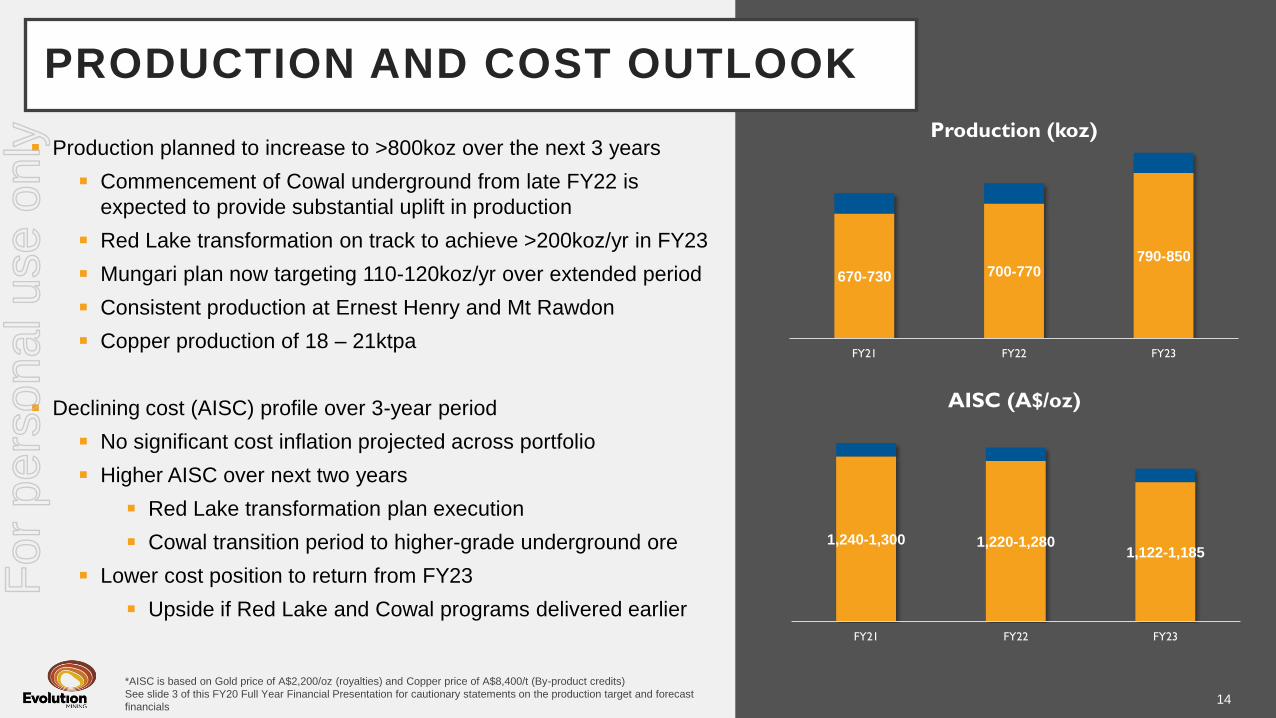
PRODUCTION AND COST OUTLOOK
◼ Production planned to increase to >800koz over the next 3 years
◼ Commencement of Cowal underground from late FY22 is
expected to provide substantial uplift in production
◼ Red Lake transformation on track to achieve >200koz/yr in FY23
◼ Mungari plan now targeting 110-120koz/yr over extended period
◼ Consistent production at Ernest Henry and Mt Rawdon
◼ Copper production of 18 – 21ktpa
◼ Declining cost (AISC) profile over 3-year period
◼ No significant cost inflation projected across portfolio
◼ Higher AISC over next two years
◼ Red Lake transformation plan execution
◼ Cowal transition period to higher-grade underground ore
◼ Lower cost position to return from FY23
◼ Upside if Red Lake and Cowal programs delivered earlier
*AISC is based on Gold price of A$2,200/oz (royalties) and Copper price of A$8,400/t (By-product credits)
See slide 3 of this FY20 Full Year Financial Presentation for cautionary statements on the production target and forecast
financials
1,240-1,300 1,220-1,2801,122-1,185
FY21 FY22 FY23
AISC (A$/oz)
For
per
sona
l use
onl
y

15
CAPITAL OUTLOOK
*AISC is based on Gold price of A$2,200/oz (royalties) and Copper price of A$8,400/t (By-product credits)
See slide 3 of this FY20 Full Year Financial Presentation for cautionary statements on the production
target and forecast financials
112.5-137.5 110-13595-125
FY21 FY22 FY23
Sustaining Capital (A$M)
260-290 250-280220-260
FY21 FY22 FY23
Major Capital (A$M)
◼ No material increases in sustaining capital investment expected
◼ Main investment areas are equipment replacement; tailings
management; process plant upgrades and Resource Definition
programs
◼ Main major capital investment for expanded or future production
◼ Cowal:
◼ Integrated Waste Landform (IWL): A$70-80M (FY22) &
A$15-20M (FY23)
◼ Underground: A$100-130M (FY22) & A$100-125M (FY23)
◼ Red Lake:
◼ Mine Development: A$30-35M (FY22) & A$15-20M (FY23)
◼ Mungari
◼ Satellite Pits: A$15-25M (FY22) & A$10-15M (FY23)
For
per
sona
l use
onl
y

16
RED LAKE MINERAL RESOURCE
Key Highlights
◼ Initial JORC Code 2012 Mineral Resource estimate of
48.1Mt grading 7.1g/t for 11.0 million ounces
◼ Including Upper Campbell estimate of 12.9Mt
grading 10.5g/t for 4.3 million ounces
◼ Potential to optimise a large, long life mining operation
◼ Presents significant upside to Evolution’s initial Red
Lake investment case
New Resource model incorporates
◼ 7 million metres of historic drilling
◼ 6 million drill sample assay results
◼ 142 separate block models reduced to 19
◼ Cut-off grade assumptions ranging from 3.0 – 3.3g/t
reflect Evolution’s transformation plan which is
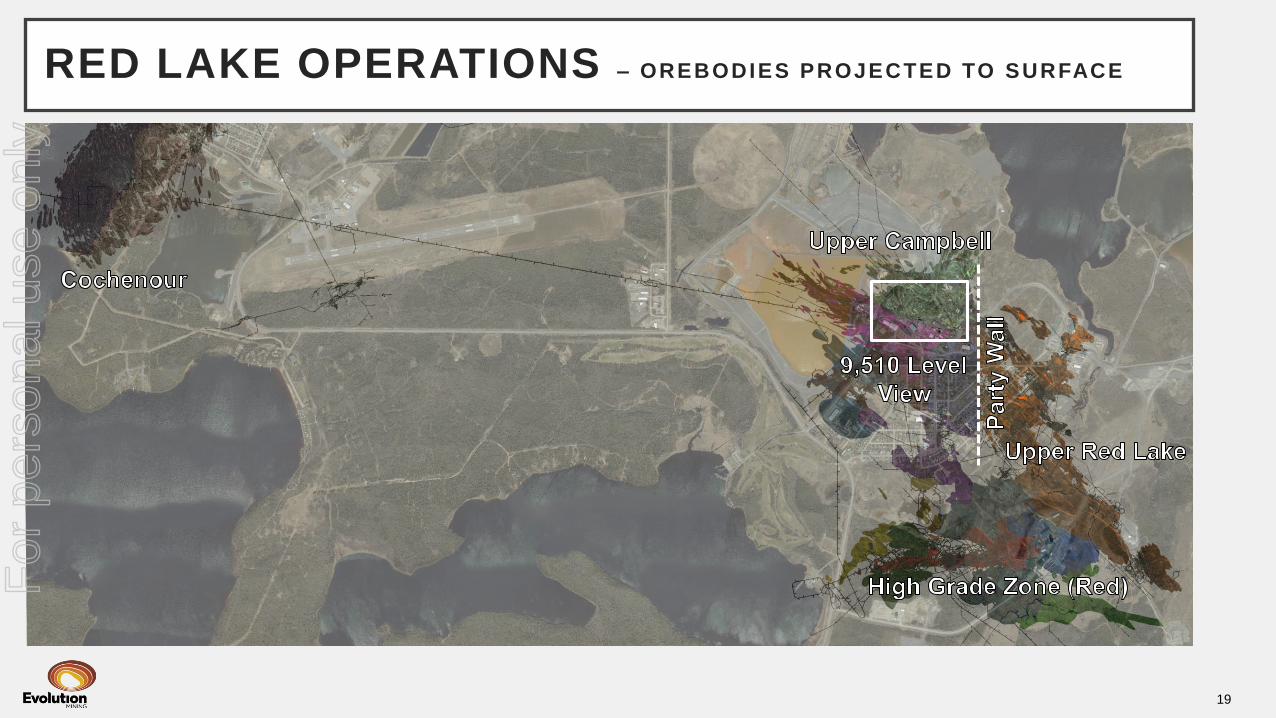
expected to significantly reduce operating costsSurface projection of the Red Lake Operation orebodies and underground
workings with the orthophoto transparency superimposed
Full details of the Red Lake Mineral Resources are provided in the report entitled “Red Lake Initial JORC Code Mineral Resource of 11 Million Ounces" released 13 August 2020 and available to view at www.evolutionmining.com.au.
Details are also provided on slide 29 of this presentation. The Company confirms that it is not aware of any new information or data that materially affects the information included in the report and that all material assumptions and
parameters underpinning the estimates in the report continue to apply and have not materially changed. The Company confirms that the form and context in which the Competent Persons’ findings are presented have not been
materially modified from the report.
For
per
sona
l use
onl
y

17
11 MILLION OUNCE RESOURCEF
or p
erso
nal u
se o
nly

18
RED LAKE HISTORY
1949Mining commences
in the region,
delivering 29Moz
first production
2000Labour strike
resolved, McEwen
launches “Goldcorp
Challenge”
1939First record of
mining at the
Cochenour deposit
1989Rob McEwen gains
control of Arthur
White and
Dickenson Mine
1995High-grade zone
discovered
1991McEwen
restructures
companies to form
Goldcorp
Incorporated
1996Four year labour
strike begins
2003Sinking of the No. 3
shaft to work the
high-grade zone
2002Discovery of the
Deep Sulphide
zones
2006Dickenson and
Campbell mine
operations merged to
create Red Lake
Goldcorp purchases
Campbell Mines from
Barrick Gold
Corporation
2008Acquisition of Gold
Eagle, dewatering
and rehabilitation of
Cochenour – Willans
shaft begins
2019Newmont acquires
Goldcorp, including
the Red Lake gold
mine
2012Cochenour haulage
drift completed, now
connected to
Campbell shaft to
move ore
2020Evolution Mining
acquires the Red
Lake gold
mine from Newmont
For
per
sona
l use
onl
y
19
RED LAKE OPERATIONS – OREBODIES PROJECTED TO SURFACE
9,510 Level
For
per
sona
l use
onl
y
20
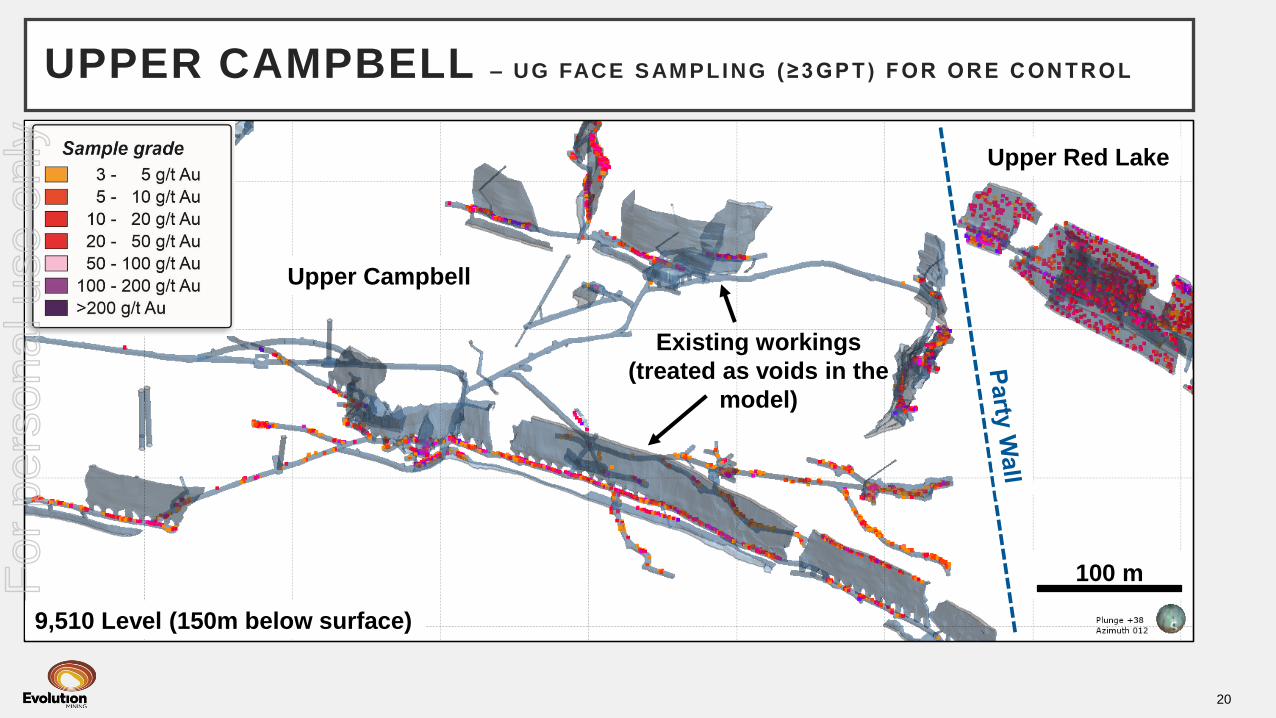
UPPER CAMPBELL – UG FACE SAMPLING ( ≥3GPT) FOR ORE CONTROL
9,510 Level (150m below surface)
100 m
Existing workings
(treated as voids in the
model)
Upper Campbell
Upper Red Lake
For
per
sona
l use
onl
y
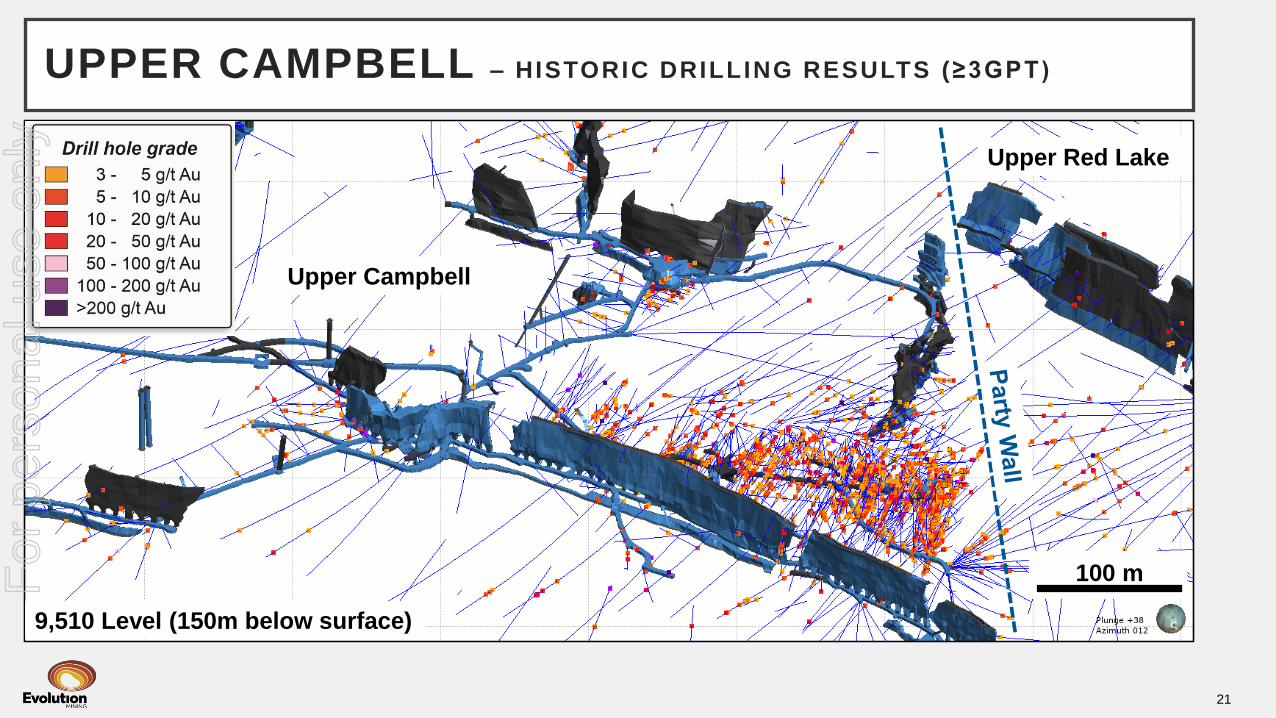
21
UPPER CAMPBELL – HISTORIC DRILLING RESULTS (≥3GPT)
Upper Campbell
Upper Red Lake
100 m
9,510 Level (150m below surface)
For
per
sona
l use
onl
y
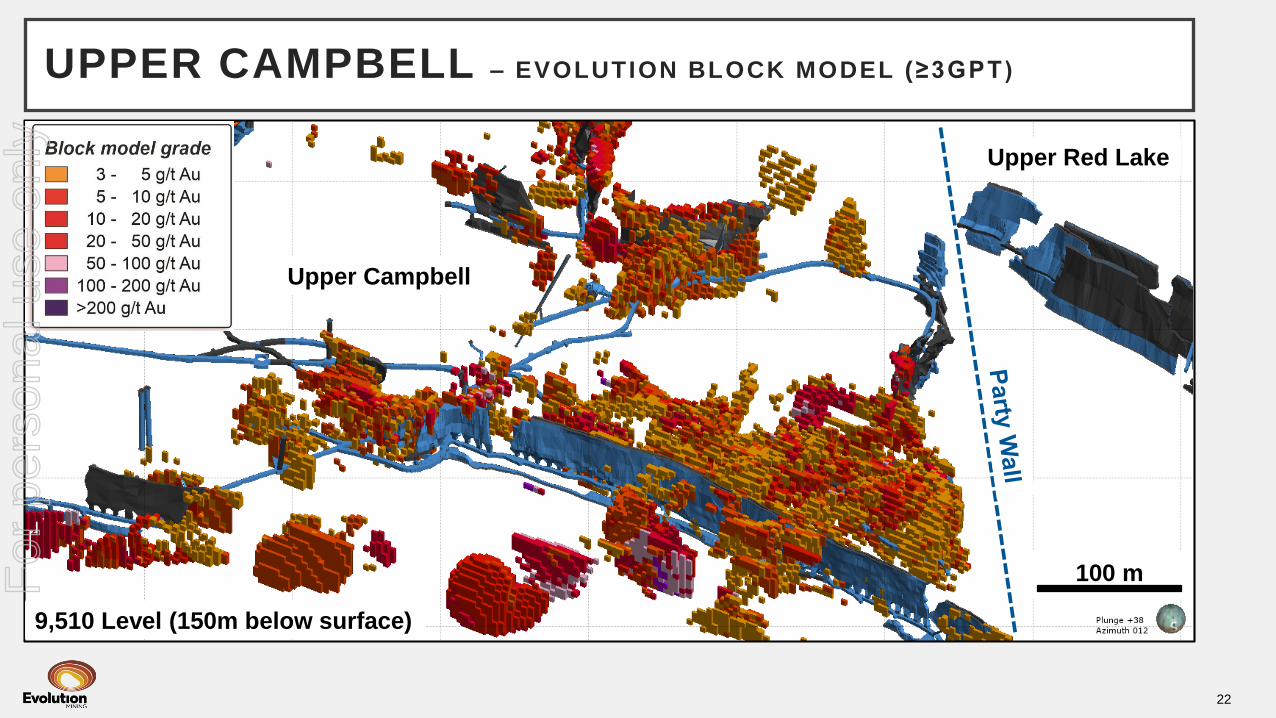
22
UPPER CAMPBELL – EVOLUTION BLOCK MODEL (≥3GPT)
100 m
Upper Campbell
Upper Red Lake
9,510 Level (150m below surface)
For
per
sona
l use
onl
y
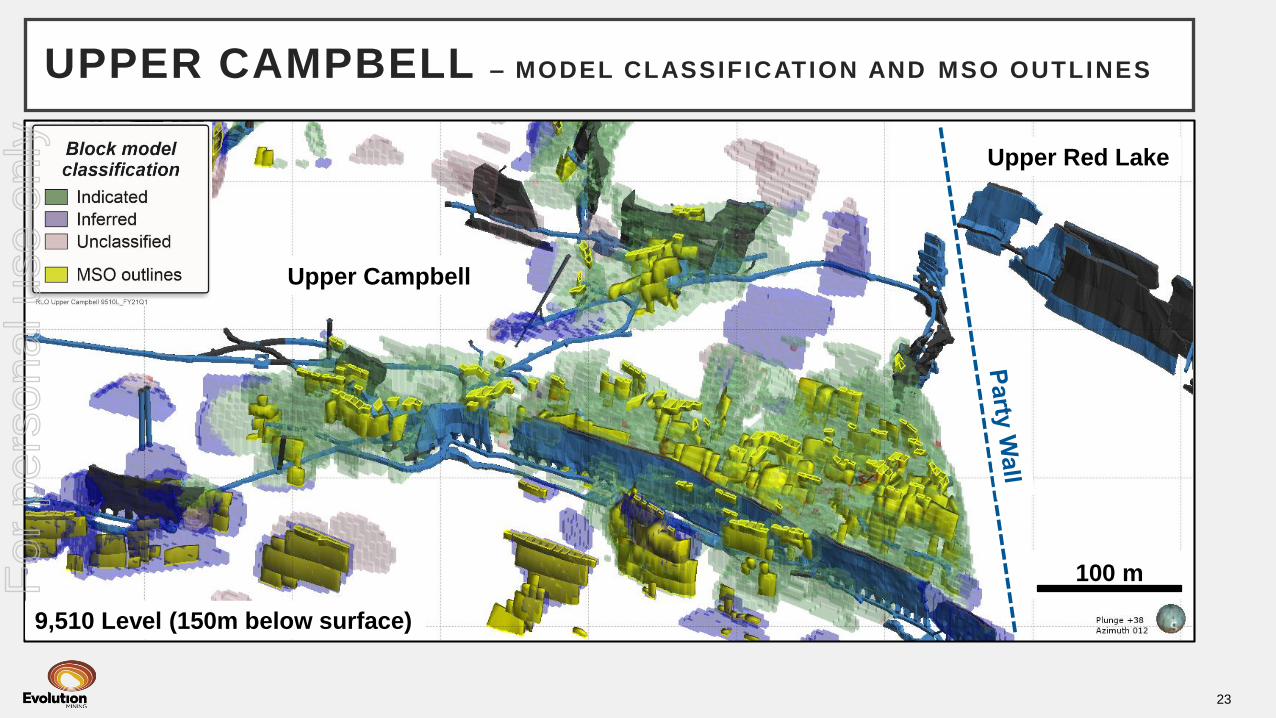
23
UPPER CAMPBELL – MODEL CLASSIFICATION AND MSO OUTLINES
100 m
Upper Campbell
Upper Red Lake
9,510 Level (150m below surface)
For
per
sona
l use
onl
y

24
SUMMARY
3 Year Outlook:
Increasing production
and lower AISC
11Moz Red Lake
Mineral Resource
Strategy execution
delivering sector
leading financials
For
per
sona
l use
onl
y

APPENDIX
For
per
sona
l use
onl
y

SUSTAINABILITY PRINCIPLES
The objective of our sustainability efforts is to deliver long-term
stakeholder value through safe, low-cost gold production in an
environmentally and socially responsible manner
Be an employer of choice
attracting the most talented
people and foster a safe,
diverse and inclusive
workplace
Demonstrate robust risk
management and safety
leadership
Contribute positively to local,
regional and national
sustainability efforts by
achieving an outstanding
level of environmental
stewardship
Actively manage climate
related risks and
opportunities including
improving energy efficiency
and the responsible
management of water
Protect and enhance our
reputation as a trusted
partner and provide
community benefits that
endure beyond the life of our
mines
Advance the outcomes for
indigenous peoples and
protect their cultural heritage
Be transparent at all levels of
Corporate Governance,
comply with applicable laws
and regulations and operate
at the highest standards of
financial and ethical
behaviour
Respect the human rights of
all our stakeholders Relentlessly drive for
operational excellence
through an innovative culture
and inspired people
delivering to plan
OUR VALUES: SAFETY EXCELLENCE ACCOUNTABILITY RESPECT 26
For
per
sona
l use
onl
y

FY21 GuidanceGold Production
All-in Sustaining
Cost
Sustaining
CapitalMajor Capital
(oz) (A$/oz) (A$M) (A$M)
Cowal 205,000 – 230,000 990 – 1,040 12.5 –17.5 170.0 – 180.0
Red Lake 125,000 – 135,000 2,050 – 2,100 55.0 – 60.0 30.0 – 40.0
Mungari 120,000 – 130,000 1,320 – 1,370 17.5 – 22.5 45.0 – 50.0
Mt Rawdon 87,500 – 92,500 1,290 – 1,340 10.0 – 15.0 15.0 – 20.0
Mt Carlton 47,500 – 52,500 1,700 – 1,750 5.0 -
Ernest Henry 85,000 – 90,000 (350) – (300) 10.0 – 15.0 -
Corporate 65 – 70 2.5 -
Group 670,000 – 730,000 1,240 – 1,300 112.5 – 137.5 260.0 – 290.0
Ernest Henry (Cu t) 18,000 – 20,000
Mt Carlton (Cu t) 1,000 – 1,500
*AISC is based on Gold price of A$2,200/oz (royalties) and Copper price of A$8,400/t (By-product credits)
27
FY21 GUIDANCE: PRODUCTION, COSTS & CAPITAL F
or p
erso
nal u
se o
nly

28
FY21 GUIDANCE: DISCOVERY AND NON-CASH
FY21 Guidance
Depreciation &
Amortisation(1)
(A$/oz)
Resource
Definition(2)
(A$M)
Discovery
(A$M)
Cowal 320 – 370 3 – 5 35 – 45
Red Lake 400 – 450 10 – 15 15 – 20
Mungari 300 – 350 1 – 2 8 – 13
Mt Rawdon 550 – 600 1 – 2 1 – 2
Mt Carlton 975 – 1,025 0 – 1 3
Ernest Henry 1,350 – 1,400 0 – 2 0
Corporate 13 – 17
Group 550 – 600 15 – 27 75 – 100
(1) Depreciation & Amortisation FY21 guidance includes fair value unwind at Cowal (A$7.5-12.5M) & Mungari (A$5.0-10.0M) and amortisation of Ernest Henry prepayment (10-12%).
(2) Resource definition is included in the Sustaining Capital guidance
For
per
sona
l use
onl
y

29
3 YEAR OUTLOOK: FY21 – FY23
3 Year Outlook FY21 FY22 FY23
Production (oz) 670,000 – 730,000 700,000 – 770,000 790,000 – 850,000
AISC (A$/oz) 1,240 – 1,300 1,220 – 1,280 1,125 – 1,185
Sustaining Capex ($M) 112.5 – 137.5 110.0 – 135.0 95.0 – 125.0
Major Capital ($M) 260.0 – 290.0 250.0 – 280.0 220.0 – 260.0
Discovery ($M) 75.0 – 100.0 70.0 – 100.0 70.0 – 100.0
*AISC is based on Gold price of A$2,200/oz (royalties) and Copper price of A$8,400/t (By-product credits)
See slide 3 of this FY20 Full Year Financial Presentation for cautionary statements on the production target and forecast financials
For
per
sona
l use
onl
y
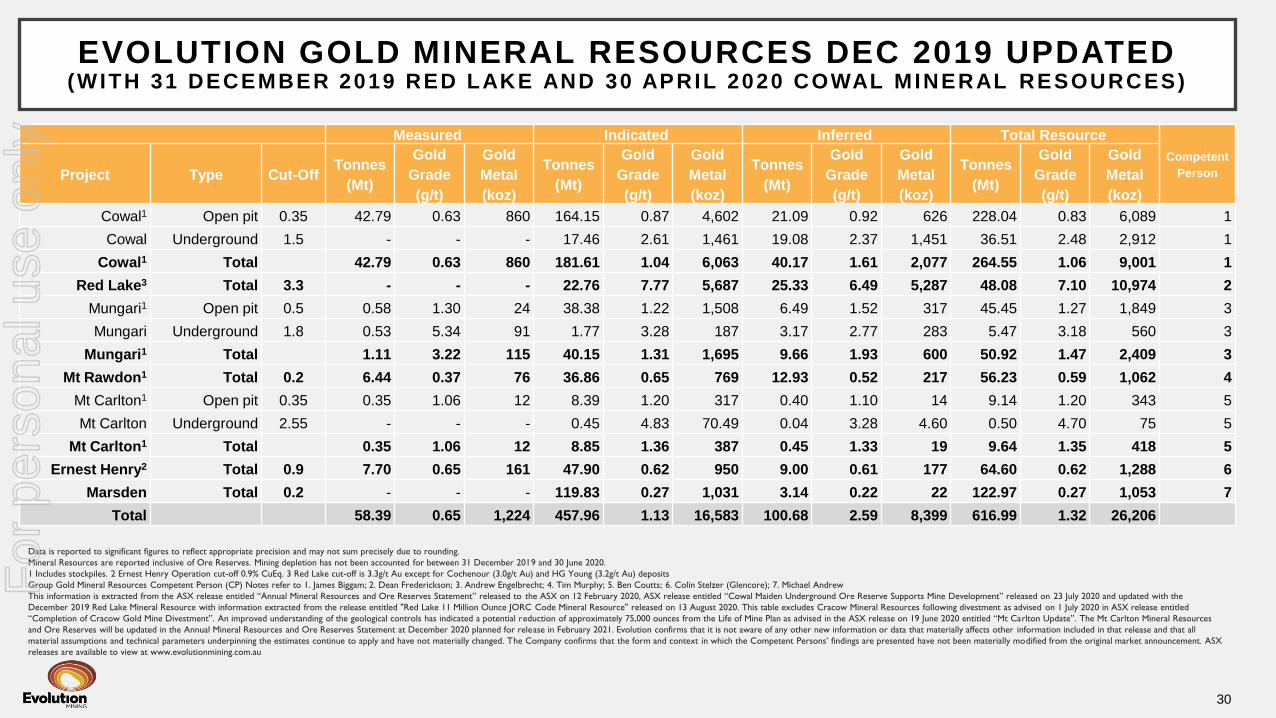
EVOLUTION GOLD MINERAL RESOURCES DEC 2019 UPDATED (WITH 31 DECEMBER 2019 RED LAKE AND 30 APRIL 2020 COWAL MINERAL RESOURCES)
30
Data is reported to significant figures to reflect appropriate precision and may not sum precisely due to rounding.
Mineral Resources are reported inclusive of Ore Reserves. Mining depletion has not been accounted for between 31 December 2019 and 30 June 2020.
1 Includes stockpiles. 2 Ernest Henry Operation cut-off 0.9% CuEq. 3 Red Lake cut-off is 3.3g/t Au except for Cochenour (3.0g/t Au) and HG Young (3.2g/t Au) deposits
Group Gold Mineral Resources Competent Person (CP) Notes refer to 1. James Biggam; 2. Dean Frederickson; 3. Andrew Engelbrecht; 4. Tim Murphy; 5. Ben Coutts; 6. Colin Stelzer (Glencore); 7. Michael Andrew
This information is extracted from the ASX release entitled “Annual Mineral Resources and Ore Reserves Statement” released to the ASX on 12 February 2020, ASX release entitled “Cowal Maiden Underground Ore Reserve Supports Mine Development” released on 23 July 2020 and updated with the
December 2019 Red Lake Mineral Resource with information extracted from the release entitled "Red Lake 11 Million Ounce JORC Code Mineral Resource" released on 13 August 2020. This table excludes Cracow Mineral Resources following divestment as advised on 1 July 2020 in ASX release entitled
“Completion of Cracow Gold Mine Divestment”. An improved understanding of the geological controls has indicated a potential reduction of approximately 75,000 ounces from the Life of Mine Plan as advised in the ASX release on 19 June 2020 entitled “Mt Carlton Update”. The Mt Carlton Mineral Resources
and Ore Reserves will be updated in the Annual Mineral Resources and Ore Reserves Statement at December 2020 planned for release in February 2021. Evolution confirms that it is not aware of any other new information or data that materially affects other information included in that release and that all
material assumptions and technical parameters underpinning the estimates continue to apply and have not materially changed. The Company confirms that the form and context in which the Competent Persons’ findings are presented have not been materially modified from the original market announcement. ASX
releases are available to view at www.evolutionmining.com.au
Measured Indicated Inferred Total Resource
Competent
PersonProject Type Cut-OffTonnes
(Mt)
Gold
Grade
(g/t)
Gold
Metal
(koz)
Tonnes
(Mt)
Gold
Grade
(g/t)
Gold
Metal
(koz)
Tonnes
(Mt)
Gold
Grade
(g/t)
Gold
Metal
(koz)
Tonnes
(Mt)
Gold
Grade
(g/t)
Gold
Metal
(koz)
Cowal1 Open pit 0.35 42.79 0.63 860 164.15 0.87 4,602 21.09 0.92 626 228.04 0.83 6,089 1
Cowal Underground 1.5 - - - 17.46 2.61 1,461 19.08 2.37 1,451 36.51 2.48 2,912 1
Cowal1 Total 42.79 0.63 860 181.61 1.04 6,063 40.17 1.61 2,077 264.55 1.06 9,001 1
Red Lake3 Total 3.3 - - - 22.76 7.77 5,687 25.33 6.49 5,287 48.08 7.10 10,974 2
Mungari1 Open pit 0.5 0.58 1.30 24 38.38 1.22 1,508 6.49 1.52 317 45.45 1.27 1,849 3
Mungari Underground 1.8 0.53 5.34 91 1.77 3.28 187 3.17 2.77 283 5.47 3.18 560 3
Mungari1 Total 1.11 3.22 115 40.15 1.31 1,695 9.66 1.93 600 50.92 1.47 2,409 3
Mt Rawdon1 Total 0.2 6.44 0.37 76 36.86 0.65 769 12.93 0.52 217 56.23 0.59 1,062 4
Mt Carlton1 Open pit 0.35 0.35 1.06 12 8.39 1.20 317 0.40 1.10 14 9.14 1.20 343 5
Mt Carlton Underground 2.55 - - - 0.45 4.83 70.49 0.04 3.28 4.60 0.50 4.70 75 5
Mt Carlton1 Total 0.35 1.06 12 8.85 1.36 387 0.45 1.33 19 9.64 1.35 418 5
Ernest Henry2 Total 0.9 7.70 0.65 161 47.90 0.62 950 9.00 0.61 177 64.60 0.62 1,288 6
Marsden Total 0.2 - - - 119.83 0.27 1,031 3.14 0.22 22 122.97 0.27 1,053 7
Total 58.39 0.65 1,224 457.96 1.13 16,583 100.68 2.59 8,399 616.99 1.32 26,206
For
per
sona
l use
onl
y
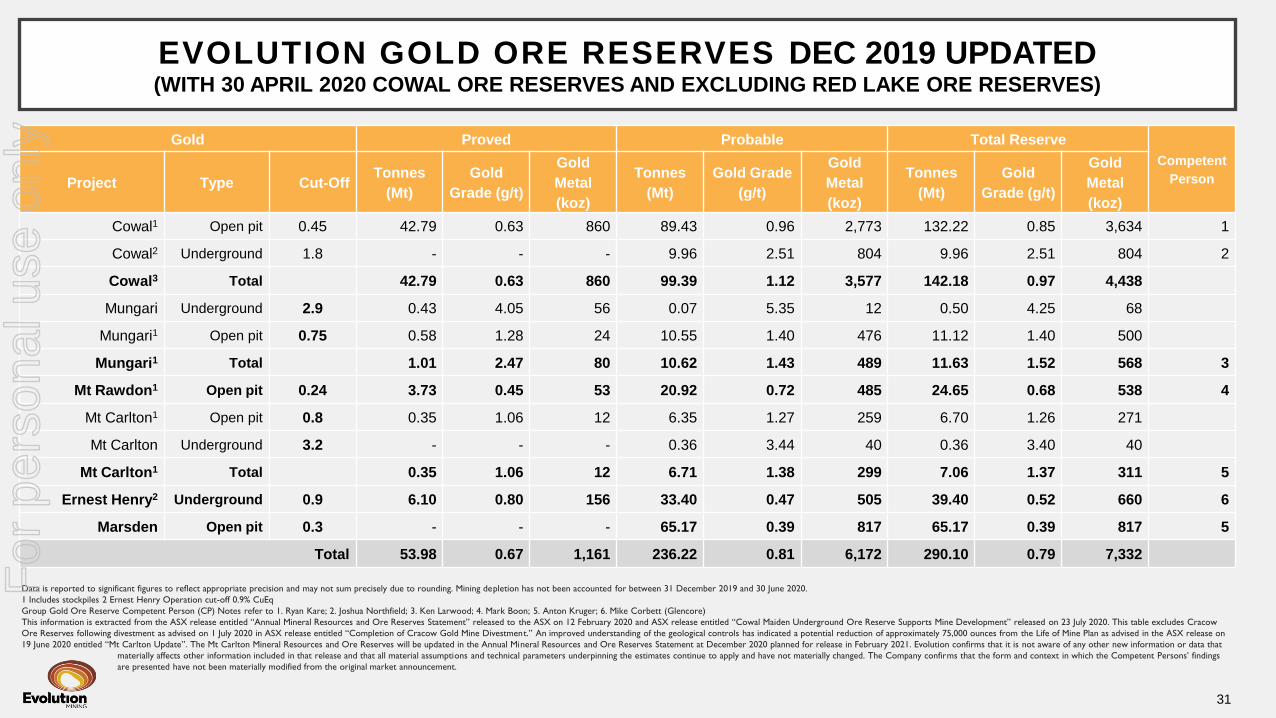
EVOLUTION GOLD ORE RESERVES DEC 2019 UPDATED(WITH 30 APRIL 2020 COWAL ORE RESERVES AND EXCLUDING RED LAKE ORE RESERVES)
31
Data is reported to significant figures to reflect appropriate precision and may not sum precisely due to rounding. Mining depletion has not been accounted for between 31 December 2019 and 30 June 2020.
1 Includes stockpiles 2 Ernest Henry Operation cut-off 0.9% CuEq
Group Gold Ore Reserve Competent Person (CP) Notes refer to 1. Ryan Kare; 2. Joshua Northfield; 3. Ken Larwood; 4. Mark Boon; 5. Anton Kruger; 6. Mike Corbett (Glencore)
This information is extracted from the ASX release entitled “Annual Mineral Resources and Ore Reserves Statement” released to the ASX on 12 February 2020 and ASX release entitled “Cowal Maiden Underground Ore Reserve Supports Mine Development” released on 23 July 2020. This table excludes Cracow
Ore Reserves following divestment as advised on 1 July 2020 in ASX release entitled “Completion of Cracow Gold Mine Divestment.” An improved understanding of the geological controls has indicated a potential reduction of approximately 75,000 ounces from the Life of Mine Plan as advised in the ASX release on
19 June 2020 entitled “Mt Carlton Update”. The Mt Carlton Mineral Resources and Ore Reserves will be updated in the Annual Mineral Resources and Ore Reserves Statement at December 2020 planned for release in February 2021. Evolution confirms that it is not aware of any other new information or data that
materially affects other information included in that release and that all material assumptions and technical parameters underpinning the estimates continue to apply and have not materially changed. The Company confirms that the form and context in which the Competent Persons’ findings
are presented have not been materially modified from the original market announcement.
Gold Proved Probable Total Reserve
Competent
PersonProject Type Cut-OffTonnes
(Mt)
Gold
Grade (g/t)
Gold
Metal
(koz)
Tonnes
(Mt)
Gold Grade
(g/t)
Gold
Metal
(koz)
Tonnes
(Mt)
Gold
Grade (g/t)
Gold
Metal
(koz)
Cowal1 Open pit 0.45 42.79 0.63 860 89.43 0.96 2,773 132.22 0.85 3,634 1
Cowal2 Underground 1.8 - - - 9.96 2.51 804 9.96 2.51 804 2
Cowal3 Total 42.79 0.63 860 99.39 1.12 3,577 142.18 0.97 4,438
Mungari Underground 2.9 0.43 4.05 56 0.07 5.35 12 0.50 4.25 68
Mungari1 Open pit 0.75 0.58 1.28 24 10.55 1.40 476 11.12 1.40 500
Mungari1 Total 1.01 2.47 80 10.62 1.43 489 11.63 1.52 568 3
Mt Rawdon1 Open pit 0.24 3.73 0.45 53 20.92 0.72 485 24.65 0.68 538 4
Mt Carlton1 Open pit 0.8 0.35 1.06 12 6.35 1.27 259 6.70 1.26 271
Mt Carlton Underground 3.2 - - - 0.36 3.44 40 0.36 3.40 40
Mt Carlton1 Total 0.35 1.06 12 6.71 1.38 299 7.06 1.37 311 5
Ernest Henry2 Underground 0.9 6.10 0.80 156 33.40 0.47 505 39.40 0.52 660 6
Marsden Open pit 0.3 - - - 65.17 0.39 817 65.17 0.39 817 5
Total 53.98 0.67 1,161 236.22 0.81 6,172 290.10 0.79 7,332
For
per
sona
l use
onl
y
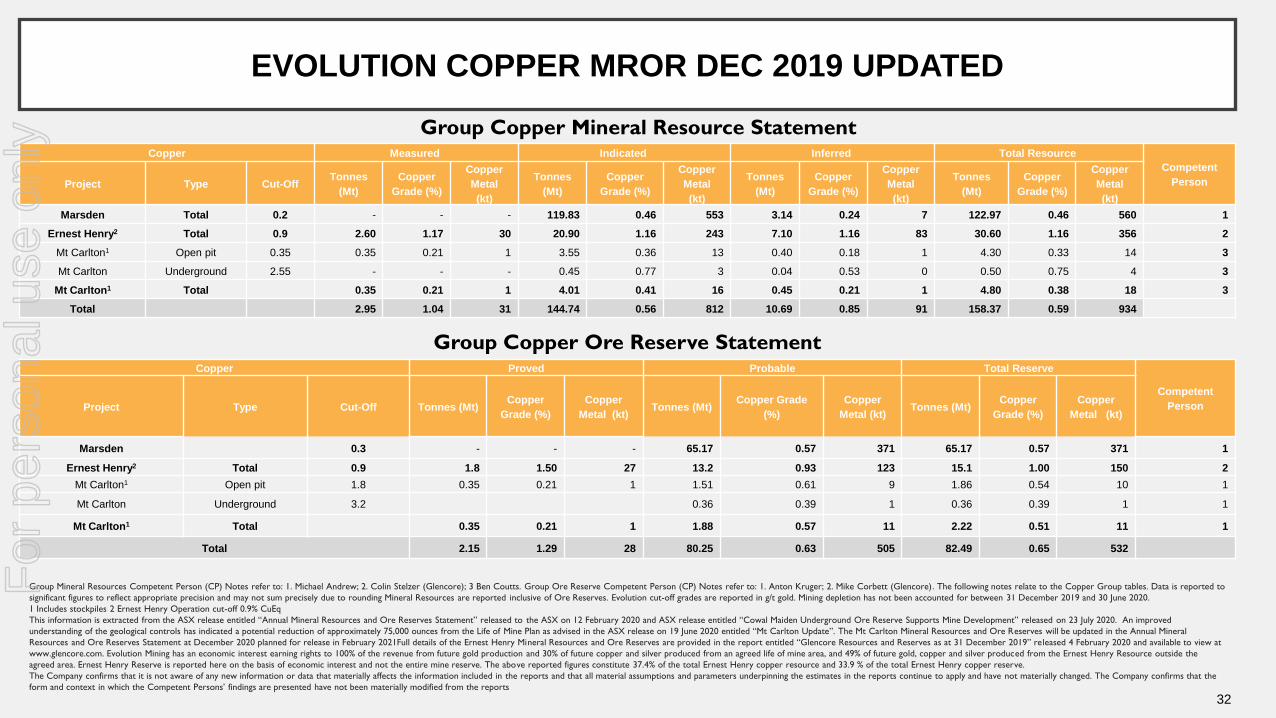
EVOLUTION COPPER MROR DEC 2019 UPDATED
32
Group Mineral Resources Competent Person (CP) Notes refer to: 1. Michael Andrew; 2. Colin Stelzer (Glencore); 3 Ben Coutts. Group Ore Reserve Competent Person (CP) Notes refer to: 1. Anton Kruger; 2. Mike Corbett (Glencore). The following notes relate to the Copper Group tables. Data is reported to
significant figures to reflect appropriate precision and may not sum precisely due to rounding Mineral Resources are reported inclusive of Ore Reserves. Evolution cut-off grades are reported in g/t gold. Mining depletion has not been accounted for between 31 December 2019 and 30 June 2020.
1 Includes stockpiles 2 Ernest Henry Operation cut-off 0.9% CuEq
This information is extracted from the ASX release entitled “Annual Mineral Resources and Ore Reserves Statement” released to the ASX on 12 February 2020 and ASX release entitled “Cowal Maiden Underground Ore Reserve Supports Mine Development” released on 23 July 2020. An improved
understanding of the geological controls has indicated a potential reduction of approximately 75,000 ounces from the Life of Mine Plan as advised in the ASX release on 19 June 2020 entitled “Mt Carlton Update”. The Mt Carlton Mineral Resources and Ore Reserves will be updated in the Annual Mineral
Resources and Ore Reserves Statement at December 2020 planned for release in February 2021Full details of the Ernest Henry Mineral Resources and Ore Reserves are provided in the report entitled “Glencore Resources and Reserves as at 31 December 2019” re leased 4 February 2020 and available to view at
www.glencore.com. Evolution Mining has an economic interest earning rights to 100% of the revenue from future gold production and 30% of future copper and silver produced from an agreed life of mine area, and 49% of future gold, copper and silver produced from the Ernest Henry Resource outside the
agreed area. Ernest Henry Reserve is reported here on the basis of economic interest and not the entire mine reserve. The above reported figures constitute 37.4% of the total Ernest Henry copper resource and 33.9 % of the total Ernest Henry copper reserve.
The Company confirms that it is not aware of any new information or data that materially affects the information included in the reports and that all material assumptions and parameters underpinning the estimates in the reports continue to apply and have not materially changed. The Company confirms that the
form and context in which the Competent Persons’ findings are presented have not been materially modified from the reports
Group Copper Mineral Resource Statement
Group Copper Ore Reserve Statement
Copper Measured Indicated Inferred Total Resource
Competent
PersonProject Type Cut-OffTonnes
(Mt)
Copper
Grade (%)
Copper
Metal
(kt)
Tonnes
(Mt)
Copper
Grade (%)
Copper
Metal
(kt)
Tonnes
(Mt)
Copper
Grade (%)
Copper
Metal
(kt)
Tonnes
(Mt)
Copper
Grade (%)
Copper
Metal
(kt)
Marsden Total 0.2 - - - 119.83 0.46 553 3.14 0.24 7 122.97 0.46 560 1
Ernest Henry2 Total 0.9 2.60 1.17 30 20.90 1.16 243 7.10 1.16 83 30.60 1.16 356 2
Mt Carlton1 Open pit 0.35 0.35 0.21 1 3.55 0.36 13 0.40 0.18 1 4.30 0.33 14 3
Mt Carlton Underground 2.55 - - - 0.45 0.77 3 0.04 0.53 0 0.50 0.75 4 3
Mt Carlton1 Total 0.35 0.21 1 4.01 0.41 16 0.45 0.21 1 4.80 0.38 18 3
Total 2.95 1.04 31 144.74 0.56 812 10.69 0.85 91 158.37 0.59 934
Copper Proved Probable Total Reserve
Competent
PersonProject Type Cut-Off Tonnes (Mt)Copper
Grade (%)
Copper
Metal (kt)Tonnes (Mt)
Copper Grade
(%)
Copper
Metal (kt)Tonnes (Mt)
Copper
Grade (%)
Copper
Metal (kt)
Marsden 0.3 - - - 65.17 0.57 371 65.17 0.57 371 1
Ernest Henry2 Total 0.9 1.8 1.50 27 13.2 0.93 123 15.1 1.00 150 2
Mt Carlton1 Open pit 1.8 0.35 0.21 1 1.51 0.61 9 1.86 0.54 10 1
Mt Carlton Underground 3.2 0.36 0.39 1 0.36 0.39 1 1
Mt Carlton1 Total 0.35 0.21 1 1.88 0.57 11 2.22 0.51 11 1
Total 2.15 1.29 28 80.25 0.63 505 82.49 0.65 532
For
per
sona
l use
onl
y

For
per
sona
l use
onl
y