Embed Size (px)
Citation preview

DISCLOSURE APPENDIX CONTAINS ANALYST CERTIFICATIONS AND THE STATUS OF NON US ANALYSTS. FOR OTHER IMPORTANT DISCLOSURES, visit www.credit-suisse.com/researchdisclosures or call +1 (877) 291-2683 US Disclosure: Credit Suisse does and seeks to do business with companies covered in its research reports. As a result, investors should be aware that the Firm may have a conflict of interest that could affect the objectivity of this report. Investors should consider this report as only a single factor in making their investment decision.
CREDIT SUISSE SECURITIES RESEARCH & ANALYTICS BEYOND INFORMATION®
Client-Driven Solutions, Insights, and Access
21 January 2013
Asia Pacific/Australia
Equity Research
Macro
Australian ESG/SRI SOCIALLY RESPONSIBLE INVESTING
Banks down, REITS up, RIO down to BB
■ Key stock calls. We have taken key calls from our sector analysts, strategy
team, quant team, and HOLT Best in Class stocks, and overlaid an ESG
view. Our key ESG long calls are BXB (strategy), CRZ, MMS (also HOLT),
TAH, (sector analysts), AUT, ILU, PRU (quant) and FLT, HGG (HOLT Best
in Class). Our key short calls are TWE (sector analyst) and EGP (Quant).
■ MSCI IVA rating upgrades for REITS: New poster child for AAA rating.
CFX (AA), CQR (BB), GMG (AA), IOF (AAA), WDC (BBB) and WRT (BB) all
have managed an upgrade to their MSCI IVA ratings. REITS now dominate the
MSCI IVA AAA rated stocks in Australian (CPA, DXS, GPT, IOF, LLC, SGP).
■ No AAA rated Australian banks post MSCI IVA rating downgrades.
ANZ (AA), BOQ (BB), CBA (AA), NAB (A) and WBC (AA), all have suffered
MSCI IVA rating downgrades amid litigation concerns. No Australian banks
are rated AAA now, with ANZ, CBA and WBC the highest rated at AA.
■ Resource companies mixed bag: AWC (A), BHP (A), RIO (BB), WHC (B)
all suffered downgrades in their MSCI IVA ratings. BTU (B), GBG (BB),
MGX (BB), OZL (BBB), PNA (A) and WSA (BBB) had an MSCI IVA rating
upgrade. Resource companies that still have an MSCI IVA rating in the A
zone include: BHP (A), CTX (A), GRY (A), ORG (AA), PNA (A), PAN (AA),
STO (A) and WPL (AA).
■ RIO at risk with BB rating: RIO has had its MSCI IVA rating downgraded
from BBB to BB. With many of its peers rated at A (including BHP), a rating
of BB risks RIO being excluded from some investors’ universe. Or
conversely, it risks other BB or lower MSCI IVA rated companies being
squeezed from some investors’ consideration (NCM, OSH also BB rated).
Figure 1: Key stock calls with an ESG overlay Ticker Company name Actual
share
price ($)
Target
Price
($)
Rating MSCI
ESG
Rating
View on
MSCI
rating
Market
cap
($mn)
AUT.AX Aurora Oil & Gas 3.43 4.10 OUTPERFORM B Positive 1,615
BXB.AX Brambles Limited 7.80 7.90 OUTPERFORM AAA Neutral 12,762
CRZ.AX carsales.com.au 8.66 8.80 OUTPERFORM B Positive 2,042
FLT.AX Flight Centre 28.27 26.35 OUTPERFORM B Positive 2,832
ILU.AX Iluka Resources 9.70 11.00 OUTPERFORM BBB Positive 4,061
MMS.AX McMillan Shakespeare 13.60 14.85 OUTPERFORM B Positive 1,014
PRU.AX Perseus Mining 1.96 3.20 OUTPERFORM B Positive 895
TAH.AX Tabcorp Holdings 3.04 3.30 OUTPERFORM AAA Neutral 2,231
EGP.AX Echo Entertainment 3.55 3.30 UNDERPERFORM BB Neutral 2,931
TWE.AX Treasury Wine 4.73 3.50 UNDERPERFORM B Neutral 3,061 Source: MSCI IVA ratings, Company data, Credit Suisse estimates
Research Analysts
Sandra McCullagh
61 2 8205 4729

21 January 2013
Australian ESG/SRI 2
Analyst changed views on ESG Target Price impacts
■ ESG embedded into analysts’ Target Prices. At Credit Suisse Australia, we have
developed a methodology for embedding Environment, Social, and Governance (ESG)
issues into how analysts’ view on stocks. This includes assessing an explicit impact on
target prices from ESG issues. This is expressed as a percentage impact off an
unaffected target price. For example, let’s consider a stock that would normally have a
$10 target price, if there were no ESG concerns. If the analysts has a view that ESG
concerns have a 10% downside impact to the target price, this would result in a $9
target price, -10% as the ESG impact is included in the target price.
■ We published our first view of the impact on analysts’ target prices on 2 July 2012 in
our note “$21.4bn in ESG concerns on Australian stocks”, with subsequent notes
on 24 October “ESG changes in stocks calls and analyst views”. The following is
a commentary on recent changes to the percentage impact on individual stock target
prices (refer Figure 2).
Figure 2: Recent analysts changes to ESG impact on target prices Ticker Company name Actual
share
price ($)
Target
Price
($)
Rating ESG TP
impact -
updated
ESG TP
impact -
prior
Change in
ESG TP
impact
ESG TP Impact Comment
APN.AX APN News & Media 0.32 0.23 UNDERPERFORM -3.0% -3.0% Independent Chairman has reduced governance risk, however APN does not
have a majority of independent Directors and major shareholder INM retains
considerable influence over the company.
BSE.AX Base Resources Ltd 0.36 0.80 OUTPERFORM -68.0% -13.0% -55.0% The Kenyan Government has passed a regulation that says every mineral right
shall have a local equity participation amounting to at least 35% but is silent on
whether it applies to existing leases and if there is any compensation. Until we
have more clarity, we value BSE at a sharp 60% discount to our DCF as, in
addition to potential dilution, there is a risk project funding can no longer be
unlocked and the project stalls. This discount is in addition to increasing our
WACC by 2% to adjust for country risk.
FXJ.AX Fairfax Media 0.54 0.40 UNDERPERFORM -3.0% -3.0% Gina Rinehart has been vocal in her opposition to parts of the company’s
strategic direction and the company’s Board composition. Increased influence of
a major shareholder may also pose problems in relation to editorial independence.
KGD.AX Kula Gold 0.34 0.55 OUTPERFORM 0.0% -25.0% 25.0% TP set using a bear case scenario that assumes a heavily discounted capital
raising. As such ESG issues are now largely inherent in our bear case capital
raising scenario, that include, but are not limited to, geopolitcal risk in PNG.
NWS.AX News Corporation 26.33 27.00 NEUTRAL -10.0% -17.2% 7.2% NWS has been faced with significant governance issues; most recently the
phone hacking controversy and the failed takeover of BSkyB. The considerable
influence that Rupert Murdoch and the Murdoch family exert over the company
through its dual class share structure raises the risk of further governance issues
in the future as well as inhibiting the rights of minority shareholders.
PRT.AX Prime Media Group 0.95 0.86 NEUTRAL -3.0% -3.0% While we have seen no indication that Chairman and major shareholder Paul
Ramsay will try to exert undue influence on the compay, the lack of
independence on the Board is a cause for concern.
REA.AX REA Group 19.24 19.76 OUTPERFORM -5.0% -5.0% NWS owns over half the shares in REA and has effective Board control,
resulting in a low free float and reduced liquidity in addition to higher risks to
minority shareholders.
SGN.AX STW Communications Group 1.18 1.24 OUTPERFORM -2.0% -2.0% While WPP to date has not looked to exert undue influence on the company, as
SGN expands internationally it is possible that its interests may conflict with
those of WPP. Additionally, given that the company is increasingly investing in
South East Asia where ESG risks may be more prevalent and harder to
measure, this is something that we will be keeping our eye on.
SWM.AX Seven West Media Ltd 2.03 1.80 OUTPERFORM -5.0% -5.0% The lack of independence on the board and large influence of major shareholder
Kerry Stokes increases the risk to minority shareholders and their interests.
TEN.AX Ten Network Holdings 0.35 0.27 OUTPERFORM -5.0% -5.0% Chairman and substantial shareholder Lachlan Murdoch has previously shown his
willingness to exert his influence over the company by taking over as Interim
CEO prior to the commencement of James Warburton’s employment.
Additionally, less than half of TEN’s Board is independent, lessening the likelihood
of the Board resisting attempts to influence the company by major shareholders.
TME.AX Trade Me Group Ltd 3.21 3.70 NEUTRAL -3.0% -3.0% The board is not fully independent and there is a risk that minority shareholders'
wishes could be ignored by majority shareholder FXJ.
Source: Company data, Credit Suisse estimates
■ Media stocks initiation: Our analysts have assumed coverage of the media sector
stocks. Our key piece, Australian ESG/SRI - ESG in the Media Sector, published
on 27 November 2012, covers the ESG issues for the Media sector in detail. The key
target price impacts for Media centre around Governance concern. The largest

21 January 2013
Australian ESG/SRI 3
downside impact is -10% for NWS, which is based on historic share price impact from
News of the World scandals. All other stocks’ downsides are then considered relative
to NWS, with a 5% target price downsides for SWM, TEN and REA, 3% downside for
APN, FXJ, PRT and TME and 2% downside for SGN.
■ KGD Target Price based off discounted capital raising: We have based our KGD
target price off a Bear Case of a heavily discounted capital raising. Therefore any ESG
concerns are captured as part of the capital raising and is not separated out, removing
the previous 25% downside on the target price for ESG issues associated with PNG.
■ Resource stocks and asbestos liabilities continue to dominate: The stocks with
10% or more Target Price downside impact from ESG issues are dominated by
resources stocks (refer Figure 3). Interestingly, the stocks with the highest negative
target price impacts from ESG all are rather lowly rated by MSCI IVA (range is BBB to
CCC). CSR, at -39% target price impact from ESG concerns, is BB rated; ERA, with -
36% target price impact is BB rated; BTU; with -18% target price impact is B rated;
JHX with -18% target price impact is BB rated; and NSW, at -10% target price impact
is CCC rated.
Figure 3: Stocks with >-10% ESG downside impact Ticker Company name Actual
share
price ($)
Target
Price
($)
Rating MSCI
ESG
Rating
View on
MSCI rating
TP rating
risk %
Mcap
($mn)
ESG
Impact
($mn)
ESG comment
BSE.AX Base Resources Ltd 0.36 0.80 OUTPERFORM -68.0% 199 423- The Kenyan Government has passed a regulation that says every
mineral right shall have a local equity participation amounting to at
least 35% but is silent on whether it applies to existing leases and if
there is any compensation. Until we have more clarity, we value
BSE at a sharp 60% discount to our DCF as, in addition to
potential dilution, there is a risk project funding can no longer be
unlocked and the project stalls. This discount is in addition to
increasing our WACC by 2% to adjust for country risk.
CSR.AX CSR 2.09 1.40 UNDERPERFORM BB Neutral -39.0% 1,058 676- Our CSR val'v captures the impact from its asbestos liability
(reduces our SOTP val'n by $0.72). The 39% reduction in val's is
high on a relative basis given current depressed (trough cycle)
earnings. We ascribe a nominal impact from the carbon tax effective
1 July 2012.
ERA.AX Energy Resources of
Australia
1.34 1.65 NEUTRAL BB Negative -36.0% 694 390- Key risk is that the Ranger underground mine does not proceed due
to environmental concerns - we currently value it at 75% but also
have a high discount rate - 13% in nominal terms.
JHX.AX James Hardie Industries SE 9.58 9.20 NEUTRAL BB Neutral -18.0% 4,440 975- Our JHX val'v is reduced by A$1.42/share (18.0%) due to the
asbestos liability. Our valuation captures a nominal impact from
carbon (>1%) effective 1 July 2012. MSCI ascribes a 33% weighting
to carbon which we believe is overstated.
BTU.AX Bathurst Resources 0.42 0.60 OUTPERFORM B Neutral -18.0% 289 64- We risk Escarpment and Deep Creek at 50% to account for the
Appeals hearing outcome. The hearing will commence 29 Oct 2012.
TIG.AX Tigers Realm Coal 0.16 0.17 NEUTRAL -17.0% 43 9- We risk the Ammam project at 25% and use a WACC of 11% to
account for ESG impacts of operating in Russia and in a difficult
area
SMR.AX Stanmore Coal 0.21 0.20 NEUTRAL -15.0% 44 8- 10% of our project risk weighting on the Range and Mackenzie
reflects approval risks
SPN.AX SP AusNet 1.13 1.07 NEUTRAL BB Neutral -13.2% 3,805 576- We have reduced our Target Price for SPN to account for risks
associated with pending bushfire litigation and a long-term reduction
in Debt Risk Premiums in regulated WACCs
KAR.AX Karoon Gas 5.49 7.65 OUTPERFORM B Positive -11.7% 1,216 161- We apply a 25% risk weighting on a $/boe to KAR's Brazil/Peru
assets to account for country risk.
MDL.AX Mineral Deposits Ltd. 3.58 6.50 OUTPERFORM BBB Positive -11.0% 314 39- We include country specific risk of 2% to reflect concerns on
corruption and instability in Senegal
BND.AX Bandanna Energy Limited 0.32 0.50 OUTPERFORM -10.0% 166 18- Around 55% of the Springsure Creek project area is located on
strategic cropping land. We see 10% downside risk relating to
regulatory hurdles.
CAB.AX Cabcharge Australia 4.61 5.40 NEUTRAL BBB Negative -10.0% 555 62- For CAB, outside of the consumer services ESG risk factors we
include in our base valuation downside to reflect 1) follow on
litigation as a result of the ACCC settlement for anticompetitive NWS.AX News Corporation 26.33 27.00 NEUTRAL CCC Neutral -10.0% 63,586 7,065- NWS has been faced with significant governance issues; most
recently the phone hacking controversy and the failed takeover of
BSkyB. The considerable influence that Rupert Murdoch and the
Murdoch family exert over the company through its dual class share
structure raises the risk of further governance issues in the future as
well as inhibiting the rights of minority shareholders. Source: MSCI IVA, Company data, Credit Suisse estimates

21 January 2013
Australian ESG/SRI 4
MSCI IVA changes and analysts’ outlook
■ Analyst outlook on MSCI IVA ratings: At Credit Suisse Australia, we use the MSCI
IVA rating system as part of analysts’ assessment of ESG issues for individual stocks.
These ratings range from AAA (top rated) to CCC (lowest rating). Our analysts have
overlaid a forward looking view on the MSCI IVA ratings, based on their views of the
stocks and events that may have happened since the MSCI IVA rating was set. This
provides a ‘Positive’, ‘Neutral’ or ‘Negative’ outlook on the MSCI IVA rating.
■ We published our view on the analysts’ outlook for MSCI IVA ratings on 27 September
2012 in our note “ESG overlay on key stock calls” and updated that on 24 October,
“ESG changes in stocks calls and analyst views”. The following are changes to
the MSCI ratings and analysts’ views since the last note was published. Figure 4
shows the MSCI rating changes in the end of December 2012.
Figure 4: MSCI IVA rating changes—October–December 2012
ENV SOC GOVOVERALLENV SOC GOVOVERALL
ANZ.AX Australia and New Zealand Bank 25/10/2012 DOWN 8.10 5.90 6.00 AA 8.50 6.80 8.40 AAA
APA.AX APA Group 10/10/2012 DOWN 4.60 8.50 7.00 A 5.60 7.90 7.00 AA
AWC.AX Alumina Limited 28/12/2012 DOWN 4.40 4.90 5.70 A 4.50 7.30 6.60 AA
BHP.AX BHP Billiton 28/12/2012 DOWN 4.70 4.20 6.50 A 4.90 5.90 8.20 AA
BOQ.AX Bank of Queensland 25/10/2012 DOWN 3.20 3.40 7.40 BB 3.50 5.30 9.80 BBB
BTU.AX Bathurst Resources 28/12/2012 UP 0.50 2.50 5.70 B 1.40 3.40 3.80 CCC
CBA.AX Commonwealth Bank Australia 25/10/2012 DOWN 8.40 5.60 5.50 AA 8.70 6.10 10.00 AAA
CFX.AX CFS Retail Property Trust 10/10/2012 UP 6.90 9.20 7.00 AA 5.20 5.00 7.00 A
COH.AX Cochlear 28/12/2012 DOWN 5.80 4.30 4.40 BB 4.30 5.50 4.90 BBB
CQR.AX Charter Hall Retail REIT 10/10/2012 UP 4.30 5.70 7.00 BB 0.70 5.00 7.00 B
CSL.AX CSL Ltd 10/10/2012 DOWN 3.60 4.20 7.00 BBB 5.00 6.10 7.00 AA
ENV.AX Envestra 10/10/2012 DOWN 1.50 7.80 7.00 BB 3.80 7.30 7.00 BBB
FLT.AX Flight Centre 25/10/2012 DOWN 4.90 7.10 7.00 B 4.80 9.20 7.00 BB
GBG.AX Gindalbie Metals Ltd 28/12/2012 UP 2.60 6.90 7.00 BB 1.60 6.40 7.00 B
GMG.AX Goodman Group 10/10/2012 UP 9.00 3.40 7.00 AA 5.50 5.00 7.00 A
GNC.AX Graincorp 10/12/2012 UP 2.50 4.90 7.00 BB 0.60 5.40 7.00 B
IOF.AX Investa Office Fund 10/10/2012 UP 9.10 4.80 7.00 AAA 6.20 5.00 7.00 AA
IVC.AX Invocare Group 10/12/2012 UP 6.00 5.70 10.00 AAA 9.30 6.40 7.00 A
MGX.AX Mount Gibson Iron 28/12/2012 UP 3.40 5.70 7.00 BB 1.60 5.00 7.00 B
NAB.AX National Australia Bank 25/10/2012 DOWN 9.20 4.40 4.90 A 7.10 6.40 7.00 AA
NVT.AX Navitas Ltd 10/12/2012 UP 3.00 3.80 10.00 BBB 2.90 4.60 7.00 BB
OZL.AX OZ Minerals 28/12/2012 UP 2.70 6.00 4.80 BBB 2.60 3.70 5.20 BB
PNA.AX PanAust 28/12/2012 UP 3.10 5.60 5.70 A 4.10 4.40 4.90 BBB
RIO.AX Rio Tinto 28/12/2012 DOWN 2.50 3.40 5.80 BB 4.10 4.70 5.30 BBB
WBC.AX Westpac 25/10/2012 DOWN 8.80 5.70 5.50 AA 9.10 5.40 10.00 AAA
WDC.AX Westfield 10/10/2012 UP 4.80 8.20 7.00 BBB 2.80 4.40 7.00 BB
WHC.AX Whitehaven Coal 28/12/2012 DOWN 0.90 3.10 5.30 B 1.60 5.60 5.00 BB
WRT.AX Westfield Retail Trust 10/10/2012 UP 5.10 4.10 7.00 BB 2.00 5.00 7.00 B
WSA.AX Western Areas NL 28/12/2012 UP 4.10 4.40 4.30 BBB 2.60 5.30 3.50 BB
Company NameOverall Rating
revision date
Overall
Rating
Change
Current Prior
Source: MSCI IVA rating, Credit Suisse estimates
■ REITS up: CFX (AA), CQR (BB), GMG (AA), IOF (AAA), WDC (BBB) and WRT (BB),
all have managed an upgrade to their MSCI IVA ratings. REITS now dominate the
MSCI IVA AAA rated stocks (CPA, DXS, GPT, IOF, LLC, SGP). CFX has been
upgraded to AA as its portfolio has one of the lowest energy intensities. CQR was
upgraded to BB due to improvements in the waste management practices. GMG was
upgraded to AA, with industry leading certification of green building standards. An

21 January 2013
Australian ESG/SRI 5
improvement in product quality through improved tenant engagement would lift this
company to AAA rating. IOF was upgraded to AAA with one of the highest level of
green certification and improvements in energy efficiency rating. WDC was upgraded
to BBB on significantly improved service quality (e.g. online real-time resolution of
issues). WRT was upgraded to BB on increased green opportunities (from
refurbishments). We retain our Neutral outlook on all these upgraded REITs.
■ Banks down: ANZ (AA), BOQ (BB), CBA (AA), NAB (A) and WBC (AA), all have
suffered MSCI IVA rating downgrades. No Australian banks are rated AAA, post this
downgrade, with ANZ, CBA and WBC the highest rated at AA. ANZ and WBC, while
acknowledged as leaders in ESG, were downgraded due to a class action on fees. We
have a Positive outlook on the AA rating for WBC, as we believe the issue of the class
action of fees is not material. ANZ and NAB also have concerns about the dominance
of residential mortgage lending with concerns on mortgage stress. We now have a
Neutral outlook on ANZ’s MSCI IVA rating, post the downgrade. CBA’s downgrade to
AA also mentioned the litigation around the collapse of Storm Financial, and we retain
our Neutral outlook on this rating. We have a Negative outlook on the A rating for
NAB, as we factor in shareholder class action on CDOs. BOQ was downgraded to a
quite low BB, on concerns of a lack of an environmental financing strategy,
involvement in the litigation around fees and the collapse of Storm Financial. We move
to a Neutral outlook on this rating, down from our Positive view of BOQ’s
environmental credentials, which are overshadowed by litigation issues.
■ Resource companies mixed bag: AWC (A), BHP (A), RIO (BB), WHC (B), all have
suffered downgrades in their MSCI IVA ratings. BTU (B), GBG (BB), MGX (BB), OZL
(BBB), PNA (A) and WSA (BBB), all have managed an upgrade in their MSCI IVA rating.
■ WPL, ORG and PAN are top rated resource companies: Resource companies that
still have an MSCI IVA rating in the A zone include BHP (A), CTX (A), GRY (A), ORG
(AA), PNA (A), PAN (AA), STO (A) and WPL (AA)
■ BHP down to AA on industrial unrest concerns: For BHP, despite industry’s
leading practices for health and safety, concerns around industrial unrest has seen a
downgrade in BHP’s MSCI IVA rating from AA to A. We move to a Neutral outlook
(from Negative) on the MSCI IVA rating.
■ RIO at risk with BB rating: RIO has had its MSCI IVA rating downgraded from BBB
to BB. Despite a top rating for Corporate Governance, RIO’s rating suffers from its
growth in countries with political risks or areas or significant environmental concerns
and community opposition. RIO also scores lowly on labour management compared to
peers, due to layoffs and a view that there is a combative stance at some of its
operations. With many of its peers rated at A (including BHP), a rating of BB risks RIO
being excluded from some investors’ universe. Or conversely, it risks other BB or less
MSCI IVA rated companies being squeezed out from some investors consideration. In
Figure 5, we list all resource and energy companies (by market cap) in our coverage
universe that have a BB or less MSCI IVA rating (including NCM and OSH).
■ Comparison of BHP and RIO: We have also graphed the relative ratings by MSCI
IVA for BHP and RIO (refer Figure 6). Despite its high Governance score relative to
BHP, it lags behind BHP and the sector average especially on labour management,
toxic emissions and waste and biodiversity/land use. RIO still uses riverine tailings
disposal methods compared to BHP which has stated its opposition to controversial
tailings disposal methods (riverine and deep sea).
■ AWC down to A on emissions concerns: AWC’s MSCI IVA rating was downgraded
from AA to A, as it faces rates low compared to peers on its emissions with average
four year emissions cited at six times the average of peers. Its decision to sign an
energy off-take agreement with MGK’s brown coal Loy Yang generator until 2036 for

21 January 2013
Australian ESG/SRI 6
its Portland and Point Henry refineries is cited as a concern in its quest to reduce its
overall emissions. We note that Victoria, where these operas are based, is dominated
by brown coal generation. For AWC, we move to a Neutral outlook (from Negative) on
the MSCI IVA rating, post the downgrade.
Figure 5: Other BB and below MSCI IVA resource and energy stocks
Ticker Company name Actual
share
price ($)
Target
Price
($)
Rating MSCI
ESG
Rating
View on
MSCI
rating
Market
cap
RIO.AX Rio Tinto 66.45 75.00 OUTPERFORM BB Neutral 108,850
NCM.AX Newcrest Mining 23.25 30.00 OUTPERFORM BB Neutral 17,807
OSH.AX Oil Search 7.14 8.00 NEUTRAL BB Neutral 10,017
AUT.AX Aurora Oil & Gas 3.43 4.10 OUTPERFORM B Positive 1,615
AGO.AX Atlas Iron 1.54 RESTRICTED B 1,401
SFR.AX Sandfire Resources NL 8.47 8.00 UNDERPERFORM B Positive 1,300
AQA.AX Aquila Resources 3.15 2.75 NEUTRAL B Positive 1,297
KAR.AX Karoon Gas 5.49 7.65 OUTPERFORM B Positive 1,216
EVN.AX Evolution Mining Limited 1.615 1.85 NEUTRAL B Positive 1,144
IGO.AX Independence Group NL 4.48 5.20 NEUTRAL BB Neutral 1,043
PRU.AX Perseus Mining 1.955 3.20 OUTPERFORM B Positive 895
MGX.AX Mount Gibson Iron 0.82 0.90 OUTPERFORM BB Neutral 894
ERA.AX Energy Resources of Australia 1.34 1.65 NEUTRAL BB Negative 694
MBN.AX Mirabela Nickel 0.55 0.65 NEUTRAL BB Neutral 507
GBG.AX Gindalbie Metals Ltd 0.295 0.37 NEUTRAL BB Neutral 414 Source: MSCI IVA ratings, Company data, Credit Suisse estimates
Figure 6: BHP versus RIO MSCI IVA ratings
0 2 4 6 8 10
Carbon emissions
Biodiversity & land use
Toxic emissions and waste
Labour management
Health & safety
Corruption and instability
Corporate Governance
Average
RIO
BHP
Source: MSCI IVA
■ WHC downgraded on emissions, social and labour concerns: WHC was
downgraded from BB to B, on combined concerns of emissions, social impact of its
mining operations and industrial unrest. Its NSW operations are believed to have
fugitive emissions three times the level of Queensland operations. We retain our
Neutral outlook on WHC’s MSCI IVA rating.
■ Some safety improvements drive Resource upgrades: BTU has been upgraded to B
(from the lowest CCC rating) as it shows commitment to mitigating some of the concerns
of its Buller Coal development in New Zealand. GBG has been upgraded to BB as it
improved its safety record (almost halved its LTIR to 0.66 in 2012). For BTU and GBG,
we move to a Neutral outlook (from Positive) on the MSCI IVA rating. Post the upgrade,

21 January 2013
Australian ESG/SRI 7
MGX was upgraded to BB (from B) on improved environmental systems that are
consistent across its sites. OZL was upgraded to BBB on its improved health and safety
with a substantial drop in LTIR (down to 1.5 in 2011 from 4.38 in 2010), but concerns
remain on a spike in recordable safety incidents (18.24 in 2011 from 12.36 in 2009).
PNA was upgraded to A (from BBB) with improvements in its health and safety as well
as improved processes for toxic waste and emissions (95% water recycling in 2011).
WSA was upgraded to BBB from BB, on improved health and safety (LTIR down to 1.5
from 4.2) and an improved management plan for threatened species and waste.
■ IVC takes a AAA rating: IVC has been upgraded from A to AAA, but we caution there
are only five peers in the comparison set. This could see a fall in the rating if more peers
are added or if any peer shows a marked improvement, given the relativity across peer
group system used by MSCVI IVA. However we retain our AAA rating on IVC.
■ GNC upgraded to BB: Graincorp was recently upgraded to a 'BB' rating from 'B'
following the initiation of programs to improve energy consumption efficiency.
According to MSCI IVA, GNC's rating is being dragged by relatively weak carbon
emission and water stress programmes. However, these are offset by a strong
presence of operations in developed economies reducing its exposure to poor labour
standard risks. We are currently Restricted on GNC.
■ APA, ENV down on environmental concerns: APA has been downgraded to A,
based on lack of evidence of emissions reduction strategies (as costs are passed
through) and below average safety performance (LTIR rate twice the industry
average). ENV has been downgraded to BB (from BBB) due to concerns on a lack of
environmental management and carbon emission reduction plans. We believe
improved disclosure at ENV should lift this rating. In the meantime, we retain our
Neutral outlook for the MSCI IVA ratings for both these stocks.
■ COH, CSL down: COH has been downgraded to BB from BBB with on-going concerns
about the transparency of its payments to doctors. CSL has been downgraded two
notches to BBB (from AA), based on concerns about product quality with a recent Class
1 recall. We believe that CSL can reverse this rating downgrade, but in the meantime,
we retain our Neutral outlook on the MSCI IVA ratings for both these stocks.
■ NVT upgraded to BBB: NVT has been upgraded to BBB (from BB) with a view that it
has relatively strong human capital and customer service processes. Post this
upgrade, we move our outlook to Neutral (from Positive).
■ FLT downgraded to B: FLT has been downgraded to B on concerns that it does not
have energy efficiency and water conservation programs in place. We believe this is
harsh given the type of operation that FLT is, with MSCI IVA comparing FLT’s retail
operations against hotels that have a far greater exposure to energy and water use.
We retain our Positive outlook on the MSCI IVA rating.
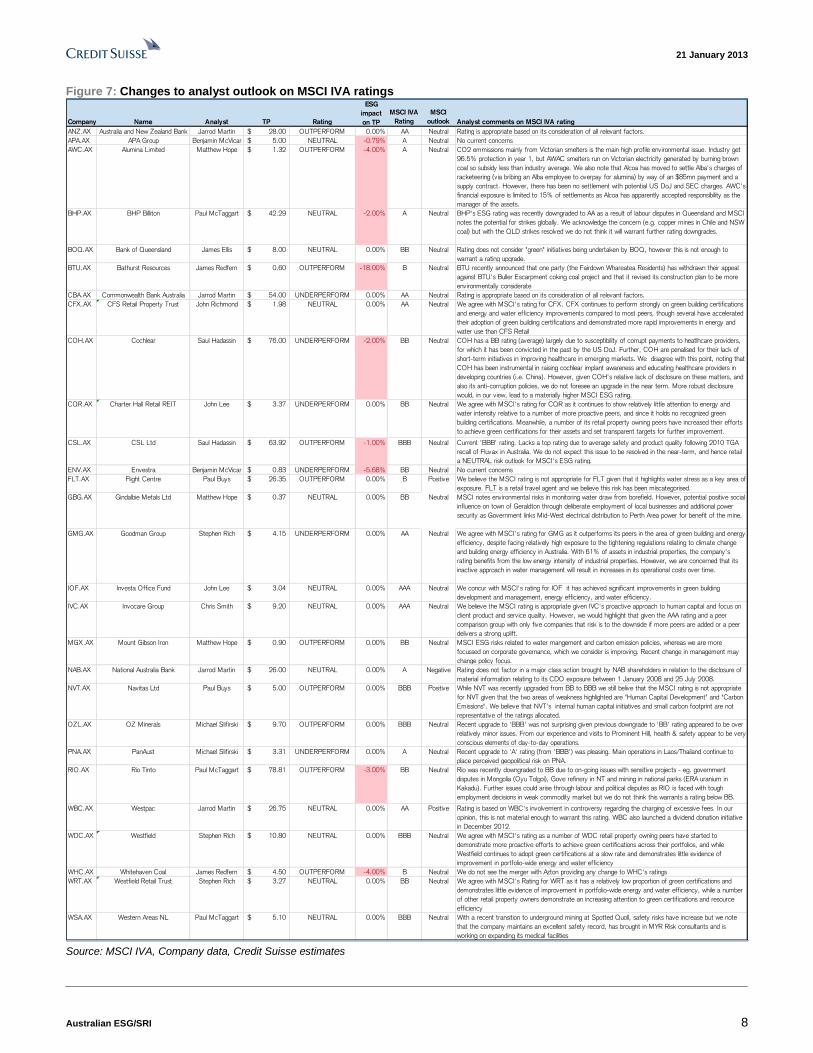
■ Summary of analyst MSCI rating outlook comments: In Figure 7, we detail the
analysts’ comment on the latest MSCI rating for recent MSCI IVA rating changes.
21 January 2013
Australian ESG/SRI 8
Figure 7: Changes to analyst outlook on MSCI IVA ratings
Company Name Analyst TP Rating
ESG
impact
on TP
MSCI IVA
Rating
MSCI
outlook Analyst comments on MSCI IVA rating
ANZ.AX Australia and New Zealand Bank Jarrod Martin 28.00$ OUTPERFORM 0.00% AA Neutral Rating is appropriate based on its consideration of all relevant factors.
APA.AX APA Group Benjamin McVicar 5.00$ NEUTRAL -0.79% A Neutral No current concerns
AWC.AX Alumina Limited Matthew Hope 1.32$ OUTPERFORM -4.00% A Neutral CO2 emmissions mainly from Victorian smelters is the main high profile environmental issue. Industry get
96.5% protection in year 1, but AWAC smelters run on Victorian electricity generated by burning brown
coal so subsidy less than industry average. We also note that Alcoa has moved to settle Alba's charges of
racketeering (via bribing an Alba employee to overpay for alumina) by way of an $85mn payment and a
supply contract. However, there has been no settlement with potential US DoJ and SEC charges. AWC's
financial exposure is limited to 15% of settlements as Alcoa has apparently accepted responsibility as the
manager of the assets.
BHP.AX BHP Billiton Paul McTaggart 42.29$ NEUTRAL -2.00% A Neutral BHP's ESG rating was recently downgraded to AA as a result of labour disputes in Queensland and MSCI
notes the potential for strikes globally. We acknowledge the concern (e.g. copper mines in Chile and NSW
coal) but with the QLD strikes resolved we do not think it will warrant further rating downgrades.
BOQ.AX Bank of Queensland James Ellis 8.00$ NEUTRAL 0.00% BB Neutral Rating does not consider "green" initiatives being undertaken by BOQ, however this is not enough to
warrant a rating upgrade.
BTU.AX Bathurst Resources James Redfern 0.60$ OUTPERFORM -18.00% B Neutral BTU recently announced that one party (the Fairdown Whareatea Residents) has withdrawn their appeal
against BTU's Buller Escarpment coking coal project and that it revised its construction plan to be more
environmentally considerate
CBA.AX Commonwealth Bank Australia Jarrod Martin 54.00$ UNDERPERFORM 0.00% AA Neutral Rating is appropriate based on its consideration of all relevant factors.
CFX.AX CFS Retail Property Trust John Richmond 1.98$ NEUTRAL 0.00% AA Neutral We agree with MSCI's rating for CFX. CFX continues to perform strongly on green building certifications
and energy and water efficiency improvements compared to most peers, though several have accelerated
their adoption of green building certifications and demonstrated more rapid improvements in energy and
water use than CFS Retail
COH.AX Cochlear Saul Hadassin 76.00$ UNDERPERFORM -2.00% BB Neutral COH has a BB rating (average) largely due to susceptibility of corrupt payments to heatlhcare providers,
for which it has been convicted in the past by the US DoJ. Further, COH are penalised for their lack of
short-term initiatives in improving healthcare in emerging markets. We disagree with this point, noting that
COH has been instrumental in raising cochlear implant awareness and educating healthcare providers in
developing countries (i.e. China). However, given COH's relative lack of disclosure on these matters, and
also its anti-corruption policies, we do not foresee an upgrade in the near term. More robust disclosure
would, in our view, lead to a materially higher MSCI ESG rating.
CQR.AX Charter Hall Retail REIT John Lee 3.37$ UNDERPERFORM 0.00% BB Neutral We agree with MSCI's rating for CQR as it continues to show relatively little attention to energy and
water intensity relative to a number of more proactive peers, and since it holds no recognized green
building certifications. Meanwhile, a number of its retail property owning peers have increased their efforts
to achieve green certifications for their assets and set transparent targets for further improvement.
CSL.AX CSL Ltd Saul Hadassin 63.92$ OUTPERFORM -1.00% BBB Neutral Current 'BBB' rating. Lacks a top rating due to average safety and product quality following 2010 TGA
recall of Fluvax in Australia. We do not expect this issue to be resolved in the near-term, and hence retail
a NEUTRAL risk outlook for MSCI's ESG rating.
ENV.AX Envestra Benjamin McVicar 0.83$ UNDERPERFORM -5.68% BB Neutral No current concerns
FLT.AX Flight Centre Paul Buys 26.35$ OUTPERFORM 0.00% B Positive We believe the MSCI rating is not appropriate for FLT given that it highlights water stress as a key area of
exposure. FLT is a retail travel agent and we believe this risk has been miscategorised.
GBG.AX Gindalbie Metals Ltd Matthew Hope 0.37$ NEUTRAL 0.00% BB Neutral MSCI notes environmental risks in monitoring water draw from borefield. However, potential positive social
influence on town of Geraldton through deliberate employment of local businesses and additional power
security as Government links Mid-West electrical distribution to Perth Area power for benefit of the mine.
GMG.AX Goodman Group Stephen Rich 4.15$ UNDERPERFORM 0.00% AA Neutral We agree with MSCI's rating for GMG as it outperforms its peers in the area of green building and energy
efficiency, despite facing relatively high exposure to the tightening regulations relating to climate change
and building energy efficiency in Australia. With 61% of assets in industrial properties, the company's
rating benefits from the low energy intensity of industrial properties. However, we are concerned that its
inactive approach in water management will result in increases in its operational costs over time.
IOF.AX Investa Office Fund John Lee 3.04$ NEUTRAL 0.00% AAA Neutral We concur with MSCI's rating for IOF it has achieved significant improvements in green building
development and management, energy efficiency, and water efficiency.
IVC.AX Invocare Group Chris Smith 9.20$ NEUTRAL 0.00% AAA Neutral We believe the MSCI rating is appropriate given IVC's proactive approach to human capital and focus on
client product and service quality. However, we would highlight that given the AAA rating and a peer
comparison group with only five companies that risk is to the downside if more peers are added or a peer
delivers a strong uplift.
MGX.AX Mount Gibson Iron Matthew Hope 0.90$ OUTPERFORM 0.00% BB Neutral MSCI ESG risks related to water mangement and carbon emission policies, whereas we are more
focussed on corporate governance, which we consider is improving. Recent change in management may
change policy focus.
NAB.AX National Australia Bank Jarrod Martin 26.00$ NEUTRAL 0.00% A Negative Rating does not factor in a major class action brought by NAB shareholders in relation to the disclosure of
material information relating to its CDO exposure between 1 January 2008 and 25 July 2008.
NVT.AX Navitas Ltd Paul Buys 5.00$ OUTPERFORM 0.00% BBB Positive While NVT was recently upgraded from BB to BBB we still belive that the MSCI rating is not appropriate
for NVT given that the two areas of weakness highlighted are "Human Capital Development" and "Carbon
Emissions". We believe that NVT's internal human capital initiatives and small carbon footprint are not
representative of the ratings allocated.
OZL.AX OZ Minerals Michael Slifirski 9.70$ OUTPERFORM 0.00% BBB Neutral Recent upgrade to 'BBB' was not surprising given previous downgrade to 'BB' rating appeared to be over
relatively minor issues. From our experience and visits to Prominent Hill, health & safety appear to be very
conscious elements of day-to-day operations.
PNA.AX PanAust Michael Slifirski 3.31$ UNDERPERFORM 0.00% A Neutral Recent upgrade to 'A' rating (from 'BBB') was pleasing. Main operations in Laos/Thailand continue to
place perceived geopolitical risk on PNA.
RIO.AX Rio Tinto Paul McTaggart 78.81$ OUTPERFORM -3.00% BB Neutral Rio was recently downgraded to BB due to on-going issues with sensitive projects - eg. government
disputes in Mongolia (Oyu Tolgoi), Gove refinery in NT and mining in national parks (ERA uranium in
Kakadu). Further issues could arise through labour and political disputes as RIO is faced with tough
employment decisions in weak commodity market but we do not think this warrants a rating below BB.
WBC.AX Westpac Jarrod Martin 26.75$ NEUTRAL 0.00% AA Positive Rating is based on WBC's involvement in controversy regarding the charging of excessive fees. In our
opinion, this is not material enough to warrant this rating. WBC also launched a dividend donation initiative
in December 2012.
WDC.AX Westfield Stephen Rich 10.80$ NEUTRAL 0.00% BBB Neutral We agree with MSCI's rating as a number of WDC retail property owning peers have started to
demonstrate more proactive efforts to achieve green certifications across their portfolios, and while
Westfield continues to adopt green certifications at a slow rate and demonstrates little evidence of
improvement in portfolio-wide energy and water efficiency
WHC.AX Whitehaven Coal James Redfern 4.50$ OUTPERFORM -4.00% B Neutral We do not see the merger with Azton providing any change to WHC's ratings
WRT.AX Westfield Retail Trust Stephen Rich 3.27$ NEUTRAL 0.00% BB Neutral We agree with MSCI's Rating for WRT as it has a relatively low proportion of green certifications and
demonstrates little evidence of improvement in portfolio-wide energy and water efficiency, while a number
of other retail property owners demonstrate an increasing attention to green certifications and resource
efficiency
WSA.AX Western Areas NL Paul McTaggart 5.10$ NEUTRAL 0.00% BBB Neutral With a recent transition to underground mining at Spotted Quoll, safety risks have increase but we note
that the company maintains an excellent safety record, has brought in MYR Risk consultants and is
working on expanding its medical facilities Source: MSCI IVA, Company data, Credit Suisse estimates

21 January 2013
Australian ESG/SRI 9
Key stock calls with an ESG overlay
Figure 8: ESG overlay on key stock calls Ticker Company name Actual
share
price ($)
Target
Price
($)
Rating MSCI
ESG
Rating
View on
MSCI
rating
Market
cap
($mn) Key call criteria
AUT.AX Aurora Oil & Gas 3.43 4.10 OUTPERFORM B Positive 1,615 Quant call on quality plus Positive MSCI IVA outlook
BXB.AX Brambles Limited 7.80 7.90 OUTPERFORM AAA Neutral 12,762 AAA rated (MSCI IVA) and Strategy sector and Quant call
CRZ.AX carsales.com.au 8.66 8.80 OUTPERFORM B Positive 2,042 Positive MSCI IVA rating outlook plus Analyst key Long call
FLT.AX Flight Centre 28.27 26.35 OUTPERFORM B Positive 2,832 HOLT Best in Class plus positive MSCI IVA outlook
ILU.AX Iluka Resources 9.70 11.00 OUTPERFORM BBB Positive 4,061 Quant call on quality plus Positive MSCI IVA outlook
MMS.AX McMillan Shakespeare 13.60 14.85 OUTPERFORM B Positive 1,014 Analyst Long call /HOLT Best in Class plus positive MSCI IVA outlook
PRU.AX Perseus Mining 1.96 3.20 OUTPERFORM B Positive 895 Quant call on quality plus Positive MSCI IVA outlook
TAH.AX Tabcorp Holdings 3.04 3.30 OUTPERFORM AAA Neutral 2,231 AAA rated (MSCI IVA), Quant and Analyst key Long call
EGP.AX Echo Entertainment 3.55 3.30 UNDERPERFORM BB Neutral 2,931 Low MSCI IVA Rating plus low Quant quality
TWE.AX Treasury Wine 4.73 3.50 UNDERPERFORM B Neutral 3,061 Low MSCI IVA Rating plus Analyst key Short call (paired with TAH) Source: MSCI IVA ratings, Company data, Credit Suisse estimates
■ ESG overlay on key stocks call: At Credit Suisse Australia, we have taken key calls
from our sector analysts, strategy team, quant team and HOLT Best in Class stocks
and overlaid those with our ESG views of AAA rated (MSCI IVA) or analysts’ Positive
outlook on the MSCI IVA rating:
o Our analysts long/short key stock calls: Best ideas from sector analysts.
o Our Quant call on quality stocks (earnings certainty and ROE)
o Our Strategy call on Global Industrials, A-REITS, Utilities and
Infrastructure.
o Our HOLT® Best in Class (refer to appendix for a further details).
■ Key calls: In Figure 8, we have listed our key stocks calls. Our key long calls are
BXB (strategy), CRZ, MMS (also HOLT), TAH, (sector analysts), AUT, ILU, PRU
(quant) and FLT, HGG (HOLT Best in Class). Our key short calls are TWE (sector
analyst) and EGP (Quant). The 12-month underperformance is impacted by significant
underperformance of UILU and PRU. Equally, three year outperformance has been
positively impacted by stellar performance by AUT, ILU, and MMS over that period.
Figure 9: Performance of key ESG stock calls Ticker Company name Actual
share
price ($)
Target
Price
($)
Rating MSCI
ESG
Rating
View on
MSCI
rating
Market
cap
($mn)
1 month total
return
6 months total
return
12 months
total return
3 year
performance
AUT.AX Aurora Oil & Gas 3.43 4.10 OUTPERFORM B Positive 1,615 -5.2% 2.1% 5.2% 971.9%
BXB.AX Brambles Limited 7.80 7.90 OUTPERFORM AAA Neutral 12,762 4.3% 28.5% 10.5% 28.1%
CRZ.AX carsales.com.au 8.66 8.80 OUTPERFORM B Positive 2,042 18.3% 46.0% 82.9% 90.0%
FLT.AX Flight Centre 28.27 26.35 OUTPERFORM B Positive 2,832 7.9% 40.9% 55.9% 60.3%
ILU.AX Iluka Resources 9.70 11.00 OUTPERFORM BBB Positive 4,061 10.2% 16.4% -42.2% 221.8%
MMS.AX McMillan Shakespeare 13.60 14.85 OUTPERFORM B Positive 1,014 0.4% 21.3% 61.4% 280.6%
PRU.AX Perseus Mining 1.96 3.20 OUTPERFORM B Positive 895 -7.3% -10.3% -32.6% 9.2%
TAH.AX Tabcorp Holdings 3.04 3.30 OUTPERFORM AAA Neutral 2,231 1.3% 0.3% 13.9% 13.9%
EGP.AX Echo Entertainment 3.55 3.30 UNDERPERFORM BB Neutral 2,931 3.8% -14.3% 4.9% N/A
TWE.AX Treasury Wine 4.73 3.50 UNDERPERFORM B Neutral 3,061 1.1% 8.4% 35.4% N/A
Market cap weighted average 19,067 4.4% 16.0% 5.1% 82.8%
All ords 3.6% 15.7% 11.6% 0.6% Source: MSCI IVA, Company data, Credit Suisse estimates
■ ESG stock call outperformance of short term: Overall the current key stock calls
with an ESG overlay have outperformed over a one and six month time-frame (refer
Figure 9).
■ Key call of BXB—fits our Global Industrials Strategy call and Quant Quality call:
For BXB, our Strategy team has a preference for Global Industrials over Domestic
Cyclicals and prefers BXB. BXB is AAA rated (MSCI IVA) with an analyst

21 January 2013
Australian ESG/SRI 10
OUTPERFORM call. We continue to believe Brambles is the highest quality name in
the Australian Transport universe. While the business is considered by some to be
expensive, trading at a 30% premium to market on a P/E basis, we believe the growth
prospects and operating characteristics continue to justify such a multiple. The
business is highly leveraged to an FMCG volume and pricing recovery in Western
markets, particularly the US where we are starting to see tentative signs of pricing
increases. In addition, the business continues to expand in emerging markets like
China and EMEA, where we see the growth accelerating. Finally, the business
continues to earn very high margins and returns on capital, helped by reasonably high
barriers to entry and longstanding relationships with customers. With respect to its
ESG credentials, BXB continues to improve its sourcing of sustainable lumbar for its
CHEP business, with 94% of lumber coming from certified sources (up from 91%),
with a target of 100% certified sourcing (independently verified) by 2015. Its CHEP
business is also working on a carbon neutral pallet for customers.
■ TAH is an analyst Long call with an AAA MSCI IVA rating: TAH has the top AAA
MSCI IVA rating. Our analyst has selected it as a key ‘Long’ call based on a
preference for the less risky domestic wagering businesses, with TAH representing
better value than TTS. Wagering revenue growth reached 7% in the June quarter and
variable contribution margin increased sequentially to 36.4% from 36.1%. Customer
growth and market share were solid in FY12. Strong growth in fixed odds, sports bets
and on-line bets which attract lower taxes and fees continue to lift margins. These
trends are likely to continue for a few years. The Victorian license refund claim has
been lodged. The payment could be as high as A$686mn before a partial tax
assessment. This is not in our valuation.
■ CRZ favoured in media: CRZ is well positioned in the digital media space. It is the
dominant player in online auto classifieds. Relative to real estate and employment, car
sales are less volatile, the auto display ad market is larger and there is greater volume
upside from new cars. While its MSCI rating is a low B rating, we see upside on
improved disclosure and therefore have a Positive analyst outlook on the MSCI rating.
■ MMS added to key analyst call and HOLT Best in Class: MMS is a key call from
our Small Cap analysts, as well as screening as a HOLT Best in Class stock. Our
analysts like the high growth profile with an attractive set of earnings drivers and
relatively low correlation to broader economic conditions. We believe these attributes
provide ample support for the stock’s valuation metrics. While MMS scores a low B
rating under the MSCI IVA ratings, our analysts have a Positive outlook on this rating.
The view is that the low Labour Management score of 0.6 does not reflect MMS’
proactive approach to human capital and rigorous internal/external audit and focus on
risk management.
■ FLT screens for HOLT Best in Class: FLT has an OUTPERFORM rating by our
analyst and a Positive outlook on the MSCI IVA B rating. Our analyst considers FLT,
which is a retail travel agent with shop-front operations that have low energy/water
requirements, is being harshly judged on water and energy strategies in a peer group
of large tourist operations. FLT is in a small group of mid-small caps stocks that
have provided FY13 guidance and offers relative earnings certainty. While
domestic leisure travel growth is likely to slow somewhat from previous periods,
FLT stands to benefit from continued growth in the corporate market (40% of Total
Transactional value) through market share gains and strong performance in its US
and UK businesses which are gaining scale. On this basis and considering FLT’s
strong net cash balance sheet, we believe valuation remains attractive.
■ Favour AUT, ILU and PRU for our Quant theme of quality: AUT, ILU and PRU are
stocks we highlight based on our Quant preference for quality stocks (earnings
certainty and ROE). These stocks have a Positive analyst outlook on the MSCI IVA
rating and an Outperform analyst call.

21 January 2013
Australian ESG/SRI 11
o AUT growth in FY13 of ~160%: As AUT ramps up production from its Eagle
Ford shale operations, its EPS growth is expected to be 80-160% over the
coming 12-24 months. We have a Positive view on AUT’s MSCI IVA rating of
B, as improved disclosure on environmental issues should lift the rating.
o ILU growth in FY13 volumes: We see ILU as undervalued, based on
our forecast mineral sands prices, which are lower than spot. Sales
volumes were low in 2012, but should increase in FY13. Operations
remain cash positive and high margin. Despite our recent commodity
price downgrades, ILU remains profitable because every tonne sold has
+60% EBITDA margin, but sales volumes in 2012 have been low and
erratic. We believe destocking of zircon is complete, and sales will
increase. Sales of titanium dioxide feedstock should also increase,
although pricing will contract to compete for market share.
o PRU growth in FY13: PRU is our favoured pick among junior gold
exposures. It is leveraged to gold price, Tengrela approval and primarily
Edikan ramp-up to 8Mtpa. If Edikan reaches the guided to 8Mtpa by mid-
2013, the current share price is supported by Edikan NPV alone. Edikan
mine review is a key datapoint in de-risking production and earnings profile.
■ TWE—short call and a low MSCI IVA rating: Our Analyst has a key ‘Short’ call on
TWE (paired with a Long call on TAH) combined with a weak B ESG rating under the
MSCI IVA system. We continue to regard the stock as expensive relative to the
market, intrinsic value, and its peers. 2H12 overheads were much lower than modelled
and we question if such a low level of costs can be maintained in North America and
Asia. TWE is trading on around 22x and 17x FY13E and FY14E P/E, respectively. For
FY13, management expects constant currency EBIT to grow less than the historical
two-year CAGR (16%) due to rising IT costs, rising grape costs and distributor de-
stocking. For FY14E, management expects above trend growth. Optimistically, we
assume that the 20% increase in inventory value is a 20% increase in inventory
volume despite rising grape prices. Assume all high end wine can be sold and this
drives a 100 bp improvement in gross margin.
EGP—low MSCI IVA rating and low Quant screening on quality: Our analyst
has an UNDERPERFORM rating on EGP. The value of EGP’s Sydney asset,
Star, is a function of its monopolistic license position in NSW. If Crown is
successful in securing a second casino license for Barangaroo, it will emerge as a
competitor to Star post the end of its NSW license exclusivity in 2019. EGP will
end up sharing the Sydney VIP market with Crown, This could imply downside
risks to our current longer term VIP forecasts for Star. There may be no value left
in EGP’s Queensland casino portfolio. It appears EGP may spend about $1.25bn
in capex (double the original Project Icon) to refurbish its QLD casinos. Funding
remain a concern. EGP will either need to raise equity or seek a partner to
execute this project: FY14–FY18 development horizon. We value EGP at our core
DCF-based target price of A$3.30, equating to about 7.9x FY14 EV/EBITDA.
CWN’s domestic casinos are trading on 8.7x FY14 EV/EBITDA. With the
uncertainty around QLD and CWN’s inside running on a new Sydney casino
licence, the takeover premium built into EGP has deflated.
21 January 2013
Australian ESG/SRI 12
Appendix Links to recent ESG research:
■ Australian ESG/SRI - ESG in the Media Sector: Our views on ESG issues in the
Media sector in Australia – 27 November
■ ESG changes in stocks calls and analyst views: An update on key ESG stock
calls, MSCI IVA rating changes and ESG Target Price impact changes – 24 October
2012.
■ “ESG overlay on key stock calls”: Our view on the analysts’ outlook for MSCI IVA
ratings on 27 September 2012..
■ “$21.4bn in ESG concerns on Australian stocks”: Our first view of the impact on
analysts’ Target Prices - 2 July 2012.

21 January 2013
Australian ESG/SRI 13
MSCI IVA ratings
■ MSCI IVA identifies and analyses key ESG issues by looking at the risks inherent in
each sector. Through an in-depth comparison against sector peers, MSCI generates
‘best-in-class’ company risk ratings and reveals ESG-driven investment risks or
opportunities that may not be captured by conventional analysis. To get a full picture
of corporate ESG practices, MSCI researches a wide and extensive range of ESG
data points, and then applies a three-phased analysis methodology. The first step is to
identify the key issues for each industry. Step 2 is to evaluate the stock’s risk exposure
and risk management. Lastly, they rate each company against its global sector peers.
■ Figure 10 shows the breakdown into 31 separate features, all of which aggregate to
give an overall score, on an ‘AAA’ to ‘CCC’ scale relative to the performance of
industry peers. It should be noted that MSCI sector-adjust their ratings by applying a
weighting on certain factors for some sectors they deem them relevant to and others
they do not. For example, Carbon Emissions may make up an important part of the
environmental characteristics for an energy company but would be almost entirely
irrelevant when looked at from a telecom company’s standpoint. In this way, all
constituents may be compared relatively against each other, in a sector-neutral
manner.
Figure 10: ESG factors—relevance by sector
Enviro
nm
enta
l key
issu
es
Car
bon E
mis
sions
Upsr
eam
Car
bon E
mis
sions
Energ
y E
ffic
iency
Insu
ring C
limat
e C
han
ge R
isk
Wat
er
Str
ess
Bio
divers
ity a
nd L
and U
se
Raw
Mat
eria
l Sourc
ing
Fin
anci
al E
nviro
nm
enta
l Im
pac
ts
Toxi
c R
ele
ases
Pac
kagin
g M
ateria
ls &
Was
te
E-W
aste
Opport
uniti
es
in E
nv.
Tech
nolo
gie
s
Opport
uniti
es
in G
reen B
uild
ing
Opport
uniti
es
in R
enew
able
Energ
y
Soci
al k
ey
issu
es
Lab
or
- O
pera
tional
Heal
th &
Saf
ety
Lab
or
- S
upply
Chai
n
Raw
Mat
eria
l Sourc
ing -
Soci
al
Pro
duct
and S
erv
ices
Qual
ity
Pro
duct
Saf
ety
- C
hem
ical
s
Pro
duct
Saf
ety
- F
inan
cial
Priv
acy
& D
ata
Secu
rity
Resp
onsi
ble
Inve
stin
g
Insu
ring H
eal
th a
nd D
em
ogra
phic
Ris
k
Opport
uniti
es
in N
utr
ition a
nd H
eal
th
Acc
ess
to C
om
munic
atio
ns
Acc
ess
to F
inan
ce
Acc
ess
to H
eal
thca
re
Gove
rnan
ce-r
ela
ted k
ey
issu
es
Corr
uptio
n a
nd Inst
abilit
y
Fin
anci
al S
yste
m Inst
abilit
y
Corp
ora
te G
ove
rnan
ce
Energy X X X X X X X X
Materials X X X X X X X X X X X X X
Industrials X X X X X X X X X
Consumer X X X X X X X X X X X X X X X X X X X
Health Care X X X X X X
Financials X X X X X X X X X X X X X X X
Technology X X X X X X X X X X X X
Telecoms X X X X X
Utilities X X X X X Source: MSCI ESG Research

21 January 2013
Australian ESG/SRI 14
Explanation of HOLT® methodology
■ HOLT CFROI: HOLT is an advanced corporate performance, valuation and strategic
analysis framework for the benefit of Credit Suisse and its clients. Corporate
performance is calculated in terms of our CFROI® metric. This provides a unique
perspective on valuation issues that result from strategic decisions driven by corporate
management. We believe the HOLT methodology helps identify valuation insights
about a company quickly and easily, saving time and wasted effort, in our view.
■ HOLT’s default model initially uses consensus estimates to drive CFROI
forecasts, before proprietary algorithms determine the “rate of fade” towards the long
run average (the rate of this fade is a function of the level and volatility of returns and
the rate of growth).
■ Simply stated, we take accounting information, convert it to cash, and then
value that cash. This brings valuation back to basics at a time when differing / revised
accounting practices are moving further away from commercial realities. From our
perspective, a company’s ability to deliver strong, sustainable and preferably
increasing free cash flows is what matters. It is sustainable free cash that ultimately
should drive the share price, longer term. Our approach takes away all the accounting
anomalies and those so-called (and seemingly consistent) one-offs where
accountability is not taken by many.
■ HOLT stock rankings: To do so, we leverage Credit Suisse’s proprietary cash flow return
on investment (CFROI) valuation framework HOLT. We establish a ranking system to
select stocks according to factors of the value creation of its operations, its forecast and
price momentum and its overall valuation according to the HOLT framework.
■ Best in class stocks: The HOLT scorecard is used across wide range of other areas
of our research. However, here we use it to focus in on the more highly rated stocks in
the IVA framework to see if we can enhance performance with an overlay of the
scorecard. We have focused on all stocks rated A and above in MSCI World to ensure
we have a sufficiently broad universe to then select stocks that are ranked in the top
two quintiles across the universe in each of the three factors—operations, momentum
and valuation. These represent the stocks we term “Best in class”.

21 January 2013
Australian ESG/SRI 15
Figure 11: Current HOLT Australian Best in Class/Worse in Class stocks
ID Company Score Operations Momentum Valuation
HOLTfolio
Theme
BEST IN CLASS
BPT BEACH ENERGY LIMITED 4.00 3.60 3.87 4.54 Best in Class
FLT FLIGHT CENTRE LIMITED 4.18 4.39 4.09 4.05 Best in Class
FMG FORTESCUE METALS GROUP LIMITED 3.88 4.44 3.66 3.54 Best in Class
MMS MCMILLAN SHAKESPEARE LTD 4.28 4.85 4.18 3.82 Best in Class
MND MONADELPHOUS GROUP LIMITED 4.34 4.98 4.14 3.89 Best in Class
RMD RESMED INC 4.04 3.72 4.66 3.75 Best in Class
RSG RESOLUTE MINING LIMITED 4.24 4.71 3.44 4.57 Best in Class
SUN SUNCORP GROUP LIMITED 3.78 3.54 4.08 3.73 Best in Class
SUL SUPER RETAIL GROUP LIMITED 3.74 3.52 4.40 3.32 Best in Class
WORST IN CLASS
AWC ALUMINA LIMITED 1.97 1.61 2.56 1.76 Worst in Class
AHD AMALGAMATED HOLDINGS LIMITED 2.10 1.44 2.62 2.24 Worst in Class
AQA AQUILA RESOURCES LIMITED 1.58 1.00 2.39 1.36 Worst in Class
BLD BORAL LIMITED 2.21 1.64 2.67 2.31 Worst in Class
KAR KAROON GAS AUSTRALIA LIMITED 1.47 1.42 1.77 1.22 Worst in Class
LYC LYNAS CORPORATION LIMITED 1.16 1.03 1.03 1.42 Worst in Class
MSB MESOBLAST LTD 1.56 1.07 2.12 1.51 Worst in Class
QAN QANTAS AIRWAYS LIMITED 1.90 1.38 2.39 1.92 Worst in Class
QBE QBE INSURANCE GROUP LIMITED 1.93 1.48 1.65 2.66 Worst in Class
SDL SUNDANCE RESOURCES LIMITED 1.57 1.00 2.59 1.12 Worst in Class
WHC WHITEHAVEN COAL LIMITED 1.60 1.07 1.28 2.46 Worst in Class Source: Company data, Credit Suisse estimates
■ HOLT contacts: For further information on this report or for other HOLT related
matters, please contact:
Scott Chessum
+613 9280 1662
Peter Jabour
+613 9280 1702

21 January 2013
Australian ESG/SRI 16
■ ESG views embedded in our research: We include our analyst’s view on the impact
of ESG issues on their target price, plus an outlook on the MSCI IVA rating for their
stocks (refer example in Figure 12).
Figure 12: Example of ESG disclosure in Financial Summary for Industrial companies
AGL Energy (AGK) Year ending 30 Jun In AUDmn, unless otherwise stated2011 2012 2013 2014 2015 2011 2012 2013 2014 2015
Share Price: A$15.63 Earnings 06/11A 06/12A 06/13E 06/14E 06/15ERating NEUTRAL c_EPS_SHARESEquiv. FPO (period avg.) mn 456.9 482.3 549.0 555.9 563.3
Target Price A$ 16.10 c_EPS*100EPS (Normalised) c 94.4 99.9 112.5 126.5 141.4
vs Share price % 3.01 EPS_GROWTH*100EPS Growth % 5.9 12.6 12.4 11.8
c_EBITDA_MARGIN*100EBITDA Margin % 11.4 12.1 14.3 14.6 15.1
c_DPS*100DPS c 60.0 61.0 64.0 64.0 65.6
c_PAYOUT*100Payout % 63.6 61.0 56.9 50.6 46.4
FRANKING*100Franking % 51.7 100.0 100.0 100.0 100.0
c_FCF_PS*100Free CFPS c 105.1 76.0 131.9 163.3 166.0
Profit & Loss 06/11A 06/12A 06/13E 06/14E 06/15E c_TAX_RATE*100Effective tax rate % 30.4 29.0 29.0 29.0 29.0
Sales revenue 7,072.5 7,455.6 10,025.2 10,808.8 11,401.8 Valuation
EBITDA 804.5 904.3 1,436.0 1,575.4 1,723.2 c_PE P/E x 16.6 15.6 13.9 12.4 11.1
Depr. & Amort. (148.0) (173.9) (328.6) (361.9) (385.8) c_EBIT_MULTIPLE_CURREV/EBIT x 13.7 15.2 9.8 8.6 7.4
EBIT 656.5 730.4 1,107.5 1,213.5 1,337.4 c_EBITDA_MULTIPLE_CUEV/EBITDA x 11.2 12.3 7.6 6.6 5.8
Associates 0.0 0.0 0.0 0.0 0.0 c_DIV_YIELD*100Dividend Yield % 3.8 3.9 4.1 4.1 4.2
Net interest Exp. (37.4) (51.2) (236.9) (223.0) (215.0) c_FCF_YIELD*100FCF Yield % 6.7 4.9 8.4 10.4 10.6
Other 0.0 0.0 0.0 0.0 0.0 c_PB Price to Book x 1.1 1.2 1.1 1.1 1.0
Profit before tax 619.1 679.2 870.6 990.6 1,122.3 ReturnsIncome tax (188.0) (197.2) (252.8) (287.6) (325.9) c_ROE*100Return on Equity % 6.8 6.8 8.2 8.8 9.3
Profit after tax 431.1 482.0 617.8 703.0 796.5 c_I_NPAT/c_I_SALES*100Profit Margin % 6.1 6.5 6.2 6.5 7.0
Minorities 0.0 0.0 0.0 0.0 0.0 c_I_SALES/c_B_TOT_ASSAsset Turnover x 0.7 0.5 0.7 0.8 0.8
Preferred dividends 0.0 0.0 0.0 0.0 0.0 c_ASSETS/c_EQ_COMMONEquity Multiplier x 1.5 2.1 1.8 1.8 1.7
Associates & Other 0.0 0.0 0.0 0.0 0.0 c_ROA*100Return on Assets % 4.4 3.3 4.5 4.9 5.4
Normalised NPAT 431.1 482.0 617.8 703.0 796.5 c_ROIC*100Return on Invested Cap. % 6.8 5.4 8.0 8.7 9.6
Unusual item after tax 127.6 (367.1) 0.0 0.0 0.0 Gearing
Reported NPAT 558.7 114.9 617.8 703.0 796.5 c_GEARING*100Net Debt to Net debt + Equity % 6.2 25.9 23.1 18.7 13.6
c_NET_DEBT/c_I_EBITDANet Debt to EBITDA x 0.5 2.8 1.6 1.2 0.8
Balance Sheet 06/11A 06/12A 06/13E 06/14E 06/15E c_I_EBITDA/ c_I_NET_INTERESTInt Cover (EBITDA/Net Int.) x 21.5 17.7 6.1 7.1 8.0
Cash & equivalents 753.1 1,812.9 546.8 969.1 1,462.7 c_I_EBIT/ c_I_NET_INTERESTInt Cover (EBIT/Net Int.) x 17.6 14.3 4.7 5.4 6.2
Inventories 127.4 185.4 192.3 207.3 218.7 (c_C_CAPEX/c_I_SALES)*-100Capex to Sales % 8.0 10.2 4.6 4.2 3.7
Receivables 1,272.1 1,531.4 1,510.6 1,628.7 1,718.1 (c_C_CAPEX/c_I_DEPR)*-100Capex to Depreciation % 380.9 437.3 141.0 125.3 109.3
Other current assets 577.8 602.2 602.2 602.2 602.2
Current assets 2,730.4 4,131.9 2,851.9 3,407.3 4,001.6 MSCI IVA (ESG) Rating A
Property, plant & equip. 3,400.9 6,323.5 6,465.8 6,563.9 6,594.8 TP ESG Risk (%): -7.62
Intangibles 3,137.2 3,172.0 3,172.0 3,172.0 3,172.0
Other non-current assets 427.2 1,111.0 1,111.0 1,111.0 1,111.0
Non-current assets 6,965.3 10,606.5 10,748.8 10,846.9 10,877.8
Total assets 9,695.7 14,738.4 13,600.7 14,254.2 14,879.4
Payables 853.1 1,158.4 1,001.0 1,083.5 1,136.6
Interest bearing debt 1,171.2 4,312.0 2,812.0 2,812.0 2,812.0
Other liabilities 1,329.9 2,135.1 2,238.8 2,347.9 2,367.6 MSCI IVA Risk: Neutral
Total liabilities 3,354.2 7,605.5 6,051.8 6,243.4 6,316.2
Net assets 6,341.5 7,132.9 7,548.9 8,010.8 8,563.3
Ordinary equity 6,341.5 7,132.9 7,548.9 8,010.8 8,563.3
Minority interests 0.0 0.0 0.0 0.0 0.0
Preferred capital 0.0 0.0 0.0 0.0 0.0
Total shareholder funds 6,341.5 7,132.9 7,548.9 8,010.8 8,563.3
Net debt 418.1 2,499.1 2,265.2 1,842.9 1,349.3 Source: MSCI IVA Rating
Cashflow 06/11A 06/12A 06/13E 06/14E 06/15E Share Price Performance
EBIT 656.5 730.4 1,107.5 1,213.5 1,337.4
Net interest -39.3 -98.0 -242.5 -228.1 -219.6
Depr & Amort 148.0 173.9 328.6 361.9 385.8
Tax paid -0.7 -180.8 -149.1 -178.5 -306.1
Working capital -219.5 -185.7 -143.5 -50.6 -47.6
Other 24.3 26.7 0.0 0.0 0.0
Operating cashflow 569.3 466.5 900.9 1,118.2 1,149.7
Capex -563.7 -760.4 -463.2 -453.5 -421.5
Capex - expansionary -474.4 -660.5 -286.5 -243.1 -206.6
Capex - maintenance -89.3 -99.9 -176.7 -210.4 -214.9
Acquisitions & Invest -5.0 143.2 0.0 0.0 0.0
Asset sale proceeds 163.9 217.5 0.0 0.0 0.0
Other -14.5 -131.6 -2.0 -1.4 9.4
Investing cashflow -419.3 -531.3 -465.2 -454.9 -412.1
Dividends paid -206.5 -185.8 -294.2 -351.4 -355.8
Equity raised -6.1 879.4 92.4 110.3 111.7
Net borrowings 335.3 431.0 -1,500.0 0.0 0.0
Other 0.0 0.0 0.0 0.0 0.0 1 Month 3 Month 12 Month
Financing cashflow 122.7 1,124.6 -1,701.8 -241.0 -244.1 Absolute 2.0% 6.3% 10.6%
Total cashflow 272.7 1,059.8 -1,266.1 422.3 493.6 Relative -1.3% 1.2% -2.1%
Adjustments 0.0 0.0 0.0 0.0 0.0
Net change in cash 272.7 1,059.8 -1,266.1 422.3 493.6 Source: Reuters 52 week trading range: 13.15-15.98
MSCI IVA Risk Comment: Post the acquisition of the Loy Yang
brown coal generator, AGK’s MSCI IVA rating has been
downgraded to A. We move out Outlook to neutral from
Negative, as a result.
21/01/2013 17:48
AGL Energy is an Australia-based integrated energy retailer. AGL is an integrated
renewable energy company and is a private owner, operator and developer of renewable
generation assets.
Credit Suisse View
TP Risk Comment: We have excluded the NSW coal seam
gas assets from out Target Price due to ESG concerns on
development. Our TP is also impacted (-90cps) by our ESG
concerns around retail energy prices
12.49
12.99
13.49
13.99
14.49
14.99
15.49
15.99
16.49
16.99
10/01/2012 10/03/2012 10/05/2012 10/07/2012 10/09/2012 10/11/2012 10/01/2013
AGK.AX XJO
4.1
4.6
5.1
5.6
6.1
6.6
7.1
7.6
8.1
8.6
Environment Social Governance
Stock Local Sector
Country Global Sector
Source: Company data, Credit Suisse estimates

21 January 2013
Australian ESG/SRI 17
Common ESG concerns by sector
■ In Figure 13, we have summarised some of our key ESG concerns for each sector in
the Australian equities space. For example, the Finance sector is dominated by Social
issues, whereas the resources sector has issues right across the ESG spectrum.
Figure 13: ESG issues by Sector Sector Subsector Issues
Financials Banks Social: regulatory changes arising from social pressures,
Social: pressure to pass on full reserve Bank rates cut to home borrowers
Diversified Financials Social: key man risk for fund managers
Social: regulatory changes to monopoly/dominant market positions
Social: large scale redundancies
Insurance Social: regulatory changes for capital requirements
Resources Coal Environmental: ability to develop new resources
Energy Social: landowner compensation for coal seam gas
Governance: country specific risk
Diversified resources Social: labour disputes
Governance: country specific risk
Other metals Environmental: ability to develop new resources
Governance: country specific risks
Steel Environmental: impact of carbon tax
Social: layoff of staff and viability of domestic production
Industrials Building materials Social: asbestos liability
Chemicals, paper, packaging Environmental: carbon tax impact
Construction Social: OH&S
Governance: bribery and reputation damage
Food and beverage Environmental: emissions and water usage
Gaming Social: potential responsible gaming legislation and employee initiatives
Healthcare Governance: disclosure and family domination
Media Governance: family domination
Retail Social: labour supply chain concerns
Social: gaming and liquor asset concerns
Telcos Social: privacy of data, upside from improving regulation (NBN)
Transport & infrastructure Environment: fuel efficient of fleet
Social: labour productivity
Utilities Environment: ability to develop coal seam gas in NSW
Social: rising electricity prices; landowner compensation for coal seam gas
REITS Environment: upside potential from strong environmental sustainability
Small caps Building Products Environment: carbon impact
Social: labour rights and OH&S
Governance: anti-bribery
Consumer Retail Environment: waste
Social: labour rights and OH&S
Governance: supply chain labour issues
Consumer Services Social: privacy and data security; labour rights and OH&S
Corporate Services Environment: regulation
Social: labour rights and OH&S
Governance: anti-bribery and corruption
IT Services Social: privacy and data security; labour rights and OH&S
Mining services Environment: policy and management systems
Social: labour rights and OH&S
Governance: anti-bribery
Travel Environment: carbon offsetting
Social: privacy and data security
Governance: contracts and anti-competitive regulations
Source: Company data, Credit Suisse estimates

21 January 2013
Australian ESG/SRI 18
Disclosure
Figure 14: Stock list as at 21 January 2013
Ticker Company name
Actual
share
price
Target
Price ($) Rating
TP
rating
risk %
MSCI IVA
rating
Analyst
outlook
on rating
Date of
MSCI IVA
rating Analyst Email contact Phone
ABC.AX Adelaide Brighton 3.29 3.30 NEUTRAL -3.5% CCC Positive 25/05/2012 Andrew Peros [email protected] 61 2 8205 4013
AGK.AX AGL Energy 15.63 16.10 NEUTRAL -7.6% A Neutral 10/07/2012 Benjamin McVicar [email protected] 61 2 8205 4577
AGO.AX Atlas Iron 1.54 RESTRICTED 0.0% B Negative 28/12/2012 Matthew Hope [email protected] 61 2 8205 4669
AIO.AX Asciano Group 4.77 5.95 OUTPERFORM -3.1% BBB Positive 1/03/2012 Nicholas [email protected] 2 8205 4400
ALL.AX Aristocrat Leisure 3.41 3.50 OUTPERFORM 0.0% A Neutral 1/02/2012 Larry Gandler [email protected] 61 3 9280 1855
ALQ.AX ALS Limited 10.95 8.80 UNDERPERFORM 0.0% A Neutral 14/08/2012 Bradley Clibborn [email protected] 61 2 8205 4465
ALZ.AX Australand 3.39 3.35 NEUTRAL 0.0% BBB Neutral 10/10/2012 John Richmond [email protected] 61 2 82054580
AMC.AX Amcor 8.46 7.70 UNDERPERFORM -3.0% A Neutral 10/09/2012 Larry Gandler [email protected] 61 3 9280 1855
AMP.AX AMP 5.21 4.65 NEUTRAL 0.0% A Neutral 11/04/2012 Andrew Adams [email protected] 61 2 8205 4106
AMX.AX Ampella Mining Limited 0.39 1.50 OUTPERFORM 0.0% Michael Slifirski [email protected] 61 3 9280 1845
ANZ.AX Australia and New Zealand Bank25.69 28.00 OUTPERFORM 0.0% AA Neutral 25/10/2012 Jarrod Martin [email protected] 61 2 8205 4334
AOH.AX Altona Mining Limited 0.25 0.46 OUTPERFORM 0.0% Michael Slifirski [email protected] 61 3 9280 1845
APA.AX APA Group 5.70 5.00 NEUTRAL -0.8% A Neutral 10/10/2012 Benjamin McVicar [email protected] 61 2 8205 4577
API.AX Australian Pharmaceutical Ind 0.47 0.60 OUTPERFORM -5.0% Saul Hadassin [email protected] 61 2 8205 4679
APN.AX APN News & Media 0.32 0.23 UNDERPERFORM -3.0% Negative Samantha Carleton [email protected] 2 8205 4148
AQA.AX Aquila Resources 3.15 2.75 NEUTRAL -5.0% B Positive 28/12/2012 Paul McTaggart [email protected] 61 2 8205 4698
AQG.AX Alacer Gold Corp. 4.51 8.25 OUTPERFORM 0.0% Michael Slifirski [email protected] 61 3 9280 1845
AQZ.AX Alliance Aviation Services Limited1.88 2.30 OUTPERFORM 0.0% Paul Buys [email protected] 61 2 8205 4538
ARI.AX Arrium 0.89 0.95 OUTPERFORM 0.0% BBB Neutral 1/12/2011 Michael Slifirski [email protected] 61 3 9280 1845
ARP.AX ARB Corp 11.61 9.80 NEUTRAL 0.0% BBB Neutral 25/05/2012 Paul Buys [email protected] 61 2 8205 4538
ASX.AX ASX 33.42 28.00 UNDERPERFORM 0.0% BB Neutral 25/10/2012 David Bailey [email protected] 61 2 8205 4739
AUB.AX Austbrokers 8.14 7.95 NEUTRAL 0.0% Andrew Adams [email protected] 61 2 8205 4106
AUT.AX Aurora Oil & Gas 3.43 4.10 OUTPERFORM -3.0% B Positive 29/08/2012 James Redfern [email protected] 61 2 8205 4779
AWC.AX Alumina Limited 1.12 1.25 OUTPERFORM -4.0% A Neutral 28/12/2012 Matthew Hope [email protected] 61 2 8205 4669
AWE.AX AWE Ltd 1.20 1.80 OUTPERFORM -0.4% BBB Negative 25/05/2012 James Redfern [email protected] 61 2 8205 4779
AZJ.AX Aurizon 4.04 3.80 NEUTRAL 0.0% Neutral Bradley Clibborn [email protected] 61 2 8205 4465
BBG.AX Billabong International 1.01 1.10 OUTPERFORM 0.0% A 25/09/2012 Grant Saligari [email protected] 61 3 9280 1720
BEN.AX Bendigo and Adelaide Bank 9.03 8.75 NEUTRAL 0.0% BBB Positive 25/10/2012 James Ellis [email protected] 61 2 8205 4531
BHP.AX BHP Billiton 36.54 40.00 NEUTRAL -2.0% A Neutral 28/12/2012 Paul McTaggart [email protected] 61 2 8205 4698
BKN.AX Bradken Limited 5.98 6.60 NEUTRAL 0.0% BBB Neutral 3/05/2012 Paul Buys [email protected] 61 2 8205 4538
BLD.AX Boral 4.86 5.40 OUTPERFORM -1.0% AA Neutral 25/05/2012 Andrew Peros [email protected] 61 2 8205 4013
BLY.AX Boart Longyear Group 1.92 1.85 OUTPERFORM 0.0% AA Neutral 24/04/2012 Emma Alcock [email protected] 61 2 8205 4403
BND.AX Bandanna Energy Limited 0.32 0.50 OUTPERFORM -10.0% James Redfern [email protected] 61 2 8205 4779
BOQ.AX Bank of Queensland 7.99 8.00 NEUTRAL 0.0% BB Neutral 25/10/2012 James Ellis [email protected] 61 2 8205 4531
BRG.AX Breville Group 6.44 7.10 OUTPERFORM 0.0% Paul Buys [email protected] 61 2 8205 4538
BSE.AX Base Resources Ltd 0.36 0.80 OUTPERFORM -68.0% Matthew Hope [email protected] 61 2 8205 4669
BSL.AX BlueScope Steel 3.46 RESTRICTED Michael Slifirski [email protected] 61 3 9280 1845
BTT.AX BT Investment Management 2.80 2.60 NEUTRAL 0.0% David Bailey [email protected] 61 2 8205 4739
BTU.AX Bathurst Resources 0.42 0.60 OUTPERFORM -18.0% B Neutral 28/12/2012 James Redfern [email protected] 61 2 8205 4779
BXB.AX Brambles Limited 7.80 7.90 OUTPERFORM 0.0% AAA Neutral 1/03/2012 Nicholas [email protected] 2 8205 4400
CAB.AX Cabcharge Australia 4.61 5.40 NEUTRAL -10.0% BBB Negative 1/03/2012 Paul Buys [email protected] 61 2 8205 4538
CBA.AX Commonwealth Bank Australia 62.20 54.00 UNDERPERFORM 0.0% AA Neutral 25/10/2012 Jarrod Martin [email protected] 61 2 8205 4334
CCL.AX Coca-Cola Amatil 13.29 13.55 UNDERPERFORM 0.0% A Neutral 8/06/2012 Larry Gandler [email protected] 61 3 9280 1855
CFX.AX CFS Retail Property Trust 1.98 1.98 NEUTRAL 0.0% AA Neutral 10/10/2012 John Richmond [email protected] 61 2 82054580
CGF.AX Challenger Financial Services Group3.75 4.90 OUTPERFORM 0.0% David Bailey [email protected] 61 2 8205 4739
CLO.AX Clough 1.02 1.11 OUTPERFORM 0.0% Paul Buys [email protected] 61 2 8205 4538
COH.AX Cochlear 81.84 76.00 UNDERPERFORM -2.0% BB Neutral 28/12/2012 Saul Hadassin [email protected] 61 2 8205 4679
COK.AX Cockatoo Coal 0.14 0.17 OUTPERFORM 0.0% James Redfern [email protected] 61 2 8205 4779
CPA.AX Commonwealth Property Office Fund1.11 1.10 NEUTRAL 0.0% AAA Neutral 10/10/2012 John Lee [email protected] 61 2 8205 4413
CPU.AX Computershare 10.24 11.15 OUTPERFORM 0.0% BBB Neutral 25/05/2012 David Bailey [email protected] 61 2 8205 4739
CQR.AX Charter Hall Retail REIT 3.72 3.37 UNDERPERFORM 0.0% BB Neutral 10/10/2012 John Lee [email protected] 61 2 8205 4413
CRF.AX Centro Retail Australia 2.28 2.00 UNDERPERFORM 0.0% B Neutral 10/10/2012 Stephen Rich [email protected] 61 2 8205 4617
CRZ.AX carsales.com.au 8.66 8.80 OUTPERFORM 0.0% B Positive 25/05/2012 Samantha Carleton [email protected] 2 8205 4148
CSL.AX CSL Ltd 54.15 60.50 OUTPERFORM -1.0% BBB Neutral 10/10/2012 Saul Hadassin [email protected] 61 2 8205 4679
CSR.AX CSR 2.09 1.40 UNDERPERFORM -39.0% BB Neutral 25/09/2012 Andrew Peros [email protected] 61 2 8205 4013
CTX.AX Caltex Australia 18.94 18.00 UNDERPERFORM -0.2% A Positive 1/04/2012 James Redfern [email protected] 61 2 8205 4779
CWN.AX Crown 11.92 13.10 OUTPERFORM 0.0% AAA Neutral 1/02/2012 Larry Gandler [email protected] 61 3 9280 1855
DJS.AX David Jones 2.37 2.42 UNDERPERFORM 0.0% B Neutral 27/08/2012 Grant Saligari [email protected] 61 3 9280 1720
DMP.AX Domino's Pizza 10.83 9.99 NEUTRAL 0.0% Paul Buys [email protected] 61 2 8205 4538
DOW.AX Downer EDI 4.38 4.10 OUTPERFORM 0.0% A Negative 1/03/2012 Bradley Clibborn [email protected] 61 2 8205 4465
DUE.AX DUET Group 2.19 2.07 NEUTRAL -2.6% BB Positive 10/07/2012 Benjamin McVicar [email protected] 61 2 8205 4577
DXS.AX Dexus Property Group 1.01 1.05 NEUTRAL 0.0% AAA Neutral 10/10/2012 Stephen Rich [email protected] 61 2 8205 4617
EGP.AX Echo Entertainment 3.55 3.30 UNDERPERFORM 0.0% BB Neutral 1/02/2012 Larry Gandler [email protected] 61 3 9280 1855
EHL.AX Emeco Holdings 0.66 0.55 NEUTRAL 0.0% AAA Neutral 25/05/2012 Paul Buys [email protected] 61 2 8205 4538
ENV.AX Envestra 0.93 0.83 UNDERPERFORM -5.7% BB Neutral 10/10/2012 Benjamin McVicar [email protected] 61 2 8205 4577
ERA.AX Energy Resources of Australia 1.34 1.65 NEUTRAL -36.0% BB Negative 28/12/2012 Matthew Hope [email protected] 61 2 8205 4669
EVN.AX Evolution Mining Limited 1.62 1.85 NEUTRAL 0.0% B Positive 23/03/2012 Michael Slifirski [email protected] 61 3 9280 1845 Source: MSCI IVA ratings, Company data, Credit Suisse estimates

21 January 2013
Australian ESG/SRI 19
Figure 15: Stock list as at 21 January 2013 (continued)
Ticker Company name
Actual
share
price
Target
Price ($) Rating
TP
rating
risk %
MSCI IVA
rating
Analyst
outlook
on rating
Date of
MSCI IVA
rating Analyst Email contact Phone
FAN.AX Fantastic Holdings 3.23 2.95 NEUTRAL 0.0% Grant Saligari [email protected] 61 3 9280 1720
FLT.AX Flight Centre 28.27 26.35 OUTPERFORM 0.0% B Positive 25/10/2012 Paul Buys [email protected] 61 2 8205 4538
FMG.AX Fortescue Metals Group Ltd 4.53 5.50 NEUTRAL 0.0% BBB Neutral 28/12/2012 Matthew Hope [email protected] 61 2 8205 4669
FWD.AX Fleetwood Corporation 10.45 9.60 UNDERPERFORM 0.0% BBB Neutral 25/06/2012 Paul Buys [email protected] 61 2 8205 4538
FXJ.AX Fairfax Media 0.54 0.40 UNDERPERFORM -3.0% BBB Positive 1/04/2012 Samantha Carleton [email protected] 2 8205 4148
FXL.AX FlexiGroup Limited 3.57 4.00 OUTPERFORM 0.0% Paul Buys [email protected] 61 2 8205 4538
GBG.AX Gindalbie Metals Ltd 0.30 0.37 NEUTRAL 0.0% BB Neutral 28/12/2012 Matthew Hope [email protected] 61 2 8205 4669
GFF.AX Goodman Fielder 0.65 0.66 UNDERPERFORM 0.0% BB Neutral 10/12/2012 Larry Gandler [email protected] 61 3 9280 1855
GMG.AX Goodman Group 4.47 4.15 UNDERPERFORM 0.0% AA Neutral 10/10/2012 Stephen Rich [email protected] 61 2 8205 4617
GNC.AX Graincorp 12.00 RESTRICTED Grant Saligari [email protected] 61 3 9280 1720
GPT.AX GPT Group 3.59 3.60 NEUTRAL 0.0% AAA Neutral 10/10/2012 Stephen Rich [email protected] 61 2 8205 4617
GRY.AX Gryphon Minerals Limited 0.56 1.25 OUTPERFORM -9.0% A Neutral 1/03/2012 Michael Slifirski [email protected] 61 3 9280 1845
GUD.AX G.U.D. Holdings 8.39 8.20 NEUTRAL 0.0% BB Neutral 10/12/2012 Paul Buys [email protected] 61 2 8205 4538
GWA.AX GWA GROUP Limited 2.26 1.95 NEUTRAL 0.0% B Neutral 8/06/2012 Paul Buys [email protected] 61 2 8205 4538
HGG.AX Henderson group 2.35 2.40 OUTPERFORM 0.0% Positive David Bailey [email protected] 61 2 8205 4739
HVN.AX Harvey Norman 1.98 1.87 NEUTRAL 0.0% BB Neutral 27/08/2012 Grant Saligari [email protected] 61 3 9280 1720
IAG.AX Insurance Australia Group 4.96 4.90 NEUTRAL 0.0% AAA Neutral 18/04/2012 Andrew Adams [email protected] 61 2 8205 4106
IFL.AX IOOF Holdings 7.98 7.60 NEUTRAL 0.0% AA Neutral 25/06/2012 David Bailey [email protected] 61 2 8205 4739
IGO.AX Independence Group NL 4.48 5.20 NEUTRAL -2.0% BB Neutral 28/12/2012 Paul McTaggart [email protected] 61 2 8205 4698
IIN.AX iiNet 4.37 3.50 UNDERPERFORM 0.0% Bradley Clibborn [email protected] 61 2 8205 4465
ILU.AX Iluka Resources 9.70 11.00 OUTPERFORM -3.9% BBB Positive 28/12/2012 Matthew Hope [email protected] 61 2 8205 4669
IOF.AX Investa Office Fund 3.01 3.04 NEUTRAL 0.0% AAA Neutral 10/10/2012 John Lee [email protected] 61 2 8205 4413
IPL.AX Incitec Pivot Ltd. 3.17 3.50 OUTPERFORM -1.3% BB Neutral 1/02/2012 Larry Gandler [email protected] 61 3 9280 1855
IRE.AX IRESS Limited 8.41 7.30 NEUTRAL 0.0% B Neutral 25/05/2012 David Bailey [email protected] 61 2 8205 4739
IVC.AX Invocare Group 9.22 9.20 NEUTRAL 0.0% AAA Neutral 10/12/2012 Chris Smith [email protected] 61 2 8205 4210
JBH.AX JB Hi-Fi 10.42 9.70 UNDERPERFORM 0.0% BBB Neutral 25/05/2012 Grant Saligari [email protected] 61 3 9280 1720
JHX.AX James Hardie Industries SE 9.58 9.20 NEUTRAL -18.0% BB Neutral 25/05/2012 Andrew Peros [email protected] 61 2 8205 4013
KAR.AX Karoon Gas 5.49 7.65 OUTPERFORM -11.7% B Positive 25/05/2012 James Redfern [email protected] 61 2 8205 4779
KGD.AX Kula Gold 0.34 0.55 OUTPERFORM 0.0% Michael Slifirski [email protected] 61 3 9280 1845
LEI.AX Leighton Holdings 19.10 17.60 NEUTRAL 0.0% BB Neutral 25/04/2012 Bradley Clibborn [email protected] 61 2 8205 4465
LLC.AX Lend Lease 9.97 8.48 NEUTRAL 2.0% AAA Neutral 25/07/2012 John Richmond [email protected] 61 2 82054580
MBN.AX Mirabela Nickel 0.55 0.65 NEUTRAL -6.0% BB Neutral 28/12/2012 Paul McTaggart [email protected] 61 2 8205 4698
MDL.AX Mineral Deposits Ltd. 3.58 6.50 OUTPERFORM -11.0% BBB Positive 28/12/2012 Matthew Hope [email protected] 61 2 8205 4669
MGR.AX Mirvac Group 1.56 1.60 NEUTRAL 0.0% AA Neutral 10/10/2012 John Richmond [email protected] 61 2 82054580
MGX.AX Mount Gibson Iron 0.82 0.90 OUTPERFORM 0.0% BB Neutral 28/12/2012 Matthew Hope [email protected] 61 2 8205 4669
MMS.AX McMillan Shakespeare 13.60 14.85 OUTPERFORM 0.0% B Positive 25/05/2012 Paul Buys [email protected] 61 2 8205 4538
MQG.AX Macquarie Group 37.01 35.00 OUTPERFORM 0.0% A Negative 1/03/2012 James Ellis [email protected] 61 2 8205 4531
MRM.AX Mermaid Marine Australia 3.86 3.61 OUTPERFORM 0.0% B Neutral 1/02/2012 Paul Buys [email protected] 61 2 8205 4538
MSB.AX Mesoblast 5.92 7.40 OUTPERFORM -3.0% B Positive 10/10/2012 Saul Hadassin [email protected] 61 2 8205 4679
MTS.AX Metcash 3.66 3.85 OUTPERFORM 0.0% A Neutral 10/08/2012 Grant Saligari [email protected] 61 3 9280 1720
MYR.AX Myer Holdings 2.35 2.70 OUTPERFORM 0.0% B Neutral 27/08/2012 Grant Saligari [email protected] 61 3 9280 1720
NAB.AX National Australia Bank 26.85 26.00 NEUTRAL 0.0% A Negative 25/10/2012 Jarrod Martin [email protected] 61 2 8205 4334
NCM.AX Newcrest Mining 23.25 30.00 OUTPERFORM 0.0% BB Neutral 1/03/2012 Michael Slifirski [email protected] 61 3 9280 1845
NHC.AX New Hope Corporation 4.26 4.00 UNDERPERFORM -3.0% James Redfern [email protected] 61 2 8205 4779
NUF.AX Nufarm 6.37 5.80 UNDERPERFORM -4.0% BBB Neutral 1/02/2012 Larry Gandler [email protected] 61 3 9280 1855
NVT.AX Navitas Ltd 4.82 5.00 OUTPERFORM 0.0% BBB Positive 10/12/2012 Paul Buys [email protected] 61 2 8205 4538
NWH.AX NRW Holdings Limited 1.91 1.40 UNDERPERFORM 0.0% AA Neutral 24/04/2012 Paul Buys [email protected] 61 2 8205 4538
NWS.AX News Corporation 26.33 27.00 NEUTRAL -10.0% CCC Neutral 27/09/2012 Samantha Carleton [email protected] 2 8205 4148
OKN.AX Oakton 1.39 1.40 NEUTRAL 0.0% Chris Smith [email protected] 61 2 8205 4210
ORG.AX Origin Energy 12.13 13.10 OUTPERFORM -4.2% AA 27/08/2012 Benjamin McVicar [email protected] 61 2 8205 4577
ORI.AX Orica 25.43 26.70 OUTPERFORM -3.0% BBB Negative 10/10/2012 Larry Gandler [email protected] 61 3 9280 1855
ORL.AX OrotonGroup 7.15 8.00 OUTPERFORM 0.0% Grant Saligari [email protected] 61 3 9280 1720
OSH.AX Oil Search 7.14 8.00 NEUTRAL -4.5% BB Neutral 3/12/2012 Paul McTaggart [email protected] 61 2 8205 4698
OZL.AX OZ Minerals 7.50 9.70 OUTPERFORM 0.0% BBB Neutral 28/12/2012 Michael Slifirski [email protected] 61 3 9280 1845
PAN.AX Panoramic Resources 0.56 0.75 OUTPERFORM 0.0% Neutral Paul McTaggart [email protected] 61 2 8205 4698
PBG.AX Pacific Brands 0.60 0.60 NEUTRAL 0.0% BBB Neutral 10/07/2012 Grant Saligari [email protected] 61 3 9280 1720
PMV.AX Premier Investments Ltd 7.08 7.54 OUTPERFORM 0.0% CCC Neutral 8/06/2012 Grant Saligari [email protected] 61 3 9280 1720
PNA.AX PanAust 3.36 3.15 UNDERPERFORM 0.0% A Neutral 28/12/2012 Michael Slifirski [email protected] 61 3 9280 1845
PPT.AX Perpetual 37.35 35.50 NEUTRAL 0.0% AAA Negative 25/06/2012 David Bailey [email protected] 61 2 8205 4739
PRG.AX Programmed Maintenance Services1.97 1.90 NEUTRAL 0.0% Chris Smith [email protected] 61 2 8205 4210
PRT.AX Prime Media Group 0.95 0.86 NEUTRAL -3.0% Samantha Carleton [email protected] 2 8205 4148
PRU.AX Perseus Mining 1.96 3.20 OUTPERFORM 0.0% B Positive 1/03/2012 Michael Slifirski [email protected] 61 3 9280 1845
PRY.AX Primary Health Care 4.42 3.65 NEUTRAL -5.0% A Neutral 25/05/2012 Saul Hadassin [email protected] 61 2 8205 4679
PTM.AX Platinum Asset Management 4.53 3.90 UNDERPERFORM 0.0% B Neutral 25/06/2012 David Bailey [email protected] 61 2 8205 4739
PXS.AX Pharmaxis 1.31 1.70 OUTPERFORM -5.0% AA 27/08/2012 Saul Hadassin [email protected] 61 2 8205 4679
QAN.AX Qantas Airways 1.53 1.76 OUTPERFORM -9.2% BB Neutral 21/09/2012 Nicholas [email protected] 2 8205 4400
QBE.AX QBE Insurance Group 12.14 13.10 OUTPERFORM 0.0% A Negative 17/04/2012 Andrew Adams [email protected] 61 2 8205 4106
QUB.AX Qube Logistics 1.79 1.90 OUTPERFORM 0.0% B Positive 25/10/2012 Nicholas [email protected] 2 8205 4400 Source: MSCI IVA ratings, Company data, Credit Suisse estimates
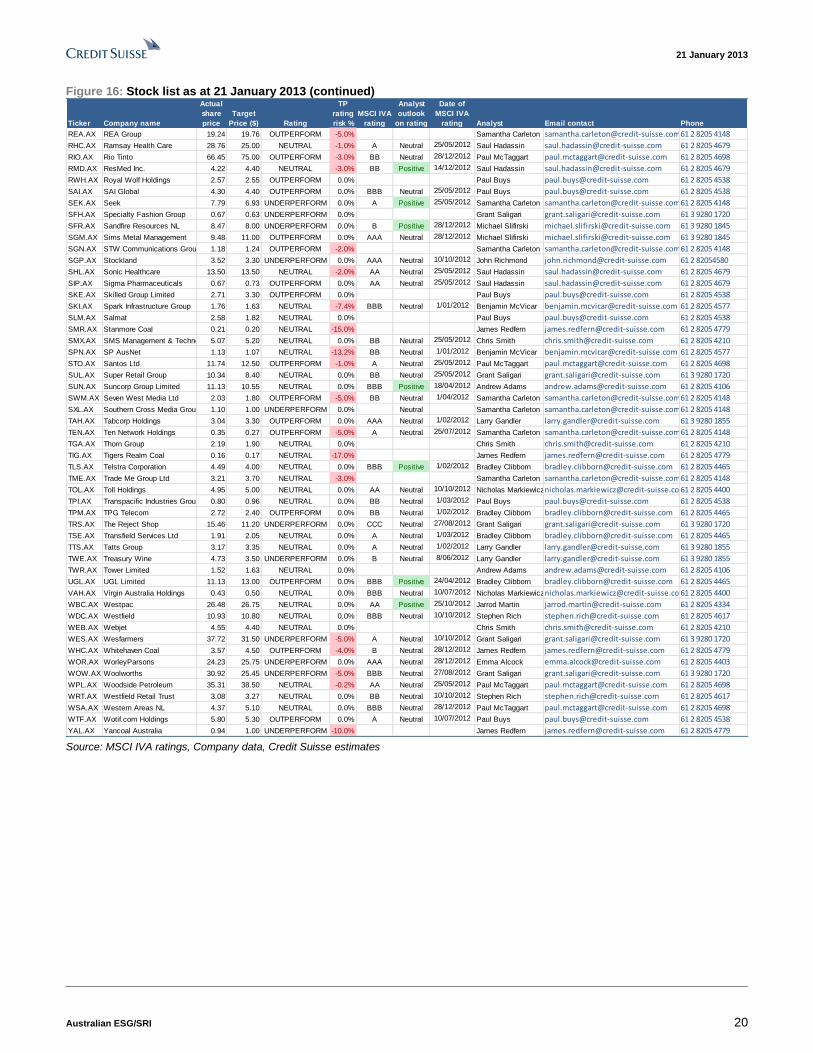
21 January 2013
Australian ESG/SRI 20
Figure 16: Stock list as at 21 January 2013 (continued)
Ticker Company name
Actual
share
price
Target
Price ($) Rating
TP
rating
risk %
MSCI IVA
rating
Analyst
outlook
on rating
Date of
MSCI IVA
rating Analyst Email contact Phone
REA.AX REA Group 19.24 19.76 OUTPERFORM -5.0% Samantha Carleton [email protected] 2 8205 4148
RHC.AX Ramsay Health Care 28.76 25.00 NEUTRAL -1.0% A Neutral 25/05/2012 Saul Hadassin [email protected] 61 2 8205 4679
RIO.AX Rio Tinto 66.45 75.00 OUTPERFORM -3.0% BB Neutral 28/12/2012 Paul McTaggart [email protected] 61 2 8205 4698
RMD.AX ResMed Inc. 4.22 4.40 NEUTRAL -3.0% BB Positive 14/12/2012 Saul Hadassin [email protected] 61 2 8205 4679
RWH.AX Royal Wolf Holdings 2.57 2.55 OUTPERFORM 0.0% Paul Buys [email protected] 61 2 8205 4538
SAI.AX SAI Global 4.30 4.40 OUTPERFORM 0.0% BBB Neutral 25/05/2012 Paul Buys [email protected] 61 2 8205 4538
SEK.AX Seek 7.79 6.93 UNDERPERFORM 0.0% A Positive 25/05/2012 Samantha Carleton [email protected] 2 8205 4148
SFH.AX Specialty Fashion Group 0.67 0.63 UNDERPERFORM 0.0% Grant Saligari [email protected] 61 3 9280 1720
SFR.AX Sandfire Resources NL 8.47 8.00 UNDERPERFORM 0.0% B Positive 28/12/2012 Michael Slifirski [email protected] 61 3 9280 1845
SGM.AX Sims Metal Management 9.48 11.00 OUTPERFORM 0.0% AAA Neutral 28/12/2012 Michael Slifirski [email protected] 61 3 9280 1845
SGN.AX STW Communications Group 1.18 1.24 OUTPERFORM -2.0% Samantha Carleton [email protected] 2 8205 4148
SGP.AX Stockland 3.52 3.30 UNDERPERFORM 0.0% AAA Neutral 10/10/2012 John Richmond [email protected] 61 2 82054580
SHL.AX Sonic Healthcare 13.50 13.50 NEUTRAL -2.0% AA Neutral 25/05/2012 Saul Hadassin [email protected] 61 2 8205 4679
SIP.AX Sigma Pharmaceuticals 0.67 0.73 OUTPERFORM 0.0% AA Neutral 25/05/2012 Saul Hadassin [email protected] 61 2 8205 4679
SKE.AX Skilled Group Limited 2.71 3.30 OUTPERFORM 0.0% Paul Buys [email protected] 61 2 8205 4538
SKI.AX Spark Infrastructure Group 1.76 1.63 NEUTRAL -7.4% BBB Neutral 1/01/2012 Benjamin McVicar [email protected] 61 2 8205 4577
SLM.AX Salmat 2.58 1.82 NEUTRAL 0.0% Paul Buys [email protected] 61 2 8205 4538
SMR.AX Stanmore Coal 0.21 0.20 NEUTRAL -15.0% James Redfern [email protected] 61 2 8205 4779
SMX.AX SMS Management & Technology5.07 5.20 NEUTRAL 0.0% BB Neutral 25/05/2012 Chris Smith [email protected] 61 2 8205 4210
SPN.AX SP AusNet 1.13 1.07 NEUTRAL -13.2% BB Neutral 1/01/2012 Benjamin McVicar [email protected] 61 2 8205 4577
STO.AX Santos Ltd 11.74 12.50 OUTPERFORM -1.0% A Neutral 25/05/2012 Paul McTaggart [email protected] 61 2 8205 4698
SUL.AX Super Retail Group 10.34 8.40 NEUTRAL 0.0% BB Neutral 25/05/2012 Grant Saligari [email protected] 61 3 9280 1720
SUN.AX Suncorp Group Limited 11.13 10.55 NEUTRAL 0.0% BBB Positive 18/04/2012 Andrew Adams [email protected] 61 2 8205 4106
SWM.AX Seven West Media Ltd 2.03 1.80 OUTPERFORM -5.0% BB Neutral 1/04/2012 Samantha Carleton [email protected] 2 8205 4148
SXL.AX Southern Cross Media Group 1.10 1.00 UNDERPERFORM 0.0% Neutral Samantha Carleton [email protected] 2 8205 4148
TAH.AX Tabcorp Holdings 3.04 3.30 OUTPERFORM 0.0% AAA Neutral 1/02/2012 Larry Gandler [email protected] 61 3 9280 1855
TEN.AX Ten Network Holdings 0.35 0.27 OUTPERFORM -5.0% A Neutral 25/07/2012 Samantha Carleton [email protected] 2 8205 4148
TGA.AX Thorn Group 2.19 1.90 NEUTRAL 0.0% Chris Smith [email protected] 61 2 8205 4210
TIG.AX Tigers Realm Coal 0.16 0.17 NEUTRAL -17.0% James Redfern [email protected] 61 2 8205 4779
TLS.AX Telstra Corporation 4.49 4.00 NEUTRAL 0.0% BBB Positive 1/02/2012 Bradley Clibborn [email protected] 61 2 8205 4465
TME.AX Trade Me Group Ltd 3.21 3.70 NEUTRAL -3.0% Samantha Carleton [email protected] 2 8205 4148
TOL.AX Toll Holdings 4.95 5.00 NEUTRAL 0.0% AA Neutral 10/10/2012 Nicholas [email protected] 2 8205 4400
TPI.AX Transpacific Industries Group 0.80 0.96 NEUTRAL 0.0% BB Neutral 1/03/2012 Paul Buys [email protected] 61 2 8205 4538
TPM.AX TPG Telecom 2.72 2.40 OUTPERFORM 0.0% BB Neutral 1/02/2012 Bradley Clibborn [email protected] 61 2 8205 4465
TRS.AX The Reject Shop 15.46 11.20 UNDERPERFORM 0.0% CCC Neutral 27/08/2012 Grant Saligari [email protected] 61 3 9280 1720
TSE.AX Transfield Services Ltd 1.91 2.05 NEUTRAL 0.0% A Neutral 1/03/2012 Bradley Clibborn [email protected] 61 2 8205 4465
TTS.AX Tatts Group 3.17 3.35 NEUTRAL 0.0% A Neutral 1/02/2012 Larry Gandler [email protected] 61 3 9280 1855
TWE.AX Treasury Wine 4.73 3.50 UNDERPERFORM 0.0% B Neutral 8/06/2012 Larry Gandler [email protected] 61 3 9280 1855
TWR.AX Tower Limited 1.52 1.63 NEUTRAL 0.0% Andrew Adams [email protected] 61 2 8205 4106
UGL.AX UGL Limited 11.13 13.00 OUTPERFORM 0.0% BBB Positive 24/04/2012 Bradley Clibborn [email protected] 61 2 8205 4465
VAH.AX Virgin Australia Holdings 0.43 0.50 NEUTRAL 0.0% BBB Neutral 10/07/2012 Nicholas [email protected] 2 8205 4400
WBC.AX Westpac 26.48 26.75 NEUTRAL 0.0% AA Positive 25/10/2012 Jarrod Martin [email protected] 61 2 8205 4334
WDC.AX Westfield 10.93 10.80 NEUTRAL 0.0% BBB Neutral 10/10/2012 Stephen Rich [email protected] 61 2 8205 4617
WEB.AX Webjet 4.55 4.40 NEUTRAL 0.0% Chris Smith [email protected] 61 2 8205 4210
WES.AX Wesfarmers 37.72 31.50 UNDERPERFORM -5.0% A Neutral 10/10/2012 Grant Saligari [email protected] 61 3 9280 1720
WHC.AX Whitehaven Coal 3.57 4.50 OUTPERFORM -4.0% B Neutral 28/12/2012 James Redfern [email protected] 61 2 8205 4779
WOR.AX WorleyParsons 24.23 25.75 UNDERPERFORM 0.0% AAA Neutral 28/12/2012 Emma Alcock [email protected] 61 2 8205 4403
WOW.AX Woolworths 30.92 25.45 UNDERPERFORM -5.0% BBB Neutral 27/08/2012 Grant Saligari [email protected] 61 3 9280 1720
WPL.AX Woodside Petroleum 35.31 38.50 NEUTRAL -0.2% AA Neutral 25/05/2012 Paul McTaggart [email protected] 61 2 8205 4698
WRT.AX Westfield Retail Trust 3.08 3.27 NEUTRAL 0.0% BB Neutral 10/10/2012 Stephen Rich [email protected] 61 2 8205 4617
WSA.AX Western Areas NL 4.37 5.10 NEUTRAL 0.0% BBB Neutral 28/12/2012 Paul McTaggart [email protected] 61 2 8205 4698
WTF.AX Wotif.com Holdings 5.80 5.30 OUTPERFORM 0.0% A Neutral 10/07/2012 Paul Buys [email protected] 61 2 8205 4538
YAL.AX Yancoal Australia 0.94 1.00 UNDERPERFORM -10.0% James Redfern [email protected] 61 2 8205 4779 Source: MSCI IVA ratings, Company data, Credit Suisse estimates

21 January 2013
Australian ESG/SRI 21
Companies Mentioned (Price as of 21-Jan-2013)
Adelaide Brighton (ABC.AX, A$3.29) AGL Energy (AGK.AX, A$15.63) Atlas Iron (AGO.AX, A$1.54) AHL (AHD.AX, A$7.3) Asciano Group (AIO.AX, A$4.77) Aristocrat Leisure (ALL.AX, A$3.41) ALS Limited (ALQ.AX, A$10.95) Australand (ALZ.AX, A$3.39) Amcor (AMC.AX, A$8.46) AMP (AMP.AX, A$5.21) Ampella Mining Limited (AMX.AX, A$0.39) Australia and New Zealand Bank (ANZ.AX, A$25.69) Altona Mining Limited (AOH.AX, A$0.25) APA Group (APA.AX, A$5.7) Australian Pharmaceutical Ind (API.AX, A$0.47) APN News & Media (APN.AX, A$0.315) Aquila Resources (AQA.AX, A$3.15) Alacer Gold Corp. (AQG.AX, A$4.51) Alliance Aviation Services Limited (AQZ.AX, A$1.88) Arrium (ARI.AX, A$0.89) ARB Corp (ARP.AX, A$11.61) ASX (ASX.AX, A$33.42) Austbrokers (AUB.AX, A$8.14) Aurora Oil & Gas (AUT.AX, A$3.43, OUTPERFORM, TP A$4.1) Alumina Limited (AWC.AX, A$1.115) AWE Ltd (AWE.AX, A$1.195) Aurizon (AZJ.AX, A$4.04) Billabong International (BBG.AX, A$1.005) Bendigo and Adelaide Bank (BEN.AX, A$9.03) BHP Billiton (BHP.AX, A$36.54) Bradken Limited (BKN.AX, A$5.98) Boral (BLD.AX, A$4.86) Boart Longyear Group (BLY.AX, A$1.92) Bandanna Energy Limited (BND.AX, A$0.315) Bank of Queensland (BOQ.AX, A$7.99) Beach Energy (BPT.AX, A$1.33) Breville Group (BRG.AX, A$6.44) Base Resources Ltd (BSE.AX, A$0.355) BlueScope Steel (BSL.AX, A$3.46) BT Investment Management (BTT.AX, A$2.8) Bathurst Resources (BTU.AX, A$0.415) Brambles Limited (BXB.AX, A$7.8, OUTPERFORM, TP A$7.9) Cabcharge Australia (CAB.AX, A$4.61) Commonwealth Bank Australia (CBA.AX, A$62.2) Coca-Cola Amatil (CCL.AX, A$13.29) CFS Retail Property Trust (CFX.AX, A$1.98) Challenger Financial Services Group (CGF.AX, A$3.75) Clough (CLO.AX, A$1.02) Cochlear (COH.AX, A$81.84) Cockatoo Coal (COK.AX, A$0.135) Commonwealth Property Office Fund (CPA.AX, A$1.105) Computershare (CPU.AX, A$10.24) Charter Hall Retail REIT (CQR.AX, A$3.72) Centro Retail Australia (CRF.AX, A$2.28) carsales.com.au (CRZ.AX, A$8.66, OUTPERFORM, TP A$8.8) CSL Ltd (CSL.AX, A$54.15) CSR (CSR.AX, A$2.09) Caltex Australia (CTX.AX, A$18.94) Crown (CWN.AX, A$11.92) David Jones (DJS.AX, A$2.37) Domino's Pizza (DMP.AX, A$10.83) Downer EDI (DOW.AX, A$4.38) DUET Group (DUE.AX, A$2.19) Dexus Property Group (DXS.AX, A$1.01) Echo Entertainment (EGP.AX, A$3.55, UNDERPERFORM, TP A$3.3) Emeco Holdings (EHL.AX, A$0.66) Envestra (ENV.AX, A$0.925) Energy Resources of Australia (ERA.AX, A$1.34) Evolution Mining Limited (EVN.AX, A$1.615) Fantastic Holdings (FAN.AX, A$3.23) Flight Centre (FLT.AX, A$28.27, OUTPERFORM, TP A$26.35) Fortescue Metals Group Ltd (FMG.AX, A$4.53) Fleetwood Corporation (FWD.AX, A$10.45) Fairfax Media (FXJ.AX, A$0.54) FlexiGroup Limited (FXL.AX, A$3.57) Gindalbie Metals Ltd (GBG.AX, A$0.295) Goodman Fielder (GFF.AX, A$0.645) Goodman Group (GMG.AX, A$4.47) Graincorp (GNC.AX, A$12.0) GPT Group (GPT.AX, A$3.59) Gryphon Minerals Limited (GRY.AX, A$0.555) G.U.D. Holdings (GUD.AX, A$8.39)

21 January 2013
Australian ESG/SRI 22
GWA GROUP Limited (GWA.AX, A$2.26) Henderson group (HGG.AX, A$2.35, OUTPERFORM, TP A$2.4) Harvey Norman (HVN.AX, A$1.98) Insurance Australia Group (IAG.AX, A$4.96) Industrea Ltd (IDL.AX, A$1.265) Industrea Ltd (IDL.AX^L12, A$1.265) Independence Group NL (IGO.AX, A$4.48) iiNet (IIN.AX, A$4.37) Iluka Resources (ILU.AX, A$9.7, OUTPERFORM[V], TP A$11.0) Investa Office Fund (IOF.AX, A$3.01) Incitec Pivot Ltd. (IPL.AX, A$3.17) IRESS Limited (IRE.AX, A$8.41) Invocare Group (IVC.AX, A$9.22) JB Hi-Fi (JBH.AX, A$10.42) James Hardie Industries SE (JHX.AX, A$9.58) Karoon Gas (KAR.AX, A$5.49) Kula Gold (KGD.AX, A$0.34) Leighton Holdings (LEI.AX, A$19.1) Lend Lease (LLC.AX, A$9.97) Lynas (LYC.AX, A$0.63) Mirabela Nickel (MBN.AX, A$0.55) Mineral Deposits Ltd. (MDL.AX, A$3.58) Mirvac Group (MGR.AX, A$1.555) Mount Gibson Iron (MGX.AX, A$0.82) McMillan Shakespeare (MMS.AX, A$13.6, OUTPERFORM, TP A$14.85) Monadelphous (MND.AX, A$24.3) Macquarie Group (MQG.AX, A$37.01) Mermaid Marine Australia (MRM.AX, A$3.86) Mesoblast (MSB.AX, A$5.92) Metcash (MTS.AX, A$3.66) Myer Holdings (MYR.AX, A$2.35) National Australia Bank (NAB.AX, A$26.85) Newcrest Mining (NCM.AX, A$23.25) New Hope Corporation (NHC.AX, A$4.26) Nufarm (NUF.AX, A$6.37) Navitas Ltd (NVT.AX, A$4.82) NRW Holdings Limited (NWH.AX, A$1.91) News Corporation (NWS.AX, A$26.33) Oakton (OKN.AX, A$1.385) Origin Energy (ORG.AX, A$12.13) Orica (ORI.AX, A$25.43) OrotonGroup (ORL.AX, A$7.15) Oil Search (OSH.AX, A$7.14) OZ Minerals (OZL.AX, A$7.5) Panoramic Resources (PAN.AX, A$0.56) Pacific Brands (PBG.AX, A$0.6) Premier Investments Ltd (PMV.AX, A$7.08) PanAust (PNA.AX, A$3.36) Perpetual (PPT.AX, A$37.35) Programmed Maintenance Services (PRG.AX, A$1.965) Prime Media Group (PRT.AX, A$0.95) Perseus Mining (PRU.AX, A$1.96, OUTPERFORM[V], TP A$3.2) Primary Health Care (PRY.AX, A$4.42) Platinum Asset Management (PTM.AX, A$4.53) Pharmaxis (PXS.AX, A$1.305) Qantas Airways (QAN.AX, A$1.53) QBE Insurance Group (QBE.AX, A$12.14) Qube Logistics (QUB.AX, A$1.785) REA Group (REA.AX, A$19.24) Ramsay Health Care (RHC.AX, A$28.76) Rio Tinto (RIO.AX, A$66.45) ResMed Inc. (RMD.AX, A$4.22) Resolute Mining (RSG.AX, A$1.38) Royal Wolf Holdings (RWH.AX, A$2.57) SAI Global (SAI.AX, A$4.3) Sundance (SDL.AX, A$0.345) Seek (SEK.AX, A$7.79) Specialty Fashion Group (SFH.AX, A$0.67) Sandfire Resources NL (SFR.AX, A$8.47) Sims Metal Management (SGM.AX, A$9.48) STW Communications Group (SGN.AX, A$1.18) Stockland (SGP.AX, A$3.52) Sonic Healthcare (SHL.AX, A$13.5) Sigma Pharmaceuticals (SIP.AX, A$0.67) Skilled Group Limited (SKE.AX, A$2.71) Spark Infrastructure Group (SKI.AX, A$1.76) Salmat (SLM.AX, A$2.58) Stanmore Coal (SMR.AX, A$0.21) SMS Management & Technology (SMX.AX, A$5.07) SP AusNet (SPN.AX, A$1.13) Santos Ltd (STO.AX, A$11.74) Super Retail Group (SUL.AX, A$10.34) Suncorp Group Limited (SUN.AX, A$11.13) Seven West Media Ltd (SWM.AX, A$2.03)

21 January 2013
Australian ESG/SRI 23
Southern Cross Media Group (SXL.AX, A$1.095) Tabcorp Holdings (TAH.AX, A$3.04, OUTPERFORM, TP A$3.3) Ten Network Holdings (TEN.AX, A$0.345) Thorn Group (TGA.AX, A$2.19) Tigers Realm Coal (TIG.AX, A$0.155) Telstra Corporation (TLS.AX, A$4.49) Trade Me Group Ltd (TME.AX, A$3.21) Toll Holdings (TOL.AX, A$4.95) Transpacific Industries Group (TPI.AX, A$0.8) TPG Telecom (TPM.AX, A$2.72) The Reject Shop (TRS.AX, A$15.46) Transfield Services Ltd (TSE.AX, A$1.91) Tatts Group (TTS.AX, A$3.17) Treasury Wine (TWE.AX, A$4.73, UNDERPERFORM, TP A$3.5) Tower Limited (TWR.AX, A$1.515) UGL Limited (UGL.AX, A$11.13) Virgin Australia Holdings (VAH.AX, A$0.43) Westpac (WBC.AX, A$26.48) Westfield (WDC.AX, A$10.93) Webjet (WEB.AX, A$4.55) Wesfarmers (WES.AX, A$37.72) Whitehaven Coal (WHC.AX, A$3.57) WorleyParsons (WOR.AX, A$24.23) Woolworths (WOW.AX, A$30.92) Woodside Petroleum (WPL.AX, A$35.31) Westfield Retail Trust (WRT.AX, A$3.08) Western Areas NL (WSA.AX, A$4.37) Wotif.com Holdings (WTF.AX, A$5.8) Yancoal Australia (YAL.AX, A$0.935)
Disclosure Appendix
Important Global Disclosures
The analysts identified in this report each certify, with respect to the companies or securities that the individual analyzes, that (1) the views expressed in this report accurately reflect his or her personal views about all of the subject companies and securities and (2) no part of his or her compensation was, is or will be directly or indirectly related to the specific recommendations or views expressed in this report.
Price and Rating History for Aurora Oil & Gas (AUT.AX)
AUT.AX Closing Price Target Price
Date (A$) (A$) Rating
23-May-11 2.83 3.60 O *
02-Jun-11 3.65 4.00 N
16-Jul-11 3.34 3.70
11-Aug-11 2.97 3.70 O
16-Aug-11 2.94 3.60
15-Dec-11 3.06 3.75
29-Mar-12 3.88 4.20 N
30-Apr-12 4.15 4.50
15-May-12 3.88 R
17-May-12 3.50 4.50 N
18-May-12 3.30 4.30 O
11-Jul-12 3.25 3.80
24-Jul-12 3.36 3.90
09-Aug-12 3.50 *
10-Aug-12 3.48 3.80 N
01-Nov-12 3.78 4.25
14-Nov-12 3.36 3.70
27-Nov-12 3.49 4.10 O *
* Asterisk signifies initiation or assumption of coverage.
O U T PERFO RM
N EU T RA L
REST RICT ED

21 January 2013
Australian ESG/SRI 24
Price and Rating History for Brambles Limited (BXB.AX)
BXB.AX Closing Price Target Price
Date (A$) (A$) Rating
18-Feb-10 6.95 8.26 O
08-Jun-10 6.23 7.66
20-Aug-10 5.62 7.36
16-Nov-10 6.75 8.11
15-Feb-11 7.15 8.46
11-May-11 6.93 8.06
19-May-11 7.23 8.21
16-Aug-11 6.61 8.06
17-Aug-11 6.89 8.16
16-Feb-12 6.96 7.66
02-May-12 7.36 8.36
04-Jun-12 6.75 7.75
16-Aug-12 6.48 7.50 *
02-Oct-12 7.00 7.80
15-Oct-12 7.03 7.90
* Asterisk signifies initiation or assumption of coverage.
O U T PERFO RM
Price and Rating History for carsales.com.au (CRZ.AX)
CRZ.AX Closing Price Target Price
Date (A$) (A$) Rating
28-Jan-10 4.55 5.02 N
25-Feb-10 4.86 5.28
19-Aug-10 5.03 5.66
23-Feb-11 5.01 5.98 O
07-May-12 5.45 6.40
18-Jul-12 6.14 NR
27-Nov-12 7.54 8.80 O *
* Asterisk signifies initiation or assumption of coverage.
N EU T RA L
O U T PERFO RM
N O T RA T ED
Price and Rating History for Echo Entertainment (EGP.AX)
EGP.AX Closing Price Target Price
Date (A$) (A$) Rating
06-Jun-11 4.17 4.32 U *
16-Aug-11 3.66 4.32 O
25-Oct-11 3.69 4.13
24-Feb-12 4.11 4.49 N
12-Jun-12 4.29 4.49 U
15-Jun-12 4.29 3.80 N
19-Jul-12 4.22 3.80 U
24-Oct-12 3.79 3.30
* Asterisk signifies initiation or assumption of coverage. U N D ERPERFO RM
O U T PERFO RM
N EU T RA L

21 January 2013
Australian ESG/SRI 25
Price and Rating History for Flight Centre (FLT.AX)
FLT.AX Closing Price Target Price
Date (A$) (A$) Rating
20-Apr-10 20.01 23.00 N
29-Apr-10 20.00 23.00 O
03-Sep-10 21.21 25.00
01-Nov-10 23.37 27.30
21-Dec-10 24.80 28.40
22-Feb-11 23.46 29.00
23-Aug-11 18.66 24.00
27-Oct-11 19.50 24.50
28-Aug-12 23.70 26.35 *
* Asterisk signifies initiation or assumption of coverage.
N EU T RA L
O U T PERFO RM
Price and Rating History for Henderson group (HGG.AX)
HGG.AX Closing Price Target Price
Date (A$) (A$) Rating
25-Feb-10 2.18 3.47 O
28-Apr-10 2.43 3.33
25-Jun-10 2.14 3.36
06-Oct-10 2.15 3.27
22-Oct-10 2.14 *
11-Jan-11 2.15 3.14 O
13-Jan-11 2.40 3.10
10-Mar-11 2.59 3.25
04-May-11 2.41 3.15
06-Jul-11 2.30 3.00
19-Jul-11 2.27 2.95
21-Sep-11 1.83 2.65
02-Nov-11 1.80 2.50
16-Dec-11 1.64 2.15
05-Jan-12 1.55 2.05
29-Feb-12 1.88 2.10
03-Apr-12 1.98 2.35
02-Jul-12 1.56 2.25
14-Aug-12 1.57 2.20
02-Oct-12 1.72 2.25
30-Nov-12 1.86 *
08-Jan-13 2.08 2.40 O
11-Jan-13 2.15 2.25
13-Jan-13 2.15 2.40
* Asterisk signifies initiation or assumption of coverage.
O U T PERFO RM

21 January 2013
Australian ESG/SRI 26
Price and Rating History for Iluka Resources (ILU.AX)
ILU.AX Closing Price Target Price
Date (A$) (A$) Rating
29-Nov-10 7.59 9.20 O *
11-Jan-11 8.44 12.30
20-Jan-11 8.90 14.00
13-Apr-11 13.84 15.60
25-May-11 15.16 18.10
15-Jul-11 17.89 20.50
27-Jul-11 18.70 21.00
21-Nov-11 14.85 20.00
08-Dec-11 16.68 21.00
18-Jan-12 16.50 23.50
23-Feb-12 16.86 23.00
05-Jul-12 11.63 19.50
09-Jul-12 8.88 17.80
24-Aug-12 9.60 13.50
17-Oct-12 9.60 12.00
28-Nov-12 8.23 11.00
* Asterisk signifies initiation or assumption of coverage.
O U T PERFO RM
Price and Rating History for McMillan Shakespeare (MMS.AX)
MMS.AX Closing Price Target Price
Date (A$) (A$) Rating
25-Mar-11 9.42 11.65 O *
13-May-11 9.72 *
30-Aug-11 8.01 10.90 O
01-Sep-11 9.15 *
11-Oct-11 8.96 *
23-Nov-11 8.90 R
30-Nov-11 8.71 10.90 O
21-Feb-12 9.35 10.50
03-May-12 10.70 12.00
21-Aug-12 12.22 13.55
17-Jan-13 13.49 14.85
* Asterisk signifies initiation or assumption of coverage.
O U T PERFO RM
REST RICT ED
Price and Rating History for Perseus Mining (PRU.AX)
PRU.AX Closing Price Target Price
Date (A$) (A$) Rating
10-Mar-11 3.03 3.75 O *
31-Aug-11 3.60 4.20
19-Jan-12 2.97 3.45
17-Feb-12 2.77 3.00 N
18-Apr-12 2.35 3.10 O
16-Oct-12 2.76 3.20
* Asterisk signifies initiation or assumption of coverage.
O U T PERFO RM
N EU T RA L
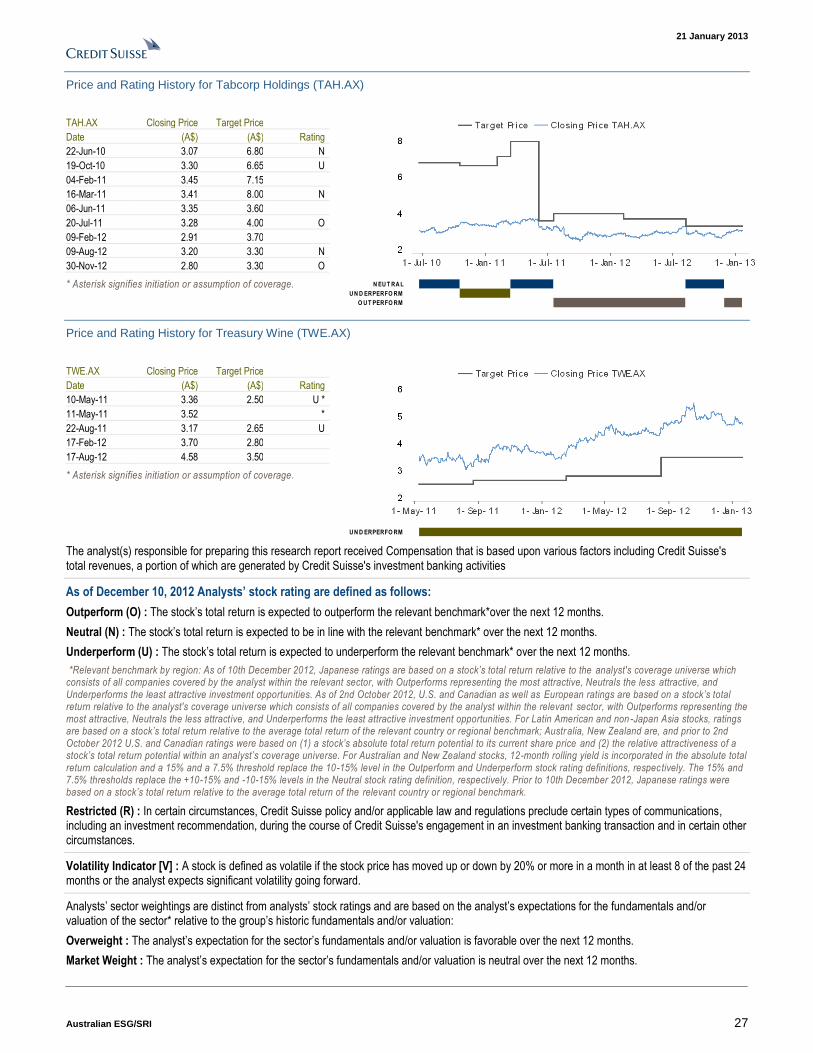
21 January 2013
Australian ESG/SRI 27
Price and Rating History for Tabcorp Holdings (TAH.AX)
TAH.AX Closing Price Target Price
Date (A$) (A$) Rating
22-Jun-10 3.07 6.80 N
19-Oct-10 3.30 6.65 U
04-Feb-11 3.45 7.15
16-Mar-11 3.41 8.00 N
06-Jun-11 3.35 3.60
20-Jul-11 3.28 4.00 O
09-Feb-12 2.91 3.70
09-Aug-12 3.20 3.30 N
30-Nov-12 2.80 3.30 O
* Asterisk signifies initiation or assumption of coverage.
N EU T RA L
U N D ERPERFO RM
O U T PERFO RM
Price and Rating History for Treasury Wine (TWE.AX)
TWE.AX Closing Price Target Price
Date (A$) (A$) Rating
10-May-11 3.36 2.50 U *
11-May-11 3.52 *
22-Aug-11 3.17 2.65 U
17-Feb-12 3.70 2.80
17-Aug-12 4.58 3.50
* Asterisk signifies initiation or assumption of coverage.
UN D ERPERFO RM
The analyst(s) responsible for preparing this research report received Compensation that is based upon various factors including Credit Suisse's total revenues, a portion of which are generated by Credit Suisse's investment banking activities
As of December 10, 2012 Analysts’ stock rating are defined as follows:
Outperform (O) : The stock’s total return is expected to outperform the relevant benchmark*over the next 12 months.
Neutral (N) : The stock’s total return is expected to be in line with the relevant benchmark* over the next 12 months.
Underperform (U) : The stock’s total return is expected to underperform the relevant benchmark* over the next 12 months.
*Relevant benchmark by region: As of 10th December 2012, Japanese ratings are based on a stock’s total return relative to the analyst's coverage universe which consists of all companies covered by the analyst within the relevant sector, with Outperforms representing the most attractive, Neutrals the less attractive, and Underperforms the least attractive investment opportunities. As of 2nd October 2012, U.S. and Canadian as well as European ratings are based on a stock’s total return relative to the analyst's coverage universe which consists of all companies covered by the analyst within the relevant sector, with Outperforms representing the most attractive, Neutrals the less attractive, and Underperforms the least attractive investment opportunities. For Latin American and non -Japan Asia stocks, ratings are based on a stock’s total return relative to the average total return of the relevant country or regional benchmark; Australia, New Zealand are, and prior to 2nd October 2012 U.S. and Canadian ratings were based on (1) a stock’s absolute total return potential to its current share price and (2) the relative attractiveness of a stock’s total return potential within an analyst’s coverage universe. For Australian and New Zealand stocks, 12-month rolling yield is incorporated in the absolute total return calculation and a 15% and a 7.5% threshold replace the 10-15% level in the Outperform and Underperform stock rating definitions, respectively. The 15% and 7.5% thresholds replace the +10-15% and -10-15% levels in the Neutral stock rating definition, respectively. Prior to 10th December 2012, Japanese ratings were based on a stock’s total return relative to the average total return of the relevant country or regional benchmark.
Restricted (R) : In certain circumstances, Credit Suisse policy and/or applicable law and regulations preclude certain types of communications, including an investment recommendation, during the course of Credit Suisse's engagement in an investment banking transaction and in certain other circumstances.
Volatility Indicator [V] : A stock is defined as volatile if the stock price has moved up or down by 20% or more in a month in at least 8 of the past 24 months or the analyst expects significant volatility going forward.
Analysts’ sector weightings are distinct from analysts’ stock ratings and are based on the analyst’s expectations for the fundamentals and/or valuation of the sector* relative to the group’s historic fundamentals and/or valuation:
Overweight : The analyst’s expectation for the sector’s fundamentals and/or valuation is favorable over the next 12 months.
Market Weight : The analyst’s expectation for the sector’s fundamentals and/or valuation is neutral over the next 12 months.

21 January 2013
Australian ESG/SRI 28
Underweight : The analyst’s expectation for the sector’s fundamentals and/or valuation is cautious over the next 12 months.
*An analyst’s coverage sector consists of all companies covered by the analyst within the relevant sector. An analyst may cover multiple sectors.
Credit Suisse's distribution of stock ratings (and banking clients) is:
Global Ratings Distribution
Rating Versus universe (%) Of which banking clients (%)
Outperform/Buy* 43% (53% banking clients)
Neutral/Hold* 38% (47% banking clients)
Underperform/Sell* 16% (41% banking clients)
Restricted 3%
*For purposes of the NYSE and NASD ratings distribution disclosure requirements, our stock ratings of Outperform, Neutral, an d Underperform most closely correspond to Buy, Hold, and Sell, respectively; however, the meanings are not the same, as our stock ratings are determined on a relative basis . (Please refer to definitions above.) An investor's decision to buy or sell a security should be based on investment objectives, current holdings, and other individual factors.
Credit Suisse’s policy is to update research reports as it deems appropriate, based on developments with the subject company, the sector or the market that may have a material impact on the research views or opinions stated herein.
Credit Suisse's policy is only to publish investment research that is impartial, independent, clear, fair and not misleading. For more detail please refer to Credit Suisse's Policies for Managing Conflicts of Interest in connection with Investment Research: http://www.csfb.com/research and analytics/disclaimer/managing_conflicts_disclaimer.html
Credit Suisse does not provide any tax advice. Any statement herein regarding any US federal tax is not intended or written to be used, and cannot be used, by any taxpayer for the purposes of avoiding any penalties.
Price Target: (12 months) for Brambles Limited (BXB.AX)
Method: We have set our $7.90 target price of BXB using a sum-of-the-parts methodology for each of the business units based on an earnings before interest tax and amortisation (EBITA) multiple relative to the market.
Risk: The critical risks associated with our forecasts, and hence our $7.90 target price for BXB, relates to the company being able to increase its growth profile, especially within CHEP as part of a global economic recovery. Also risk in management delivering a clear delivery of the strategy in CHEP USA to re-establish a growth path for new customer wins. Management also need to deliver strong cost saving benefits from the restructuring initiatives currently underway.
Price Target: (12 months) for Henderson group (HGG.AX)
Method: We set our A$2.40 (£1.57) target price on Henderson Group using an average our discounted cash flow (discount rate of 12.25%, 2.2% terminal growth rate after 10 years) and PE relative valuations ($2.55 and $2.25, respectively).
Risk: The risks to HGG achieving our A$2.40 (£1.57) target price relate to investment market volatility, investment market declines, fund outflows, expense overruns and poor investment performance (both HGG funds and market generally).
Price Target: (12 months) for Iluka Resources (ILU.AX)
Method: Our Iluka Resources (ILU.AX) target price is A$11.00/share, derived from 9-10x PE multiples and 4-5x EV/EBITDA multiples of forward earnings. Our DCF valuation of $11.60/share for the mineral sands operations uses a discount rate of 9.5% pa (nominal terms) derived from a post-tax weighted average cost of capital (WACC) under the following assumptions: Risk free rate of 5.3%; a market premium of 6%; Beta of 1.1; a targeted debt/equity ratio of 30/70 and 5.5% pa interest rate. Our nominal discount rate for the MAC royalty is 6.3% pa, being 100bp above the risk free rate as discussed in our initiation report.
Risk: The critical risks to Iluka achieving the target price of $11.00/share relate to mineral sands sales volumes, the prices that can be achieved for zircon, rutile and synthetic rutile, currency assumptions, operational issues related to mine projects, and cost issues in general.
Price Target: (12 months) for McMillan Shakespeare (MMS.AX)
Method: Our target price of $14.85 is based on an average of our discounted cash flow (DCF) and sum-of-the-parts valuation. The DCF assumes a risk free rate of 5.3%, market risk premium of 6% and a beta of 1.0 giving a weighted average cost of capital (WACC) of 11.3%. The sum-of-the-parts valuation applies a EV/EBIT relative premium for Remuneration Services for FY14E of 40% to the Small Industrials, and an average of EV/EBIT discount and price/book (P/BV) multiples for Asset Management of 10% and 1.1x, respectively.
Risk: The major risk to MMS achieving our earnings forecasts and target price of $14.85 are regulatory risks relating to potential changes in FBT legislation, proposed accounting changes for operating leases and fluctuations in residual values in its fleet leasing business.

21 January 2013
Australian ESG/SRI 29
Price Target: (12 months) for Perseus Mining (PRU.AX)
Method: Our $3.20/share target price is based on our raw NPV for Perseus Mining. The majority of our NPV is based on a 8mtpa production scenario for the Edikan Gold Project. We use a 5% discount rate (as for all our gold exposures) and CS house gold price and FX assumptions.
Risk: The risks associated with achieving our $3.20/share TP include geopolitical risk, construction risk, commissioning risk, operational risk, management risk, financing risk and also commodity price risk. If any of these turn out to be less favourable than what we have assumed, then our valuation will reduce.
Price Target: (12 months) for Tabcorp Holdings (TAH.AX)
Method: Our A$3.30 target price for TAH.AX reflects a 6% discount to our A$3.51 DCF due to uncertainty in a number of key areas: NSW wagering licence exclusivity renewal, compensation from Vic Government pertaining to loss of Vic gaming licence in August 2012, and an uncertainty around the full profitability of VIC Keno and NSW automated racing. Our DCF of A$3.51 incorporates a beta of 0.9 and a weighted average cost of capital of 9.0%.
Risk: Risks to our A$3.30 target price include a future court case that awards TAH full compensation of over A$650m for loss of Vic gaming licence. Negative company specific risks include increased competition from new wagering operators and less revenue than modelled in our VIC keno and NSW automated racing new business lines.
Price Target: (12 months) for Treasury Wine (TWE.AX)
Method: Our discounted cash flow (DCF) valuation analysis for TWE.AX is based on Credit Suisse's exchange rate assumptions which generally applies the forward curve and incorporates a cost of capital of 9.6%. The competitive advantage period, whereby the company exceeds the cost of capital is 30 years. The company's cash flows, because they are predisposed to exchange rate movements, are expected to have an equity beta of 1.2x. Our target price is $3.50.
Risk: The key risks to TWE achieving our A$3.50 target price relates to US wine pricing and Australian wine pricing exceeding our expectations in 2012 and 2013. The AUD could fall against the USD and GBP and that could cause TWE to continue to trade higher than our valuation.
Price Target: (12 months) for Aurora Oil & Gas (AUT.AX)
Method: Our target price of $4.10 for Aurora Oil & Gas is set in line with our risked sum-of-the-parts discounted cash flow valuation using Credit Suisse oil price, gas price and FX assumptions. We probability-weight our base valuation at 100%, which assumes full field development proceeds as outlined by Netherland Sewell & Associates Inc (NSAI). We also include 75% probability of achieving a 20% increase in higher production rates, with well outperforming NSAI assumptions. We also include 75% risk-weighting on moving from 80 acre well spacing to 60 acre spacing, which is being currently trialed.
Risk: The critical risks associated with our $4.10 AUT target price, forecasts and valuation, relate to commodity price assumptions, the pace of future drilling activity and production rates from future wells. To a lesser extent, the sector is experiencing some short term upside pressure to operating costs and capex estimates as drilling and fracture stimulation activities ramp up in the Eagle Ford Shale. Longer-term risk in our opinion relates to the company's use of free cash flow, with the company stating that it intends to also grow through the acquisitions of new acreage positions.
Price Target: (12 months) for carsales.com.au (CRZ.AX)
Method: Our target price of $8.80 per share is based on our Sum of the Parts valuation of $8.80 per share
Risk: The main risks to our $8.80 per share target price for CRZ are changes to advertising spend, changes to motor vehicle sales and potential acquisitions.
Price Target: (12 months) for Echo Entertainment (EGP.AX)
Method: Our target price on Echo Entertainment (EGP.AX) is A$3.30 and approximates our discounted cash flow valuation (DCF) of A$3.30 less the next 12 months dividends (A$0.04) which incorporates a weighted average cost of capital of 9.4%. The company's cash flows are not expected to be more volatile than the broader market. We therefore ascribe a beta of 0.95. We also compare our DCF valuation to a set of comparable companies. We are comfortable with 8.0x forward EBITDA as that is consistent with the implied EBITDA multiples for our key comparable valuation.
Risk: The key risks to Echo Entertainment (EGP.AX) achieving our A$3.30 target price relates to (1) the possibility that potential suitors lose interest in acquiring EGP.AX and (2) economic weakness that causes a contraction in the Asian VIP gaming market
Price Target: (12 months) for Flight Centre (FLT.AX)
Method: We set our FLT target price by applying a parity rating relative to the XSI based on FY13 earnings, appropriate given FLT's long-run average PE relative.

21 January 2013
Australian ESG/SRI 30
Risk: The risks to our target price on FLT are associated with our forecast cash flows. These include lower than expected TTV growth or commission margins across the business.
Please refer to the firm's disclosure website at www.credit-suisse.com/researchdisclosures for the definitions of abbreviations typically used in the target price method and risk sections.
See the Companies Mentioned section for full company names
The subject company (HGG.AX, ILU.AX, MMS.AX, PRU.AX, AUT.AX) currently is, or was during the 12-month period preceding the date of distribution of this report, a client of Credit Suisse.
Credit Suisse provided investment banking services to the subject company (MMS.AX, AUT.AX) within the past 12 months.
Credit Suisse provided non-investment banking services to the subject company (HGG.AX, PRU.AX, AUT.AX) within the past 12 months
Credit Suisse has managed or co-managed a public offering of securities for the subject company (AUT.AX) within the past 12 months.
Credit Suisse has received investment banking related compensation from the subject company (MMS.AX, AUT.AX) within the past 12 months
Credit Suisse expects to receive or intends to seek investment banking related compensation from the subject company (ILU.AX, MMS.AX, PRU.AX, TWE.AX, AUT.AX, CRZ.AX) within the next 3 months.
Credit Suisse has received compensation for products and services other than investment banking services from the subject company (HGG.AX, PRU.AX, AUT.AX) within the past 12 months
As of the end of the preceding month, Credit Suisse beneficially own 1% or more of a class of common equity securities of (EGP.AX).
Credit Suisse has a material conflict of interest with the subject company (HGG.AX). Credit Suisse (Australia) Ltd are currently assisting Henderson Group in connection with a buy-back of Henderson Group's CDI's.
Important Regional Disclosures
Singapore recipients should contact Credit Suisse AG, Singapore Branch for any matters arising from this research report.
The analyst(s) involved in the preparation of this report have not visited the material operations of the subject company (BXB.AX, HGG.AX, ILU.AX, MMS.AX, PRU.AX, TAH.AX, TWE.AX, AUT.AX, CRZ.AX, EGP.AX, FLT.AX) within the past 12 months
Restrictions on certain Canadian securities are indicated by the following abbreviations: NVS--Non-Voting shares; RVS--Restricted Voting Shares; SVS--Subordinate Voting Shares.
Individuals receiving this report from a Canadian investment dealer that is not affiliated with Credit Suisse should be advised that this report may not contain regulatory disclosures the non-affiliated Canadian investment dealer would be required to make if this were its own report.
For Credit Suisse Securities (Canada), Inc.'s policies and procedures regarding the dissemination of equity research, please visit http://www.csfb.com/legal_terms/canada_research_policy.shtml.
As of the date of this report, Credit Suisse acts as a market maker or liquidity provider in the equities securities that are the subject of this report.
Principal is not guaranteed in the case of equities because equity prices are variable.
Commission is the commission rate or the amount agreed with a customer when setting up an account or at any time after that.
To the extent this is a report authored in whole or in part by a non-U.S. analyst and is made available in the U.S., the following are important disclosures regarding any non-U.S. analyst contributors: The non-U.S. research analysts listed below (if any) are not registered/qualified as research analysts with FINRA. The non-U.S. research analysts listed below may not be associated persons of CSSU and therefore may not be subject to the NASD Rule 2711 and NYSE Rule 472 restrictions on communications with a subject company, public appearances and trading securities held by a research analyst account.
Credit Suisse Equities (Australia) Limited .................................................................................................................................. Sandra McCullagh
Important MSCI Disclosures
The MSCI sourced information is the exclusive property of Morgan Stanley Capital International Inc. (MSCI). Without prior written permission of MSCI, this information and any other MSCI intellectual property may not be reproduced, re-disseminated or used to create and financial products, including any indices. This information is provided on an "as is" basis. The user assumes the entire risk of any use made of this information. MSCI, its affiliates and any third party involved in, or related to, computing or compiling the information hereby expressly disclaim all warranties of originality, accuracy, completeness, merchantability or fitness for a particular purpose with respect to any of this information. Without limiting any of the foregoing, in no event shall MSCI, any of its affiliates or any third party involved in, or related to, computing or compiling the information have any liability for any damages of any kind. MSCI, Morgan Stanley Capital International and the MSCI indexes are services marks of MSCI and its affiliates.
The Global Industry Classification Standard (GICS) was developed by and is the exclusive property of Morgan Stanley Capital International Inc. and Standard & Poor’s. GICS is a service mark of MSCI and S&P and has been licensed for use by Credit Suisse.

21 January 2013
Australian ESG/SRI 31
Important Credit Suisse HOLT Disclosures
With respect to the analysis in this report based on the Credit Suisse HOLT methodology, Credit Suisse certifies that (1) the views expressed in this report accurately reflect the Credit Suisse HOLT methodology and (2) no part of the Firm’s compensation was, is, or will be directly related to the specific views disclosed in this report
The Credit Suisse HOLT methodology does not assign ratings to a security. It is an analytical tool that involves use of a set of proprietary quantitative algorithms and warranted value calculations, collectively called the Credit Suisse HOLT valuation model, that are consistently applied to all the companies included in its database. Third-part data (including consensus earnings estimates) are systematically translated into a number of default algorithms available in the Credit Suisse HOLT valuation model. The source financial statement, pricing, and earnings data provided by outside data vendors are subject to quality control and may also be adjusted to more closely measure the underlying economics of firm performance. The adjustments provide consistency when analyzing a single company across time, or analyzing multiple companies across industries or national borders. The default scenario that is produced by the Credit Suisse HOLT valuation model establishes the baseline valuation for a security, and a user then may adjust the default variables to produce alternative scenarios, any of which could occur.
Additional information about the Credit Suisse HOLT methodology is available on request.
The Credit Suisse HOLT methodology does not assign a price target to a security. The default scenario that is produced by the Credit Suisse HOLT valuation model establishes a warranted price for a security, and as the third-party data are updated, the warranted price may also change. The default variable may also be adjusted to produce alternative warranted prices, any of which could occur.
CFROI®, HOLT, HOLTfolio, ValueSearch, AggreGator, Signal Flag and “Powered by HOLT” are trademarks or service marks or registered trademarks or registered service marks of Credit Suisse or its affiliates in the United States and other countries. HOLT is a corporate performance and valuation advisory service of Credit Suisse.
For Credit Suisse disclosure information on other companies mentioned in this report, please visit the website at www.credit-suisse.com/researchdisclosures or call +1 (877) 291-2683.

21 January 2013
Australian ESG/SRI 32
References in this report to Credit Suisse include all of the subsidiaries and affiliates of Credit Suisse operating under its investment banking division. For more information on our structure, please use the following link: https://www.credit-suisse.com/who_we_are/en/.This report may contain material that is not directed to, or intended for distribution to or use by, any person or entity who is a citizen or resident of or located in any locality, state, country or other jurisdiction where such distribution, publication, availability or use would be contrary to law or regulation or which would subject Credit Suisse AG or its affiliates ("CS") to any registration or licensing requirement within such jurisdiction. All material presented in this report, unless specifically indicated otherwise, is under copyright to CS. None of the material, nor its content, nor any copy of it, may be altered in any way, transmitted to, copied or distributed to any other party, without the prior express written permission of CS. All trademarks, service marks and logos used in this report are trademarks or service marks or registered trademarks or service marks of CS or its affiliates. The information, tools and material presented in this report are provided to you for information purposes only and are not to be used or considered as an offer or the solicitation of an offer to sell or to buy or subscribe for securities or other financial instruments. CS may not have taken any steps to ensure that the securities referred to in this report are suitable for any particular investor. CS will not treat recipients of this report as its customers by virtue of their receiving this report. The investments and services contained or referred to in this report may not be suitable for you and it is recommended that you consult an independent investment advisor if you are in doubt about such investments or investment services. Nothing in this report constitutes investment, legal, accounting or tax advice, or a representation that any investment or strategy is suitable or appropriate to your individual circumstances, or otherwise constitutes a personal recommendation to you. CS does not advise on the tax consequences of investments and you are advised to contact an independent tax adviser. Please note in particular that the bases and levels of taxation may change. Information and opinions presented in this report have been obtained or derived from sources believed by CS to be reliable, but CS makes no representation as to their accuracy or completeness. CS accepts no liability for loss arising from the use of the material presented in this report, except that this exclusion of liability does not apply to the extent that such liability arises under specific statutes or regulations applicable to CS. This report is not to be relied upon in substitution for the exercise of independent judgment. CS may have issued, and may in the future issue, other communications that are inconsistent with, and reach different conclusions from, the information presented in this report. Those communications reflect the different assumptions, views and analytical methods of the analysts who prepared them and CS is under no obligation to ensure that such other communications are brought to the attention of any recipient of this report. CS may, to the extent permitted by law, participate or invest in financing transactions with the issuer(s) of the securities referred to in this report, perform services for or solicit business from such issuers, and/or have a position or holding, or other material interest, or effect transactions, in such securities or options thereon, or other investments related thereto. In addition, it may make markets in the securities mentioned in the material presented in this report. CS may have, within the last three years, served as manager or co-manager of a public offering of securities for, or currently may make a primary market in issues of, any or all of the entities mentioned in this report or may be providing, or have provided within the previous 12 months, significant advice or investment services in relation to the investment concerned or a related investment. Additional information is, subject to duties of confidentiality, available on request. Some investments referred to in this report will be offered solely by a single entity and in the case of some investments solely by CS, or an associate of CS or CS may be the only market maker in such investments. Past performance should not be taken as an indication or guarantee of future performance, and no representation or warranty, express or implied, is made regarding future performance. Information, opinions and estimates contained in this report reflect a judgment at its original date of publication by CS and are subject to change without notice. The price, value of and income from any of the securities or financial instruments mentioned in this report can fall as well as rise. The value of securities and financial instruments is subject to exchange rate fluctuation that may have a positive or adverse effect on the price or income of such securities or financial instruments. Investors in securities such as ADR's, the values of which are influenced by currency volatility, effectively assume this risk. Structured securities are complex instruments, typically involve a high degree of risk and are intended for sale only to sophisticated investors who are capable of understanding and assuming the risks involved. The market value of any structured security may be affected by changes in economic, financial and political factors (including, but not limited to, spot and forward interest and exchange rates), time to maturity, market conditions and volatility, and the credit quality of any issuer or reference issuer. Any investor interested in purchasing a structured product should conduct their own investigation and analysis of the product and consult with their own professional advisers as to the risks involved in making such a purchase. Some investments discussed in this report may have a high level of volatility. High volatility investments may experience sudden and large falls in their value causing losses when that investment is realised. Those losses may equal your original investment. Indeed, in the case of some investments the potential losses may exceed the amount of initial investment and, in such circumstances, you may be required to pay more money to support those losses. Income yields from investments may fluctuate and, in consequence, initial capital paid to make the investment may be used as part of that income yield. Some investments may not be readily realisable and it may be difficult to sell or realise those investments, similarly it may prove difficult for you to obtain reliable information about the value, or risks, to which such an investment is exposed. This report may provide the addresses of, or contain hyperlinks to, websites. Except to the extent to which the report refers to website material of CS, CS has not reviewed any such site and takes no responsibility for the content contained therein. Such address or hyperlink (including addresses or hyperlinks to CS's own website material) is provided solely for your convenience and information and the content of any such website does not in any way form part of this document. Accessing such website or following such link through this report or CS's website shall be at your own risk. This report is issued and distributed in Europe (except Switzerland) by Credit Suisse Securities (Europe) Limited, One Cabot Square, London E14 4QJ, England, which is regulated in the United Kingdom by The Financial Services Authority ("FSA"). This report is being distributed in Germany by Credit Suisse Securities (Europe) This report is being distributed in the United States and Canada by Credit Suisse Securities (USA) LLC; in Switzerland by Credit Suisse AG; in Brazil by Banco de Investimentos Credit Suisse (Brasil) S.A or its affiliates; in Mexico by Banco Credit Suisse (México), S.A. (transactions related to the securities mentioned in this report will only be effected in compliance with applicable regulation); in Japan by Credit Suisse Securities (Japan) Limited, Financial Instruments Firm, Director-General of Kanto Local Finance Bureau (Kinsho) No. 66, a member of Japan Securities Dealers Association, The Financial Futures Association of Japan, Japan Investment Advisers Association, Type II Financial Instruments Firms Association; elsewhere in Asia/ Pacific by whichever of the following is the appropriately authorised entity in the relevant jurisdiction: Credit Suisse (Hong Kong) Limited, Credit Suisse Equities (Australia) Limited, Credit Suisse Securities (Thailand) Limited, Credit Suisse Securities (Malaysia) Sdn Bhd, Credit Suisse AG, Singapore Branch, Credit Suisse Securities (India) Private Limited regulated by the Securities and Exchange Board of India (registration Nos. INB230970637; INF230970637; INB010970631; INF010970631), having registered address at 9th Floor, Ceejay House, Dr.A.B. Road, Worli, Mumbai - 18, India, T- +91-22 6777 3777, Credit Suisse Securities (Europe) Limited, Seoul Branch, Credit Suisse AG, Taipei Securities Branch, PT Credit Suisse Securities Indonesia, Credit Suisse Securities (Philippines ) Inc., and elsewhere in the world by the relevant authorised affiliate of the above. Research on Taiwanese securities produced by Credit Suisse AG, Taipei Securities Branch has been prepared by a registered Senior Business Person. Research provided to residents of Malaysia is authorised by the Head of Research for Credit Suisse Securities (Malaysia) Sdn Bhd, to whom they should direct any queries on +603 2723 2020. This research may not conform to Canadian disclosure requirements. In jurisdictions where CS is not already registered or licensed to trade in securities, transactions will only be effected in accordance with applicable securities legislation, which will vary from jurisdiction to jurisdiction and may require that the trade be made in accordance with applicable exemptions from registration or licensing requirements. Non-U.S. customers wishing to effect a transaction should contact a CS entity in their local jurisdiction unless governing law permits otherwise. U.S. customers wishing to effect a transaction should do so only by contacting a representative at Credit Suisse Securities (USA) LLC in the U.S. Please note that this research was originally prepared and issued by CS for distribution to their market professional and institutional investor customers. Recipients who are not market professional or institutional investor customers of CS should seek the advice of their independent financial advisor prior to taking any investment decision based on this report or for any necessary explanation of its contents. This research may relate to investments or services of a person outside of the UK or to other matters which are not regulated by the FSA or in respect of which the protections of the FSA for private customers and/or the UK compensation scheme may not be available, and further details as to where this may be the case are available upon request in respect of this report. CS may provide various services to US municipal entities or obligated persons ("municipalities"), including suggesting individual transactions or trades and entering into such transactions. Any services CS provides to municipalities are not viewed as "advice" within the meaning of Section 975 of the Dodd-Frank Wall Street Reform and Consumer Protection Act. CS is providing any such services and related information solely on an arm's length basis and not as an advisor or fiduciary to the municipality. In connection with the provision of the any such services, there is no agreement, direct or indirect, between any municipality (including the officials, management, employees or agents thereof) and CS for CS to provide advice to the municipality. Municipalities should consult with their financial, accounting and legal advisors regarding any such services provided by CS. In addition, CS is not acting for direct or indirect compensation to solicit the municipality on behalf of an unaffiliated broker, dealer, municipal securities dealer, municipal advisor, or investment adviser for the purpose of obtaining or retaining an engagement by the municipality for or in connection with Municipal Financial Products, the issuance of municipal securities, or of an investment adviser to provide investment advisory services to or on behalf of the municipality. If this report is being distributed by a financial institution other than Credit Suisse AG, or its affiliates, that financial institution is solely responsible for distribution. Clients of that institution should contact that institution to effect a transaction in the securities mentioned in this report or require further information. This report does not constitute investment advice by Credit Suisse to the clients of the distributing financial institution, and neither Credit Suisse AG, its affiliates, and their respective officers, directors and employees accept any liability whatsoever for any direct or consequential loss arising from their use of this report or its content. Principal is not guaranteed. Commission is the commission rate or the amount agreed with a customer when setting up an account or at any time after that.
Copyright © 2013 CREDIT SUISSE AG and/or its affiliates. All rights reserved.
Investment principal on bonds can be eroded depending on sale price or market price. In addition, there are bonds on which investment principal can be eroded due to changes in redemption amounts. Care is required when investing in such instruments.
When you purchase non-listed Japanese fixed income securities (Japanese government bonds, Japanese municipal bonds, Japanese government guaranteed bonds, Japanese corporate bonds) from CS as a seller, you will be requested to pay the purchase price only.
SRI 2013 01 21 – Banks down REITS up RIO down to BB.doc