Embed Size (px)
Citation preview

49
AUSTRALIAN SECURITIES AND INVESTMENTS COMMISSION
Section 1: Agency overview and resources ............................................................. 51 1.1 Strategic direction ........................................................................................... 51 1.2 Agency resource statement ............................................................................ 52 1.3 Agency measures table .................................................................................. 53 1.4 Additional estimates and variations ................................................................ 55 1.5 Breakdown of additional estimates by Appropriation Bill ................................ 56 Section 2: Revisions to agency outcomes and planned performance .................. 57 2.1 Resources and performance information ....................................................... 57 Section 3: Explanatory tables and budgeted financial statements ....................... 59 3.1 Explanatory tables .......................................................................................... 59 3.2 Budgeted financial statements........................................................................ 60

Agency Additional Estimates Statements — ASIC
51
AUSTRALIAN SECURITIES AND INVESTMENTS COMMISSION
Section 1: Agency overview and resources
1.1 STRATEGIC DIRECTION
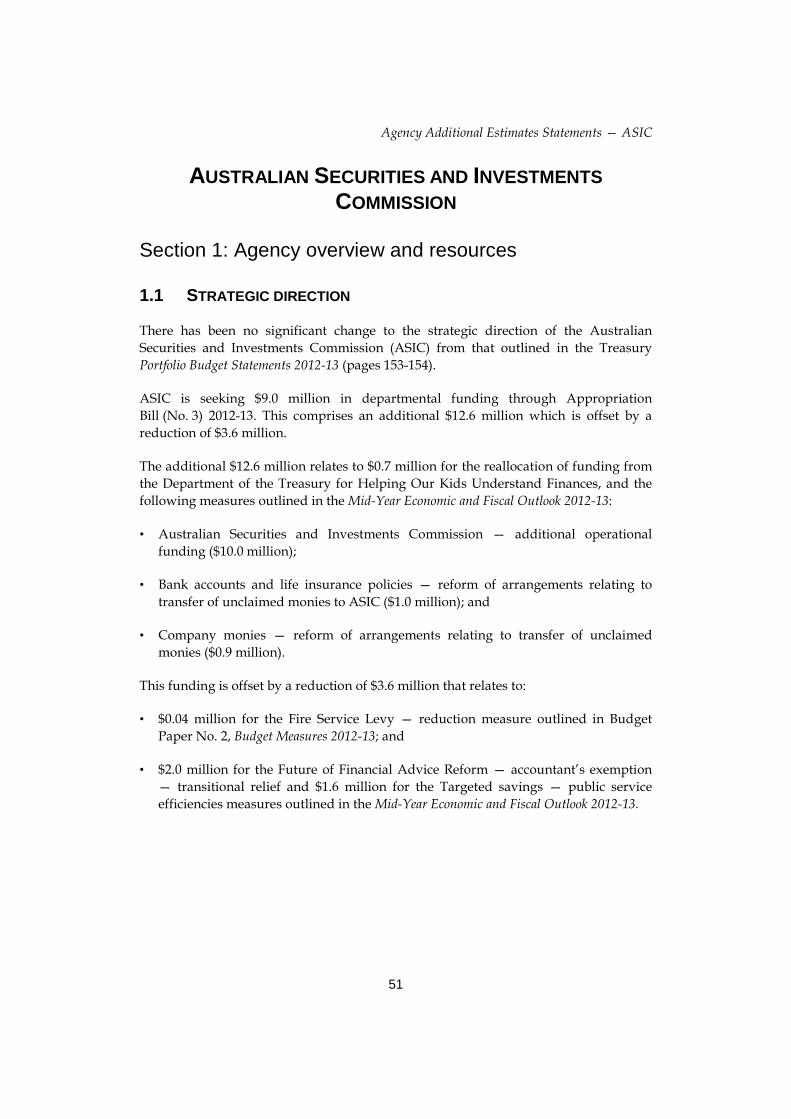
There has been no significant change to the strategic direction of the Australian Securities and Investments Commission (ASIC) from that outlined in the Treasury Portfolio Budget Statements 2012-13 (pages 153-154).
ASIC is seeking $9.0 million in departmental funding through Appropriation Bill (No. 3) 2012-13. This comprises an additional $12.6 million which is offset by a reduction of $3.6 million.
The additional $12.6 million relates to $0.7 million for the reallocation of funding from the Department of the Treasury for Helping Our Kids Understand Finances, and the following measures outlined in the Mid-Year Economic and Fiscal Outlook 2012-13:
• Australian Securities and Investments Commission — additional operational funding ($10.0 million);
• Bank accounts and life insurance policies — reform of arrangements relating to transfer of unclaimed monies to ASIC ($1.0 million); and
• Company monies — reform of arrangements relating to transfer of unclaimed monies ($0.9 million).
This funding is offset by a reduction of $3.6 million that relates to:
• $0.04 million for the Fire Service Levy — reduction measure outlined in Budget Paper No. 2, Budget Measures 2012-13; and
• $2.0 million for the Future of Financial Advice Reform — accountant’s exemption — transitional relief and $1.6 million for the Targeted savings — public service efficiencies measures outlined in the Mid-Year Economic and Fiscal Outlook 2012-13.
Agency Additional Estimates Statements — ASIC
52
1.2 AGENCY RESOURCE STATEMENT
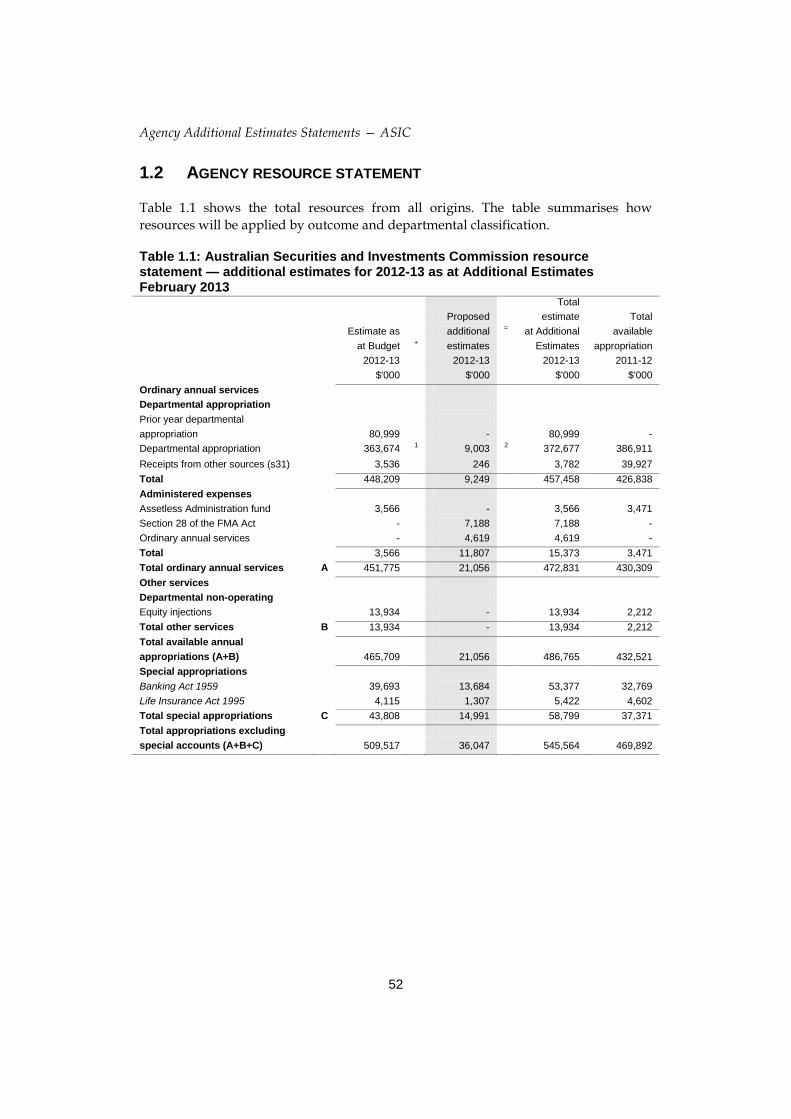
Table 1.1 shows the total resources from all origins. The table summarises how resources will be applied by outcome and departmental classification.
Table 1.1: Australian Securities and Investments Commission resource statement — additional estimates for 2012-13 as at Additional Estimates February 2013
Total Proposed estimate Total Estimate as additional = at Additional available at Budget + estimates Estimates appropriation 2012-13 2012-13 2012-13 2011-12 $'000 $'000 $'000 $'000
Ordinary annual services Departmental appropriation Prior year departmental appropriation 80,999 - 80,999 - Departmental appropriation 363,674 1 9,003 2 372,677 386,911 Receipts from other sources (s31) 3,536 246 3,782 39,927 Total 448,209 9,249 457,458 426,838 Administered expenses Assetless Administration fund 3,566 - 3,566 3,471 Section 28 of the FMA Act - 7,188 7,188 - Ordinary annual services - 4,619 4,619 - Total 3,566 11,807 15,373 3,471 Total ordinary annual services A 451,775 21,056 472,831 430,309 Other services Departmental non-operating Equity injections 13,934 - 13,934 2,212 Total other services B 13,934 - 13,934 2,212 Total available annual appropriations (A+B) 465,709 21,056 486,765 432,521 Special appropriations Banking Act 1959 39,693 13,684 53,377 32,769 Life Insurance Act 1995 4,115 1,307 5,422 4,602 Total special appropriations C 43,808 14,991 58,799 37,371 Total appropriations excluding special accounts (A+B+C) 509,517 36,047 545,564 469,892

Agency Additional Estimates Statements — ASIC
53
Table 1.1: Australian Securities and Investments Commission resource statement — additional estimates for 2012-13 as at Additional Estimates February 2013 (continued)
Total Proposed estimate Total Estimate as additional = at Additional available at Budget + estimates Estimates appropriation 2012-13 2012-13 2012-13 2011-12 $'000 $'000 $'000 $'000
Special accounts Opening balance 39,596 - 39,596 99,794 Appropriation receipts 30,000 - 30,000 30,000 Non-appropriation receipts to special accounts 109,000 163,560 272,560 305,924 Total special account D 178,596 163,560 342,156 435,718 Total resourcing (A+B+C+D) 688,113 199,607 887,720 905,610 Less receipts from other sources and credited to special accounts 30,000 - 30,000 30,000 Total net resourcing for ASIC 658,113 199,607 857,720 875,610 1. Includes $15.8 million in 2012-13 for the Departmental Capital Budget (also refer to Table 3.2.5). 2. Appropriation Bill (No. 3) 2012-13.
1.3 AGENCY MEASURES TABLE
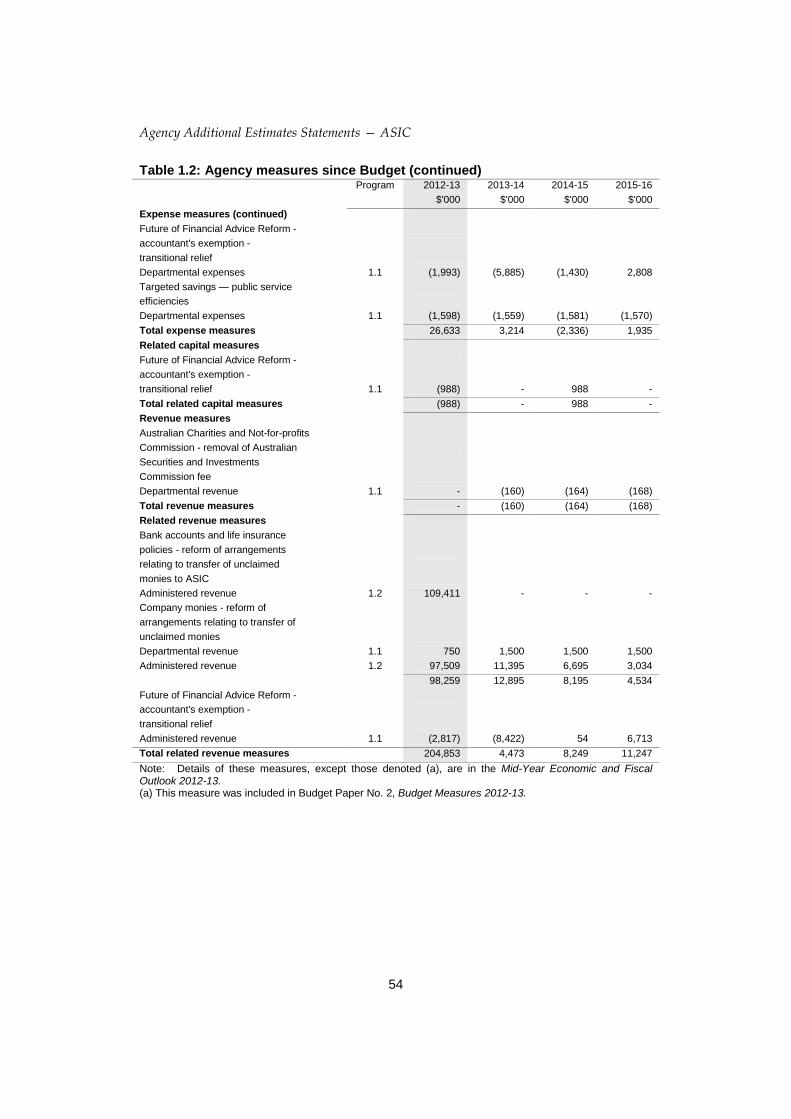
Table 1.2 summarises new Government measures taken since the 2012-13 Budget.
Table 1.2: Agency measures since Budget Program 2012-13 2013-14 2014-15 2015-16 $'000 $'000 $'000 $'000
Expense measures Australian Securities and Investments Commission - additional operational funding Departmental expenses 1.1 10,000 10,000 - - Bank accounts and life insurance policies - reform of arrangements relating to transfer of unclaimed monies to ASIC Departmental expenses 1.1 1,041 343 346 350 Administered expenses 1.2 14,965 - - - 16,006 343 346 350 Company monies - reform of arrangements relating to transfer of unclaimed monies Departmental expenses 1.1 921 1,856 1,872 1,890 Departmental revenue 1.1 (750) (1,500) (1,500) (1,500) Administered expenses 1.2 4,086 - - - 4,257 356 372 390 Fire Service Levy — reduction(a) Departmental expenses 1.1 (39) (41) (43) (43)
Agency Additional Estimates Statements — ASIC
54
Table 1.2: Agency measures since Budget (continued) Program 2012-13 2013-14 2014-15 2015-16 $'000 $'000 $'000 $'000
Expense measures (continued) Future of Financial Advice Reform - accountant's exemption - transitional relief Departmental expenses 1.1 (1,993) (5,885) (1,430) 2,808 Targeted savings — public service efficiencies Departmental expenses 1.1 (1,598) (1,559) (1,581) (1,570) Total expense measures 26,633 3,214 (2,336) 1,935 Related capital measures Future of Financial Advice Reform - accountant's exemption - transitional relief 1.1 (988) - 988 - Total related capital measures (988) - 988 - Revenue measures Australian Charities and Not-for-profits Commission - removal of Australian Securities and Investments Commission fee Departmental revenue 1.1 - (160) (164) (168) Total revenue measures - (160) (164) (168) Related revenue measures Bank accounts and life insurance policies - reform of arrangements relating to transfer of unclaimed monies to ASIC Administered revenue 1.2 109,411 - - - Company monies - reform of arrangements relating to transfer of unclaimed monies Departmental revenue 1.1 750 1,500 1,500 1,500 Administered revenue 1.2 97,509 11,395 6,695 3,034 98,259 12,895 8,195 4,534 Future of Financial Advice Reform - accountant's exemption - transitional relief Administered revenue 1.1 (2,817) (8,422) 54 6,713 Total related revenue measures 204,853 4,473 8,249 11,247 Note: Details of these measures, except those denoted (a), are in the Mid-Year Economic and Fiscal Outlook 2012-13. (a) This measure was included in Budget Paper No. 2, Budget Measures 2012-13.
Agency Additional Estimates Statements — ASIC
55
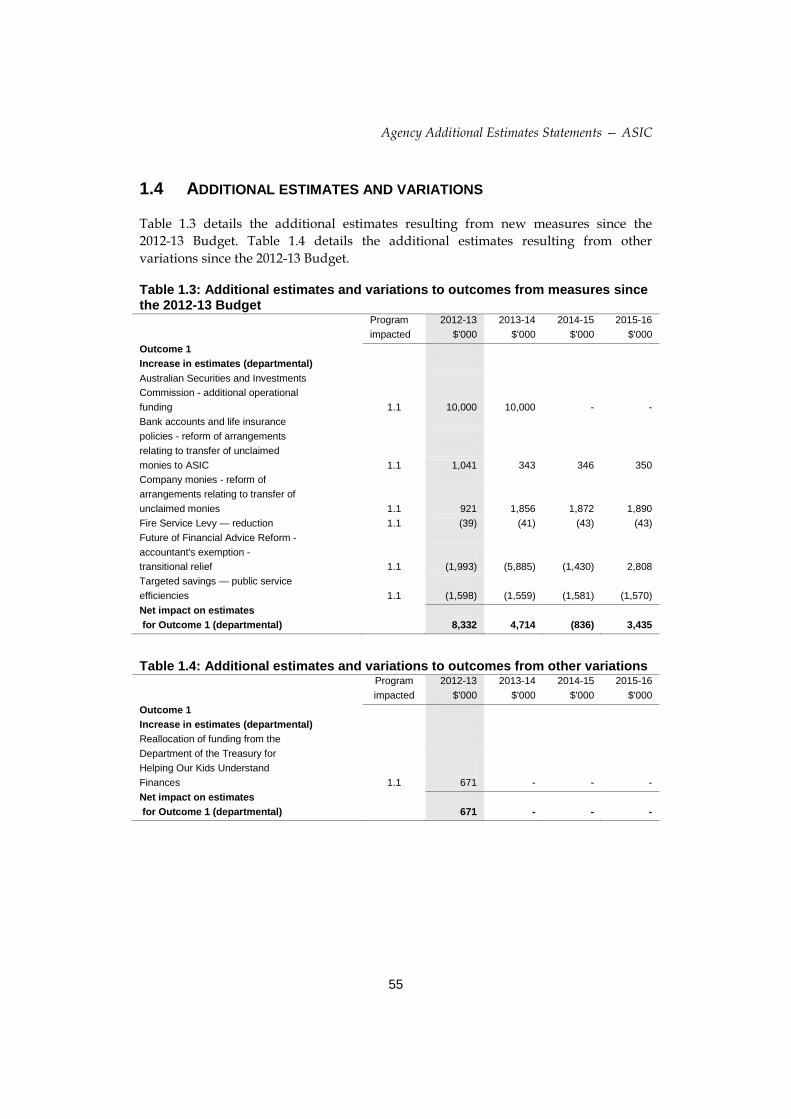
1.4 ADDITIONAL ESTIMATES AND VARIATIONS
Table 1.3 details the additional estimates resulting from new measures since the 2012-13 Budget. Table 1.4 details the additional estimates resulting from other variations since the 2012-13 Budget.
Table 1.3: Additional estimates and variations to outcomes from measures since the 2012-13 Budget
Program 2012-13 2013-14 2014-15 2015-16 impacted $'000 $'000 $'000 $'000
Outcome 1 Increase in estimates (departmental) Australian Securities and Investments Commission - additional operational funding 1.1 10,000 10,000 - - Bank accounts and life insurance policies - reform of arrangements relating to transfer of unclaimed monies to ASIC 1.1 1,041 343 346 350 Company monies - reform of arrangements relating to transfer of unclaimed monies 1.1 921 1,856 1,872 1,890 Fire Service Levy — reduction 1.1 (39) (41) (43) (43) Future of Financial Advice Reform - accountant's exemption - transitional relief 1.1 (1,993) (5,885) (1,430) 2,808 Targeted savings — public service efficiencies 1.1 (1,598) (1,559) (1,581) (1,570) Net impact on estimates for Outcome 1 (departmental) 8,332 4,714 (836) 3,435
Table 1.4: Additional estimates and variations to outcomes from other variations Program 2012-13 2013-14 2014-15 2015-16 impacted $'000 $'000 $'000 $'000
Outcome 1 Increase in estimates (departmental) Reallocation of funding from the Department of the Treasury for Helping Our Kids Understand Finances 1.1 671 - - - Net impact on estimates for Outcome 1 (departmental) 671 - - -
Agency Additional Estimates Statements — ASIC
56
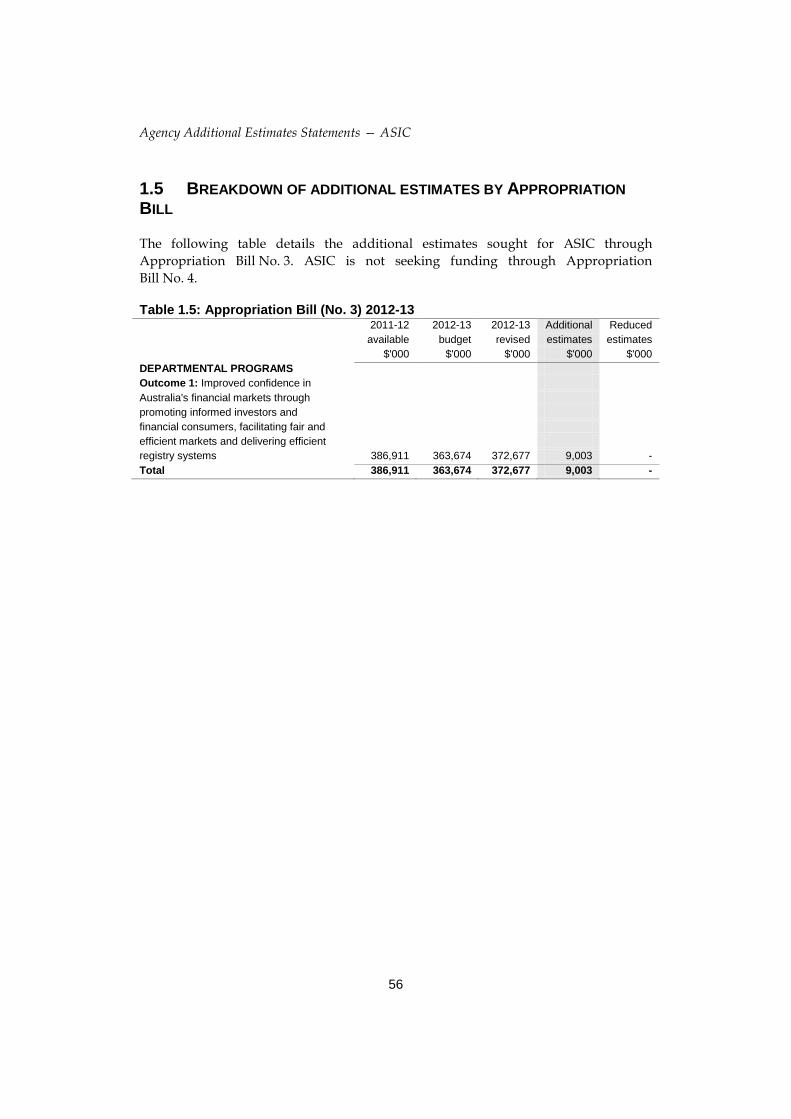
1.5 BREAKDOWN OF ADDITIONAL ESTIMATES BY APPROPRIATION BILL
The following table details the additional estimates sought for ASIC through Appropriation Bill No. 3. ASIC is not seeking funding through Appropriation Bill No. 4.
Table 1.5: Appropriation Bill (No. 3) 2012-13 2011-12 2012-13 2012-13 Additional Reduced available budget revised estimates estimates $'000 $'000 $'000 $'000 $'000
DEPARTMENTAL PROGRAMS Outcome 1: Improved confidence in Australia's financial markets through promoting informed investors and financial consumers, facilitating fair and efficient markets and delivering efficient registry systems 386,911 363,674 372,677 9,003 - Total 386,911 363,674 372,677 9,003 -
Agency Additional Estimates Statements — ASIC
57
Section 2: Revisions to agency outcomes and planned performance
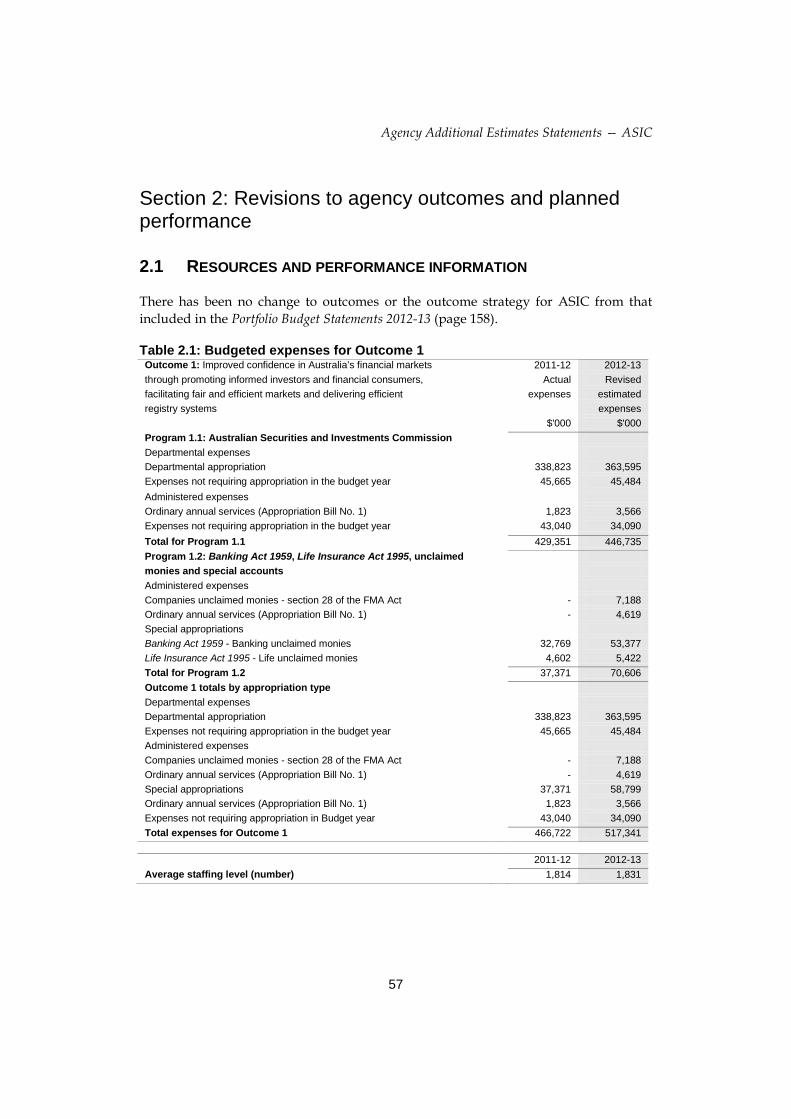
2.1 RESOURCES AND PERFORMANCE INFORMATION
There has been no change to outcomes or the outcome strategy for ASIC from that included in the Portfolio Budget Statements 2012-13 (page 158).
Table 2.1: Budgeted expenses for Outcome 1 Outcome 1: Improved confidence in Australia’s financial markets 2011-12 2012-13 through promoting informed investors and financial consumers, Actual Revised facilitating fair and efficient markets and delivering efficient expenses estimated registry systems expenses
$'000 $'000 Program 1.1: Australian Securities and Investments Commission Departmental expenses Departmental appropriation 338,823 363,595 Expenses not requiring appropriation in the budget year 45,665 45,484 Administered expenses Ordinary annual services (Appropriation Bill No. 1) 1,823 3,566 Expenses not requiring appropriation in the budget year 43,040 34,090 Total for Program 1.1 429,351 446,735 Program 1.2: Banking Act 1959, Life Insurance Act 1995, unclaimed monies and special accounts Administered expenses Companies unclaimed monies - section 28 of the FMA Act - 7,188 Ordinary annual services (Appropriation Bill No. 1) - 4,619 Special appropriations Banking Act 1959 - Banking unclaimed monies 32,769 53,377 Life Insurance Act 1995 - Life unclaimed monies 4,602 5,422 Total for Program 1.2 37,371 70,606 Outcome 1 totals by appropriation type Departmental expenses Departmental appropriation 338,823 363,595 Expenses not requiring appropriation in the budget year 45,665 45,484 Administered expenses Companies unclaimed monies - section 28 of the FMA Act - 7,188 Ordinary annual services (Appropriation Bill No. 1) - 4,619 Special appropriations 37,371 58,799 Ordinary annual services (Appropriation Bill No. 1) 1,823 3,566 Expenses not requiring appropriation in Budget year 43,040 34,090 Total expenses for Outcome 1 466,722 517,341
2011-12 2012-13
Average staffing level (number) 1,814 1,831
Agency Additional Estimates Statements — ASIC
58
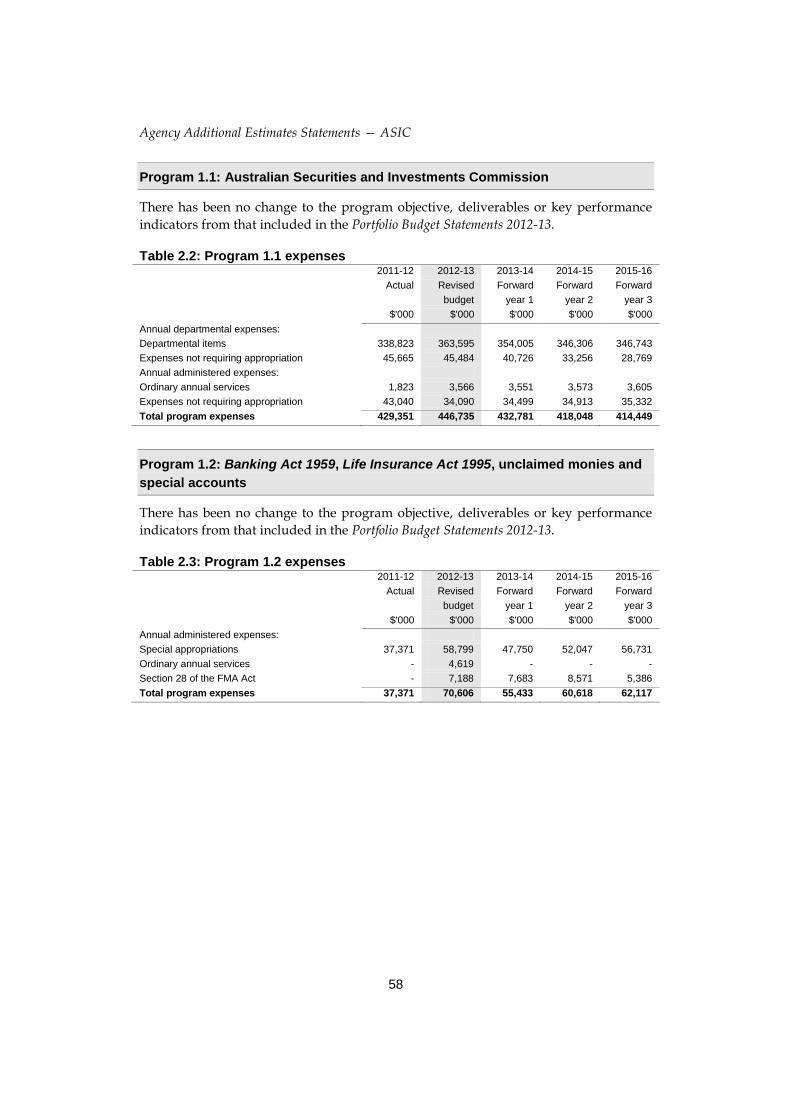
Program 1.1: Australian Securities and Investments Commission
There has been no change to the program objective, deliverables or key performance indicators from that included in the Portfolio Budget Statements 2012-13.
Table 2.2: Program 1.1 expenses 2011-12 2012-13 2013-14 2014-15 2015-16
Actual Revised Forward Forward Forward budget year 1 year 2 year 3 $'000 $'000 $'000 $'000 $'000
Annual departmental expenses: Departmental items 338,823 363,595 354,005 346,306 346,743 Expenses not requiring appropriation 45,665 45,484 40,726 33,256 28,769 Annual administered expenses: Ordinary annual services 1,823 3,566 3,551 3,573 3,605 Expenses not requiring appropriation 43,040 34,090 34,499 34,913 35,332 Total program expenses 429,351 446,735 432,781 418,048 414,449
Program 1.2: Banking Act 1959, Life Insurance Act 1995, unclaimed monies and special accounts
There has been no change to the program objective, deliverables or key performance indicators from that included in the Portfolio Budget Statements 2012-13.
Table 2.3: Program 1.2 expenses 2011-12 2012-13 2013-14 2014-15 2015-16
Actual Revised Forward Forward Forward budget year 1 year 2 year 3 $'000 $'000 $'000 $'000 $'000
Annual administered expenses: Special appropriations 37,371 58,799 47,750 52,047 56,731 Ordinary annual services - 4,619 - - - Section 28 of the FMA Act - 7,188 7,683 8,571 5,386 Total program expenses 37,371 70,606 55,433 60,618 62,117
Agency Additional Estimates Statements — ASIC
59
Section 3: Explanatory tables and budgeted financial statements
3.1 EXPLANATORY TABLES
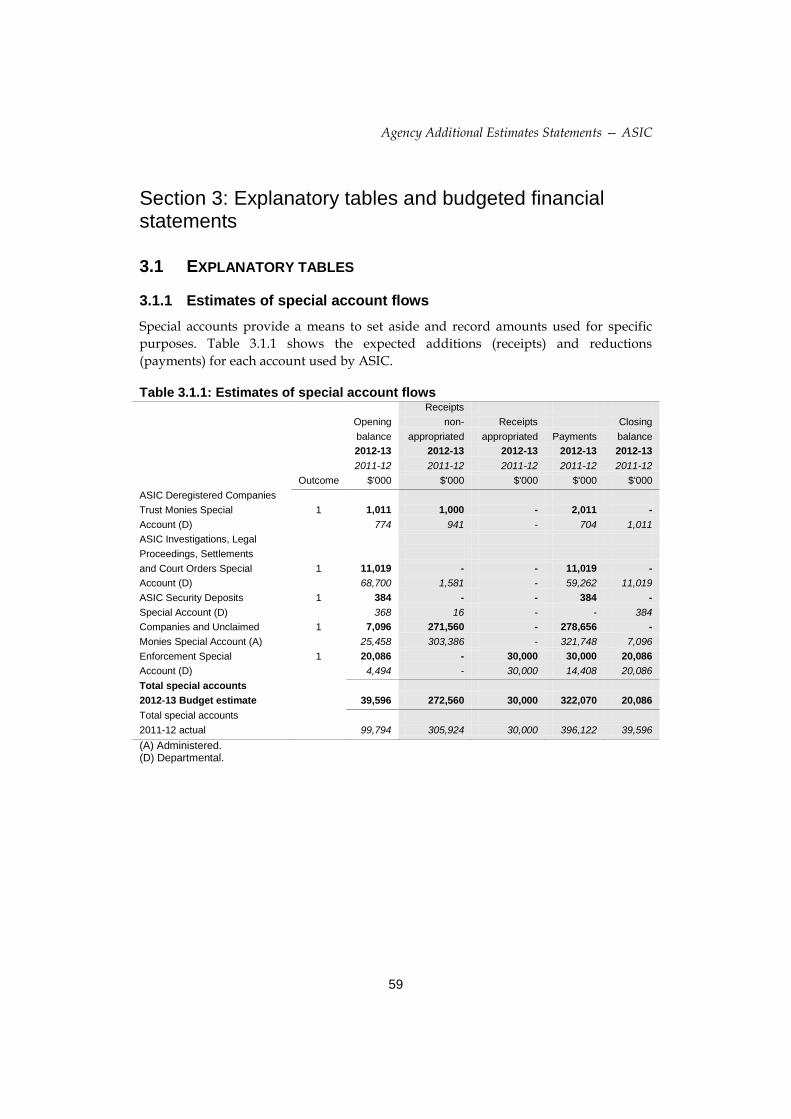
3.1.1 Estimates of special account flows Special accounts provide a means to set aside and record amounts used for specific purposes. Table 3.1.1 shows the expected additions (receipts) and reductions (payments) for each account used by ASIC.
Table 3.1.1: Estimates of special account flows Receipts Opening non- Receipts Closing balance appropriated appropriated Payments balance 2012-13 2012-13 2012-13 2012-13 2012-13 2011-12 2011-12 2011-12 2011-12 2011-12 Outcome $'000 $'000 $'000 $'000 $'000
ASIC Deregistered Companies Trust Monies Special 1 1,011 1,000 - 2,011 - Account (D) 774 941 - 704 1,011 ASIC Investigations, Legal Proceedings, Settlements and Court Orders Special 1 11,019 - - 11,019 - Account (D) 68,700 1,581 - 59,262 11,019 ASIC Security Deposits 1 384 - - 384 - Special Account (D) 368 16 - - 384 Companies and Unclaimed 1 7,096 271,560 - 278,656 - Monies Special Account (A) 25,458 303,386 - 321,748 7,096 Enforcement Special 1 20,086 - 30,000 30,000 20,086 Account (D) 4,494 - 30,000 14,408 20,086 Total special accounts 2012-13 Budget estimate 39,596 272,560 30,000 322,070 20,086 Total special accounts 2011-12 actual 99,794 305,924 30,000 396,122 39,596 (A) Administered. (D) Departmental.

Agency Additional Estimates Statements — ASIC
60
3.2 BUDGETED FINANCIAL STATEMENTS
3.2.1 Analysis of budgeted financial statements Budgeted departmental Comprehensive income statement
ASIC is currently budgeting for a break-even operating result for 2012-13 and for the remainder of the forward estimates.
Total revenue and expenses (excluding depreciation) are estimated to be $365.8 million for 2012-13. The expenditure will be used to fund activities that contribute towards achieving the outcome and program objectives outlined in Section 2.
Budgeted departmental balance sheet This statement shows the financial position of ASIC. It helps decision makers to track the management of ASIC’s assets and liabilities.
ASIC’s budgeted equity (or net asset position) for 2012-13 is $141.4 million.
The 2012-13 equity position reflects the cumulative effect of capital injections of $29.7 million received during 2012-13.
Budgeted departmental statement of cash flows The budgeted statement of cash flows provides important information on the extent and nature of cash flows by categorising them into expected cash flows from operating activities, investing activities and financing activities.
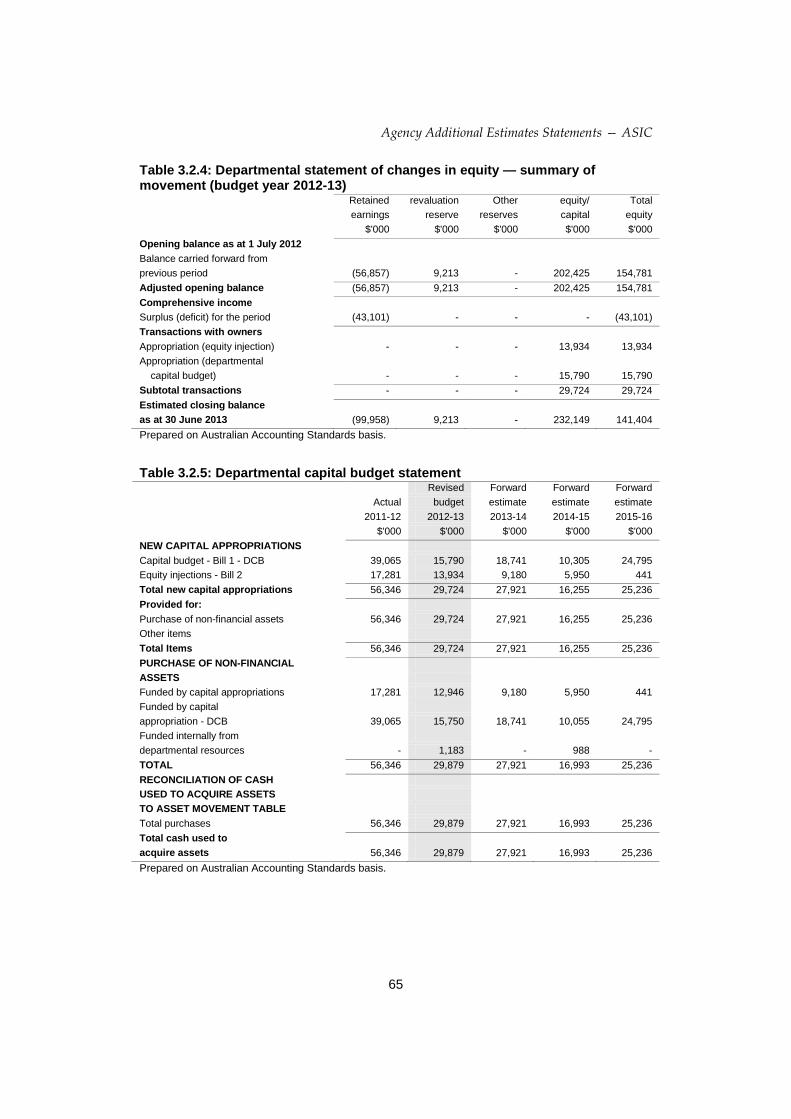
Departmental statement of changes in equity — summary of movement This statement shows the changes in the equity position of ASIC. It helps decision-makers to track the management of ASIC’s equity.
Departmental capital budget statement This statement shows details of capital appropriations received by ASIC. It helps decision-makers to track the acquisition of new non-financial assets.
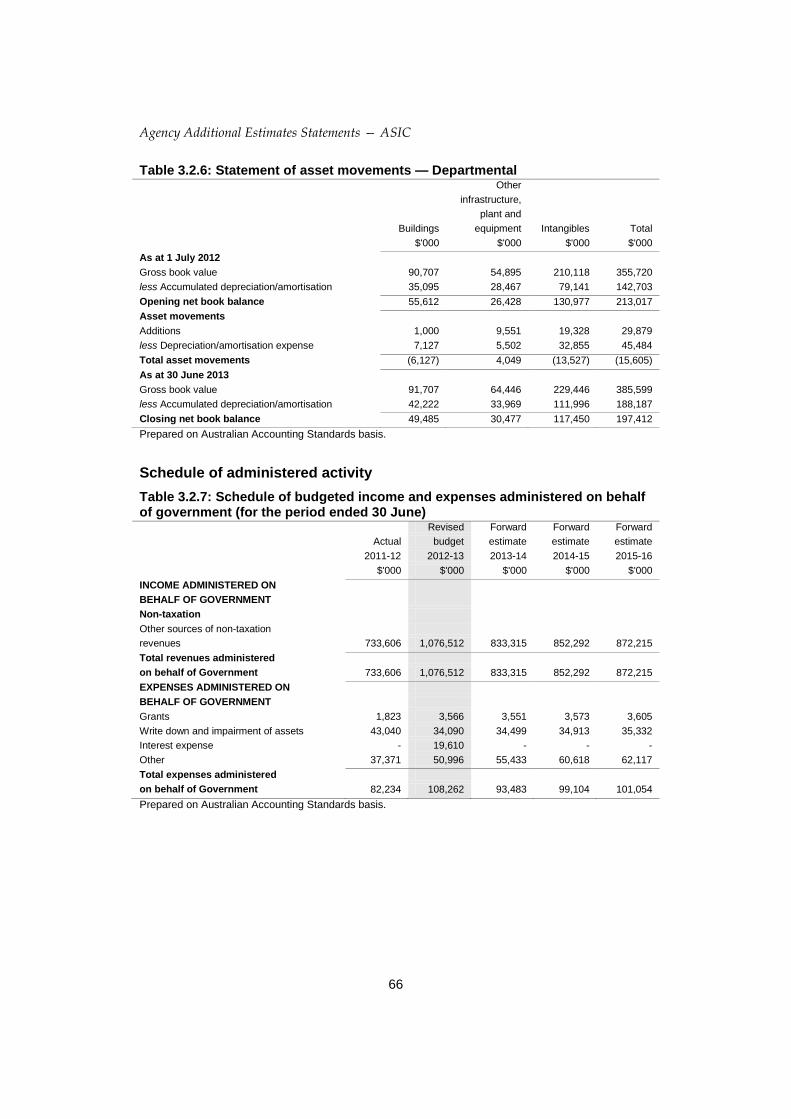
Statement of Asset Movements — Departmental This statement shows details of gross asset movements during the year. It helps decision-makers to analyse movements of non-financial assets.
Agency Additional Estimates Statements — ASIC
61
Schedule of administered activity Schedule of budgeted income and expenses administered on behalf of government
The schedule of budgeted income and expenses administered on behalf of government shows the revenue and expenses associated with the collection of revenue under the Corporations Act 2001 and ASIC’s responsibilities in administering unclaimed monies under the Banking Act 1959, the Life Insurance Act 1995 and section 28 of the Financial Management and Accountability Act 1997 (FMA Act).
Prior to 5 December 2012, unclaimed company monies were held in ASIC’s Companies and Unclaimed Monies Special Account (CUMSA) for six years before being transferred to the Consolidated Revenue Fund (CRF). From 5 December 2012, the Government closed the CUMSA and unclaimed company monies are transferred to the CRF on a daily basis. In addition to the above reform, the Government will pay interest from 1 July 2013 on all reclaimed monies. ASIC will receive $6.5 million over the forward estimates to continue to administer unclaimed monies and associated interest payments.
Other non-taxation revenue represents the amount of fees and charges budgeted to be levied under the Corporations Act 2001 and estimated receipts of unclaimed monies under the Banking Act 1959, the Life Insurance Act 1995 and the Corporations Act 2001.
Expenses represent budgeted payments of unclaimed monies, refund of overpaid fees and charges levied under the Corporations Act 2001, bad debt expense and payments to registered insolvency practitioners to investigate breaches of directors’ duties and fraudulent conduct.
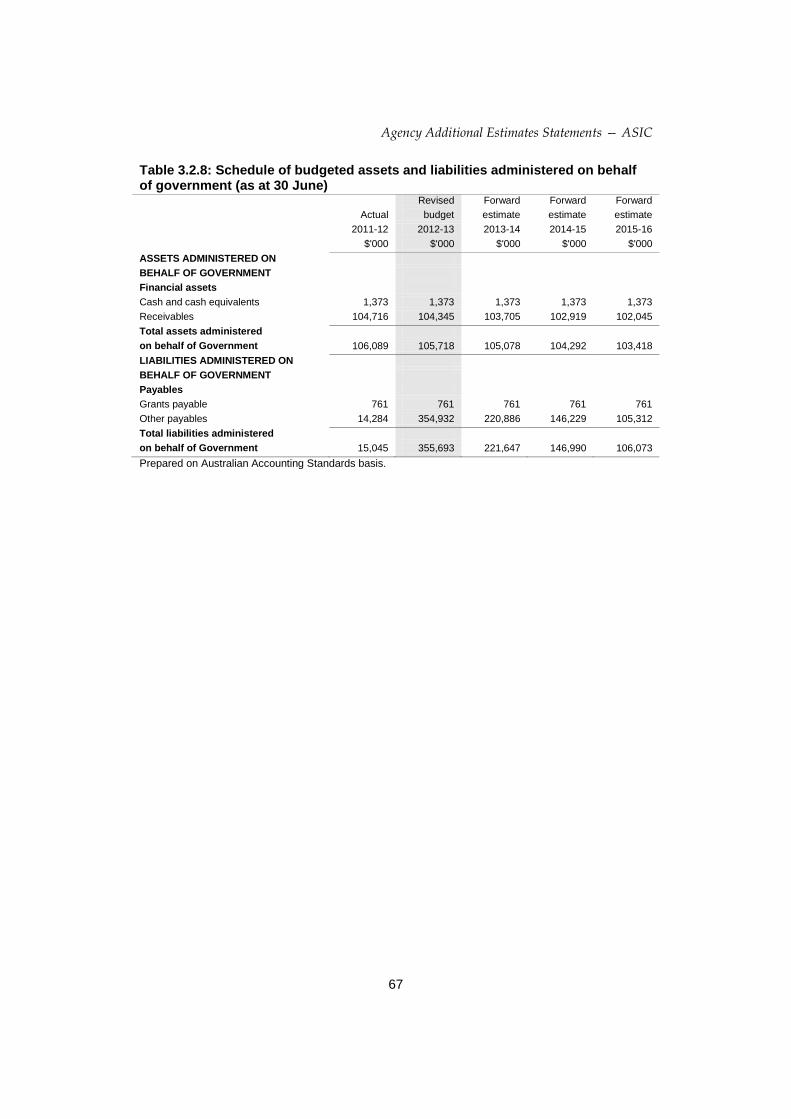
Schedule of budgeted assets and liabilities administered on behalf of government The amount shown for receivables in 2012-13 and in the forward estimates is the estimated amount of fees and charges under the Corporations Act 2001 remaining unpaid at 30 June.
The amounts shown in other payables for 2012-13 and the forward estimates represent the estimated amount of refunds relating to the over payments of annual review fees, other fees under the Corporations Act 2001, claims payable under the Banking Act 1959, the Life Insurance Act 1995 and companies unclaimed monies under section 28 of the FMA Act.
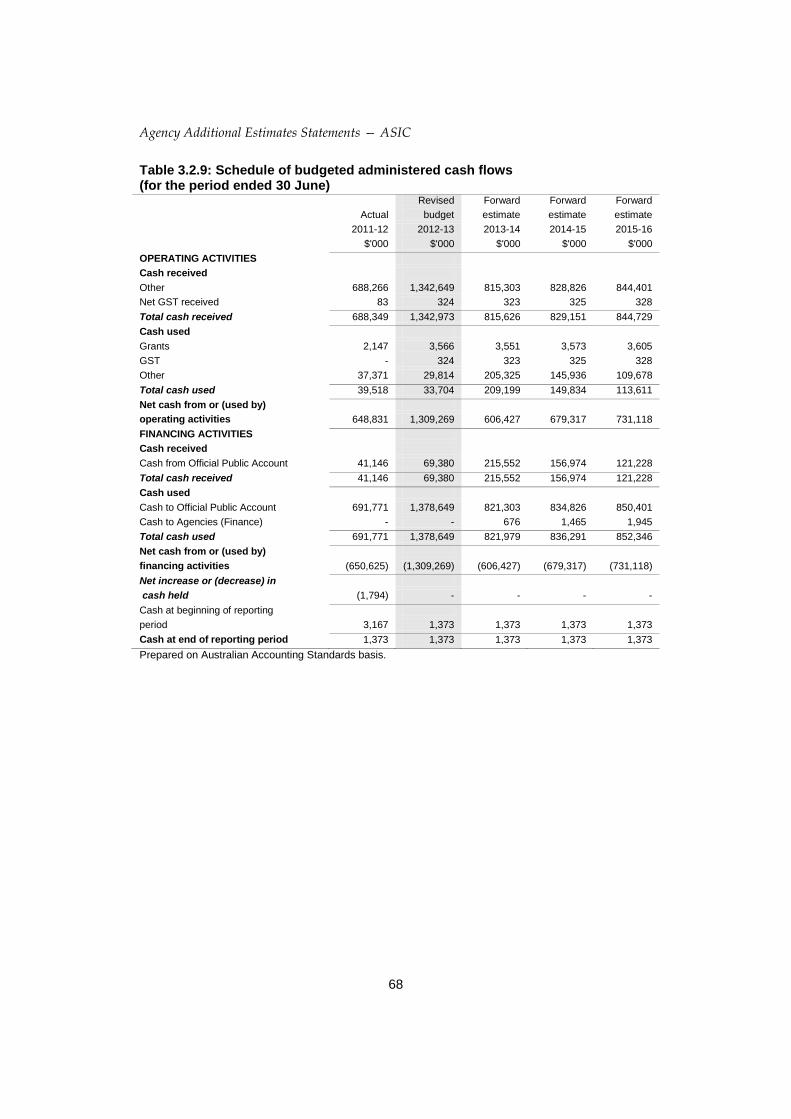
Schedule of budgeted administered cash flows Budgeted administered cash flows, provide important information on the extent and nature of cash flows by categorising them into expected cash flows from operating activities, investing activities and financing activities.
Agency Additional Estimates Statements — ASIC
62
3.2.2 Budgeted financial statements Departmental financial statements
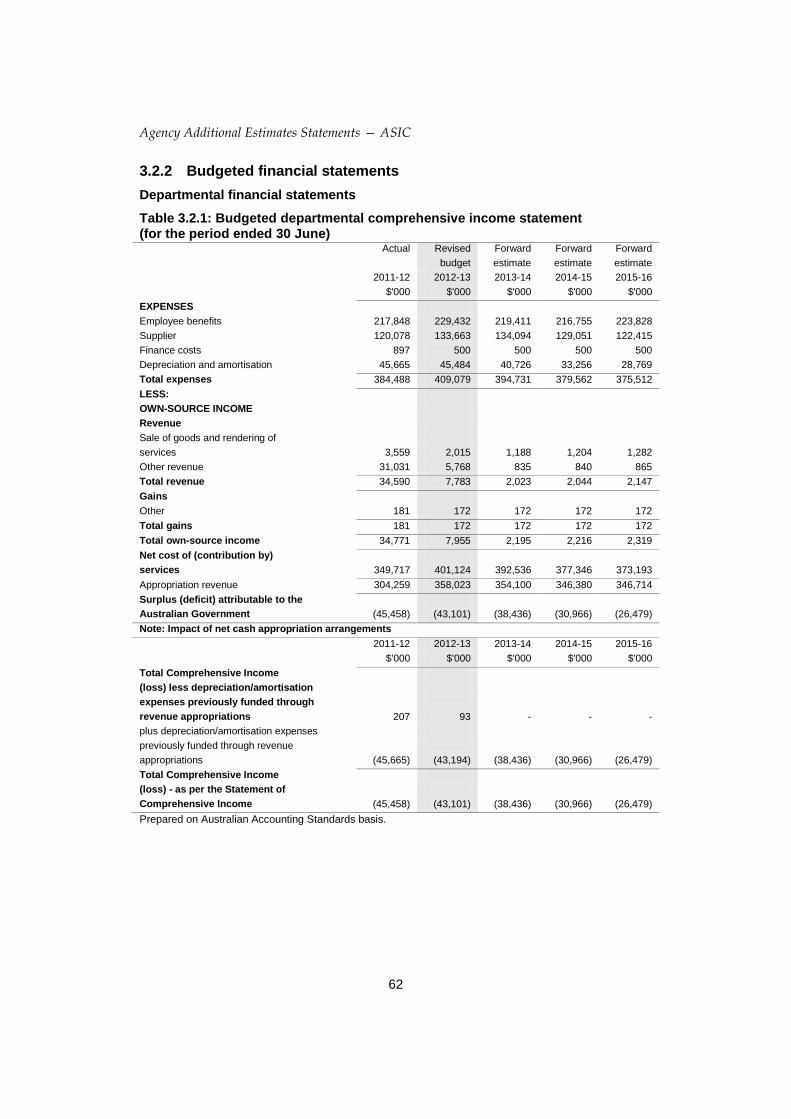
Table 3.2.1: Budgeted departmental comprehensive income statement (for the period ended 30 June)
Actual Revised Forward Forward Forward budget estimate estimate estimate 2011-12 2012-13 2013-14 2014-15 2015-16 $'000 $'000 $'000 $'000 $'000
EXPENSES Employee benefits 217,848 229,432 219,411 216,755 223,828 Supplier 120,078 133,663 134,094 129,051 122,415 Finance costs 897 500 500 500 500 Depreciation and amortisation 45,665 45,484 40,726 33,256 28,769 Total expenses 384,488 409,079 394,731 379,562 375,512 LESS: OWN-SOURCE INCOME Revenue Sale of goods and rendering of services 3,559 2,015 1,188 1,204 1,282 Other revenue 31,031 5,768 835 840 865 Total revenue 34,590 7,783 2,023 2,044 2,147 Gains Other 181 172 172 172 172 Total gains 181 172 172 172 172 Total own-source income 34,771 7,955 2,195 2,216 2,319 Net cost of (contribution by) services 349,717 401,124 392,536 377,346 373,193 Appropriation revenue 304,259 358,023 354,100 346,380 346,714 Surplus (deficit) attributable to the Australian Government (45,458) (43,101) (38,436) (30,966) (26,479) Note: Impact of net cash appropriation arrangements
2011-12 2012-13 2013-14 2014-15 2015-16 $'000 $'000 $'000 $'000 $'000
Total Comprehensive Income (loss) less depreciation/amortisation expenses previously funded through revenue appropriations 207 93 - - - plus depreciation/amortisation expenses previously funded through revenue appropriations (45,665) (43,194) (38,436) (30,966) (26,479) Total Comprehensive Income (loss) - as per the Statement of Comprehensive Income (45,458) (43,101) (38,436) (30,966) (26,479) Prepared on Australian Accounting Standards basis.
Agency Additional Estimates Statements — ASIC
63
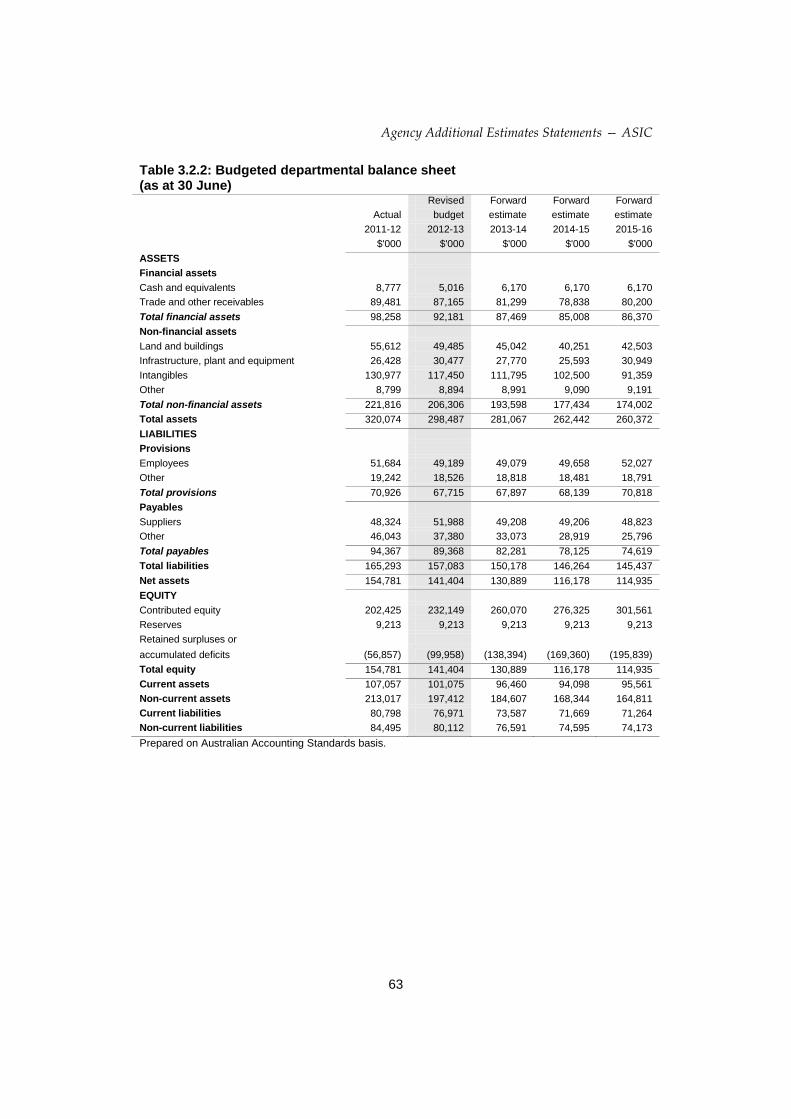
Table 3.2.2: Budgeted departmental balance sheet (as at 30 June)
Revised Forward Forward Forward Actual budget estimate estimate estimate 2011-12 2012-13 2013-14 2014-15 2015-16 $'000 $'000 $'000 $'000 $'000
ASSETS Financial assets Cash and equivalents 8,777 5,016 6,170 6,170 6,170 Trade and other receivables 89,481 87,165 81,299 78,838 80,200 Total financial assets 98,258 92,181 87,469 85,008 86,370 Non-financial assets Land and buildings 55,612 49,485 45,042 40,251 42,503 Infrastructure, plant and equipment 26,428 30,477 27,770 25,593 30,949 Intangibles 130,977 117,450 111,795 102,500 91,359 Other 8,799 8,894 8,991 9,090 9,191 Total non-financial assets 221,816 206,306 193,598 177,434 174,002 Total assets 320,074 298,487 281,067 262,442 260,372 LIABILITIES Provisions Employees 51,684 49,189 49,079 49,658 52,027 Other 19,242 18,526 18,818 18,481 18,791 Total provisions 70,926 67,715 67,897 68,139 70,818 Payables Suppliers 48,324 51,988 49,208 49,206 48,823 Other 46,043 37,380 33,073 28,919 25,796 Total payables 94,367 89,368 82,281 78,125 74,619 Total liabilities 165,293 157,083 150,178 146,264 145,437 Net assets 154,781 141,404 130,889 116,178 114,935 EQUITY Contributed equity 202,425 232,149 260,070 276,325 301,561 Reserves 9,213 9,213 9,213 9,213 9,213 Retained surpluses or accumulated deficits (56,857) (99,958) (138,394) (169,360) (195,839) Total equity 154,781 141,404 130,889 116,178 114,935 Current assets 107,057 101,075 96,460 94,098 95,561 Non-current assets 213,017 197,412 184,607 168,344 164,811 Current liabilities 80,798 76,971 73,587 71,669 71,264 Non-current liabilities 84,495 80,112 76,591 74,595 74,173 Prepared on Australian Accounting Standards basis.

Agency Additional Estimates Statements — ASIC
64
Table 3.2.3: Budgeted departmental statement of cash flows (for the period ended 30 June)
Revised Forward Forward Forward Actual budget estimate estimate estimate 2011-12 2012-13 2013-14 2014-15 2015-16 $'000 $'000 $'000 $'000 $'000
OPERATING ACTIVITIES Cash received Goods and services 8,895 2,015 1,188 1,204 1,282 Appropriations 319,312 359,903 358,830 348,066 345,352 GST received 19,221 12,555 15,986 15,309 15,608 Other 31,032 1,767 835 840 865 Total cash received 378,460 376,240 376,839 365,419 363,107 Cash used Employees 211,883 232,643 219,229 216,513 221,149 Suppliers 109,118 134,608 140,470 132,609 126,350 GST paid 19,889 12,555 15,986 15,309 15,608 Other 36,042 40 - 250 - Total cash used 376,932 379,846 375,685 364,681 363,107 Net cash from or (used by) operating activities 1,528 (3,606) 1,154 738 - INVESTING ACTIVITIES Cash used Purchase of property, plant and equipment 56,346 29,879 27,921 16,993 25,236 Total cash used 56,346 29,879 27,921 16,993 25,236 Net cash from or (used by) investing activities (56,346) (29,879) (27,921) (16,993) (25,236) FINANCING ACTIVITIES Cash received Appropriations - contributed equity 58,861 29,724 27,921 16,255 25,236 Total cash received 58,861 29,724 27,921 16,255 25,236 Net cash from or (used by) financing activities 58,861 29,724 27,921 16,255 25,236 Net increase or (decrease) in cash held 4,043 (3,761) 1,154 - - Cash at the beginning of the reporting period 4,734 8,777 5,016 6,170 6,170 Cash at the end of the reporting period 8,777 5,016 6,170 6,170 6,170 Prepared on Australian Accounting Standards basis.
Agency Additional Estimates Statements — ASIC
65
Table 3.2.4: Departmental statement of changes in equity — summary of movement (budget year 2012-13) Retained revaluation Other equity/ Total earnings reserve reserves capital equity $'000 $'000 $'000 $'000 $'000 Opening balance as at 1 July 2012 Balance carried forward from previous period (56,857) 9,213 - 202,425 154,781 Adjusted opening balance (56,857) 9,213 - 202,425 154,781 Comprehensive income Surplus (deficit) for the period (43,101) - - - (43,101) Transactions with owners Appropriation (equity injection) - - - 13,934 13,934 Appropriation (departmental capital budget) - - - 15,790 15,790 Subtotal transactions - - - 29,724 29,724 Estimated closing balance as at 30 June 2013 (99,958) 9,213 - 232,149 141,404 Prepared on Australian Accounting Standards basis.
Table 3.2.5: Departmental capital budget statement Revised Forward Forward Forward Actual budget estimate estimate estimate 2011-12 2012-13 2013-14 2014-15 2015-16 $'000 $'000 $'000 $'000 $'000
NEW CAPITAL APPROPRIATIONS Capital budget - Bill 1 - DCB 39,065 15,790 18,741 10,305 24,795 Equity injections - Bill 2 17,281 13,934 9,180 5,950 441 Total new capital appropriations 56,346 29,724 27,921 16,255 25,236 Provided for: Purchase of non-financial assets 56,346 29,724 27,921 16,255 25,236 Other items Total Items 56,346 29,724 27,921 16,255 25,236 PURCHASE OF NON-FINANCIAL ASSETS Funded by capital appropriations 17,281 12,946 9,180 5,950 441 Funded by capital appropriation - DCB 39,065 15,750 18,741 10,055 24,795 Funded internally from departmental resources - 1,183 - 988 - TOTAL 56,346 29,879 27,921 16,993 25,236 RECONCILIATION OF CASH USED TO ACQUIRE ASSETS TO ASSET MOVEMENT TABLE Total purchases 56,346 29,879 27,921 16,993 25,236 Total cash used to acquire assets 56,346 29,879 27,921 16,993 25,236 Prepared on Australian Accounting Standards basis.
Agency Additional Estimates Statements — ASIC
66
Table 3.2.6: Statement of asset movements — Departmental Other infrastructure, plant and Buildings equipment Intangibles Total $'000 $'000 $'000 $'000
As at 1 July 2012 Gross book value 90,707 54,895 210,118 355,720 less Accumulated depreciation/amortisation 35,095 28,467 79,141 142,703 Opening net book balance 55,612 26,428 130,977 213,017 Asset movements Additions 1,000 9,551 19,328 29,879 less Depreciation/amortisation expense 7,127 5,502 32,855 45,484 Total asset movements (6,127) 4,049 (13,527) (15,605) As at 30 June 2013 Gross book value 91,707 64,446 229,446 385,599 less Accumulated depreciation/amortisation 42,222 33,969 111,996 188,187 Closing net book balance 49,485 30,477 117,450 197,412 Prepared on Australian Accounting Standards basis.
Schedule of administered activity Table 3.2.7: Schedule of budgeted income and expenses administered on behalf of government (for the period ended 30 June)
Revised Forward Forward Forward Actual budget estimate estimate estimate 2011-12 2012-13 2013-14 2014-15 2015-16 $'000 $'000 $'000 $'000 $'000
INCOME ADMINISTERED ON BEHALF OF GOVERNMENT Non-taxation Other sources of non-taxation revenues 733,606 1,076,512 833,315 852,292 872,215 Total revenues administered on behalf of Government 733,606 1,076,512 833,315 852,292 872,215 EXPENSES ADMINISTERED ON BEHALF OF GOVERNMENT Grants 1,823 3,566 3,551 3,573 3,605 Write down and impairment of assets 43,040 34,090 34,499 34,913 35,332 Interest expense - 19,610 - - - Other 37,371 50,996 55,433 60,618 62,117 Total expenses administered on behalf of Government 82,234 108,262 93,483 99,104 101,054 Prepared on Australian Accounting Standards basis.
Agency Additional Estimates Statements — ASIC
67
Table 3.2.8: Schedule of budgeted assets and liabilities administered on behalf of government (as at 30 June)
Revised Forward Forward Forward Actual budget estimate estimate estimate 2011-12 2012-13 2013-14 2014-15 2015-16 $'000 $'000 $'000 $'000 $'000
ASSETS ADMINISTERED ON BEHALF OF GOVERNMENT Financial assets Cash and cash equivalents 1,373 1,373 1,373 1,373 1,373 Receivables 104,716 104,345 103,705 102,919 102,045 Total assets administered on behalf of Government 106,089 105,718 105,078 104,292 103,418 LIABILITIES ADMINISTERED ON BEHALF OF GOVERNMENT Payables Grants payable 761 761 761 761 761 Other payables 14,284 354,932 220,886 146,229 105,312 Total liabilities administered on behalf of Government 15,045 355,693 221,647 146,990 106,073 Prepared on Australian Accounting Standards basis.
Agency Additional Estimates Statements — ASIC
68
Table 3.2.9: Schedule of budgeted administered cash flows (for the period ended 30 June)
Revised Forward Forward Forward Actual budget estimate estimate estimate 2011-12 2012-13 2013-14 2014-15 2015-16 $'000 $'000 $'000 $'000 $'000
OPERATING ACTIVITIES Cash received Other 688,266 1,342,649 815,303 828,826 844,401 Net GST received 83 324 323 325 328 Total cash received 688,349 1,342,973 815,626 829,151 844,729 Cash used Grants 2,147 3,566 3,551 3,573 3,605 GST - 324 323 325 328 Other 37,371 29,814 205,325 145,936 109,678 Total cash used 39,518 33,704 209,199 149,834 113,611 Net cash from or (used by) operating activities 648,831 1,309,269 606,427 679,317 731,118 FINANCING ACTIVITIES Cash received Cash from Official Public Account 41,146 69,380 215,552 156,974 121,228 Total cash received 41,146 69,380 215,552 156,974 121,228 Cash used Cash to Official Public Account 691,771 1,378,649 821,303 834,826 850,401 Cash to Agencies (Finance) - - 676 1,465 1,945 Total cash used 691,771 1,378,649 821,979 836,291 852,346 Net cash from or (used by) financing activities (650,625) (1,309,269) (606,427) (679,317) (731,118) Net increase or (decrease) in cash held (1,794) - - - - Cash at beginning of reporting period 3,167 1,373 1,373 1,373 1,373 Cash at end of reporting period 1,373 1,373 1,373 1,373 1,373 Prepared on Australian Accounting Standards basis.
Agency Additional Estimates Statements — ASIC
69
Notes to the financial statements Basis of accounting
The budgeted financial statements have been prepared on an Australian Accounting Standards basis.
Budgeted agency financial statements
Under the Australian Government’s accrual budgeting framework, and consistent with Australian Accounting Standards, transactions that agencies control (departmental transactions) are separately budgeted for and reported on from transactions that agencies do not have control over (administered transactions). This ensures that agencies are only held fully accountable for the transactions over which they have control.
Departmental items are those assets, liabilities, revenues and expenses in relation to an agency or authority that are controlled by the agency. Departmental expenses include employee and supplier expenses and other administrative costs, which are incurred by the agency in providing its goods and services.
Administered items are revenues, expenses, assets and liabilities that are managed by an agency or authority on behalf of the Australian Government according to set government directions. Administered expenses and administered revenues include fees, fines and expenses that have been earmarked for a specific purpose by the government.
Appropriations in the accrual budgeting framework
Under the Australian Government’s accrual budgeting framework, separate annual appropriations are provided for:
• departmental appropriations representing the Australian Government’s purchase of programs from agencies;
• departmental capital appropriations for investments by the Australian Government for either additional equity or loans in agencies;
• administered expense appropriations for the estimated administered expenses relating to an existing outcome or a new outcome; and
• administered capital appropriations for increases in administered equity through funding non-expense administered payments.
Agency Additional Estimates Statements — ASIC
70
Departmental Asset valuation
ASIC has adopted fair value as a basis for valuing its leasehold improvements and plant and equipment. Valuation is conducted with sufficient frequency to ensure that the carrying amounts of assets do not differ materially from the assets fair values as at the reporting date.
Asset recognition threshold
Purchases of property, plant and equipment are recognised initially at cost in the balance sheet, except for purchases costing less than $2,000, which are expensed in the year of acquisition.
Leases
A distinction is made between finance leases, which effectively transfer from the lessor to the lessee substantially all the risks and benefits incidental to ownership of leased non-current assets, and operating leases under which the lessor effectively retains substantially all such risks and benefits.
Where a non-current asset is acquired by means of a finance lease, the asset is capitalised at the lower of fair value or the present value of minimum lease payments at the inception of the lease and a liability recognised for the same amount. Leased assets are amortised over the period of the lease. Lease payments are allocated between the principal component and the interest expense.
Operating lease payments are charged to the income statement on a basis that is representative of the pattern of benefits derived from the lease assets.
Depreciation and amortisation
Computer equipment and plant and equipment is depreciated using the straight-line method. Leasehold improvements are amortised on a straight-line basis over the lesser of the estimated life of the improvements or the unexpired period of the lease.
Depreciation/amortisation rates (useful lives) are reviewed at each balance date and necessary adjustments are recognised.
Receivables
A provision is raised for any doubtful debts based on a review of the collectability of all outstanding accounts as at year-end.
Bad debts are written off during the year in which they are identified.
Agency Additional Estimates Statements — ASIC
71
Provisions and payables
Provisions and payables represent liabilities for miscellaneous accruals and employee benefits, including accrued salary and leave entitlements, provisions for making-good leased premises and lease incentives. No provision for sick leave is required as all sick leave is non-vesting.
Administered Schedule of budgeted revenues and expenses administered on behalf of government
Revenues
Non-taxation revenues are predominately comprised of Corporations Act 2001 fees and charges and collections of unclaimed monies under the Banking Act 1959, the Life Insurance Act 1995 and the Corporations Act 2001.
Write down and impairment of assets
Write down and impairment of assets represents waivers and write-offs of corporation’s law fees.
Schedule of budgeted assets and liabilities administered on behalf of government
Financial assets
The financial assets include corporation’s law debt invoiced and still outstanding at year-end.
Schedule of budgeted administered cash flows
All cash collected by ASIC for corporations law revenue is transferred to the Official Public Account (OPA) at the close of business each day. Cash collected for Banking Act 1959 unclaimed monies and Life Insurance Act 1995 unclaimed monies is transferred to the OPA when received.
From 5 December 2012, cash collected for unclaimed monies under the Corporations Act 2001 is also transferred to the OPA when received.