Embed Size (px)
Citation preview
Ports. Interconnecting places, trade and consumptionYear 9 Geography (Vic years 9 &10)
Ports Australia – 100 years of Advancing Australia
Investigating ports through the eyes of a geographer Few of our students have encountered ports up close. They are large fascinating operations that are a hub between the land and sea. Ports are relevant to students as they link Australia to the rest of the world. They operate around the clock loading vast amounts of materials between ships, trucks and trains. Each day $1.2billion worth of trade flows through Australia’s many ports. Most of our manufactured goods have travelled through several ports.
Everything students need for their learning experience is online. They will interpret graphs, tables of data and manipulate online maps choosing overlays that explain what they intend to communicate.
For some teachers, not familiar with the many online mapping websites, this is an opportunity to see how these mapping programs can be applied to a unit of work.
Students will use geography skills to explore, question and discover why ports are a major component of interconnecting places, trade and consumption. They are particularly significant for Australia as it isn’t possible to drive to another country.
Ports AustraliaPorts Australia coordinates and represents many functions of Australia’s major ports, not least ensuring that our ports minimise environmental impact by ensuring everything is covered to avoid accidents, reduction of greenhouse gases and maintain a safe work environment.
Ports by necessity are behind security fences so it’s difficult to fully appreciate their functions. This geography unit of work will expand students’ understanding of trade along with the wide variety of skilled employees that are required to safely operate ports.
We Are Ports high school competition
The We Are Ports school pilot program is designed to promote the We Are Ports website and messaging in schools across Australia through a pilot program in key schools located near ports.
The program, to commence in Term 2 2017, will be curriculum based (Geography) and target Year 9 students. The program will involve an element of online research that will require exploration of www.weareports.com.au and it will culminate in a competition with first, second and third places winning an iPad/device/GoPro for the school.
The program, competition, and award event will be promoted through social media, with local media and through several other channels that are relevant to each port. Ports Australia asks that the relevant port collaborate on the promotion of the program in their area.
Ports Australia is working with The Australian Marine Environment Protection Association (AUSMEPA) who will be developing the curriculum theme and content. In the past AUSMEPA have run competitions in schools in collaboration with ports and are very familiar with the processes and requirements.
We encourage you to join with us in this collaborative initiative.
Keep reading below for the Unit of Work!
Australian Curriculum Year 9 GeographyUnit 2: Geographies of interconnections
The way transportation and information and communication technologies are used to connect people to services, information and people in other places (ACHGK066)
The ways that places and people are interconnected with other places through trade in goods and services, at all scales (ACHGK067)
The effects of the production and consumption of goods on places and environments throughout the world and including a country from North-East Asia (ACHGK068)
Collecting, recording, evaluating and representing Represent spatial distribution of geographical phenomena by constructing special purpose
maps that conform to cartographic conventions, using spatial technologies as appropriate (ACHGS066)
Interpreting, analysing and concluding Identify how geographical information systems (GIS) might be used to analyse
geographical data and make predictions (ACHGS069) Communicating
Present findings, arguments and explanations in a range of appropriate communication forms, selected for their effectiveness and to suit audience and purpose; using relevant geographical terminology, and digital technologies as appropriate (ACHGS070)
Victorian Curriculum Year 9 and 10 Geography Geographical interconnections
Ways in which transportation and information and communication technologies are used to connect people to services, information and people in other places (VCGGK140)
Ways that places and people are interconnected with other places through trade in goods and services, at all scales (VCGGK141)
Effects of the production and consumption of goods on places and environments throughout the world and including a country from North-East Asia(VCGGK142)
Geographical concepts and skills Select, organise and represent data and information in different forms, including by
constructing special purpose maps that conform to cartographic conventions, using digital and spatial technologies as appropriate (VCGGC131)
Analyse and evaluate data, maps and other geographical information using digital and spatial technologies and Geographical Information Systems as appropriate, to develop identifications, descriptions, explanations and conclusions that use geographical terminology (VCGGC132)
Using this unit of work and assessment It will take 7 to 9 lessons to complete all the research and tasks. The written activities are designed for students so that much of the work can be done independently in small groups.
Students will need access to computers or tablets and the internet They will require an electronic version of this document so they can access the links. You may want to printout the activity sheets or ask students to use the word version
of the document to write their research and findings in. You may want students to save electronic versions of their maps for assessment. Their communication project can be assessed by the students following the criteria
producing a plan and showing they can apply their knowledge to making a creative communication product.
There are many opportunities for students to demonstrate their use of GIS mapping skills.
Assessment: Rubric See separate document for the Rubric
Lesson 1
Equipment and materials:Access to computers and the internetDigital projector with computer or smartboardStudent activity available in electronic form so they can access links
Tuning in: How many times has students’ cloths gone through a port?Example: Leather shoes. The leather will have come from a country that farms many cattle. The leather will have been shipped to an Asian country where they would have been used as part of a shoe. The rubber soles is made from petroleum products which came from an oil producing country. The final product is shipped to Australia.
Use Google Earth Add Path to link counties to show where the raw products come from, where they are manufactured and how they arrive in Australia.
Students will need to use the navigation tools on the top right to manoeuvre around h globe.
Real time ship spotting
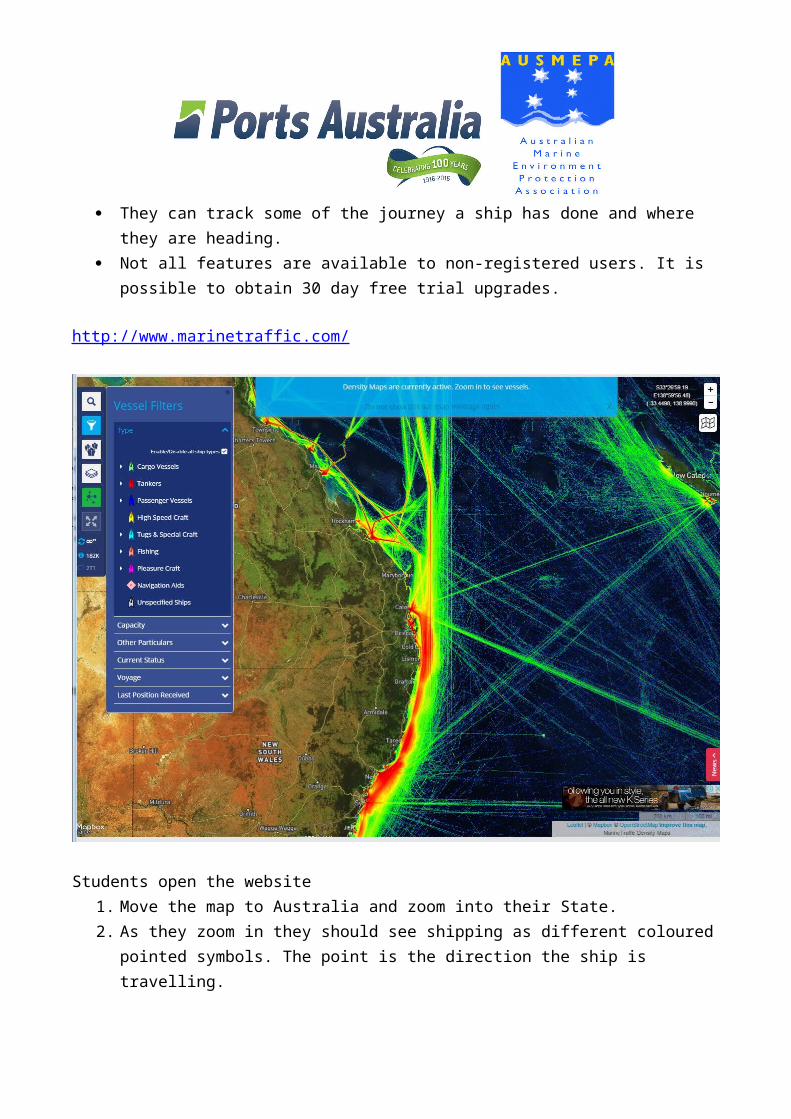
The website Maritime Traffic logs the position of shipping from coastal boats to the largest cargo ships. Some of the features of the website include:
Detailed information in a small popup window is provided for some ships when their position is clicked on.
The colour legend below distinguishes between different shipping types. Students can use various overlays. They can track some of the journey a ship has done and where they are heading. Not all features are available to non-registered users. It is possible to obtain 30 day
free trial upgrades. http://www.marinetraffic.com/
Students open the website1. Move the map to Australia and zoom into their State. 2. As they zoom in they should see shipping as different coloured pointed symbols. The
point is the direction the ship is travelling. 3. Students click on different ships and boats. They will note there is not much
information about many of the ships. However many of the large ships travelling between continents have a photo and the basic information about the ship.
Choose a ship – what is its name
What type of cargo could it be carrying?
Where is the cargo stored?
What are the coordinates of the ship? (look at top right of map)
Suggest where has it come from?
Suggest where is it heading?
What other information could you find about the ship?
Our closest major port
To find your closest port, go to the Ports Australia website. http://www.portsaustralia.com.au/
On the right of the page is a box with a Google map of Australia with pins around the coast. Click on View a Map of Australian Ports. A window will pop up with a larger map. Zoom into the closest pin to where your school is. When you click on the pin some information will come up. If information doesn’t come up, go to a search engine to locate the port’s website.
What is the name of the port?
Who operates the port?
Can you find out what is being imported and exported through the port?
Zoom in using satellite. What infrastructure can you identify?
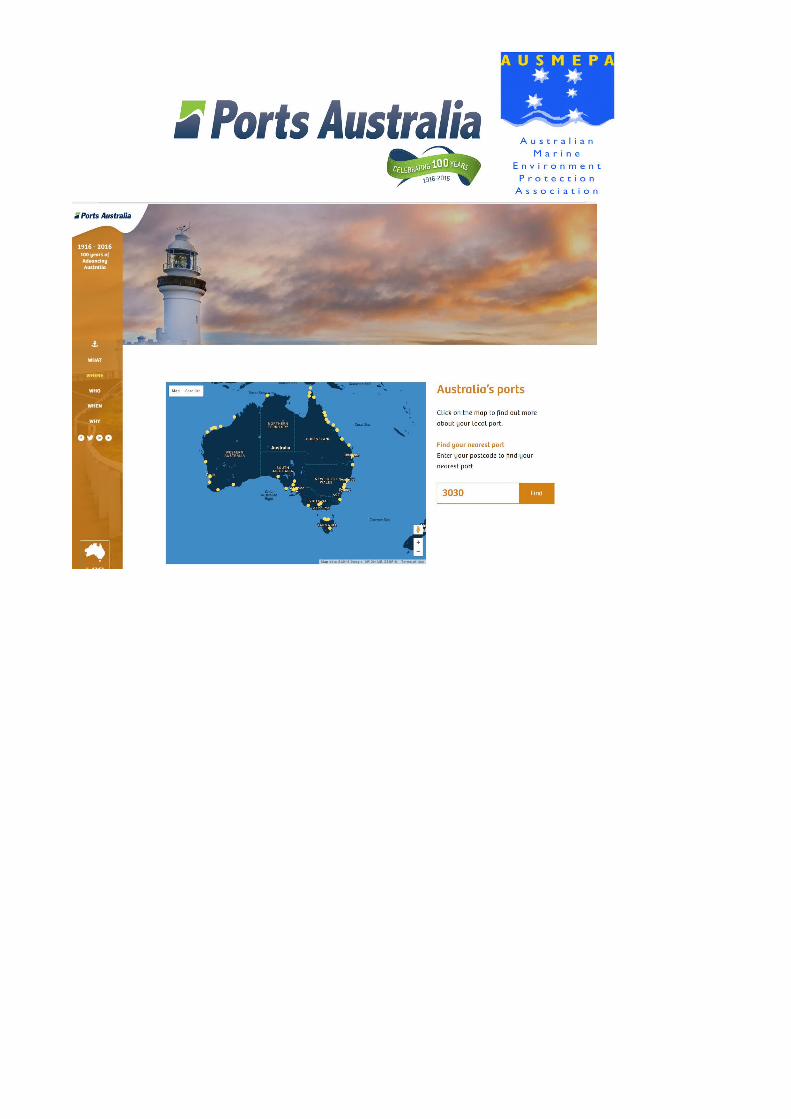
Confirm your closest portAfter getting onto the We are Ports website:
Click on where – left menu bar Scroll down page until the screen below pops up Students write their postcode in the box and click on find.
https://www.weareports.com.au/
Lesson 2Interconnecting cargo in Australia – the big picture
Equipment and materials:Access to computers and the internetDigital projector with computer or smartboardStudent activity available in electronic form so they can access links
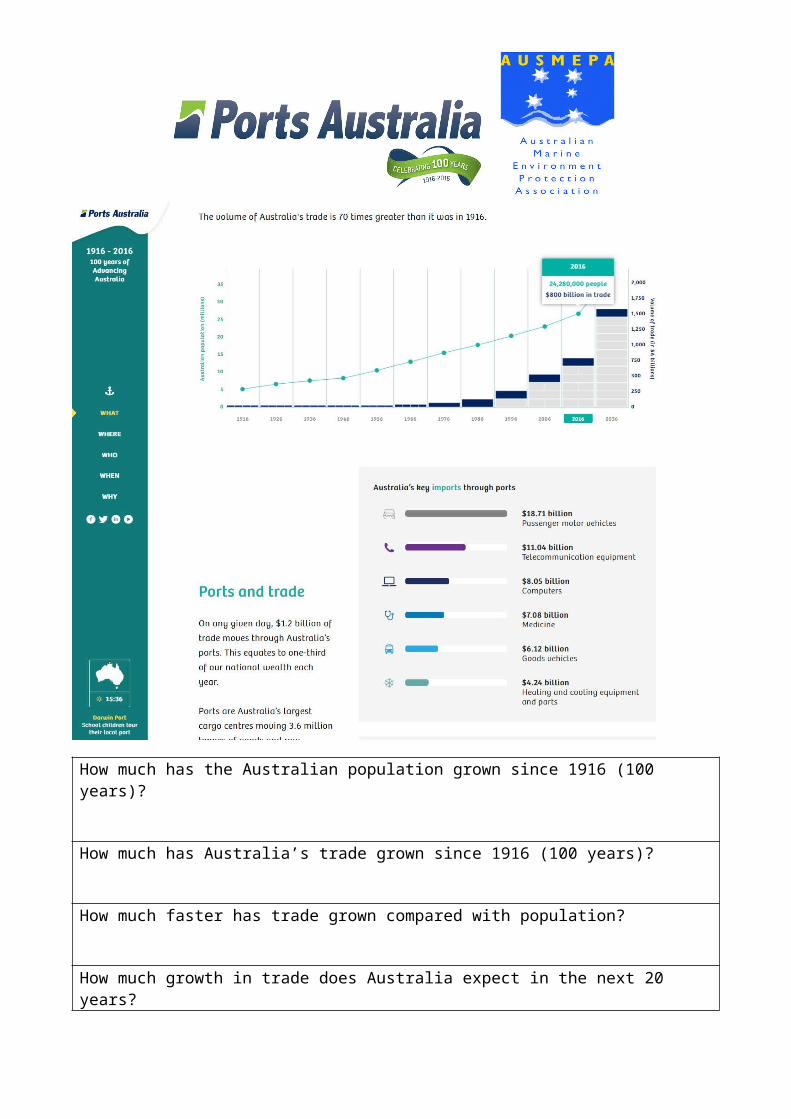
100 years of growth population and trade
After getting onto the We are Ports website: Click on where – left menu bar Scroll down page until the screen below pops up To access data on population and trade click on the years at the bottom of the graph
https://www.weareports.com.au/
How much has the Australian population grown since 1916 (100 years)?
How much has Australia’s trade grown since 1916 (100 years)?
How much faster has trade grown compared with population?
How much growth in trade does Australia expect in the next 20 years?
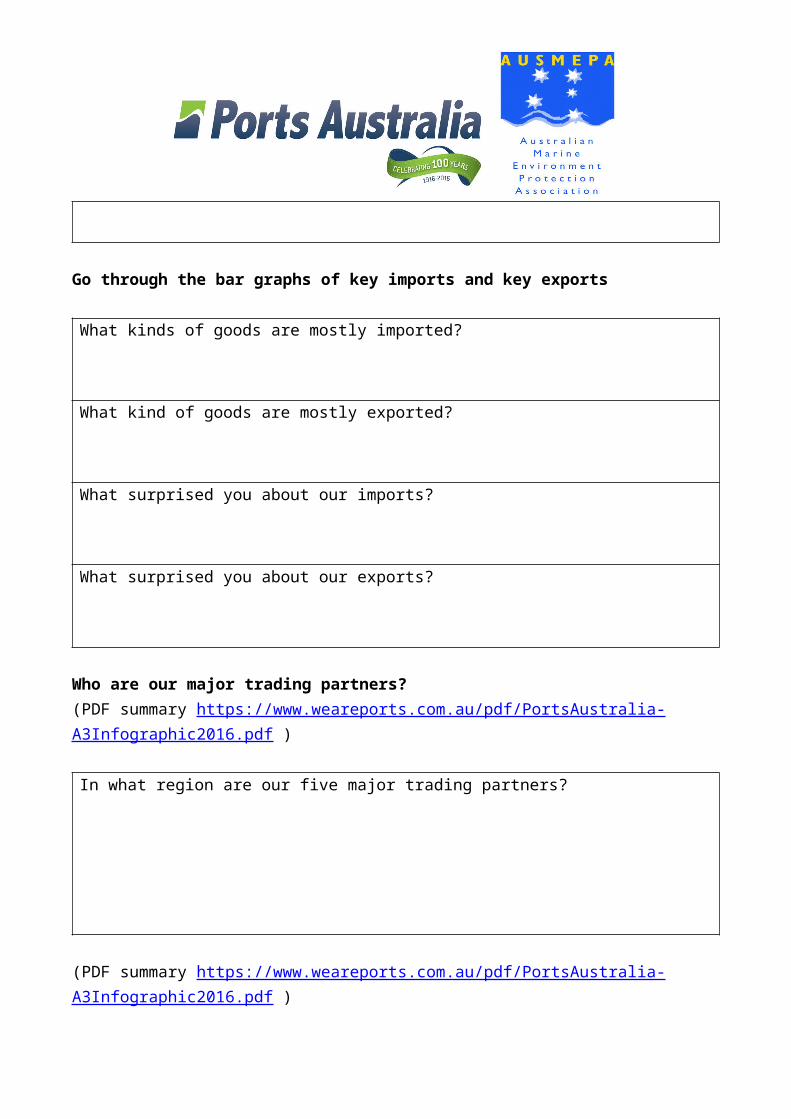
Go through the bar graphs of key imports and key exports
What kinds of goods are mostly imported?
What kind of goods are mostly exported?
What surprised you about our imports?
What surprised you about our exports?
Who are our major trading partners?(PDF summary https://www.weareports.com.au/pdf/PortsAustralia-A3Infographic2016.pdf )
In what region are our five major trading partners?
(PDF summary https://www.weareports.com.au/pdf/PortsAustralia-A3Infographic2016.pdf )
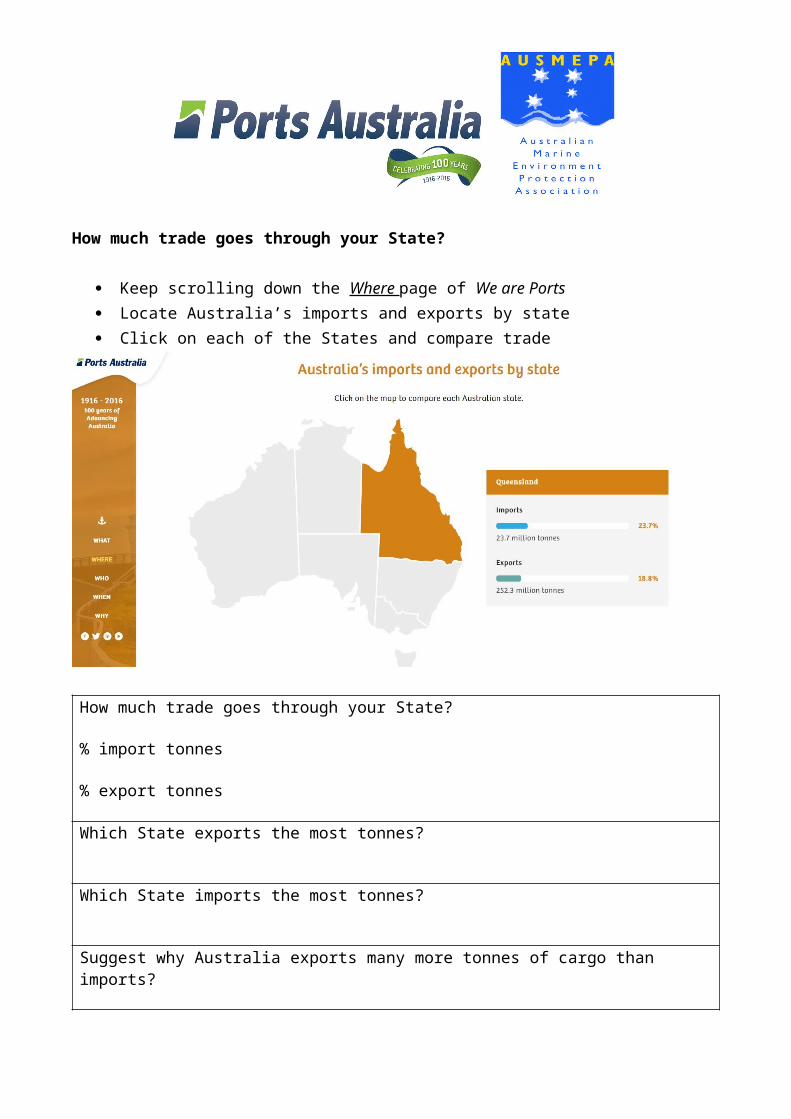
How much trade goes through your State?
Keep scrolling down the Where page of We are Ports Locate Australia’s imports and exports by state Click on each of the States and compare trade
How much trade goes through your State?
% import tonnes
% export tonnes
Which State exports the most tonnes?
Which State imports the most tonnes?
Suggest why Australia exports many more tonnes of cargo than imports?
Why are ports along with transport systems interested in tonnes of cargo?
Lesson 3Mapping your closest port
Equipment and materials:Access to computers and the internetDigital projector with computer or smartboardStudent activity available in electronic form so they can access links
Activity 1 National Map datasets IntroductionNational maphttps://nationalmap.gov.au/ is a collection of Commonwealth and State data all on one site. Hundreds of items can potentially be imported as map overlays. Each overlay can be adjusted by a slider going from hidden to full illumination. The most difficult aspect of using this mapping system is locating the most relevant data in the extensive menu. The maps do not highlight railway tracks within ports on satellite. The tracks are shown on normal map but the overlay won’t highlight them.
Students will use national map website to produce a map that shows how land transport links to the ports. They will choose overlays that are most relevant to transport, ports and movement of goods.
They start by looking at the National Datasets and choosing those that are relevant. They will then go to their state datasets and add further layers. The program is easy enough to remove layers or hide a layer by moving a slider.
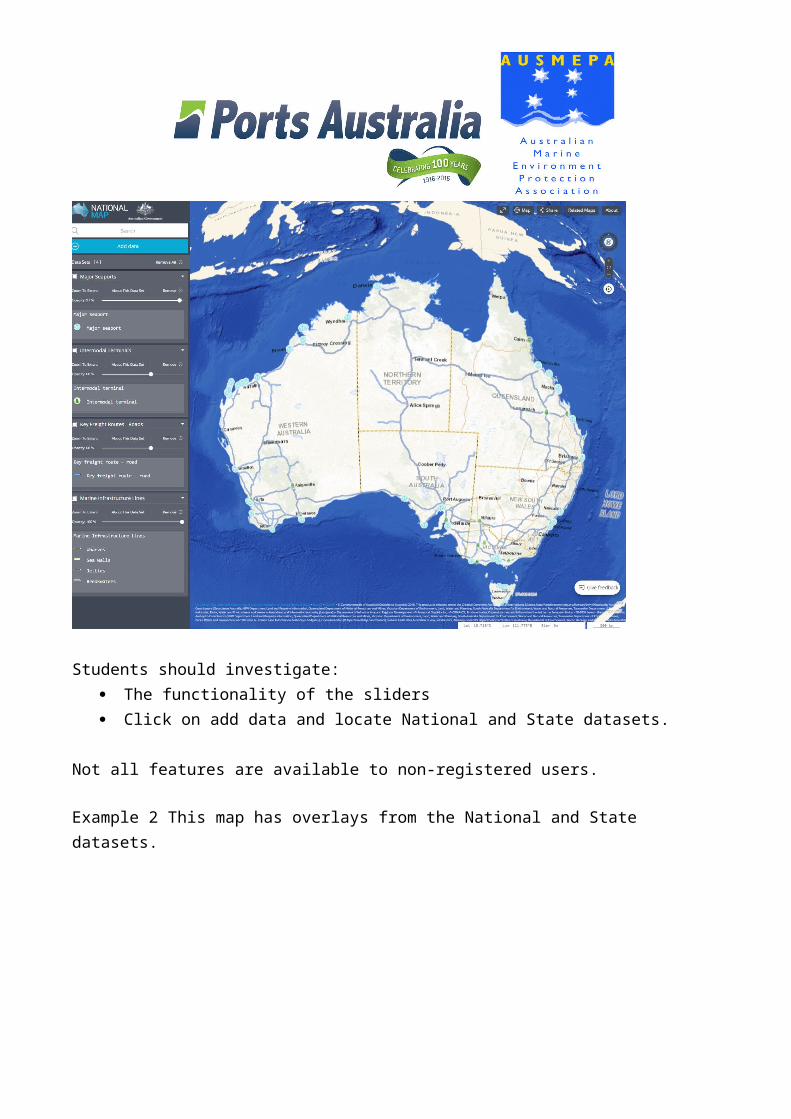
Example 1. Click on this link and this map will come up https://nationalmap.gov.au/#share=s-4gu5OP8VGXAIzkyqpaRdF97SX6I
Students should investigate: The functionality of the sliders Click on add data and locate National and State datasets.
Not all features are available to non-registered users. Example 2 This map has overlays from the National and State datasets.
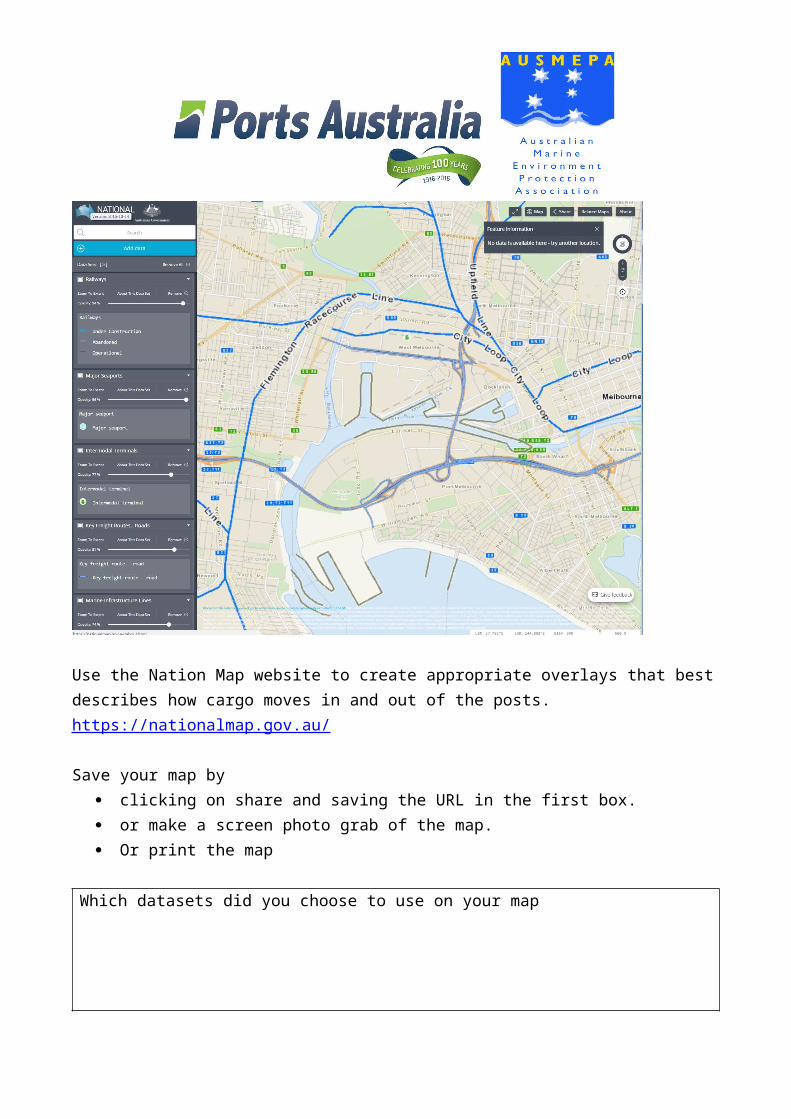
Use the Nation Map website to create appropriate overlays that best describes how cargo moves in and out of the posts.https://nationalmap.gov.au/
Save your map by clicking on share and saving the URL in the first box. or make a screen photo grab of the map. Or print the map
Which datasets did you choose to use on your map
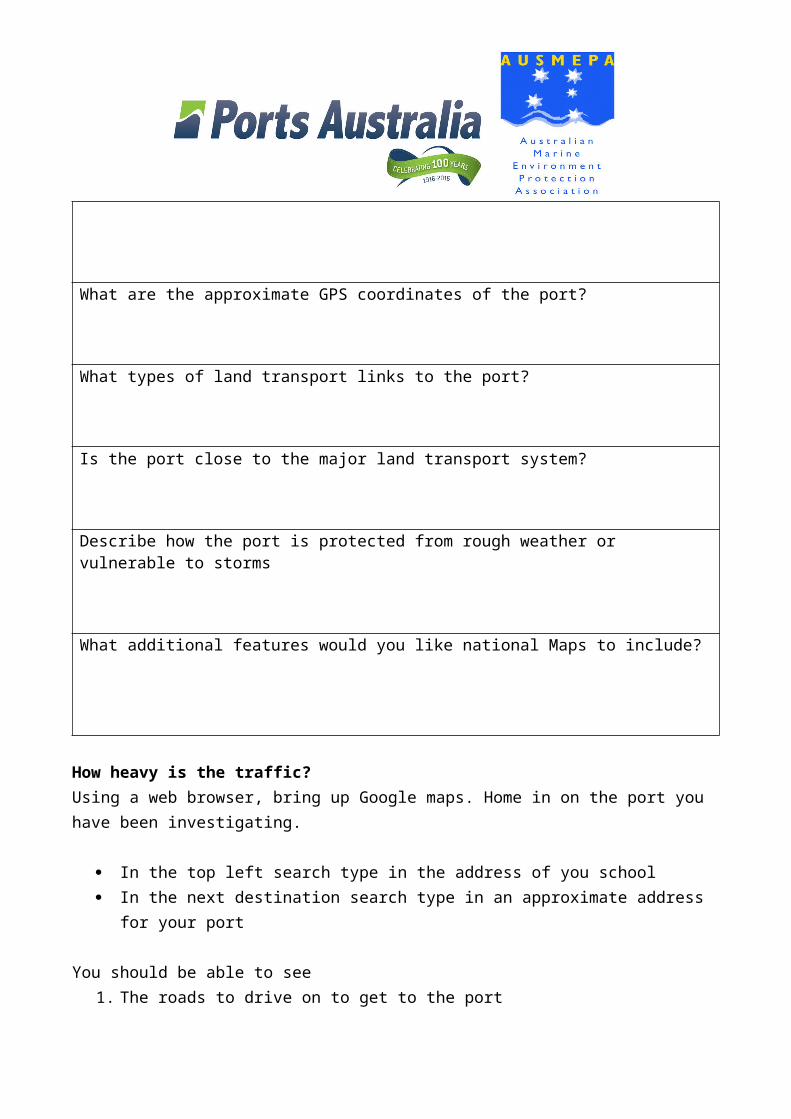
What are the approximate GPS coordinates of the port?
What types of land transport links to the port?
Is the port close to the major land transport system?
Describe how the port is protected from rough weather or vulnerable to storms
What additional features would you like national Maps to include?
How heavy is the traffic?Using a web browser, bring up Google maps. Home in on the port you have been investigating.
In the top left search type in the address of you school In the next destination search type in an approximate address for your port
You should be able to see1. The roads to drive on to get to the port2. Red and orange roads is where traffic is slow3. There should be below the search bar time to get to the destination using alternative
forms of transport.
What distance by road is the port?
How long would it take to drive to the port
Is the traffic being held up around the port?
How slow is the traffic within 10km of the port?
Will trucks have a hard time getting to and from the port?
Is there any evidence that trucks might be slowing down the traffic?
How easy or difficult is it to move goods in and out of the port
Fly over your port using Google Earth
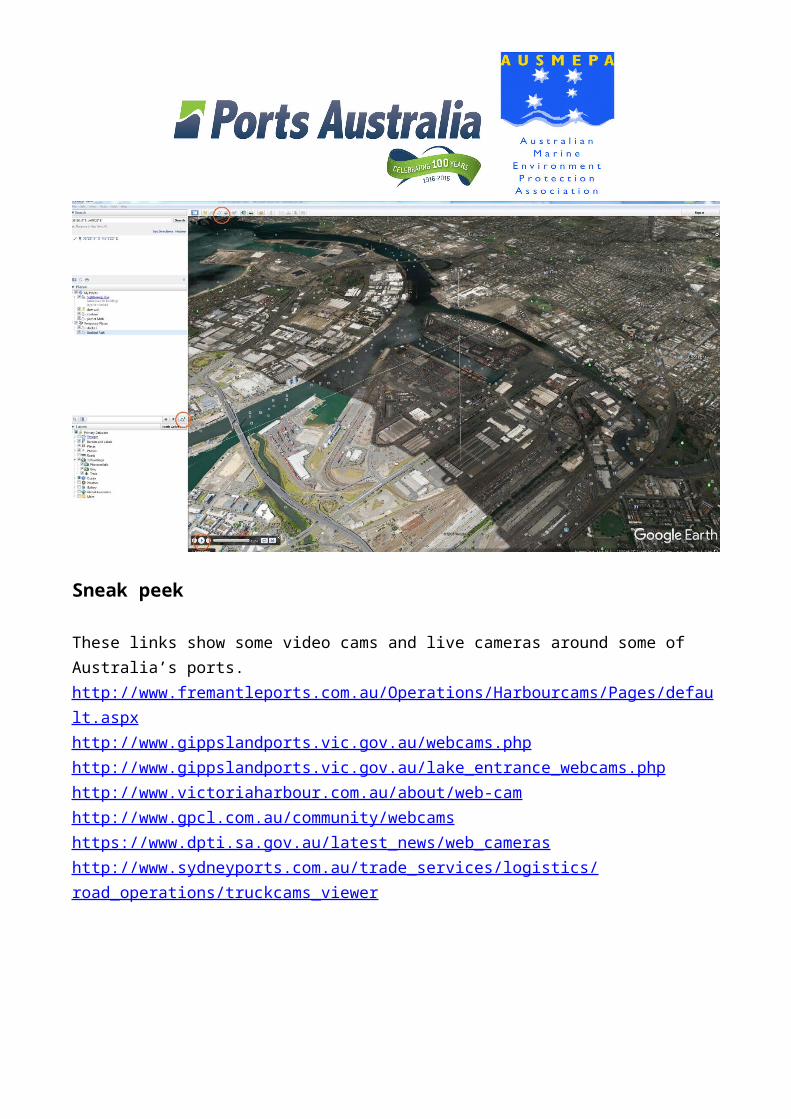
With Google Earth it is possible to do a 3D flyover. It’s a bit messy so when a student has worked it out, they might use a smart board to show the rest of the class. The Google Earth screen-save has three red circles of the items you will need to use.
Steps:1. Add path: On the top menu bar is a button called Add Path (see top red circle
below)2. Name properties: A box will pop up on the left of the screen. Give it a name of your
choice and click on OK3. Click once at either end: A square curser will replace the normal one. By clicking
on two locations, a line will appear. This will be the path you will do the fly over. Click two locations which will produce a line across the port that will be of greatest interest.
4. Switch to 3D: About half way down the left hand side of the screen is the layers menu. Make sure that layers is switched on for 3D
5. Play tour: Just above the layers menu is another bar. Click on the button called play tour is between the bar and the map. (see red circle in the middle on the of screen-save)
6. Click on play: At the bottom left click on play (see bottom red circle)
If nothing happens do some random clicking.
Sneak peek
These links show some video cams and live cameras around some of Australia’s ports. http://www.fremantleports.com.au/Operations/Harbourcams/Pages/default.aspx http://www.gippslandports.vic.gov.au/webcams.php http://www.gippslandports.vic.gov.au/lake_entrance_webcams.php http://www.victoriaharbour.com.au/about/web-cam http://www.gpcl.com.au/community/webcams https://www.dpti.sa.gov.au/latest_news/web_cameras http://www.sydneyports.com.au/trade_services/logistics/road_operations/truckcams_viewer
Lesson 4Trading partner
Equipment and materials:Access to computers and the internetDigital projector with computer or smartboardStudent activity available in electronic form so they can access links
Top 5What are our top 5 trading partners? Click on Where and scroll down https://www.weareports.com.au/
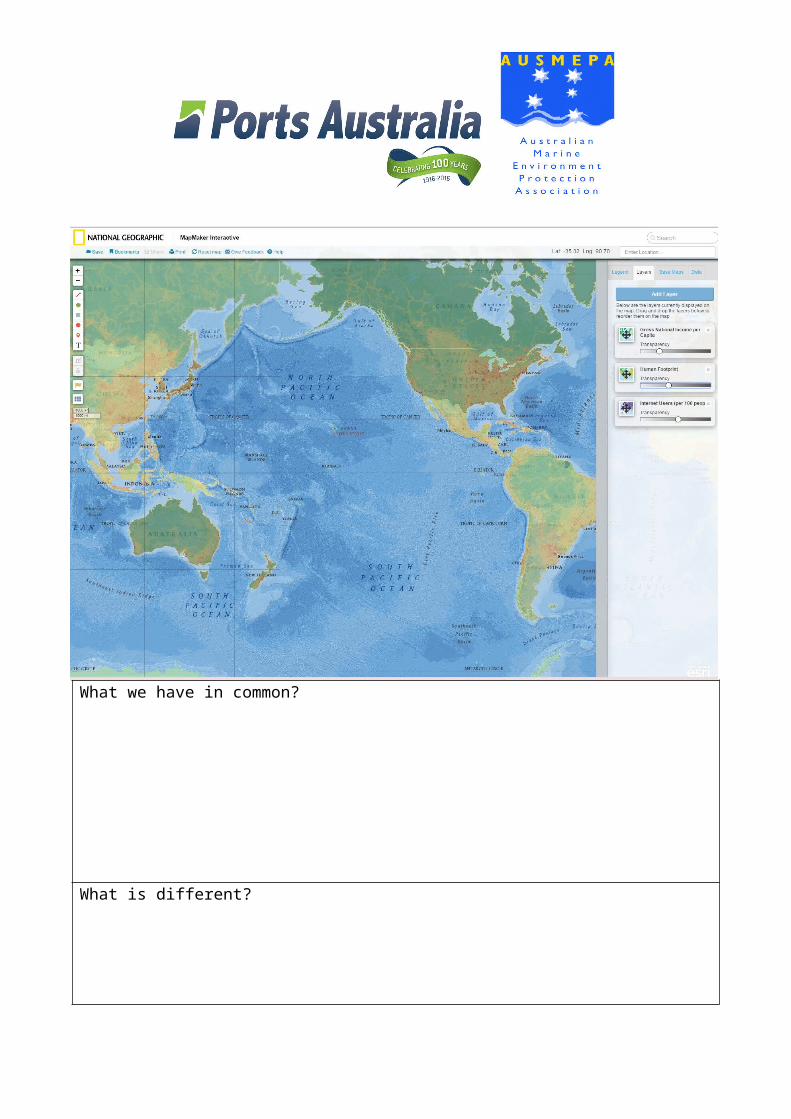
How do our trading partners help each other?Use National Geographic’s mapping website. http://mapmaker.nationalgeographic.org/#/ Add layers: Add layers to the map to find out what we have in common and what is different about our trading partners. Add and remove layers for:
Human population Economy Environment
What we have in common?
What is different?
Trade statistics
Use the DFAT website to find out how much trade and what we trade with our top 5http://dfat.gov.au/trade/resources/trade-at-a-glance/Pages/default.aspx http://dfat.gov.au/trade/resources/trade-at-a-glance/Pages/goods-by-country.aspx
Country What Australia exports and value in $
What Australia imports and value in $
Top 10 exports of goods and services exported The chart that comes up on the DFAT website has an import/export button at the top. Highlight the import/export buttons to go between charts. http://dfat.gov.au/trade/resources/trade-at-a-glance/Pages/top-goods-services.aspx
What will our trading partners do with the goods and service provided by Australia?
What will Australia do with the goods and services our partners provide to Australia?
Extension This daft webpages provide reports of exactly what has been traded between Australia and every other country in the world. http://dfat.gov.au/trade/resources/Pages/trade-and-economic-fact-sheets-for-countries-and-regions.aspx This is an example of the report on trade with Chinahttp://dfat.gov.au/trade/resources/Documents/chin.pdf Students summarise what type of information these reports present.
Lesson 5A container of goods
Equipment and materials:Access to computers and the internetDigital projector with computer or smartboardStudent activity available in electronic form so they can access links
IntroductionIf your family were to move permanently overseas, they could pack one or more shipping containers and have it sent to any town or city in the world. It would take a few weeks and if it were arranged to turn up to an address, it will arrive soon after it was unloaded at the destination port. Many of our belongings arrived in Australia inside a shipping container.
There are many steps required to get goods from one destination to another.
Complete a supply chain powerpoint
You are provided with a powerpoint with images arranged randomly.1. Research how goods get from a supplier in Australia to overseas via a port or from
overseas to Australia.2. Arrange the powerpoint slides in the order to wish to tell your story.3. Delete slides you don’t need and add images or more slides as you need them.
Research websites Getty images: video of portshttp://www.gettyimages.com.au/detail/video/view-of-shipping-container-at-dangjin-port-with-stock-video-footage/460737042 AUSMEPA: Ports and the marine environment http://www.ausmepa.org.au/ports-and-the-marine-environment/ Ports Australia http://www.portsaustralia.com.au/
Examples of companies that move shipping containersBest global movershttp://au.bestglobalmovers.com/ Affordable shippinghttp://www.affordableshipping.com.au/
ExtensionWhere did my car come from?Track iron ore from Australia to Korea where it is processed into steel and then a Korean car is shipped back to Australia where it is displayed in a car dealer’s show room. How many steps can you find?
Lesson 6Our ports making a difference
Equipment and materials:Access to computers and the internetDigital projector with computer or smartboardStudent activity available in electronic form so they can access links
Mind mapsGo to google images and type in: mind map. Mind maps are diagrams. They show relationships between items using lines. With the find map you will be doing, there is a central theme.
Individual or small groups choose one of the mind map themes People employed to operate ports including ship, tug, truck and rail services Businesses and employees that depend on imports Businesses and employees that depend on exporting Overlayed on a world map a mind map of how countries are connected with Australia How I as an individual depend on imports
Resources that may be useful:
People employed to operate ports including ship, tug, truck and rail services Ports Australia: click on whohttps://www.weareports.com.au/ AUSMPEPA port and ship operationshttp://www.ausmepa.org.au/ports-and-the-marine-environment/ http://www.ausmepa.org.au/ships-and-the-marine-environment/ Ports Australia Links: See Associations and Environment http://www.portsaustralia.com.au/about/links
Businesses and employees that depend on imports What are the imports used for? Many imports will be sold by sales people to consumers. Other imports are required to operate industry and farming.
Use a search engine to do an Australian search on importers DFAT: Composition of trade Australia 204-15. Read pages 26 and 50 of report http://dfat.gov.au/about-us/publications/Documents/cot-fy-2014-15.pdf OEC: place mouse over Imports chart for box to pop up with monetary value
http://atlas.media.mit.edu/en/profile/country/aus/
Businesses and employees that depend on exporting. DFAT: Composition of trade Australia 204-15. Read pages 25 and 48 of report http://dfat.gov.au/about-us/publications/Documents/cot-fy-2014-15.pdf Austrade Export markets https://www.austrade.gov.au/Australian/Export/Export-markets/Industries OEC: place mouse over Export chart for a box to pop up with monetary value http://atlas.media.mit.edu/en/profile/country/aus/
Overlayed on a world map a mind map of how countries are connected with AustraliaAustrade browse the market by country https://www.austrade.gov.au/Australian/Export/Export-markets/Countries OEC: place the mouse over the Destination and Origins charts to obtain a monetary value of imports and exports http://atlas.media.mit.edu/en/profile/country/aus/
Lesson 7 Communication
Equipment and materials:Access to computers and the internetDigital projector with computer or smartboardStudent activity available in electronic form so they can access linksArt materials, cameras, video gear depending on what students wish to do
Individuals or small groups will design a communication product that explains why your closest port is important to a specific group in your community.
Complete the sentenceTo find out what stood out for you do the following activity:From what you have discovered during these lessons, write the first words that come to mind to complete the sentences below. I was surprised by
I didn’t know
I enjoyed learning or doing
Ports link communities by
My favourite website was
Ports are important
Criteria for the communication project Provides a clear message about some benefits that ports provide to a section of your
community. The product can be displayed or used on the internet. The product is a single web page or single product. The design is up to those developing it. It can include a photographs, scans, videos etc of materials students have
developed for the communication product. If students are not able to design it in a web page, they can design it in a word
document or using a graphic package and exporting a jpg. .
CompetitionDiscuss with your teacher if you are able to enter your communication product into the Ports Australia education competition. Entry must be in by the end of term two 2017
Decide: who your audience is going to be what message you want to give to your audiences and the media and method you will use to produce your product.
Examples of communication projects: Showing careers that students can aspire to – working with or servicing ports Develop an image for local traders that show how ports connect communities to the
world. Raise awareness in your community of what occurs beyond the fences of a port. Create a mind map type image showing the jobs that ports generate Do an advertising poster with a few catchy words that explains the importance of
ports to a primary industry. Write a media release about your local port explaining what benefits people (their
readers) enjoy. Develop a new logo for your local port showing how it connects goods and people.
Fill in the table
Who is your audience?
What is your message?
What medium will you use?
Will it meet criteria?
Our plan


![Interconnected Systems [Kompatibilitätsmodus]](https://img.pdfslide.us/doc/110x75/6241c6f30e4f7279512665fa/interconnected-systems-kompatibilittsmodus.jpg)