Embed Size (px)
Citation preview
Economic benefits to the Australian Beef Industry Griffith & Thompson
Australasian Agribusiness Review ‐ Vol.20 ‐ 2012 Paper 2
ISSN 1442‐6951 ---------------------------------------------------------------------------------------------------------------------
The Aggregate Economic Benefits to the Australian Beef Industry from the Adoption of Meat Standards Australia: updated to 2010/11 +
Garry Griffith and John Thompson*
Garry Griffith, Cooperative Research Centre for Beef Genetic Technologies, University of New England, Armidale and Adjunct Professor, School of Business, Economics and Public Policy, University of New England, Armidale, NSW.
John Thompson, Adjunct Professor, School of Environmental and Rural Science, University of New England, Armidale, NSW.
.
---------------------------------------------------------------------------------------------------------------------------------------------
Abstract
Meat and Livestock Australia and the Cooperative Research Centre for Cattle and Meat Quality funded a major R&D program in the mid 1990s to investigate the relationships between observable beef and cattle characteristics, cooking methods and consumer appreciation of beef palatability. Out of this R&D program grew the Meat Standards Australia (MSA) voluntary meat grading system which was aimed primarily at providing an accurate prediction of beef eating quality for the domestic market. The MSA system commenced operations in 1999/2000. The gross benefits associated with using the MSA system were quantified by using data on the number of carcases graded and certified, a survey of retailers and wholesalers based on prices for MSA graded beef (3 star or better) versus ungraded beef, and market reports of prices paid for MSA quality cattle versus non-MSA quality cattle.
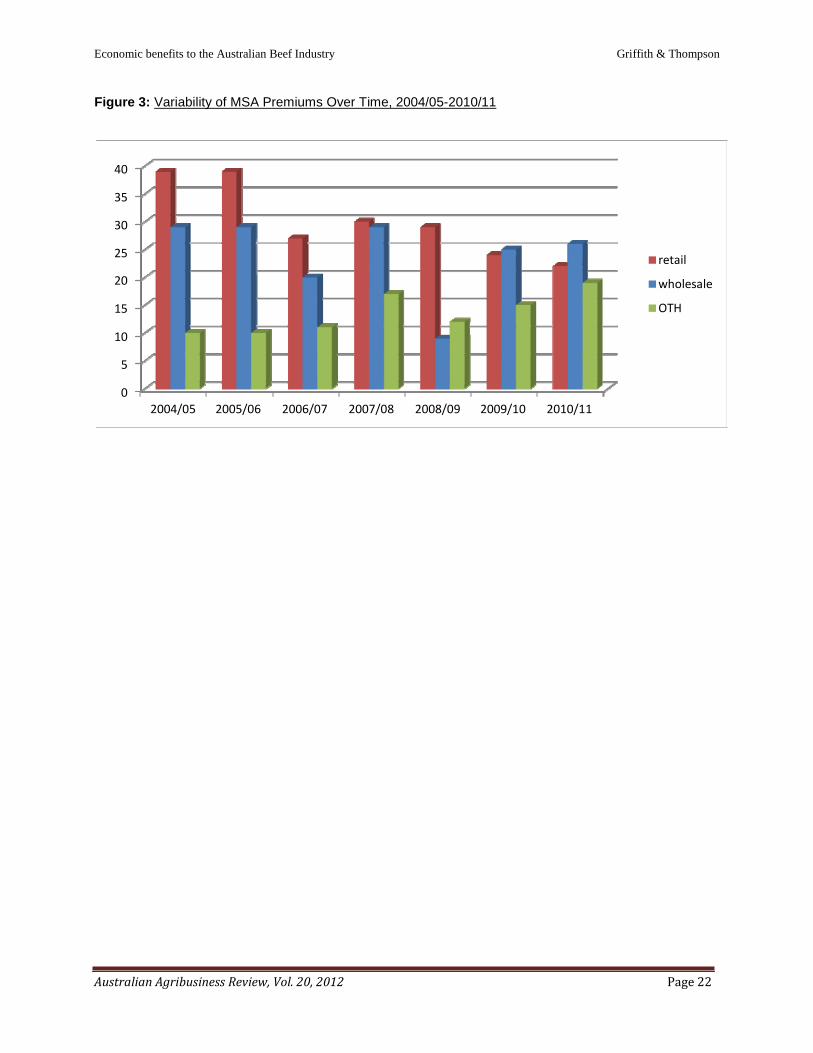
Over the period 2004/05 to 2010/11, beef consumers across Australia were prepared to pay on average $0.30/kg extra for MSA branded beef on a carcass weight equivalent basis to guarantee tenderness. This beef is primarily sold through independent butcher shops, although one of the major supermarket chains has now started selling MSA branded beef. The retailers kept about $0.06/kg and paid their wholesale suppliers the remaining $0.24/kg to source MSA compliant cattle and MSA graded carcasses. About $0.13/kg was passed back to cattle producers on average. The cumulative retail-level economic benefit of the MSA system to 2010/11 is estimated to be around $523 million, with a current annual benefit of around $77 million over the past three years. After accounting for all the costs of development and implementation, net benefits are at least $200 million.
1. Background
Meat Standards Australia (MSA) is a voluntary beef grading system aimed at describing and predicting the eating quality of individual cuts in the beef carcass prepared using a number of cooking methods. The MSA system represents a new approach to the grading of beef. First, the grades are based on taste panel responses using untrained consumers. Second, it uses a Total Quality Management approach, whereby the system addresses all critical control points along the supply chain, from the genetics of the animals to the cooking method used by the consumer (Polkinghorne et al. 1998, Thompson 2002).
Whilst development of the MSA system was an advance in accuracy over other grading schemes, it was simply a model to predict the eating quality of beef. By itself, it offered little commercial advantage to the Australian beef industry, unless it was integrated into a business model that included procurement, value
+ This paper is an update of Griffith et al. (2009), so much of the material in sections 1 and 2 is simply a repeat of the material already published. * The authors acknowledge the assistance of Janine Lau and other Meat Standards Australia staff for the provision of data, Andrew Alford of Meat and Livestock Australia for data and advice, and Vic Wright and an anonymous referee for some very helpful suggestions.
Australian Agribusiness Review, Vol. 20, 2012 Page 11

Economic benefits to the Australian Beef Industry Griffith & Thompson
Australian Agribusiness Review, Vol. 20, 2012 Page 12
adding and retailing. Polkinghorne et al. (2008b) described a commercial model which utilised the MSA grading system to retail meat based on eating quality and cooking method, independently of the traditional cuts of beef. The commercial model proposed by Polkinghorne developed a payment system to the wholesaler and producer based on a fixed proportion of retail value, which made it easier to reward partners in the supply chain for small increments in eating quality, as opposed to the conventional marketing grid system which often provided little or no incentive for improvements in eating quality. Whilst the MSA scheme was initially developed for the Australian domestic market, more recently it has been used to describe eating quality of beef for several export markets (MLA 2008). Therefore the MSA prediction model provides a tool which if integrated into a process for beef procurement and retailing, can be used to deliver a guaranteed eating quality outcome to the consumer. Over time the application of MSA has the potential to improve overall beef quality, and given development and refinement of feedback systems and pricing differentials which reflect differences in eating quality, to strengthen supply chain linkages.
As described by Watson et al. (2008), much of the empirical modelling underpinning the MSA system was based on research that was either in the public domain, or was commissioned by Meat and Livestock Australia (MLA) and the Cooperative Research Centre for Cattle and Meat Quality (Beef CRC). The research undertaken by Beef CRC and MLA focused on quantifying the relationships between animal traits (the proportion of Bos indicus, HGP status, carcass weight, marbling and ossification scores), lairage (ultimate pH), processing (pH/temperature decline and hanging method), value adding (ageing or conditioning of the cut post-mortem) and cooking methods (grill, roast, stir fry, slow cooking and corning), with consumer palatability of the beef. As part of the initial taste panels, untrained consumers were asked to score meat samples cooked using a particular cooking method for tenderness, juiciness, like flavour and overall liking. They were then asked to classify the samples into one of 4 grades: 2 star (unsatisfactory), 3 star (good everyday), 4 star (better than everyday) or 5 star (premium). These scores were then analysed using a discriminant analysis, to firstly combine the individual scores for tenderness, juiciness, flavour and overall liking into a single meat quality score (MQ4), and secondly, to determine the boundaries of the 2, 3, 4 and 5 star grades on the new MQ4 scale. The end result was the development of a model to predict palatability of beef using commercially measurable traits. The MSA model accounts for approximately 50 per cent of the variance in consumer scores (Thompson et al. 1998) which was approximately four to five times more accurate than the US beef grading scheme (Smith et al. 1987). Since this research commenced in 1996, over 80,000 consumers have participated in MSA consumer taste testing, providing palatability scores on over 560,000 cuts of beef (MLA 2011). The original release was a 12-cut version (Polkinghorne et al. 1998). The current (fourth commercial) version now predicts 135 cut-by-cooking method consumer outcomes for each graded carcass (Polkinghorne et al. 2008a).
MSA commenced implementation with a trial in Brisbane in 1996, followed by a staggered national rollout in 1999/2000. All sectors of the beef marketing chain are expected to receive economic benefits from the adoption of MSA. For producers, MSA provides standards and best practice guidelines to achieve compliance with specified target grades. Being a registered MSA producer means that they can get feedback on the quality of the carcasses that they are providing and access to tools to improve on-farm management decisions. The MSA system also means that pricing signals could be passed more easily along the supply chain. For example, a producer’s decision to alter a certain management practice could affect the grade of their cattle and thus the prices they could get.
For processors, MSA provides standards that will achieve better and more consistent eating quality. For retailers and wholesalers, MSA provides a guarantee of eating quality and allows retailers to more easily identify the quality of the product they buy. The grading system also established an option for an MSA brand, which could be carried through to the retail level, enabling consumers to identify the eating quality of the product. The MSA brand has not always been carried through to consumers. For example, until recently large supermarkets often substituted their own private label brands for that of MSA (Woolworths now explicitly market their beef as MSA).
Currently the adoption of MSA technology is increasing and this would suggest that an adequate level of return can be generated. However, the potential returns could be much higher if the principles of MSA were fully adopted to grade meat on quality (eg the system described by Polkinghorne et al. 2008b). A study commissioned by MLA identified eating quality as a key determinant of consumer satisfaction, even outweighing price as the most important consideration when buying beef (Millward Brown 2003). This
Economic benefits to the Australian Beef Industry Griffith & Thompson
Australian Agribusiness Review, Vol. 20, 2012 Page 13
same study found that perceptions of beef quality had improved in the period 2000 to 2003, with 38 per cent of those surveyed identifying improvements in beef quality compared to only 13 per cent who viewed quality as worsening over the same period. More recent surveys suggest that consumer satisfaction has improved over the whole period of the program (Millward Brown 2007a). Some part of this improvement in the perception of beef quality must reflect the development of the MSA system.
The purpose of this paper is to provide an updated estimate of the magnitude of the aggregate benefits to 2010/11 of this large research and development investment by the Australian beef industry.
2. Economic Framework for Evaluation
Quality-enhancing research has become increasingly important. However, compared with the number of studies undertaken to assess the economic benefits from cost-reducing (or yield-increasing) research, economic analysis of research that aims to improve the desirable characteristics of a commodity has not been widely covered in the literature. In addition, there is some debate about how to model research- induced quality improvements.
One approach is to model quality improvements in agricultural commodities as a change in the demand for these commodities, so that an improvement in the quality of the product can be shown to result in an upward or rightward shift in the ordinary demand curve for the product (Ladd and Suvannunt 1976; Unnevehr 1986, 1990). In this type of analysis, an approximation of the gross gain from the demand expansion effect of improved product quality is the initial increase in retail price times the initial output (or, with the assumption of a fixed margin, the initial increase in the farm price times the initial output). This is sometimes called the incremental profit approach, where this increased “profit” is eventually distributed to producers and consumers in relation to the relative slopes of the demand and supply curves, as the market adjusts over time to the new level of consumer willingness-to-pay1.
An alternative approach is to view quality-enhancing research as a change in supply conditions rather than as a change in demand conditions. In this approach, different qualities of a commodity are defined as different commodities (e.g., normal wheat and high-lysine wheat would be treated as two separate, even if highly substitutable, commodities) and a technical change that leads to a change in quality is modelled as a shift in the supply of the commodities in question rather than as an ad hoc shift in demand (Brennan, Godyn and Johnston 1989; Voon 1991, 1992, 1996). A common assumption in these types of studies is that there is no substitution in demand between the different wheat qualities. However, when a product is treated as a heterogeneous commodity, with discrete variations in quality defined in terms of quality characteristics, the different product types are likely to be related through both production and consumption. This can lead to serious measurement difficulties in the welfare of identifiable groups.
However, a more fundamental problem for the present application is that MSA is fundamentally just a grading system – it is an improvement in the reliability of information surrounding exchanges. In fact, the MSA logo says “tenderness guaranteed”. Thus there is no change in quality per se, so there is unlikely to be higher aggregate consumption of beef in the domestic market. There may be some substitution between MSA-graded beef and non-MSA-graded beef, but there is no information on the price elasticities of demand for these two segments nor on the respective quantities involved at the retail level. The only data available are for the number of carcasses graded for MSA by meat processors, the number of carcasses that actually achieve the MSA grade and the unit premiums attributed to MSA product at the live animal, carcass and retail market levels. This means that a simple incremental profit analysis is all that can be done, and what we are measuring is the premium that wholesalers, food service operators, beef retailers and final consumers are willing to pay to have a tenderness guarantee on their beef purchases.
3. Carcass Gradings and Compliance
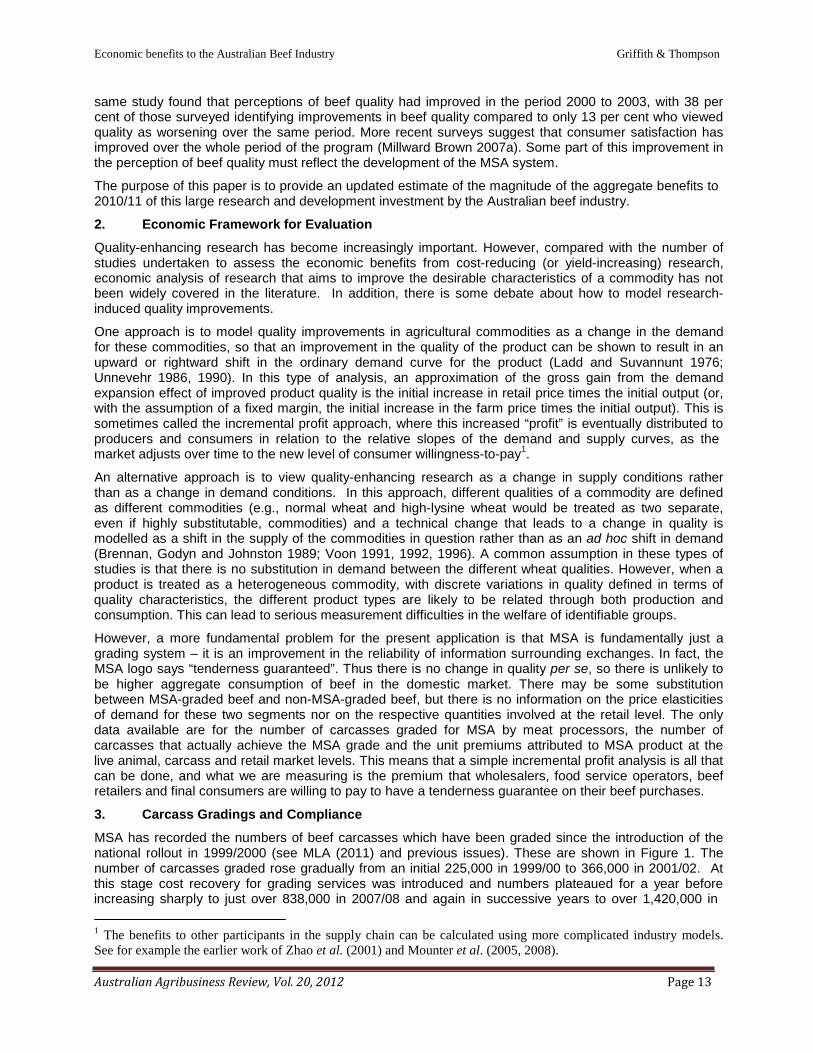
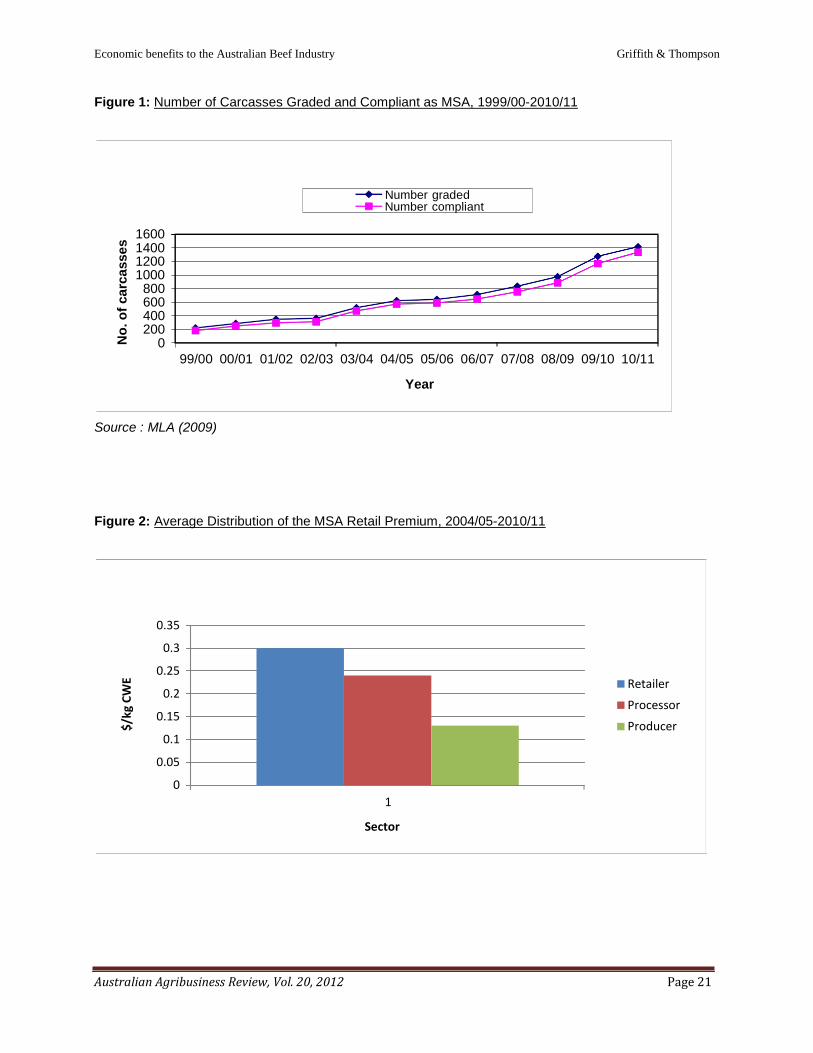
MSA has recorded the numbers of beef carcasses which have been graded since the introduction of the national rollout in 1999/2000 (see MLA (2011) and previous issues). These are shown in Figure 1. The number of carcasses graded rose gradually from an initial 225,000 in 1999/00 to 366,000 in 2001/02. At this stage cost recovery for grading services was introduced and numbers plateaued for a year before increasing sharply to just over 838,000 in 2007/08 and again in successive years to over 1,420,000 in
1 The benefits to other participants in the supply chain can be calculated using more complicated industry models. See for example the earlier work of Zhao et al. (2001) and Mounter et al. (2005, 2008).
Economic benefits to the Australian Beef Industry Griffith & Thompson
Australian Agribusiness Review, Vol. 20, 2012 Page 14
2010/11. Queensland represents about half of all MSA gradings in recent years, followed by West Australia and New South Wales with between 150,000 and 200,000 each, but numbers graded are increasing rapidly in some of the smaller states such as Tasmania and South Australia. The total number of carcasses graded to June 2011 exceeds 9.1 million.
Carcass gradings now represent around a third of the total number of carcasses slaughtered for the domestic market (based on ABARE 2009), although Polkinghorne et al. (2008a) suggest that the number of carcasses graded represents a much higher proportion of all “eligible” carcasses destined for the domestic market.
The other part of the quantity side of the analysis is the level of compliance to MSA specifications. That is, of the carcasses graded for MSA, what proportion achieved the MSA tag? According to MLA (2009), compliance in 2006/07, 2007/08 and in 2008/09 was over 90 per cent, down from around 92 per cent in the immediately preceding couple of years but up substantially from levels around 85 per cent in the initial years of operation. In the last three years, compliance has continued to improve and exceeded 94 per cent in 2010/11 (MSA 2011). These data are also shown in Figure 1. Failing to meet the meat colour specification was the most common cause of non-compliance, with higher than acceptable pH levels also a problem.
4. Price Premiums
Meat Standards Australia began conducting pricing surveys during 2005 (MLA 2005). Initially, face to face and telephone interviews were conducted each week from January to September, across the wholesale, food service and retail sectors in Brisbane, Sydney, Melbourne, Adelaide and Perth, for 13 separate cuts of beef. Some 25,900 prices in total were collected during the survey across these three market levels. Another round of price surveys commenced in July 2006 for the 2006/07 financial year (Millward Brown 2007b), and the process was repeated during succeeding years (MLA 2008, 2009, 2010, 2011). The average annual retail and wholesale prices for MSA and non-MSA product, and the premiums attributable to MSA grading, are shown in Tables 1 and 2 respectively, for all time periods.
4.1 Retail
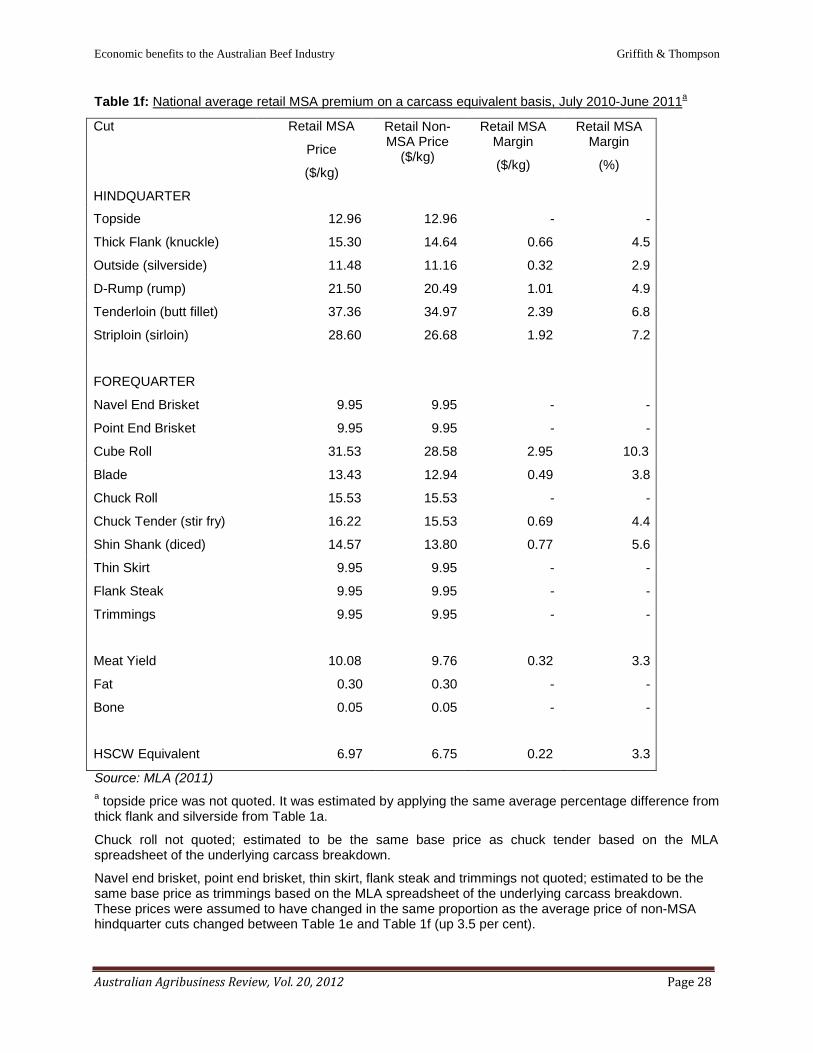
The value of the MSA scheme is created at the retail level, where final consumers are willing to pay premiums for beef cuts that are guaranteed tender compared to those cuts that are not guaranteed tender. The data show that the MSA-graded product has been well differentiated at the national retail level, with MSA prices higher than non MSA-prices in all but one product group. These data are shown in Tables 1a-1f for 2005/06 through to 2010/11. Average retail premiums of between $1.19/kg and $5.35/kg were achieved on more than half the cuts measured during the 2005 reporting period, and the national average retail premium on the ten cuts showing different prices was $2.18/kg. During the 2006/07 period, average retail premiums of between $0.93/kg and $3.31/kg were achieved on the four high value cuts, with the national average retail premium on the 11 cuts showing different prices being $1.63/kg. During 2007/08, retail premiums for MSA grading ranged up to $3.87/kg for cube roll, with an average over all graded cuts of $1.70/kg, while during 2008/09 the premiums were over $2/kg for the three high value cuts and $1.36/kg over all cuts graded. Retail premiums were retained at similar levels during 2009/10, but were reduced somewhat during 2010/11.
Although not shown here, there have been some large differences in price levels and price premiums for the various cuts across the states and over time, at both the retail and wholesale levels. These detailed data are available on the MSA website (MLA 2007, 2008, 2009, 2010, 2011).
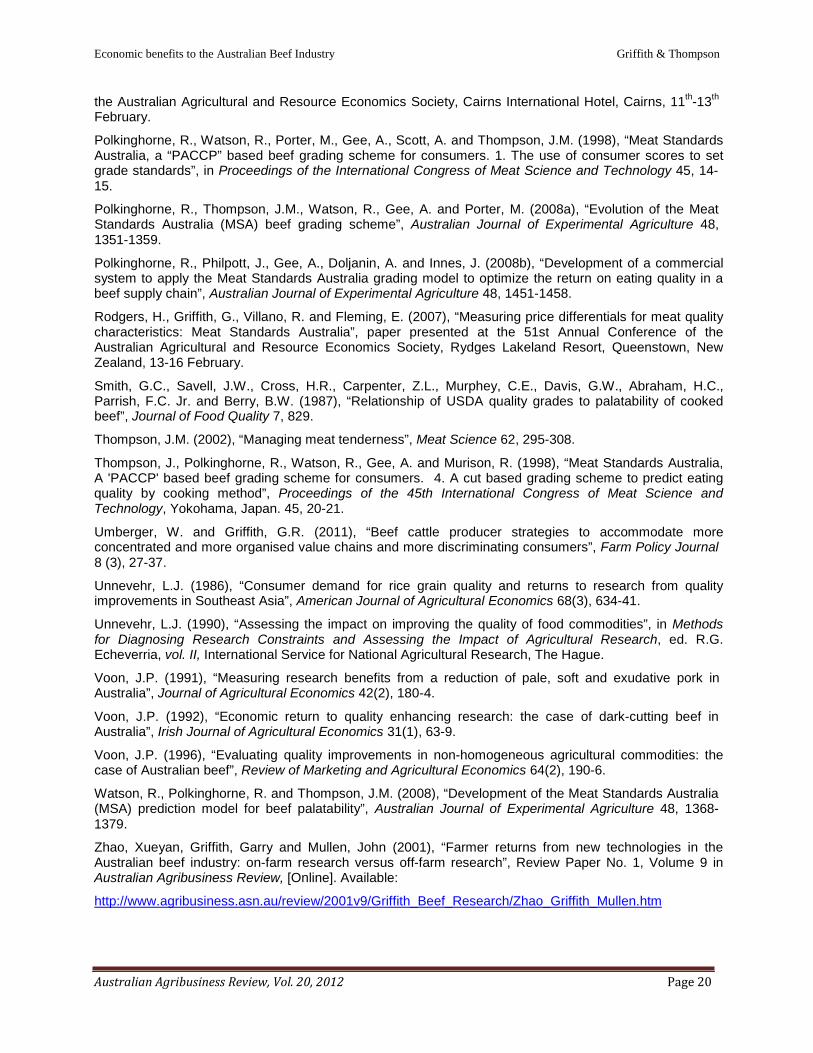
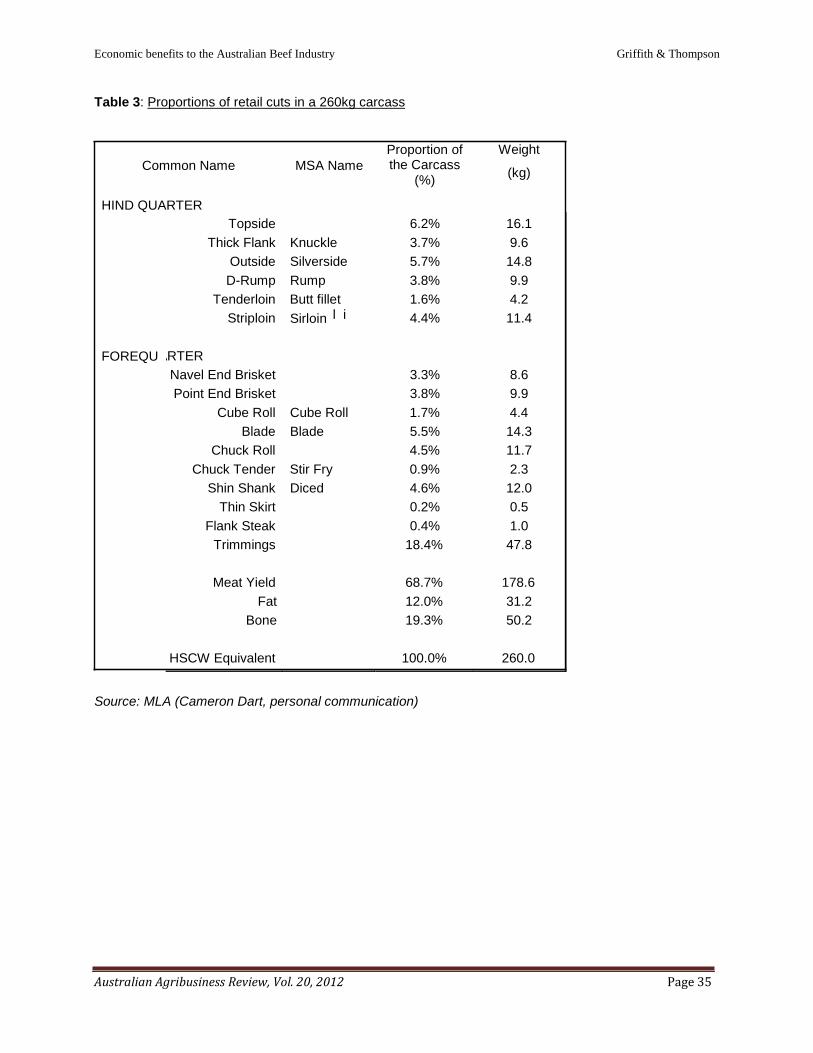
Our quantity data are the number of carcasses graded, so for a consistent evaluation of the economic impacts of the adoption of the MSA grading scheme we need to convert these reported price differences across a dozen or so retail cuts of beef into a carcass equivalent value. This was done using the data in Table 3, which shows the proportions of a standard 260kg domestic “trade” carcass made up by the various MSA cuts as well as all the other components of the carcass.

Economic benefits to the Australian Beef Industry Griffith & Thompson
Australian Agribusiness Review, Vol. 20, 2012 Page 15
Applying these proportions to the retail prices for all the individual cuts and the other components of the carcass allowed the MSA premium to be calculated on a retail carcass equivalent basis (Tables 1a – 1f).2
This premium was calculated as $0.39/kg, or 6.3 per cent above the non MSA-graded carcass equivalent for the 2005 period3, with the premium for the meat-only component of the carcass being $0.56/kg. The carcass equivalent retail premium for the 2006/07 period was $0.27/kg, or 4.5 per cent, with the premium for the meat-only component of the carcass being $0.44/kg, while for the 2007/08 period the premium was $0.30/kg on a carcass equivalent basis or 4.8 per cent, and for the 2008/09 period the premium was $0.29/kg on a carcass equivalent basis or 4.3 per cent. For 2009/10 the average premium was $0.24/kg or 3.7 per cent, and for 2010/11 the premium was $0.22/kg or 3.3 per cent. So although price levels for beef have increased slightly from early 2005 to 2010/11 (ABARE 2009), the margins for MSA product at retail have contracted a little.
4.2 Wholesale
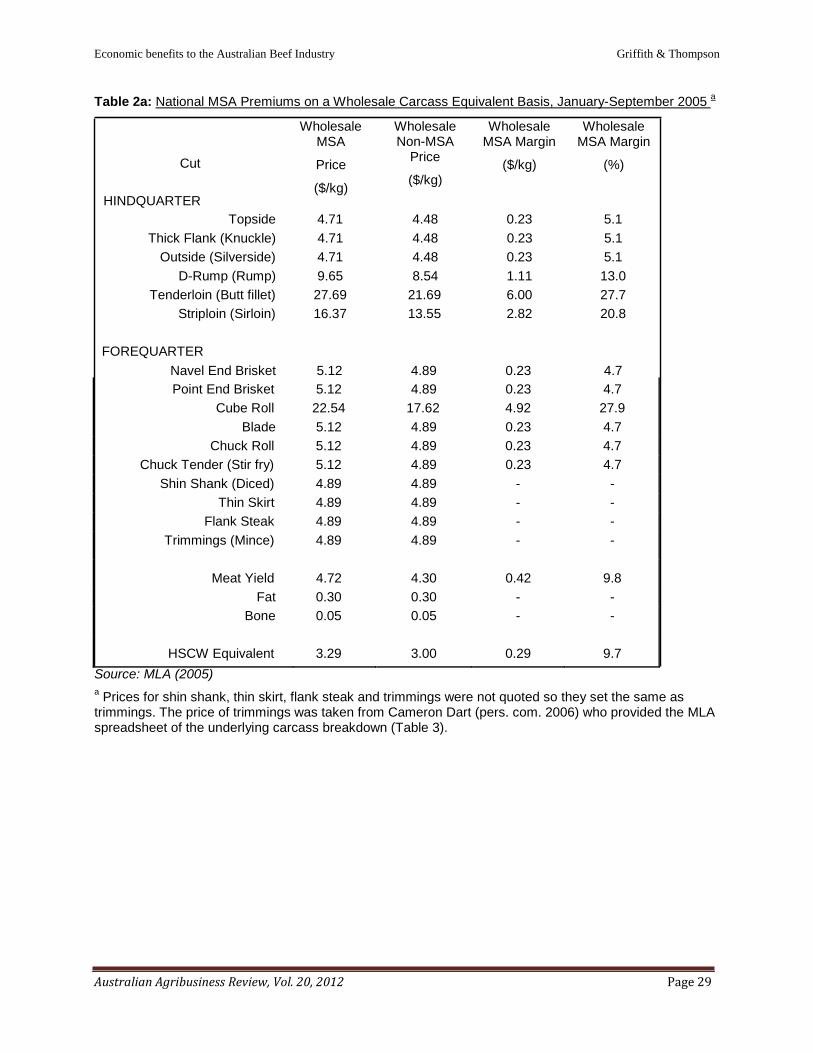
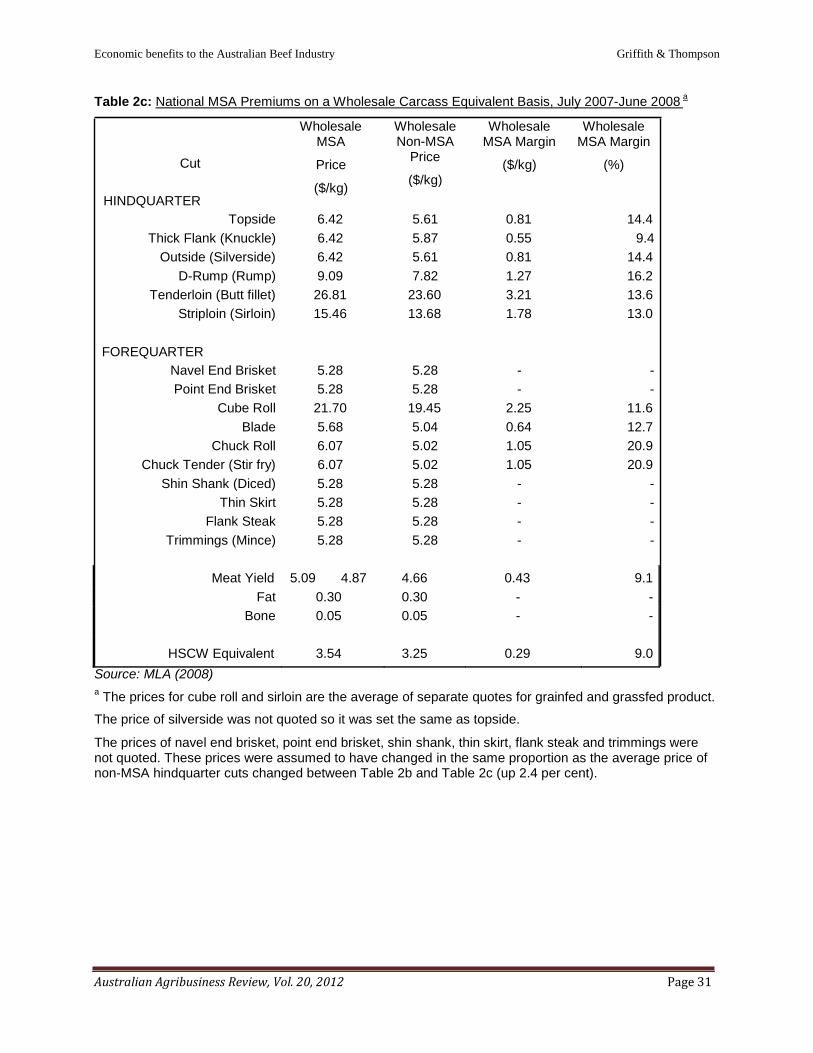
Wholesale premiums are the extra amounts that retailers will pay to processors who are able to supply carcases that meet MSA grades The data show that MSA-graded product has also been well differentiated at the wholesale level, with MSA prices higher than non MSA-prices in all product groups over all time periods, with only a couple of exceptions. The national average data are shown in Tables 2a- 2f. During 2005, average wholesale premiums of between $1.11/kg and $6.00/kg were achieved on the four major cuts, with the national average wholesale premium on the 12 cuts showing different prices being $1.39/kg. During the 2006/07 period, average wholesale premiums of between $1.69/kg and $4.01/kg were achieved on the four high value cuts, with the national average wholesale premium on the seven cuts showing different prices being $1.59/kg. During 2007/08, wholesale premiums were more evenly spread across cuts and ranged between $1.27 and $3.21 for the four major cuts, while during 2008/09 the average margins were much lower, being $1.60/kg for the four major cuts and $1.32/kg over all MSA cuts, and there were some negative margins evident. Wholesale margins picked up again in 2009/10 and 2010/11, with premiums of between $0.70/kg and $3.64/kg for the four major cuts, a higher aggregate margin and margins more evenly spread over all the differentiated cuts.
In a similar manner as for the retail data, a MSA premium on a wholesale carcass equivalent basis can be calculated (Tables 2a -2f).4 This premium was calculated as $0.29/kg, or 9.7 per cent above the non MSA-graded carcass equivalent for the 2005 period. For the 2006/07 period, the wholesale premium on a carcass equivalent basis was $0.20/kg, or 6.2 per cent, while for the 2007/08 period it was $0.29/kg or 9.0 per cent and for 2008/09 it fell to $0.09/kg or 2.9 per cent. Wholesale margins then recovered in 2009/10 and 2010/11, to around $0.25/kg, or about 7.5 per cent of the wholesale value of the non MSA-graded carcass equivalent.
2 The underlying price data supplied by MLA only relates to those cuts that are branded and sold as MSA. Prices during 2005 for the non-MSA components of the carcass were taken directly from the MLA spreadsheet of the underlying carcass breakdown (C. Dart, pers. com.). These prices were increased over the following survey periods in the same proportion as the increases in price for the non-MSA graded cuts. From 2006/07, the price for chuck roll was not quoted. It was estimated to be the same base price as chuck tender based on the MLA spreadsheet of the underlying carcass breakdown. Similarly, the prices of navel end brisket, point end brisket, thin skirt, flank steak and trimmings were not quoted. They were estimated to be the same base price as trimmings based on the MLA spreadsheet of the underlying carcass breakdown. In the 2006/07 to 2010/11 data, topside price was not quoted. It was estimated by applying the same percentage difference from thick flank and silverside from Table 1a.
3 Applying this same procedure to similar food-service sector price data for 2005 produced a premium for MSA product of $0.37/kg above the non MSA-graded carcass equivalent (Rodgers et al. 2007). 4 From 2006/07, the wholesale prices for cube roll and sirloin were reported for both grainfed and grassfed product. In the calculations of the carcass equivalent prices, an average was taken. Silverside price was not quoted from 2006/07, so it was set the same as the price of topside.

Economic benefits to the Australian Beef Industry Griffith & Thompson
Australian Agribusiness Review, Vol. 20, 2012 Page 16
4.3 Over-the-hooks
Live cattle submitted for MSA grading are sent to processors on consignment. Producers must certify that certain criteria are met relating to each animal and the production system where it has been grown out to slaughter weight. Base price levels and premiums and discounts for whether the cattle meet the various market specifications offered by that processor are known beforehand, but the actual price for each animal is only known after slaughtering and grading, thus “over-the-hooks”. Over-the-hooks cattle prices for MSA cattle were collected from Queensland and New South Wales commencing January 2007 by MLA’s National Livestock Reporting Service (NLRS), and for other states from 2007/08. These are the premiums that processors will pay to producers who are able to supply cattle that meet MSA grades (MLA 2009).
Over-the-hooks prices for 170-230kg yearling cattle in New South Wales for February-June 2007 show an average premium for MSA cattle of $0.04/kg, although with sub-periods of both much larger premiums and other periods of discounts. Queensland prices for the same weight range and time period show a premium for MSA cattle over grain-fed yearlings of $0.17/kg, and again with sub-periods of larger premiums and discounts. During 2007/08, the average premium for MSA 170-230kg cattle was $0.07/kg in New South Wales and $0.26/kg in Queensland (MLA 2008), while during 2009/09, the average premium for MSA 180-220kg yearling cattle was $0.13/kg in New South Wales and $0.11/kg in Queensland (MLA 2009). Over-the-hooks premiums continued to grow during 2009/10 and 2010/11, reaching $0.15/kg and $0.19/kg respectively across all states and weight ranges.
4.4 Summary
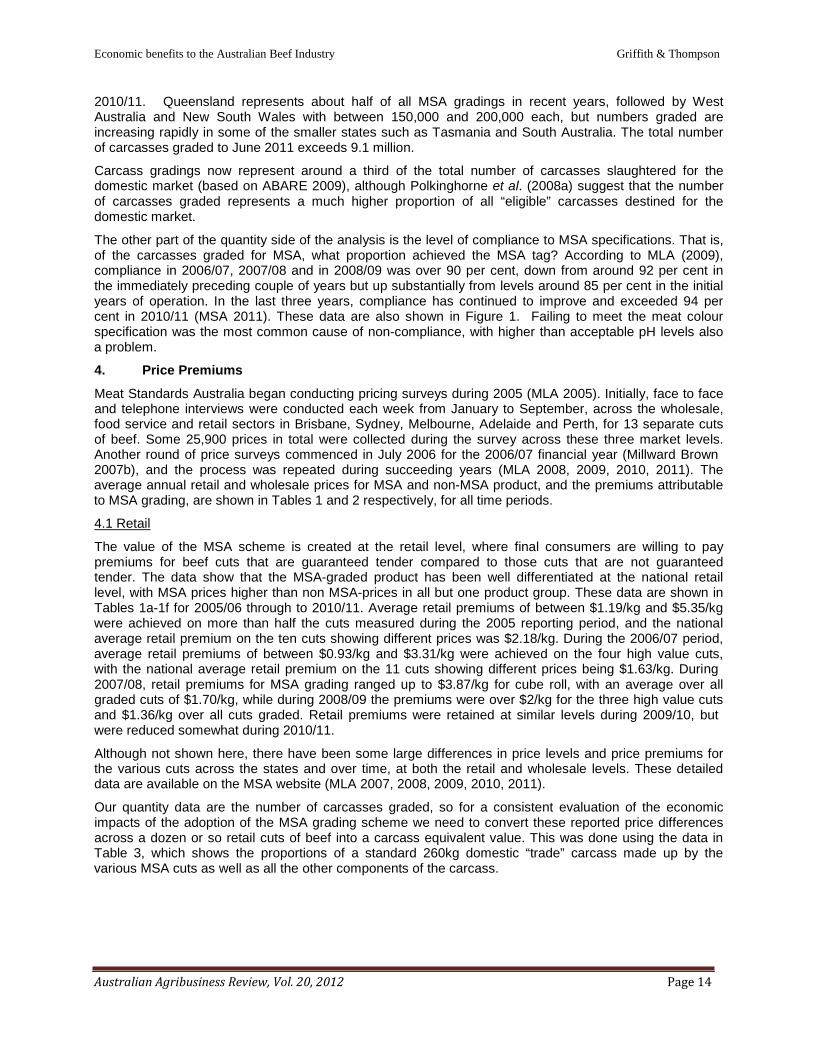
Thus, across Australia over the period 2004/05 to 2010/11, retail beef consumers were prepared to pay on average $0.30/kg extra for MSA branded beef on a carcass weight equivalent basis to guarantee tenderness. This beef is primarily sold through independent butcher shops. These retailers kept about $0.06/kg and paid their wholesale suppliers the remaining $0.24/kg to source MSA compliant cattle and MSA graded carcasses. About $0.13/kg was passed back to cattle producers on average (Figure 2). However premiums for live cattle that eventually grade MSA are relatively new, and vary considerably by State. In New South Wales where the MSA wholesale margin was typically well under the national average, less than $0.10/kg was passed back, while in Queensland where the wholesale margin was a little higher than the national average, around $0.18/kg was passed back.
Thus based on the average c/kg distribution of consumer willingness to pay over the period 2005/06 to 2010/11, retailers retain about 20 per cent of the value, wholesalers receive about 35 per cent of the value and cattle producers receive some 45 per cent.
5. Estimated Economic Impact
5.1 Aggregate benefits
In relation to the approximate economic analysis framework described above, we now have the two basic sets of data required to implement the calculations.
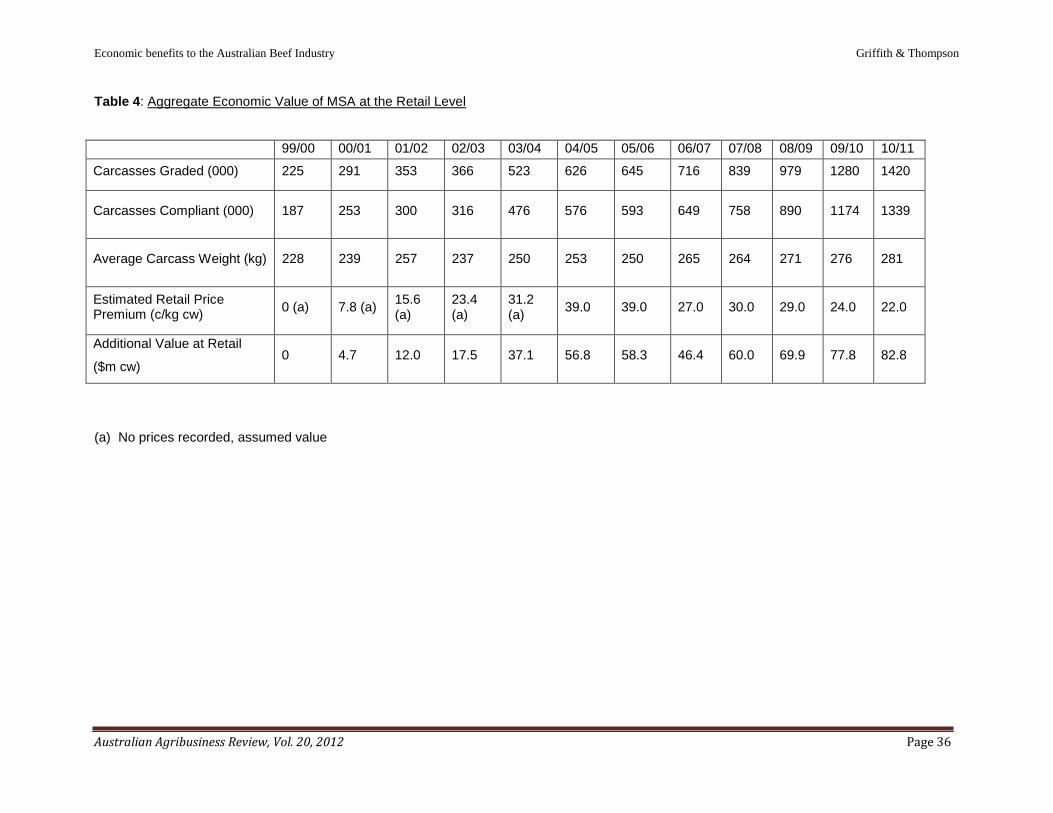
First though, we only have retail and wholesale price premiums for part of 2005 and for 2006/07 onwards. There were no similar price surveys done in previous years, so we need to estimate what the price premiums are likely to have been from 1999/00 until 2004/05. Although there is some anecdotal evidence that large premiums were available for some specialist butcher shops in the early days of MSA (Cameron Dart, pers. com., Rod Polkinghorne, pers.com.), we have made the very conservative assumption that there was no premium in the first year, and that premiums increased in a simple linear manner from 2000/01 until 2004/05, and continued at that level for 2005/06 (as shown in Tables 1a and 2a). Actual premiums for 2006/07 are available from Tables 1b and 2b, those for 2007/08 are in Tables 1c and 2c, those for 2008/09 are in Tables 1d and 2d, those for 2009/10 are in Tables 1e and 2e, and those for 2010/11 are in Tables 1f and 2f. The assumed and estimated premiums over time are shown in Tables 4 and 5 for the retail and wholesale market levels respectively.
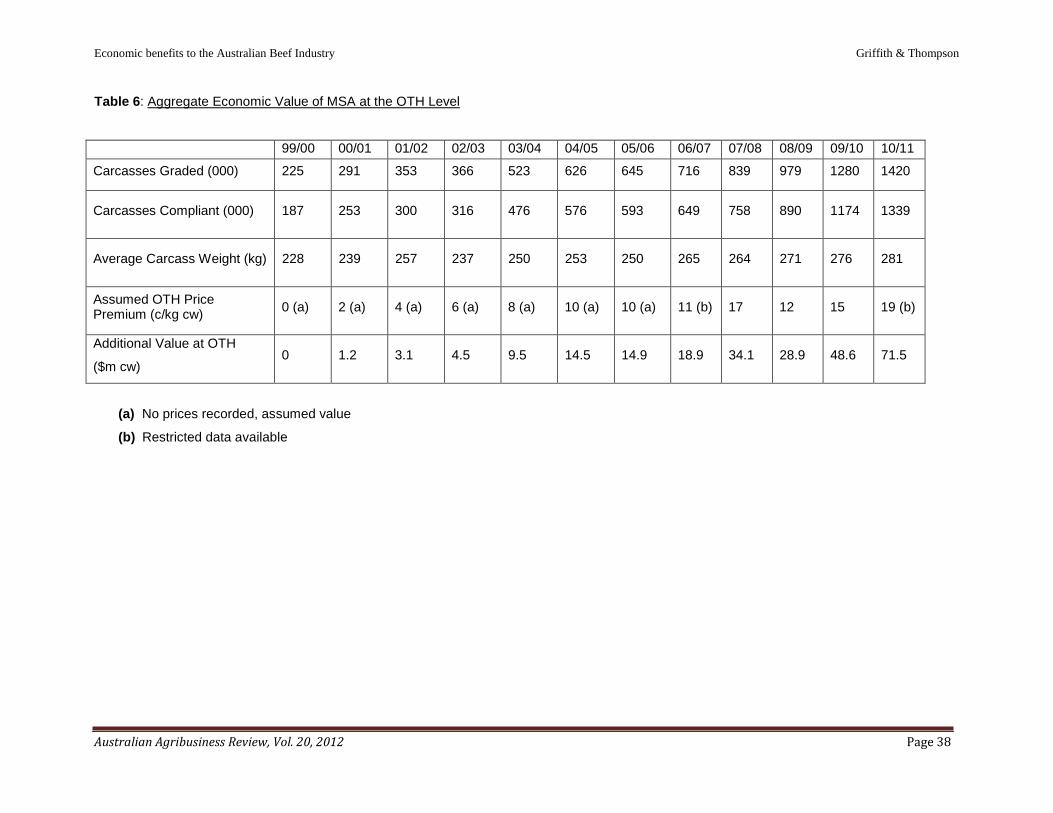
A similar procedure was applied to the OTH premiums. These were first measured in 2006/07, so they were assumed to be 10c/kg for 2004/05 and 2005/06, and then to linearly trend back to zero in 1999/00. The assumed and estimated OTH premiums over time are shown in Table 6.
Economic benefits to the Australian Beef Industry Griffith & Thompson
Australian Agribusiness Review, Vol. 20, 2012 Page 17
The appropriate weight to use for MSA graded carcasses is also an issue. As noted above, the over-the- hooks’ prices reported by the National Livestock Reporting Service to indicate premiums for MSA quality in the live cattle market are for the weight ranges 170-230kg, and 230kg+. On the other hand, the proportions of individual cuts used by Meat and Livestock Australia to derive weighted average values, as shown in Table 3, are based on a 260kg carcass. Initially, we used 250kg as the average weight of MSA graded and compliant carcasses (John Thompson, pers. com., March 2009). However we now have access to the actual average weights of MSA graded carcases. These are reported in Tables 4, 5 and 6.
Multiplying the estimated and assumed premiums by the known number of carcasses graded and compliant and the known carcase weights provides an estimate of the gross annual economic value at the retail, wholesale and OTH levels of the improvement in certainty about beef quality brought about by the MSA system, over the years 2000/01 to 2010/11. At the retail level, recent annual gross benefits range between $70-$83 million, and the cumulative value to 2010/11 is estimated to be $523 million. At the wholesale level, recent annual gross benefits range between $22-$98 million, and the cumulative value to 2010/11 is estimated to be just over $430 million. At the OTH level, recent annual gross benefits range between $29-$72 million, and the cumulative value to 2010/11 is estimated to be just under $250 million. All of these estimates are in current $ values, without applying any discounting or compounding.
5.2 Distribution of benefits
These annual gross benefits are eventually distributed to producers, wholesalers, retailers and consumers in relation to the relative slopes of the demand and supply curves at all the various market levels, as the market adjusts over time to the new level of consumer willingness-to-pay for guaranteed tenderness. This is the sort of information provided by equilibrium market models such as the one reported in Zhao et al. (2001).
Based on the calculated aggregate economic values reported in Tables 4, 5 and 6, cattle producers have received about 48 per cent of the total retail value, wholesalers have received about 35 per cent, and retailers have retained about 17 per cent. These are quite close to the shares calculated on the basis of c/kg carcase equivalent values in section 4.4 and as shown in Figure 2.
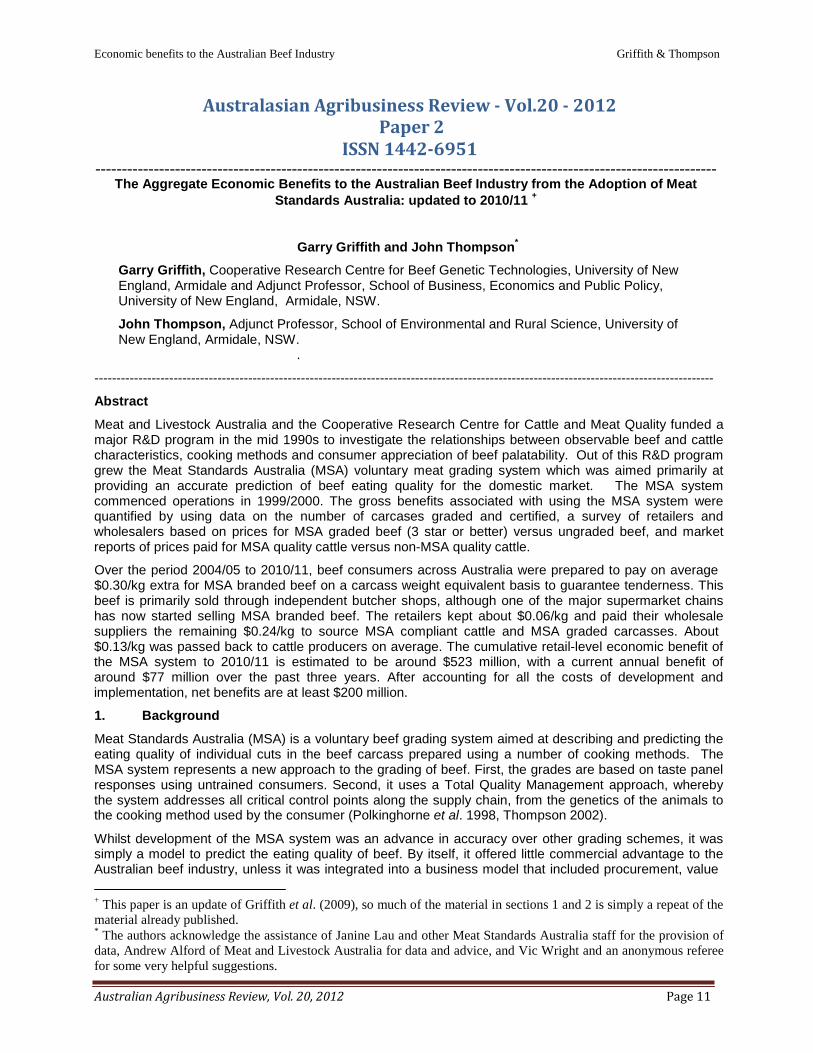
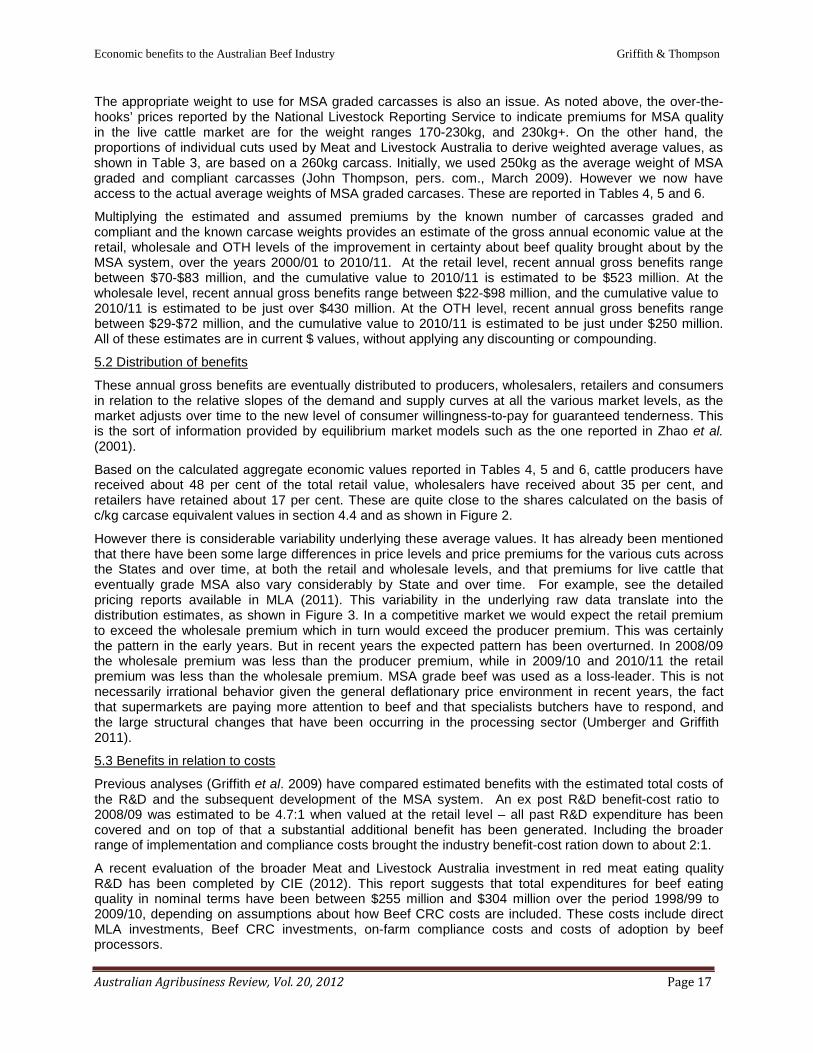
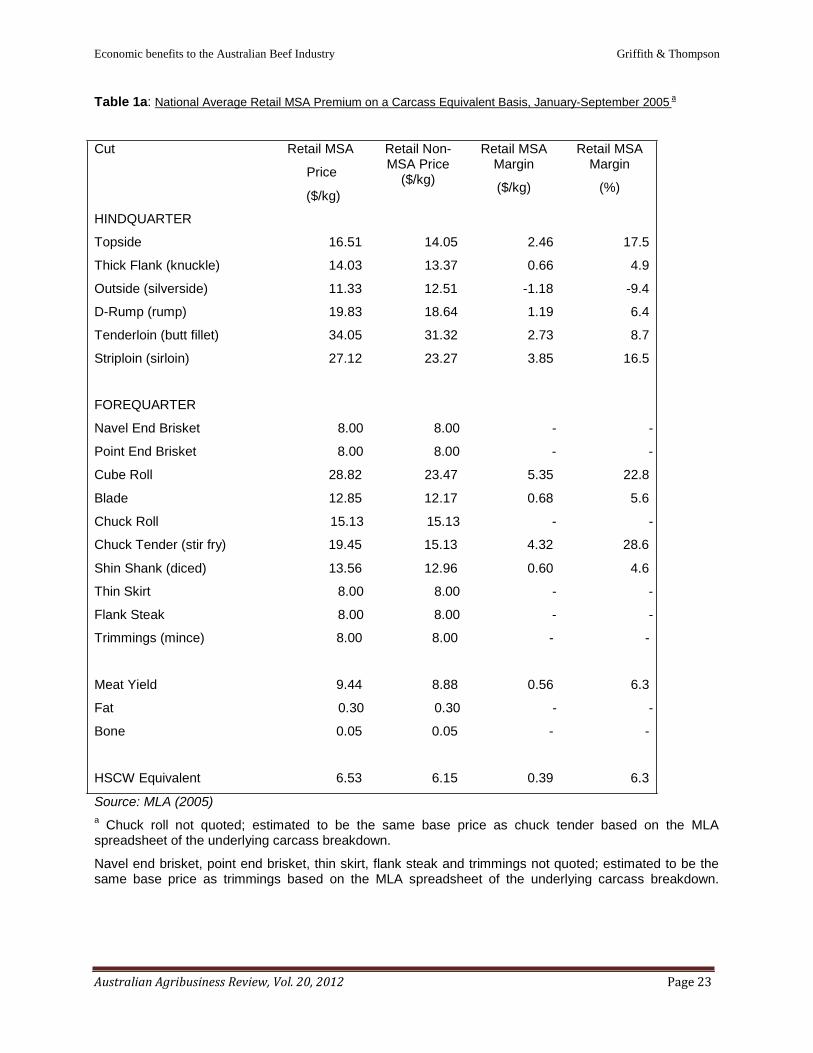
However there is considerable variability underlying these average values. It has already been mentioned that there have been some large differences in price levels and price premiums for the various cuts across the States and over time, at both the retail and wholesale levels, and that premiums for live cattle that eventually grade MSA also vary considerably by State and over time. For example, see the detailed pricing reports available in MLA (2011). This variability in the underlying raw data translate into the distribution estimates, as shown in Figure 3. In a competitive market we would expect the retail premium to exceed the wholesale premium which in turn would exceed the producer premium. This was certainly the pattern in the early years. But in recent years the expected pattern has been overturned. In 2008/09 the wholesale premium was less than the producer premium, while in 2009/10 and 2010/11 the retail premium was less than the wholesale premium. MSA grade beef was used as a loss-leader. This is not necessarily irrational behavior given the general deflationary price environment in recent years, the fact that supermarkets are paying more attention to beef and that specialists butchers have to respond, and the large structural changes that have been occurring in the processing sector (Umberger and Griffith 2011).
5.3 Benefits in relation to costs
Previous analyses (Griffith et al. 2009) have compared estimated benefits with the estimated total costs of the R&D and the subsequent development of the MSA system. An ex post R&D benefit-cost ratio to 2008/09 was estimated to be 4.7:1 when valued at the retail level – all past R&D expenditure has been covered and on top of that a substantial additional benefit has been generated. Including the broader range of implementation and compliance costs brought the industry benefit-cost ration down to about 2:1.
A recent evaluation of the broader Meat and Livestock Australia investment in red meat eating quality R&D has been completed by CIE (2012). This report suggests that total expenditures for beef eating quality in nominal terms have been between $255 million and $304 million over the period 1998/99 to 2009/10, depending on assumptions about how Beef CRC costs are included. These costs include direct MLA investments, Beef CRC investments, on-farm compliance costs and costs of adoption by beef processors.

Economic benefits to the Australian Beef Industry Griffith & Thompson
Australian Agribusiness Review, Vol. 20, 2012 Page 18
These estimates imply a net benefit to the Australian beef industry from the MSA innovation of between $219 million and $268 million, or benefit cost ratios of between 1.72 and 2.39. These values are close to the industry benefit cost ratio of around 2:1 estimated by Griffith et al. (2009). To date, all past R&D expenditure has been covered, all industry adoption costs have been covered, and on top of that a substantial additional benefit has been generated. These net industry benefits are expected to continue to grow in future years as throughput increases and ongoing development and operational costs stabilise.
6. Conclusions
MLA and the Beef CRC undertook a major R&D program in the mid 1990s to investigate the relationships between observable beef characteristics, cooking methods and consumer appreciation of beef palatability. This research established a base by which beef could be graded, using consumer responses to different combinations of live animal and carcass traits in combination with cooking methods. Out of this R&D grew the MSA voluntary meat grading system which was aimed primarily at providing an accurate prediction of beef eating quality. The MSA system commenced operations in 1999/2000.
The cumulative retail-level economic benefit of the MSA system to 2010/11 is estimated to be $523 million, the wholesale value $432 million and the OTH value $250 million. Based on these calculated aggregate economic values, cattle producers have received about 48 per cent of the total consumer willingness to pay, wholesalers have received about 35 per cent, and retailers have retained about 17 per cent.
These estimates have been calculated using an approximation to the true economic surplus values, and they are based on the raw survey data, without any statistical analysis of the significance of any differences in mean values. However, this study took a deliberately conservative approach to valuing the benefits from the adoption of the MSA grading system – only those benefits actually evident to date. In the absence of the required data, a conservative approach was also taken to assuming past price premiums for MSA cuts. Finally, it should be noted that these benefits were realized by using MSA in its simplest form, simply discriminating between graded (3 star or better) and ungraded beef cuts. It would be assumed that the gross benefits would be much larger if the industry adopts the full range in quality grades and sells 3, 4 and 5 star with corresponding increases in prices (Lyford et al. 2010). Whether the full potential of MSA is realized will depend upon how successfully the technology is extended and whether the net returns justify the extra inputs (see also Morales et al. 2008, 2009).

Economic benefits to the Australian Beef Industry Griffith & Thompson
Australian Agribusiness Review, Vol. 20, 2012 Page 19
7. References
ABARE (2009), Commodity Statistical Bulletin 2009, ABARE, Canberra (and previous issues).
Brennan, J.P., Godyn, D.L. and Johnston, B.G. (1989), “An economic framework for evaluating new wheat varieties”, Review of Marketing and Agricultural Economics 57(1,2,3), 75-92.
Centre for International Economics (2012), Red Meat Eating Quality – recent program performance and emerging roles, Report prepared for Meat and Livestock Australia, CIE, Canberra and Sydney, January (approved for release May 2012).
Griffith, G.R., Rodgers, H.J., Thompson, J.M. and Dart, C. (2009), “The aggregate economic benefits from the adoption of Meat Standards Australia”, Australasian Agribusiness Review Volume 17, Paper 5, pp. 94- 114. Available at: http://www.agrifood.info/review/2009/Griffith_Rodgers_Thompson_Dart.pdf
Ladd, G.W. and Suvannunt, V. (1976), “A model of consumer goods characteristics”, American Journal of Agricultural Economics 58(3), 504-10.
Lyford, C., Thompson, J., Polkinghorne, R., Miller, M., Nishimura, T., Neath, K., Allen, P. and Belasco, E. (2010), “Is willingness to pay (WTP) for beef quality grades affected by consumer demographics and meat consumption preferences?”, Australasian Agribusiness Review Volume 18, Paper 1, pp.1-17. Available at: http://www.agrifood.info/review/2010/Lyford_et_al.pdf
Millward Brown (2003), Meat Expectations 2003, presentation to Meat and Livestock Australia, 16 September.
Millward Brown (2007a), Consumer survey data, Meat and Livestock Australia, North Sydney.
Millward Brown (2007b), Retail Wholesale Price Report 2006/07, Meat and Livestock Australia, North Sydney.
MLA (2005), Comparison of MSA vs. Non-MSA Product in the Australian Domestic Market, Meat and Livestock Australia, Sydney, December.
MLA (2007), Meat Standards Australia Annual Outcomes Report 2006-07, Meat and Livestock Australia, Sydney, November.
MLA (2008), Meat Standards Australia Annual Outcomes Report 2007-08, Meat and Livestock Australia, Sydney, November.
MLA (2009), Meat Standards Australia Annual Outcomes Report 2008-09, Meat and Livestock Australia, Sydney, November.
MLA (2010), Meat Standards Australia Annual Outcomes Report 2009-10, Meat and Livestock Australia, Sydney, November.
MLA (2011), Meat Standards Australia Annual Outcomes Report 2010-11, Meat and Livestock Australia, Sydney, November.
Mounter, S.W., Griffith, G.R., Piggott, R.R. and Mullen, J.D. (2005), “The payoff from generic advertising by the Australian pig industry: further results relative to the payoff from R&D”, Australasian Agribusiness Review Volume 13, Paper 19 (published September 23). Available online at: http://www.agrifood.info/review/2005/Mounter_et_al.html
Mounter, S., Griffith, G., Piggott, R., Fleming, E. and Zhao, X. (2008), “Potential returns to the Australian sheep and wool industries from effective R&D and promotion investments and their sensitivities to assumed elasticity values”, Australasian Agribusiness Review Volume 16, Paper 1. Available online at: http://www.agrifood.info/review/2008/mounter_et_al.pdf
Morales, E., Fleming, E., Griffith, G. and Wright, V. (2008), “Innovative business in the Australian beef marketing system”, paper presented at the 52nd Annual Conference of the Australian Agricultural and Resource Economics Society, Rydges Lakeside, Canberra, 5-8 February.
Morales, L.E., Griffith, G., Wright, V., Umberger, W. and Fleming, E. (2009), “Characteristics of different consumer segments in the Australian beef market”, paper presented at the 53rd Annual Conference of
Economic benefits to the Australian Beef Industry Griffith & Thompson
Australian Agribusiness Review, Vol. 20, 2012 Page 20
the Australian Agricultural and Resource Economics Society, Cairns International Hotel, Cairns, 11th-13th
February.
Polkinghorne, R., Watson, R., Porter, M., Gee, A., Scott, A. and Thompson, J.M. (1998), “Meat Standards Australia, a “PACCP” based beef grading scheme for consumers. 1. The use of consumer scores to set grade standards”, in Proceedings of the International Congress of Meat Science and Technology 45, 14- 15.
Polkinghorne, R., Thompson, J.M., Watson, R., Gee, A. and Porter, M. (2008a), “Evolution of the Meat Standards Australia (MSA) beef grading scheme”, Australian Journal of Experimental Agriculture 48, 1351-1359.
Polkinghorne, R., Philpott, J., Gee, A., Doljanin, A. and Innes, J. (2008b), “Development of a commercial system to apply the Meat Standards Australia grading model to optimize the return on eating quality in a beef supply chain”, Australian Journal of Experimental Agriculture 48, 1451-1458.
Rodgers, H., Griffith, G., Villano, R. and Fleming, E. (2007), “Measuring price differentials for meat quality characteristics: Meat Standards Australia”, paper presented at the 51st Annual Conference of the Australian Agricultural and Resource Economics Society, Rydges Lakeland Resort, Queenstown, New Zealand, 13-16 February.
Smith, G.C., Savell, J.W., Cross, H.R., Carpenter, Z.L., Murphey, C.E., Davis, G.W., Abraham, H.C., Parrish, F.C. Jr. and Berry, B.W. (1987), “Relationship of USDA quality grades to palatability of cooked beef”, Journal of Food Quality 7, 829.
Thompson, J.M. (2002), “Managing meat tenderness”, Meat Science 62, 295-308.
Thompson, J., Polkinghorne, R., Watson, R., Gee, A. and Murison, R. (1998), “Meat Standards Australia, A 'PACCP' based beef grading scheme for consumers. 4. A cut based grading scheme to predict eating quality by cooking method”, Proceedings of the 45th International Congress of Meat Science and Technology, Yokohama, Japan. 45, 20-21.
Umberger, W. and Griffith, G.R. (2011), “Beef cattle producer strategies to accommodate more concentrated and more organised value chains and more discriminating consumers”, Farm Policy Journal 8 (3), 27-37.
Unnevehr, L.J. (1986), “Consumer demand for rice grain quality and returns to research from quality improvements in Southeast Asia”, American Journal of Agricultural Economics 68(3), 634-41.
Unnevehr, L.J. (1990), “Assessing the impact on improving the quality of food commodities”, in Methods for Diagnosing Research Constraints and Assessing the Impact of Agricultural Research, ed. R.G. Echeverria, vol. II, International Service for National Agricultural Research, The Hague.
Voon, J.P. (1991), “Measuring research benefits from a reduction of pale, soft and exudative pork in Australia”, Journal of Agricultural Economics 42(2), 180-4.
Voon, J.P. (1992), “Economic return to quality enhancing research: the case of dark-cutting beef in Australia”, Irish Journal of Agricultural Economics 31(1), 63-9.
Voon, J.P. (1996), “Evaluating quality improvements in non-homogeneous agricultural commodities: the case of Australian beef”, Review of Marketing and Agricultural Economics 64(2), 190-6.
Watson, R., Polkinghorne, R. and Thompson, J.M. (2008), “Development of the Meat Standards Australia (MSA) prediction model for beef palatability”, Australian Journal of Experimental Agriculture 48, 1368- 1379.
Zhao, Xueyan, Griffith, Garry and Mullen, John (2001), “Farmer returns from new technologies in the Australian beef industry: on-farm research versus off-farm research”, Review Paper No. 1, Volume 9 in Australian Agribusiness Review, [Online]. Available:
http://www.agribusiness.asn.au/review/2001v9/Griffith_Beef_Research/Zhao_Griffith_Mullen.htm
Economic benefits to the Australian Beef Industry Griffith & Thompson
Australian Agribusiness Review, Vol. 20, 2012 Page 21
No.
of c
arca
sses
$/
kg C
WE
Figure 1: Number of Carcasses Graded and Compliant as MSA, 1999/00-2010/11
Number graded Number compliant
1600 1400 1200 1000
800 600 400 200
0
99/00 00/01 01/02 02/03 03/04 04/05 05/06 06/07 07/08 08/09 09/10 10/11
Year
Source : MLA (2009)
Figure 2: Average Distribution of the MSA Retail Premium, 2004/05-2010/11
0.35
0.3
0.25
0.2
0.15
0.1
0.05
0
1
Sector
Retailer
Processor
Producer
Economic benefits to the Australian Beef Industry Griffith & Thompson
Australian Agribusiness Review, Vol. 20, 2012 Page 22
Figure 3: Variability of MSA Premiums Over Time, 2004/05-2010/11
40
35
30
25 retail 20 wholesale
15 OTH
10
5
0 2004/05 2005/06 2006/07 2007/08 2008/09 2009/10 2010/11
Economic benefits to the Australian Beef Industry Griffith & Thompson
Australian Agribusiness Review, Vol. 20, 2012 Page 23
Table 1a: National Average Retail MSA Premium on a Carcass Equivalent Basis, January-September 2005 a
Cut Retail MSA
Price
($/kg)
Retail Non- MSA Price
($/kg)
Retail MSA Margin
($/kg)
Retail MSA Margin
(%)
HINDQUARTER
Topside 16.51 14.05 2.46 17.5
Thick Flank (knuckle) 14.03 13.37 0.66 4.9
Outside (silverside) 11.33 12.51 -1.18 -9.4
D-Rump (rump) 19.83 18.64 1.19 6.4
Tenderloin (butt fillet) 34.05 31.32 2.73 8.7
Striploin (sirloin) 27.12 23.27 3.85 16.5
FOREQUARTER
Navel End Brisket 8.00 8.00 - -
Point End Brisket 8.00 8.00 - -
Cube Roll 28.82 23.47 5.35 22.8
Blade 12.85 12.17 0.68 5.6
Chuck Roll 15.13 15.13 - -
Chuck Tender (stir fry) 19.45 15.13 4.32 28.6
Shin Shank (diced) 13.56 12.96 0.60 4.6
Thin Skirt 8.00 8.00 - -
Flank Steak 8.00 8.00 - -
Trimmings (mince) 8.00 8.00 - -
Meat Yield 9.44 8.88 0.56 6.3
Fat 0.30 0.30 - -
Bone 0.05 0.05 - -
HSCW Equivalent 6.53 6.15 0.39 6.3
Source: MLA (2005) a Chuck roll not quoted; estimated to be the same base price as chuck tender based on the MLA spreadsheet of the underlying carcass breakdown.
Navel end brisket, point end brisket, thin skirt, flank steak and trimmings not quoted; estimated to be the same base price as trimmings based on the MLA spreadsheet of the underlying carcass breakdown.

Economic benefits to the Australian Beef Industry Griffith & Thompson
Australian Agribusiness Review, Vol. 20, 2012 Page 24
Table 1b: National average retail MSA premium on a carcass equivalent basis, July 2006-June 2007 a
Cut HINDQUARTER
Retail MSA
Price
($/kg)
Retail Non- MSA Price
($/kg)
Retail MSA Margin
($/kg)
Retail MSA Margin
(%)
Topside 13.41 13.41 - -
Thick Flank (knuckle) 13.58 12.96 0.62 4.8
Outside (silverside) 12.24 11.74 0.50 4.3
D-Rump (rump) 19.49 18.56 0.93 5.0
Tenderloin (butt fillet) 33.52 30.42 3.10 10.2
Striploin (sirloin) 25.94 23.30 2.64 11.3
FOREQUARTER
Navel End Brisket
9.02
9.02
-
-
Point End Brisket 9.02 9.02 - -
Cube Roll 27.67 24.36 3.31 13.6
Blade 12.49 11.70 0.79 6.8
Chuck Roll 13.88 13.88 - -
Chuck Tender (stir fry) 15.05 13.88 1.17 8.4
Shin Shank (diced) 13.09 12.26 0.83 6.8
Thin Skirt 9.02 9.02 - -
Flank Steak 9.02 9.02 - -
Trimmings 9.02 9.02 - -
Meat Yield
9.32
8.92
0.40
4.5
Fat 0.30 0.30 - -
Bone 0.05 0.05 - -
HSCW Equivalent
6.45
6.18
0.27
4.5
Source: MLA (2007)
a topside price was not quoted. It was estimated by applying the same average percentage difference from thick flank and silverside from Table 1a.
Chuck roll not quoted; estimated to be the same base price as chuck tender based on the MLA spreadsheet of the underlying carcass breakdown.
Navel end brisket, point end brisket, thin skirt, flank steak and trimmings not quoted; estimated to be the same base price as trimmings based on the MLA spreadsheet of the underlying carcass breakdown. These prices were assumed to have changed in the same proportion as the average price of non-MSA cuts changed between Table 1a and Table 1b (up 12.7 per cent).

Economic benefits to the Australian Beef Industry Griffith & Thompson
Australian Agribusiness Review, Vol. 20, 2012 Page 25
Table 1c: National average retail MSA premium on a carcass equivalent basis, July 2007-June 2008a
Cut HINDQUARTER
Retail MSA
Price
($/kg)
Retail Non- MSA Price
($/kg)
Retail MSA Margin
($/kg)
Retail MSA Margin
(%)
Topside 13.55 13.55 - -
Thick Flank (knuckle) 13.90 13.17 0.73 5.5
Outside (silverside) 12.21 11.79 0.42 3.6
D-Rump (rump) 20.19 18.87 1.32 7.0
Tenderloin (butt fillet) 35.10 31.41 3.69 11.7
Striploin (sirloin) 26.72 23.95 2.77 11.6
FOREQUARTER
Navel End Brisket
9.23
9.23
-
-
Point End Brisket 9.23 9.23 - -
Cube Roll 29.22 25.35 3.87 15.3
Blade 12.58 11.73 0.85 7.2
Chuck Roll 14.28 14.28 - -
Chuck Tender (stir fry) 15.19 14.28 0.91 11.2
Shin Shank (diced) 13.10 12.43 0.67 5.4
Thin Skirt 9.23 9.23 - -
Flank Steak 9.23 9.23 - -
Trimmings 9.23 9.23 - -
Meat Yield
9.54
9.10
0.44
4.8
Fat 0.30 0.30 - -
Bone 0.05 0.05 - -
HSCW Equivalent
6.60
6.30
0.30
4.8
Source: MLA (2008) a topside price was not quoted. It was estimated by applying the same average percentage difference from thick flank and silverside from Table 1a.
Chuck roll not quoted; estimated to be the same base price as chuck tender based on the MLA spreadsheet of the underlying carcass breakdown.
Navel end brisket, point end brisket, thin skirt, flank steak and trimmings not quoted; estimated to be the same base price as trimmings based on the MLA spreadsheet of the underlying carcass breakdown. These prices were assumed to have changed in the same proportion as the average price of non-MSA cuts changed between Table 1b and Table 1c (up 2.3 per cent).

Economic benefits to the Australian Beef Industry Griffith & Thompson
Australian Agribusiness Review, Vol. 20, 2012 Page 26
Table 1d: National average retail MSA premium on a carcass equivalent basis, July 2008-June 2009a
Cut HINDQUARTER
Retail MSA
Price
($/kg)
Retail Non- MSA Price
($/kg)
Retail MSA Margin
($/kg)
Retail MSA Margin
(%)
Topside 13.60 13.60 - -
Thick Flank (knuckle) 14.69 13.81 0.88 6.4
Outside (silverside) 12.70 11.87 0.84 7.0
D-Rump (rump) 20.75 19.46 1.28 6.6
Tenderloin (butt fillet) 35.73 32.76 2.97 9.1
Striploin (sirloin) 26.98 24.95 2.03 8.1
FOREQUARTER
Navel End Brisket
9.58
9.58
-
-
Point End Brisket 9.58 9.58 - -
Cube Roll 29.58 26.77 2.81 10.5
Blade 12.96 12.18 0.78 6.4
Chuck Roll 14.87 14.87 - -
Chuck Tender (stir fry) 15.89 14.87 1.02 6.9
Shin Shank (diced) 13.88 12.88 1.00 7.0
Thin Skirt 9.58 9.58 - -
Flank Steak 9.58 9.58 - -
Trimmings 9.58 9.58 - -
Meat Yield
9.82
9.41
0.41
4.4
Fat 0.30 0.30 - -
Bone 0.05 0.05 - -
HSCW Equivalent
6.80
6.51
0.29
4.3
Source: MLA (2009)
a topside price was not quoted. It was estimated by applying the same average percentage difference from thick flank and silverside from Table 1a.
Chuck roll not quoted; estimated to be the same base price as chuck tender based on the MLA spreadsheet of the underlying carcass breakdown.
Navel end brisket, point end brisket, thin skirt, flank steak and trimmings not quoted; estimated to be the same base price as trimmings based on the MLA spreadsheet of the underlying carcass breakdown. These prices were assumed to have changed in the same proportion as the average price of non-MSA cuts changed between Table 1c and Table 1d (up 3.7 per cent).

Economic benefits to the Australian Beef Industry Griffith & Thompson
Australian Agribusiness Review, Vol. 20, 2012 Page 27
Table 1e: National average retail MSA premium on a carcass equivalent basis, July 2009-June 2010a
Cut HINDQUARTER
Retail MSA
Price
($/kg)
Retail Non- MSA Price
($/kg)
Retail MSA Margin
($/kg)
Retail MSA Margin
(%)
Topside 12.51 12.51 - -
Thick Flank (knuckle) 14.94 14.10 0.84 6.0
Outside (silverside) 11.13 10.79 0.34 3.2
D-Rump (rump) 21.39 20.24 1.15 5.7
Tenderloin (butt fillet) 36.04 33.39 2.65 7.9
Striploin (sirloin) 28.05 25.80 2.25 8.7
FOREQUARTER
Navel End Brisket
9.61
9.61
-
-
Point End Brisket 9.61 9.61 - -
Cube Roll 30.29 27.80 2.49 9.0
Blade 13.33 12.83 0.50 3.9
Chuck Roll 14.47 14.47 - -
Chuck Tender (stir fry) 15.47 14.47 1.00 6.9
Shin Shank (diced) 13.58 12.72 0.86 6.8
Thin Skirt 9.61 9.61 - -
Flank Steak 9.61 9.61 - -
Trimmings 9.61 9.61 - -
Meat Yield
9.76
9.40
0.36
3.8
Fat 0.30 0.30 - -
Bone 0.05 0.05 - -
HSCW Equivalent
6.75
6.51
0.24
3.7
Source: MLA (2010)
a topside price was not quoted. It was estimated by applying the same average percentage difference from thick flank and silverside from Table 1a.
Chuck roll not quoted; estimated to be the same base price as chuck tender based on the MLA spreadsheet of the underlying carcass breakdown.
Navel end brisket, point end brisket, thin skirt, flank steak and trimmings not quoted; estimated to be the same base price as trimmings based on the MLA spreadsheet of the underlying carcass breakdown. These prices were assumed to have changed in the same proportion as the average price of non-MSA cuts changed between Table 1d and Table 1e (up 0.03 per cent).
Economic benefits to the Australian Beef Industry Griffith & Thompson
Australian Agribusiness Review, Vol. 20, 2012 Page 28
Table 1f: National average retail MSA premium on a carcass equivalent basis, July 2010-June 2011a
Cut HINDQUARTER
Retail MSA
Price
($/kg)
Retail Non- MSA Price
($/kg)
Retail MSA Margin
($/kg)
Retail MSA Margin
(%)
Topside 12.96 12.96 - -
Thick Flank (knuckle) 15.30 14.64 0.66 4.5
Outside (silverside) 11.48 11.16 0.32 2.9
D-Rump (rump) 21.50 20.49 1.01 4.9
Tenderloin (butt fillet) 37.36 34.97 2.39 6.8
Striploin (sirloin) 28.60 26.68 1.92 7.2
FOREQUARTER
Navel End Brisket
9.95
9.95
-
-
Point End Brisket 9.95 9.95 - -
Cube Roll 31.53 28.58 2.95 10.3
Blade 13.43 12.94 0.49 3.8
Chuck Roll 15.53 15.53 - -
Chuck Tender (stir fry) 16.22 15.53 0.69 4.4
Shin Shank (diced) 14.57 13.80 0.77 5.6
Thin Skirt 9.95 9.95 - -
Flank Steak 9.95 9.95 - -
Trimmings 9.95 9.95 - -
Meat Yield
10.08
9.76
0.32
3.3
Fat 0.30 0.30 - -
Bone 0.05 0.05 - -
HSCW Equivalent
6.97
6.75
0.22
3.3
Source: MLA (2011)
a topside price was not quoted. It was estimated by applying the same average percentage difference from thick flank and silverside from Table 1a.
Chuck roll not quoted; estimated to be the same base price as chuck tender based on the MLA spreadsheet of the underlying carcass breakdown.
Navel end brisket, point end brisket, thin skirt, flank steak and trimmings not quoted; estimated to be the same base price as trimmings based on the MLA spreadsheet of the underlying carcass breakdown. These prices were assumed to have changed in the same proportion as the average price of non-MSA hindquarter cuts changed between Table 1e and Table 1f (up 3.5 per cent).
Economic benefits to the Australian Beef Industry Griffith & Thompson
Australian Agribusiness Review, Vol. 20, 2012 Page 29
Table 2a: National MSA Premiums on a Wholesale Carcass Equivalent Basis, January-September 2005 a
Cut
HINDQUARTER
Wholesale
MSA
Price
($/kg)
Wholesale Non-MSA
Price
($/kg)
Wholesale
MSA Margin
($/kg)
Wholesale
MSA Margin
(%)
Topside 4.71 4.48 0.23 5.1 Thick Flank (Knuckle) 4.71 4.48 0.23 5.1
Outside (Silverside) 4.71 4.48 0.23 5.1 D-Rump (Rump) 9.65 8.54 1.11 13.0
Tenderloin (Butt fillet) 27.69 21.69 6.00 27.7 Striploin (Sirloin) 16.37 13.55 2.82 20.8
FOREQUARTER
Navel End Brisket 5.12 4.89 0.23 4.7 Point End Brisket 5.12 4.89 0.23 4.7
Cube Roll 22.54 17.62 4.92 27.9 Blade 5.12 4.89 0.23 4.7
Chuck Roll 5.12 4.89 0.23 4.7 Chuck Tender (Stir fry) 5.12 4.89 0.23 4.7
Shin Shank (Diced) 4.89 4.89 - - Thin Skirt 4.89 4.89 - -
Flank Steak 4.89 4.89 - - Trimmings (Mince) 4.89 4.89 - -
Meat Yield
4.72
4.30
0.42
9.8
Fat 0.30 0.30 - - Bone 0.05 0.05 - -
HSCW Equivalent
3.29
3.00
0.29
9.7
Source: MLA (2005) a Prices for shin shank, thin skirt, flank steak and trimmings were not quoted so they set the same as trimmings. The price of trimmings was taken from Cameron Dart (pers. com. 2006) who provided the MLA spreadsheet of the underlying carcass breakdown (Table 3).

Economic benefits to the Australian Beef Industry Griffith & Thompson
Australian Agribusiness Review, Vol. 20, 2012 Page 30
Table 2b: National MSA Premiums on a Wholesale Carcass Equivalent Basis, July 2006-June 2007 a
Cut
HINDQUARTER
Wholesale
MSA
Price
($/kg)
Wholesale Non-MSA
Price
($/kg)
Wholesale
MSA Margin
($/kg)
Wholesale
MSA Margin
(%)
Topside 5.95 5.88 0.07 1.2 Thick Flank (Knuckle) 6.09 5.81 0.28 4.8
Outside (Silverside) 5.95 5.88 0.07 1.2 D-Rump (Rump) 9.65 7.96 1.69 21.2
Tenderloin (Butt fillet) 26.24 22.23 4.01 18.0 Striploin (Sirloin) 14.93 13.19 1.74 13.2
FOREQUARTER
Navel End Brisket 5.15 5.15 - - Point End Brisket 5.15 5.15 - -
Cube Roll 20.85 17.79 3.06 17.2 Blade 5.55 5.31 0.24 4.5
Chuck Roll 5.18 5.16 0.02 0.4 Chuck Tender (Stir fry) 5.18 5.16 0.02 0.4
Shin Shank (Diced) 5.15 5.15 - - Thin Skirt (Diced) 5.15 5.15 - -
Flank Steak 5.15 5.15 - - Trimmings 5.15 5.15 - -
Meat Yield 4.90 4.87 4.61 0.29 6.3 Fat 0.30 0.30 - -
Bone 0.05 0.05 - -
HSCW Equivalent
3.41
3.21
0.20
6.2
Source: MLA (2007) a The prices for cube roll and sirloin are the average of separate quotes for grainfed and grassfed product.
The price of silverside was not quoted so it was set the same as topside.
The prices of navel end brisket, point end brisket, shin shank, thin skirt, flank steak and trimmings were not quoted. These prices were assumed to have changed in the same proportion as the average price of non-MSA hindquarter cuts changed between Table 2a and Table 2b (up 5.3 per cent).
Economic benefits to the Australian Beef Industry Griffith & Thompson
Australian Agribusiness Review, Vol. 20, 2012 Page 31
Table 2c: National MSA Premiums on a Wholesale Carcass Equivalent Basis, July 2007-June 2008 a
Cut
HINDQUARTER
Wholesale
MSA
Price
($/kg)
Wholesale Non-MSA
Price
($/kg)
Wholesale
MSA Margin
($/kg)
Wholesale
MSA Margin
(%)
Topside 6.42 5.61 0.81 14.4 Thick Flank (Knuckle) 6.42 5.87 0.55 9.4
Outside (Silverside) 6.42 5.61 0.81 14.4 D-Rump (Rump) 9.09 7.82 1.27 16.2
Tenderloin (Butt fillet) 26.81 23.60 3.21 13.6 Striploin (Sirloin) 15.46 13.68 1.78 13.0
FOREQUARTER
Navel End Brisket 5.28 5.28 - - Point End Brisket 5.28 5.28 - -
Cube Roll 21.70 19.45 2.25 11.6 Blade 5.68 5.04 0.64 12.7
Chuck Roll 6.07 5.02 1.05 20.9 Chuck Tender (Stir fry) 6.07 5.02 1.05 20.9
Shin Shank (Diced) 5.28 5.28 - - Thin Skirt 5.28 5.28 - -
Flank Steak 5.28 5.28 - - Trimmings (Mince) 5.28 5.28 - -
Meat Yield 5.09 4.87 4.66 0.43 9.1 Fat 0.30 0.30 - -
Bone 0.05 0.05 - -
HSCW Equivalent
3.54
3.25
0.29
9.0
Source: MLA (2008) a The prices for cube roll and sirloin are the average of separate quotes for grainfed and grassfed product.
The price of silverside was not quoted so it was set the same as topside.
The prices of navel end brisket, point end brisket, shin shank, thin skirt, flank steak and trimmings were not quoted. These prices were assumed to have changed in the same proportion as the average price of non-MSA hindquarter cuts changed between Table 2b and Table 2c (up 2.4 per cent).

Economic benefits to the Australian Beef Industry Griffith & Thompson
Australian Agribusiness Review, Vol. 20, 2012 Page 32
Table 2d: National MSA Premiums on a Wholesale Carcass Equivalent Basis, July 2008-June 2009 a
Cut
HINDQUARTER
Wholesale
MSA
Price
($/kg)
Wholesale Non-MSA
Price
($/kg)
Wholesale
MSA Margin
($/kg)
Wholesale
MSA Margin
(%)
Topside 6.23 7.07 -0.84 -11.9 Thick Flank (Knuckle) 6.25 6.31 -0.06 -1.0
Outside (Silverside) 6.23 7.07 -0.84 -11.9 D-Rump (Rump) 9.09 8.51 0.58 6.8
Tenderloin (Butt fillet) 24.36 20.57 3.69 18.4 Striploin (Sirloin) 14.99 12.82 2.17 16.9
FOREQUARTER
Navel End Brisket 5.32 5.32 - - Point End Brisket 5.32 5.32 - -
Cube Roll 20.83 18.07 2.76 15.3 Blade 5.66 5.62 0.04 0.7
Chuck Roll 5.97 5.68 0.29 5.1 Chuck Tender (Stir fry) 5.97 5.68 0.29 5.1
Shin Shank (Diced) 5.32 5.32 - - Thin Skirt 5.32 5.32 - -
Flank Steak 5.32 5.32 - - Trimmings (Mince) 5.32 5.32 - -
Meat Yield 4.99 4.87 4.85 0.14 2.9 Fat 0.30 0.30 - -
Bone 0.05 0.05 - -
HSCW Equivalent
3.47
3.38
0.09
2.9
Source: MLA (2009) a The prices for cube roll and sirloin are the average of separate quotes for grainfed and grassfed product.
The price of silverside was not quoted so it was set the same as topside.
The prices of navel end brisket, point end brisket, shin shank, thin skirt, flank steak and trimmings were not quoted. These prices were assumed to have changed in the same proportion as the average price of non-MSA hindquarter cuts changed between Table 2c and Table 2d (up 0.7 per cent).

Economic benefits to the Australian Beef Industry Griffith & Thompson
Australian Agribusiness Review, Vol. 20, 2012 Page 33
Table 2e: National MSA Premiums on a Wholesale Carcass Equivalent Basis, July 2009-June 2010 a
Cut
HINDQUARTER
Wholesale
MSA
Price
($/kg)
Wholesale Non-MSA
Price
($/kg)
Wholesale
MSA Margin
($/kg)
Wholesale
MSA Margin
(%)
Topside 6.37 6.06 0.31 5.1 Thick Flank (Knuckle) 6.45 5.81 0.64 11.0
Outside (Silverside) 6.37 6.06 0.31 5.1 D-Rump (Rump) 9.44 7.96 1.48 18.6
Tenderloin (Butt fillet) 24.55 20.91 3.64 17.4 Striploin (Sirloin) 14.79 12.77 2.02 15.8
FOREQUARTER
Navel End Brisket 5.08 5.08 - - Point End Brisket 5.08 5.08 - -
Cube Roll 21.13 18.40 2.73 14.8 Blade 5.67 5.21 0.46 8.8
Chuck Roll 6.61 5.97 0.64 10.7 Chuck Tender (Stir fry) 6.61 5.97 0.64 10.7
Shin Shank (Diced) 5.08 5.08 - - Thin Skirt 5.08 5.08 - -
Flank Steak 5.08 5.08 - - Trimmings (Mince) 5.08 5.08 - -
Meat Yield
4.99
4.87
4.62
0.37
8.0
Fat 0.30 0.30 - - Bone 0.05 0.05 - -
HSCW Equivalent
3.47
3.22
0.25
7.9
Source: MLA (2010) a The prices for cube roll and sirloin are the average of separate quotes for grainfed and grassfed product.
The price of silverside was not quoted so it was set the same as topside.
The prices of navel end brisket, point end brisket, shin shank, thin skirt, flank steak and trimmings were not quoted. These prices were assumed to have changed in the same proportion as the average price of non-MSA hindquarter cuts changed between Table 2d and Table 2e (down 4.5 per cent).

Economic benefits to the Australian Beef Industry Griffith & Thompson
Australian Agribusiness Review, Vol. 20, 2012 Page 34
Table 2f: National MSA Premiums on a Wholesale Carcass Equivalent Basis, July 2010-June 2011 a
Cut
HINDQUARTER
Wholesale
MSA
Price
($/kg)
Wholesale Non-MSA
Price
($/kg)
Wholesale
MSA Margin
($/kg)
Wholesale
MSA Margin
(%)
Topside 7.05 6.36 0.69 10.8 Thick Flank (Knuckle) 7.11 6.33 0.78 12.3
Outside (Silverside) 7.05 6.36 0.69 10.8 D-Rump (Rump) 9.05 8.35 0.70 8.4
Tenderloin (Butt fillet) 25.81 24.22 1.59 6.6 Striploin (Sirloin) 16.09 13.36 2.73 20.4
FOREQUARTER
Navel End Brisket 5.55 5.55 - - Point End Brisket 5.55 5.55 - -
Cube Roll 24.02 20.48 3.54 17.3 Blade 6.00 5.70 0.30 5.3
Chuck Roll 5.81 5.51 0.30 5.4 Chuck Tender (Stir fry) 5.81 5.51 0.30 5.4
Shin Shank (Diced) 5.55 5.55 - - Thin Skirt 5.55 5.55 - -
Flank Steak 5.55 5.55 - - Trimmings (Mince) 5.55 5.55 - -
Meat Yield
5.32
4.87
4.95
0.37
7.6
Fat 0.30 0.30 - - Bone 0.05 0.05 - -
HSCW Equivalent
3.70
3.44
0.26
7.5
Source: MLA (2011)
a The prices for cube roll and sirloin are the average of separate quotes for grainfed and grassfed product. The price of silverside was not quoted so it was set the same as topside.
The prices of navel end brisket, point end brisket, shin shank, thin skirt, flank steak and trimmings were not quoted. These prices were assumed to have changed in the same proportion as the average price of non-MSA hindquarter cuts changed between Table 2e and Table 2f (up 9.1 per cent).
Economic benefits to the Australian Beef Industry Griffith & Thompson
Australian Agribusiness Review, Vol. 20, 2012 Page 35
Topside 6.2% 16.1 Thick Flank Knuckle 3.7% 9.6
Outside Silverside 5.7% 14.8 D-Rump Rump 3.8% 9.9
Tenderloin Butt fillet 1.6% 4.2 Striploin Sirloin l i 4.4% 11.4
ARTER Navel End Brisket
3.3%
8.6
Point End Brisket 3.8% 9.9 Cube Roll Cube Roll 1.7% 4.4
Blade Blade 5.5% 14.3 Chuck Roll 4.5% 11.7
Chuck Tender Stir Fry 0.9% 2.3 Shin Shank Diced 4.6% 12.0
Thin Skirt 0.2% 0.5 Flank Steak 0.4% 1.0
Trimmings 18.4% 47.8
Meat Yield
68.7%
178.6 Fat 12.0% 31.2
Bone 19.3% 50.2
HSCW Equivalent
100.0%
260.0
Table 3: Proportions of retail cuts in a 260kg carcass
Common Name MSA Name
HIND QUARTER
Proportion of the Carcass
(%)
Weight
(kg)
FOREQU
Source: MLA (Cameron Dart, personal communication)
Economic benefits to the Australian Beef Industry Griffith & Thompson
Australian Agribusiness Review, Vol. 20, 2012 Page 36
Table 4: Aggregate Economic Value of MSA at the Retail Level 99/00 00/01 01/02 02/03 03/04 04/05 05/06 06/07 07/08 08/09 09/10 10/11
Carcasses Graded (000) 225 291 353 366 523 626 645 716 839 979 1280 1420
Carcasses Compliant (000)
187
253
300
316
476
576
593
649
758
890
1174
1339
Average Carcass Weight (kg)
228
239
257
237
250
253
250
265
264
271
276
281
Estimated Retail Price Premium (c/kg cw)
0 (a)
7.8 (a) 15.6
(a) 23.4 (a)
31.2 (a)
39.0
39.0
27.0
30.0
29.0
24.0
22.0
Additional Value at Retail
($m cw)
0
4.7
12.0
17.5
37.1
56.8
58.3
46.4
60.0
69.9
77.8
82.8
(a) No prices recorded, assumed value

Economic benefits to the Australian Beef Industry Griffith & Thompson
Australian Agribusiness Review, Vol. 20, 2012 Page 37
Table 5: Aggregate Economic Value of MSA at the Wholesale Level 99/00 00/01 01/02 02/03 03/04 04/05 05/06 06/07 07/08 08/09 09/10 10/11
Carcasses Graded (000)
225
291
353
366
523
626
645
716
839
979
1280
1420
Carcasses Compliant (000)
187
253
300
316
476
576
593
649
758
890
1174
1339
Average Carcass Weight (kg)
228
239
257
237
250
253
250
265
264
271
276
281
Assumed Wholesale Price Premium
(c/kg cw)
0 (a)
5.9 (a)
11.8 (a)
17.8 (a)
23.0 (a)
29.0
29.0
20.0
29.0
9.0
25.0
26.0
Additional Value at Wholesale
($m cw)
0
3.6
9.1
13.3
27.4
42.3
43.2
34.4
58.0
21.7
81.0
97.8
(a) No prices recorded, assumed value
Economic benefits to the Australian Beef Industry Griffith & Thompson
Australian Agribusiness Review, Vol. 20, 2012 Page 38
Table 6: Aggregate Economic Value of MSA at the OTH Level 99/00 00/01 01/02 02/03 03/04 04/05 05/06 06/07 07/08 08/09 09/10 10/11
Carcasses Graded (000) 225 291 353 366 523 626 645 716 839 979 1280 1420
Carcasses Compliant (000)
187
253
300
316
476
576
593
649
758
890
1174
1339
Average Carcass Weight (kg)
228
239
257
237
250
253
250
265
264
271
276
281
Assumed OTH Price Premium (c/kg cw)
0 (a)
2 (a)
4 (a)
6 (a)
8 (a)
10 (a)
10 (a)
11 (b)
17
12
15
19 (b)
Additional Value at OTH
($m cw)
0
1.2
3.1
4.5
9.5
14.5
14.9
18.9
34.1
28.9
48.6
71.5
(a) No prices recorded, assumed value
(b) Restricted data available