Embed Size (px)
Citation preview

AURORA PUBLIC SCHOOLS 15701 E. First Avenue, Suite 106
Aurora, Colorado 80011
Joint School District No. 28-J of the Counties of Adams and Arapahoe, Colorado
COMPREHENSIVE ANNUAL FINANCIAL REPORT
For the Fiscal Year Ended June 30, 2021
BOARD OF EDUCATION
Kyla Armstrong-Romero, Ph.D., President Kevin Cox, Vice President
Marques Ivey, J.D., Treasurer Debra E. Gerkin, Secretary
Nichelle Ortiz, Director Stephanie Mason, Director
Vicki Reinhard, Director
Superintendent
D. Rico Munn
Prepared by
Division of Finance
Cover Page Artwork by
Tatum Jones, 8th Grade (2020-2021 School Year), Aurora Frontier P-8
JOINT SCHOOL DISTRICT No. 28-J OF THE COUNTIES OF ADAMS AND ARAPAHOE, COLORADO COMPREHENSIVE ANNUAL FINANCIAL REPORT For the Year Ended June 30, 2021
Table of Contents Page
i
INTRODUCTORY SECTION ..................................................................................................... 1 Governing Board of Education - Function and Composition .................................................... 3 Letter of Transmittal ................................................................................................................ 5 Aurora Public Schools Organizational Chart ..........................................................................13 GFOA – Certificate of Achievement for Excellence in Financial Reporting .............................14 ASBO – Certificate of Excellence in Financial Reporting .......................................................15
FINANCIAL SECTION ..............................................................................................................17 Independent Auditor’s Report ................................................................................................19 Management’s Discussion and Analysis (Unaudited)...........................................................23 Basic Financial Statements ...................................................................................................37
Government-wide Financial Statements Statement of Net Position ...............................................................................................38 Statement of Financial Position – Aurora Public Schools Foundation .............................39 Statement of Activities ....................................................................................................40 Statement of Activities – Aurora Public Schools Foundation ...........................................41
Fund Financial Statements Balance Sheet – Governmental Funds ...........................................................................42 Reconciliation of the Governmental Funds Balance Sheet to the Statement of Net
Position .......................................................................................................................44 Statement of Revenues, Expenditures and Changes in Fund Balances – Governmental
Funds ..........................................................................................................................46 Reconciliation of the Statement of Revenues, Expenditures and Changes in Fund
Balances of Governmental Funds to the Statement of Activities .................................48 Statement of Fiduciary Net Position – Fiduciary Fund – Health Trust Fund ....................49 Statement of Changes in Fiduciary Net Position – Fiduciary Fund – Health Trust Fund .50
Notes to Basic Financial Statements ..................................................................................51 Required Supplementary Information ....................................................................................93
Schedule of Revenues, Expenditures and Changes in Fund Balance - Budget and Actual General Fund .................................................................................................................94 Special Revenue Fund – Grants Fund ............................................................................95 Special Revenue Fund – Nutrition Services Fund ...........................................................96
Schedule of the District’s Proportionate Share of the Net Pension Liability ........................97 Schedule of the District’s Pension Contributions ................................................................98 Schedule of the District’s Proportionate Share of the Net OPEB Liability ...........................99 Schedule of the District’s OPEB Contributions ................................................................. 100 Notes to the Required Supplementary Information ........................................................... 101
Supplementary Information .................................................................................................. 103 Major and Nonmajor Governmental Funds ...................................................................... 104
Schedule of Revenues, Expenditures and Changes in Fund Balance – Budget and Actual Debt Service Fund – Bond Redemption Fund ........................................................... 105 Capital Projects Fund – Building Fund ...................................................................... 106 Capital Projects Fund – Capital Reserve Fund .......................................................... 107
Combining Balance Sheet – Nonmajor Governmental Funds ....................................... 108 Combining Statement of Revenues, Expenditures and Changes in Fund Balance –
Nonmajor Governmental Funds ................................................................................ 109 Schedule of Revenues, Expenditures and Changes in Fund Balance – Budget and Actual
Special Revenue Fund – Athletic Fund ..................................................................... 110
JOINT SCHOOL DISTRICT No. 28-J OF THE COUNTIES OF ADAMS AND ARAPAHOE, COLORADO COMPREHENSIVE ANNUAL FINANCIAL REPORT For the Year Ended June 30, 2021
Table of Contents Page
ii
Special Revenue Fund – Medicaid Fund ................................................................... 111 Special Revenue Fund – Pickens Post-Secondary Fund .......................................... 112 Special Revenue Fund – Pupil Activity Fund ............................................................. 113
Nonmajor Component Units – Charter Schools ................................................................... 115 Combining Statement of Net Position – Component Units – Charter Schools .................. 116 Combining Statement of Activities – Component Units – Charter Schools ....................... 117
Colorado Department of Education – Auditor’s Integrity Report - Independent Auditor’s Report......................................................................................................................................... 118
Colorado Department of Education – Auditor’s Integrity Report ........................................... 119 STATISTICAL SECTION ........................................................................................................ 121
Net Position by Component ................................................................................................. 123 Expenses, Program Revenues and Net (Expense)/Revenue ............................................... 124 General Revenues and Total Change in Net Position .......................................................... 125 Fund Balances, Governmental Funds .................................................................................. 126 Governmental Funds Revenues .......................................................................................... 127 Governmental Funds Expenditures and Debt Service Ratio ................................................ 128 Other Financing Sources (Uses) and Net Change in Fund Balances ................................... 129 Assessed Value and Actual Value of Taxable Property ....................................................... 130 Direct and Overlapping Property Tax Rates ......................................................................... 132 Principal Property Taxpayers ............................................................................................... 134 Principal Tax Levies and Collections ................................................................................... 135 Outstanding Debt by Type ................................................................................................... 136 General Bonded Debt .......................................................................................................... 137 Direct and Overlapping Governmental Activities Debt ......................................................... 138 Legal Debt Margin Information ............................................................................................. 139 Demographic and Economic Statistics ................................................................................. 140 Principal Employers ............................................................................................................. 141 Full-time Equivalent District Employees by Type ................................................................. 142 Operating Statistics ............................................................................................................. 143 Teacher Salaries ................................................................................................................. 144 School Building Information ................................................................................................. 145
REPORTS REQUIRED BY UNIFORM GUIDANCE ................................................................ 147 Schedule of Expenditures of Federal Awards ...................................................................... 148 Notes to Schedule of Expenditures of Federal Awards ........................................................ 150 Report on Internal Control over Financial Reporting and on Compliance and Other Matters
Based on an Audit of Financial Statements Performed in Accordance with Government Audit Standards - Independent Auditor’s Report ....................................................................... 151
Report on Compliance for Each Major Federal Program and Report on Internal Control over Compliance - Independent Auditor’s Report ..................................................................... 153
Schedule of Findings and Questioned Costs ....................................................................... 155 Summary Schedule of Prior Audit Findings .......................................................................... 158


1
INTRODUCTORY SECTION

2

3
Governing Board of Education - Function and Composition
Clockwise from top left: Vicki Reinhard, Stephanie Mason, Nichelle Ortiz, Marques Ivey, J.D., Board President Kyla Armstrong-Romero, Ph.D., Debra E. Gerkin, Superintendent D. Rico Munn, and Kevin Cox
The district is governed by a seven-member board of education. Directors are elected at successive biennial elections by registered voters residing in the district. Current directors serve staggered four-year terms of office. The board holds regular meetings on the third Tuesday of each month. Special meetings are held as needed. Directors elect board officers following each election. Members of the board of education receive no compensation for their services to the district. Among its duties, the board is empowered to:
• Employ all personnel required to maintain the operations and carry out the education programs of the district
• Determine and pay personnel compensatory wages • Establish enrollment boundaries for each school’s geographic area • Determine educational programs to be provided by the district

4
5
Letter of Transmittal
November 3, 2021
To the Members of the Board of Education:
The Comprehensive Annual Financial Report for Joint School District No. 28-J of the Counties of Adams and Arapahoe, Colorado, is hereby presented to the Board of Education and stakeholders of Aurora Public Schools. This report for fiscal year ended June 30, 2021, was prepared by the Division of Finance and includes the audit opinion of the independent auditors, BKD, LLP, who conducted the annual audit of the financial statements in accordance with generally accepted auditing standards and in compliance with state statutes.
BKD, LLP, certified public accountants, issued an unmodified (clean) opinion on the financial statements of the district for the fiscal year ended June 30, 2021. The independent auditor’s report is located at the front of the financial section of this report.
Management assumes full responsibility for the completeness and reliability of all the information presented in this report. The district’s financial services department prepares this report, which contains management’s representations concerning the finances of the district. To the best of our knowledge and belief, the enclosed data are accurate in all material respects, and reported in a manner to present fairly, the financial position and activities of the district’s various funds. All disclosures necessary to enable the reader to gain an understanding of the district’s financial activities are included.
Management’s discussion and analysis (MD&A) follows the independent auditor’s report and provides a narrative introduction, overview and analysis of the basic financial statements. MD&A complements this letter of transmittal and should be read in conjunction with it.
Profile of the District
Joint School District No. 28-J of the Counties of Adams and Arapahoe, Colorado, (Aurora Public Schools or APS), is a political subdivision of the state of Colorado with an independent governing Board of Education. The original school district was established in 1885 and was created in its current configuration in 1962. APS is one of the largest and most diverse school districts in Colorado. The district serves nearly 40,000 students representing families with longstanding connections to the community and families who come from more than 130 countries. The APS community is rich in culture, assets, and opportunity.
The district is located in Aurora, Colorado, a city on the eastern border of Denver, Colorado, and covers nearly 160 square miles. APS provides a full range of educational programs to a funded enrollment of 38,551 students, as authorized by Colorado state statutes. The district is an independent school district that is a public corporation duly organized and existing under the constitution and laws of the state of Colorado.
During 2020-21, the district consists of four child development centers, 27 elementary schools, seven combination elementary and middle schools, six middle schools, one combination grades

6
6-12 school, six high schools, one technical college, one home school support program, one gifted and talented combination elementary and middle school, and 10 charter schools. In school year 2020-21, 2,377 teachers were employed by the district.
In addition to regular education, student offerings include special education, vocational education at the technical college, pre-school, gifted and talented, English language acquisition and International Baccalaureate programs.
The transportation department travels over 1.45 million miles annually, transporting over 7,980 general education students and over 865 special needs students to and from school each day. The district operates 56 general education buses and 20 special needs buses to deliver daily transportation services. In total, 145 buses and 24 Multi-Function School Activity Buses (MFSAB) are available to cover routes and support over an average of 3,200 field and activity trips per school year.
A seven-member Board of Education governs the district. Each board member is elected by the public and serves a four-year term. The Board of Education is required by state statute to adopt annual budgets that represent a complete financial plan for the ensuing fiscal year. § 22-44-110(4), C.R.S. The Board of Education must adopt a resolution specifying appropriations for each governmental fund. Pursuant to these requirements, the district uses a detailed programmatic and line item budget for planning expenditures. The district maintains numerous budgetary controls. The objective of these controls is to ensure compliance with legal provisions embodied in the annual appropriated budget adopted by the Board of Education. Activities of all funds are included in the district's financial plan. The level of budgetary control (that is, the level at which expenditures cannot legally exceed the appropriated amount) is established at the individual fund level. Quarterly financial reports are prepared for each fund and distributed to the board and district administrators. While allowing minor deviations from budgets at the line item level, department and program-level budget areas stay within their total appropriations ensured by continuing management control of expenditures. Budget-to-actual comparison reports are available online to all program directors and department supervisors. These reports highlight budgetary variances and significant line-item deviations are discussed with appropriate supervisory administrators. This report includes all district funds and 11 component units: the Aurora Public Schools Foundation and 10 charter schools. The 10 charter schools are: Academy of Advanced Learning, Aurora Academy, Aurora Science and Tech. of Denver School of Science and Technology, Inc., AXL Charter School, Empower Community High School, Global Village Academy, Lotus School for Excellence, Rocky Mountain Preparatory School at Fletcher, Vanguard Classical School, and Vega Collegiate Academy.
Economy
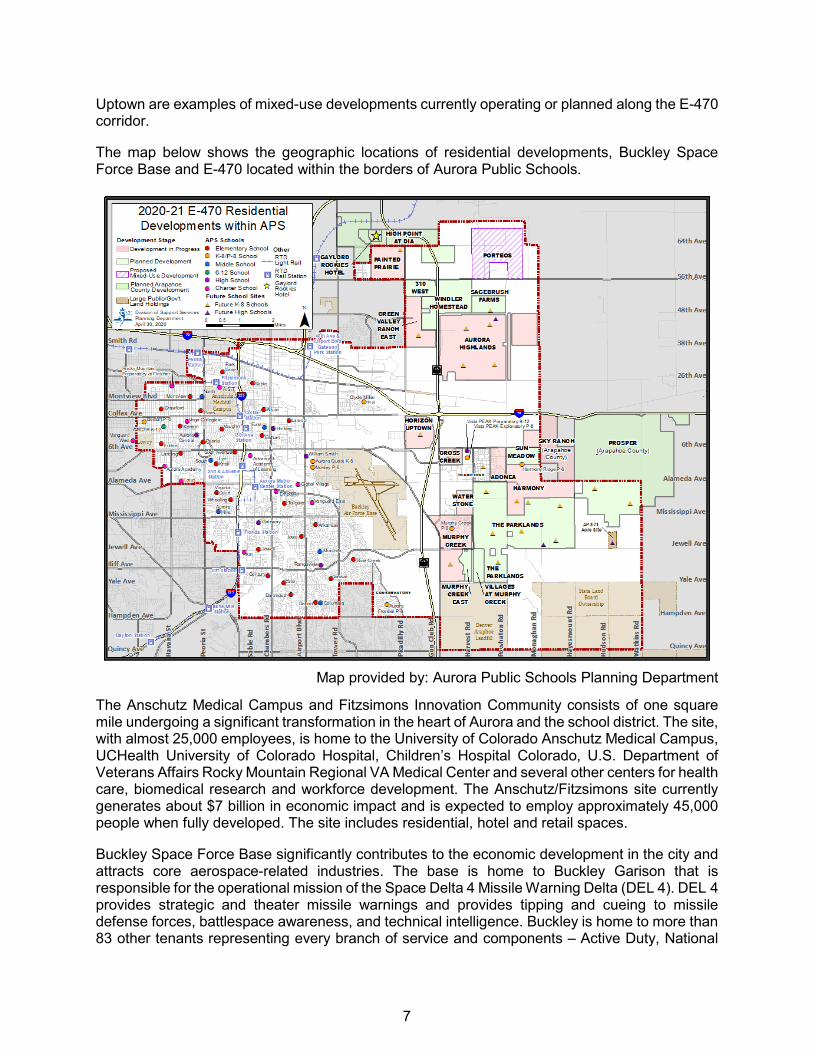
The district is located almost entirely within the city of Aurora and other portions are located in unincorporated Adams and Arapahoe counties. With over 386,000 residents, Aurora is the 54th largest city in the nation and the third largest in the state of Colorado. Over 188,000 of residents aged 16 and above are employed. The city of Aurora covers 160 square miles. Approximately 12,320 businesses employ over 188,000 people. City demographics indicate that 38.5 percent are college graduates. Median household income is $62,541, and the median age is 34.4. Most of Aurora’s new residential development continues to take place in southeast and northeast Aurora along the E-470 tollway, shown on the map on the next page, providing a major north-south thoroughfare in the center of the district. Approximately 55 percent of the area within the district boundaries is not developed. The Painted Prairie, Green Valley Ranch East and Horizon
7
Uptown are examples of mixed-use developments currently operating or planned along the E-470 corridor.
The map below shows the geographic locations of residential developments, Buckley Space Force Base and E-470 located within the borders of Aurora Public Schools.
Map provided by: Aurora Public Schools Planning Department
The Anschutz Medical Campus and Fitzsimons Innovation Community consists of one square mile undergoing a significant transformation in the heart of Aurora and the school district. The site, with almost 25,000 employees, is home to the University of Colorado Anschutz Medical Campus, UCHealth University of Colorado Hospital, Children’s Hospital Colorado, U.S. Department of Veterans Affairs Rocky Mountain Regional VA Medical Center and several other centers for health care, biomedical research and workforce development. The Anschutz/Fitzsimons site currently generates about $7 billion in economic impact and is expected to employ approximately 45,000 people when fully developed. The site includes residential, hotel and retail spaces.
Buckley Space Force Base significantly contributes to the economic development in the city and attracts core aerospace-related industries. The base is home to Buckley Garison that is responsible for the operational mission of the Space Delta 4 Missile Warning Delta (DEL 4). DEL 4 provides strategic and theater missile warnings and provides tipping and cueing to missile defense forces, battlespace awareness, and technical intelligence. Buckley is home to more than 83 other tenants representing every branch of service and components – Active Duty, National
8
Guard and Reserve as well as the Aerospace Data Facility – Colorado. The base has an annual economic impact of nearly $1 billion to the region. Raytheon is the city’s second largest private employer with more than 2,430 employees (Northrop Grumman has 750 and Lockheed Martin has 600). Lockheed Martin and The Boeing Company all have major operations in the city of Aurora.
In March 2020, the World Health Organization declared COVID-19 a pandemic. The COVID-19 pandemic and resulting disruptions have caused significant economic uncertainty and volatility in financial markets, economy, business and communities. The disruptions included closure of schools and implementing remote learning with APS providing remote learning for the first few months of the school year 2020-2021. By May 2021 COVID-19 vaccines in the US became available to the general public for those who are over 12 years of age and restrictions began to be lifted. Management believes that the district is taking appropriate actions to mitigate the negative impact. However, the full impact of the COVID-19 pandemic is unknown and may continue to impact various aspects of the district operations including creating significant shortfall for school funding.
Long-Term Financial Planning
The fund balance in the General Fund is a measure of the ability of the district’s finances to sustain operations in the event of a financial downturn. Fund balance increased by $33.2 million, from $147.3 million to $180.5 million. Total fund balance in the General Fund is 34 percent of total ordinary General Fund revenues (excluding other financing sources), which includes fund balances that are restricted (e.g., three percent TABOR emergency reserve), assigned for identified needs (e.g., the Board’s cash fund emergency reserve) and unassigned fund balances to cover contingencies caused by unpredictable revenues and potentially volatile expenditures.
Looking to the future, Colorado’s K-12 funding remains uncertain. Long-term estimates of state funding for K-12 education will be predicated on sustained economic growth within the state that is sufficient to cover inflation and student growth, while at the same time being able to meet other resource demands such as Medicaid, social programs, prisons, roads and higher education.
Outstanding general obligation debt including accreted interest as of June 30, 2021, is $399.2 million. During 2020-21, $32.4 million from the district’s bond program authorized in 2016 was expended to renovate existing schools. Approximately 88 percent of the district’s 65 schools (and 88 percent of school buildings) are over 20 years old and roughly 47 percent (and 47 percent of school buildings) are over 40 years old. Every school will benefit from various projects funded from the 2016 bond program.
Financial Policies
The district’s system of internal controls is designed to provide reasonable, but not absolute, assurance that assets are adequately safeguarded, transactions are accurately recorded and expenditures are properly authorized. Those controls also assure the reliability of financial records for preparing financial statements and maintaining the accountability for assets. The concept of reasonable assurance recognizes that the cost of a control should not exceed the benefits likely to be derived from that control. The evaluation of costs and benefits requires estimates and judgments by management. All internal control evaluations occur within this framework.
The district’s accounting and budgeting systems are integrated, which facilitates budgetary control. Also, the systems include integrity checks and balances which help assure only valid transactions become permanent records. The district’s existing systems of budgetary and accounting controls
9
are designed to provide reasonable assurance that error or irregularities of a material nature are prevented or are detected within a reasonable period. We believe that the district’s internal accounting controls adequately safeguard assets and provide reasonable assurance of proper recording of financial transactions. The district’s internal control structure is subject to periodic review by management and independent external auditors.
The District Accountability Advisory Committee, comprised of parents, staff and community members, reviews the district’s budget annually at its public budget hearings in May.
Colorado Public School Finance
School funding in Colorado is primarily generated by the School Finance Act with per pupil revenues distributed to districts based upon a finance formula. This formula is designed to equalize school funding across districts for variations in local property values and student needs. However, revenue shortfalls at the state level caused by economic recessions continued to stress school district budgets in 2020-21. Statewide, Colorado school district funding was reduced by $1.059 million through the application of the budget stabilization factor. During 2020-21, the district received $8,593 per pupil, $423 less per pupil than the prior year.
Considering declining funded student enrollments, the district prepares budgets that use conservative revenue assumptions. These assumptions include decline in state per pupil revenue and modest estimates of district funded pupil count.
For fiscal year 2021-22, the district’s per pupil funding is budgeted to increase by $707, from $8,593 to $9,300. Considering the per pupil count decrease, the 2021-22 budget projected a decrease in funded pupil count of 961, resulting in an estimated increase in total pupil funding of $18.1 million. The increase in per pupil funding does not restore state funding to the level that would have occurred if the state could fully fund the school finance formula.
The Public School Finance Act of 1994 provides state funding for charter schools authorized by the local Board of Education. Funding flows from the state, through the district, and then to the charter schools. Charter schools receive per pupil funding, a proportionate share of local mill levy override funding, state capital construction funding and federal start-up funds, if applicable. The district had 10 charter schools operating in 2020-21: Academy of Advanced Learning, Aurora Academy, Aurora Science and Tech. of Denver School of Science and Technology, Inc., AXL Charter School, Empower Community High School, Global Village Academy, Lotus School for Excellence, Rocky Mountain Preparatory School at Fletcher, Vanguard Classical School and Vega Collegiate Academy.
Local Property Tax Support
Property taxes collected during the 2020-21 fiscal year were based on assessed valuations which increased by 5 percent in 2020-21 over the prior year.
The mill levy programs approved by APS voters in 1990, 2008, 2012 and 2018 provide funding for instruction-related programs that support student achievement. For example, mill levy dollars fund increased instruction in math, science and literacy, classroom technology and full-day kindergarten at most APS schools. Other examples of how APS mill levy funds benefit students include:
• Providing after-school tutoring and extended day learning opportunities for students who benefit from additional literacy and math support
10
• Expanding staff and training dedicated to student mental health • Increasing pay to recruit and retain high quality teachers • Expanding after-school learning programs for K-5 elementary students • Adding and providing seat belts on buses • Supporting school choice by providing mill levy funds to charter schools based on student
enrollment
Major Initiatives
APS’ previous strategic plan, APS 2020, provided a foundation for change and momentum that APS has seen including helping APS move off of the district accountability clock for the 2017-18 school year. Graduation rates have seen significant increases over the last six school years, making significant progress to close the gap with the state average and eliminating the graduation gap between students who are white, Hispanic, and African American/Black.
In 2021, APS launched APS 2026: Faces of the Future, a new strategic plan that builds on the momentum, opportunity and impact that resulted from APS’ previous strategic plan, APS 2020. APS 2026 is also informed by the community's priorities, which are focused on early literacy, equity, and postsecondary workforce readiness. These priorities, as well as the community's values, were adopted by the APS Board of Education in 2021. APS 2026: Faces of the Future serves as the district’s plan to guide everything we do to achieve our vision that: Every student shapes a successful future. APS 2026 includes four strategic goals to ensure that we achieve our vision. Every student will have:
• Goal 1: A Plan for their Future • Goal 2: A Set of Skills to Implement Their Plan • Goal 3: Credentials that Open Doors • Goal 4: A Community of Support
Like school districts across the state and country, APS finds itself continuing to build on the prior success, while navigating new challenges with the disruption of learning due to the COVID-19 pandemic. APS is also focused on responding to the impacts that the COVID-19 pandemic has had on our students, community and staff since March 2020. In response to Lessons Learned from the COVID-19 Pandemic, APS will implement the APS Resiliency and Recovery Plan, with financial support from the American Rescue Plan ESSER funds and prioritization of other district funds. APS’ Resiliency and Recovery Plan will focus on closing the opportunity and resource divides created or exacerbated by the COVID-19 global pandemic by using one-time resources in a way that builds sustainable capacity to implement our strategic plan, meet the APS Board of Education directed Results (student outcomes), and fulfill APS’ mission. This will include focusing on responding to student learning loss—the continued social and academic progress that students would have made in absence of the disruption to student learning; supporting ongoing infrastructure needs and those elevated by the pandemic, and supporting system and capacity building for meeting student needs.
In addition to the APS 2026 and Resiliency and Recovery, APS is implementing a new comprehensive, long-term education and facilities plan called Blueprint APS. The Blueprint APS considers the decline in enrollment for the district over the past several years that is particularly affecting schools in the western part of the district and anticipated growth in housing developments on the eastern part of the district. In June 2018, APS began engaging the community to get input on the future of APS and what they wanted for their children. With direction from the community and the APS Board of Education, APS is implementing its Blueprint APS
11
Framework. The Blueprint APS Framework includes shifting neighborhood schools to boundary schools, implementation of regions with specialties aligned to community assets, and more district-run schools for families to choose, such as magnet schools. For APS, this will mean changes to align with Blueprint APS and the changes the community is experiencing, including repurposing of existing schools and building of new schools. APS has begun implementation of several components of the Blueprint APS Framework, with identification of regional specializations for all seven regions; plans moving forward to build two new P-8 school buildings in two regions; plans to repurpose two schools into magnet schools, one focused on arts and one on entrepreneurship and invention; and implementation of a 6-12 new magnet program within an existing comprehensive high school. The magnet schools and programs will open for the 2022-23 school year.
APS is also continuing implementation of key activities to support the health and safety of our students as a result of the passage of APS’ 2018 Mill Levy Override. The ballot measure included funding to support: expanding staff and training dedicated to student mental health; increasing pay to recruit and retain high quality teachers; expanding after-school learning programs for K-5 elementary students; and adding and providing seat belts on buses. This work has been instrumental in APS being able to respond in real time to the behavioral health and childcare needs of our students and families during the COVID-19 pandemic.
APS, like every other school district in the nation, does not have unlimited time or resources. This reality demands that we be focused, creative, and above all else, strategic. Our students, families and community deserve better schools and higher achievement. This belief fuels our work. It also drives a deep sense of urgency to be ready, to be flexible and to maximize the talent needed to improve outcomes across the district so that every student shapes a successful future.
Awards and Acknowledgements
The Government Finance Officers Association of the United States and Canada (GFOA) awarded a Certificate of Achievement for Excellence in Financial Reporting to the district for its comprehensive annual financial report for the fiscal year ended June 30, 2020. This was the 37th consecutive year that the district received this prestigious award. In order to receive a certificate of achievement, the district must publish an easily readable and efficiently organized comprehensive annual financial report whose contents conform to generally accepted accounting principles and applicable legal requirements. This report must satisfy accounting principles generally accepted in the United States of America and applicable legal requirements.
In addition, the Association of School Business Officials International (ASBO) awarded a Certificate of Excellence in Financial Reporting to Aurora Public Schools for its comprehensive annual financial report for fiscal year ended June 30, 2020. This was the 3rd consecutive year that the district received this prestigious award. This certificate is awarded to government units that publish an easy-to-read and well-organized comprehensive annual financial report whose content conforms to the program’s standards. This report satisfy accounting principles generally accepted in the United States of America and applicable legal requirements.
Certificates from both ASBO and GFOA are valid for a period of one year only. We believe that our current report continues to meet the certificate of achievement programs’ requirements and we are submitting it to both ASBO and GFOA for review and certification.
The publishing of this document would not have been possible without many hours of work put forth by the district’s accounting department. In addition, the district appreciates its independent auditors, BKD, LLP, for their professional assistance in preparation of this report. Furthermore,
12
we would like to express our appreciation to the district’s planning and transportation departments, city of Aurora, Adams and Arapahoe counties and other governmental agencies that provided supplemental information used in the preparation of this report. Finally, supplemental information from the Internet home pages of several agencies, organizations and city and state governments was accessed during the compilation of this report. Garnering this information via the Internet was an efficient method to acquire relevant data for our report.
Respectfully submitted,
D. Rico Munn Brett Johnson Superintendent of Schools Chief Financial Officer
13
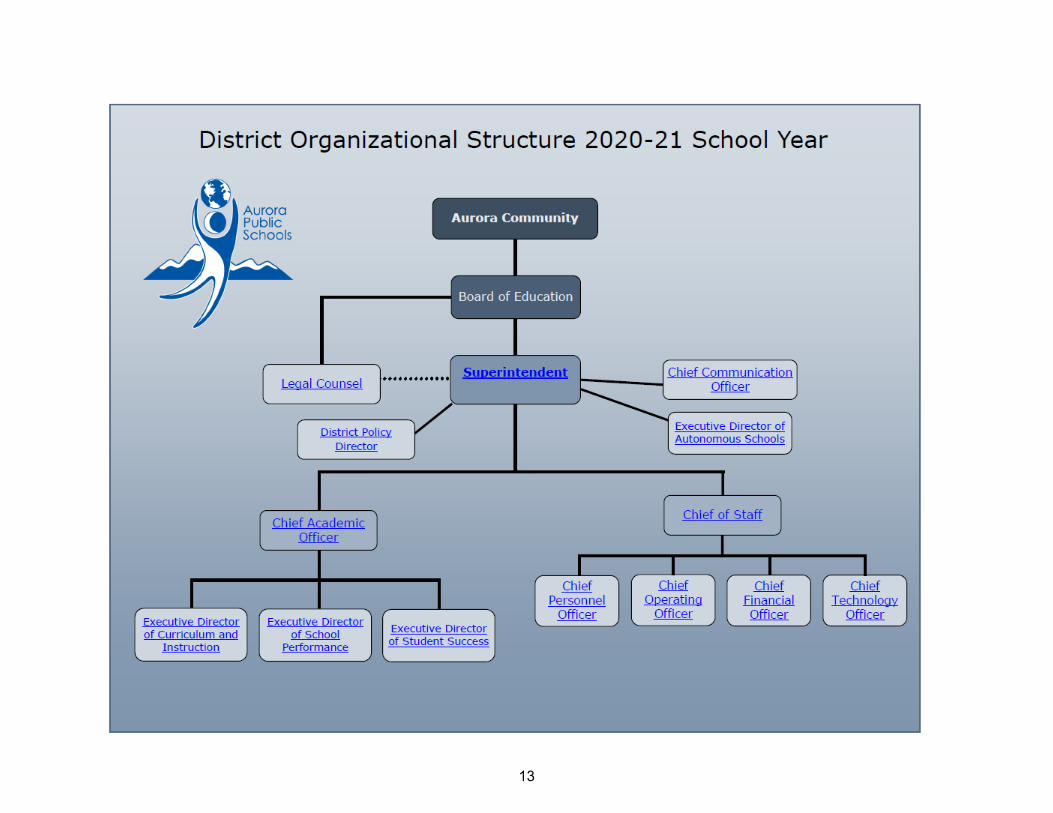
Aurora Public Schools Organizational Chart
14
GFOA – Certificate of Achievement for Excellence in Financial Reporting
Government Finance Officers Association
Certificate of Achievement for Excellence in Financial Reporting
Presented to
Joint School District No. 28J of the Counties of Adams and Arapahoe
Colorado
For its Comprehensive Annual Financial Report
For the Fiscal Year Ended
June 30, 2020
Executive Director/CEO
15
ASBO – Certificate of Excellence in Financial Reporting
The Certificate of Excellence in Financial Reporting is presented to
Joint School District No 28J of the Counties of Adams and Araphahoe, Colorado
for its Comprehensive Annual Financial Report
for the Fiscal Year Ended June 30, 2020.
The district report meets the criteria established for ASBO International’s Certificate of Excellence.
W. Edward Chabal David J. Lewis President Executive Director

16

17
FINANCIAL SECTION

18
Independent Auditor’s Report5F
Board of Education Joint School District No. 28-J of the Counties of Adams and Arapahoe, Colorado Aurora, Colorado Report on the Financial Statements
We have audited the accompanying financial statements of the governmental activities, the aggregate discretely presented component units, each major fund and the aggregate remaining fund information of the Joint School District No. 28-J of the Counties of Adams and Arapahoe, Colorado, as of and for the year ended June 30, 2021, and the related notes to the financial statements, which collectively comprise the District’s basic financial statements as listed in the table of contents.
Management’s Responsibility for the Financial Statements
Management is responsible for the preparation and fair presentation of these financial statements in accordance with accounting principles generally accepted in the United States of America; this includes the design, implementation and maintenance of internal control relevant to the preparation and fair presentation of financial statements that are free from material misstatement, whether due to fraud or error.
Auditor’s Responsibility
Our responsibility is to express opinions on these financial statements based on our audit. We did not audit the financial statements of Aurora Academy, Global Village Academy, Academy of Advanced Learning, Lotus School for Excellence, Vanguard Classical School, AXL Academy, Rocky Mountain Preparatory School, Vega Collegiate Academy and Empower Community High School all of which are included as discretely presented component units, which represent 96.95% of total assets and 90.10% of total revenues of the aggregate discretely presented component units as of and for the year ended June 30, 2021. Those statements were audited by other auditors whose reports have been furnished to us and our opinion on the aggregate discretely presented component units, insofar as it relates to the amounts included for Aurora Academy, Global Village Academy, Academy of Advanced Learning, Lotus School for Excellence, Vanguard Classical School, AXL Academy, Rocky Mountain Preparatory School, Vega Collegiate Academy, and Empower Community High School, is based solely on the reports of the other auditors. We conducted our audit in accordance with auditing standards generally accepted in the United States of America and the standards applicable to financial audits contained in Government Auditing Standards, issued by the Comptroller General of the United States. Those standards require that we plan and perform the audit to obtain reasonable assurance about whether the financial statements are free from material misstatement. The financial statements of the Aurora Public Schools Foundation, AXL Academy, Vanguard Classical School, Vega Collegiate Academy and Empower Community High School
included in the financial statements of the aggregate discretely presented component units, were not audited in accordance with Government Auditing Standards. An audit involves performing procedures to obtain audit evidence about the amounts and disclosures in the financial statements. The procedures selected depend on the auditor’s judgment, including the assessment of the risks of material misstatement of the financial statements, whether due to fraud or error. In making those risk assessments, the auditor considers internal control relevant to the entity’s preparation and fair presentation of the financial statements in order to design audit procedures that are appropriate in the circumstances, but not for the purpose of expressing an opinion on the effectiveness of the entity’s internal control. Accordingly, we express no such opinion. An audit also includes evaluating the appropriateness of accounting policies used and the reasonableness of significant accounting estimates made by management, as well as evaluating the overall presentation of the financial statements.
We believe that the audit evidence we have obtained is sufficient and appropriate to provide a basis for our audit opinions.
Opinions
In our opinion, based on our audit and the reports of the other auditors, the financial statements referred to above present fairly, in all material respects, the respective financial position of the governmental activities, the aggregate discretely presented component units, each major fund, and the aggregate remaining fund information of the District as of June 30, 2021, and the respective changes in financial position, for the year then ended in accordance with accounting principles generally accepted in the United States of America.
Other Matters
Required Supplementary Information 7F
Accounting principles generally accepted in the United States of America require that the management’s discussion and analysis, budgetary and pension and other postemployment benefits information as listed in the table of contents be presented to supplement the basic financial statements. Such information, although not part of the basic financial statements, is required by the Governmental Accounting Standards Board, who considers it to be an essential part of financial reporting for placing the basic financial statements in an appropriate operational, economic or historical context. We have applied certain limited procedures to the required supplementary information in accordance with auditing standards generally accepted in the United States of America, which consisted of inquiries of management about the methods of preparing the information and comparing the information for consistency with management’s responses to our inquiries, the basic financial statements and other knowledge we obtained during our audit of the basic financial statements. We do not express an opinion or provide any assurance on the information because the limited procedures do not provide us with sufficient evidence to express an opinion or provide any assurance.
Other Information8F
Our audit was conducted for the purpose of forming opinions on the financial statements that collectively comprise the District’s basic financial statements. The accompanying supplementary information as listed in the table of contents, including the schedule of expenditures of federal awards required by Title 2 U.S. Code of Federal Regulations Part 200, Uniform Administrative Requirements, Cost Principles, and Audit Requirements for Federal Awards, as well as other information including the introductory and statistical sections, as listed in the table of contents is presented for purposes of additional analysis and is not a required part of the basic financial statements.
The supplementary information is the responsibility of management and was derived from and relate directly to the underlying accounting and other records used to prepare the basic financial statements. Such information has been subjected to the auditing procedures applied in the audit of the basic financial statements and certain additional procedures, including comparing and reconciling such information directly to the underlying accounting and other records used to prepare the basic financial statements or to the basic financial statements themselves, and other additional procedures in accordance with auditing standards generally accepted in the United States of America by us and the other auditors. In our opinion, based on our audit, the procedures performed as described above, and the reports of other auditors, the supplementary information is fairly stated, in all material respects, in relation to the basic financial statements as a whole.
The other information as defined above, has not been subjected to the auditing procedures applied in the audit of the basic financial statements, and accordingly, we do not express an opinion or provide any assurance on it.
Other Reporting Required by Government Auditing Standards
In accordance with Government Auditing Standards, we have also issued our report dated November 3, 2021, on our consideration of the District’s internal control over financial reporting and on our tests of its compliance with certain provisions of laws, regulations, contracts and grant agreements and other matters. The purpose of that report is solely to describe the scope of our testing of internal control over financial reporting and compliance and the results of that testing, and not to provide an opinion on the effectiveness of the District’s internal control over financial reporting or on compliance. That report is an integral part of an audit performed in accordance with Government Auditing Standards in considering the District’s internal control over financial reporting and compliance.
Denver, Colorado November 3, 2021

22
23
Management’s Discussion and Analysis
(Unaudited)
Joint School District No. 28-J of the Counties of Adams and Arapahoe, Colorado
Management’s Discussion and Analysis (Unaudited) For the Fiscal Year Ended June 30, 2021
24
The management of Joint School District No. 28-J of the Counties of Adams and Arapahoe, Colorado, offers to readers this discussion and analysis of the district’s financial performance for the year ended June 30, 2021. This discussion and analysis focuses on the primary government and does not include its discretely presented component units. We encourage readers to consider the information presented here in conjunction with the transmittal letter, basic financial statements, notes to the basic financial statements, the required supplementary information, supplementary information and the statistical section to further enhance their understanding of APS’s financial performance.
Financial Highlights
On the statement of net position, assets and deferred outflows of resources were less than the district’s liabilities and deferred inflows of resources, resulting in a net position deficit of $461.0 million. Total assets increased by $4.6 million, deferred outflows of resources increased by $189.6 million, total liabilities increased by $57.3 million and deferred inflows of resources decreased by $129.4 million.
On the statement of activities, general revenues totaling $499.0 million accounted for 73.3 percent of all revenues of the primary government. Program revenues provided $181.8 million, or 26.7 percent of all revenues, directly supporting the functions and programs of the primary government. Total expenses increased from $396.3 million in 2019-20 to $414.7 million in 2020-21.
The outstanding liability for general obligation bonds payable, including accreted interest and principal, decreased by $32.0 million due to the net of scheduled principal payments and the additions of accreted interest, leaving $399.2 million in principal and accreted interest payments outstanding.
Governmental funds reported combined ending fund balances of $363.8 million, an increase of $39.5 million from the prior year. Unassigned fund balance of $24.6 million in the General Fund is available for district use. Nonspendable fund balance for prepaid items totaled $7.4 million; fund balances restricted for statutory requirements and committed for contractual agreements totaled $192.9 million; fund balance amounts assigned by district management for various operations and contingencies totaled $138.8 million. Federal grants totaling $130.4 million were received by the district and increased from $46.0 million, contributing to the increase in fund balance year over year.
The COVID-19 pandemic and resulting disruptions have caused significant economic uncertainty and volatility in financial markets, U.S. economy and local economy. It is expected that the disruptions will create significant shortfall for school funding for the next several years.
Overview of the Basic Financial Statements
This discussion and analysis is intended to serve as an introduction to the district’s basic financial statements. This annual report consists of a series of financial statements and notes to those statements organized so the reader can understand the district as a whole. The basic financial statements are comprised of three components: 1) government-wide financial statements, 2) fund financial statements and 3) notes to basic financial statements. This report also includes a section of required supplementary information and a section of supplementary information intended to furnish additional detail to support the basic financial statements.
Joint School District No. 28-J of the Counties of Adams and Arapahoe, Colorado
Management’s Discussion and Analysis (Unaudited) For the Fiscal Year Ended June 30, 2021
25
Government-wide Financial Statements
The government-wide financial statements are designed to provide readers with a broad overview of the district’s finances using accounting methods similar to those used by private-sector business. The government-wide financial statements include the statement of net position and the statement of activities.
The statement of net position presents information about all of the district’s assets, deferred outflows of resources, liabilities and deferred inflows of resources, with the difference reported as net position. Over time, increases or decreases in net position may serve as a useful indicator of whether the financial position of the district is improving or deteriorating.
The statement of activities shows how the government’s net position changed during the most recent fiscal year. All of the current year’s revenues and expenses are accounted for in the statement of activities when the event occurs, regardless of the timing of when cash is received or paid. Thus, revenues and expenses are reported for some items that will only result in cash flows in future fiscal periods (e.g., uncollected property taxes and earned but unused leave).
Fund Financial Statements
The fund financial statements focus on the district’s major funds and provide more detailed information about the district. A fund is a grouping of related accounts that is used to maintain control over resources that have been segregated for specific activities or objectives. The district has two kinds of funds: governmental funds and fiduciary funds.
Governmental Funds
Most of the district’s activities are reported in governmental funds, which focus on how money flows into and out of those funds. The balances left at year-end are available for spending in future periods. The governmental fund statements provide a detailed, short-term view on the financial resources that can be spent in the near future on the district’s programs.
The focus of governmental funds is narrower than that of the government-wide financial statements, so it is useful to compare the information presented for governmental funds with similar information presented for governmental activities in the government-wide financial statements. By doing so, readers may better understand the long-term impact of the government’s near-term financial decisions.
Because there are differences between governmental activities (shown in the statement of net position and the statement of activities previously discussed) and governmental funds, two reconciliations are provided in the financial statements. The major differences between the financial reporting on governmental activities and governmental funds relate to the district’s long-term liabilities and acquisition of capital assets. The district maintains ten individual governmental funds. Information is presented separately in the governmental fund balance sheet and in the governmental fund statement of revenues, expenditures and changes in fund balances for the General, Bond Redemption, Grants, Nutrition Services, Building and Capital Reserve, all of which are considered to be major funds. Data for the other four governmental funds (Athletic, Medicaid, Pickens Post-Secondary and Pupil Activity) are combined into a single, aggregated presentation. Individual fund data for each of these nonmajor governmental funds is provided in the form of combining statements included in this report.
Joint School District No. 28-J of the Counties of Adams and Arapahoe, Colorado
Management’s Discussion and Analysis (Unaudited) For the Fiscal Year Ended June 30, 2021
26
Fiduciary Fund
The district operates one fiduciary fund, the Health Trust Fund. The district is the fiduciary for assets that belong to others. The district is responsible for ensuring that the assets reported in the Health Trust Fund are used only for their intended purposes. Additions to the Health Trust Fund are employer and employee contributions for the operations of the self-funded health insurance program. These assets cannot be used to finance district operations and are not included in the government-wide financial statements.
Notes to Basic Financial Statements
The notes to basic financial statements provide additional information that is essential to a full understanding of the data provided in the basic financial statements.
Required Supplementary Information and Other Supplementary Information
In addition to the basic financial statements and accompanying notes, this report also includes required supplementary information containing the district’s budgetary schedules for the district’s General Fund, Grants Fund, and Nutrition Services Fund, as well as pension information as required by GASB 68 and OPEB information as required by GASB 75. Other supplementary information, including financial statements and budgetary comparisons for the district’s other governmental funds, and financial statements for the district’s fiduciary funds and component units, follows the required supplementary information. Legal compliance information for budgetary requirements and the Auditor’s Integrity Report is included in other supplementary information.
Government-wide Financial Analysis
Governmental Activities
As of June 30, 2021, assets were not sufficient to fund liabilities. The sole reason for liabilities exceeding assets is due to amounts related to the PERA pension and OPEB. As required by GASB 68, the district recorded a noncurrent liability of $795.6 million for its net pension liability. APS has no legal obligation to fund this shortfall nor does it have any ability to affect funding, benefits or annual required contribution decisions made by PERA. The district also recorded a noncurrent liability of $28.9 million as required by GASB 75 for net OPEB liability. Deferred outflows of resources related to the pension plan and OPEB increased by $193.4 million, due to the difference between projected and actual earnings on investments, change in assumptions and change in proportionate share of contributions. Deferred inflows of resources related to the pension plan and OPEB decreased by $129.4 million, due to the difference between projected and actual earnings on investments, change in assumptions and change in proportionate share of contributions. Overall, the district’s total net position improved from a deficit of $727.3 million to a deficit of $461.0 million. See footnotes 1, 10 and 11 in Notes to the Financial Statements for additional information on GASB 68 and GASB 75.
A significant portion of the district’s assets are its investments in capital assets, such as land, buildings, vehicles and equipment. The value of capital assets, including nondepreciable and depreciable assets, net of depreciation, increased by $1.7 million, from $492.4 million to $494.1 million. The change is due to new assets of $24.4 million offset by depreciation of $22.7 million. The new assets include construction in progress of $20.8 million, which is a result of the district using proceeds from the general obligation bonds approved by voters in November 2016.
Joint School District No. 28-J of the Counties of Adams and Arapahoe, Colorado
Management’s Discussion and Analysis (Unaudited) For the Fiscal Year Ended June 30, 2021
27
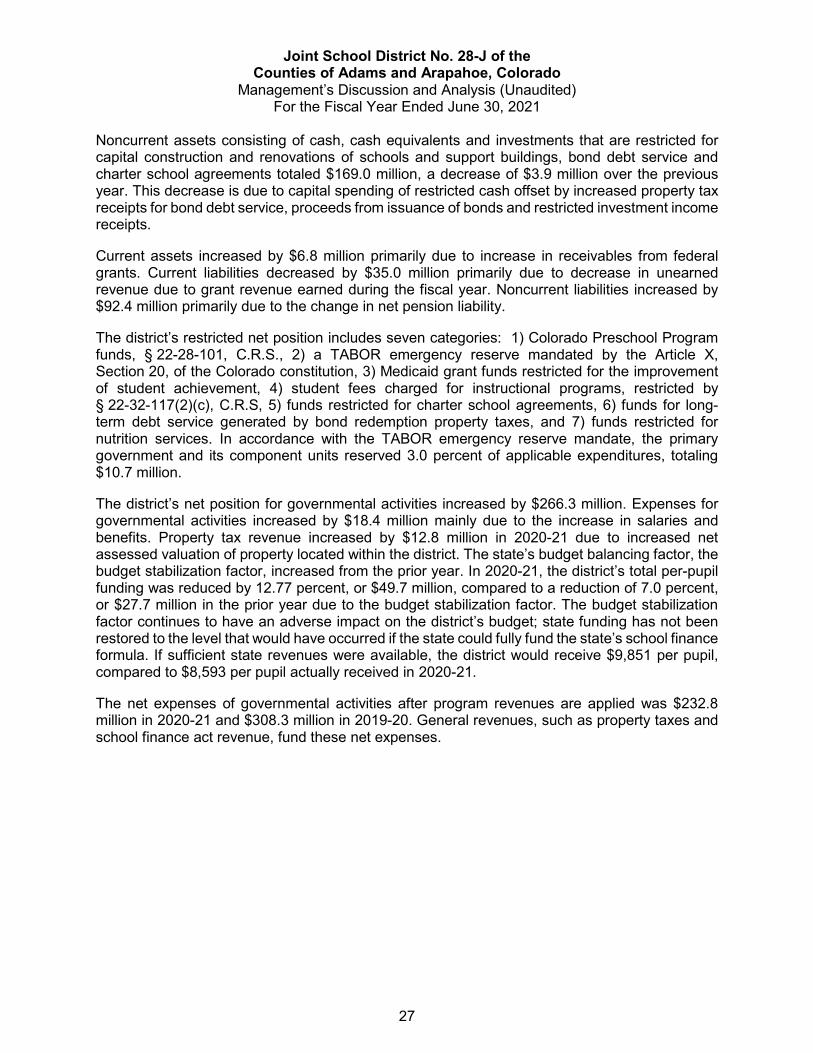
Noncurrent assets consisting of cash, cash equivalents and investments that are restricted for capital construction and renovations of schools and support buildings, bond debt service and charter school agreements totaled $169.0 million, a decrease of $3.9 million over the previous year. This decrease is due to capital spending of restricted cash offset by increased property tax receipts for bond debt service, proceeds from issuance of bonds and restricted investment income receipts.
Current assets increased by $6.8 million primarily due to increase in receivables from federal grants. Current liabilities decreased by $35.0 million primarily due to decrease in unearned revenue due to grant revenue earned during the fiscal year. Noncurrent liabilities increased by $92.4 million primarily due to the change in net pension liability.
The district’s restricted net position includes seven categories: 1) Colorado Preschool Program funds, § 22-28-101, C.R.S., 2) a TABOR emergency reserve mandated by the Article X, Section 20, of the Colorado constitution, 3) Medicaid grant funds restricted for the improvement of student achievement, 4) student fees charged for instructional programs, restricted by § 22-32-117(2)(c), C.R.S, 5) funds restricted for charter school agreements, 6) funds for long-term debt service generated by bond redemption property taxes, and 7) funds restricted for nutrition services. In accordance with the TABOR emergency reserve mandate, the primary government and its component units reserved 3.0 percent of applicable expenditures, totaling $10.7 million.
The district’s net position for governmental activities increased by $266.3 million. Expenses for governmental activities increased by $18.4 million mainly due to the increase in salaries and benefits. Property tax revenue increased by $12.8 million in 2020-21 due to increased net assessed valuation of property located within the district. The state’s budget balancing factor, the budget stabilization factor, increased from the prior year. In 2020-21, the district’s total per-pupil funding was reduced by 12.77 percent, or $49.7 million, compared to a reduction of 7.0 percent, or $27.7 million in the prior year due to the budget stabilization factor. The budget stabilization factor continues to have an adverse impact on the district’s budget; state funding has not been restored to the level that would have occurred if the state could fully fund the state’s school finance formula. If sufficient state revenues were available, the district would receive $9,851 per pupil, compared to $8,593 per pupil actually received in 2020-21.
The net expenses of governmental activities after program revenues are applied was $232.8 million in 2020-21 and $308.3 million in 2019-20. General revenues, such as property taxes and school finance act revenue, fund these net expenses.
Joint School District No. 28-J of the Counties of Adams and Arapahoe, Colorado
Management’s Discussion and Analysis (Unaudited) For the Fiscal Year Ended June 30, 2021
28
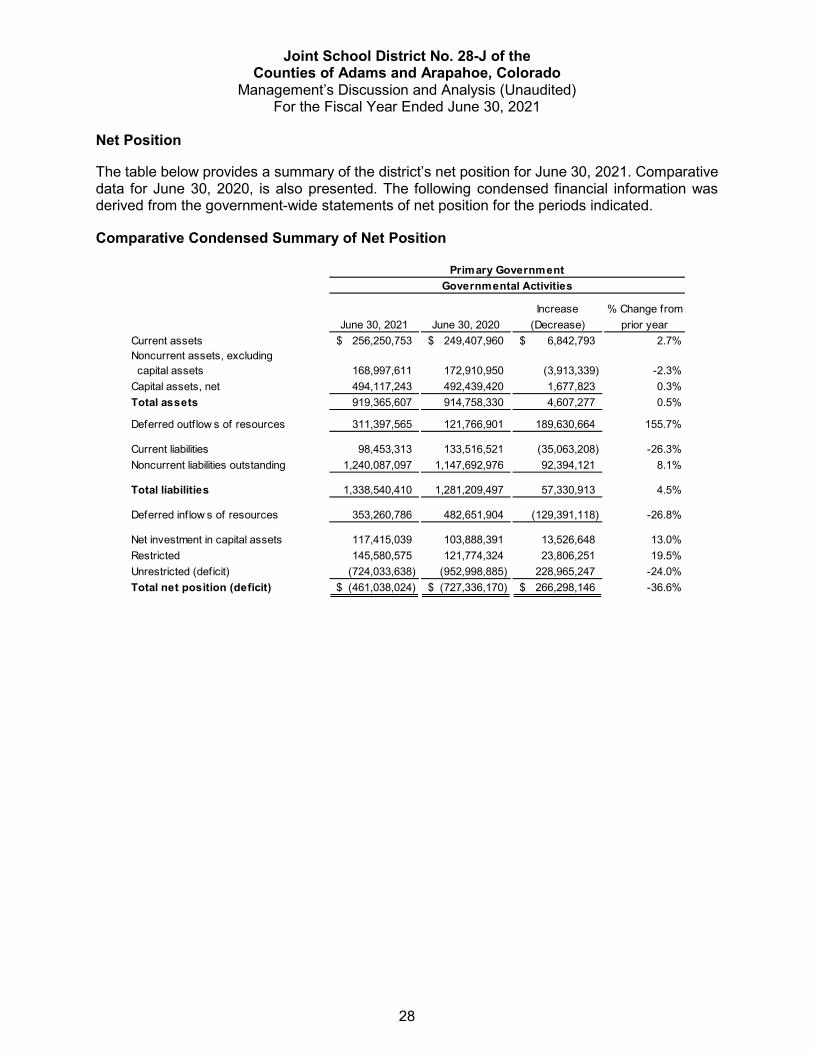
Net Position
The table below provides a summary of the district’s net position for June 30, 2021. Comparative data for June 30, 2020, is also presented. The following condensed financial information was derived from the government-wide statements of net position for the periods indicated.
Comparative Condensed Summary of Net Position
Increase % Change fromJune 30, 2021 June 30, 2020 (Decrease) prior year
Current assets 256,250,753$ 249,407,960$ 6,842,793$ 2.7%Noncurrent assets, excluding capital assets 168,997,611 172,910,950 (3,913,339) -2.3%Capital assets, net 494,117,243 492,439,420 1,677,823 0.3%Total assets 919,365,607 914,758,330 4,607,277 0.5%
Deferred outf low s of resources 311,397,565 121,766,901 189,630,664 155.7%
Current liabilities 98,453,313 133,516,521 (35,063,208) -26.3%Noncurrent liabilities outstanding 1,240,087,097 1,147,692,976 92,394,121 8.1%
Total liabilities 1,338,540,410 1,281,209,497 57,330,913 4.5%
Deferred inflow s of resources 353,260,786 482,651,904 (129,391,118) -26.8%
Net investment in capital assets 117,415,039 103,888,391 13,526,648 13.0%Restricted 145,580,575 121,774,324 23,806,251 19.5%Unrestricted (deficit) (724,033,638) (952,998,885) 228,965,247 -24.0%Total net position (deficit) (461,038,024)$ (727,336,170)$ 266,298,146$ -36.6%
Primary GovernmentGovernmental Activities

Joint School District No. 28-J of the Counties of Adams and Arapahoe, Colorado
Management’s Discussion and Analysis (Unaudited) For the Fiscal Year Ended June 30, 2021
29
The following condensed financial information was derived from the government-wide statements of activities and reflects how the district’s net position changed from June 30, 2020 to June 30, 2021.
Comparative Summary of Activities and Changes in Net Position
Year Ended Year Ended Increase % Change fromREVENUES June 30, 2021 June 30, 2020 (Decrease) prior yearProgram revenues:
Charges for services 16,564,181$ 20,551,401$ (3,987,220)$ -19.4%Operating grants & contributions 160,437,356 65,875,346 94,562,010 143.5%Capital grants & contributions 4,881,784 1,567,907 3,313,877 211.4%
General revenues:Property taxes 287,173,369 274,402,739 12,770,630 4.7%State School Finance Act 210,519,931 239,175,271 (28,655,340) -12.0%Other 1,377,336 6,014,603 (4,637,267) -77.1%
Total revenues 680,953,957 607,587,267 73,366,690
EXPENSESInstruction 167,588,694 174,053,652 (6,464,958) -3.7%Pupil support 37,050,748 39,750,922 (2,700,174) -6.8%Instructional staff support 20,561,462 20,930,308 (368,846) -1.8%General administration 11,937,057 6,627,896 5,309,161 80.1%School administration 22,197,244 25,882,420 (3,685,176) -14.2%Business administration 3,478,744 3,726,169 (247,425) -6.6%Operations & maintenance 33,472,822 32,156,705 1,316,117 4.1%Transportation 10,229,664 9,345,685 883,979 9.5%Personnel/data/risk management 19,358,742 14,513,560 4,845,182 33.4%Other support services 48,631,501 31,697,881 16,933,620 53.4%Food service operations 20,696,760 18,008,490 2,688,270 14.9%Interest on long-term debt 19,452,373 19,565,840 (113,467) -0.6%
Total expenses 414,655,811 396,259,528 18,396,283 4.6%
Change in net position 266,298,146 211,327,739 54,970,407 26.0%
(727,336,170) (940,684,893) 213,348,723 -22.7%- 2,020,984 (2,020,984) -100.0%
(727,336,170) (938,663,909) 211,327,739 -22.5%
Net position (deficit) - end of year (461,038,024)$ (727,336,170)$ 266,298,146$ -36.6%
Restatement for change in accounting principle
Net position (deficit) as restated - beginning of year
Comparative Summary of Activities and Changes in Net PositionPrimary Government
Governmental Activities
Net position (deficit) - beginning of year
Most revenues to Colorado’s school districts are provided through the Public School Finance Act of 1994 (as amended). The district’s adjusted total program funding for 2020-21 was $331.2 million based on a funded pupil count of 38,551 and per pupil total program funding of $8,593, compared to total program funding of $356.9 million based on a funded pupil count of 39,586 and per pupil total program funding of $9,016 for 2019-20. Of the $331.2 million adjusted funding, $210.5 million was funded through state equalization and the remainder through a combination of local property and specific ownership taxes compared to $239.2 million funded through state equalization in 2019-20. The district distributes per pupil total program funding to its charters as state funding is received.
Joint School District No. 28-J of the Counties of Adams and Arapahoe, Colorado
Management’s Discussion and Analysis (Unaudited) For the Fiscal Year Ended June 30, 2021
30
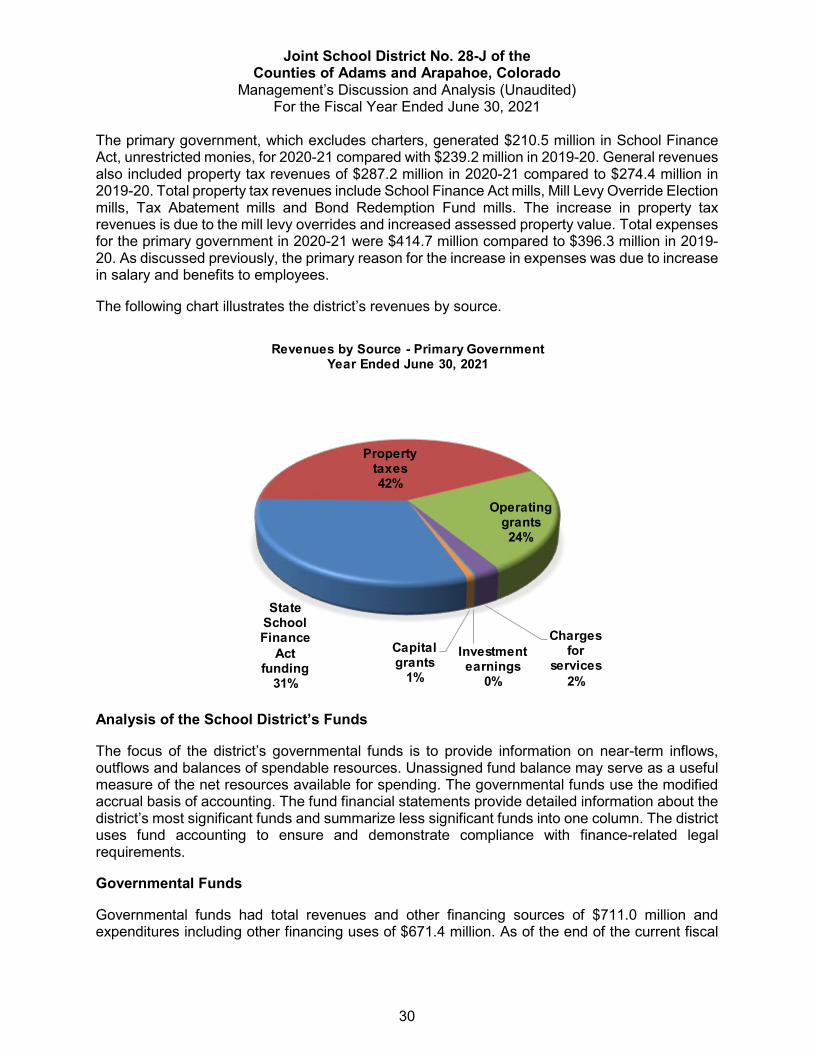
The primary government, which excludes charters, generated $210.5 million in School Finance Act, unrestricted monies, for 2020-21 compared with $239.2 million in 2019-20. General revenues also included property tax revenues of $287.2 million in 2020-21 compared to $274.4 million in 2019-20. Total property tax revenues include School Finance Act mills, Mill Levy Override Election mills, Tax Abatement mills and Bond Redemption Fund mills. The increase in property tax revenues is due to the mill levy overrides and increased assessed property value. Total expenses for the primary government in 2020-21 were $414.7 million compared to $396.3 million in 2019-20. As discussed previously, the primary reason for the increase in expenses was due to increase in salary and benefits to employees.
The following chart illustrates the district’s revenues by source.
State School Finance
Act funding
31%
Property taxes42%
Operating grants24%
Charges for
services2%
Investment earnings
0%
Capital grants
1%
Revenues by Source - Primary GovernmentYear Ended June 30, 2021
Analysis of the School District’s Funds
The focus of the district’s governmental funds is to provide information on near-term inflows, outflows and balances of spendable resources. Unassigned fund balance may serve as a useful measure of the net resources available for spending. The governmental funds use the modified accrual basis of accounting. The fund financial statements provide detailed information about the district’s most significant funds and summarize less significant funds into one column. The district uses fund accounting to ensure and demonstrate compliance with finance-related legal requirements.
Governmental Funds
Governmental funds had total revenues and other financing sources of $711.0 million and expenditures including other financing uses of $671.4 million. As of the end of the current fiscal
Joint School District No. 28-J of the Counties of Adams and Arapahoe, Colorado
Management’s Discussion and Analysis (Unaudited) For the Fiscal Year Ended June 30, 2021
31
year, the district’s ten governmental funds reported combined ending fund balances of $363.8 million, an increase of $39.5 million.
The Building Fund is used to account for construction projects financed by the sale of general obligation bonds. The fund recorded an ending fund balance of $34.7 million, a decrease of $19.8 million from the prior year. This is the result of spending a portion of the proceeds that Aurora voters approved in November 2016. Of the $300 million approved general obligation bonds, $200 million and $26.5 million were sold in January 2017 and December 2019, respectively.
The Bond Redemption Fund had a fund balance increase of $20.8 million due to property tax and other revenues in excess of required payments on outstanding debt. The Nutrition Services Fund had an increase of $5.0 million in fund balance from operations primarily due to Federal grant revenues and other financing source. Finally, the Capital Reserve Fund had an increase in fund balance of $0.9 million due to other financing sources and revenue in excess of expenditures.
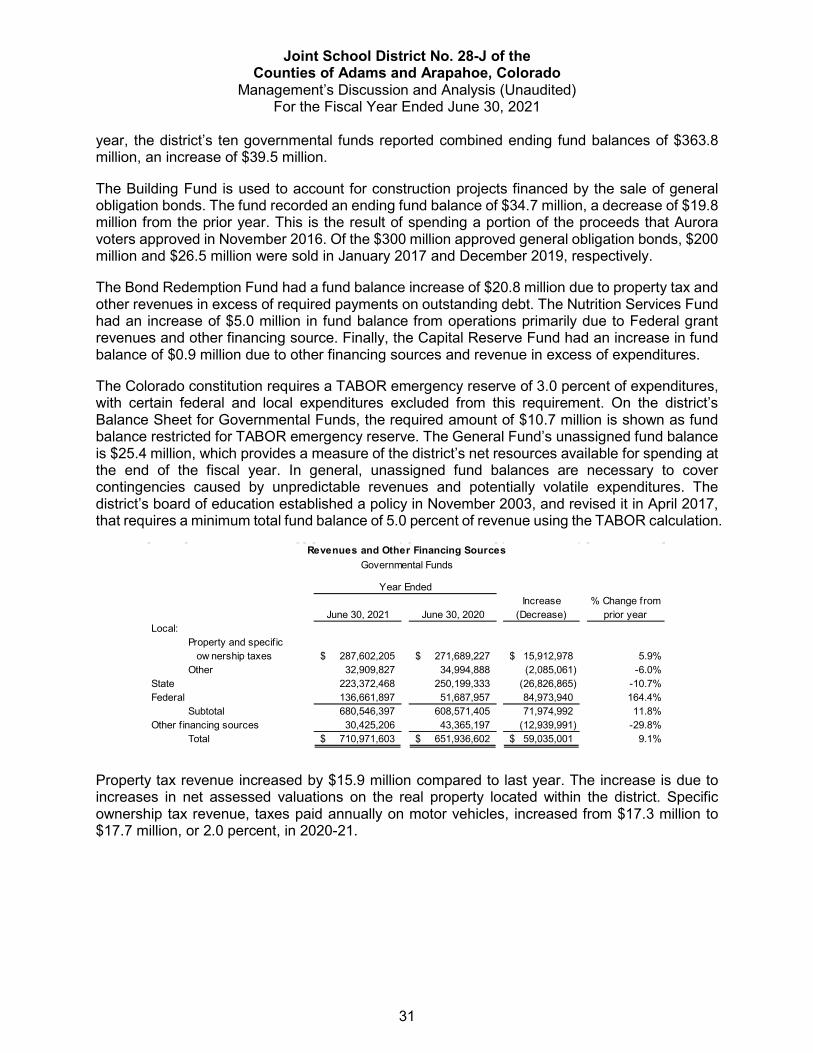
The Colorado constitution requires a TABOR emergency reserve of 3.0 percent of expenditures, with certain federal and local expenditures excluded from this requirement. On the district’s Balance Sheet for Governmental Funds, the required amount of $10.7 million is shown as fund balance restricted for TABOR emergency reserve. The General Fund’s unassigned fund balance is $25.4 million, which provides a measure of the district’s net resources available for spending at the end of the fiscal year. In general, unassigned fund balances are necessary to cover contingencies caused by unpredictable revenues and potentially volatile expenditures. The district’s board of education established a policy in November 2003, and revised it in April 2017, that requires a minimum total fund balance of 5.0 percent of revenue using the TABOR calculation.
June 30, 2021 June 30, 2020Increase
(Decrease)% Change from
prior yearLocal:
Property and specif icow nership taxes 287,602,205$ 271,689,227$ 15,912,978$ 5.9%
Other 32,909,827 34,994,888 (2,085,061) -6.0%State 223,372,468 250,199,333 (26,826,865) -10.7%Federal 136,661,897 51,687,957 84,973,940 164.4%
Subtotal 680,546,397 608,571,405 71,974,992 11.8%Other f inancing sources 30,425,206 43,365,197 (12,939,991) -29.8%
Total 710,971,603$ 651,936,602$ 59,035,001$ 9.1%
Revenues and Other Financing SourcesGovernmental Funds
Year Ended
Property tax revenue increased by $15.9 million compared to last year. The increase is due to increases in net assessed valuations on the real property located within the district. Specific ownership tax revenue, taxes paid annually on motor vehicles, increased from $17.3 million to $17.7 million, or 2.0 percent, in 2020-21.

Joint School District No. 28-J of the Counties of Adams and Arapahoe, Colorado
Management’s Discussion and Analysis (Unaudited) For the Fiscal Year Ended June 30, 2021
32
June 30, 2021 June 30, 2020Increase
(Decrease)% Change from
prior yearInstruction 260,329,744$ 231,164,129$ 29,165,615$ 12.6%Pupil support 62,141,361 57,906,194 4,235,167 7.3%Instructional staff support 32,873,855 30,714,217 2,159,638 7.0%General administration 14,387,236 8,481,315 5,905,921 69.6%School administration 38,851,188 37,029,025 1,822,163 4.9%Business administration 5,531,441 5,460,609 70,832 1.3%Operations and maintenance 38,599,563 37,258,429 1,341,134 3.6%Transportation 14,431,018 14,080,077 350,941 2.5%Personnel/data/risk management 24,424,242 19,138,589 5,285,653 27.6%Other support services 27,535,663 23,121,107 4,414,556 19.1%Food service operations 21,463,580 18,378,137 3,085,443 16.8%Payment to bond escrow agent - - - 0.0%Facilities acquisition/improvement 46,705,577 85,239,640 (38,534,063) -45.2%Debt service 55,963,575 51,280,256 4,683,319 9.1%
Subtotal 643,238,043 619,251,724 23,986,319 3.9%Other f inancing uses 28,184,635 8,363,812 19,820,823 237.0%
Total 671,422,678$ 627,615,536$ 43,807,142$ 7.0%
Expenditures and Other Financing UsesGovernmental Funds
Year Ended
Governmental fund expenditures increased by 7.0 percent mainly due to increase in salaries and benefits including these areas:
• Instruction costs increased by $29.2 million. • General administration costs increased by $5.9 million.
The majority of the district’s governmental expenditures, 60.8 percent, are directed to the delivery of student instruction, providing additional student and staff supports, student nutrition and transportation. These programs increased expenditures by $39.0 million compared to 2019-20 and are accounted for in the instruction, pupil support, instructional staff support, food service operations and transportation programs. The district’s administrative expenditures increased year over year by $12.2 million and are 13.4 percent of total costs. These programs are accounted for in the general administration, school administration, business administration and other support services. Other support services expenditures decreased by $27.2 million primarily due less bond funded projects.
General Fund Budgetary Highlights
General Fund – Original budget compared to final budget
Differences between the original budget and the final budget are included in the January 2021 budget appropriations as approved by the Board of education. Changes to the budget take into consideration the availability of revenues from certifying the mill levy, finalizing the pupil count and receiving updated estimates on state funding. The general fund revenue budget increased due to expected increases in assessed valuations, vehicle registration taxes and interest earnings. The beginning fund balance available to the district also increased as discussed in the district’s 2019-20 Comprehensive Annual Financial Report. The increase in overall available resources did not increase the district’s budgeted expenditures, instead the increase allowed the district to continue to plan for unforeseen events.
Joint School District No. 28-J of the Counties of Adams and Arapahoe, Colorado
Management’s Discussion and Analysis (Unaudited) For the Fiscal Year Ended June 30, 2021
33
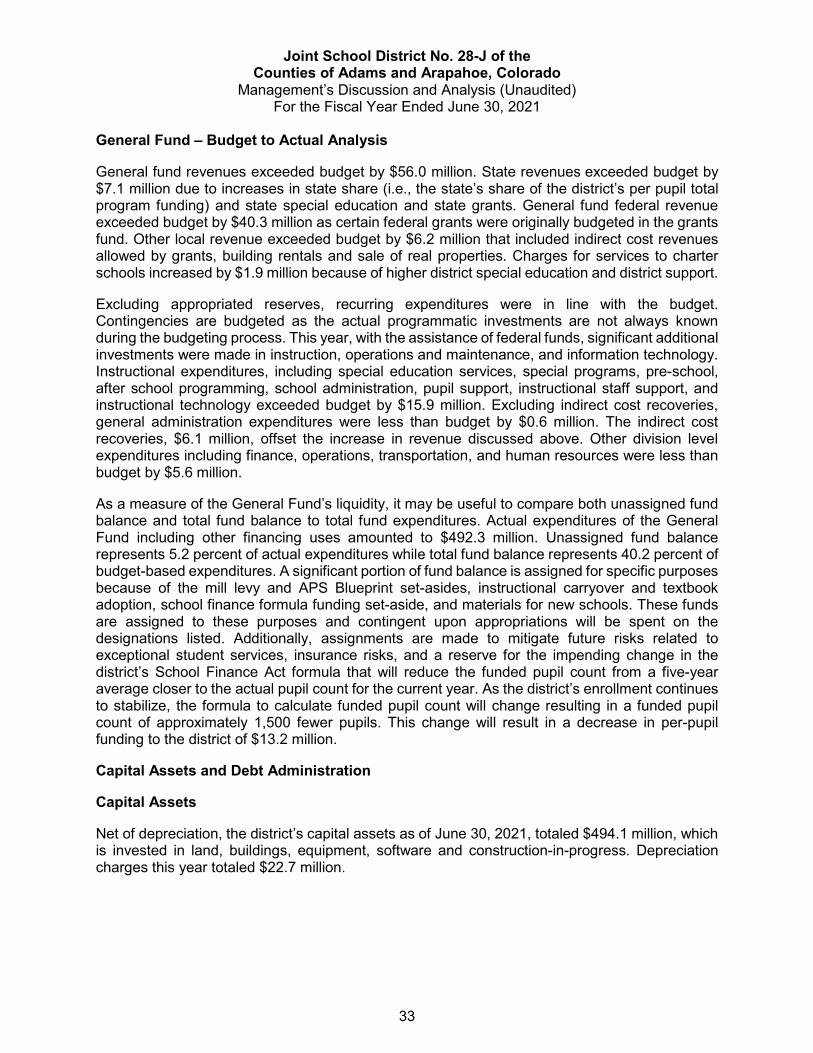
General Fund – Budget to Actual Analysis
General fund revenues exceeded budget by $56.0 million. State revenues exceeded budget by $7.1 million due to increases in state share (i.e., the state’s share of the district’s per pupil total program funding) and state special education and state grants. General fund federal revenue exceeded budget by $40.3 million as certain federal grants were originally budgeted in the grants fund. Other local revenue exceeded budget by $6.2 million that included indirect cost revenues allowed by grants, building rentals and sale of real properties. Charges for services to charter schools increased by $1.9 million because of higher district special education and district support.
Excluding appropriated reserves, recurring expenditures were in line with the budget. Contingencies are budgeted as the actual programmatic investments are not always known during the budgeting process. This year, with the assistance of federal funds, significant additional investments were made in instruction, operations and maintenance, and information technology. Instructional expenditures, including special education services, special programs, pre-school, after school programming, school administration, pupil support, instructional staff support, and instructional technology exceeded budget by $15.9 million. Excluding indirect cost recoveries, general administration expenditures were less than budget by $0.6 million. The indirect cost recoveries, $6.1 million, offset the increase in revenue discussed above. Other division level expenditures including finance, operations, transportation, and human resources were less than budget by $5.6 million.
As a measure of the General Fund’s liquidity, it may be useful to compare both unassigned fund balance and total fund balance to total fund expenditures. Actual expenditures of the General Fund including other financing uses amounted to $492.3 million. Unassigned fund balance represents 5.2 percent of actual expenditures while total fund balance represents 40.2 percent of budget-based expenditures. A significant portion of fund balance is assigned for specific purposes because of the mill levy and APS Blueprint set-asides, instructional carryover and textbook adoption, school finance formula funding set-aside, and materials for new schools. These funds are assigned to these purposes and contingent upon appropriations will be spent on the designations listed. Additionally, assignments are made to mitigate future risks related to exceptional student services, insurance risks, and a reserve for the impending change in the district’s School Finance Act formula that will reduce the funded pupil count from a five-year average closer to the actual pupil count for the current year. As the district’s enrollment continues to stabilize, the formula to calculate funded pupil count will change resulting in a funded pupil count of approximately 1,500 fewer pupils. This change will result in a decrease in per-pupil funding to the district of $13.2 million.
Capital Assets and Debt Administration
Capital Assets
Net of depreciation, the district’s capital assets as of June 30, 2021, totaled $494.1 million, which is invested in land, buildings, equipment, software and construction-in-progress. Depreciation charges this year totaled $22.7 million.
Joint School District No. 28-J of the Counties of Adams and Arapahoe, Colorado
Management’s Discussion and Analysis (Unaudited) For the Fiscal Year Ended June 30, 2021
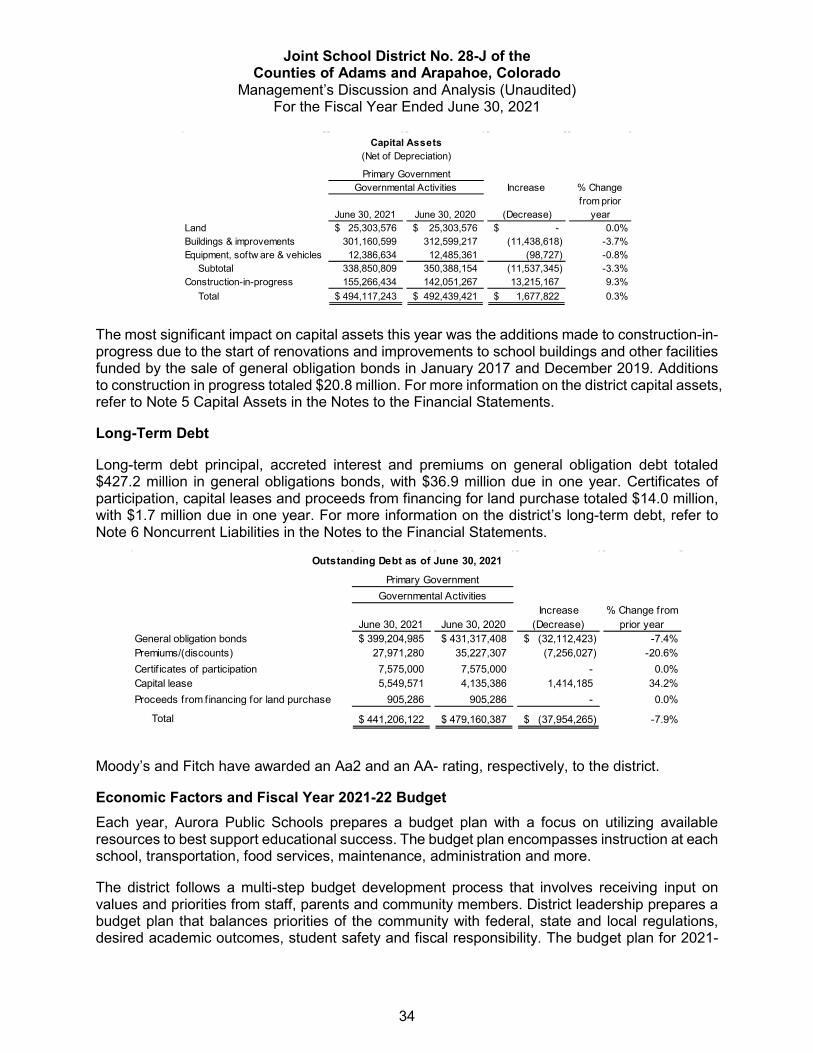
34
Increase % Change
June 30, 2021 June 30, 2020 (Decrease)from prior
yearLand 25,303,576$ 25,303,576$ -$ 0.0%Buildings & improvements 301,160,599 312,599,217 (11,438,618) -3.7%Equipment, softw are & vehicles 12,386,634 12,485,361 (98,727) -0.8% Subtotal 338,850,809 350,388,154 (11,537,345) -3.3%Construction-in-progress 155,266,434 142,051,267 13,215,167 9.3% Total 494,117,243$ 492,439,421$ 1,677,822$ 0.3%
Capital Assets(Net of Depreciation)
Primary GovernmentGovernmental Activities
The most significant impact on capital assets this year was the additions made to construction-in-progress due to the start of renovations and improvements to school buildings and other facilities funded by the sale of general obligation bonds in January 2017 and December 2019. Additions to construction in progress totaled $20.8 million. For more information on the district capital assets, refer to Note 5 Capital Assets in the Notes to the Financial Statements.
Long-Term Debt
Long-term debt principal, accreted interest and premiums on general obligation debt totaled $427.2 million in general obligations bonds, with $36.9 million due in one year. Certificates of participation, capital leases and proceeds from financing for land purchase totaled $14.0 million, with $1.7 million due in one year. For more information on the district’s long-term debt, refer to Note 6 Noncurrent Liabilities in the Notes to the Financial Statements.
June 30, 2021 June 30, 2020Increase
(Decrease)% Change from
prior yearGeneral obligation bonds 399,204,985$ 431,317,408$ (32,112,423)$ -7.4%Premiums/(discounts) 27,971,280 35,227,307 (7,256,027) -20.6%Certif icates of participation 7,575,000 7,575,000 - 0.0%Capital lease 5,549,571 4,135,386 1,414,185 34.2%Proceeds from financing for land purchase 905,286 905,286 - 0.0%
Total 441,206,122$ 479,160,387$ (37,954,265)$ -7.9%
Outstanding Debt as of June 30, 2021
Primary GovernmentGovernmental Activities
Moody’s and Fitch have awarded an Aa2 and an AA- rating, respectively, to the district.
Economic Factors and Fiscal Year 2021-22 Budget Each year, Aurora Public Schools prepares a budget plan with a focus on utilizing available resources to best support educational success. The budget plan encompasses instruction at each school, transportation, food services, maintenance, administration and more.
The district follows a multi-step budget development process that involves receiving input on values and priorities from staff, parents and community members. District leadership prepares a budget plan that balances priorities of the community with federal, state and local regulations, desired academic outcomes, student safety and fiscal responsibility. The budget plan for 2021-
Joint School District No. 28-J of the Counties of Adams and Arapahoe, Colorado
Management’s Discussion and Analysis (Unaudited) For the Fiscal Year Ended June 30, 2021
35
2022 supports the educational commitments of student learning, professional practice and collective responsibility.
In 2010-11, the Colorado General Assembly implemented a budget stabilization factor for total per-pupil program funding. For 2021-22, the budget stabilization factor is estimated to reduce funding available to public education by $571.2 million statewide. In 2021-22, the district’s total program funding will be reduced by 6.7 percent, or $27.0 million. The budget stabilization factor continues to have an adverse impact on the district’s budget; state funding has not been restored to the level that would have occurred if the state could fully fund the school finance formula. If sufficient revenue were available in Colorado’s General Fund, the district would receive $10,352 per pupil, compared to the projected amount of $9,300.
Additionally, COVID-19 pandemic and resulting disruptions have caused significant economic uncertainty and volatility in financial markets, U.S. economy and local economy. It is expected that the disruptions will create significant shortfall for school funding for the next several years.
As with any plan, the 2021-2022 budget is based upon key assumptions. These range from changes in enrollment and per pupil revenue amounts to assessed valuations and staffing ratios. Assumptions upon which the 2021-2022 budget are based include:
• State per-pupil revenue: $9,300 • Total mill levy override revenues: $121.6 million • Decrease in enrollment, excluding district charter schools and preschool: 907 students, a
decrease of 3.0%. • Net assessed value of property within APS boundaries: $3.8 billion • Property tax collection rate: 98.5 percent
Given continuing economic forecast uncertainties confronting the nation and Colorado, district leadership will continue to work closely with employee groups and members of the community to create options that maintain the financial health of Aurora Public Schools while continuing our progress in raising student achievement.
Contacting the District’s Financial Management
This financial report is designed to provide the district’s citizens, taxpayers, parents, investors and creditors with a general overview of the district’s finances and to demonstrate the district’s accountability for the money it receives. If you have questions about this report or need additional information, contact the Division of Finance, Joint School District No. 28-J of the Counties of Adams and Arapahoe, Colorado (dba Aurora Public Schools), 15701 East First Avenue, Suite 106, Aurora, Colorado, 80011, or visit our website at www.aurorak12.org.

36
37
Basic Financial Statements
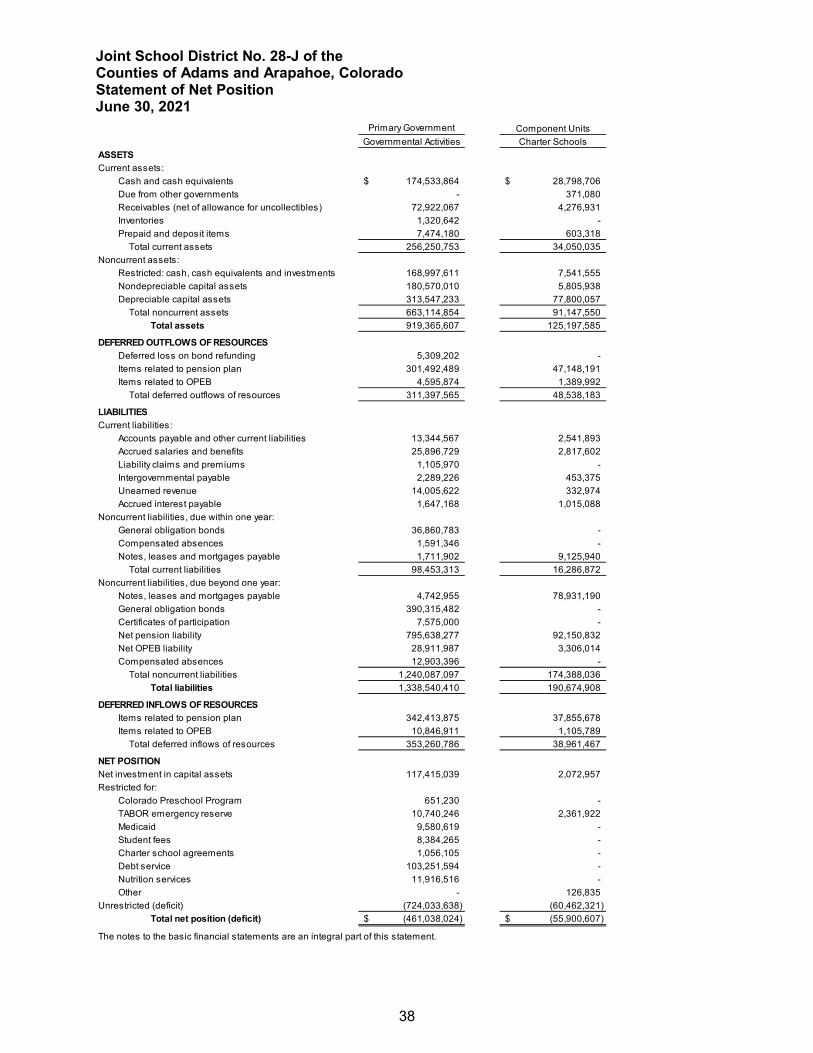
Joint School District No. 28-J of the Counties of Adams and Arapahoe, Colorado Statement of Net Position June 30, 2021
38
Statement of Net Position
Primary Government Component UnitsGovernmental Activities Charter Schools
ASSETSCurrent assets:
Cash and cash equivalents 174,533,864$ 28,798,706$ Due from other governments - 371,080 Receivables (net of allowance for uncollectibles) 72,922,067 4,276,931 Inventories 1,320,642 - Prepaid and deposit items 7,474,180 603,318
Total current assets 256,250,753 34,050,035 Noncurrent assets:
Restricted: cash, cash equivalents and investments 168,997,611 7,541,555 Nondepreciable capital assets 180,570,010 5,805,938 Depreciable capital assets 313,547,233 77,800,057
Total noncurrent assets 663,114,854 91,147,550 Total assets 919,365,607 125,197,585
DEFERRED OUTFLOWS OF RESOURCESDeferred loss on bond refunding 5,309,202 - Items related to pension plan 301,492,489 47,148,191 Items related to OPEB 4,595,874 1,389,992
Total deferred outflows of resources 311,397,565 48,538,183
LIABILITIESCurrent liabilities:
Accounts payable and other current liabilities 13,344,567 2,541,893 Accrued salaries and benefits 25,896,729 2,817,602 Liability claims and premiums 1,105,970 - Intergovernmental payable 2,289,226 453,375 Unearned revenue 14,005,622 332,974 Accrued interest payable 1,647,168 1,015,088
Noncurrent liabilities, due within one year:General obligation bonds 36,860,783 - Compensated absences 1,591,346 - Notes, leases and mortgages payable 1,711,902 9,125,940
Total current liabilities 98,453,313 16,286,872 Noncurrent liabilities, due beyond one year:
Notes, leases and mortgages payable 4,742,955 78,931,190 General obligation bonds 390,315,482 - Certificates of participation 7,575,000 - Net pension liability 795,638,277 92,150,832 Net OPEB liability 28,911,987 3,306,014 Compensated absences 12,903,396 -
Total noncurrent liabilities 1,240,087,097 174,388,036 Total liabilities 1,338,540,410 190,674,908
DEFERRED INFLOWS OF RESOURCESItems related to pension plan 342,413,875 37,855,678 Items related to OPEB 10,846,911 1,105,789
Total deferred inflows of resources 353,260,786 38,961,467
NET POSITIONNet investment in capital assets 117,415,039 2,072,957 Restricted for:
Colorado Preschool Program 651,230 - TABOR emergency reserve 10,740,246 2,361,922 Medicaid 9,580,619 - Student fees 8,384,265 - Charter school agreements 1,056,105 - Debt service 103,251,594 - Nutrition services 11,916,516 - Other - 126,835
Unrestricted (deficit) (724,033,638) (60,462,321) Total net position (deficit) (461,038,024)$ (55,900,607)$
The notes to the basic financial statements are an integral part of this statement.
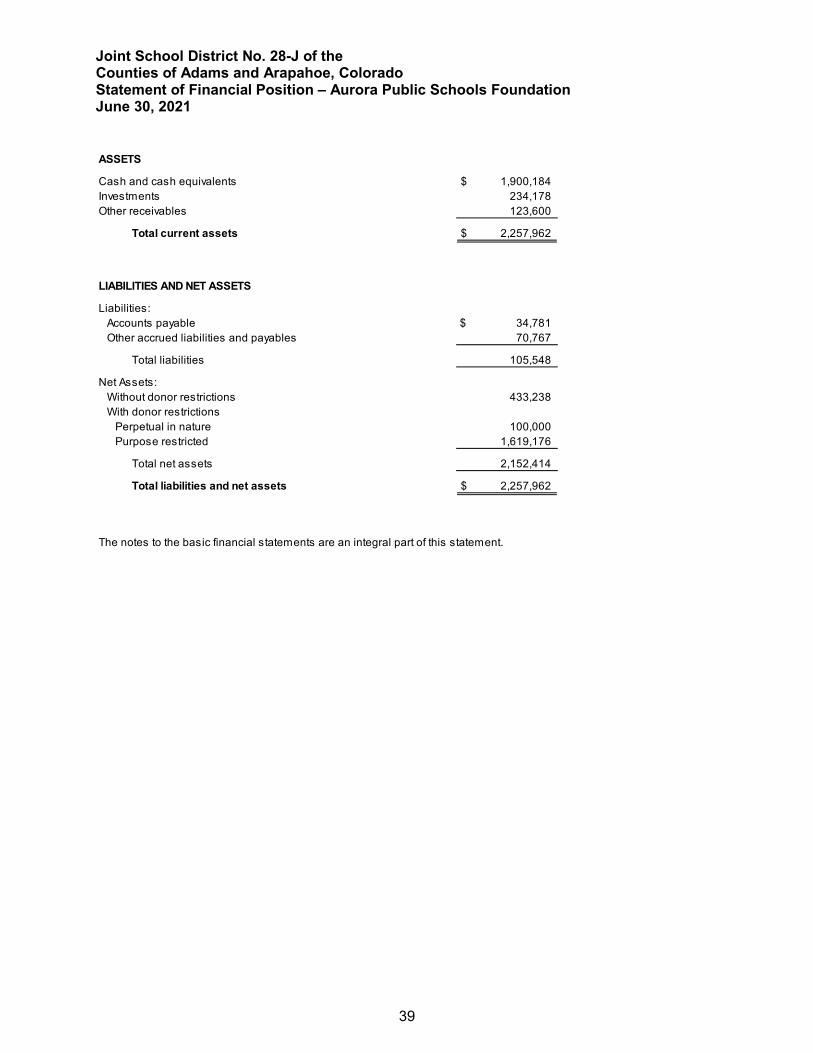
Joint School District No. 28-J of the Counties of Adams and Arapahoe, Colorado Statement of Financial Position – Aurora Public Schools Foundation June 30, 2021
39
Statement of Financial Position – Aurora Public Schools Foundation
Cash and cash equivalents 1,900,184$ Investments 234,178 Other receivables 123,600
Total current assets 2,257,962$
Liabilities:Accounts payable 34,781$ Other accrued liabilities and payables 70,767
Total liabilities 105,548
Net Assets:Without donor restrictions 433,238With donor restrictions
Perpetual in nature 100,000Purpose restricted 1,619,176
Total net assets 2,152,414
Total liabilities and net assets 2,257,962$
The notes to the basic financial statements are an integral part of this statement.
LIABILITIES AND NET ASSETS
ASSETS
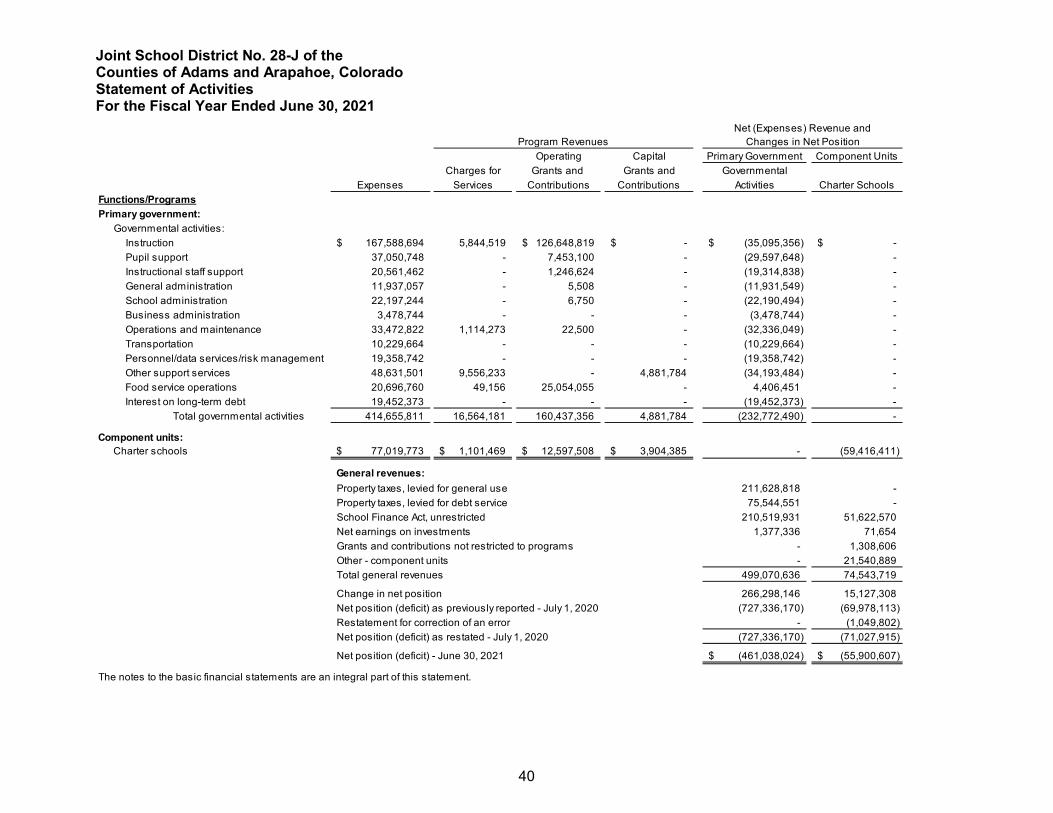
Joint School District No. 28-J of the Counties of Adams and Arapahoe, Colorado Statement of Activities For the Fiscal Year Ended June 30, 2021
40
Statement of Activities
Operating Capital Primary Government Component UnitsCharges for Grants and Grants and Governmental
Expenses Services Contributions Contributions Activities Charter SchoolsFunctions/ProgramsPrimary government:
Governmental activities:Instruction 167,588,694$ 5,844,519 126,648,819$ -$ (35,095,356)$ -$ Pupil support 37,050,748 - 7,453,100 - (29,597,648) - Instructional staff support 20,561,462 - 1,246,624 - (19,314,838) - General administration 11,937,057 - 5,508 - (11,931,549) - School administration 22,197,244 - 6,750 - (22,190,494) - Business administration 3,478,744 - - - (3,478,744) - Operations and maintenance 33,472,822 1,114,273 22,500 - (32,336,049) - Transportation 10,229,664 - - - (10,229,664) - Personnel/data services/risk management 19,358,742 - - - (19,358,742) - Other support services 48,631,501 9,556,233 - 4,881,784 (34,193,484) - Food service operations 20,696,760 49,156 25,054,055 - 4,406,451 - Interest on long-term debt 19,452,373 - - - (19,452,373) -
Total governmental activities 414,655,811 16,564,181 160,437,356 4,881,784 (232,772,490) -
Component units:Charter schools 77,019,773$ 1,101,469$ 12,597,508$ 3,904,385$ - (59,416,411)
General revenues:Property taxes, levied for general use 211,628,818 - Property taxes, levied for debt service 75,544,551 - School Finance Act, unrestricted 210,519,931 51,622,570Net earnings on investments 1,377,336 71,654Grants and contributions not restricted to programs - 1,308,606Other - component units - 21,540,889Total general revenues 499,070,636 74,543,719
Change in net position 266,298,146 15,127,308 Net position (deficit) as previously reported - July 1, 2020 (727,336,170) (69,978,113) Restatement for correction of an error - (1,049,802) Net position (deficit) as restated - July 1, 2020 (727,336,170) (71,027,915)
Net position (deficit) - June 30, 2021 (461,038,024)$ (55,900,607)$
The notes to the basic financial statements are an integral part of this statement.
Program RevenuesNet (Expenses) Revenue and
Changes in Net Position
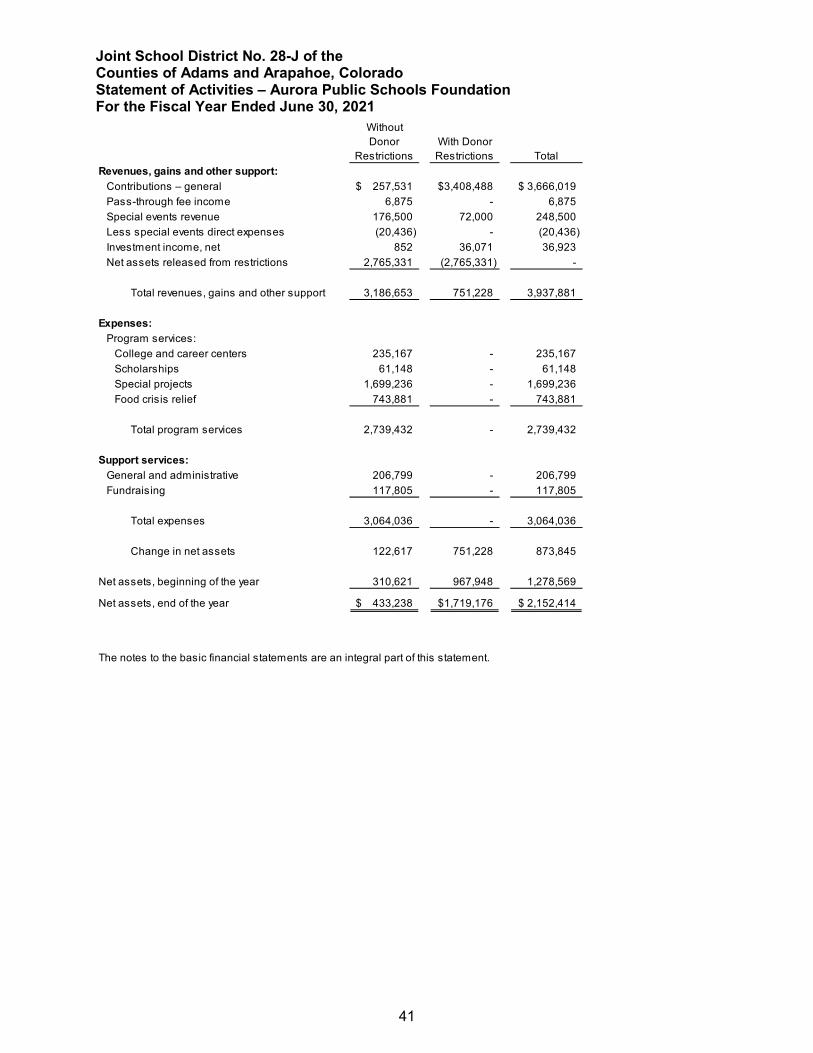
Joint School District No. 28-J of the Counties of Adams and Arapahoe, Colorado Statement of Activities – Aurora Public Schools Foundation For the Fiscal Year Ended June 30, 2021
41
Statement of Activities – Aurora Public Schools Foundation
Without Donor
RestrictionsWith Donor Restrictions Total
Revenues, gains and other support:Contributions – general 257,531$ 3,408,488$ 3,666,019$ Pass-through fee income 6,875 - 6,875 Special events revenue 176,500 72,000 248,500 Less special events direct expenses (20,436) - (20,436) Investment income, net 852 36,071 36,923 Net assets released from restrictions 2,765,331 (2,765,331) -
Total revenues, gains and other support 3,186,653 751,228 3,937,881
Expenses:Program services:
College and career centers 235,167 - 235,167 Scholarships 61,148 - 61,148 Special projects 1,699,236 - 1,699,236 Food crisis relief 743,881 - 743,881
Total program services 2,739,432 - 2,739,432
Support services: General and administrative 206,799 - 206,799 Fundraising 117,805 - 117,805
Total expenses 3,064,036 - 3,064,036
Change in net assets 122,617 751,228 873,845
Net assets, beginning of the year 310,621 967,948 1,278,569
Net assets, end of the year 433,238$ 1,719,176$ 2,152,414$
The notes to the basic financial statements are an integral part of this statement.
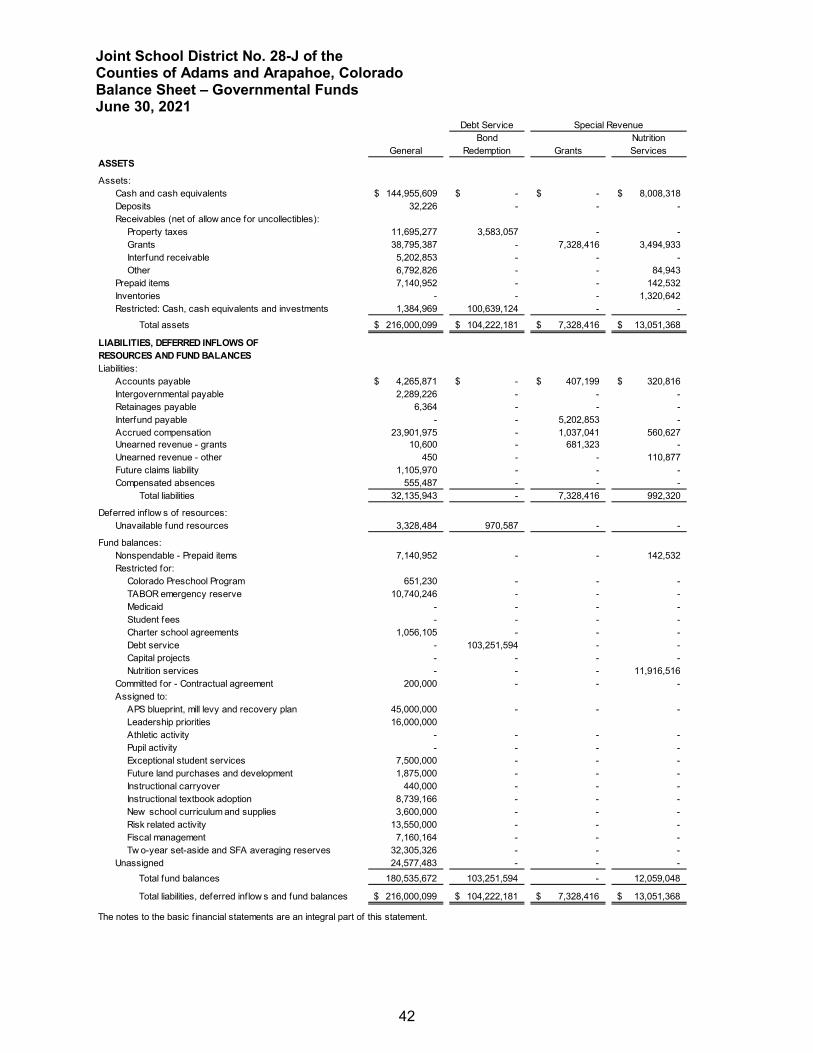
Joint School District No. 28-J of the Counties of Adams and Arapahoe, Colorado Balance Sheet – Governmental Funds June 30, 2021
42
Bal ance Sheet – Gover nmental Funds
Debt ServiceBond
General Redemption Grants
Assets:Cash and cash equivalents 144,955,609$ -$ -$ 8,008,318$ Deposits 32,226 - - - Receivables (net of allow ance for uncollectibles):
Property taxes 11,695,277 3,583,057 - - Grants 38,795,387 - 7,328,416 3,494,933 Interfund receivable 5,202,853 - - - Other 6,792,826 - - 84,943
Prepaid items 7,140,952 - - 142,532 Inventories - - - 1,320,642 Restricted: Cash, cash equivalents and investments 1,384,969 100,639,124 - -
Total assets 216,000,099$ 104,222,181$ 7,328,416$ 13,051,368$
Liabilities:Accounts payable 4,265,871$ -$ 407,199$ 320,816$ Intergovernmental payable 2,289,226 - - - Retainages payable 6,364 - - - Interfund payable - - 5,202,853 - Accrued compensation 23,901,975 - 1,037,041 560,627 Unearned revenue - grants 10,600 - 681,323 - Unearned revenue - other 450 - - 110,877 Future claims liability 1,105,970 - - - Compensated absences 555,487 - - -
Total liabilities 32,135,943 - 7,328,416 992,320
Deferred inflow s of resources:Unavailable fund resources 3,328,484 970,587 - -
Fund balances:Nonspendable - Prepaid items 7,140,952 - - 142,532 Restricted for:
Colorado Preschool Program 651,230 - - - TABOR emergency reserve 10,740,246 - - - Medicaid - - - - Student fees - - - - Charter school agreements 1,056,105 - - - Debt service - 103,251,594 - - Capital projects - - - - Nutrition services - - - 11,916,516
Committed for - Contractual agreement 200,000 - - - Assigned to:
APS blueprint, mill levy and recovery plan 45,000,000 - - - Leadership priorities 16,000,000 Athletic activity - - - - Pupil activity - - - - Exceptional student services 7,500,000 - - - Future land purchases and development 1,875,000 - - - Instructional carryover 440,000 - - - Instructional textbook adoption 8,739,166 - - - New school curriculum and supplies 3,600,000 - - - Risk related activity 13,550,000 - - - Fiscal management 7,160,164 - - - Tw o-year set-aside and SFA averaging reserves 32,305,326 - - -
Unassigned 24,577,483 - - - Total fund balances 180,535,672 103,251,594 - 12,059,048
Total liabilities, deferred inflow s and fund balances 216,000,099$ 104,222,181$ 7,328,416$ 13,051,368$
The notes to the basic f inancial statements are an integral part of this statement.
LIABILITIES, DEFERRED INFLOWS OF RESOURCES AND FUND BALANCES
ASSETS
Nutrition Services
Special Revenue
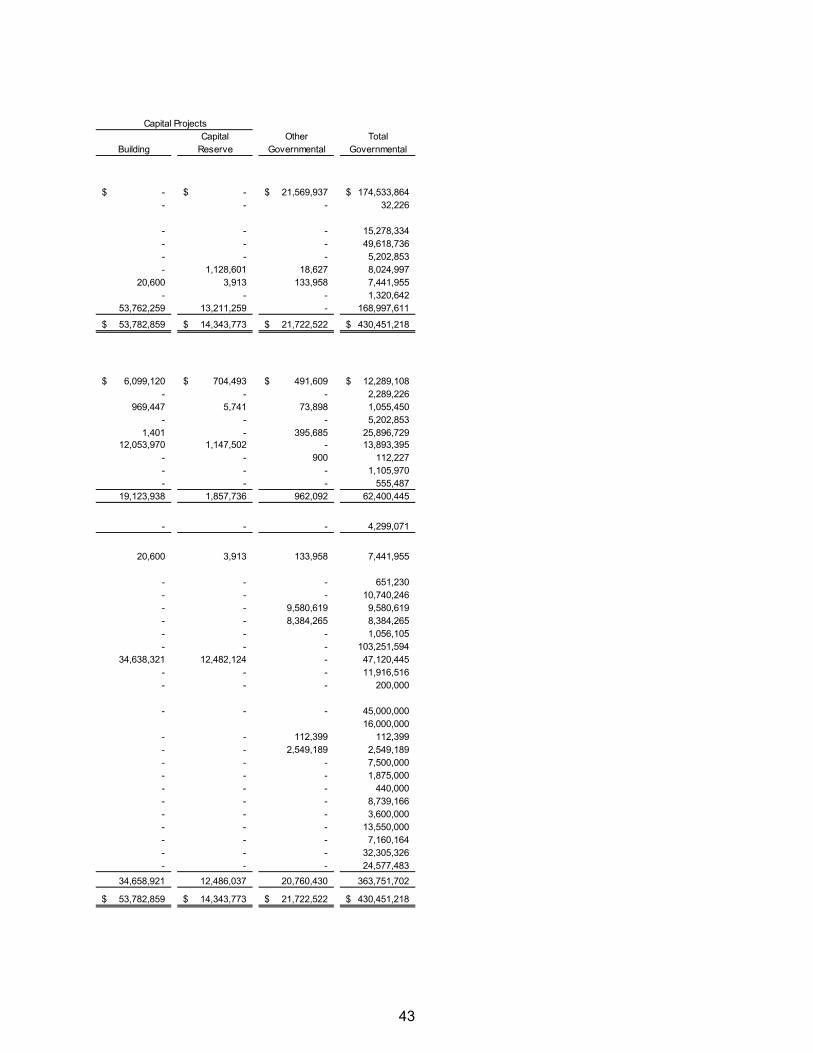
43
Capital Other TotalBuilding Reserve Governmental Governmental
-$ -$ 21,569,937$ 174,533,864$ - - - 32,226
- - - 15,278,334 - - - 49,618,736 - - - 5,202,853 - 1,128,601 18,627 8,024,997
20,600 3,913 133,958 7,441,955 - - - 1,320,642
53,762,259 13,211,259 - 168,997,611
53,782,859$ 14,343,773$ 21,722,522$ 430,451,218$
6,099,120$ 704,493$ 491,609$ 12,289,108$ - - - 2,289,226
969,447 5,741 73,898 1,055,450 - - - 5,202,853
1,401 - 395,685 25,896,729 12,053,970 1,147,502 - 13,893,395
- - 900 112,227 - - - 1,105,970 - - - 555,487
19,123,938 1,857,736 962,092 62,400,445
- - - 4,299,071
20,600 3,913 133,958 7,441,955
- - - 651,230 - - - 10,740,246 - - 9,580,619 9,580,619 - - 8,384,265 8,384,265 - - - 1,056,105 - - - 103,251,594
34,638,321 12,482,124 - 47,120,445 - - - 11,916,516 - - - 200,000
- - - 45,000,000 16,000,000
- - 112,399 112,399 - - 2,549,189 2,549,189 - - - 7,500,000 - - - 1,875,000 - - - 440,000 - - - 8,739,166 - - - 3,600,000 - - - 13,550,000 - - - 7,160,164 - - - 32,305,326 - - - 24,577,483
34,658,921 12,486,037 20,760,430 363,751,702
53,782,859$ 14,343,773$ 21,722,522$ 430,451,218$
Capital Projects
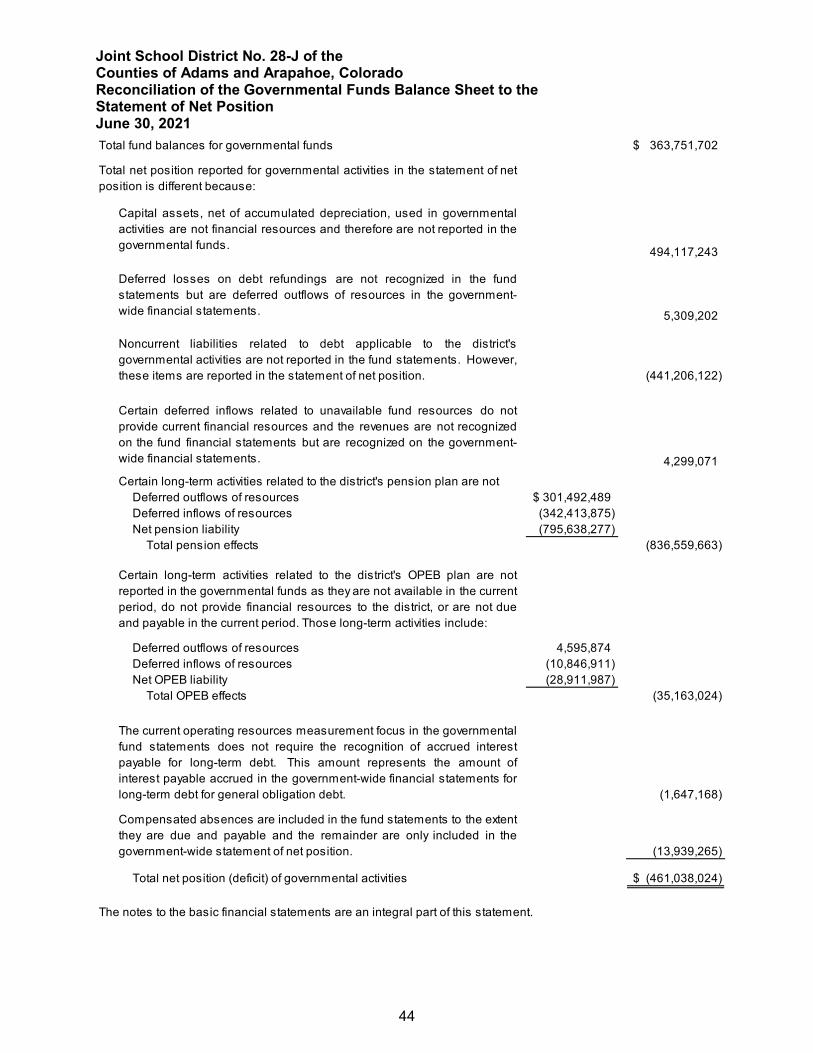
Joint School District No. 28-J of the Counties of Adams and Arapahoe, Colorado Reconciliation of the Governmental Funds Balance Sheet to the Statement of Net Position June 30, 2021
44
Reconciliation of the Governmental Funds Balance Sheet to the Statement of Net Position
Total fund balances for governmental funds 363,751,702$
494,117,243
5,309,202
(441,206,122)
4,299,071
Deferred outflows of resources 301,492,489$ Deferred inflows of resources (342,413,875) Net pension liability (795,638,277)
Total pension effects (836,559,663)
Deferred outflows of resources 4,595,874 Deferred inflows of resources (10,846,911) Net OPEB liability (28,911,987)
Total OPEB effects (35,163,024)
(1,647,168)
(13,939,265)
Total net position (deficit) of governmental activities (461,038,024)$
The notes to the basic financial statements are an integral part of this statement.
Noncurrent liabilities related to debt applicable to the district'sgovernmental activities are not reported in the fund statements. However,these items are reported in the statement of net position.
Compensated absences are included in the fund statements to the extentthey are due and payable and the remainder are only included in thegovernment-wide statement of net position.
The current operating resources measurement focus in the governmentalfund statements does not require the recognition of accrued interestpayable for long-term debt. This amount represents the amount ofinterest payable accrued in the government-wide financial statements forlong-term debt for general obligation debt.
Certain deferred inflows related to unavailable fund resources do notprovide current financial resources and the revenues are not recognizedon the fund financial statements but are recognized on the government-wide financial statements.
Certain long-term activities related to the district's pension plan are not
Certain long-term activities related to the district's OPEB plan are notreported in the governmental funds as they are not available in the currentperiod, do not provide financial resources to the district, or are not dueand payable in the current period. Those long-term activities include:
Capital assets, net of accumulated depreciation, used in governmentalactivities are not financial resources and therefore are not reported in thegovernmental funds.
Deferred losses on debt refundings are not recognized in the fundstatements but are deferred outflows of resources in the government-wide financial statements.
Total net position reported for governmental activities in the statement of netposition is different because:

45
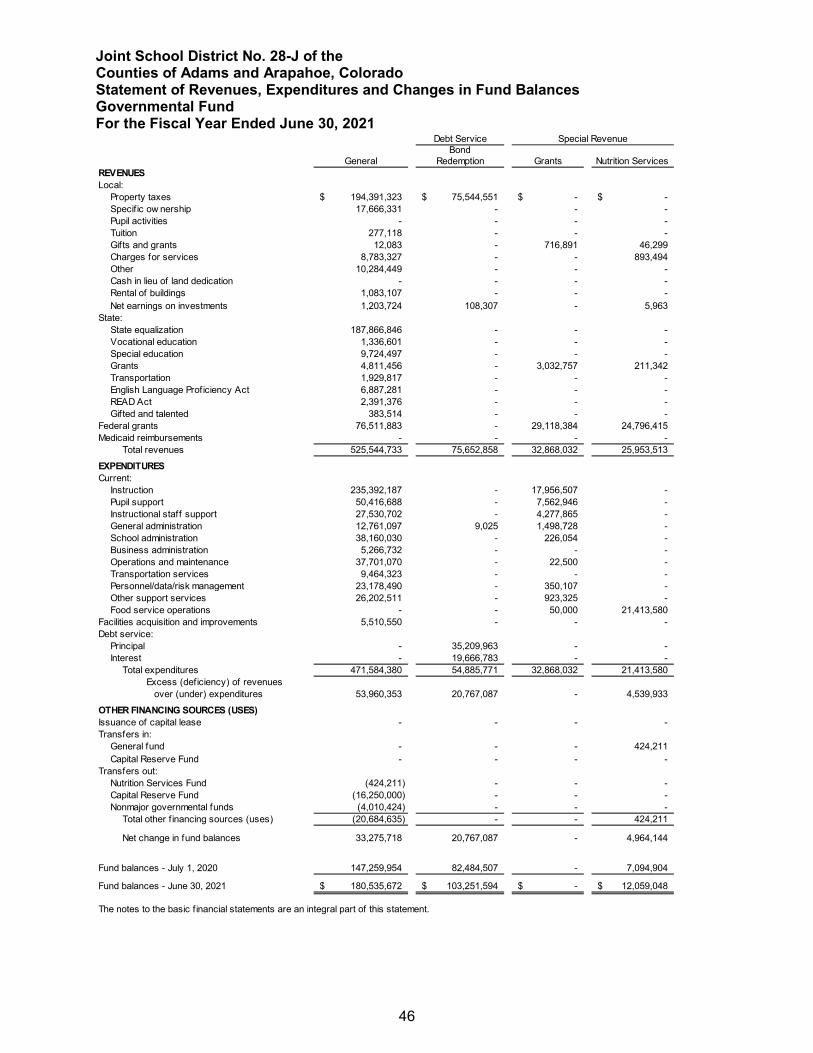
Joint School District No. 28-J of the Counties of Adams and Arapahoe, Colorado Statement of Revenues, Expenditures and Changes in Fund Balances Governmental Fund For the Fiscal Year Ended June 30, 2021
46
Statement of Revenues, Expenditures and C hanges in Fund Balances – Gover nmental Funds
Debt ServiceBond
General Redemption GrantsREVENUESLocal:
Property taxes 194,391,323$ 75,544,551$ -$ -$ Specif ic ow nership 17,666,331 - - - Pupil activities - - - - Tuition 277,118 - - - Gifts and grants 12,083 - 716,891 46,299 Charges for services 8,783,327 - - 893,494 Other 10,284,449 - - - Cash in lieu of land dedication - - - - Rental of buildings 1,083,107 - - - Net earnings on investments 1,203,724 108,307 - 5,963
State:State equalization 187,866,846 - - - Vocational education 1,336,601 - - - Special education 9,724,497 - - - Grants 4,811,456 - 3,032,757 211,342 Transportation 1,929,817 - - - English Language Proficiency Act 6,887,281 - - - READ Act 2,391,376 - - - Gifted and talented 383,514 - - -
Federal grants 76,511,883 - 29,118,384 24,796,415 Medicaid reimbursements - - - -
Total revenues 525,544,733 75,652,858 32,868,032 25,953,513
EXPENDITURESCurrent:
Instruction 235,392,187 - 17,956,507 - Pupil support 50,416,688 - 7,562,946 - Instructional staff support 27,530,702 - 4,277,865 - General administration 12,761,097 9,025 1,498,728 - School administration 38,160,030 - 226,054 - Business administration 5,266,732 - - - Operations and maintenance 37,701,070 - 22,500 - Transportation services 9,464,323 - - - Personnel/data/risk management 23,178,490 - 350,107 - Other support services 26,202,511 - 923,325 - Food service operations - - 50,000 21,413,580
Facilities acquisition and improvements 5,510,550 - - - Debt service:
Principal - 35,209,963 - - Interest - 19,666,783 - -
Total expenditures 471,584,380 54,885,771 32,868,032 21,413,580 Excess (deficiency) of revenues over (under) expenditures 53,960,353 20,767,087 - 4,539,933
OTHER FINANCING SOURCES (USES)Issuance of capital lease - - - - Transfers in:
General fund - - - 424,211 Capital Reserve Fund - - - -
Transfers out:Nutrition Services Fund (424,211) - - - Capital Reserve Fund (16,250,000) - - - Nonmajor governmental funds (4,010,424) - - -
Total other f inancing sources (uses) (20,684,635) - - 424,211
Net change in fund balances 33,275,718 20,767,087 - 4,964,144
147,259,954 82,484,507 - 7,094,904
Fund balances - June 30, 2021 180,535,672$ 103,251,594$ -$ 12,059,048$
The notes to the basic f inancial statements are an integral part of this statement.
Nutrition Services
Fund balances - July 1, 2020
Special Revenue
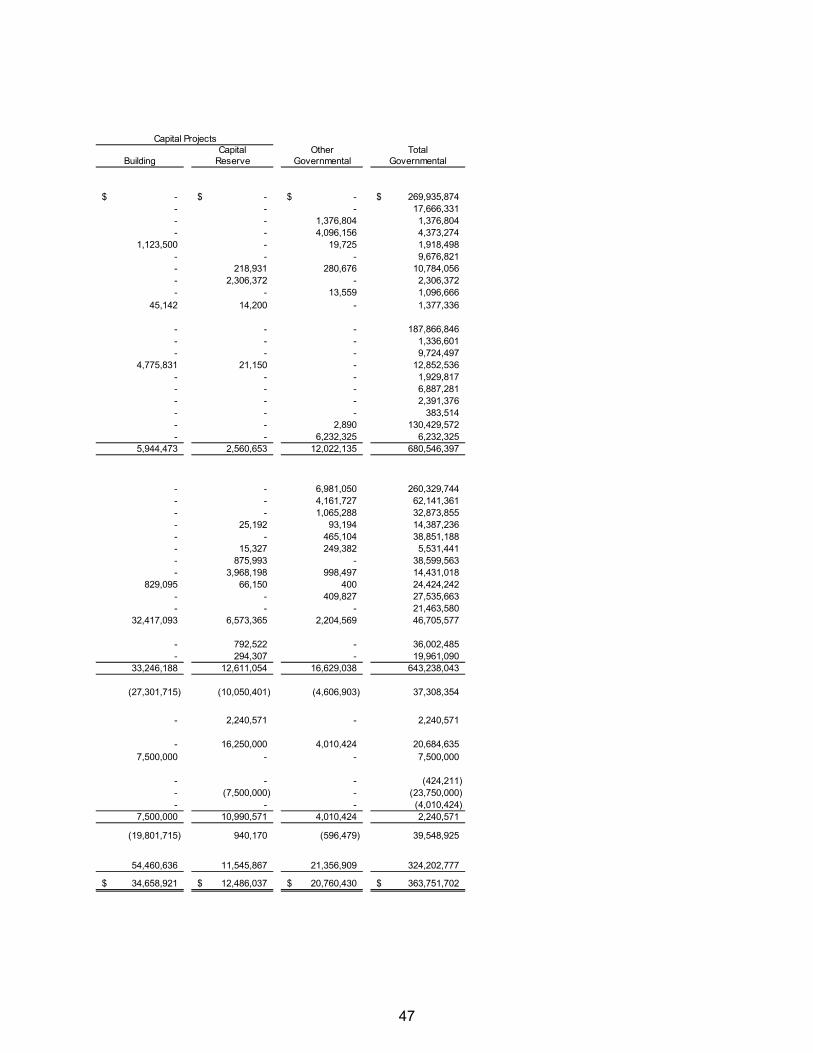
47
Capital Other TotalBuilding Reserve Governmental Governmental
-$ -$ -$ 269,935,874$ - - - 17,666,331 - - 1,376,804 1,376,804 - - 4,096,156 4,373,274
1,123,500 - 19,725 1,918,498 - - - 9,676,821 - 218,931 280,676 10,784,056 - 2,306,372 - 2,306,372 - - 13,559 1,096,666
45,142 14,200 - 1,377,336
- - - 187,866,846 - - - 1,336,601 - - - 9,724,497
4,775,831 21,150 - 12,852,536 - - - 1,929,817 - - - 6,887,281 - - - 2,391,376 - - - 383,514 - - 2,890 130,429,572 - - 6,232,325 6,232,325
5,944,473 2,560,653 12,022,135 680,546,397
- - 6,981,050 260,329,744 - - 4,161,727 62,141,361 - - 1,065,288 32,873,855 - 25,192 93,194 14,387,236 - - 465,104 38,851,188 - 15,327 249,382 5,531,441 - 875,993 - 38,599,563 - 3,968,198 998,497 14,431,018
829,095 66,150 400 24,424,242 - - 409,827 27,535,663 - - - 21,463,580
32,417,093 6,573,365 2,204,569 46,705,577
- 792,522 - 36,002,485 - 294,307 - 19,961,090
33,246,188 12,611,054 16,629,038 643,238,043
(27,301,715) (10,050,401) (4,606,903) 37,308,354
- 2,240,571 - 2,240,571
- 16,250,000 4,010,424 20,684,635 7,500,000 - - 7,500,000
- - - (424,211) - (7,500,000) - (23,750,000) - - - (4,010,424)
7,500,000 10,990,571 4,010,424 2,240,571
(19,801,715) 940,170 (596,479) 39,548,925
54,460,636 11,545,867 21,356,909 324,202,777
34,658,921$ 12,486,037$ 20,760,430$ 363,751,702$
Capital Projects
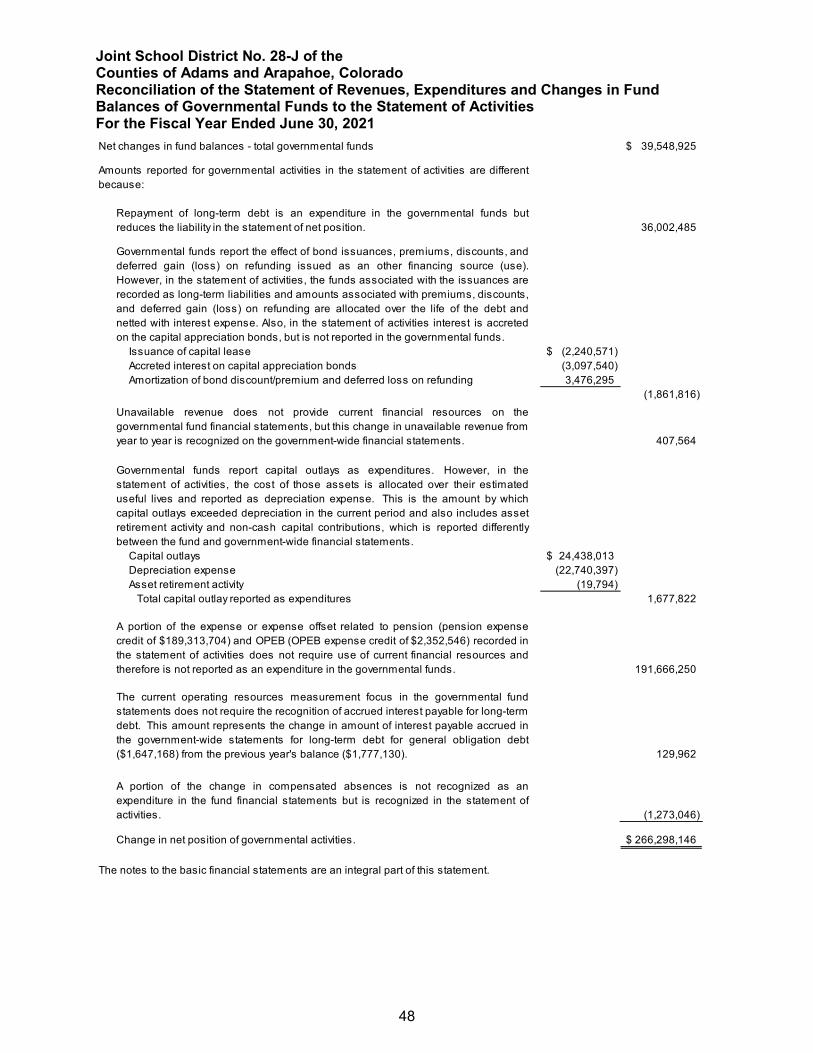
Joint School District No. 28-J of the Counties of Adams and Arapahoe, Colorado Reconciliation of the Statement of Revenues, Expenditures and Changes in Fund Balances of Governmental Funds to the Statement of Activities For the Fiscal Year Ended June 30, 2021
48
Reconciliation of the Statement of Revenues, Expenditures and Changes in Fund Balances of Governmental Funds to the Statement of Activities
Net changes in fund balances - total governmental funds 39,548,925$
36,002,485
Issuance of capital lease (2,240,571)$ Accreted interest on capital appreciation bonds (3,097,540)Amortization of bond discount/premium and deferred loss on refunding 3,476,295
(1,861,816)
407,564
Capital outlays 24,438,013$ Depreciation expense (22,740,397)
(19,794)Total capital outlay reported as expenditures 1,677,822
191,666,250
129,962
(1,273,046)
Change in net position of governmental activities. 266,298,146$
The notes to the basic financial statements are an integral part of this statement.
Amounts reported for governmental activities in the statement of activities are differentbecause:
Repayment of long-term debt is an expenditure in the governmental funds butreduces the liability in the statement of net position.
A portion of the change in compensated absences is not recognized as anexpenditure in the fund financial statements but is recognized in the statement ofactivities.
The current operating resources measurement focus in the governmental fundstatements does not require the recognition of accrued interest payable for long-term debt. This amount represents the change in amount of interest payable accrued inthe government-wide statements for long-term debt for general obligation debt($1,647,168) from the previous year's balance ($1,777,130).
Unavailable revenue does not provide current financial resources on thegovernmental fund financial statements, but this change in unavailable revenue fromyear to year is recognized on the government-wide financial statements.
Governmental funds report capital outlays as expenditures. However, in thestatement of activities, the cost of those assets is allocated over their estimateduseful lives and reported as depreciation expense. This is the amount by whichcapital outlays exceeded depreciation in the current period and also includes assetretirement activity and non-cash capital contributions, which is reported differentlybetween the fund and government-wide financial statements.
Governmental funds report the effect of bond issuances, premiums, discounts, anddeferred gain (loss) on refunding issued as an other financing source (use).However, in the statement of activities, the funds associated with the issuances arerecorded as long-term liabilities and amounts associated with premiums, discounts, and deferred gain (loss) on refunding are allocated over the life of the debt andnetted with interest expense. Also, in the statement of activities interest is accretedon the capital appreciation bonds, but is not reported in the governmental funds.
Asset retirement activity
A portion of the expense or expense offset related to pension (pension expensecredit of $189,313,704) and OPEB (OPEB expense credit of $2,352,546) recorded inthe statement of activities does not require use of current financial resources andtherefore is not reported as an expenditure in the governmental funds.
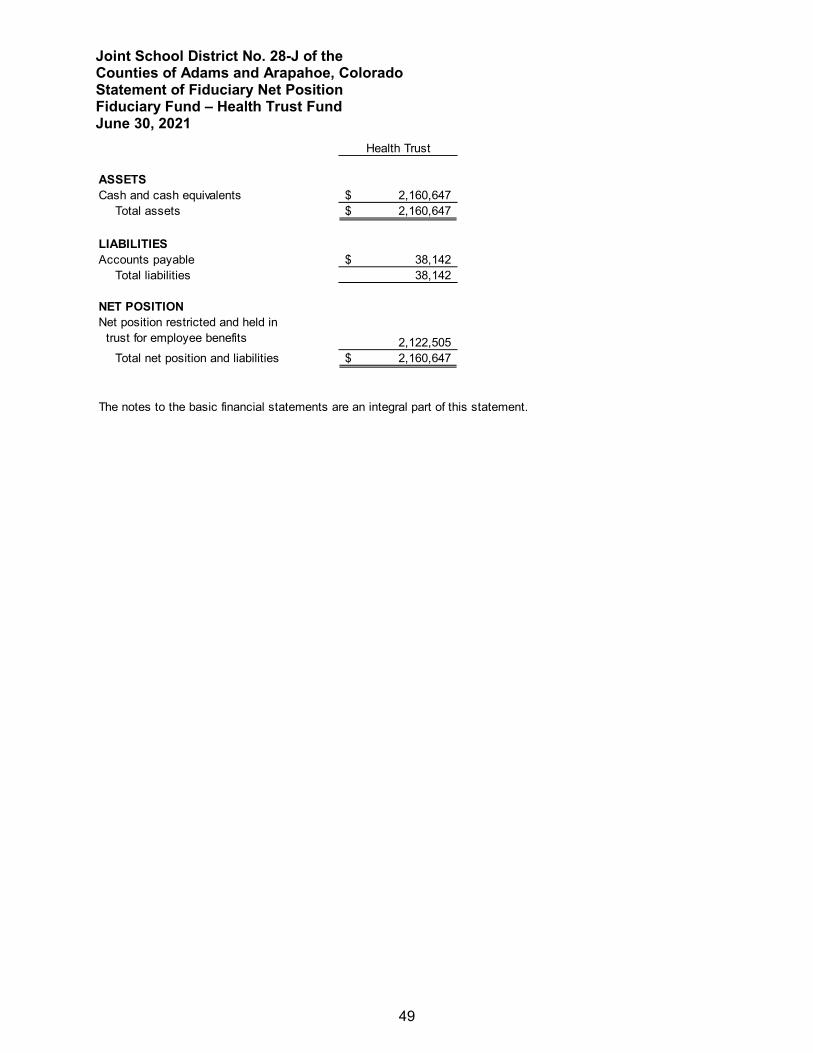
Joint School District No. 28-J of the Counties of Adams and Arapahoe, Colorado Statement of Fiduciary Net Position Fiduciary Fund – Health Trust Fund June 30, 2021
49
Statement of Fiduciary Net Position – Fiduciary Fund – Health Trust Fund
Health Trust
ASSETSCash and cash equivalents 2,160,647$
Total assets 2,160,647$
LIABILITIESAccounts payable 38,142$
Total liabilities 38,142
NET POSITION
2,122,505Total net position and liabilities 2,160,647$
The notes to the basic financial statements are an integral part of this statement.
Net position restricted and held in trust for employee benefits
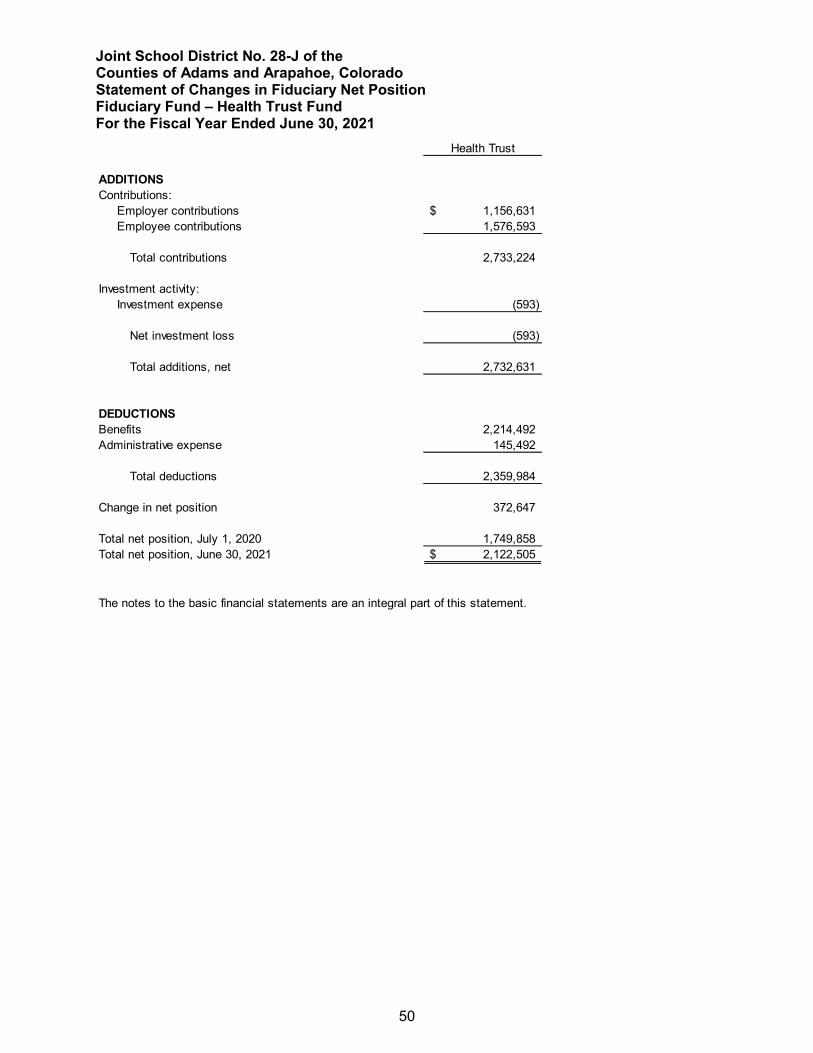
Joint School District No. 28-J of the Counties of Adams and Arapahoe, Colorado Statement of Changes in Fiduciary Net Position Fiduciary Fund – Health Trust Fund For the Fiscal Year Ended June 30, 2021
50
Statement of Changes in Fiduciary Net Position – Fiduciary Fund – Health Trust Fund
Health Trust
ADDITIONSContributions:
Employer contributions 1,156,631$ Employee contributions 1,576,593
Total contributions 2,733,224
Investment activity:Investment expense (593)
Net investment loss (593)
Total additions, net 2,732,631
DEDUCTIONSBenefits 2,214,492 Administrative expense 145,492
Total deductions 2,359,984
Change in net position 372,647
Total net position, July 1, 2020 1,749,858 Total net position, June 30, 2021 2,122,505$
The notes to the basic financial statements are an integral part of this statement.
51
Notes to Basic Financial Statements NOTES TO BASIC
FINANCIAL STATEMENTS
Joint School District No. 28-J of the Counties of Adams and Arapahoe, Colorado Notes to Basic Financial Statements June 30, 2021
52
NOTE 1: SUMMARY OF SIGNIFICANT ACCOUNTING POLICIES
The accompanying basic financial statements of Joint School District No. 28-J of the Counties of Adams and Arapahoe, Colorado, have been prepared in accordance with accounting principles generally accepted in the United States of America (U.S. GAAP). In addition, the district conforms to the Colorado Financial Policies and Procedures Handbook as required by Colorado statutes. A summary of the significant accounting policies applied in the preparation of the basic financial statements is described below.
Reporting Entity Joint School District No. 28-J of the Counties of Adams and Arapahoe, Colorado, is a political subdivision and corporate body of the state of Colorado. The public elects a seven-member board of education, which has the authority to make decisions, the power to designate management, the ability to significantly influence operations, and the primary accountability for fiscal matters. The board members are elected for four-year terms. The district superintendent serves as the executive officer of the board. The superintendent does not maintain any voting privileges.
The district receives local, state, and federal funding and must comply with regulations established by all of these entities. The district is not included as a component unit in any other governmental reporting entity. In accordance with accounting principles generally accepted in the United States of America, these financial statements present all funds of the district and its component units.
Discretely Presented Component Units – Charter Schools In 1993, the Colorado state legislature enacted the Charter School Act, § 22-30.5-101 et seq., C.R.S., which permits the district to contract with individuals and organizations for the operation of charter schools within the district. A charter school operates as a public school within the district and is accountable to the school district’s local board of education for purposes of ensuring compliance with applicable laws and charter provisions. The charter schools have separate governing boards but a financial benefit/burden relationship exists as the district provides the majority of their funding, and their exclusion would render the district’s financial statements incomplete. Charter schools are considered discretely presented component units for external financial reporting purposes. The district considers each of the component units to be nonmajor component units because none of the schools individually has a financial relationship with the district that is significant to require separate reporting within the basic financial statements. Combining schedules are included within the supplementary section of this comprehensive annual financial report.
Each charter school prepares its own separately issued financial statements. These statements can be obtained by sending a request to:
School Name Address Academy of Advanced Learning 441 Sable Blvd. Aurora, CO 80011 Aurora Academy 10251 E. First Ave. Aurora, CO 80010 Aurora Science and Technology of 3401 Quebec St., Suite 2000 Denver School of Science and Technology, Inc. Denver, CO 80207 Empower Community High School 450 S. Chambers Rd. Aurora, CO 80017 AXL Charter School 14100 E. Jewell Ave. Aurora, CO 80012 Global Village Academy 16401E Alameda Pl. Aurora, CO 80017
Joint School District No. 28-J of the Counties of Adams and Arapahoe, Colorado Notes to Basic Financial Statements June 30, 2021
53
Lotus School for Excellence 11001 E. Alameda Ave. Aurora, CO 80012 Rocky Mountain Preparatory School at Fletcher 10455 E. 25th Ave. Aurora, CO 80010 Vanguard Classical Schools 801 Yosemite St. Aurora, CO 80230 Vega Collegiate Academy 1345 Macon St. Aurora, CO 80010 Discretely Presented Component Unit – Aurora Public Schools Foundation The Aurora Public Schools Foundation was incorporated in 1987 as a non-profit organization. The foundation is a community-based advocate for quality public education for students within the district. Programs administered by the foundation provide a financial benefit to the district in the form of grants, scholarships and special projects which support innovative classroom initiatives and enhance the educational opportunities of district students and staff. In addition, donations to the foundation support various educational programs within the district. Even though the foundation is a separate legal entity and the district is not financially accountable for the foundation, the foundation’s financial statements are included as part of the district’s financial reporting entity because of the nature and significance of the relationship between the primary government and the foundation. The foundation solicits donations and manages those funds for the benefit of the students and district.
Complete financial statements for this component unit may be obtained from Aurora Public Schools Foundation administrative offices located at 15701 E. First Avenue, Suite 206, Aurora, Colorado 80011.
Government-wide and Fund Financial Statements The government-wide financial statements (i.e., the statement of net position and the statement of activities) report information on all of the non-fiduciary activities of the primary government and its component units. The effect of interfund activity has been removed from these statements. Governmental activities are normally supported by taxes and intergovernmental revenues. The primary government is reported separately from the discretely presented component units for which the primary government is financially accountable.
The statement of activities demonstrates the degree to which the direct expenses for a given function or segment are offset by program revenues. Direct expenses are those that are clearly identifiable with a specific function or segment. Capital asset depreciation is reported as a direct expense of the functional program that benefits from the use of the capital asset. Program revenues include 1) charges to customers who purchase, use, or directly benefit from goods, services or privileges provided by a given function or segment, and 2) grants and contributions that are restricted to meeting the operational or capital requirements of a particular function or segment. Taxes and other items not properly included among program revenues are reported instead as general revenues.
Separate financial statements are provided for governmental funds and the district’s fiduciary funds. The fiduciary funds’ statements are excluded from the government-wide financial statements. Major individual governmental funds are reported as separate columns in the fund financial statements.
Measurement Focus, Basis of Accounting and Financial Statement Presentation The government-wide financial statements are reported using the economic resources measurement focus and the accrual basis of accounting. Revenues are recorded when earned and expenses are recorded when a liability is incurred, regardless of the timing of related cash
Joint School District No. 28-J of the Counties of Adams and Arapahoe, Colorado Notes to Basic Financial Statements June 30, 2021
54
flows. Property taxes are recognized as revenues in the year for which they are levied. Grants and similar items are recognized as revenue as soon as all eligibility requirements have been met. When both restricted and unrestricted resources are available for use, it is the district’s policy to use restricted resources first, then unrestricted resources as they are needed.
Governmental funds account for the district’s general governmental activities and use the flow of current financial resources measurement focus. This measurement focus means that only current assets and current liabilities are included in these balance sheets. The reported fund balances are considered a measure of available spendable resources. Governmental fund operating statements show increases (revenues and other financing sources) and decreases (expenditures and other financing uses) in fund balance. Accordingly, they present a summary of sources and uses of available spendable resources during the reporting period.
All governmental funds use the modified accrual basis of accounting. Under the modified accrual basis, revenues are recognized when they become measurable and available. Measurable means the amount of the transaction can be determined, while available means collectible within the current period or soon enough thereafter to pay liabilities of the current period. Revenues susceptible to accrual include property taxes and payments from the state for equalization funding, special education and vocational education reimbursements. Other revenues susceptible to accrual include tuition payments received from other school districts and rental receipts for building usage that occurred in the fiscal year but were paid after year-end. The district considers these other revenues available if they are collected within 60 days after year-end. Grant revenues are recognized if they are collected within a one year period after the expenditures occur. Other local receipts are not susceptible to accrual since they are generally not measurable until received. The district considers all property tax revenues available if they are collected within 60 days after year-end. In addition, under the modified accrual basis of accounting, expenditures are recorded when the liability is incurred with two exceptions. These exceptions include (1) interest on general long-term obligations which is recognized when due, and (2) compensated absences such as accrued unused vacation pay and paid leave which are recognized when the obligations are expected to be liquidated when matured.
Governmental Funds The General Fund is the government’s primary operating fund. It is used to account for all financial resources of the general government, except those required to be accounted for in another fund.
The Bond Redemption Fund is the government’s debt service fund. It accounts for the accumulation of resources to pay general long-term debt principal, interest, and related costs. Because of its large cash balance, the Bond Redemption Fund is presented as a major fund on the governmental statements.
The Grants Fund is classified as a major special revenue fund and is used to account for revenues and expenditures related to federal, state and local grants. Special revenue funds are used to account for proceeds of special revenue sources that are legally or otherwise restricted to expenditures for specified purposes. Revenue restrictions in this fund are imposed by the grantor for the specific purposes of the grant.
The Nutrition Services Fund is classified as a major special revenue fund and is used to account for revenues and expenditures related to providing students with healthy and nutritious meals. Special revenue funds are used to account for proceeds that are legally or otherwise restricted to
Joint School District No. 28-J of the Counties of Adams and Arapahoe, Colorado Notes to Basic Financial Statements June 30, 2021
55
expenditures for specified purposes. Revenues in the Nutrition Services Fund are primarily from federal, state, and local sources specifically for school cafeteria operations. The fund balance of Nutrition Services operations is restricted for that fund’s use only.
The Building Fund is a capital projects fund and accounts for construction and renovation projects funded by the sale of general obligation bonds.
The Capital Reserve Fund is a capital projects fund and accounts for ongoing capital outlay needs of the district such as equipment purchases and debt repayments.
Fiduciary Fund The Health Trust Fund is an other employee benefit trust fiduciary fund, was created on July 1, 2010, and is used to account for the district’s self-insured dental insurance program and the employee-funded medical flexible spending accounts. Both employee and employer dental premiums fund dental claims that are processed through the dental insurance carrier. Medical flexible spending accounts are processed by a third-party administrator. The Health Trust Fund reports assets held by the district in a fiduciary capacity for employees and therefore cannot be used to support the government’s own programs. The fund uses the economic resources measurement focus and the accrual basis of accounting.
Major and Nonmajor Funds The district reports the following major funds.
Fund Group District Fund Name Fund Type Governmental Funds General Fund General Bond Redemption Fund Debt Service Grants Fund Special Revenue Nutrition Services Fund Special Revenue Building Fund Capital Projects Capital Reserve Fund Capital Projects
Additionally, the district reports four nonmajor government funds and one fiduciary fund.
Fund Group District Fund Name Fund Type Governmental Funds Athletic Fund Special Revenue Medicaid Funds Special Revenue Pickens Post-Secondary Fund Special Revenue Pupil Activity Special Revenue Fiduciary Fund Health Trust Trust-Other Employee Benefits
Assets, Deferred Outflows/Inflows of Resources, Liabilities and Equity Cash and Investments As mandated by § 22-45-103, C.R.S., the district maintains deposits for the Bond Redemption Fund in a third-party custodial bank. In order to maximize interest earnings, all other funds’ cash deposits are maintained in a cash and investment pool.
The district maintains accountability for each fund’s equity in pooled cash and investments. Interest earnings for combined deposits are generally distributed based on monthly cash balances.
Joint School District No. 28-J of the Counties of Adams and Arapahoe, Colorado Notes to Basic Financial Statements June 30, 2021
56
All pooled cash investments are considered cash equivalents for accounting purposes. Investments are carried at fair value based on current market quotations.
The district is required to deposit funds in eligible public depositories as defined by § 11-10.5-104, C.R.S. The eligible depository is required to pledge collateral having a market value that exceeds 102 percent of uninsured aggregate public deposits to the Colorado Division of Banking. Eligible collateral types include obligations of the United States, the state of Colorado, local Colorado governments, and obligations secured by first lien mortgages on real property located in the state. The collateral is not held in the name of the district but is part of a collateral pool. The district’s bank deposits are entirely covered by federal depository insurance or collateralized in accordance with the statute.
The district maintains deposits in the Colorado Local Government Liquid Asset Trust (COLOTRUST), an investment trust established by state statute for local governments in Colorado to pool surplus funds for investment purposes. COLOTRUST operates similarly to demand deposit accounts where each share is equal to one dollar. COLOTRUST invests in U.S. Treasury securities, written repurchase agreements, certain approved obligations of agencies of the U.S. government and commercial paper rated in the highest rating category. The district considers COLOTRUST funds, U.S. government securities and certificates of deposit with an original maturity of three months or less to be cash equivalents. Investments are reported at fair value (generally based on quoted market prices) except for the position in local government investment pools.
It is the policy of the district to invest public funds in a manner which will provide the highest investment return with the maximum security, meet the daily cash flow demands of the district, and conform to all federal, state and local statutes governing the investment of public funds. This policy applies to the investment of all financial assets and all funds of the district over which it exercises financial control. Investment activities are governed by § 24-75-601, C.R.S.
Interfund Transactions Transactions between funds that are representative of lending or borrowing arrangements result in interfund balances. Balances representing the current portion of interfund loans are reported as due to/from other funds, while advances to/from other funds represent the noncurrent portion of interfund loans. Another type of interfund transaction is a transfer, which occurs when resources of one fund are transferred to another fund. For the fiscal year ended June 30, 2021, the district reported both interfund transfers and current interfund loans.
Receivables and Payables Property taxes are levied on December 15 and are payable in full by April 30, or in two equal installments due February 28 and June 15. Taxes are considered past due on June 15. Personal property taxes that remain unpaid as of October 1 will be subject to distraint, seizure and sale to satisfy taxes due. Adams and Arapahoe counties bill and collect property taxes for all taxing entities in the counties. Property tax receipts collected by the counties on behalf of the district are remitted to the district in the subsequent month. A fee of 0.25 percent on General Fund collections is retained by both counties as compensation for collecting the taxes and is reflected as an expenditure in the General Fund.
In the governmental statements, which use the modified accrual basis of accounting, property taxes are reported as receivables and deferred inflows of resources when taxes are levied. Taxes
Joint School District No. 28-J of the Counties of Adams and Arapahoe, Colorado Notes to Basic Financial Statements June 30, 2021
57
received within 60 days after year-end are reported as revenue and as county treasurers’ receivables. In the government-wide financial statements, which use the full accrual basis of accounting, property taxes are recognized as revenue for the full levy amount in the period for which they are levied. All property tax receivables are shown net of an allowance for doubtful accounts, calculated as 1.06 percent of the year’s total levy amount.
For federal and state grants and entitlements, a receivable is established when related expenditures exceed receipts, and revenue is recognized to the extent of related expenditures when eligibility requirements are met. Grant revenues are recognized if they are collected within a one year period after the expenditures occur.
Unearned Revenue – Grants and Other Unearned federal grant, state grant and entitlement revenues are established when receipts exceed expenditures and all eligibility requirements have not been met. Other unearned revenues included community use rentals, tuition and fees received in advance, but not earned.
Inventories Inventories consist of expendable supplies held for consumption. Expenditures for supplies are recorded upon the release of these items to various schools and departments. Inventories for governmental activities are stated at cost as determined by the weighted average cost method. Expenses for food items are recorded when used. Inventories for food items are stated at cost as determined by the first-in, first-out method. Inventory balance at year end relates to Nutrition Services with the amount included with Nutrition Services’ restricted fund balance as it is restricted for that fund’s use only.
Prepayments Certain payments to vendors reflect costs applicable to future accounting periods and are recorded as prepaid items in both government-wide and fund financial statements. The district records prepaid items using the consumption method. Fund equity is classified as nonspendable for the prepayments.
Capital Assets The primary government considers capital equipment and vehicles to be those items having a useful life greater than one year and having an original item value greater than $5,000. Capital renovations are considered to be those items that significantly enhance the value of previously existing assets and have a project value greater than $25,000. In addition, capital improvements are those items that add new functionality to existing assets and have a project value greater than $10,000. All capital assets are recorded at either original cost or an estimated historical cost in the case of assets for which actual cost was not determinable. Intangible assets, such as purchased software licenses or internally generated software applications having a cost or development value of $5,000 or more, are capitalized and amortized over a three- to fifteen-year period. Donated assets have been recorded at acquisition value on the date of receipt. Expenditures that significantly enhance the value of an asset whether land, building, or equipment
Joint School District No. 28-J of the Counties of Adams and Arapahoe, Colorado Notes to Basic Financial Statements June 30, 2021
58
are capitalized according to the district’s policies. However, expenditures for repairs, maintenance and expendable supplies are not capitalized.
Capital assets of the district are depreciated using the straight line method over the following estimated useful lives:
Assets Years Buildings 40 Buildings and site improvements/renovations 10-20 Vehicles 7-12 Equipment 5-12 Intangible assets-software and software development
3-15
Each component unit has established its own capital asset policy and method of depreciation. Please refer to the financial statements of the component units for more information.
Deferred Outflows/Inflows of Resources A deferred inflow of resources is an acquisition of net position by the district that is applicable to a future reporting period and a deferred outflow of resources is a consumption of net position by the district that is applicable to a future reporting period. Both deferred inflows and outflows are reported in the statement of net position but are not recognized in the financial statements as revenues and expenses until the period(s) to which they relate.
Under the modified accrual basis of accounting, revenues and other fund financial resources are recognized in the period in which they become both measurable and available. Assets recorded in the fund financial statements for which the revenues are not available are reported as deferred inflows of resources.
Deferred outflows of resources of the entity consist of a deferred charge on refunding, pension items and OPEB items in the government-wide statement of net position. A deferred charge on refunding results from the difference in the carrying value of refunded debt and its reacquisition price. This amount is deferred and amortized over the shorter of the life of the refunded or refunding debt.
Refer to Notes 10 and 11 for information on deferred outflows of resources and deferred inflows of resources related to pension items and OPEB items, respectively.
Accrued Compensation Salaries and benefits of certain contractually employed personnel are paid over a 12-month period (for example, from August to July) for both the district and its charter school component units, but are earned during a school year of approximately 10 months.
Compensated Absences – Accumulated Unused Paid Leave and Vacation Pay District policy allows employees to accumulate unused paid leave and vacation pay to specified limits. Upon retirement or termination of employment, employees with at least 10 years of service are entitled to be paid for a portion of their accumulated unused paid leave in excess of 30 days. Unused vacation leave is expected to be used in the year in which it was earned but may be accumulated and carried over to specified limits. Unused vacation is paid in full to specified limits upon an employee’s retirement or termination of employment.
Joint School District No. 28-J of the Counties of Adams and Arapahoe, Colorado Notes to Basic Financial Statements June 30, 2021
59
In the governmental funds, which use the modified accrual basis of accounting, only the amounts due at the end of the fiscal year are accrued as current-year expenditures. These amounts are shown as fund liabilities. The General Fund is used to liquidate the compensated absences liabilities of the governmental funds.
In the government-wide financial statements, the district has estimated a portion of the total unused vacation pay and paid leave liability as due within one year with the remainder of the liability recorded as a long-term liability.
Noncurrent Liabilities In the government-wide financial statements, long-term debt and other long-term obligations are reported as liabilities in the applicable governmental activities. Bond premiums and discounts are amortized over the life of the bonds. Bonds payable are reported net of the applicable bond premium or discount.
In the fund financial statements, governmental fund types recognize bond premiums and discounts during the current period. Bond premiums and discounts are recognized as other financing sources and uses, respectively. Issuance costs, whether or not withheld from the actual debt proceeds received, are reported as expenditures.
For financial reporting purposes, the district follows the requirements of Governmental Accounting Standards Board (GASB) Statement No. 62, Codification of Accounting and Financial Reporting Guidance Contained in Pre-November 30, 1989 FASB and AICPA Pronouncements; which states under certain circumstances for capital leases, the present value of future minimum lease payments should be shown as a liability and related assets should be capitalized in the basic financial statements. Capital leases held by the district have been renewed annually, and title to the related property has been acquired pursuant to the lease.
General obligation bonds are serviced from property taxes and other revenues of the Bond Redemption Debt Service Fund. Refunded bonds are serviced by irrevocable refunding escrow accounts established at the time of refunding.
Accumulated unused vacation and paid leave for governmental funds are serviced from the General Fund.
The district has no legal obligation to fund the balance of the net pension liability recorded in the government-wide financial statements. Annual contributions to the pension plan are made from the fund in which an employee is paid.
Fund Balances and Net Position Fund balances are the excess of assets plus deferred outflows of resources minus liabilities and deferred inflows of resources and are shown only in the governmental funds statements. Governmental funds balances are classified into five categories: restricted, committed, assigned, unassigned or nonspendable. Fund balance is reported as restricted when constraints placed on the use are either externally imposed by creditors, grantors, contributors, or laws or regulations of other governments or imposed by law through constitutional provisions or enabling legislation. Assets that are required by outside sources to be used for a specific purpose are shown on the balance sheet as restricted assets. Any formal action, ordinance or resolution, of the board of education, the highest level of decision making authority, which places constraints on the use of funds to a specific purpose is categorized as committed fund balance. Actions to remove the
Joint School District No. 28-J of the Counties of Adams and Arapahoe, Colorado Notes to Basic Financial Statements June 30, 2021
60
constraints, regardless if they were imposed by an ordinance or a resolution, would require the same level of difficulty needed to place constraints on the use of funds to a specific purpose. Fund balance is reported as assigned when the board or board designee intends to use the funds for a specific purpose. Under the board’s adopted policy, only the board of education, superintendent, or the chief financial officer may assign amounts for specific purposes. The nonspendable fund balance classification includes amounts that cannot be spent because they are either (a) not in spendable form or (b) legally or contractually required to be maintained intact. Unassigned fund balance is the residual classification for the General Fund and represents fund balance that has not been assigned to other funds and that has not been restricted, committed, or assigned to specific purposes and may only be reported in the General Fund.
The district does not have a policy for its use of unrestricted fund balance amounts, but considers that committed amounts would be reduced first, followed by assigned amounts, and then unassigned amounts when expenditures are incurred for purposes for which amounts in any of those unrestricted fund balances could be used. When both restricted and unrestricted resources are available for use, it is the district’s policy to use restricted resources first, and then use unrestricted resources as they are needed.
Net position is the excess of assets minus liabilities and is shown in the government-wide and fiduciary fund financial statements. Net position includes the following three classifications: (a) net investment in capital assets which consists of capital assets, net of accumulated depreciation, and reduced by the outstanding amount of debt which was issued to acquire or construct the capital assets, (b) restricted net position report amounts legally segregated for a specific future use, and (c) remaining net position is reported as unrestricted.
On-Behalf Payments U.S. GAAP requires that direct on-behalf payments for fringe benefits and salaries made by one entity to a third party recipient for the employees of another, legally separate entity be recognized as revenue and expenditures by the employer government. The State of Colorado makes direct on-behalf payments for retirement benefits to Colorado PERA. Beginning on July 1, 2018, the State of Colorado is required to make a payment to PERA each year equal to $225 million. PERA allocates the contribution to the trust funds of the State, School, Denver Public Schools, and Judicial Division Trust Funds of PERA, as proportionate to the annual payroll of each division. This annual payment is required on July 1st of each year thereafter until there are no unfunded actuarial accrued liabilities of any division of PERA that receives the direct distribution. Due to House Bill 20-1379, signed by Governor Polis on June 29, 2020, the annual payment for fiscal year ended June 30, 2021 was suspended and there was no on-behalf payment for 2020-21.
Estimates Preparation of the basic financial statements in conformity with accounting principles generally accepted in the United States of America requires management to make estimates and assumptions that affect certain reported amounts and disclosures. Accordingly, actual results could differ from those estimates.
NOTE 2: STEWARDSHIP, COMPLIANCE AND ACCOUNTABILITY
Encumbrances Outstanding encumbrances represent a commitment for the estimated amount of expenditures, which could ultimately result from the fulfillment of uncompleted purchase orders and contracts.
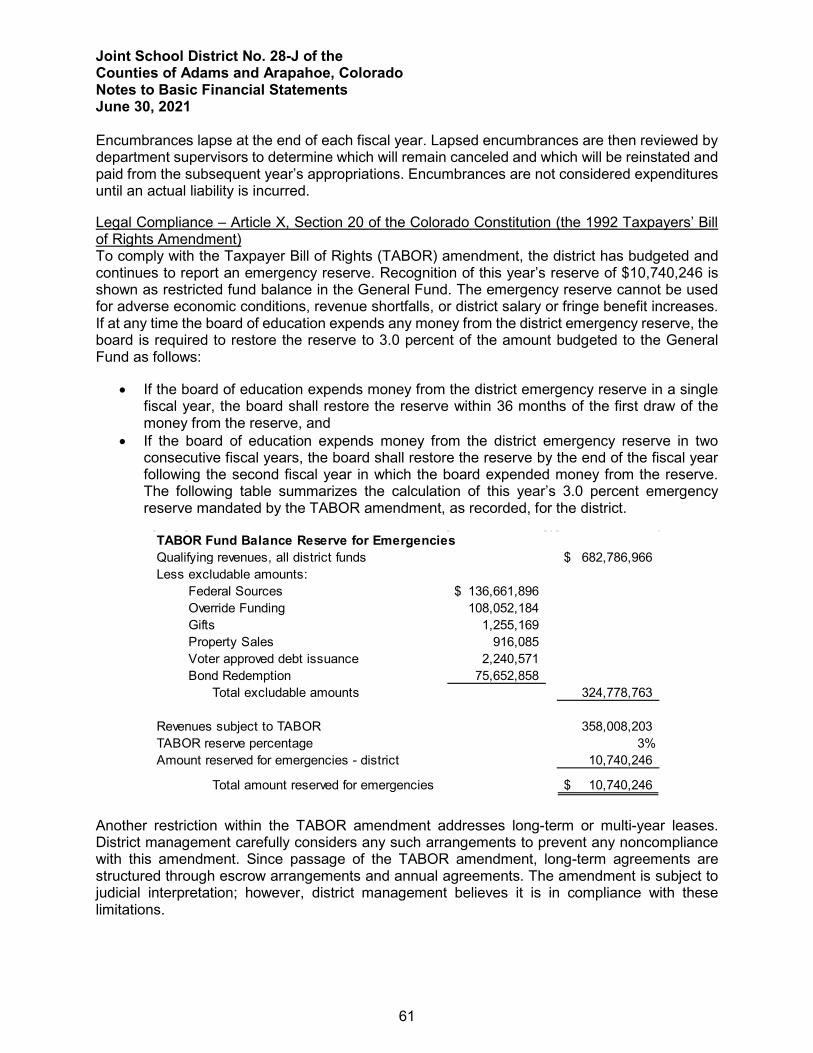
Joint School District No. 28-J of the Counties of Adams and Arapahoe, Colorado Notes to Basic Financial Statements June 30, 2021
61
Encumbrances lapse at the end of each fiscal year. Lapsed encumbrances are then reviewed by department supervisors to determine which will remain canceled and which will be reinstated and paid from the subsequent year’s appropriations. Encumbrances are not considered expenditures until an actual liability is incurred.
Legal Compliance – Article X, Section 20 of the Colorado Constitution (the 1992 Taxpayers’ Bill of Rights Amendment) To comply with the Taxpayer Bill of Rights (TABOR) amendment, the district has budgeted and continues to report an emergency reserve. Recognition of this year’s reserve of $10,740,246 is shown as restricted fund balance in the General Fund. The emergency reserve cannot be used for adverse economic conditions, revenue shortfalls, or district salary or fringe benefit increases. If at any time the board of education expends any money from the district emergency reserve, the board is required to restore the reserve to 3.0 percent of the amount budgeted to the General Fund as follows:
• If the board of education expends money from the district emergency reserve in a single fiscal year, the board shall restore the reserve within 36 months of the first draw of the money from the reserve, and
• If the board of education expends money from the district emergency reserve in two consecutive fiscal years, the board shall restore the reserve by the end of the fiscal year following the second fiscal year in which the board expended money from the reserve. The following table summarizes the calculation of this year’s 3.0 percent emergency reserve mandated by the TABOR amendment, as recorded, for the district.
TABOR Fund Balance Reserve for Emergencies682,786,966$
Federal Sources 136,661,896$ Override Funding 108,052,184 Gifts 1,255,169 Property Sales 916,085 Voter approved debt issuance 2,240,571 Bond Redemption 75,652,858
Total excludable amounts 324,778,763
Revenues subject to TABOR 358,008,203 TABOR reserve percentage 3%Amount reserved for emergencies - district 10,740,246
Total amount reserved for emergencies 10,740,246$
Qualifying revenues, all district fundsLess excludable amounts:
Another restriction within the TABOR amendment addresses long-term or multi-year leases. District management carefully considers any such arrangements to prevent any noncompliance with this amendment. Since passage of the TABOR amendment, long-term agreements are structured through escrow arrangements and annual agreements. The amendment is subject to judicial interpretation; however, district management believes it is in compliance with these limitations.
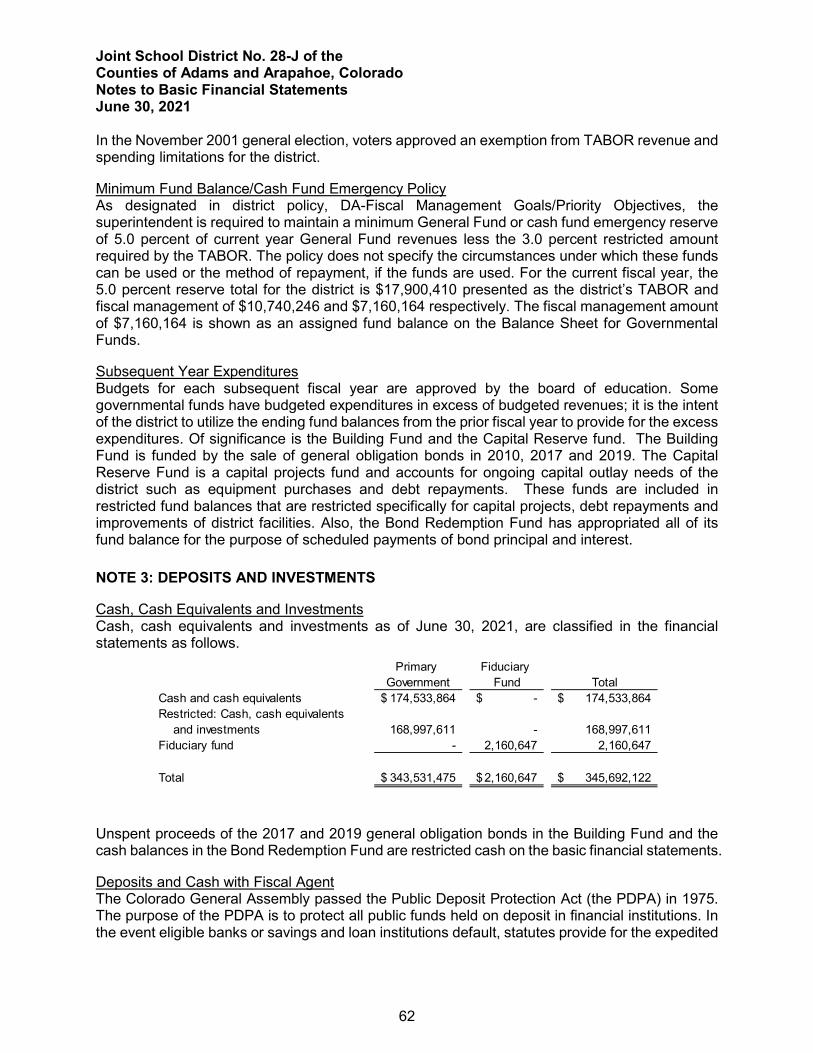
Joint School District No. 28-J of the Counties of Adams and Arapahoe, Colorado Notes to Basic Financial Statements June 30, 2021
62
In the November 2001 general election, voters approved an exemption from TABOR revenue and spending limitations for the district.
Minimum Fund Balance/Cash Fund Emergency Policy As designated in district policy, DA-Fiscal Management Goals/Priority Objectives, the superintendent is required to maintain a minimum General Fund or cash fund emergency reserve of 5.0 percent of current year General Fund revenues less the 3.0 percent restricted amount required by the TABOR. The policy does not specify the circumstances under which these funds can be used or the method of repayment, if the funds are used. For the current fiscal year, the 5.0 percent reserve total for the district is $17,900,410 presented as the district’s TABOR and fiscal management of $10,740,246 and $7,160,164 respectively. The fiscal management amount of $7,160,164 is shown as an assigned fund balance on the Balance Sheet for Governmental Funds.
Subsequent Year Expenditures Budgets for each subsequent fiscal year are approved by the board of education. Some governmental funds have budgeted expenditures in excess of budgeted revenues; it is the intent of the district to utilize the ending fund balances from the prior fiscal year to provide for the excess expenditures. Of significance is the Building Fund and the Capital Reserve fund. The Building Fund is funded by the sale of general obligation bonds in 2010, 2017 and 2019. The Capital Reserve Fund is a capital projects fund and accounts for ongoing capital outlay needs of the district such as equipment purchases and debt repayments. These funds are included in restricted fund balances that are restricted specifically for capital projects, debt repayments and improvements of district facilities. Also, the Bond Redemption Fund has appropriated all of its fund balance for the purpose of scheduled payments of bond principal and interest.
NOTE 3: DEPOSITS AND INVESTMENTS
Cash, Cash Equivalents and Investments Cash, cash equivalents and investments as of June 30, 2021, are classified in the financial statements as follows.
Primary Fiduciary Government Fund Total
Cash and cash equivalents 174,533,864$ -$ 174,533,864$ Restricted: Cash, cash equivalents and investments 168,997,611 - 168,997,611 Fiduciary fund - 2,160,647 2,160,647
Total 343,531,475$ 2,160,647$ 345,692,122$
Unspent proceeds of the 2017 and 2019 general obligation bonds in the Building Fund and the cash balances in the Bond Redemption Fund are restricted cash on the basic financial statements.
Deposits and Cash with Fiscal Agent The Colorado General Assembly passed the Public Deposit Protection Act (the PDPA) in 1975. The purpose of the PDPA is to protect all public funds held on deposit in financial institutions. In the event eligible banks or savings and loan institutions default, statutes provide for the expedited
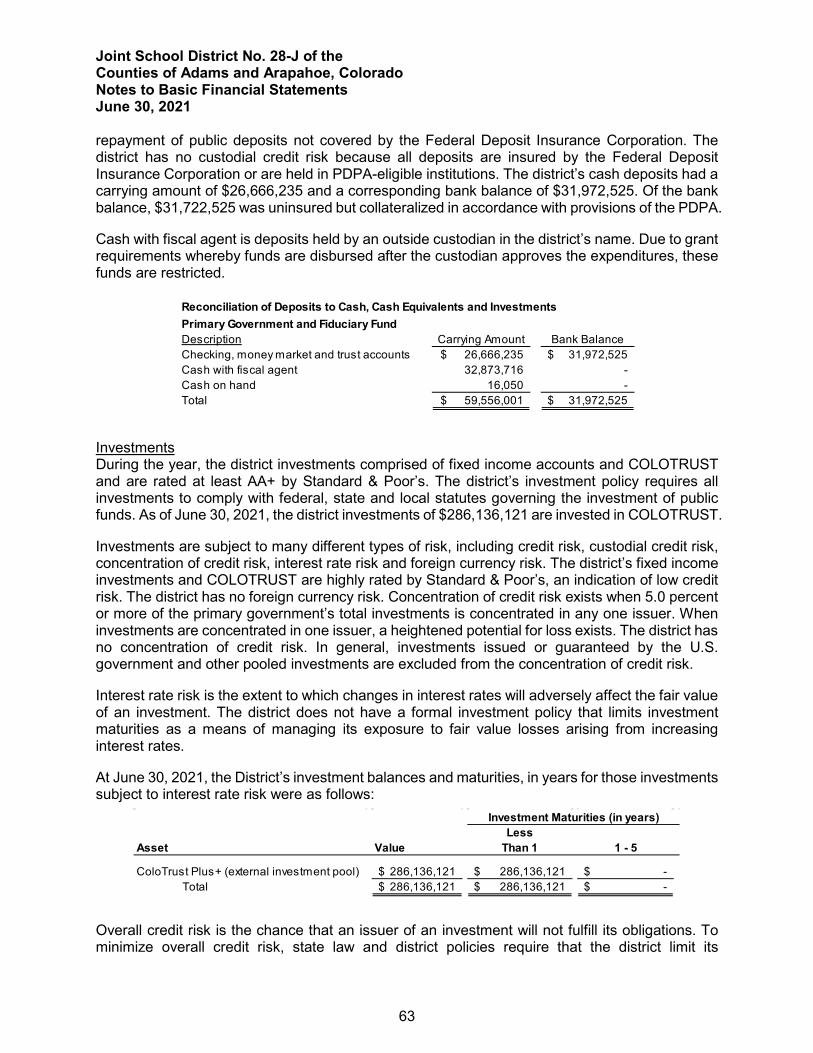
Joint School District No. 28-J of the Counties of Adams and Arapahoe, Colorado Notes to Basic Financial Statements June 30, 2021
63
repayment of public deposits not covered by the Federal Deposit Insurance Corporation. The district has no custodial credit risk because all deposits are insured by the Federal Deposit Insurance Corporation or are held in PDPA-eligible institutions. The district’s cash deposits had a carrying amount of $26,666,235 and a corresponding bank balance of $31,972,525. Of the bank balance, $31,722,525 was uninsured but collateralized in accordance with provisions of the PDPA.
Cash with fiscal agent is deposits held by an outside custodian in the district’s name. Due to grant requirements whereby funds are disbursed after the custodian approves the expenditures, these funds are restricted.
Reconciliation of Deposits to Cash, Cash Equivalents and InvestmentsPrimary Government and Fiduciary FundDescription Carrying Amount Bank BalanceChecking, money market and trust accounts 26,666,235$ 31,972,525$ Cash with fiscal agent 32,873,716 - Cash on hand 16,050 - Total 59,556,001$ 31,972,525$
Investments During the year, the district investments comprised of fixed income accounts and COLOTRUST and are rated at least AA+ by Standard & Poor’s. The district’s investment policy requires all investments to comply with federal, state and local statutes governing the investment of public funds. As of June 30, 2021, the district investments of $286,136,121 are invested in COLOTRUST.
Investments are subject to many different types of risk, including credit risk, custodial credit risk, concentration of credit risk, interest rate risk and foreign currency risk. The district’s fixed income investments and COLOTRUST are highly rated by Standard & Poor’s, an indication of low credit risk. The district has no foreign currency risk. Concentration of credit risk exists when 5.0 percent or more of the primary government’s total investments is concentrated in any one issuer. When investments are concentrated in one issuer, a heightened potential for loss exists. The district has no concentration of credit risk. In general, investments issued or guaranteed by the U.S. government and other pooled investments are excluded from the concentration of credit risk.
Interest rate risk is the extent to which changes in interest rates will adversely affect the fair value of an investment. The district does not have a formal investment policy that limits investment maturities as a means of managing its exposure to fair value losses arising from increasing interest rates.
At June 30, 2021, the District’s investment balances and maturities, in years for those investments subject to interest rate risk were as follows:
LessAsset Value Than 1 1 - 5
ColoTrust Plus+ (external investment pool) 286,136,121$ 286,136,121$ -$ Total 286,136,121$ 286,136,121$ -$
Investment Maturities (in years)
Overall credit risk is the chance that an issuer of an investment will not fulfill its obligations. To minimize overall credit risk, state law and district policies require that the district limit its
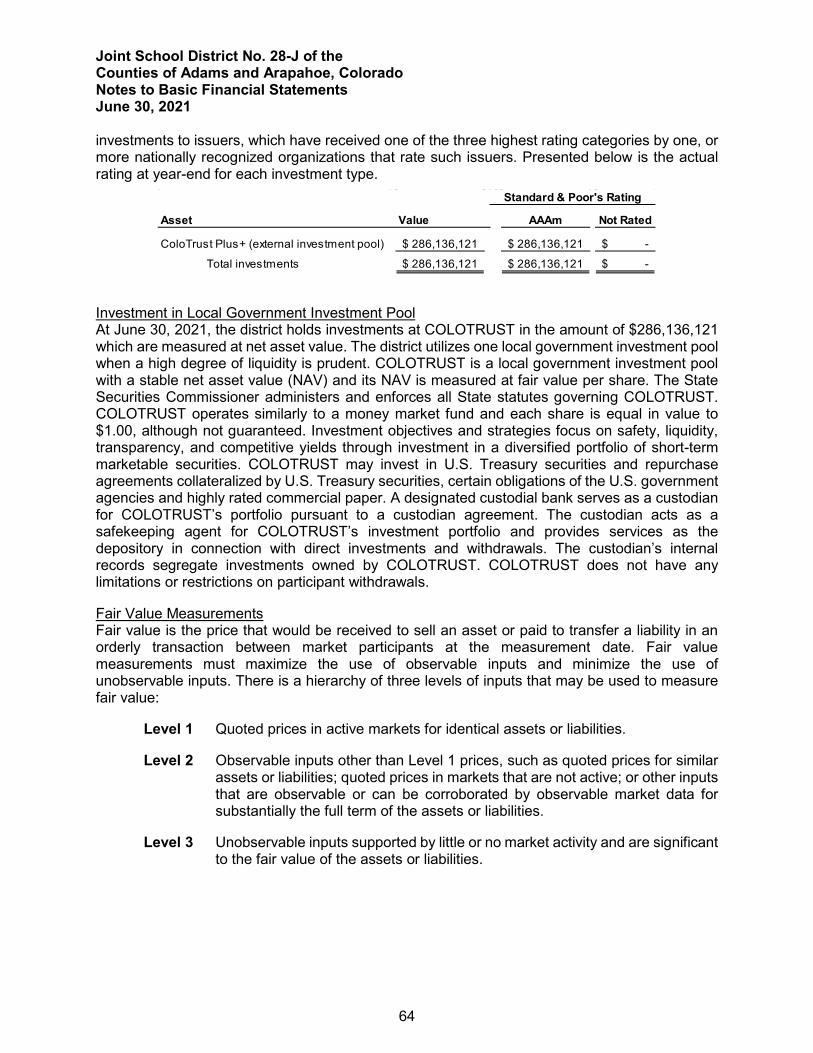
Joint School District No. 28-J of the Counties of Adams and Arapahoe, Colorado Notes to Basic Financial Statements June 30, 2021
64
investments to issuers, which have received one of the three highest rating categories by one, or more nationally recognized organizations that rate such issuers. Presented below is the actual rating at year-end for each investment type.
Asset Value AAAm Not Rated
ColoTrust Plus+ (external investment pool) 286,136,121$ 286,136,121$ -$
Total investments 286,136,121$ 286,136,121$ -$
Standard & Poor's Rating
Investment in Local Government Investment Pool At June 30, 2021, the district holds investments at COLOTRUST in the amount of $286,136,121 which are measured at net asset value. The district utilizes one local government investment pool when a high degree of liquidity is prudent. COLOTRUST is a local government investment pool with a stable net asset value (NAV) and its NAV is measured at fair value per share. The State Securities Commissioner administers and enforces all State statutes governing COLOTRUST. COLOTRUST operates similarly to a money market fund and each share is equal in value to $1.00, although not guaranteed. Investment objectives and strategies focus on safety, liquidity, transparency, and competitive yields through investment in a diversified portfolio of short-term marketable securities. COLOTRUST may invest in U.S. Treasury securities and repurchase agreements collateralized by U.S. Treasury securities, certain obligations of the U.S. government agencies and highly rated commercial paper. A designated custodial bank serves as a custodian for COLOTRUST’s portfolio pursuant to a custodian agreement. The custodian acts as a safekeeping agent for COLOTRUST’s investment portfolio and provides services as the depository in connection with direct investments and withdrawals. The custodian’s internal records segregate investments owned by COLOTRUST. COLOTRUST does not have any limitations or restrictions on participant withdrawals.
Fair Value Measurements Fair value is the price that would be received to sell an asset or paid to transfer a liability in an orderly transaction between market participants at the measurement date. Fair value measurements must maximize the use of observable inputs and minimize the use of unobservable inputs. There is a hierarchy of three levels of inputs that may be used to measure fair value:
Level 1 Quoted prices in active markets for identical assets or liabilities.
Level 2 Observable inputs other than Level 1 prices, such as quoted prices for similar assets or liabilities; quoted prices in markets that are not active; or other inputs that are observable or can be corroborated by observable market data for substantially the full term of the assets or liabilities.
Level 3 Unobservable inputs supported by little or no market activity and are significant to the fair value of the assets or liabilities.
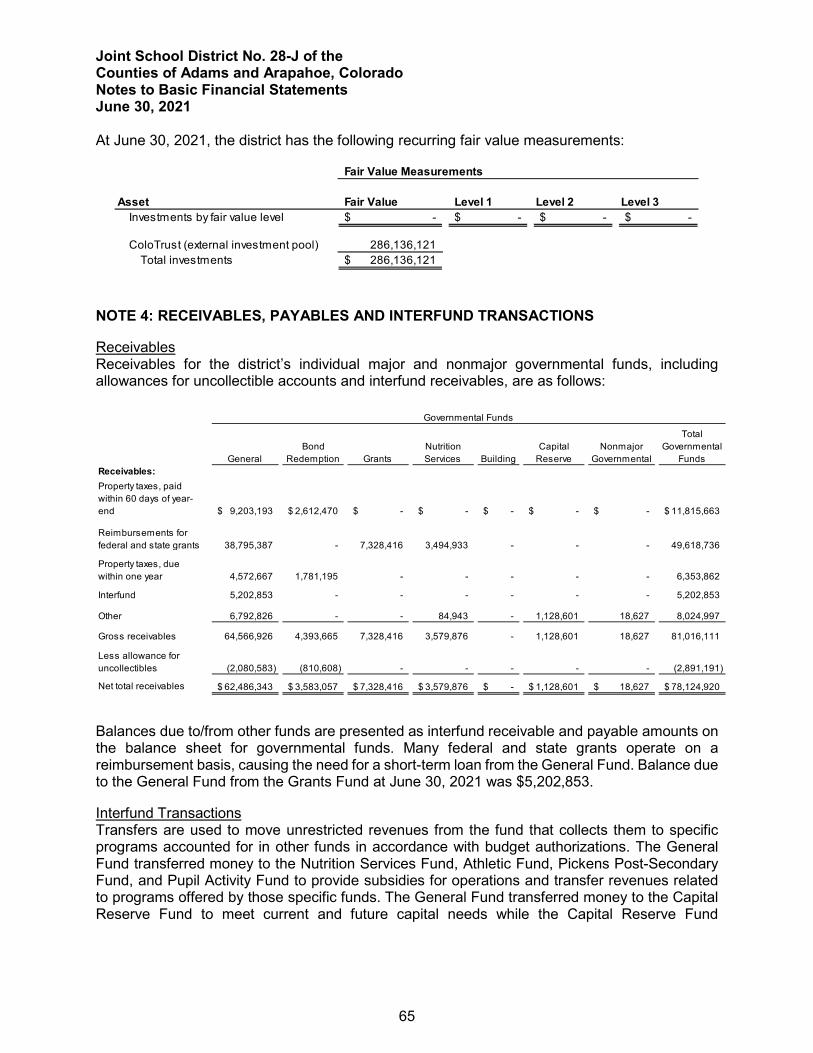
Joint School District No. 28-J of the Counties of Adams and Arapahoe, Colorado Notes to Basic Financial Statements June 30, 2021
65
At June 30, 2021, the district has the following recurring fair value measurements:
Fair Value Measurements
Asset Fair Value Level 1 Level 2 Level 3Investments by fair value level -$ -$ -$ -$
ColoTrust (external investment pool) 286,136,121 Total investments 286,136,121$
NOTE 4: RECEIVABLES, PAYABLES AND INTERFUND TRANSACTIONS
Receivables Receivables for the district’s individual major and nonmajor governmental funds, including allowances for uncollectible accounts and interfund receivables, are as follows:
GeneralBond
Redemption GrantsNutrition Services Building
Capital Reserve
Nonmajor Governmental
Total Governmental
FundsReceivables:Property taxes, paid within 60 days of year-end 9,203,193$ 2,612,470$ -$ -$ -$ -$ -$ 11,815,663$
Reimbursements for federal and state grants 38,795,387 - 7,328,416 3,494,933 - - - 49,618,736
Property taxes, due within one year 4,572,667 1,781,195 - - - - - 6,353,862
Interfund 5,202,853 - - - - - - 5,202,853
Other 6,792,826 - - 84,943 - 1,128,601 18,627 8,024,997
Gross receivables 64,566,926 4,393,665 7,328,416 3,579,876 - 1,128,601 18,627 81,016,111
Less allowance for uncollectibles (2,080,583) (810,608) - - - - - (2,891,191)
Net total receivables 62,486,343$ 3,583,057$ 7,328,416$ 3,579,876$ -$ 1,128,601$ 18,627$ 78,124,920$
Governmental Funds
Balances due to/from other funds are presented as interfund receivable and payable amounts on the balance sheet for governmental funds. Many federal and state grants operate on a reimbursement basis, causing the need for a short-term loan from the General Fund. Balance due to the General Fund from the Grants Fund at June 30, 2021 was $5,202,853.
Interfund Transactions Transfers are used to move unrestricted revenues from the fund that collects them to specific programs accounted for in other funds in accordance with budget authorizations. The General Fund transferred money to the Nutrition Services Fund, Athletic Fund, Pickens Post-Secondary Fund, and Pupil Activity Fund to provide subsidies for operations and transfer revenues related to programs offered by those specific funds. The General Fund transferred money to the Capital Reserve Fund to meet current and future capital needs while the Capital Reserve Fund
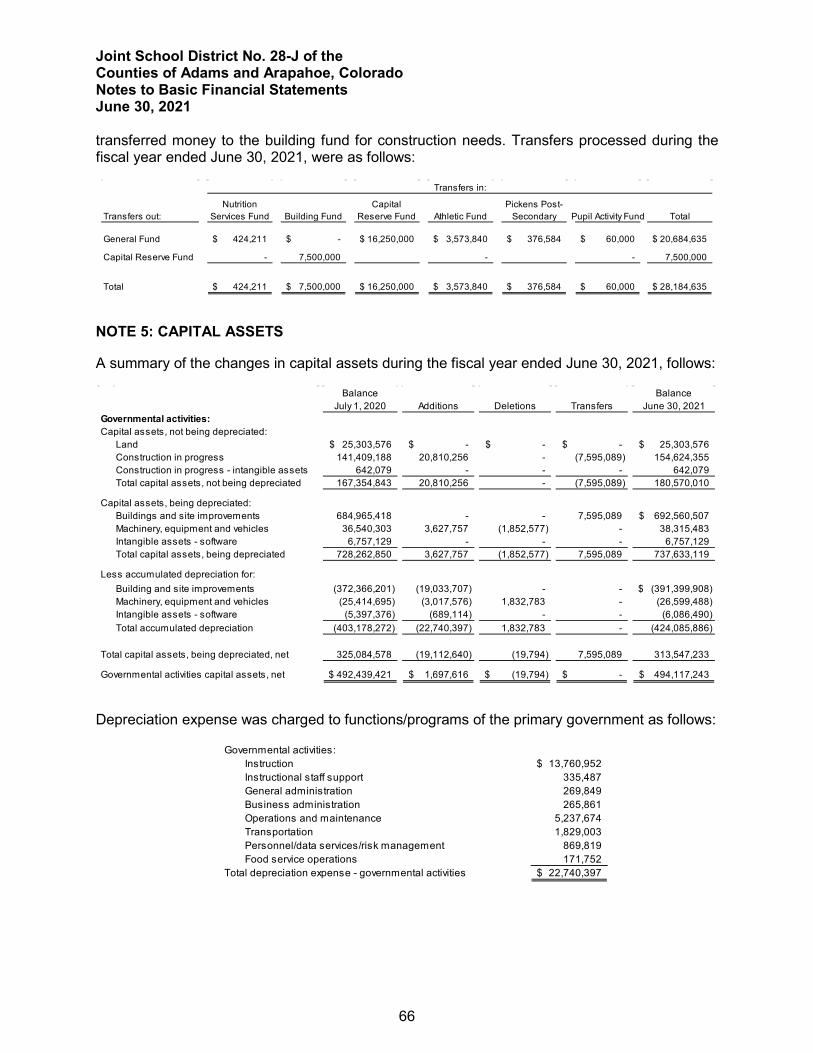
Joint School District No. 28-J of the Counties of Adams and Arapahoe, Colorado Notes to Basic Financial Statements June 30, 2021
66
transferred money to the building fund for construction needs. Transfers processed during the fiscal year ended June 30, 2021, were as follows:
Transfers out:Nutrition
Services Fund Building FundCapital
Reserve Fund Athletic FundPickens Post-
Secondary Pupil Activity Fund Total
General Fund 424,211$ -$ 16,250,000$ 3,573,840$ 376,584$ 60,000$ 20,684,635$
Capital Reserve Fund - 7,500,000 - - 7,500,000
Total 424,211$ 7,500,000$ 16,250,000$ 3,573,840$ 376,584$ 60,000$ 28,184,635$
Transfers in:
NOTE 5: CAPITAL ASSETS
A summary of the changes in capital assets during the fiscal year ended June 30, 2021, follows:
Balance BalanceJuly 1, 2020 Additions Deletions Transfers June 30, 2021
Governmental activities:Capital assets, not being depreciated:
Land 25,303,576$ -$ -$ -$ 25,303,576$ Construction in progress 141,409,188 20,810,256 - (7,595,089) 154,624,355 Construction in progress - intangible assets 642,079 - - - 642,079 Total capital assets, not being depreciated 167,354,843 20,810,256 - (7,595,089) 180,570,010
Capital assets, being depreciated:Buildings and site improvements 684,965,418 - - 7,595,089 692,560,507$ Machinery, equipment and vehicles 36,540,303 3,627,757 (1,852,577) - 38,315,483 Intangible assets - software 6,757,129 - - - 6,757,129 Total capital assets, being depreciated 728,262,850 3,627,757 (1,852,577) 7,595,089 737,633,119
Less accumulated depreciation for:Building and site improvements (372,366,201) (19,033,707) - - (391,399,908)$ Machinery, equipment and vehicles (25,414,695) (3,017,576) 1,832,783 - (26,599,488) Intangible assets - software (5,397,376) (689,114) - - (6,086,490) Total accumulated depreciation (403,178,272) (22,740,397) 1,832,783 - (424,085,886)
Total capital assets, being depreciated, net 325,084,578 (19,112,640) (19,794) 7,595,089 313,547,233
Governmental activities capital assets, net 492,439,421$ 1,697,616$ (19,794)$ -$ 494,117,243$
Depreciation expense was charged to functions/programs of the primary government as follows:
Governmental activities:Instruction 13,760,952$ Instructional staff support 335,487 General administration 269,849 Business administration 265,861 Operations and maintenance 5,237,674 Transportation 1,829,003 Personnel/data services/risk management 869,819 Food service operations 171,752
Total depreciation expense - governmental activities 22,740,397$

Joint School District No. 28-J of the Counties of Adams and Arapahoe, Colorado Notes to Basic Financial Statements June 30, 2021
67
NOTE 6: NONCURRENT LIABILITIES
General Obligation Bonds The district issues bonds to finance construction, renovation, and repair of schools and support site facilities. When market and interest rates are favorable, the district may refinance outstanding debt with new debt to reduce interest payments or restructure the debt service requirement of the Bond Redemption Fund. The bonds are serviced from property tax revenues. As of June 30, 2021, total general obligation bonds outstanding are $389,186,136, total unamortized premium is $27,971,280, and total accreted interest is $10,018,849.
Management of the district believes it has complied with all significant financial bond covenants regarding its original bond issues and refunding bond issues. In general, bond covenants for each of the following issues include:
• The district will not take any action or omit to take any action that jeopardizes the federal and state tax-free status of the bonds or bond coupons to the bondholder.
• The district will provide annual financial information to each bond repository. • The district will prepare and file an annual budget and annual financial report with the
appropriate state agency. • The district will comply with the continuing disclosure certificate, which will be executed by
the officers of the district in connection with the delivery of the bonds.
General Obligation Bonds A description of each issue follows.
• In May 2010, the 2010 Series Refunding Bonds were issued with a total face value of $101,460,000. As of June 30, 2021, outstanding principal balance for the 2010 Series Refunding Bonds was $15,615,000. Maturity dates began December 1, 2010, and will continue through December 1, 2022. Interest rates range from 4.0 percent to 5.0 percent. Remaining annual payments for principal and interest range from $693,600 to $15,335,575.
• On September 15, 2010, the district issued $38,000,000 in the 2010B Series General Obligation Bonds – Direct Pay Build America Bonds. Current outstanding balance is $27,610,000. These bonds began maturing on December 1, 2012, with the final principal payment due on December 1, 2028. The interest rate ranges from 3.930 percent to 5.312 percent. Remaining annual payments for principal and interest range from $2,377,101 to $10,534,144.
• On December 22, 2010, the district issued $37,315,000 in the 2010D Series General Obligation Bonds – Direct Pay Build America Bonds. Current outstanding balance is $23,570,000. These bonds began maturing on December 1, 2014, with the final principal payment due on December 1, 2028. The interest rate ranges from 4.536 percent to 6.045 percent. Remaining annual payments for principal and interest range from $3,631,205 to $3,883,948.
• In February 2012, the 2012 Series Refunding Bonds were issued with a total face value of $149,535,000. Concurrently, the district issued capital appreciation bonds with an original principal amount of $385,000. The capital appreciation bonds will accrete interest
Joint School District No. 28-J of the Counties of Adams and Arapahoe, Colorado Notes to Basic Financial Statements June 30, 2021
68
over the term of 10 years to the maturity date of December 1, 2022, to the redeemable amount of $17,250,000. Total current outstanding principal balance for both types of bonds is $137,140,000. Maturity dates began December 1, 2012, and will continue through December 1, 2028. Interest rates range from 3.0 percent to 5.0 percent. Remaining annual payments for principal and interest range from $11,745,675 to $27,458,625. As of June 30, 2021, accreted interest for the capital appreciation bonds was $10,018,849.
• In January 2017, the district issued $200,000,000 in the 2017A General Obligation Bonds. Current outstanding balance is $159,730,000. These bonds began maturing on December 1, 2017, with the final principal payment due on December 1, 2036. The interest rate is 5.0 percent. Remaining annual payments for principal and interest range from $1,025,000 to $40,400,750.
• In January 2017, the district issued $3,665,000 in the 2017B General Obligation Refunding Bonds. The final payment, including interest, was made on December 1, 2020 in the amount of $3,756,625.
• In December 2019, the district issued $26,521,099 in the 2019 General Obligation Bonds. Current outstanding balance is $25,521,136. These bonds begin maturing on December 1, 2020, with the final principal payment due on December 1, 2039. The interest rate is 2.952 percent. Remaining annual payments for principal and interest range from $1,748,731 to $1,759,100.
Certificates of Participation On June 25, 2020, the district sold certificates of participation (COP) with a par value of $7,575,000. The proceeds from the COPs are being used to build a new 6-12 school in the district. The outstanding amount due on the COP is collateralized by related future rental income and the property that the funds are being used to construct. The COP matures on December 1, 2029 and bears interest at a per annum fixed rate of 2.77 percent. Annual lease principal and interest payments range from $195,839 to $1,193,070. The first interest payment was made on December 1, 2020.
Capital Leases The Board of Education approved a master lease purchase agreement for the purpose of financing the costs of acquiring approximately 80 buses and support vehicles for school purposes and other essential need equipment in an amount not to exceed $12.0 million over approximately a five year period. The titles to the leased assets are held by the lessor and they will not be released until the leases are fully repaid.
On September 1, 2016, the district financed 14 buses and 36 support vehicles in the amount of $2,411,380 with an interest rate of 1.726 percent per year to be repaid over the next 10 years. Assets in the amount of $2,279,022 were capitalized in fiscal year 2017 into machinery and equipment and had related amortization of $1,448,643 as of June 30, 2021.
On September 11, 2017, the district financed 16 buses and 7 support vehicles in the amount of $1,931,000 with an interest rate of 2.098 percent per year to be repaid over the next 10 years. Assets in the amount of $1,907,221 were capitalized into machinery and equipment and had related amortization of $1,011,222 as of June 30, 2021.
Joint School District No. 28-J of the Counties of Adams and Arapahoe, Colorado Notes to Basic Financial Statements June 30, 2021
69
On June 21, 2018, the district financed 18 buses and 3 support vehicles in the amount of $1,837,761 with an interest rate of 3.414 percent per year to be repaid over the next 10 years. Assets in the amount of $1,612,410 were capitalized into machinery and equipment and have related amortization of $621,130 as of June 30, 2021.
On January 26, 2021, the district financed 16 buses and 3 support vehicles in the amount of $2,240,571 with an interest rate of 1.670 percent per year to be repaid over the next 10 years. Assets in the amount of $2,240,571 were capitalized and have related amortization of $83,218 as of June 30, 2021.
Debt Financing for Land Purchase On February 20, 2020, the district purchased land for the building of a future school. The purchase price was $4,750,245 with an initial payment made at closing of $3,844,959 and an additional $905,286 due to the seller in the future in the form of cash-in-lieu payments received. This financing has no interest due or maturity date. The timing of these future payments are unknown, as cash-in-lieu payments yet to be received by the district depend on the timing of development of certain residential units as per the purchase agreement. The $905,286 debt financing for the land purchase is reflected as non-current liabilities due within a year.
Compensated Absences In accordance with GASB Statement No. 16, Accounting for Compensated Absences, the district has recorded the accrued liability for compensated absences in the accompanying basic financial statements. The subsequent table summarizes total liabilities and current year activity for compensated absences. Per GASB Interpretation No. 6, Recognition and Measurement of Certain Liabilities and Expenditures in Governmental Fund Financial Statements, the amount of $555,487 recorded in the General Fund in the governmental statements represents the mature portion of total compensated absences liabilities.
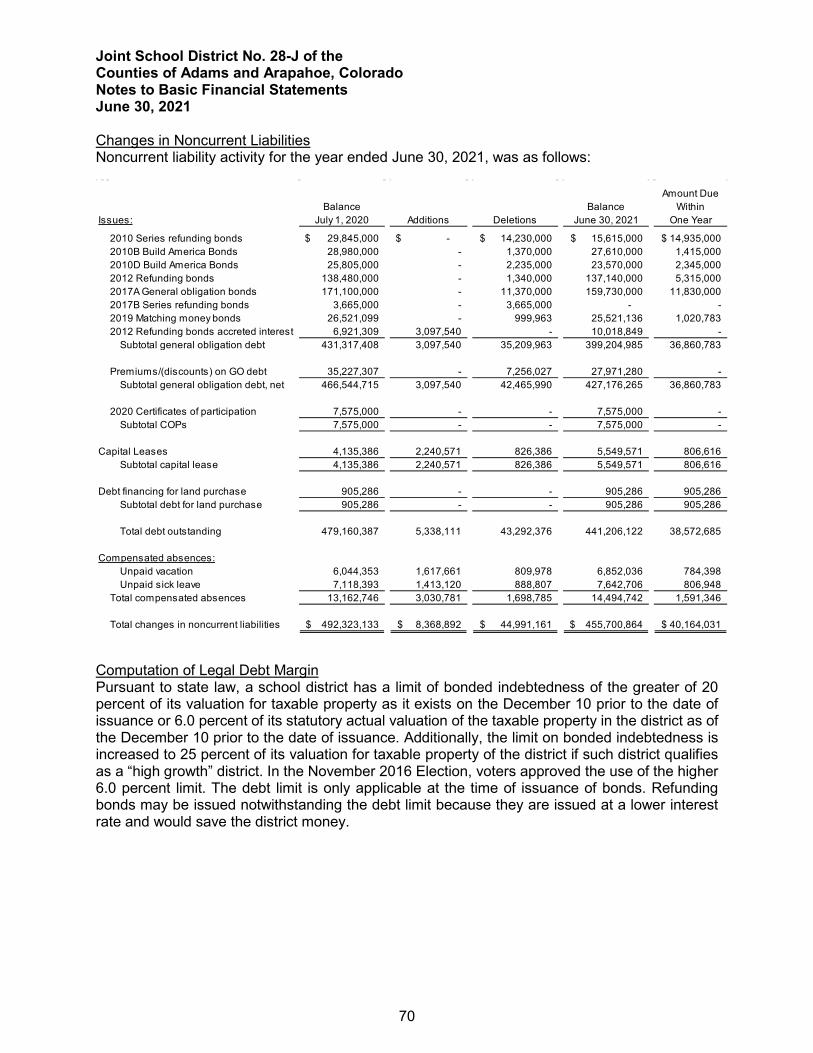
Joint School District No. 28-J of the Counties of Adams and Arapahoe, Colorado Notes to Basic Financial Statements June 30, 2021
70
Changes in Noncurrent Liabilities Noncurrent liability activity for the year ended June 30, 2021, was as follows:
Amount DueBalance Balance Within
Issues: July 1, 2020 Additions Deletions June 30, 2021 One Year
2010 Series refunding bonds 29,845,000$ -$ 14,230,000$ 15,615,000$ 14,935,000$ 2010B Build America Bonds 28,980,000 - 1,370,000 27,610,000 1,415,000 2010D Build America Bonds 25,805,000 - 2,235,000 23,570,000 2,345,000 2012 Refunding bonds 138,480,000 - 1,340,000 137,140,000 5,315,000 2017A General obligation bonds 171,100,000 - 11,370,000 159,730,000 11,830,000 2017B Series refunding bonds 3,665,000 - 3,665,000 - - 2019 Matching money bonds 26,521,099 - 999,963 25,521,136 1,020,783 2012 Refunding bonds accreted interest 6,921,309 3,097,540 - 10,018,849 -
Subtotal general obligation debt 431,317,408 3,097,540 35,209,963 399,204,985 36,860,783
Premiums/(discounts) on GO debt 35,227,307 - 7,256,027 27,971,280 - Subtotal general obligation debt, net 466,544,715 3,097,540 42,465,990 427,176,265 36,860,783
2020 Certificates of participation 7,575,000 - - 7,575,000 - Subtotal COPs 7,575,000 - - 7,575,000 -
Capital Leases 4,135,386 2,240,571 826,386 5,549,571 806,616 Subtotal capital lease 4,135,386 2,240,571 826,386 5,549,571 806,616
Debt financing for land purchase 905,286 - - 905,286 905,286 Subtotal debt for land purchase 905,286 - - 905,286 905,286
Total debt outstanding 479,160,387 5,338,111 43,292,376 441,206,122 38,572,685
Compensated absences:Unpaid vacation 6,044,353 1,617,661 809,978 6,852,036 784,398 Unpaid sick leave 7,118,393 1,413,120 888,807 7,642,706 806,948
Total compensated absences 13,162,746 3,030,781 1,698,785 14,494,742 1,591,346
Total changes in noncurrent liabilities 492,323,133$ 8,368,892$ 44,991,161$ 455,700,864$ 40,164,031$
Computation of Legal Debt Margin Pursuant to state law, a school district has a limit of bonded indebtedness of the greater of 20 percent of its valuation for taxable property as it exists on the December 10 prior to the date of issuance or 6.0 percent of its statutory actual valuation of the taxable property in the district as of the December 10 prior to the date of issuance. Additionally, the limit on bonded indebtedness is increased to 25 percent of its valuation for taxable property of the district if such district qualifies as a “high growth” district. In the November 2016 Election, voters approved the use of the higher 6.0 percent limit. The debt limit is only applicable at the time of issuance of bonds. Refunding bonds may be issued notwithstanding the debt limit because they are issued at a lower interest rate and would save the district money.
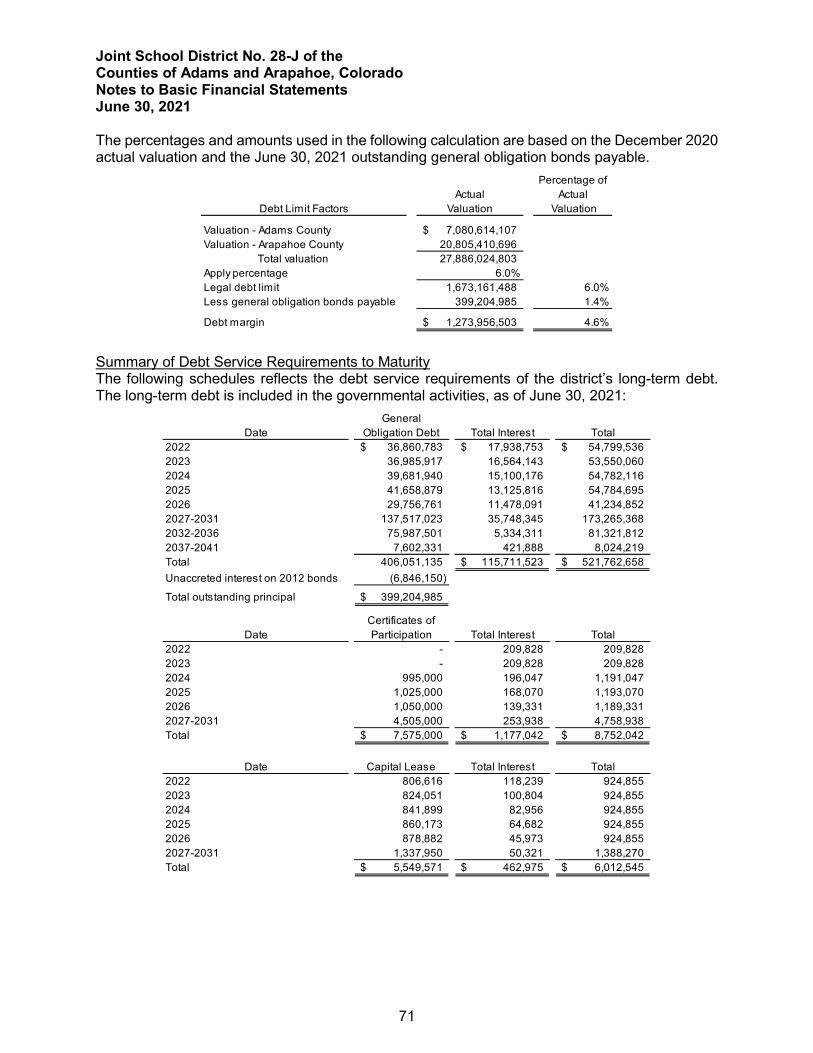
Joint School District No. 28-J of the Counties of Adams and Arapahoe, Colorado Notes to Basic Financial Statements June 30, 2021
71
The percentages and amounts used in the following calculation are based on the December 2020 actual valuation and the June 30, 2021 outstanding general obligation bonds payable.
ActualPercentage of
ActualDebt Limit Factors Valuation Valuation
Valuation - Adams County 7,080,614,107$ Valuation - Arapahoe County 20,805,410,696
Total valuation 27,886,024,803 Apply percentage 6.0%Legal debt limit 1,673,161,488 6.0%Less general obligation bonds payable 399,204,985 1.4%
Debt margin 1,273,956,503$ 4.6%
Summary of Debt Service Requirements to Maturity The following schedules reflects the debt service requirements of the district’s long-term debt. The long-term debt is included in the governmental activities, as of June 30, 2021:
DateGeneral
Obligation Debt Total Interest Total2022 36,860,783$ 17,938,753$ 54,799,536$ 2023 36,985,917 16,564,143 53,550,060 2024 39,681,940 15,100,176 54,782,116 2025 41,658,879 13,125,816 54,784,695 2026 29,756,761 11,478,091 41,234,852 2027-2031 137,517,023 35,748,345 173,265,368 2032-2036 75,987,501 5,334,311 81,321,812 2037-2041 7,602,331 421,888 8,024,219 Total 406,051,135 115,711,523$ 521,762,658$ Unaccreted interest on 2012 bonds (6,846,150)
Total outstanding principal 399,204,985$
DateCertificates of Participation Total Interest Total
2022 - 209,828 209,828 2023 - 209,828 209,828 2024 995,000 196,047 1,191,047 2025 1,025,000 168,070 1,193,070 2026 1,050,000 139,331 1,189,331 2027-2031 4,505,000 253,938 4,758,938 Total 7,575,000$ 1,177,042$ 8,752,042$
Date Capital Lease Total Interest Total2022 806,616 118,239 924,855 2023 824,051 100,804 924,855 2024 841,899 82,956 924,855 2025 860,173 64,682 924,855 2026 878,882 45,973 924,855 2027-2031 1,337,950 50,321 1,388,270 Total 5,549,571$ 462,975$ 6,012,545$
Joint School District No. 28-J of the Counties of Adams and Arapahoe, Colorado Notes to Basic Financial Statements June 30, 2021
72
NOTE 7: SHORT-TERM DEBT
In order to meet short-term General Fund cash flow needs, the district participates in the state of Colorado Interest-Free Loan Program. There was no draw request during 2020-21.
NOTE 8: RISK MANAGEMENT
The district is exposed to various risks of loss such as theft of, damage to, and destruction of assets; errors and omissions; injuries to employees; and natural disasters. These risks are covered by a combination of risk retention programs, purchased insurance coverages from independent carriers, and by participating in two risk pools. Property and casualty losses, claims and purchased insurance protection are accounted for in the district’s General Fund. Settled claims from these risks have not exceeded commercial coverage for each of the past three fiscal years. Some insurance coverage has had additional exclusions in the policies making the district’s risk retention slightly higher.
The Colorado Governmental Immunity Act provides protection against several types of claims and establishes damage limits for claims for those that are not protected. The limits through 2021 are $387,000 per injury and $1,093,000 per occurrence.
Self-insurance Programs and Purchased Insurance Coverages The district self-insures the first $50,000 of each property loss/claim and purchases insurance for any additional property loss/claim up to $1,000,000,000. For any loss caused by wind or hail, the deductible is 3% of the value of property damaged. The district purchases other insurance policies for crime, cyber, fiduciary, foreign travel, pollution, boiler & machinery and student professional liability with varying deductibles and limits.
Workers’ Compensation In 1986, the district joined other Colorado school districts to form the Joint School Districts’ Workers’ Compensation Self-Insurance Pool (JSD) with the purpose to control costs related to workers’ compensation incidents. JSD is managed by an independent manager chosen by the pool’s board of directors. Board membership consists of one member from each of four participating school districts. Each member’s initial contribution and subsequent share of expenses and contributions is based on JSD’s and respective member’s payroll, projected losses, standard premiums, experience modifications, and other variable expenses as estimated by JSD management and approved by the JSD board. The district’s share of expenses is reported in the district’s basic financial statements. JSD has no current or long-term debt. Each member of JSD is responsible for the first $100,000 of each loss. Losses between $100,000 and $550,000 are shared between the member districts and losses in excess of $550,000 are reinsured for up to statutory limits. This pool is audited each year by Clifton Larson Allen LLP. Actuarial services are performed by Willis Towers Watson. Requests for JSD financial statements can be sent to Beecher Carlson, 8000 E. Maplewood Avenue, Suite 350, Greenwood Village, Colorado 80111.
Liability The district self-insures the first $150,000 of each liability loss/claim and purchases insurance for the next $10,000,000 of each loss/claim. General liability, auto liability and errors and omissions coverage is purchased through the Excess-of-Loss Self Insurance Pool (ELSIP), a public entity risk pool. ELSIP is managed by an independent manager chosen by ELSIP’s board of directors. The board is comprised of one member from each of three participating districts. Each member’s
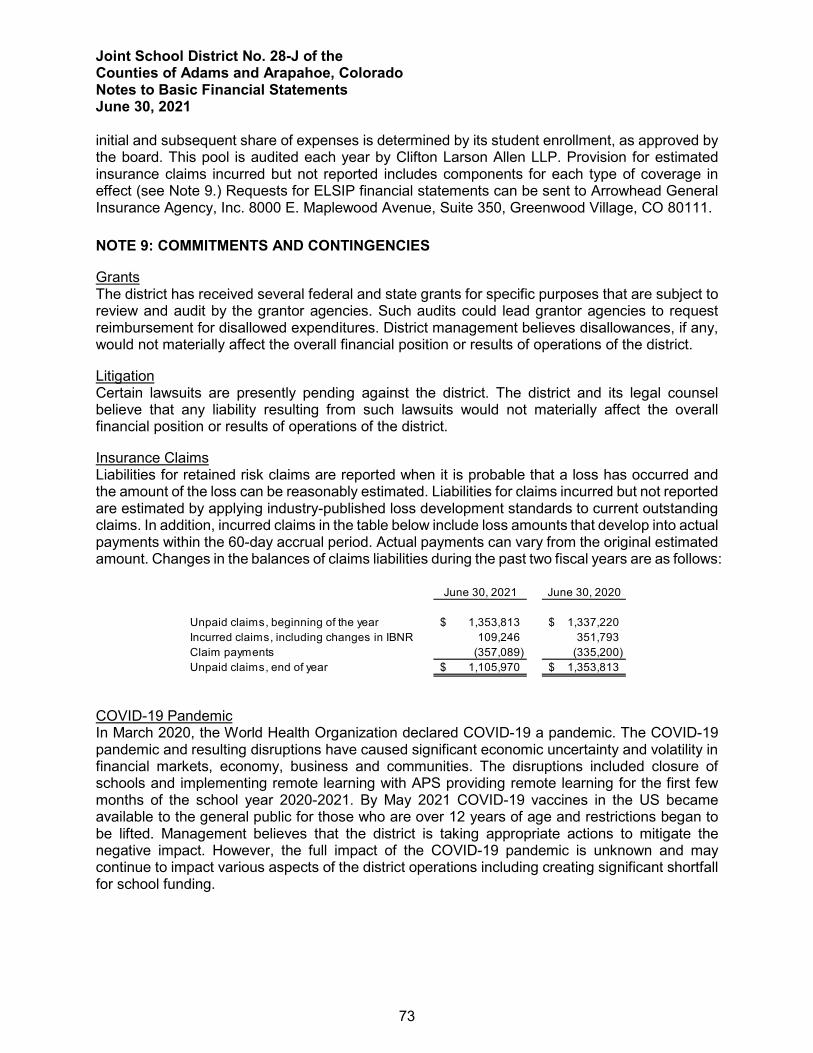
Joint School District No. 28-J of the Counties of Adams and Arapahoe, Colorado Notes to Basic Financial Statements June 30, 2021
73
initial and subsequent share of expenses is determined by its student enrollment, as approved by the board. This pool is audited each year by Clifton Larson Allen LLP. Provision for estimated insurance claims incurred but not reported includes components for each type of coverage in effect (see Note 9.) Requests for ELSIP financial statements can be sent to Arrowhead General Insurance Agency, Inc. 8000 E. Maplewood Avenue, Suite 350, Greenwood Village, CO 80111.
NOTE 9: COMMITMENTS AND CONTINGENCIES
Grants The district has received several federal and state grants for specific purposes that are subject to review and audit by the grantor agencies. Such audits could lead grantor agencies to request reimbursement for disallowed expenditures. District management believes disallowances, if any, would not materially affect the overall financial position or results of operations of the district.
Litigation Certain lawsuits are presently pending against the district. The district and its legal counsel believe that any liability resulting from such lawsuits would not materially affect the overall financial position or results of operations of the district.
Insurance Claims Liabilities for retained risk claims are reported when it is probable that a loss has occurred and the amount of the loss can be reasonably estimated. Liabilities for claims incurred but not reported are estimated by applying industry-published loss development standards to current outstanding claims. In addition, incurred claims in the table below include loss amounts that develop into actual payments within the 60-day accrual period. Actual payments can vary from the original estimated amount. Changes in the balances of claims liabilities during the past two fiscal years are as follows:
June 30, 2021 June 30, 2020
Unpaid claims, beginning of the year 1,353,813$ 1,337,220$ Incurred claims, including changes in IBNR 109,246 351,793 Claim payments (357,089) (335,200) Unpaid claims, end of year 1,105,970$ 1,353,813$
COVID-19 Pandemic In March 2020, the World Health Organization declared COVID-19 a pandemic. The COVID-19 pandemic and resulting disruptions have caused significant economic uncertainty and volatility in financial markets, economy, business and communities. The disruptions included closure of schools and implementing remote learning with APS providing remote learning for the first few months of the school year 2020-2021. By May 2021 COVID-19 vaccines in the US became available to the general public for those who are over 12 years of age and restrictions began to be lifted. Management believes that the district is taking appropriate actions to mitigate the negative impact. However, the full impact of the COVID-19 pandemic is unknown and may continue to impact various aspects of the district operations including creating significant shortfall for school funding.
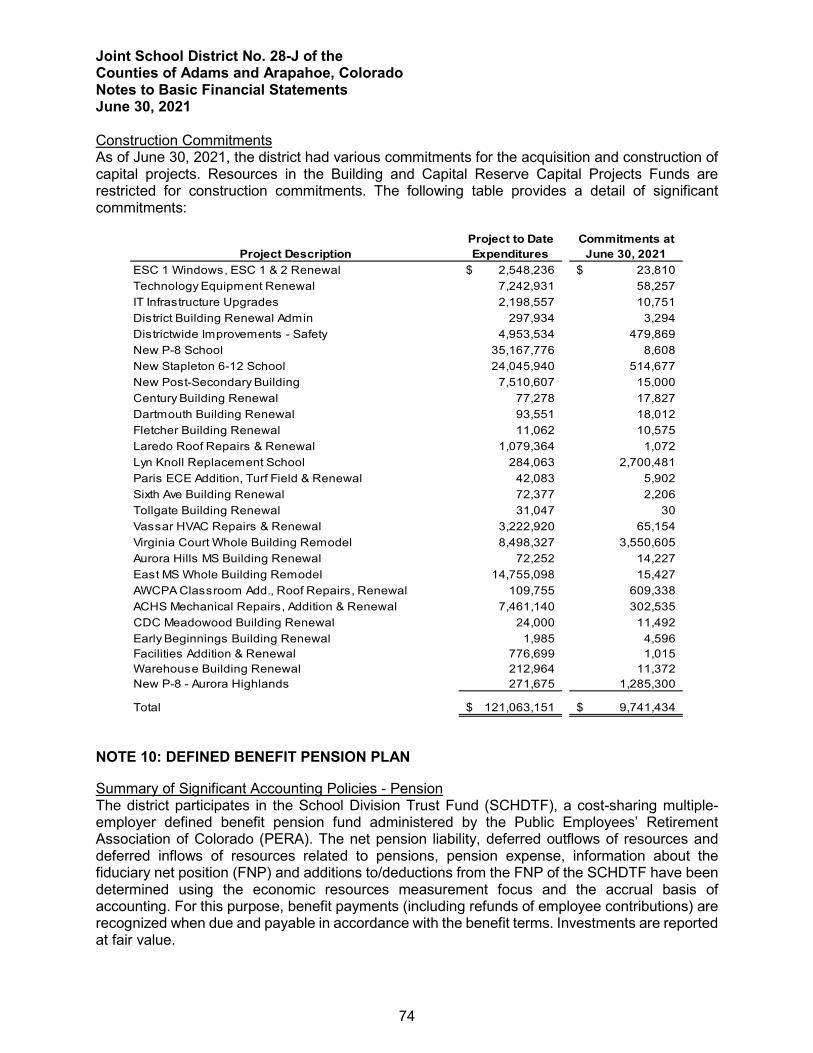
Joint School District No. 28-J of the Counties of Adams and Arapahoe, Colorado Notes to Basic Financial Statements June 30, 2021
74
Construction Commitments As of June 30, 2021, the district had various commitments for the acquisition and construction of capital projects. Resources in the Building and Capital Reserve Capital Projects Funds are restricted for construction commitments. The following table provides a detail of significant commitments:
Project to Date Commitments atProject Description Expenditures June 30, 2021
ESC 1 Windows, ESC 1 & 2 Renewal 2,548,236$ 23,810$ Technology Equipment Renewal 7,242,931 58,257 IT Infrastructure Upgrades 2,198,557 10,751 District Building Renewal Admin 297,934 3,294 Districtwide Improvements - Safety 4,953,534 479,869 New P-8 School 35,167,776 8,608 New Stapleton 6-12 School 24,045,940 514,677 New Post-Secondary Building 7,510,607 15,000 Century Building Renewal 77,278 17,827 Dartmouth Building Renewal 93,551 18,012 Fletcher Building Renewal 11,062 10,575 Laredo Roof Repairs & Renewal 1,079,364 1,072 Lyn Knoll Replacement School 284,063 2,700,481 Paris ECE Addition, Turf Field & Renewal 42,083 5,902 Sixth Ave Building Renewal 72,377 2,206 Tollgate Building Renewal 31,047 30 Vassar HVAC Repairs & Renewal 3,222,920 65,154 Virginia Court Whole Building Remodel 8,498,327 3,550,605 Aurora Hills MS Building Renewal 72,252 14,227 East MS Whole Building Remodel 14,755,098 15,427 AWCPA Classroom Add., Roof Repairs, Renewal 109,755 609,338 ACHS Mechanical Repairs, Addition & Renewal 7,461,140 302,535 CDC Meadowood Building Renewal 24,000 11,492 Early Beginnings Building Renewal 1,985 4,596 Facilities Addition & Renewal 776,699 1,015 Warehouse Building Renewal 212,964 11,372 New P-8 - Aurora Highlands 271,675 1,285,300
Total 121,063,151$ 9,741,434$
NOTE 10: DEFINED BENEFIT PENSION PLAN
Summary of Significant Accounting Policies - Pension The district participates in the School Division Trust Fund (SCHDTF), a cost-sharing multiple-employer defined benefit pension fund administered by the Public Employees’ Retirement Association of Colorado (PERA). The net pension liability, deferred outflows of resources and deferred inflows of resources related to pensions, pension expense, information about the fiduciary net position (FNP) and additions to/deductions from the FNP of the SCHDTF have been determined using the economic resources measurement focus and the accrual basis of accounting. For this purpose, benefit payments (including refunds of employee contributions) are recognized when due and payable in accordance with the benefit terms. Investments are reported at fair value.
Joint School District No. 28-J of the Counties of Adams and Arapahoe, Colorado Notes to Basic Financial Statements June 30, 2021
75
The Colorado General Assembly passed significant pension reform through Senate Bill (SB) 18-200: Concerning Modifications to the Public Employees’ Retirement Association Hybrid Defined Benefit Plan Necessary to Eliminate with a High Probability the Unfunded Liability of the Plan Within the Next Thirty Years. The bill was signed into law by Governor Hickenlooper on June 4, 2018. SB 18-200 makes changes to certain benefit provisions. Most of these changes were in effect as of June 30, 2021.
General Information about the Pension Plan Plan description. Eligible employees of the district are provided with pensions through SCHDTF—a cost-sharing multiple-employer defined benefit pension plan administered by PERA. Plan benefits are specified in Title 24, Article 51 of the Colorado Revised Statutes (C.R.S.), administrative rules set forth at 8 C.C.R. 1502-1, and applicable provisions of the federal Internal Revenue Code. Colorado State law provisions may be amended from time to time by the Colorado General Assembly. PERA issues a publicly available comprehensive annual financial report (CAFR) that can be obtained at www.copera.org/investments/pera-financial-reports.
Benefits provided as of December 31, 2020. PERA provides retirement, disability, and survivor benefits. Retirement benefits are determined by the amount of service credit earned and/or purchased, highest average salary, the benefit structure(s) under which the member retires, the benefit option selected at retirement, and age at retirement. Retirement eligibility is specified in tables set forth at C.R.S. § 24-51-602, 604, 1713, and 1714.
The lifetime retirement benefit for all eligible retiring employees under the PERA benefit structure is the greater of the:
• Highest average salary multiplied by 2.5 percent and then multiplied by years of service credit.
• The value of the retiring employee’s member contribution account plus a 100 percent match on eligible amounts as of the retirement date. This amount is then annuitized into a monthly benefit based on life expectancy and other actuarial factors.
In all cases the service retirement benefit is limited to 100 percent of highest average salary and also cannot exceed the maximum benefit allowed by federal Internal Revenue Code.
Members may elect to withdraw their member contribution accounts upon termination of employment with all PERA employers; waiving rights to any lifetime retirement benefits earned. If eligible, the member may receive a match of either 50 percent or 100 percent on eligible amounts depending on when contributions were remitted to PERA, the date employment was terminated, whether 5 years of service credit has been obtained and the benefit structure under which contributions were made. As of December 31, 2020, benefit recipients who elect to receive a lifetime retirement benefit are generally eligible to receive post-retirement cost-of-living adjustments, referred to as annual increases in the C.R.S., once certain criteria are met. Pursuant to SB 18-200, eligible benefit recipients under the PERA benefit structure who began membership before January 1, 2007, and all eligible benefit recipients of the Denver Public Schools (DPS) benefit structure will receive an annual increase of 1.25 percent unless adjusted by the automatic adjustment provision (AAP) pursuant to C.R.S. § 24-51-413. Eligible benefit recipients under the PERA benefit structure who began membership on or after January 1, 2007, will receive the lessor of an annual increase of 1.25 percent or the average of the Consumer Price Index for Urban Wage Earners and Clerical
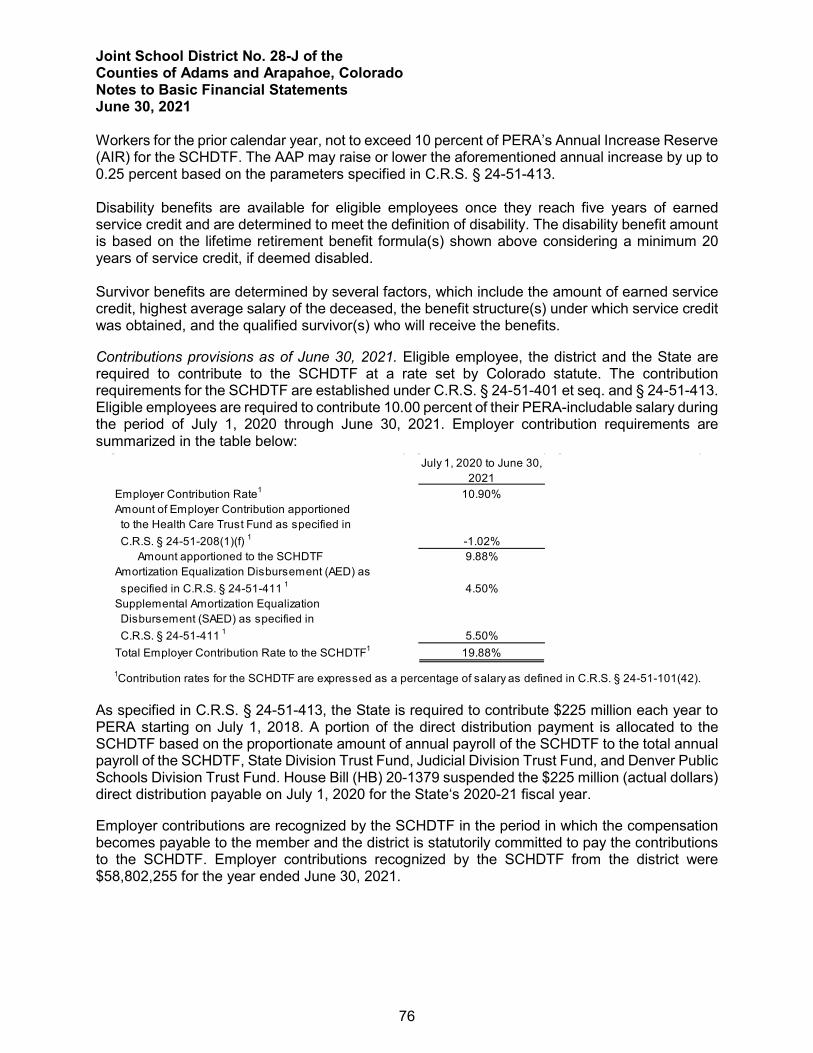
Joint School District No. 28-J of the Counties of Adams and Arapahoe, Colorado Notes to Basic Financial Statements June 30, 2021
76
Workers for the prior calendar year, not to exceed 10 percent of PERA’s Annual Increase Reserve (AIR) for the SCHDTF. The AAP may raise or lower the aforementioned annual increase by up to 0.25 percent based on the parameters specified in C.R.S. § 24-51-413. Disability benefits are available for eligible employees once they reach five years of earned service credit and are determined to meet the definition of disability. The disability benefit amount is based on the lifetime retirement benefit formula(s) shown above considering a minimum 20 years of service credit, if deemed disabled. Survivor benefits are determined by several factors, which include the amount of earned service credit, highest average salary of the deceased, the benefit structure(s) under which service credit was obtained, and the qualified survivor(s) who will receive the benefits.
Contributions provisions as of June 30, 2021. Eligible employee, the district and the State are required to contribute to the SCHDTF at a rate set by Colorado statute. The contribution requirements for the SCHDTF are established under C.R.S. § 24-51-401 et seq. and § 24-51-413. Eligible employees are required to contribute 10.00 percent of their PERA-includable salary during the period of July 1, 2020 through June 30, 2021. Employer contribution requirements are summarized in the table below:
July 1, 2020 to June 30, 2021
Employer Contribution Rate1 10.90%Amount of Employer Contribution apportioned to the Health Care Trust Fund as specified in C.R.S. § 24-51-208(1)(f) 1 -1.02%
Amount apportioned to the SCHDTF 9.88%Amortization Equalization Disbursement (AED) as specified in C.R.S. § 24-51-411 1 4.50%Supplemental Amortization Equalization Disbursement (SAED) as specified in C.R.S. § 24-51-411 1 5.50%Total Employer Contribution Rate to the SCHDTF1 19.88%
1Contribution rates for the SCHDTF are expressed as a percentage of salary as defined in C.R.S. § 24-51-101(42).
As specified in C.R.S. § 24-51-413, the State is required to contribute $225 million each year to PERA starting on July 1, 2018. A portion of the direct distribution payment is allocated to the SCHDTF based on the proportionate amount of annual payroll of the SCHDTF to the total annual payroll of the SCHDTF, State Division Trust Fund, Judicial Division Trust Fund, and Denver Public Schools Division Trust Fund. House Bill (HB) 20-1379 suspended the $225 million (actual dollars) direct distribution payable on July 1, 2020 for the State‘s 2020-21 fiscal year.
Employer contributions are recognized by the SCHDTF in the period in which the compensation becomes payable to the member and the district is statutorily committed to pay the contributions to the SCHDTF. Employer contributions recognized by the SCHDTF from the district were $58,802,255 for the year ended June 30, 2021.

Joint School District No. 28-J of the Counties of Adams and Arapahoe, Colorado Notes to Basic Financial Statements June 30, 2021
77
Pension Liabilities, Pension Expense, Deferred Outflows of Resources, and Deferred Inflows of Resources Related to Pensions The net pension liability for the SCHDTF was measured as of December 31, 2020, and the total pension liability used to calculate the net pension liability was determined by an actuarial valuation as of December 31, 2019. Standard update procedures were used to roll-forward the total pension liability to December 31, 2020. The district proportion of the net pension liability was based on the district contributions to the SCHDTF for the calendar year 2020 relative to the total contributions of participating employers and the State as a nonemployer contributing entity.
Due to the aforementioned suspension of the July 1, 2020, direct distribution payment, the nonemployer contributing entity's proportion is zero percent. Pursuant to C.R.S. § 24-51-414, the direct distribution payment from the State of Colorado is to recommence annually starting on July 1, 2021. For purposes of GASB 68 paragraph 15, a circumstance exists in which a nonemployer contributing entity is legally responsible for making contributions to the SCHDTF and is considered to meet the definition of a special funding situation.
At June 30, 2021, the district reported a liability of $795,638,277 for its proportionate share of the net pension liability.
At December 31, 2020, the districts proportion was 5.263 percent, which was an increase of 0.839 percent from its proportionate share measured as of December 31, 2019.
For the year ended June 30, 2021, the district recognized its own portion of pension expense credit of $130,511,449.
At June 30, 2021, the district reported deferred outflows of resources and deferred inflows of resources related to pensions from the following sources:
Deferred Outflowsof Resources
Deferred Inflowsof Resources
Difference between expected and actual experience 43,716,367$ -$ Changes of assumptions or other inputs 76,537,931 133,740,061 Net difference between projected and actual earnings on pension plan investments - 175,138,086 Changes in proportion and differences between contributions recognized and proportionate share of contributions 151,172,954 33,535,728 Contributions subsequent to the measurement date 30,065,237 -
Total 301,492,489$ 342,413,875$
The $30,065,237 reported as deferred outflows of resources related to pensions, resulting from contributions subsequent to the measurement date, will be recognized as a reduction of the net pension liability in the year ending June 30, 2021. Other amounts reported as deferred outflows
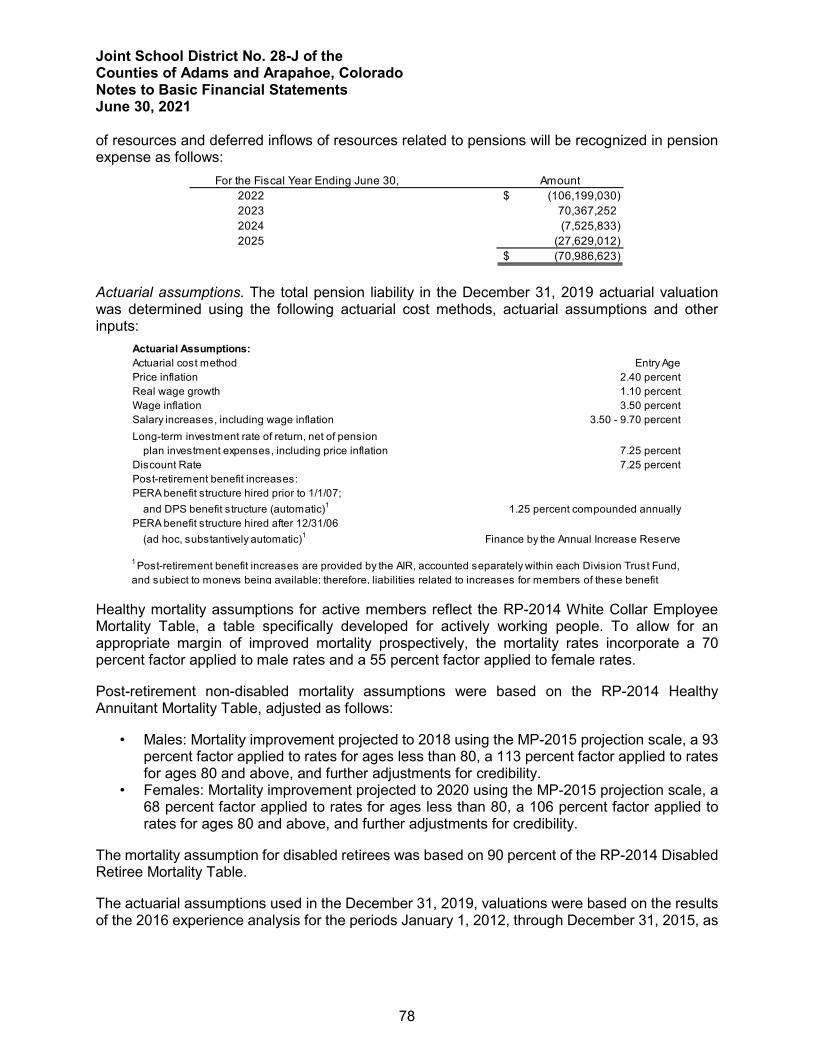
Joint School District No. 28-J of the Counties of Adams and Arapahoe, Colorado Notes to Basic Financial Statements June 30, 2021
78
of resources and deferred inflows of resources related to pensions will be recognized in pension expense as follows:
For the Fiscal Year Ending June 30, Amount2022 (106,199,030)$ 2023 70,367,252 2024 (7,525,833) 2025 (27,629,012)
(70,986,623)$
Actuarial assumptions. The total pension liability in the December 31, 2019 actuarial valuation was determined using the following actuarial cost methods, actuarial assumptions and other inputs:
Actuarial Assumptions:Actuarial cost method Entry AgePrice inflationReal wage growthWage inflationSalary increases, including wage inflationLong-term investment rate of return, net of pension plan investment expenses, including price inflationDiscount Rate 7.25 percentPost-retirement benefit increases:PERA benefit structure hired prior to 1/1/07; and DPS benefit structure (automatic)1
PERA benefit structure hired after 12/31/06 (ad hoc, substantively automatic)1
Finance by the Annual Increase Reserve
2.40 percent1.10 percent3.50 percent
3.50 - 9.70 percent
7.25 percent
1.25 percent compounded annually
1 Post-retirement benefit increases are provided by the AIR, accounted separately within each Division Trust Fund, and subject to moneys being available; therefore, liabilities related to increases for members of these benefit
Healthy mortality assumptions for active members reflect the RP-2014 White Collar Employee Mortality Table, a table specifically developed for actively working people. To allow for an appropriate margin of improved mortality prospectively, the mortality rates incorporate a 70 percent factor applied to male rates and a 55 percent factor applied to female rates.
Post-retirement non-disabled mortality assumptions were based on the RP-2014 Healthy Annuitant Mortality Table, adjusted as follows:
• Males: Mortality improvement projected to 2018 using the MP-2015 projection scale, a 93 percent factor applied to rates for ages less than 80, a 113 percent factor applied to rates for ages 80 and above, and further adjustments for credibility.
• Females: Mortality improvement projected to 2020 using the MP-2015 projection scale, a 68 percent factor applied to rates for ages less than 80, a 106 percent factor applied to rates for ages 80 and above, and further adjustments for credibility.
The mortality assumption for disabled retirees was based on 90 percent of the RP-2014 Disabled Retiree Mortality Table.
The actuarial assumptions used in the December 31, 2019, valuations were based on the results of the 2016 experience analysis for the periods January 1, 2012, through December 31, 2015, as
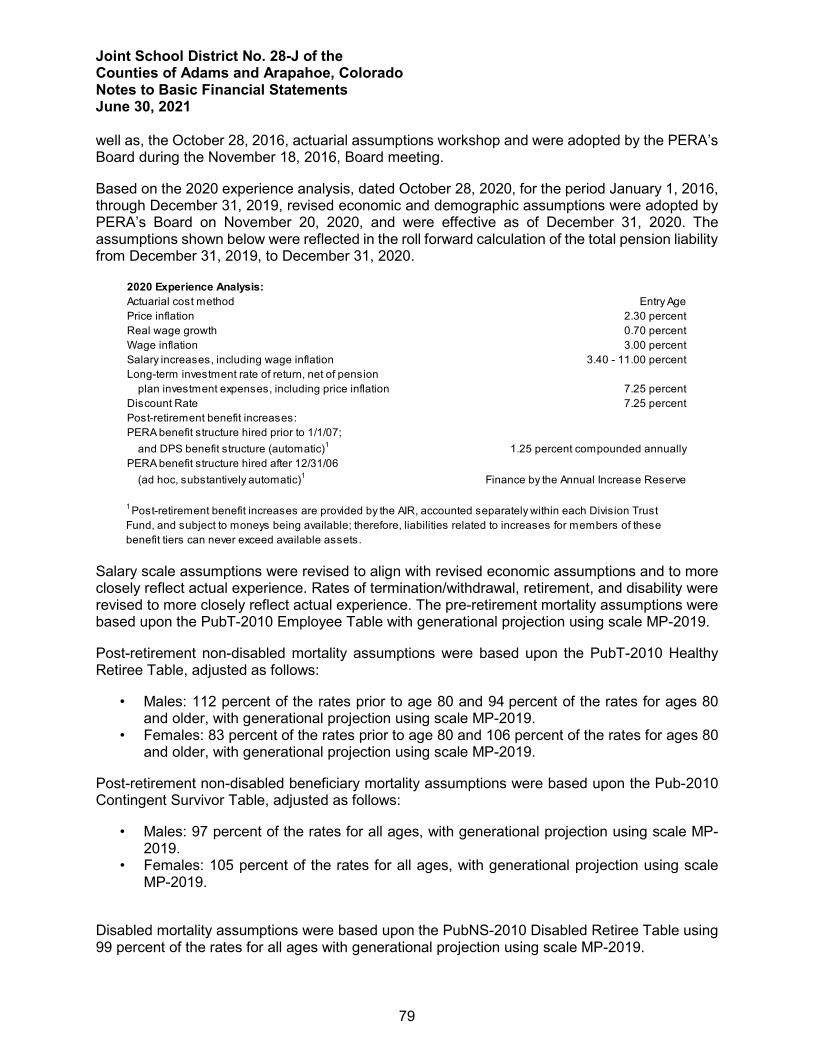
Joint School District No. 28-J of the Counties of Adams and Arapahoe, Colorado Notes to Basic Financial Statements June 30, 2021
79
well as, the October 28, 2016, actuarial assumptions workshop and were adopted by the PERA’s Board during the November 18, 2016, Board meeting.
Based on the 2020 experience analysis, dated October 28, 2020, for the period January 1, 2016, through December 31, 2019, revised economic and demographic assumptions were adopted by PERA’s Board on November 20, 2020, and were effective as of December 31, 2020. The assumptions shown below were reflected in the roll forward calculation of the total pension liability from December 31, 2019, to December 31, 2020.
2020 Experience Analysis:Actuarial cost method Entry AgePrice inflationReal wage growthWage inflationSalary increases, including wage inflationLong-term investment rate of return, net of pension plan investment expenses, including price inflationDiscount Rate 7.25 percentPost-retirement benefit increases:PERA benefit structure hired prior to 1/1/07; and DPS benefit structure (automatic)1
PERA benefit structure hired after 12/31/06 (ad hoc, substantively automatic)1
7.25 percent
1.25 percent compounded annually
Finance by the Annual Increase Reserve
1 Post-retirement benefit increases are provided by the AIR, accounted separately within each Division Trust Fund, and subject to moneys being available; therefore, liabilities related to increases for members of these benefit tiers can never exceed available assets.
2.30 percent0.70 percent3.00 percent
3.40 - 11.00 percent
Salary scale assumptions were revised to align with revised economic assumptions and to more closely reflect actual experience. Rates of termination/withdrawal, retirement, and disability were revised to more closely reflect actual experience. The pre-retirement mortality assumptions were based upon the PubT-2010 Employee Table with generational projection using scale MP-2019.
Post-retirement non-disabled mortality assumptions were based upon the PubT-2010 Healthy Retiree Table, adjusted as follows:
• Males: 112 percent of the rates prior to age 80 and 94 percent of the rates for ages 80 and older, with generational projection using scale MP-2019.
• Females: 83 percent of the rates prior to age 80 and 106 percent of the rates for ages 80 and older, with generational projection using scale MP-2019.
Post-retirement non-disabled beneficiary mortality assumptions were based upon the Pub-2010 Contingent Survivor Table, adjusted as follows:
• Males: 97 percent of the rates for all ages, with generational projection using scale MP-2019.
• Females: 105 percent of the rates for all ages, with generational projection using scale MP-2019.
Disabled mortality assumptions were based upon the PubNS-2010 Disabled Retiree Table using 99 percent of the rates for all ages with generational projection using scale MP-2019.
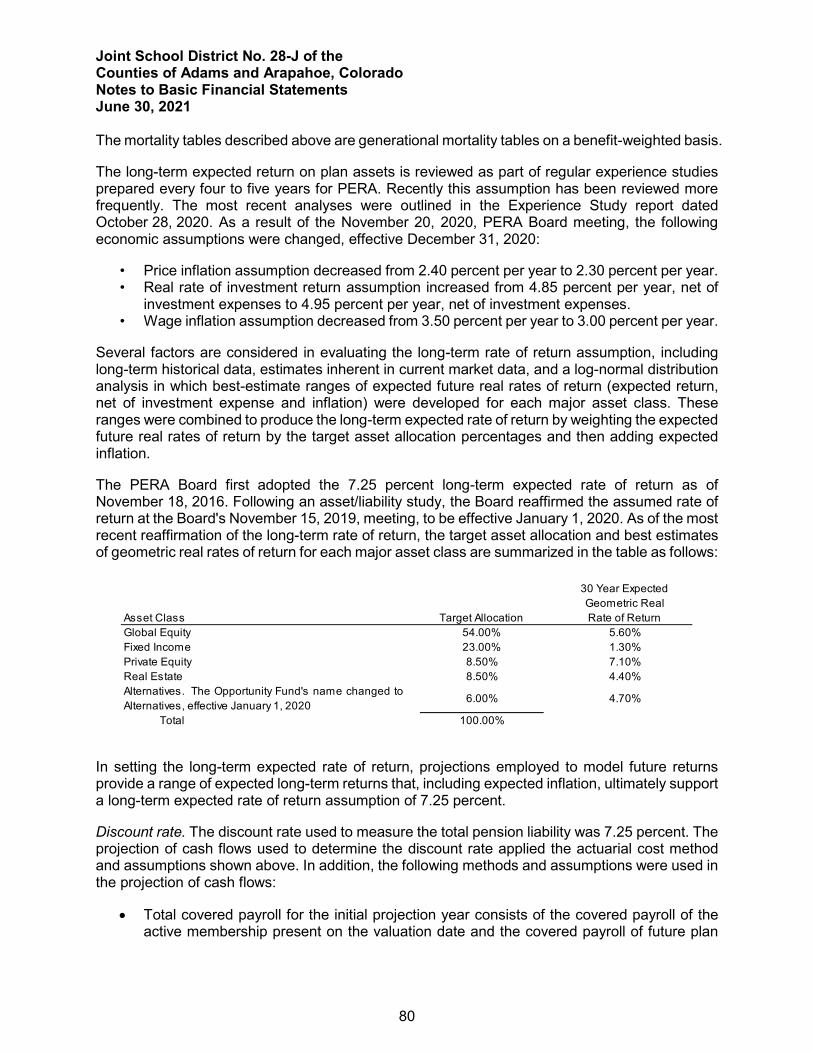
Joint School District No. 28-J of the Counties of Adams and Arapahoe, Colorado Notes to Basic Financial Statements June 30, 2021
80
The mortality tables described above are generational mortality tables on a benefit-weighted basis.
The long-term expected return on plan assets is reviewed as part of regular experience studies prepared every four to five years for PERA. Recently this assumption has been reviewed more frequently. The most recent analyses were outlined in the Experience Study report dated October 28, 2020. As a result of the November 20, 2020, PERA Board meeting, the following economic assumptions were changed, effective December 31, 2020:
• Price inflation assumption decreased from 2.40 percent per year to 2.30 percent per year. • Real rate of investment return assumption increased from 4.85 percent per year, net of
investment expenses to 4.95 percent per year, net of investment expenses. • Wage inflation assumption decreased from 3.50 percent per year to 3.00 percent per year.
Several factors are considered in evaluating the long-term rate of return assumption, including long-term historical data, estimates inherent in current market data, and a log-normal distribution analysis in which best-estimate ranges of expected future real rates of return (expected return, net of investment expense and inflation) were developed for each major asset class. These ranges were combined to produce the long-term expected rate of return by weighting the expected future real rates of return by the target asset allocation percentages and then adding expected inflation.
The PERA Board first adopted the 7.25 percent long-term expected rate of return as of November 18, 2016. Following an asset/liability study, the Board reaffirmed the assumed rate of return at the Board's November 15, 2019, meeting, to be effective January 1, 2020. As of the most recent reaffirmation of the long-term rate of return, the target asset allocation and best estimates of geometric real rates of return for each major asset class are summarized in the table as follows:
Asset Class Target Allocation
30 Year ExpectedGeometric RealRate of Return
Global Equity 54.00% 5.60%Fixed Income 23.00% 1.30%Private Equity 8.50% 7.10%Real Estate 8.50% 4.40%Alternatives. The Opportunity Fund's name changed toAlternatives, effective January 1, 2020 6.00% 4.70%
Total 100.00%
In setting the long-term expected rate of return, projections employed to model future returns provide a range of expected long-term returns that, including expected inflation, ultimately support a long-term expected rate of return assumption of 7.25 percent.
Discount rate. The discount rate used to measure the total pension liability was 7.25 percent. The projection of cash flows used to determine the discount rate applied the actuarial cost method and assumptions shown above. In addition, the following methods and assumptions were used in the projection of cash flows:
• Total covered payroll for the initial projection year consists of the covered payroll of the active membership present on the valuation date and the covered payroll of future plan
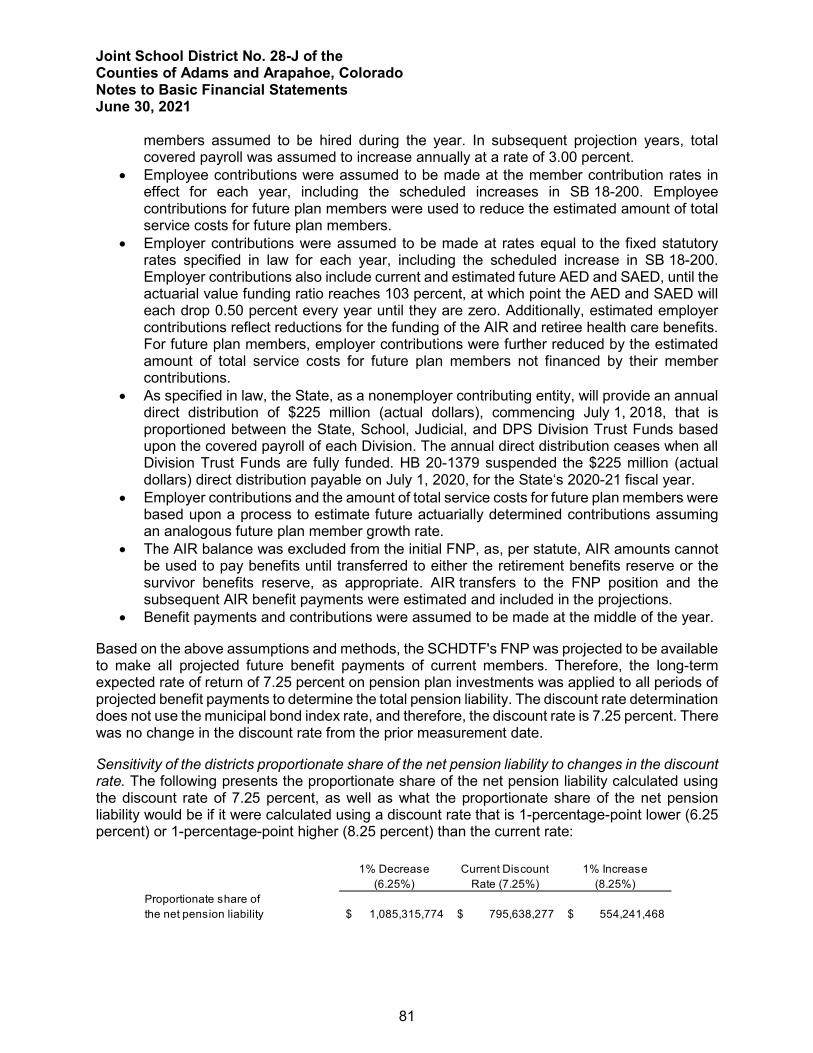
Joint School District No. 28-J of the Counties of Adams and Arapahoe, Colorado Notes to Basic Financial Statements June 30, 2021
81
members assumed to be hired during the year. In subsequent projection years, total covered payroll was assumed to increase annually at a rate of 3.00 percent.
• Employee contributions were assumed to be made at the member contribution rates in effect for each year, including the scheduled increases in SB 18-200. Employee contributions for future plan members were used to reduce the estimated amount of total service costs for future plan members.
• Employer contributions were assumed to be made at rates equal to the fixed statutory rates specified in law for each year, including the scheduled increase in SB 18-200. Employer contributions also include current and estimated future AED and SAED, until the actuarial value funding ratio reaches 103 percent, at which point the AED and SAED will each drop 0.50 percent every year until they are zero. Additionally, estimated employer contributions reflect reductions for the funding of the AIR and retiree health care benefits. For future plan members, employer contributions were further reduced by the estimated amount of total service costs for future plan members not financed by their member contributions.
• As specified in law, the State, as a nonemployer contributing entity, will provide an annual direct distribution of $225 million (actual dollars), commencing July 1, 2018, that is proportioned between the State, School, Judicial, and DPS Division Trust Funds based upon the covered payroll of each Division. The annual direct distribution ceases when all Division Trust Funds are fully funded. HB 20-1379 suspended the $225 million (actual dollars) direct distribution payable on July 1, 2020, for the State‘s 2020-21 fiscal year.
• Employer contributions and the amount of total service costs for future plan members were based upon a process to estimate future actuarially determined contributions assuming an analogous future plan member growth rate.
• The AIR balance was excluded from the initial FNP, as, per statute, AIR amounts cannot be used to pay benefits until transferred to either the retirement benefits reserve or the survivor benefits reserve, as appropriate. AIR transfers to the FNP position and the subsequent AIR benefit payments were estimated and included in the projections.
• Benefit payments and contributions were assumed to be made at the middle of the year.
Based on the above assumptions and methods, the SCHDTF's FNP was projected to be available to make all projected future benefit payments of current members. Therefore, the long-term expected rate of return of 7.25 percent on pension plan investments was applied to all periods of projected benefit payments to determine the total pension liability. The discount rate determination does not use the municipal bond index rate, and therefore, the discount rate is 7.25 percent. There was no change in the discount rate from the prior measurement date.
Sensitivity of the districts proportionate share of the net pension liability to changes in the discount rate. The following presents the proportionate share of the net pension liability calculated using the discount rate of 7.25 percent, as well as what the proportionate share of the net pension liability would be if it were calculated using a discount rate that is 1-percentage-point lower (6.25 percent) or 1-percentage-point higher (8.25 percent) than the current rate:
1% Decrease (6.25%)
Current DiscountRate (7.25%)
1% Increase (8.25%)
1,085,315,774$ 795,638,277$ 554,241,468$ Proportionate share ofthe net pension liability
Joint School District No. 28-J of the Counties of Adams and Arapahoe, Colorado Notes to Basic Financial Statements June 30, 2021
82
Pension plan fiduciary net position. Detailed information about the SCHDTF’s fiduciary net position is available in PERA’s comprehensive annual financial report which can be obtained at www.copera.org/investments/pera-financial-reports.
NOTE 11: DEFINED BENEFIT OTHER POSTEMPLOYMENT BENEFIT (OPEB) PLAN
Summary of Significant Accounting Policies - Defined Benefit Other Post Employment Benefit (OPEB) The district participates in the Health Care Trust Fund (HCTF), a cost-sharing multiple-employer defined benefit OPEB fund administered by the PERA. The net OPEB liability, deferred outflows of resources and deferred inflows of resources related to OPEB, OPEB expense, information about the fiduciary net position and additions to/deductions from the fiduciary net position of the HCTF have been determined using the economic resources measurement focus and the accrual basis of accounting. For this purpose, benefits paid on behalf of health care participants are recognized when due and/or payable in accordance with the benefit terms. Investments are reported at fair value.
General Information about the OPEB Plan Plan description. Eligible employees of the district are provided with OPEB through the HCTF—a cost-sharing multiple-employer defined benefit OPEB plan administered by PERA. The HCTF is established under Title 24, Article 51, Part 12 of the Colorado Revised Statutes (C.R.S.), as amended. Colorado State law provisions may be amended from time to time by the Colorado General Assembly. Title 24, Article 51, Part 12 of the C.R.S., as amended, sets forth a framework that grants authority to the PERA Board to contract, self-insure, and authorize disbursements necessary in order to carry out the purposes of the PERACare program, including the administration of the premium subsidies. Colorado State law provisions may be amended from time to time by the Colorado General Assembly. PERA issues a publicly available comprehensive annual financial report (annual report) that can be obtained at www.copera.org/investments/pera-financial-reports.
Benefits provided. The HCTF provides a health care premium subsidy to eligible participating PERA benefit recipients and retirees who choose to enroll in one of the PERA health care plans, however, the subsidy is not available if only enrolled in the dental and/or vision plan(s). The health care premium subsidy is based upon the benefit structure under which the member retires and the member’s years of service credit. For members who retire having service credit with employers in the Denver Public Schools (DPS) Division and one or more of the other four Divisions (State, School, Local Government and Judicial), the premium subsidy is allocated between the HCTF and the Denver Public Schools Health Care Trust Fund (DPS HCTF). The basis for the amount of the premium subsidy funded by each trust fund is the percentage of the member contribution account balance from each division as it relates to the total member contribution account balance from which the retirement benefit is paid.
C.R.S. § 24-51-1202 et seq. specifies the eligibility for enrollment in the health care plans offered by PERA and the amount of the premium subsidy. The law governing a benefit recipient’s eligibility for the subsidy and the amount of the subsidy differs slightly depending under which benefit structure the benefits are calculated. All benefit recipients under the PERA benefit structure and all retirees under the DPS benefit structure are eligible for a premium subsidy, if enrolled in a health care plan under PERACare. Upon the death of a DPS benefit structure retiree, no further subsidy is paid.
Joint School District No. 28-J of the Counties of Adams and Arapahoe, Colorado Notes to Basic Financial Statements June 30, 2021
83
Enrollment in the PERACare is voluntary and is available to benefit recipients and their eligible dependents, certain surviving spouses, and divorced spouses and guardians, among others. Eligible benefit recipients may enroll into the program upon retirement, upon the occurrence of certain life events, or on an annual basis during an open enrollment period.
PERA Benefit Structure. The maximum service-based premium subsidy is $230 per month for benefit recipients who are under 65 years of age and who are not entitled to Medicare; the maximum service-based subsidy is $115 per month for benefit recipients who are 65 years of age or older or who are under 65 years of age and entitled to Medicare. The basis for the maximum service-based subsidy, in each case, is for benefit recipients with retirement benefits based on 20 or more years of service credit. There is a 5 percent reduction in the subsidy for each year less than 20. The benefit recipient pays the remaining portion of the premium to the extent the subsidy does not cover the entire amount.
For benefit recipients who have not participated in Social Security and who are not otherwise eligible for premium-free Medicare Part A for hospital-related services, C.R.S. § 24-51-1206(4) provides an additional subsidy. According to the statute, PERA cannot charge premiums to benefit recipients without Medicare Part A that are greater than premiums charged to benefit recipients with Part A for the same plan option, coverage level, and service credit. Currently, for each individual PERACare enrollee, the total premium for Medicare coverage is determined assuming plan participants have both Medicare Part A and Part B and the difference in premium cost is paid by the HCTF or the DPS HCTF on behalf of benefit recipients not covered by Medicare Part A.
Contributions. Pursuant to Title 24, Article 51, Section 208(1)(f) of the C.R.S., as amended, certain contributions are apportioned to the HCTF. PERA-affiliated employers of the State, School, Local Government, and Judicial Divisions are required to contribute at a rate of 1.02 percent of PERA-includable salary into the HCTF.
Employer contributions are recognized by the HCTF in the period in which the compensation becomes payable to the member and the district is statutorily committed to pay the contributions. Employer contributions recognized by the HCTF from the district were $3,017,047 for the year ended June 30, 2021.
OPEB Liabilities, OPEB Expense, and Deferred Outflows of Resources and Deferred Inflows of Resources Related to OPEB At June 30, 2021, the district reported a liability of $28,911,987 for its proportionate share of the net OPEB liability. The net OPEB liability for the HCTF was measured as of December 31, 2020, and the total OPEB liability used to calculate the net OPEB liability was determined by an actuarial valuation as of December 31, 2019. Standard update procedures were used to roll-forward the total OPEB liability to December 31, 2020. The district’s proportion of the net OPEB liability was based on the district’s contributions to the HCTF for the calendar year 2020 relative to the total contributions of participating employers to the HCTF.
At December 31, 2020, the district’s proportion was 3.04 percent, which was an increase of 0.15 percent from its proportion measured as of December 31, 2019.
Joint School District No. 28-J of the Counties of Adams and Arapahoe, Colorado Notes to Basic Financial Statements June 30, 2021
84
For the year ended June 30, 2021, the district recognized OPEB expense of $664,501. At June 30, 2021, the district reported deferred outflows of resources and deferred inflows of resources related to OPEB from the following sources:
Deferred Outflowsof Resources
Deferred Inflowsof Resources
Difference between expected and actual experience 76,736$ 6,356,240$ Changes of assumptions or other inputs 216,028 1,772,859 Net difference between projected and actual earnings on OPEB plan investments - 1,181,368 Changes in proportion and differences between contributions recognized and proportionate share of contributions 2,760,508 1,536,444 Contributions subsequent to the measurement date 1,542,602 -
Total 4,595,874$ 10,846,911$
The amount of $1,542,602 reported as deferred outflows of resources related to OPEB, resulting from contributions subsequent to the measurement date, will be recognized as a reduction of the net OPEB liability in the year ending June 30, 2021. Other amounts reported as deferred outflows of resources and deferred inflows of resources related to OPEB will be recognized in OPEB expense as follows:
For the Fiscal Year Ending June 30, Amount2022 (2,130,078)$ 2023 (1,964,802) 2024 (1,839,080) 2025 (1,417,542) 2026 (416,489) Thereafter (25,648)
(7,793,639)$
Actuarial assumptions. The total OPEB liability in the December 31, 2019 actuarial valuation was determined using the following actuarial cost method, actuarial assumptions and other inputs:
Actuarial Assumptions:Actuarial cost method Entry AgePrice inflationReal wage growthWage inflationSalary increases, including wage inflationLong-term investment rate of return, net of OPEB plan investment expenses, including price inflationDiscount Rate 7.25 percentHealth care cost trend rates
PERA benefit structureService-based premium subsidy
PERACare Medicare plans
Medicare Part A premiums
2.40 percent1.10 percent3.50 percent
3.50 percent in aggregate
0.00 percent8.10 percent in 2020, gradually decreasing to
4.50 percent in 20293.50 percent for 2020, gradually increasing to
4.50 percent in 2029
7.25 percent
In determining the additional liability for PERACare enrollees who are age 65 or older and who are not eligible for premium-free Medicare Part A in the December 31, 2019, valuation, the
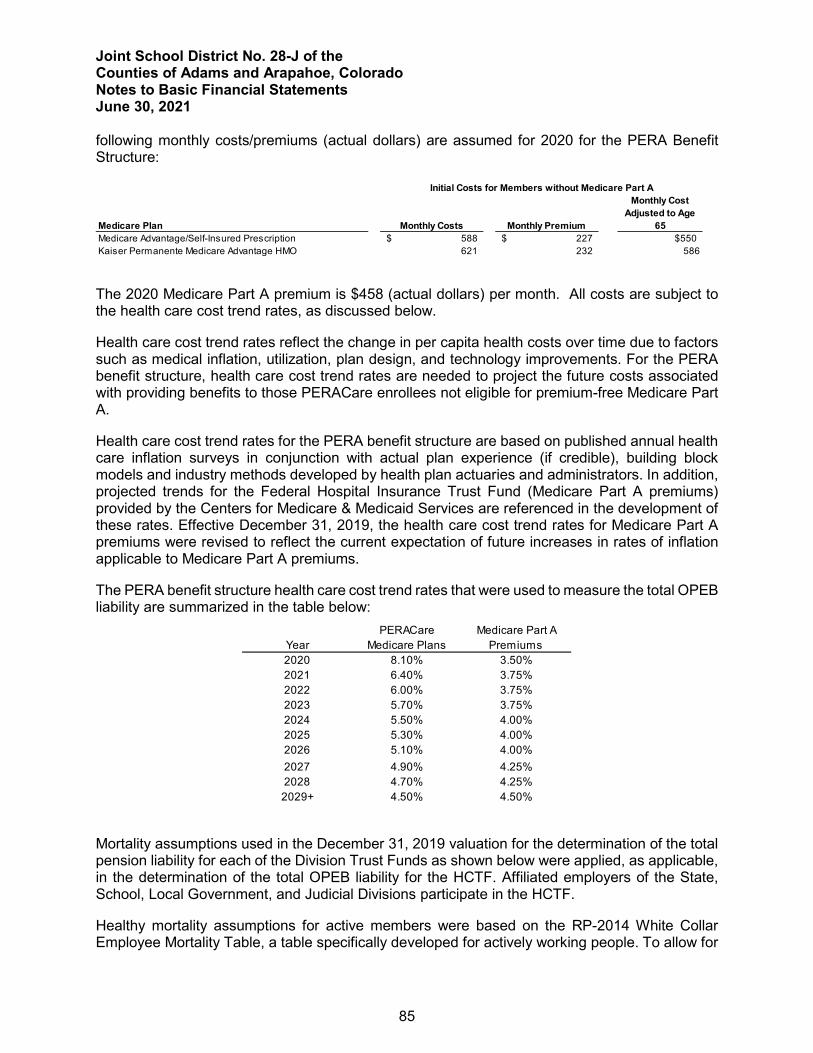
Joint School District No. 28-J of the Counties of Adams and Arapahoe, Colorado Notes to Basic Financial Statements June 30, 2021
85
following monthly costs/premiums (actual dollars) are assumed for 2020 for the PERA Benefit Structure:
Medicare Plan Monthly Costs Monthly Premium
Monthly Cost Adjusted to Age
65Medicare Advantage/Self-Insured Prescription 588$ 227$ $550Kaiser Permanente Medicare Advantage HMO 621 232 586
Initial Costs for Members without Medicare Part A
The 2020 Medicare Part A premium is $458 (actual dollars) per month. All costs are subject to the health care cost trend rates, as discussed below.
Health care cost trend rates reflect the change in per capita health costs over time due to factors such as medical inflation, utilization, plan design, and technology improvements. For the PERA benefit structure, health care cost trend rates are needed to project the future costs associated with providing benefits to those PERACare enrollees not eligible for premium-free Medicare Part A.
Health care cost trend rates for the PERA benefit structure are based on published annual health care inflation surveys in conjunction with actual plan experience (if credible), building block models and industry methods developed by health plan actuaries and administrators. In addition, projected trends for the Federal Hospital Insurance Trust Fund (Medicare Part A premiums) provided by the Centers for Medicare & Medicaid Services are referenced in the development of these rates. Effective December 31, 2019, the health care cost trend rates for Medicare Part A premiums were revised to reflect the current expectation of future increases in rates of inflation applicable to Medicare Part A premiums.
The PERA benefit structure health care cost trend rates that were used to measure the total OPEB liability are summarized in the table below:
PERACare Medicare Part AYear Medicare Plans Premiums2020 8.10% 3.50%2021 6.40% 3.75%2022 6.00% 3.75%2023 5.70% 3.75%2024 5.50% 4.00%2025 5.30% 4.00%2026 5.10% 4.00%2027 4.90% 4.25%2028 4.70% 4.25%2029+ 4.50% 4.50%
Mortality assumptions used in the December 31, 2019 valuation for the determination of the total pension liability for each of the Division Trust Funds as shown below were applied, as applicable, in the determination of the total OPEB liability for the HCTF. Affiliated employers of the State, School, Local Government, and Judicial Divisions participate in the HCTF.
Healthy mortality assumptions for active members were based on the RP-2014 White Collar Employee Mortality Table, a table specifically developed for actively working people. To allow for
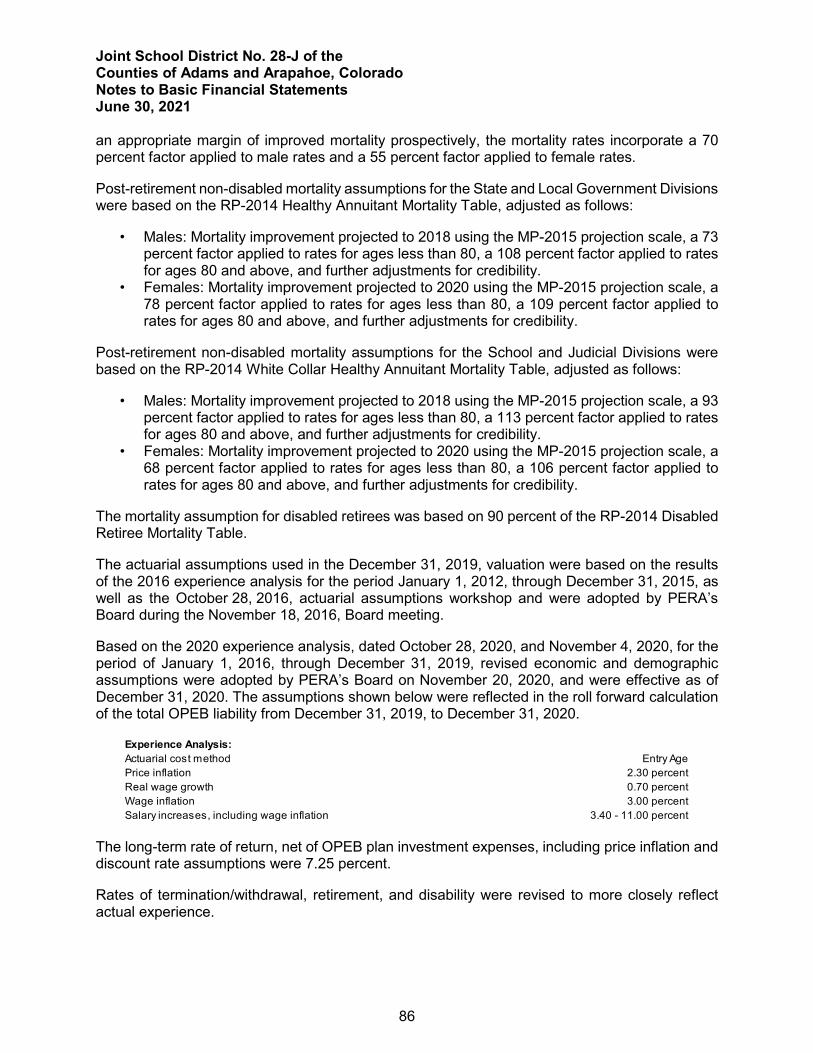
Joint School District No. 28-J of the Counties of Adams and Arapahoe, Colorado Notes to Basic Financial Statements June 30, 2021
86
an appropriate margin of improved mortality prospectively, the mortality rates incorporate a 70 percent factor applied to male rates and a 55 percent factor applied to female rates.
Post-retirement non-disabled mortality assumptions for the State and Local Government Divisions were based on the RP-2014 Healthy Annuitant Mortality Table, adjusted as follows:
• Males: Mortality improvement projected to 2018 using the MP-2015 projection scale, a 73 percent factor applied to rates for ages less than 80, a 108 percent factor applied to rates for ages 80 and above, and further adjustments for credibility.
• Females: Mortality improvement projected to 2020 using the MP-2015 projection scale, a 78 percent factor applied to rates for ages less than 80, a 109 percent factor applied to rates for ages 80 and above, and further adjustments for credibility.
Post-retirement non-disabled mortality assumptions for the School and Judicial Divisions were based on the RP-2014 White Collar Healthy Annuitant Mortality Table, adjusted as follows:
• Males: Mortality improvement projected to 2018 using the MP-2015 projection scale, a 93 percent factor applied to rates for ages less than 80, a 113 percent factor applied to rates for ages 80 and above, and further adjustments for credibility.
• Females: Mortality improvement projected to 2020 using the MP-2015 projection scale, a 68 percent factor applied to rates for ages less than 80, a 106 percent factor applied to rates for ages 80 and above, and further adjustments for credibility.
The mortality assumption for disabled retirees was based on 90 percent of the RP-2014 Disabled Retiree Mortality Table.
The actuarial assumptions used in the December 31, 2019, valuation were based on the results of the 2016 experience analysis for the period January 1, 2012, through December 31, 2015, as well as the October 28, 2016, actuarial assumptions workshop and were adopted by PERA’s Board during the November 18, 2016, Board meeting.
Based on the 2020 experience analysis, dated October 28, 2020, and November 4, 2020, for the period of January 1, 2016, through December 31, 2019, revised economic and demographic assumptions were adopted by PERA’s Board on November 20, 2020, and were effective as of December 31, 2020. The assumptions shown below were reflected in the roll forward calculation of the total OPEB liability from December 31, 2019, to December 31, 2020.
Experience Analysis:Actuarial cost method Entry AgePrice inflationReal wage growthWage inflationSalary increases, including wage inflation
2.30 percent0.70 percent3.00 percent
3.40 - 11.00 percent
The long-term rate of return, net of OPEB plan investment expenses, including price inflation and discount rate assumptions were 7.25 percent.
Rates of termination/withdrawal, retirement, and disability were revised to more closely reflect actual experience.
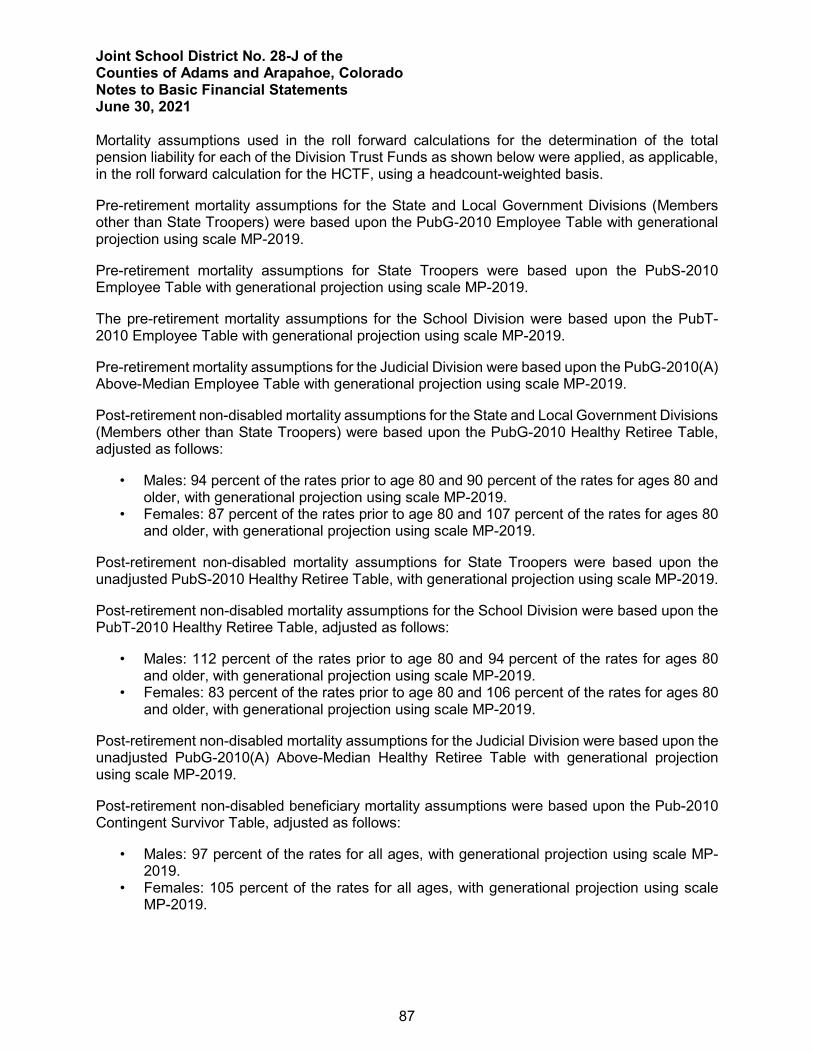
Joint School District No. 28-J of the Counties of Adams and Arapahoe, Colorado Notes to Basic Financial Statements June 30, 2021
87
Mortality assumptions used in the roll forward calculations for the determination of the total pension liability for each of the Division Trust Funds as shown below were applied, as applicable, in the roll forward calculation for the HCTF, using a headcount-weighted basis.
Pre-retirement mortality assumptions for the State and Local Government Divisions (Members other than State Troopers) were based upon the PubG-2010 Employee Table with generational projection using scale MP-2019.
Pre-retirement mortality assumptions for State Troopers were based upon the PubS-2010 Employee Table with generational projection using scale MP-2019.
The pre-retirement mortality assumptions for the School Division were based upon the PubT-2010 Employee Table with generational projection using scale MP-2019.
Pre-retirement mortality assumptions for the Judicial Division were based upon the PubG-2010(A) Above-Median Employee Table with generational projection using scale MP-2019.
Post-retirement non-disabled mortality assumptions for the State and Local Government Divisions (Members other than State Troopers) were based upon the PubG-2010 Healthy Retiree Table, adjusted as follows:
• Males: 94 percent of the rates prior to age 80 and 90 percent of the rates for ages 80 and older, with generational projection using scale MP-2019.
• Females: 87 percent of the rates prior to age 80 and 107 percent of the rates for ages 80 and older, with generational projection using scale MP-2019.
Post-retirement non-disabled mortality assumptions for State Troopers were based upon the unadjusted PubS-2010 Healthy Retiree Table, with generational projection using scale MP-2019.
Post-retirement non-disabled mortality assumptions for the School Division were based upon the PubT-2010 Healthy Retiree Table, adjusted as follows:
• Males: 112 percent of the rates prior to age 80 and 94 percent of the rates for ages 80 and older, with generational projection using scale MP-2019.
• Females: 83 percent of the rates prior to age 80 and 106 percent of the rates for ages 80 and older, with generational projection using scale MP-2019.
Post-retirement non-disabled mortality assumptions for the Judicial Division were based upon the unadjusted PubG-2010(A) Above-Median Healthy Retiree Table with generational projection using scale MP-2019.
Post-retirement non-disabled beneficiary mortality assumptions were based upon the Pub-2010 Contingent Survivor Table, adjusted as follows:
• Males: 97 percent of the rates for all ages, with generational projection using scale MP-2019.
• Females: 105 percent of the rates for all ages, with generational projection using scale MP-2019.
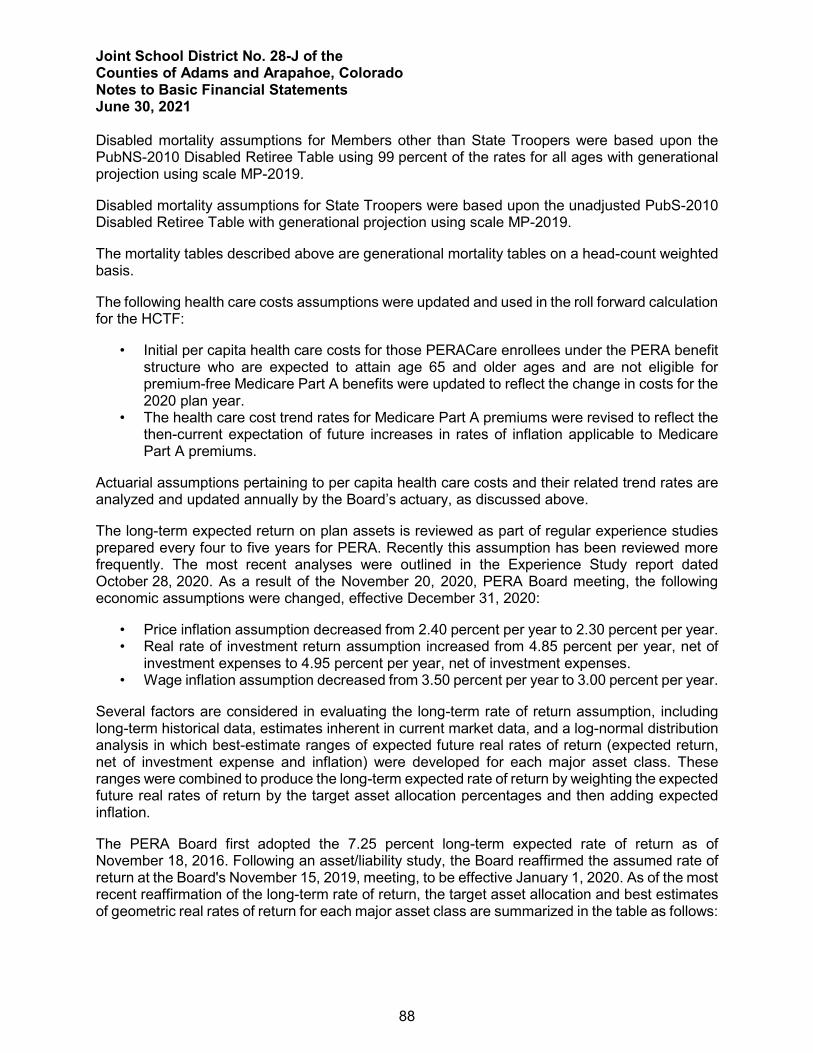
Joint School District No. 28-J of the Counties of Adams and Arapahoe, Colorado Notes to Basic Financial Statements June 30, 2021
88
Disabled mortality assumptions for Members other than State Troopers were based upon the PubNS-2010 Disabled Retiree Table using 99 percent of the rates for all ages with generational projection using scale MP-2019.
Disabled mortality assumptions for State Troopers were based upon the unadjusted PubS-2010 Disabled Retiree Table with generational projection using scale MP-2019.
The mortality tables described above are generational mortality tables on a head-count weighted basis.
The following health care costs assumptions were updated and used in the roll forward calculation for the HCTF:
• Initial per capita health care costs for those PERACare enrollees under the PERA benefit structure who are expected to attain age 65 and older ages and are not eligible for premium-free Medicare Part A benefits were updated to reflect the change in costs for the 2020 plan year.
• The health care cost trend rates for Medicare Part A premiums were revised to reflect the then-current expectation of future increases in rates of inflation applicable to Medicare Part A premiums.
Actuarial assumptions pertaining to per capita health care costs and their related trend rates are analyzed and updated annually by the Board’s actuary, as discussed above.
The long-term expected return on plan assets is reviewed as part of regular experience studies prepared every four to five years for PERA. Recently this assumption has been reviewed more frequently. The most recent analyses were outlined in the Experience Study report dated October 28, 2020. As a result of the November 20, 2020, PERA Board meeting, the following economic assumptions were changed, effective December 31, 2020:
• Price inflation assumption decreased from 2.40 percent per year to 2.30 percent per year. • Real rate of investment return assumption increased from 4.85 percent per year, net of
investment expenses to 4.95 percent per year, net of investment expenses. • Wage inflation assumption decreased from 3.50 percent per year to 3.00 percent per year.
Several factors are considered in evaluating the long-term rate of return assumption, including long-term historical data, estimates inherent in current market data, and a log-normal distribution analysis in which best-estimate ranges of expected future real rates of return (expected return, net of investment expense and inflation) were developed for each major asset class. These ranges were combined to produce the long-term expected rate of return by weighting the expected future real rates of return by the target asset allocation percentages and then adding expected inflation.
The PERA Board first adopted the 7.25 percent long-term expected rate of return as of November 18, 2016. Following an asset/liability study, the Board reaffirmed the assumed rate of return at the Board's November 15, 2019, meeting, to be effective January 1, 2020. As of the most recent reaffirmation of the long-term rate of return, the target asset allocation and best estimates of geometric real rates of return for each major asset class are summarized in the table as follows:
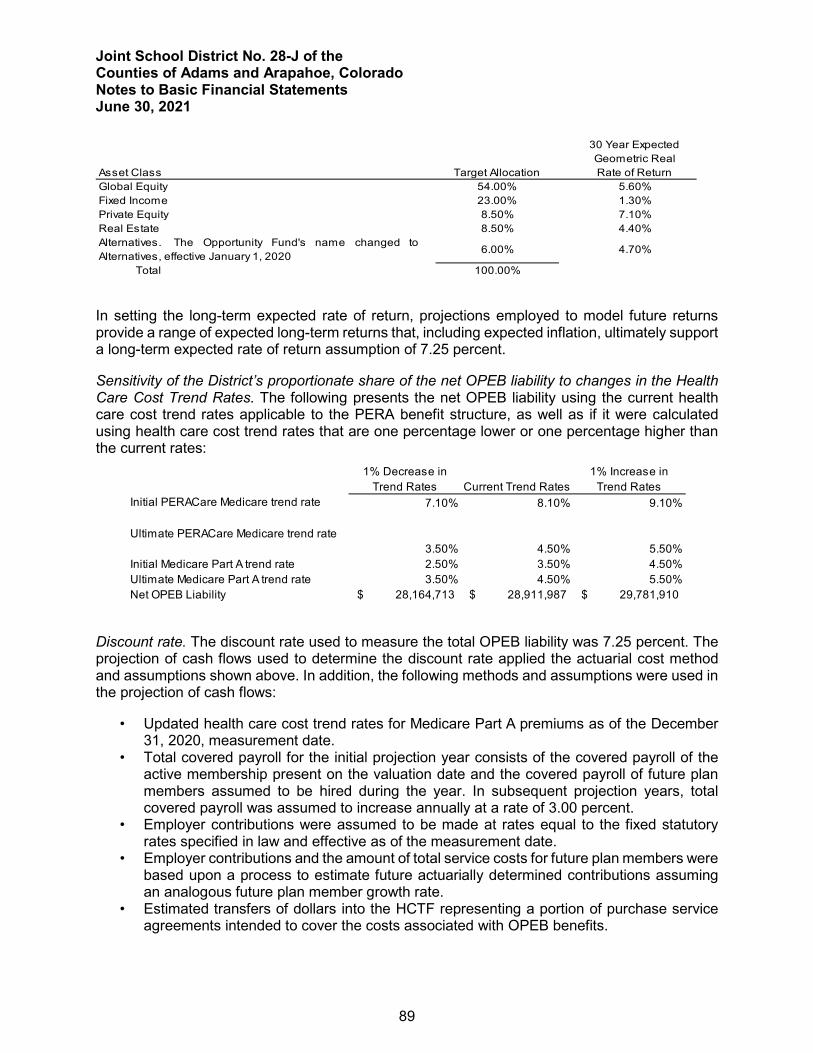
Joint School District No. 28-J of the Counties of Adams and Arapahoe, Colorado Notes to Basic Financial Statements June 30, 2021
89
Asset Class Target Allocation
30 Year ExpectedGeometric RealRate of Return
Global Equity 54.00% 5.60%Fixed Income 23.00% 1.30%Private Equity 8.50% 7.10%Real Estate 8.50% 4.40%Alternatives. The Opportunity Fund's name changed toAlternatives, effective January 1, 2020 6.00% 4.70%
Total 100.00%
In setting the long-term expected rate of return, projections employed to model future returns provide a range of expected long-term returns that, including expected inflation, ultimately support a long-term expected rate of return assumption of 7.25 percent.
Sensitivity of the District’s proportionate share of the net OPEB liability to changes in the Health Care Cost Trend Rates. The following presents the net OPEB liability using the current health care cost trend rates applicable to the PERA benefit structure, as well as if it were calculated using health care cost trend rates that are one percentage lower or one percentage higher than the current rates:
1% Decrease in Trend Rates Current Trend Rates
1% Increase in Trend Rates
Initial PERACare Medicare trend rate 7.10% 8.10% 9.10%
Ultimate PERACare Medicare trend rate3.50% 4.50% 5.50%
Initial Medicare Part A trend rate 2.50% 3.50% 4.50%Ultimate Medicare Part A trend rate 3.50% 4.50% 5.50%Net OPEB Liability 28,164,713$ 28,911,987$ 29,781,910$
Discount rate. The discount rate used to measure the total OPEB liability was 7.25 percent. The projection of cash flows used to determine the discount rate applied the actuarial cost method and assumptions shown above. In addition, the following methods and assumptions were used in the projection of cash flows:
• Updated health care cost trend rates for Medicare Part A premiums as of the December 31, 2020, measurement date.
• Total covered payroll for the initial projection year consists of the covered payroll of the active membership present on the valuation date and the covered payroll of future plan members assumed to be hired during the year. In subsequent projection years, total covered payroll was assumed to increase annually at a rate of 3.00 percent.
• Employer contributions were assumed to be made at rates equal to the fixed statutory rates specified in law and effective as of the measurement date.
• Employer contributions and the amount of total service costs for future plan members were based upon a process to estimate future actuarially determined contributions assuming an analogous future plan member growth rate.
• Estimated transfers of dollars into the HCTF representing a portion of purchase service agreements intended to cover the costs associated with OPEB benefits.
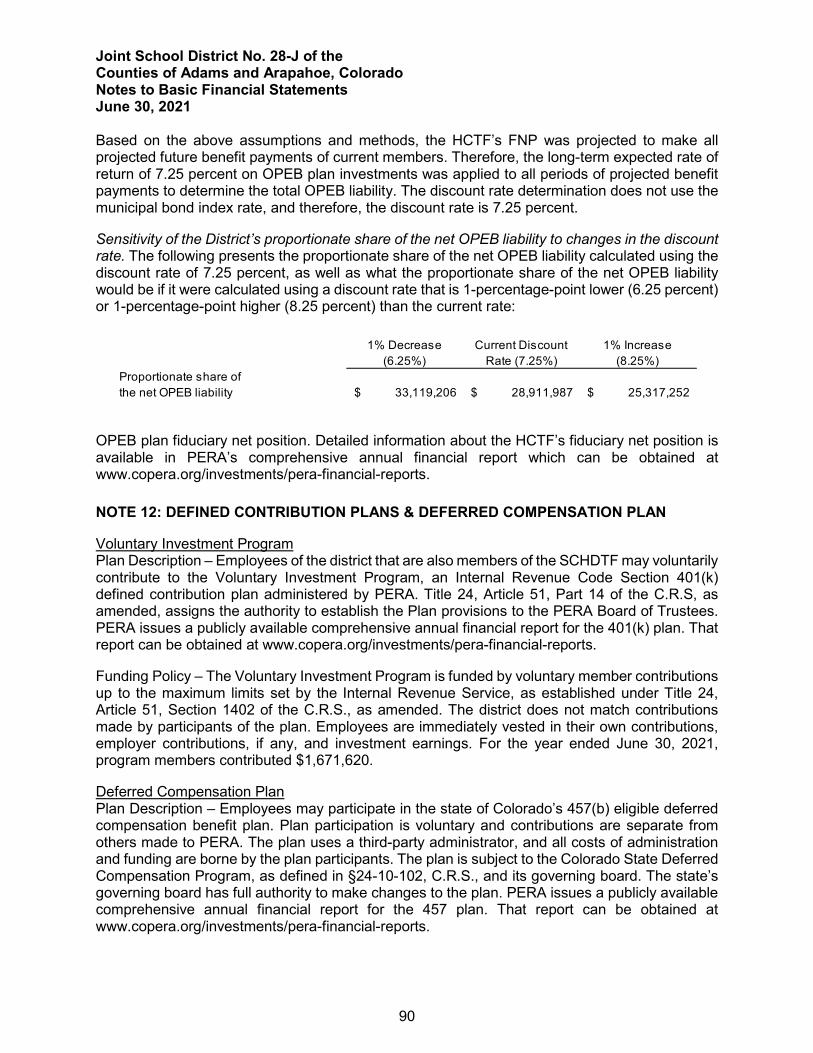
Joint School District No. 28-J of the Counties of Adams and Arapahoe, Colorado Notes to Basic Financial Statements June 30, 2021
90
Based on the above assumptions and methods, the HCTF’s FNP was projected to make all projected future benefit payments of current members. Therefore, the long-term expected rate of return of 7.25 percent on OPEB plan investments was applied to all periods of projected benefit payments to determine the total OPEB liability. The discount rate determination does not use the municipal bond index rate, and therefore, the discount rate is 7.25 percent.
Sensitivity of the District’s proportionate share of the net OPEB liability to changes in the discount rate. The following presents the proportionate share of the net OPEB liability calculated using the discount rate of 7.25 percent, as well as what the proportionate share of the net OPEB liability would be if it were calculated using a discount rate that is 1-percentage-point lower (6.25 percent) or 1-percentage-point higher (8.25 percent) than the current rate:
1% Decrease (6.25%)
Current DiscountRate (7.25%)
1% Increase (8.25%)
33,119,206$ 28,911,987$ 25,317,252$ Proportionate share ofthe net OPEB liability
OPEB plan fiduciary net position. Detailed information about the HCTF’s fiduciary net position is available in PERA’s comprehensive annual financial report which can be obtained at www.copera.org/investments/pera-financial-reports.
NOTE 12: DEFINED CONTRIBUTION PLANS & DEFERRED COMPENSATION PLAN
Voluntary Investment Program Plan Description – Employees of the district that are also members of the SCHDTF may voluntarily contribute to the Voluntary Investment Program, an Internal Revenue Code Section 401(k) defined contribution plan administered by PERA. Title 24, Article 51, Part 14 of the C.R.S, as amended, assigns the authority to establish the Plan provisions to the PERA Board of Trustees. PERA issues a publicly available comprehensive annual financial report for the 401(k) plan. That report can be obtained at www.copera.org/investments/pera-financial-reports.
Funding Policy – The Voluntary Investment Program is funded by voluntary member contributions up to the maximum limits set by the Internal Revenue Service, as established under Title 24, Article 51, Section 1402 of the C.R.S., as amended. The district does not match contributions made by participants of the plan. Employees are immediately vested in their own contributions, employer contributions, if any, and investment earnings. For the year ended June 30, 2021, program members contributed $1,671,620.
Deferred Compensation Plan Plan Description – Employees may participate in the state of Colorado’s 457(b) eligible deferred compensation benefit plan. Plan participation is voluntary and contributions are separate from others made to PERA. The plan uses a third-party administrator, and all costs of administration and funding are borne by the plan participants. The plan is subject to the Colorado State Deferred Compensation Program, as defined in §24-10-102, C.R.S., and its governing board. The state’s governing board has full authority to make changes to the plan. PERA issues a publicly available comprehensive annual financial report for the 457 plan. That report can be obtained at www.copera.org/investments/pera-financial-reports.
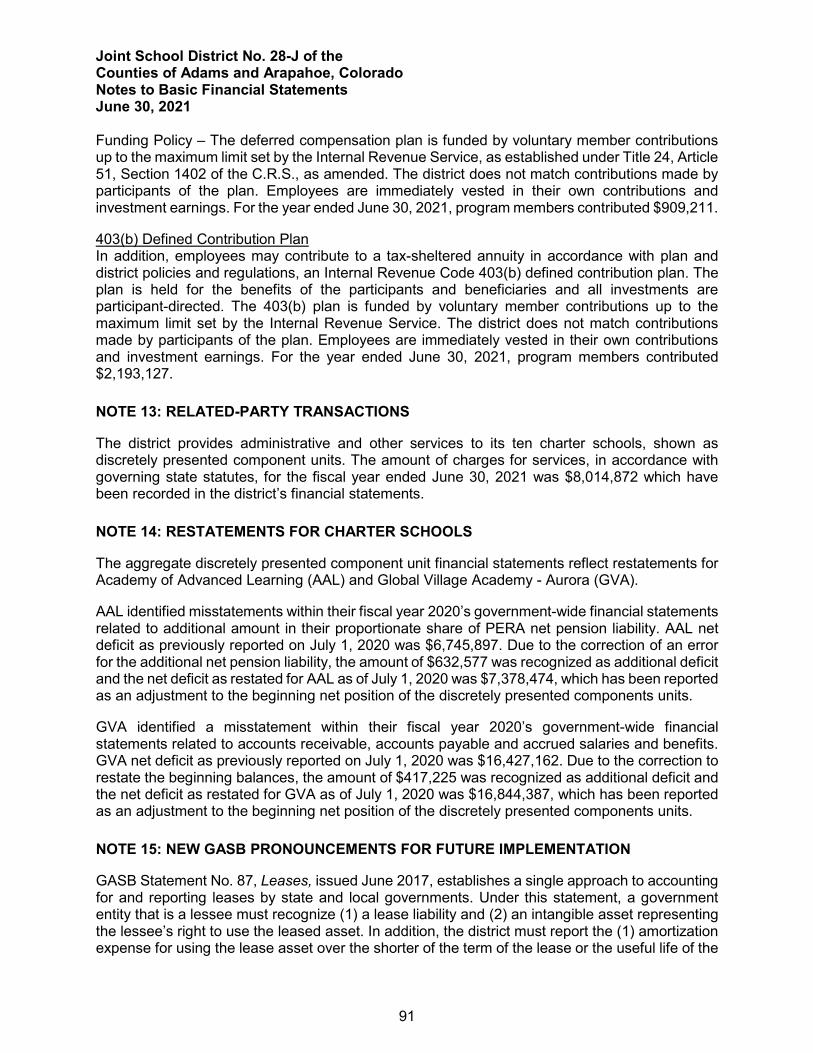
Joint School District No. 28-J of the Counties of Adams and Arapahoe, Colorado Notes to Basic Financial Statements June 30, 2021
91
Funding Policy – The deferred compensation plan is funded by voluntary member contributions up to the maximum limit set by the Internal Revenue Service, as established under Title 24, Article 51, Section 1402 of the C.R.S., as amended. The district does not match contributions made by participants of the plan. Employees are immediately vested in their own contributions and investment earnings. For the year ended June 30, 2021, program members contributed $909,211.
403(b) Defined Contribution Plan In addition, employees may contribute to a tax-sheltered annuity in accordance with plan and district policies and regulations, an Internal Revenue Code 403(b) defined contribution plan. The plan is held for the benefits of the participants and beneficiaries and all investments are participant-directed. The 403(b) plan is funded by voluntary member contributions up to the maximum limit set by the Internal Revenue Service. The district does not match contributions made by participants of the plan. Employees are immediately vested in their own contributions and investment earnings. For the year ended June 30, 2021, program members contributed $2,193,127.
NOTE 13: RELATED-PARTY TRANSACTIONS
The district provides administrative and other services to its ten charter schools, shown as discretely presented component units. The amount of charges for services, in accordance with governing state statutes, for the fiscal year ended June 30, 2021 was $8,014,872 which have been recorded in the district’s financial statements.
NOTE 14: RESTATEMENTS FOR CHARTER SCHOOLS
The aggregate discretely presented component unit financial statements reflect restatements for Academy of Advanced Learning (AAL) and Global Village Academy - Aurora (GVA).
AAL identified misstatements within their fiscal year 2020’s government-wide financial statements related to additional amount in their proportionate share of PERA net pension liability. AAL net deficit as previously reported on July 1, 2020 was $6,745,897. Due to the correction of an error for the additional net pension liability, the amount of $632,577 was recognized as additional deficit and the net deficit as restated for AAL as of July 1, 2020 was $7,378,474, which has been reported as an adjustment to the beginning net position of the discretely presented components units.
GVA identified a misstatement within their fiscal year 2020’s government-wide financial statements related to accounts receivable, accounts payable and accrued salaries and benefits. GVA net deficit as previously reported on July 1, 2020 was $16,427,162. Due to the correction to restate the beginning balances, the amount of $417,225 was recognized as additional deficit and the net deficit as restated for GVA as of July 1, 2020 was $16,844,387, which has been reported as an adjustment to the beginning net position of the discretely presented components units.
NOTE 15: NEW GASB PRONOUNCEMENTS FOR FUTURE IMPLEMENTATION
GASB Statement No. 87, Leases, issued June 2017, establishes a single approach to accounting for and reporting leases by state and local governments. Under this statement, a government entity that is a lessee must recognize (1) a lease liability and (2) an intangible asset representing the lessee’s right to use the leased asset. In addition, the district must report the (1) amortization expense for using the lease asset over the shorter of the term of the lease or the useful life of the
Joint School District No. 28-J of the Counties of Adams and Arapahoe, Colorado Notes to Basic Financial Statements June 30, 2021
92
underlying asset, (2) interest expense on the lease liability and (3) note disclosures about the lease. The Statement provides exceptions from the single-approach for short-term leases, financial purchases, leases of assets that are investments, and certain regulated leases. This Statement also addresses accounting for lease terminations and modifications, sale-leaseback transactions, non-lease components embedded in lease contracts (such as service agreements), and leases with related parties.
The issuance of GASB Statement No. 95, Postponement of the Effective Dates of Certain Authoritative Guidance, provides additional time to comply with numerous recent GASB pronouncements as a result of the COVID-19 pandemic. GASB Statement No. 95 postponed the effective date of the GASB Statement No. 87 by 18 months, as such the district will adopt GASB Statement No. 87 effective July 1, 2021.
NOTE 16: SUBSEQUENT EVENT
On July 27, 2021, the district issued General Obligation Bonds, Series 2021A, in the aggregate principal amount of $73,475,000 and General Obligation Refunding Bonds, Series 2021B, in the aggregate principal amount of $47,620,000. The interest rate on the bonds is 5.0% and the final maturity date is December 1, 2029.
Annual principal and interest payments for the General Obligation Refunding Bonds Series 2021B are due starting from December 1, 2021 to December 1, 2024 range from $11,240,000 to $12,390,000. Annual principal and interest payments for General Obligation Bonds Series 2021A are due starting from December 1, 2025 to December 1, 2029 range from $5,005,000 to $34,530,000.
93
Required Supplementary Information
Required Supplementary Information This section presents the budgetary comparison schedules for the General Fund and the Grants and Nutrition Services Funds, the major special revenue funds. It also includes schedules regarding the district’s proportionate share of PERA’s net pension liability and their annual contributions.
Budgetary Comparisons
General Fund
All activities of the district are reported in the General Fund unless there is a legal or contractual requirement to use another fund. Most instructional and administrative expenditures are processed through the General Fund. Primary revenue sources are local property taxes and state aid.
Grants Fund
This fund is used to account for revenues and expenditures related to federal, state and local grants.
Nutrition Services Fund
Nutrition Services operates the school lunch and breakfast programs and serves nutritious meals to district students and adults. In addition, summer meal programs, after school snack programs, nutrition education, in-service programs and emergency feeding sites are offered.
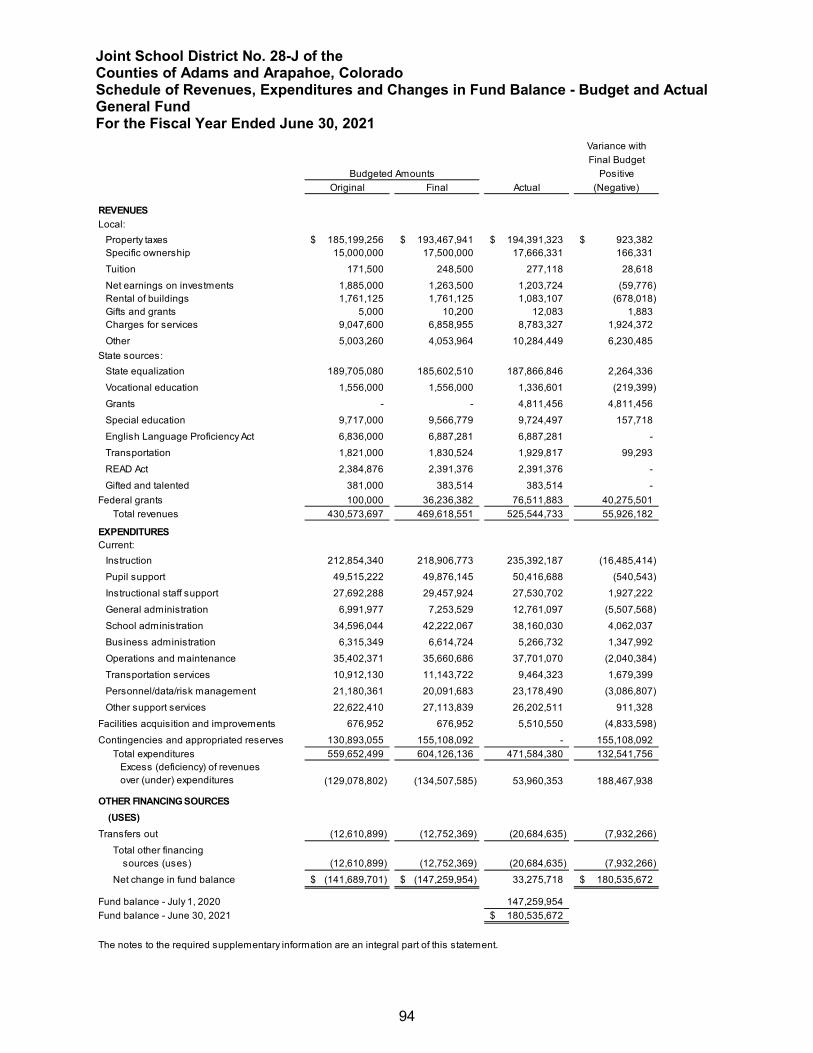
Joint School District No. 28-J of the Counties of Adams and Arapahoe, Colorado Schedule of Revenues, Expenditures and Changes in Fund Balance - Budget and Actual General Fund For the Fiscal Year Ended June 30, 2021
94
General Fund
Variance withFinal Budget
PositiveOriginal Final Actual (Negative)
REVENUESLocal:
Property taxes 185,199,256$ 193,467,941$ 194,391,323$ 923,382$ Specific ownership 15,000,000 17,500,000 17,666,331 166,331 Tuition 171,500 248,500 277,118 28,618 Net earnings on investments 1,885,000 1,263,500 1,203,724 (59,776) Rental of buildings 1,761,125 1,761,125 1,083,107 (678,018) Gifts and grants 5,000 10,200 12,083 1,883 Charges for services 9,047,600 6,858,955 8,783,327 1,924,372 Other 5,003,260 4,053,964 10,284,449 6,230,485
State sources:State equalization 189,705,080 185,602,510 187,866,846 2,264,336 Vocational education 1,556,000 1,556,000 1,336,601 (219,399) Grants - - 4,811,456 4,811,456 Special education 9,717,000 9,566,779 9,724,497 157,718 English Language Proficiency Act 6,836,000 6,887,281 6,887,281 - Transportation 1,821,000 1,830,524 1,929,817 99,293 READ Act 2,384,876 2,391,376 2,391,376 - Gifted and talented 381,000 383,514 383,514 -
Federal grants 100,000 36,236,382 76,511,883 40,275,501 Total revenues 430,573,697 469,618,551 525,544,733 55,926,182
EXPENDITURESCurrent:
Instruction 212,854,340 218,906,773 235,392,187 (16,485,414) Pupil support 49,515,222 49,876,145 50,416,688 (540,543) Instructional staff support 27,692,288 29,457,924 27,530,702 1,927,222 General administration 6,991,977 7,253,529 12,761,097 (5,507,568) School administration 34,596,044 42,222,067 38,160,030 4,062,037 Business administration 6,315,349 6,614,724 5,266,732 1,347,992 Operations and maintenance 35,402,371 35,660,686 37,701,070 (2,040,384) Transportation services 10,912,130 11,143,722 9,464,323 1,679,399 Personnel/data/risk management 21,180,361 20,091,683 23,178,490 (3,086,807) Other support services 22,622,410 27,113,839 26,202,511 911,328
Facilities acquisition and improvements 676,952 676,952 5,510,550 (4,833,598) Contingencies and appropriated reserves 130,893,055 155,108,092 - 155,108,092
Total expenditures 559,652,499 604,126,136 471,584,380 132,541,756
(129,078,802) (134,507,585) 53,960,353 188,467,938
OTHER FINANCING SOURCES(USES)
Transfers out (12,610,899) (12,752,369) (20,684,635) (7,932,266) Total other financing
sources (uses) (12,610,899) (12,752,369) (20,684,635) (7,932,266) Net change in fund balance (141,689,701)$ (147,259,954)$ 33,275,718 180,535,672$
Fund balance - July 1, 2020 147,259,954 Fund balance - June 30, 2021 180,535,672$
The notes to the required supplementary information are an integral part of this statement.
Excess (deficiency) of revenues over (under) expenditures
Budgeted Amounts
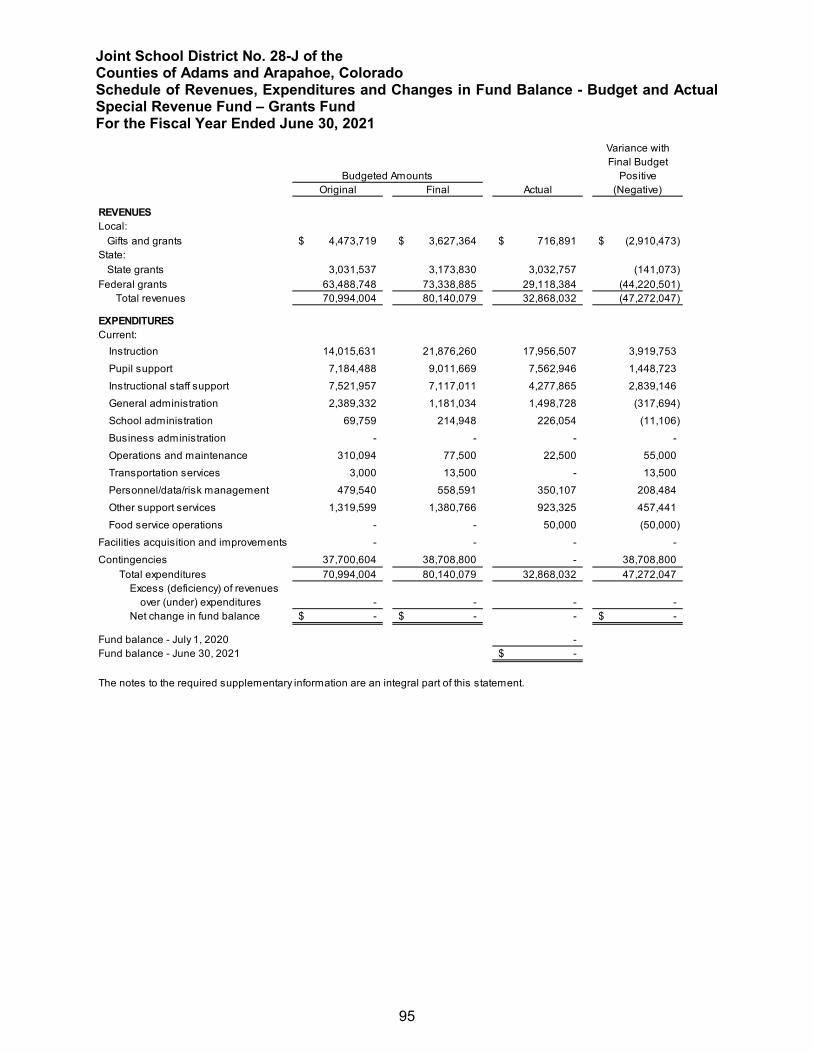
Joint School District No. 28-J of the Counties of Adams and Arapahoe, Colorado Schedule of Revenues, Expenditures and Changes in Fund Balance - Budget and Actual Special Revenue Fund – Grants Fund For the Fiscal Year Ended June 30, 2021
95
Special Revenue Fund – Grants Fund
Variance withFinal Budget
Budgeted Amounts PositiveOriginal Final Actual (Negative)
REVENUESLocal:
Gifts and grants 4,473,719$ 3,627,364$ 716,891$ (2,910,473)$ State:
State grants 3,031,537 3,173,830 3,032,757 (141,073) Federal grants 63,488,748 73,338,885 29,118,384 (44,220,501)
Total revenues 70,994,004 80,140,079 32,868,032 (47,272,047)
EXPENDITURESCurrent:
Instruction 14,015,631 21,876,260 17,956,507 3,919,753 Pupil support 7,184,488 9,011,669 7,562,946 1,448,723 Instructional staff support 7,521,957 7,117,011 4,277,865 2,839,146 General administration 2,389,332 1,181,034 1,498,728 (317,694) School administration 69,759 214,948 226,054 (11,106) Business administration - - - - Operations and maintenance 310,094 77,500 22,500 55,000 Transportation services 3,000 13,500 - 13,500 Personnel/data/risk management 479,540 558,591 350,107 208,484 Other support services 1,319,599 1,380,766 923,325 457,441 Food service operations - - 50,000 (50,000)
Facilities acquisition and improvements - - - - Contingencies 37,700,604 38,708,800 - 38,708,800
Total expenditures 70,994,004 80,140,079 32,868,032 47,272,047 Excess (deficiency) of revenues
over (under) expenditures - - - - Net change in fund balance -$ -$ - -$
Fund balance - July 1, 2020 - Fund balance - June 30, 2021 -$
The notes to the required supplementary information are an integral part of this statement.
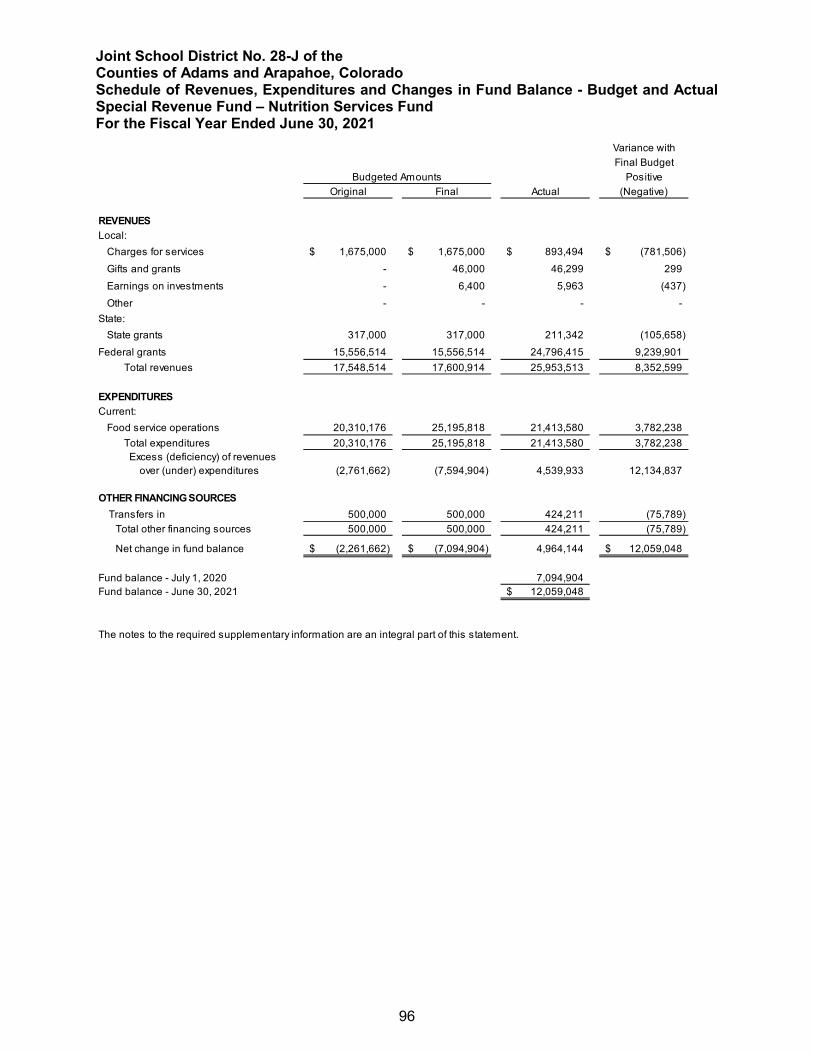
Joint School District No. 28-J of the Counties of Adams and Arapahoe, Colorado Schedule of Revenues, Expenditures and Changes in Fund Balance - Budget and Actual Special Revenue Fund – Nutrition Services Fund For the Fiscal Year Ended June 30, 2021
96
Special Revenue Fund – Nutrition Services Fund
Variance withFinal Budget
Budgeted Amounts PositiveOriginal Final Actual (Negative)
REVENUESLocal:
Charges for services 1,675,000$ 1,675,000$ 893,494$ (781,506)$ Gifts and grants - 46,000 46,299 299 Earnings on investments - 6,400 5,963 (437) Other - - - -
State:State grants 317,000 317,000 211,342 (105,658)
Federal grants 15,556,514 15,556,514 24,796,415 9,239,901 Total revenues 17,548,514 17,600,914 25,953,513 8,352,599
EXPENDITURESCurrent:
Food service operations 20,310,176 25,195,818 21,413,580 3,782,238 Total expenditures 20,310,176 25,195,818 21,413,580 3,782,238 Excess (deficiency) of revenues
over (under) expenditures (2,761,662) (7,594,904) 4,539,933 12,134,837
OTHER FINANCING SOURCESTransfers in 500,000 500,000 424,211 (75,789)
Total other financing sources 500,000 500,000 424,211 (75,789)
Net change in fund balance (2,261,662)$ (7,094,904)$ 4,964,144 12,059,048$
Fund balance - July 1, 2020 7,094,904 Fund balance - June 30, 2021 12,059,048$
The notes to the required supplementary information are an integral part of this statement.
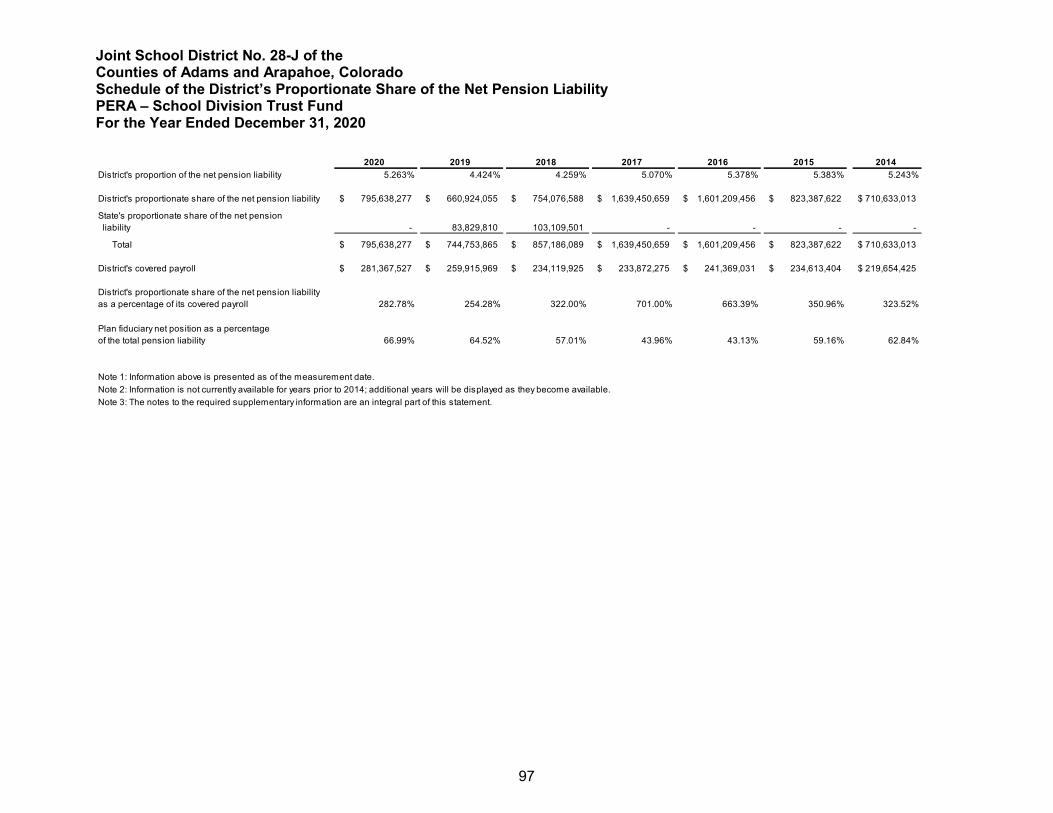
Joint School District No. 28-J of the Counties of Adams and Arapahoe, Colorado Schedule of the District’s Proportionate Share of the Net Pension Liability PERA – School Division Trust Fund For the Year Ended December 31, 2020
97
Schedule of the District’s Proportionate Share of the Net Pension Liability 2020 2019 2018 2017 2016 2015 2014
5.263% 4.424% 4.259% 5.070% 5.378% 5.383% 5.243%
795,638,277$ 660,924,055$ 754,076,588$ 1,639,450,659$ 1,601,209,456$ 823,387,622$ 710,633,013$
State's proportionate share of the net pension liability - 83,829,810 103,109,501 - - - -
Total 795,638,277$ 744,753,865$ 857,186,089$ 1,639,450,659$ 1,601,209,456$ 823,387,622$ 710,633,013$
281,367,527$ 259,915,969$ 234,119,925$ 233,872,275$ 241,369,031$ 234,613,404$ 219,654,425$
282.78% 254.28% 322.00% 701.00% 663.39% 350.96% 323.52%
66.99% 64.52% 57.01% 43.96% 43.13% 59.16% 62.84%
Note 3: The notes to the required supplementary information are an integral part of this statement.Note 2: Information is not currently available for years prior to 2014; additional years will be displayed as they become available.
District's proportionate share of the net pension liabilityas a percentage of its covered payroll
District's proportion of the net pension liability
District's proportionate share of the net pension liability
District's covered payroll
Plan fiduciary net position as a percentageof the total pension liability
Note 1: Information above is presented as of the measurement date.
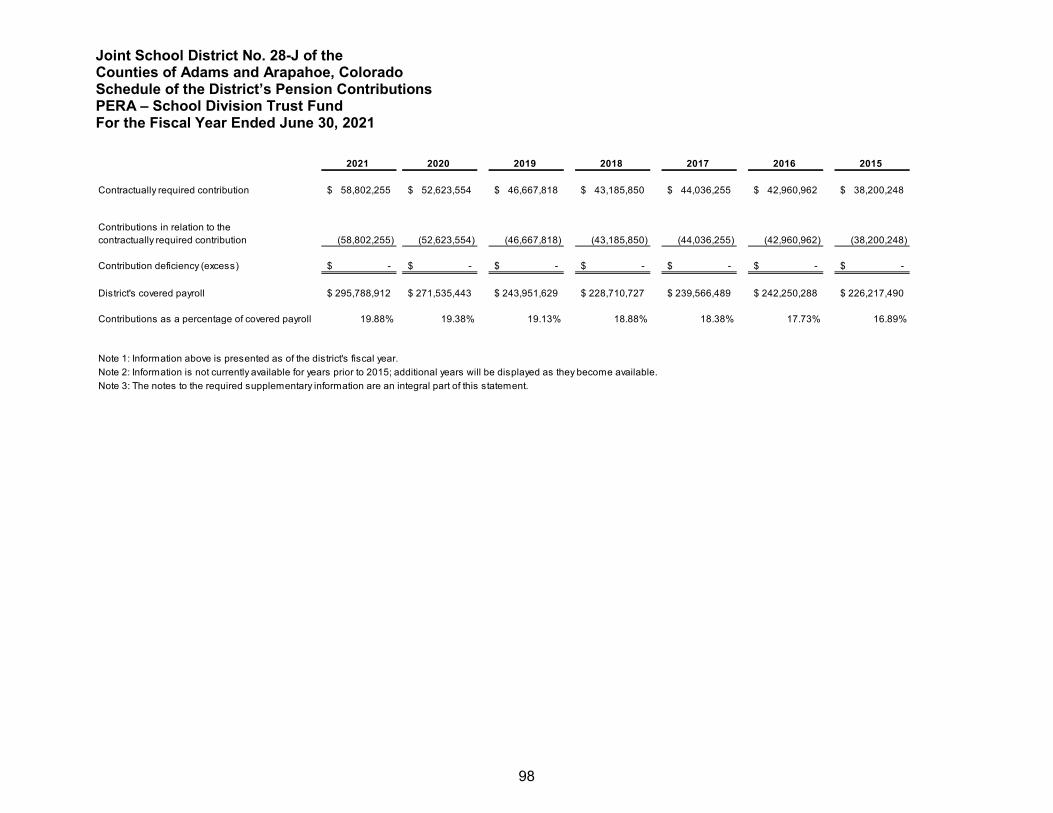
Joint School District No. 28-J of the Counties of Adams and Arapahoe, Colorado Schedule of the District’s Pension Contributions PERA – School Division Trust Fund For the Fiscal Year Ended June 30, 2021
98
Schedule of the District’s Pension Contributions
2021 2020 2019 2018 2017 2016 2015
58,802,255$ 52,623,554$ 46,667,818$ 43,185,850$ 44,036,255$ 42,960,962$ 38,200,248$
(58,802,255) (52,623,554) (46,667,818) (43,185,850) (44,036,255) (42,960,962) (38,200,248)
-$ -$ -$ -$ -$ -$ -$
295,788,912$ 271,535,443$ 243,951,629$ 228,710,727$ 239,566,489$ 242,250,288$ 226,217,490$
19.88% 19.38% 19.13% 18.88% 18.38% 17.73% 16.89%
Note 3: The notes to the required supplementary information are an integral part of this statement.Note 2: Information is not currently available for years prior to 2015; additional years will be displayed as they become available.
Contractually required contribution
Contributions in relation to the contractually required contribution
Contribution deficiency (excess)
District's covered payroll
Contributions as a percentage of covered payroll
Note 1: Information above is presented as of the district's fiscal year.
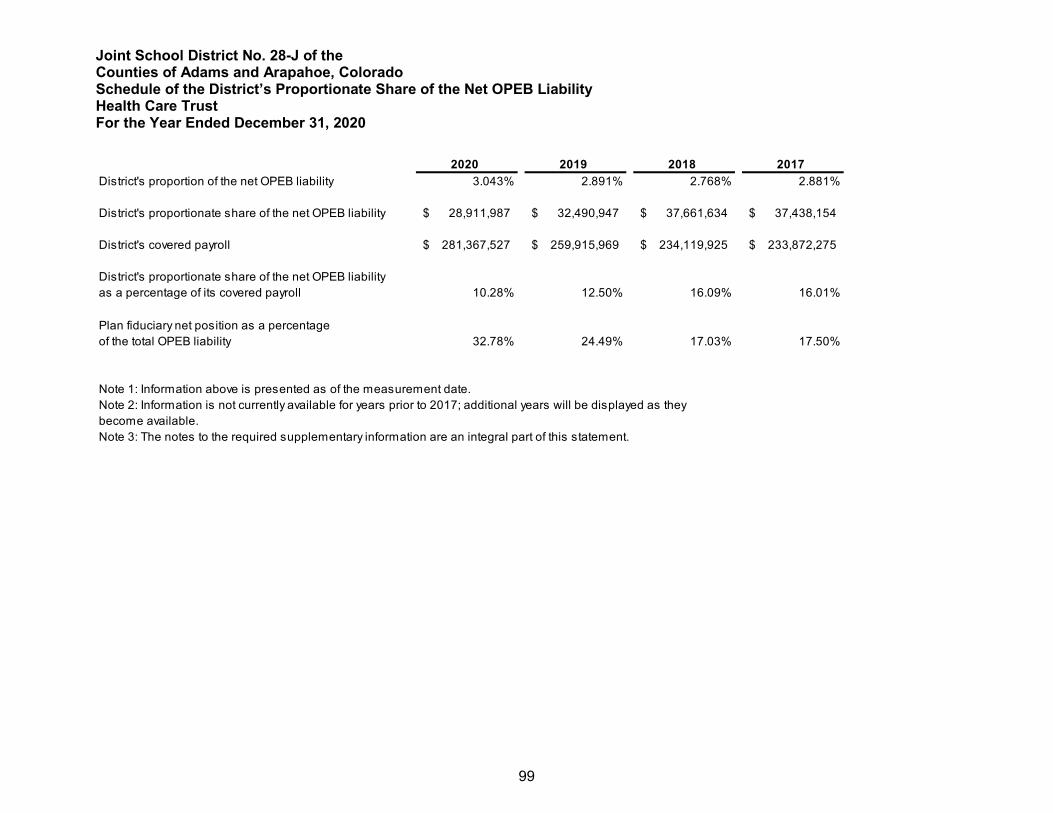
Joint School District No. 28-J of the Counties of Adams and Arapahoe, Colorado Schedule of the District’s Proportionate Share of the Net OPEB Liability Health Care Trust For the Year Ended December 31, 2020
99
Schedule of the District’s Proportionate Share of the Net OPEB Liability
2020 2019 2018 20173.043% 2.891% 2.768% 2.881%
28,911,987$ 32,490,947$ 37,661,634$ 37,438,154$
281,367,527$ 259,915,969$ 234,119,925$ 233,872,275$
10.28% 12.50% 16.09% 16.01%
32.78% 24.49% 17.03% 17.50%
Note 3: The notes to the required supplementary information are an integral part of this statement.
Note 2: Information is not currently available for years prior to 2017; additional years will be displayed as they become available.
District's proportion of the net OPEB liability
District's proportionate share of the net OPEB liability
District's covered payroll
District's proportionate share of the net OPEB liabilityas a percentage of its covered payroll
Plan fiduciary net position as a percentageof the total OPEB liability
Note 1: Information above is presented as of the measurement date.
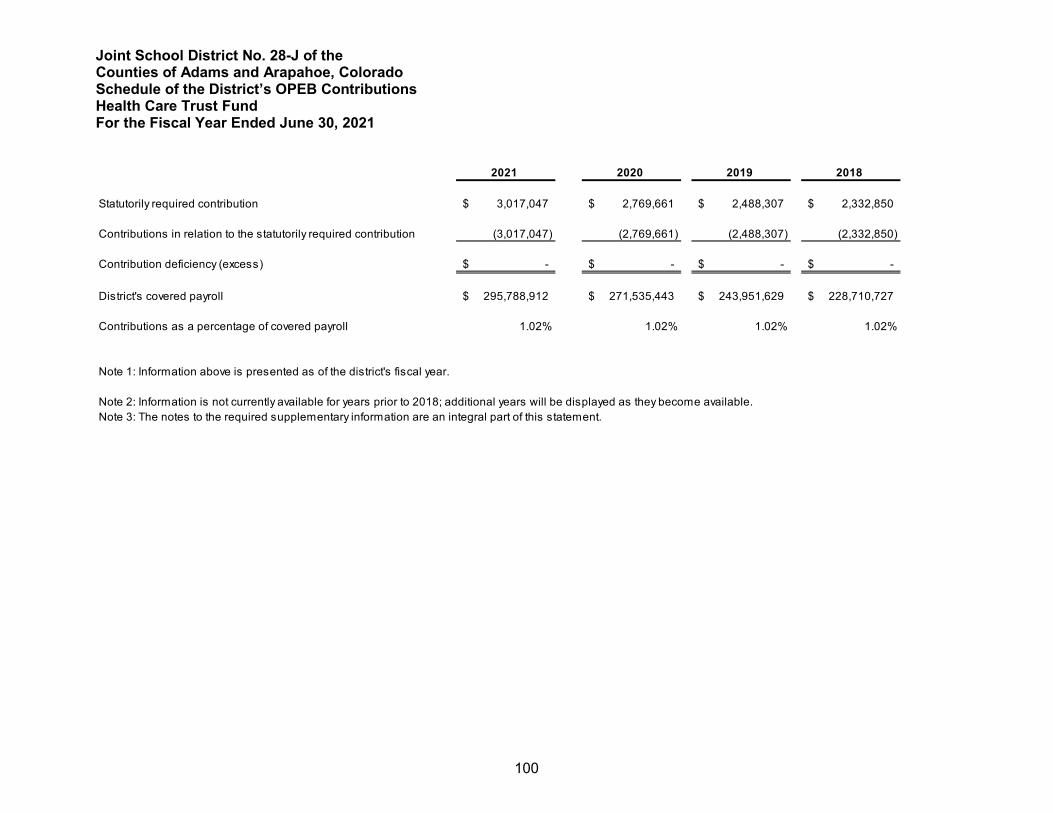
Joint School District No. 28-J of the Counties of Adams and Arapahoe, Colorado Schedule of the District’s OPEB Contributions Health Care Trust Fund For the Fiscal Year Ended June 30, 2021
100
Schedule of the District’s OPEB Contributions 2021 2020 2019 2018
3,017,047$ 2,769,661$ 2,488,307$ 2,332,850$
(3,017,047) (2,769,661) (2,488,307) (2,332,850)
-$ -$ -$ -$
295,788,912$ 271,535,443$ 243,951,629$ 228,710,727$
1.02% 1.02% 1.02% 1.02%
Note 3: The notes to the required supplementary information are an integral part of this statement.Note 2: Information is not currently available for years prior to 2018; additional years will be displayed as they become available.
Statutorily required contribution
Contributions in relation to the statutorily required contribution
Contribution deficiency (excess)
District's covered payroll
Contributions as a percentage of covered payroll
Note 1: Information above is presented as of the district's fiscal year.
Joint School District No. 28-J of the Counties of Adams and Arapahoe, Colorado Notes to the Required Supplementary Information June 30, 2021
101
Notes to the Required Supplementary Information NOTE 1: BUDGETARY INFORMATION
The district follows these procedures in establishing the budgetary data reflected in the financial statements.
i. Per state statute (§ 22-44-105, C.R.S.), legally adopted budgets are required for all funds. During May, the superintendent of schools submits to the board of education a proposed budget for the fiscal year commencing the following July. Budgets include estimated expenditures and the means of financing them.
ii. Public hearings are conducted by the board of education to obtain taxpayer comments. iii. Prior to June 30th, the budget is adopted by formal resolution of the board of education,
and the district issues a separate budget document. iv. Authorizations to transfer budgeted amounts between Colorado Department of Education
defined function groups or budget transfers, which change the total fund appropriation, must be approved by the board of education. The superintendent of schools must approve all other line item budget transfers. Actual expenditures and operating transfers out may not legally exceed appropriations at the individual fund level. Budgetary control is maintained at the supervisory department level.
v. Budgets for governmental funds are adopted on a basis consistent with accounting principles generally accepted in the United States of America.
vi. Budget amounts reported in the accompanying financial statements are as originally adopted and as amended by the board of education throughout the year.
vii. Appropriations for all funds lapse at fiscal year-end.
NOTE 2: SIGNIFICANT CHANGES AFFECTING TRENDS IN ACTUARIAL INFORMATION
Changes of assumptions or other inputs since the December 31, 2019 actuarial valuation are as follows:
Defined Benefit Pension plan:
• The price inflation assumption was lowered from 2.40 percent to 2.30 percent. • The wage inflation assumption was lowered from 3.5 percent to 3.00 percent. • The real rate of investment return assumption was increased to 4.95 percent per year, net
of investment expenses from 4.85 percent per year, net of investment expenses. • Salary scale assumptions were revised to align with revised economic assumptions and
to more closely reflect actual experience. • Rate of termination/withdrawal, retirement and disability were revised to more closely
reflect actual experience. • The pre-retirement mortality assumption for the School and DPS Divisions was changed
to the PubT-2010 Employee Table with generational projection using scale MP-2019. • The post-retirement non-disabled mortality assumption for the School and DPS Divisions
was changed to PubT-2010 Healthy Retiree Table, adjusted as follows: o Males: 112 percent of the rates prior to age 80 and 94 percent of the rates for ages
80 and older, with generational projection using scale MP-2019. o Females: 83 percent of the rates prior to age 80 and 106 percent of the rates for
ages 80 and older, with generational projection using scale MP-2019.
Joint School District No. 28-J of the Counties of Adams and Arapahoe, Colorado Notes to the Required Supplementary Information June 30, 2021
102
• The post-retirement non-disabled beneficiary mortality assumption for the Division Trust Funds was changed to the Pub-2010 Contingent Survivor Table, adjusted as follows:
o Males: 97 percent of the rates for all ages, with generational projection using scale MP-2019.
o Females: 105 percent of the rates for all ages, with generational projection using scale MP-2019
• The disabled mortality assumption for the Division Trust Funds was based upon the PubNS-2010 Disabled Retiree Table using 99 percent of the rates for all ages with generational projection using scale MP-2019.
• The mortality tables described above are generational mortality tables on a benefit-weighted basis.
Defined Benefit Other Post-Employment Benefits (OPEB) Pension plan:
• The price inflation assumption was lowered from 2.40 percent to 2.30 percent. • The wage inflation assumption was lowered from 3.5 percent to 3.00 percent. • The real rate of investment return assumption was increased to 4.95 percent per year, net
of investment expenses from 4.85 percent per year, net of investment expenses. • Rate of termination/withdrawal, retirement and disability were revised to more closely
reflect actual experience. • The pre-retirement mortality assumption for the School and DPS Divisions was changed
to the PubT-2010 Employee Table with generational projection using scale MP-2019. • The post-retirement non-disabled mortality assumptions were based upon the PubT-2010
Healthy Retiree Table, adjusted as follows: o Males: 112 percent of the rates prior to age 80 and 94 percent of the rates for ages
80 and older, with generational projection using scale MP-2019. o Females: 83 percent of the rates prior to age 80 and 106 percent of the rates for
ages 80 and older, with generational projection using scale MP-2019. • The post-retirement non-disabled beneficiary mortality assumption for the Division Trust
Funds was changed to the Pub-2010 Contingent Survivor Table, adjusted as follows: o Males: 97 percent of the rates for all ages, with generational projection using scale
MP-2019. o Females: 105 percent of the rates for all ages, with generational projection using
scale MP-2019 • The disabled mortality assumption for the Division Trust Funds was based upon the
PubNS-2010 Disabled Retiree Table using 99 percent of the rates for all ages with generational projection using scale MP-2019.
• The mortality tables described above are generational mortality tables on a head-count weighted basis.
103
Supplementary Information
SUPPLEMENTARY INFORMATION
This section presents the major and nonmajor fund financial statements. These statements show a more detailed look at the funds.
104
Major and Nonmajor Governmental Funds Major Governmental Funds
Bond Redemption Fund
This fund is used to account for property tax revenues and expenditures related to general long-term debt principal, interest, and related costs.
Building Fund
This fund is used to account for expenditures related to major construction, repair, or remodel of district sites. Funding for these projects was provided by the sale of the 2010, 2017 and 2019 General Obligation Bonds.
Capital Reserve Fund
This fund is used to account for the transfers from the General Fund and other revenue sources allocated or earned in this fund. Associated expenditures are for the ongoing capital needs of the district, such as reserve for debt payments, technology, capital projects, deferred maintenance, heating, ventilation and air conditioning (HVAC) projects, vehicles and roofing projects.
Nonmajor Governmental Funds
Athletic Fund
This fund is used to account for activities of the middle school intramural program and high school interscholastic athletic program. Financing is provided through a general fund subsidy and user fees.
Medicaid Fund
In 1997, the Colorado Legislature enacted legislation authorizing school district to receive and encumber Medicaid reimbursements. This fund is used to account for Medicaid reimbursements which support local school health and related services. Funding also is intended to increase access to preventative and primary care services for low-income, under-insured and uninsured school aged children.
Pickens Post-Secondary Fund
This fund is used to account for the tuition-based activities of the Pickens Post-Secondary Fund. Pickens Technical College provides vocational programs offered for post-secondary credit under the standards established by the state board for community college and occupational education.
Pupil Activity Fund
This fund is used to record financial transactions related to school-sponsored pupil organizations and activities. These activities are self-supporting and do not receive direct or indirect district support. Beginning July 1, 2019, per guidance from GASB No. 84, Fiduciary Activities, this fund is now reported as a special revenue fund rather than a fiduciary fund.
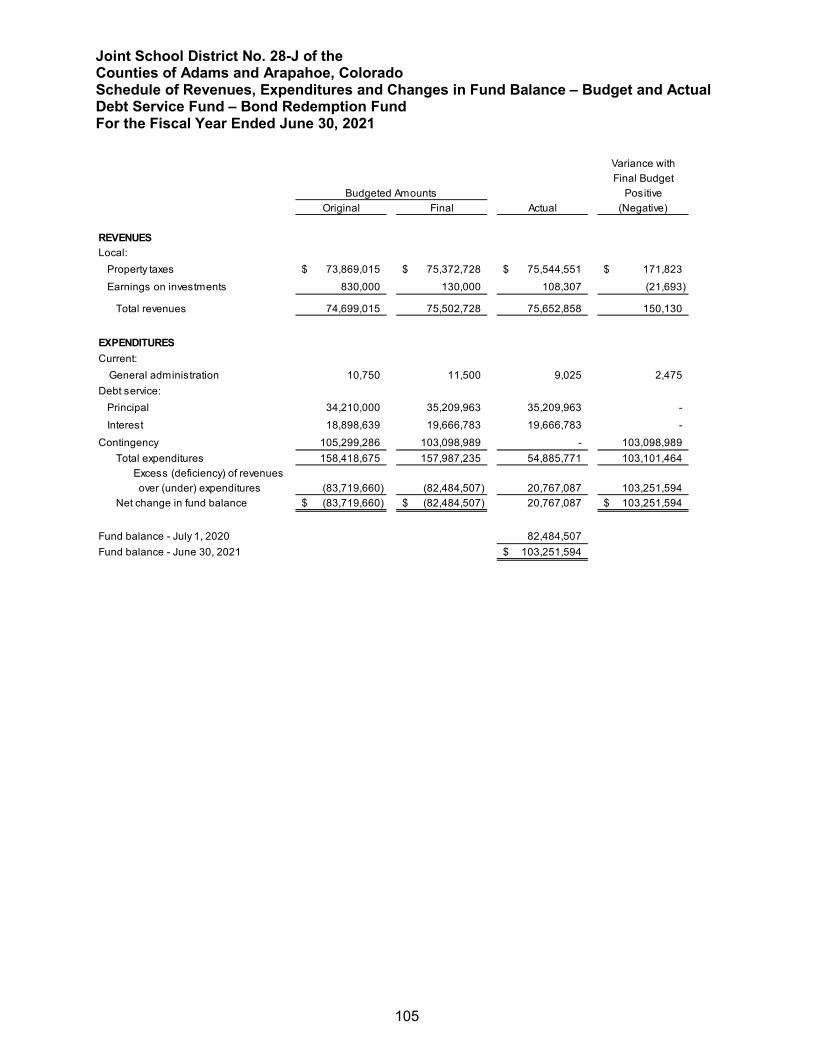
Joint School District No. 28-J of the Counties of Adams and Arapahoe, Colorado Schedule of Revenues, Expenditures and Changes in Fund Balance – Budget and Actual Debt Service Fund – Bond Redemption Fund For the Fiscal Year Ended June 30, 2021
105
Debt Service Fund – Bond Redemption Fund
Variance withFinal Budget
Budgeted Amounts PositiveOriginal Final Actual (Negative)
REVENUESLocal:
Property taxes 73,869,015$ 75,372,728$ 75,544,551$ 171,823$ Earnings on investments 830,000 130,000 108,307 (21,693)
Total revenues 74,699,015 75,502,728 75,652,858 150,130
EXPENDITURESCurrent:
General administration 10,750 11,500 9,025 2,475 Debt service:
Principal 34,210,000 35,209,963 35,209,963 - Interest 18,898,639 19,666,783 19,666,783 -
Contingency 105,299,286 103,098,989 - 103,098,989 Total expenditures 158,418,675 157,987,235 54,885,771 103,101,464
Excess (deficiency) of revenues over (under) expenditures (83,719,660) (82,484,507) 20,767,087 103,251,594
Net change in fund balance (83,719,660)$ (82,484,507)$ 20,767,087 103,251,594$
Fund balance - July 1, 2020 82,484,507 Fund balance - June 30, 2021 103,251,594$
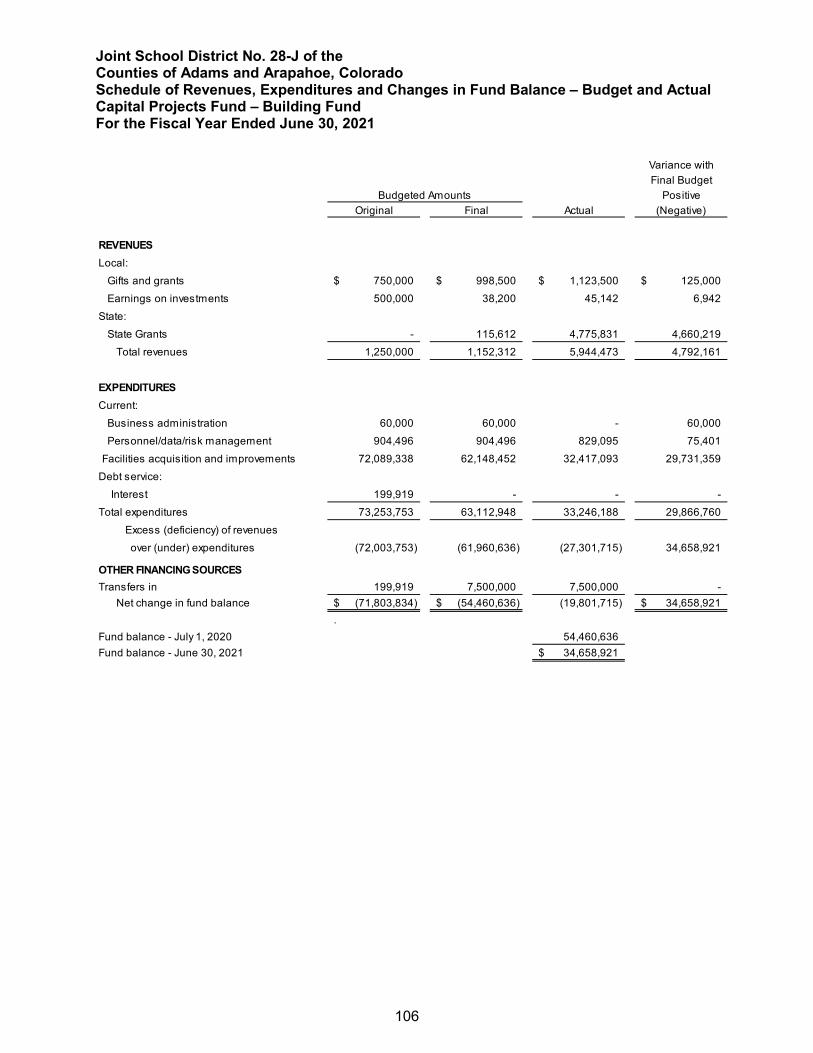
Joint School District No. 28-J of the Counties of Adams and Arapahoe, Colorado Schedule of Revenues, Expenditures and Changes in Fund Balance – Budget and Actual Capital Projects Fund – Building Fund For the Fiscal Year Ended June 30, 2021
106
Capital Projects Fund – Building Fund
Variance withFinal Budget
PositiveOriginal Final Actual (Negative)
REVENUESLocal:
Gifts and grants 750,000$ 998,500$ 1,123,500$ 125,000$ Earnings on investments 500,000 38,200 45,142 6,942
State:State Grants - 115,612 4,775,831 4,660,219
Total revenues 1,250,000 1,152,312 5,944,473 4,792,161
EXPENDITURESCurrent:
Business administration 60,000 60,000 - 60,000 Personnel/data/risk management 904,496 904,496 829,095 75,401
Facilities acquisition and improvements 72,089,338 62,148,452 32,417,093 29,731,359 Debt service:
Interest 199,919 - - - Total expenditures 73,253,753 63,112,948 33,246,188 29,866,760
Excess (deficiency) of revenues over (under) expenditures (72,003,753) (61,960,636) (27,301,715) 34,658,921
OTHER FINANCING SOURCESTransfers in 199,919 7,500,000 7,500,000 -
Net change in fund balance (71,803,834)$ (54,460,636)$ (19,801,715) 34,658,921$ .
Fund balance - July 1, 2020 54,460,636 Fund balance - June 30, 2021 34,658,921$
Budgeted Amounts
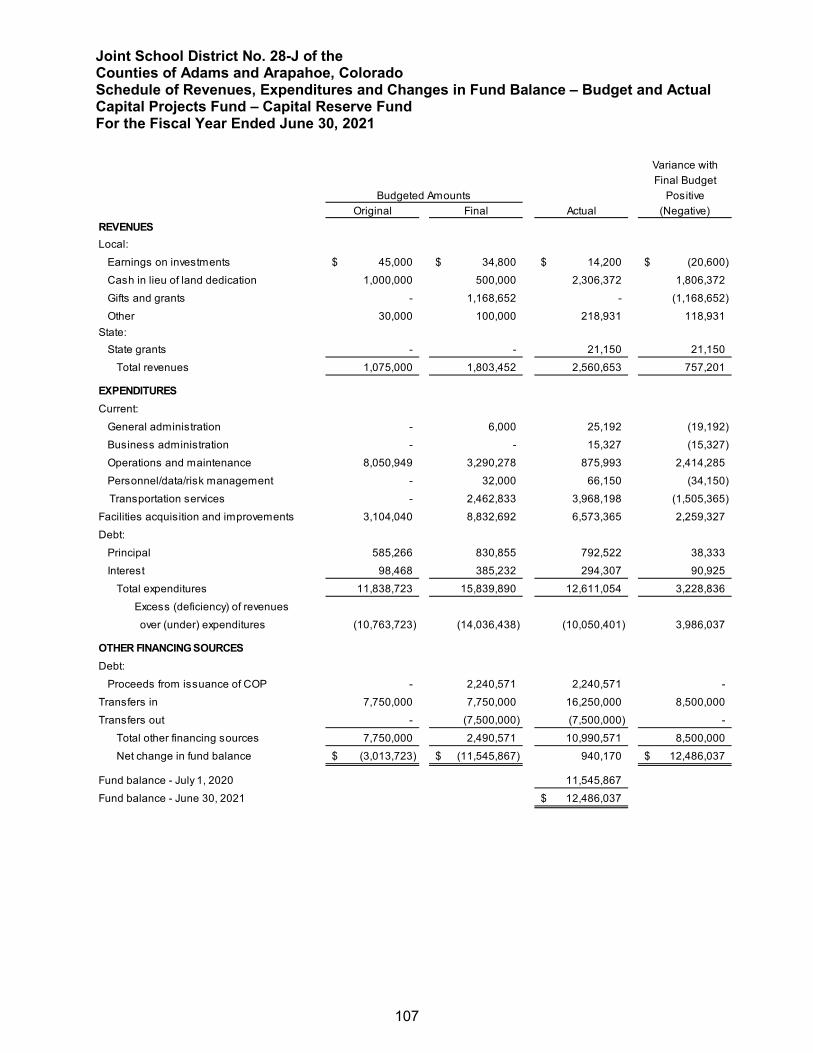
Joint School District No. 28-J of the Counties of Adams and Arapahoe, Colorado Schedule of Revenues, Expenditures and Changes in Fund Balance – Budget and Actual Capital Projects Fund – Capital Reserve Fund For the Fiscal Year Ended June 30, 2021
107
Capital Projects Fund – Capital Reserve Fund
Variance withFinal Budget
Budgeted Amounts PositiveOriginal Final Actual (Negative)
REVENUESLocal:
Earnings on investments 45,000$ 34,800$ 14,200$ (20,600)$ Cash in lieu of land dedication 1,000,000 500,000 2,306,372 1,806,372 Gifts and grants - 1,168,652 - (1,168,652) Other 30,000 100,000 218,931 118,931
State:State grants - - 21,150 21,150
Total revenues 1,075,000 1,803,452 2,560,653 757,201
EXPENDITURESCurrent:
General administration - 6,000 25,192 (19,192) Business administration - - 15,327 (15,327) Operations and maintenance 8,050,949 3,290,278 875,993 2,414,285 Personnel/data/risk management - 32,000 66,150 (34,150) Transportation services - 2,462,833 3,968,198 (1,505,365)
Facilities acquisition and improvements 3,104,040 8,832,692 6,573,365 2,259,327 Debt:
Principal 585,266 830,855 792,522 38,333 Interest 98,468 385,232 294,307 90,925
Total expenditures 11,838,723 15,839,890 12,611,054 3,228,836 Excess (deficiency) of revenues over (under) expenditures (10,763,723) (14,036,438) (10,050,401) 3,986,037
OTHER FINANCING SOURCESDebt:
Proceeds from issuance of COP - 2,240,571 2,240,571 - Transfers in 7,750,000 7,750,000 16,250,000 8,500,000 Transfers out - (7,500,000) (7,500,000) -
Total other financing sources 7,750,000 2,490,571 10,990,571 8,500,000 Net change in fund balance (3,013,723)$ (11,545,867)$ 940,170 12,486,037$
Fund balance - July 1, 2020 11,545,867 Fund balance - June 30, 2021 12,486,037$
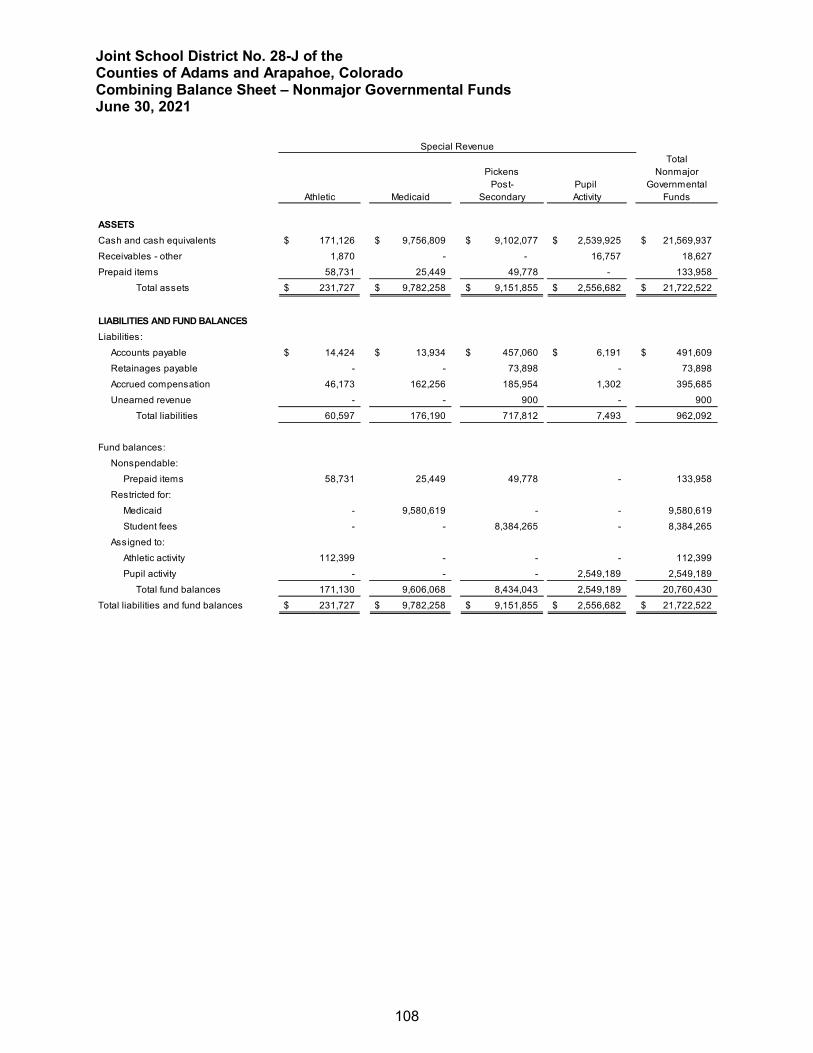
Joint School District No. 28-J of the Counties of Adams and Arapahoe, Colorado Combining Balance Sheet – Nonmajor Governmental Funds June 30, 2021
108
Combining Balance Sheet – Nonmajor Governmental Funds
TotalPickens Nonmajor
Post- Pupil GovernmentalAthletic Medicaid Secondary Activity Funds
ASSETSCash and cash equivalents 171,126$ 9,756,809$ 9,102,077$ 2,539,925$ 21,569,937$ Receivables - other 1,870 - - 16,757 18,627 Prepaid items 58,731 25,449 49,778 - 133,958
Total assets 231,727$ 9,782,258$ 9,151,855$ 2,556,682$ 21,722,522$
LIABILITIES AND FUND BALANCESLiabilities:
Accounts payable 14,424$ 13,934$ 457,060$ 6,191$ 491,609$ Retainages payable - - 73,898 - 73,898 Accrued compensation 46,173 162,256 185,954 1,302 395,685 Unearned revenue - - 900 - 900
Total liabilities 60,597 176,190 717,812 7,493 962,092
Fund balances:Nonspendable:
Prepaid items 58,731 25,449 49,778 - 133,958 Restricted for:
Medicaid - 9,580,619 - - 9,580,619 Student fees - - 8,384,265 - 8,384,265
Assigned to:Athletic activity 112,399 - - - 112,399 Pupil activity - - - 2,549,189 2,549,189
Total fund balances 171,130 9,606,068 8,434,043 2,549,189 20,760,430 Total liabilities and fund balances 231,727$ 9,782,258$ 9,151,855$ 2,556,682$ 21,722,522$
Special Revenue
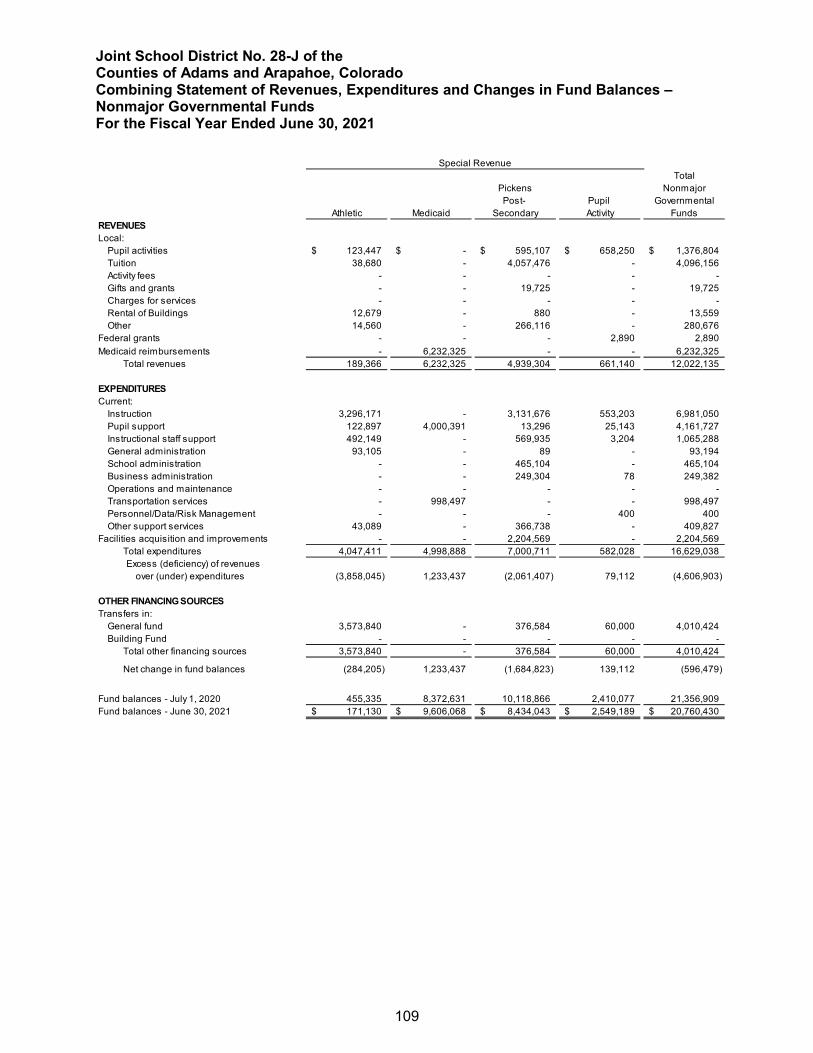
Joint School District No. 28-J of the Counties of Adams and Arapahoe, Colorado Combining Statement of Revenues, Expenditures and Changes in Fund Balances – Nonmajor Governmental Funds For the Fiscal Year Ended June 30, 2021
109
Combining Statement of Revenues, Expenditures and Changes in Fund Balance – Nonmajor Governmental Funds
TotalPickens NonmajorPost- Pupil Governmental
Athletic Medicaid Secondary Activity FundsREVENUESLocal:
Pupil activities 123,447$ -$ 595,107$ 658,250$ 1,376,804$ Tuition 38,680 - 4,057,476 - 4,096,156 Activity fees - - - - - Gifts and grants - - 19,725 - 19,725 Charges for services - - - - - Rental of Buildings 12,679 - 880 - 13,559 Other 14,560 - 266,116 - 280,676
Federal grants - - - 2,890 2,890 Medicaid reimbursements - 6,232,325 - - 6,232,325
Total revenues 189,366 6,232,325 4,939,304 661,140 12,022,135
EXPENDITURESCurrent:
Instruction 3,296,171 - 3,131,676 553,203 6,981,050 Pupil support 122,897 4,000,391 13,296 25,143 4,161,727 Instructional staff support 492,149 - 569,935 3,204 1,065,288 General administration 93,105 - 89 - 93,194 School administration - - 465,104 - 465,104 Business administration - - 249,304 78 249,382 Operations and maintenance - - - - - Transportation services - 998,497 - - 998,497 Personnel/Data/Risk Management - - - 400 400 Other support services 43,089 - 366,738 - 409,827
Facilities acquisition and improvements - - 2,204,569 - 2,204,569 Total expenditures 4,047,411 4,998,888 7,000,711 582,028 16,629,038 Excess (deficiency) of revenues
over (under) expenditures (3,858,045) 1,233,437 (2,061,407) 79,112 (4,606,903)
OTHER FINANCING SOURCESTransfers in:
General fund 3,573,840 - 376,584 60,000 4,010,424 Building Fund - - - - -
Total other financing sources 3,573,840 - 376,584 60,000 4,010,424
Net change in fund balances (284,205) 1,233,437 (1,684,823) 139,112 (596,479)
455,335 8,372,631 10,118,866 2,410,077 21,356,909 Fund balances - June 30, 2021 171,130$ 9,606,068$ 8,434,043$ 2,549,189$ 20,760,430$
Special Revenue
Fund balances - July 1, 2020
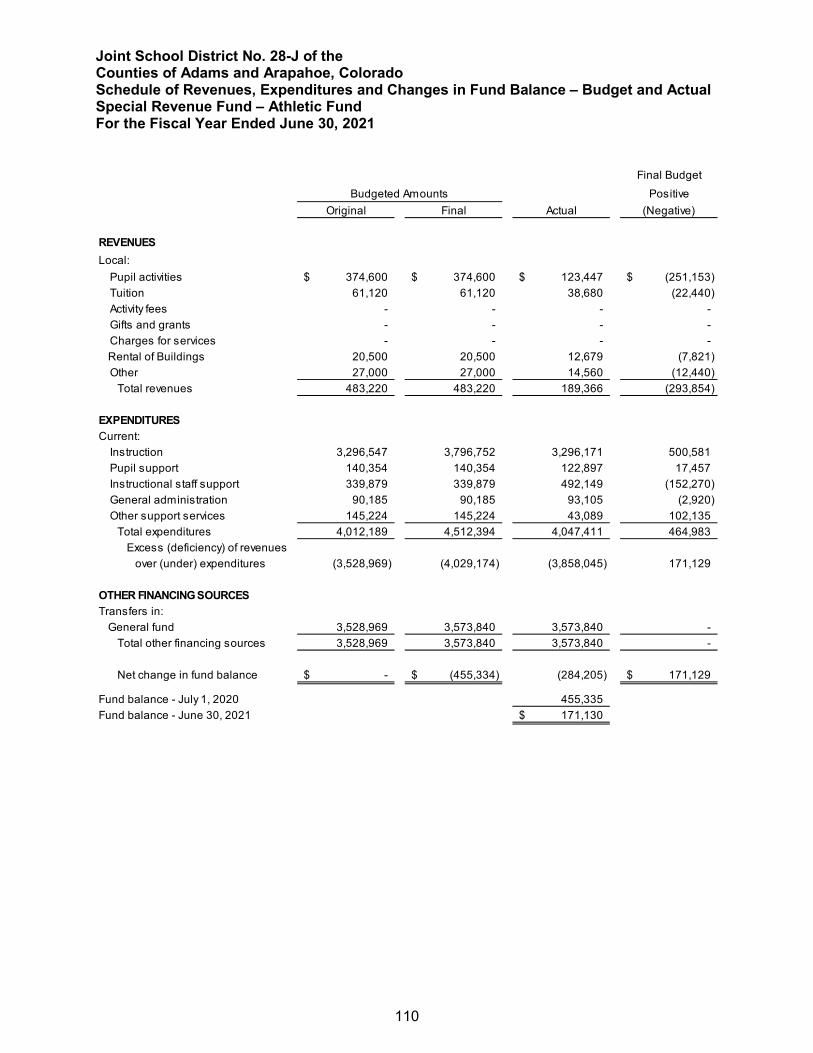
Joint School District No. 28-J of the Counties of Adams and Arapahoe, Colorado Schedule of Revenues, Expenditures and Changes in Fund Balance – Budget and Actual Special Revenue Fund – Athletic Fund For the Fiscal Year Ended June 30, 2021
110
Special Revenue Fund – Athletic Fund
Final BudgetBudgeted Amounts Positive
Original Final Actual (Negative)
REVENUESLocal:
Pupil activities 374,600$ 374,600$ 123,447$ (251,153)$ Tuition 61,120 61,120 38,680 (22,440) Activity fees - - - - Gifts and grants - - - - Charges for services - - - -
Rental of Buildings 20,500 20,500 12,679 (7,821) Other 27,000 27,000 14,560 (12,440)
Total revenues 483,220 483,220 189,366 (293,854)
EXPENDITURESCurrent:
Instruction 3,296,547 3,796,752 3,296,171 500,581 Pupil support 140,354 140,354 122,897 17,457 Instructional staff support 339,879 339,879 492,149 (152,270) General administration 90,185 90,185 93,105 (2,920) Other support services 145,224 145,224 43,089 102,135
Total expenditures 4,012,189 4,512,394 4,047,411 464,983 Excess (deficiency) of revenues over (under) expenditures (3,528,969) (4,029,174) (3,858,045) 171,129
OTHER FINANCING SOURCESTransfers in:
General fund 3,528,969 3,573,840 3,573,840 - Total other financing sources 3,528,969 3,573,840 3,573,840 -
Net change in fund balance -$ (455,334)$ (284,205) 171,129$
Fund balance - July 1, 2020 455,335 Fund balance - June 30, 2021 171,130$
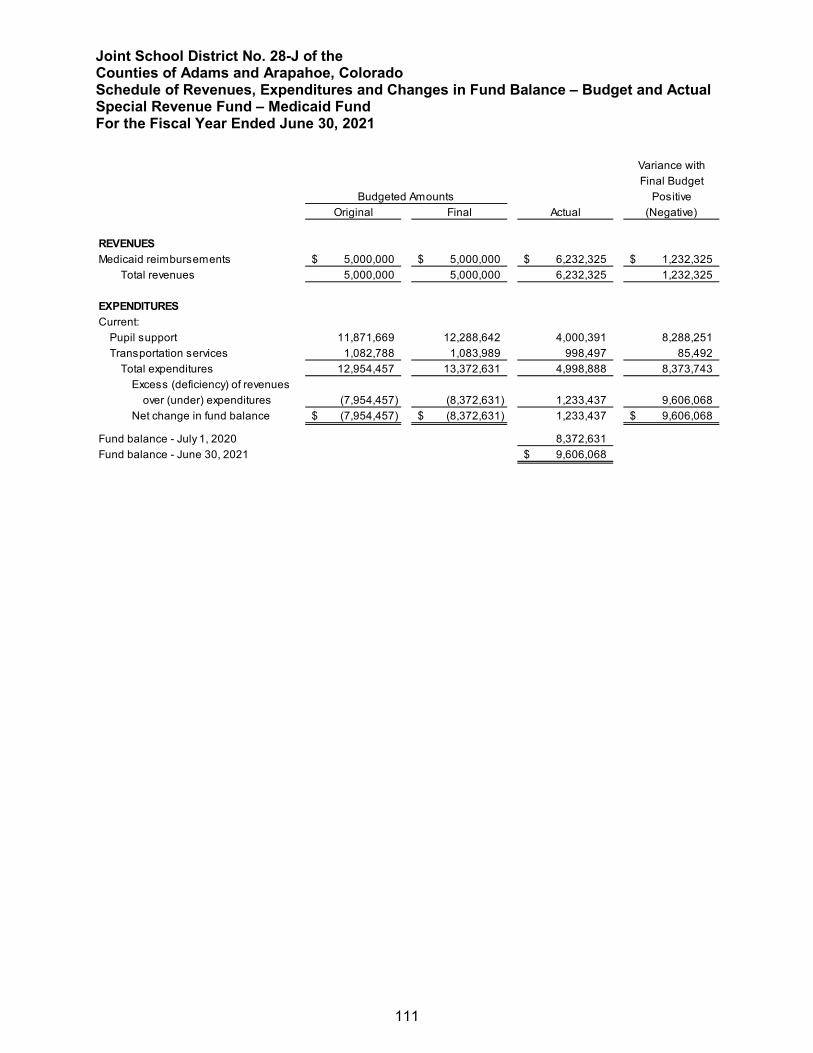
Joint School District No. 28-J of the Counties of Adams and Arapahoe, Colorado Schedule of Revenues, Expenditures and Changes in Fund Balance – Budget and Actual Special Revenue Fund – Medicaid Fund For the Fiscal Year Ended June 30, 2021
111
Special Revenue Fund – Medicaid Fund
Variance withFinal Budget
Budgeted Amounts PositiveOriginal Final Actual (Negative)
REVENUESMedicaid reimbursements 5,000,000$ 5,000,000$ 6,232,325$ 1,232,325$
Total revenues 5,000,000 5,000,000 6,232,325 1,232,325
EXPENDITURESCurrent:
Pupil support 11,871,669 12,288,642 4,000,391 8,288,251 Transportation services 1,082,788 1,083,989 998,497 85,492
Total expenditures 12,954,457 13,372,631 4,998,888 8,373,743 Excess (deficiency) of revenues
over (under) expenditures (7,954,457) (8,372,631) 1,233,437 9,606,068 Net change in fund balance (7,954,457)$ (8,372,631)$ 1,233,437 9,606,068$
Fund balance - July 1, 2020 8,372,631 Fund balance - June 30, 2021 9,606,068$
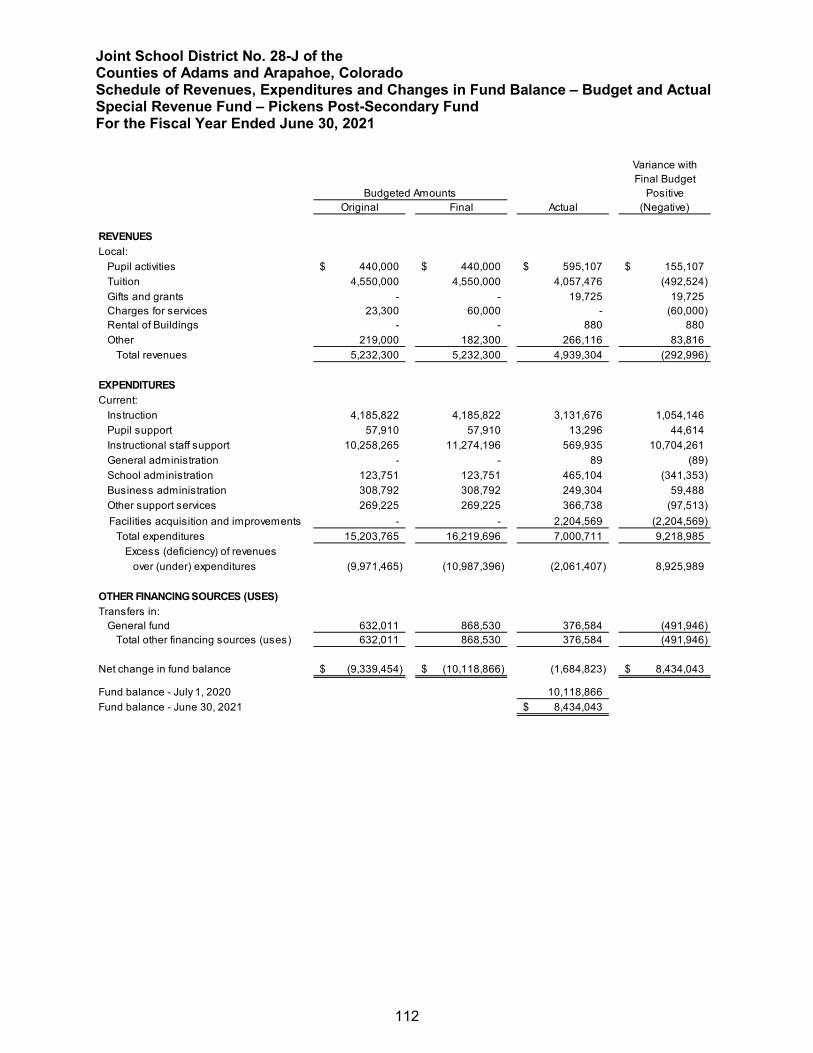
Joint School District No. 28-J of the Counties of Adams and Arapahoe, Colorado Schedule of Revenues, Expenditures and Changes in Fund Balance – Budget and Actual Special Revenue Fund – Pickens Post-Secondary Fund For the Fiscal Year Ended June 30, 2021
112
Special Revenue Fund – Pickens Post-Secondary Fund
Variance withFinal Budget
Budgeted Amounts PositiveOriginal Final Actual (Negative)
REVENUESLocal:
Pupil activities 440,000$ 440,000$ 595,107$ 155,107$ Tuition 4,550,000 4,550,000 4,057,476 (492,524) Gifts and grants - - 19,725 19,725 Charges for services 23,300 60,000 - (60,000)
Rental of Buildings - - 880 880 Other 219,000 182,300 266,116 83,816
Total revenues 5,232,300 5,232,300 4,939,304 (292,996)
EXPENDITURESCurrent:
Instruction 4,185,822 4,185,822 3,131,676 1,054,146 Pupil support 57,910 57,910 13,296 44,614 Instructional staff support 10,258,265 11,274,196 569,935 10,704,261 General administration - - 89 (89) School administration 123,751 123,751 465,104 (341,353) Business administration 308,792 308,792 249,304 59,488 Other support services 269,225 269,225 366,738 (97,513) Facilities acquisition and improvements - - 2,204,569 (2,204,569)
Total expenditures 15,203,765 16,219,696 7,000,711 9,218,985 Excess (deficiency) of revenues over (under) expenditures (9,971,465) (10,987,396) (2,061,407) 8,925,989
OTHER FINANCING SOURCES (USES)Transfers in:
General fund 632,011 868,530 376,584 (491,946) Total other financing sources (uses) 632,011 868,530 376,584 (491,946)
Net change in fund balance (9,339,454)$ (10,118,866)$ (1,684,823) 8,434,043$
Fund balance - July 1, 2020 10,118,866 Fund balance - June 30, 2021 8,434,043$
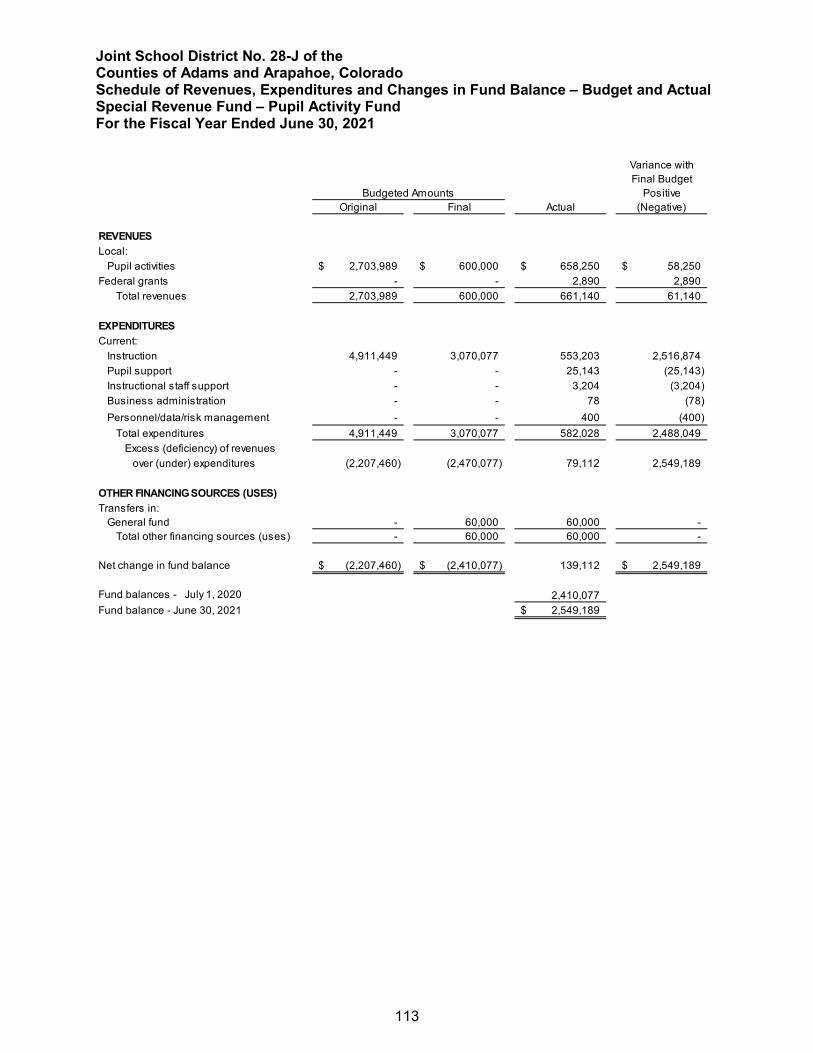
Joint School District No. 28-J of the Counties of Adams and Arapahoe, Colorado Schedule of Revenues, Expenditures and Changes in Fund Balance – Budget and Actual Special Revenue Fund – Pupil Activity Fund For the Fiscal Year Ended June 30, 2021
113
Special Revenue Fund – Pupil Activity Fund
Variance withFinal Budget
Budgeted Amounts PositiveOriginal Final Actual (Negative)
REVENUESLocal:
Pupil activities 2,703,989$ 600,000$ 658,250$ 58,250$ Federal grants - - 2,890 2,890
Total revenues 2,703,989 600,000 661,140 61,140
EXPENDITURESCurrent:
Instruction 4,911,449 3,070,077 553,203 2,516,874 Pupil support - - 25,143 (25,143) Instructional staff support - - 3,204 (3,204) Business administration - - 78 (78) Personnel/data/risk management - - 400 (400)
Total expenditures 4,911,449 3,070,077 582,028 2,488,049 Excess (deficiency) of revenues over (under) expenditures (2,207,460) (2,470,077) 79,112 2,549,189
OTHER FINANCING SOURCES (USES)Transfers in:
General fund - 60,000 60,000 - Total other financing sources (uses) - 60,000 60,000 -
Net change in fund balance (2,207,460)$ (2,410,077)$ 139,112 2,549,189$
Fund balances - July 1, 2020 2,410,077 Fund balance - June 30, 2021 2,549,189$

114
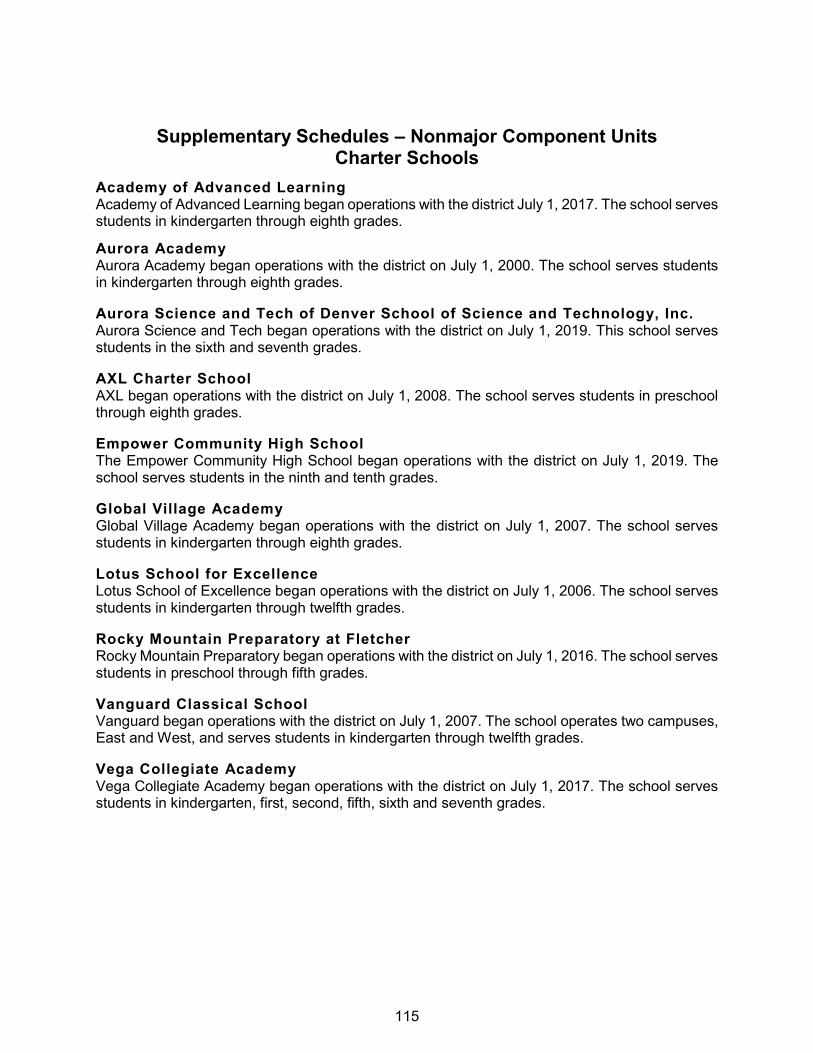
115
Nonmajor Component Units – Charter Schools
Supplementary Schedules – Nonmajor Component Units Charter Schools
Academy of Advanced Learning Academy of Advanced Learning began operations with the district July 1, 2017. The school serves students in kindergarten through eighth grades.
Aurora Academy Aurora Academy began operations with the district on July 1, 2000. The school serves students in kindergarten through eighth grades.
Aurora Science and Tech of Denver School of Science and Technology, Inc. Aurora Science and Tech began operations with the district on July 1, 2019. This school serves students in the sixth and seventh grades.
AXL Charter School AXL began operations with the district on July 1, 2008. The school serves students in preschool through eighth grades.
Empower Community High School The Empower Community High School began operations with the district on July 1, 2019. The school serves students in the ninth and tenth grades.
Global Village Academy Global Village Academy began operations with the district on July 1, 2007. The school serves students in kindergarten through eighth grades.
Lotus School for Excellence Lotus School of Excellence began operations with the district on July 1, 2006. The school serves students in kindergarten through twelfth grades.
Rocky Mountain Preparatory at Fletcher Rocky Mountain Preparatory began operations with the district on July 1, 2016. The school serves students in preschool through fifth grades.
Vanguard Classical School Vanguard began operations with the district on July 1, 2007. The school operates two campuses, East and West, and serves students in kindergarten through twelfth grades.
Vega Collegiate Academy Vega Collegiate Academy began operations with the district on July 1, 2017. The school serves students in kindergarten, first, second, fifth, sixth and seventh grades.
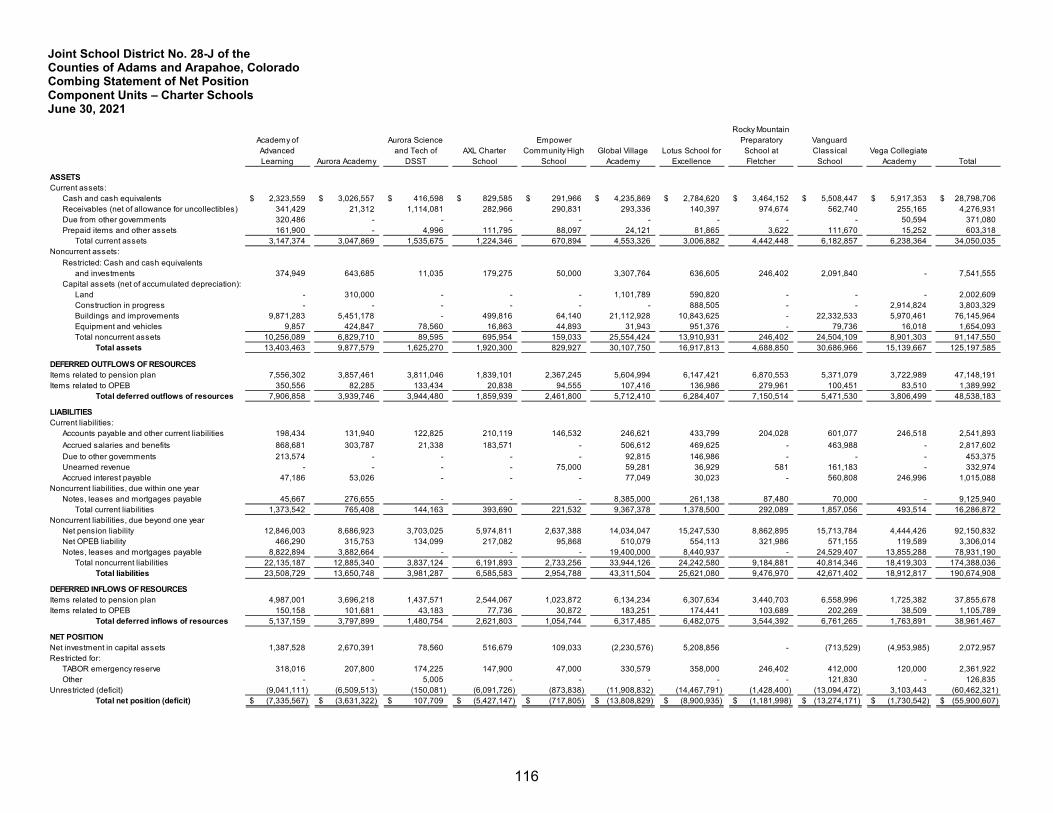
Joint School District No. 28-J of the Counties of Adams and Arapahoe, Colorado Combing Statement of Net Position Component Units – Charter Schools June 30, 2021
116
Combining Statement of Net Position – Component Units – Charter Schools
Academy of Advanced Learning Aurora Academy
Aurora Science and Tech of
DSSTAXL Charter
School
Empower Community High
SchoolGlobal Village
AcademyLotus School for
Excellence
Rocky Mountain Preparatory School at Fletcher
Vanguard Classical
SchoolVega Collegiate
Academy Total
ASSETSCurrent assets:
Cash and cash equivalents 2,323,559$ 3,026,557$ 416,598$ 829,585$ 291,966$ 4,235,869$ 2,784,620$ 3,464,152$ 5,508,447$ 5,917,353$ 28,798,706$ Receivables (net of allowance for uncollectibles) 341,429 21,312 1,114,081 282,966 290,831 293,336 140,397 974,674 562,740 255,165 4,276,931 Due from other governments 320,486 - - - - - - - - 50,594 371,080 Prepaid items and other assets 161,900 - 4,996 111,795 88,097 24,121 81,865 3,622 111,670 15,252 603,318
Total current assets 3,147,374 3,047,869 1,535,675 1,224,346 670,894 4,553,326 3,006,882 4,442,448 6,182,857 6,238,364 34,050,035 Noncurrent assets:
Restricted: Cash and cash equivalents and investments 374,949 643,685 11,035 179,275 50,000 3,307,764 636,605 246,402 2,091,840 - 7,541,555
Capital assets (net of accumulated depreciation):Land - 310,000 - - - 1,101,789 590,820 - - - 2,002,609 Construction in progress - - - - - - 888,505 - - 2,914,824 3,803,329 Buildings and improvements 9,871,283 5,451,178 - 499,816 64,140 21,112,928 10,843,625 - 22,332,533 5,970,461 76,145,964 Equipment and vehicles 9,857 424,847 78,560 16,863 44,893 31,943 951,376 - 79,736 16,018 1,654,093 Total noncurrent assets 10,256,089 6,829,710 89,595 695,954 159,033 25,554,424 13,910,931 246,402 24,504,109 8,901,303 91,147,550
Total assets 13,403,463 9,877,579 1,625,270 1,920,300 829,927 30,107,750 16,917,813 4,688,850 30,686,966 15,139,667 125,197,585
DEFERRED OUTFLOWS OF RESOURCESItems related to pension plan 7,556,302 3,857,461 3,811,046 1,839,101 2,367,245 5,604,994 6,147,421 6,870,553 5,371,079 3,722,989 47,148,191 Items related to OPEB 350,556 82,285 133,434 20,838 94,555 107,416 136,986 279,961 100,451 83,510 1,389,992
Total deferred outflows of resources 7,906,858 3,939,746 3,944,480 1,859,939 2,461,800 5,712,410 6,284,407 7,150,514 5,471,530 3,806,499 48,538,183
LIABILITIESCurrent liabilities:
Accounts payable and other current liabilities 198,434 131,940 122,825 210,119 146,532 246,621 433,799 204,028 601,077 246,518 2,541,893 Accrued salaries and benefits 868,681 303,787 21,338 183,571 - 506,612 469,625 - 463,988 - 2,817,602 Due to other governments 213,574 - - - - 92,815 146,986 - - - 453,375 Unearned revenue - - - - 75,000 59,281 36,929 581 161,183 - 332,974 Accrued interest payable 47,186 53,026 - - - 77,049 30,023 - 560,808 246,996 1,015,088
Noncurrent liabilities, due within one yearNotes, leases and mortgages payable 45,667 276,655 - - - 8,385,000 261,138 87,480 70,000 - 9,125,940
Total current liabilities 1,373,542 765,408 144,163 393,690 221,532 9,367,378 1,378,500 292,089 1,857,056 493,514 16,286,872 Noncurrent liabilities, due beyond one year
Net pension liability 12,846,003 8,686,923 3,703,025 5,974,811 2,637,388 14,034,047 15,247,530 8,862,895 15,713,784 4,444,426 92,150,832 Net OPEB liability 466,290 315,753 134,099 217,082 95,868 510,079 554,113 321,986 571,155 119,589 3,306,014 Notes, leases and mortgages payable 8,822,894 3,882,664 - - - 19,400,000 8,440,937 - 24,529,407 13,855,288 78,931,190
Total noncurrent liabilities 22,135,187 12,885,340 3,837,124 6,191,893 2,733,256 33,944,126 24,242,580 9,184,881 40,814,346 18,419,303 174,388,036 Total liabilities 23,508,729 13,650,748 3,981,287 6,585,583 2,954,788 43,311,504 25,621,080 9,476,970 42,671,402 18,912,817 190,674,908
DEFERRED INFLOWS OF RESOURCESItems related to pension plan 4,987,001 3,696,218 1,437,571 2,544,067 1,023,872 6,134,234 6,307,634 3,440,703 6,558,996 1,725,382 37,855,678 Items related to OPEB 150,158 101,681 43,183 77,736 30,872 183,251 174,441 103,689 202,269 38,509 1,105,789
Total deferred inflows of resources 5,137,159 3,797,899 1,480,754 2,621,803 1,054,744 6,317,485 6,482,075 3,544,392 6,761,265 1,763,891 38,961,467
NET POSITIONNet investment in capital assets 1,387,528 2,670,391 78,560 516,679 109,033 (2,230,576) 5,208,856 - (713,529) (4,953,985) 2,072,957 Restricted for:
TABOR emergency reserve 318,016 207,800 174,225 147,900 47,000 330,579 358,000 246,402 412,000 120,000 2,361,922 Other - - 5,005 - - - - - 121,830 - 126,835
Unrestricted (deficit) (9,041,111) (6,509,513) (150,081) (6,091,726) (873,838) (11,908,832) (14,467,791) (1,428,400) (13,094,472) 3,103,443 (60,462,321) Total net position (deficit) (7,335,567)$ (3,631,322)$ 107,709$ (5,427,147)$ (717,805)$ (13,808,829)$ (8,900,935)$ (1,181,998)$ (13,274,171)$ (1,730,542)$ (55,900,607)$
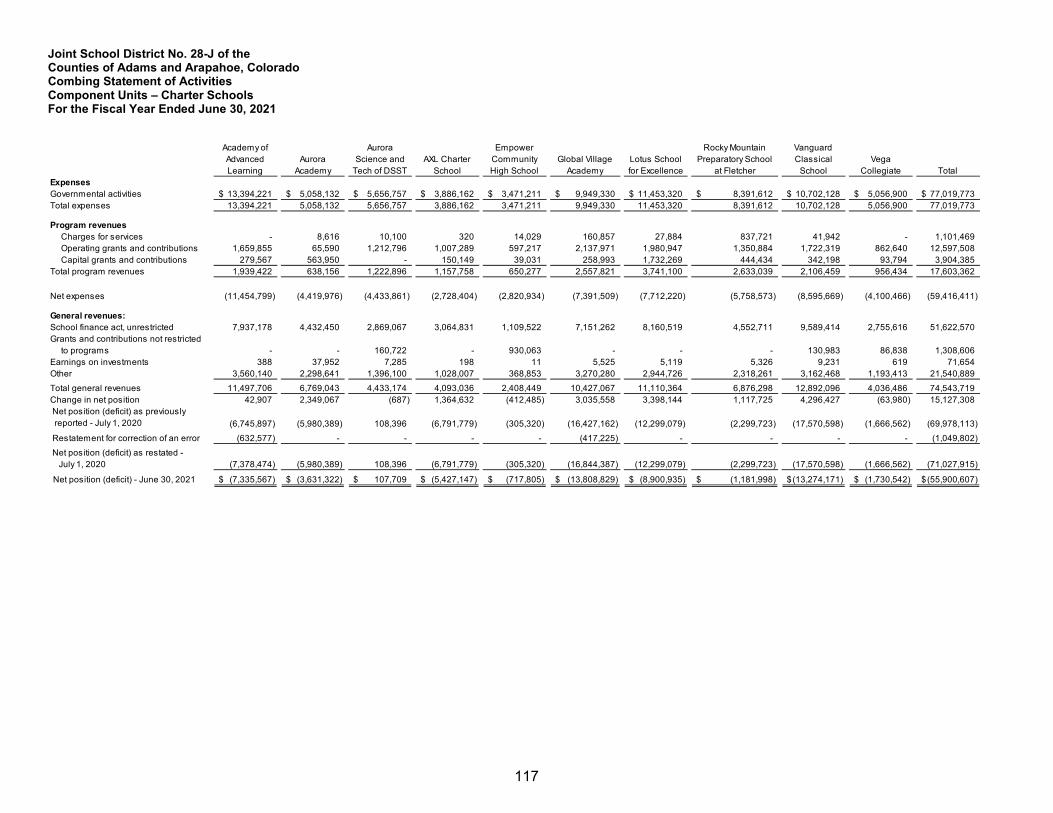
Joint School District No. 28-J of the Counties of Adams and Arapahoe, Colorado Combing Statement of Activities Component Units – Charter Schools For the Fiscal Year Ended June 30, 2021
117
Combining Statement of Activities – Component Units – Charter Schools
Academy of Advanced Learning
Aurora Academy
Aurora Science and
Tech of DSSTAXL Charter
School
Empower Community High School
Global Village Academy
Lotus School for Excellence
Rocky Mountain Preparatory School
at Fletcher
Vanguard Classical
SchoolVega
Collegiate TotalExpensesGovernmental activities 13,394,221$ 5,058,132$ 5,656,757$ 3,886,162$ 3,471,211$ 9,949,330$ 11,453,320$ 8,391,612$ 10,702,128$ 5,056,900$ 77,019,773$ Total expenses 13,394,221 5,058,132 5,656,757 3,886,162 3,471,211 9,949,330 11,453,320 8,391,612 10,702,128 5,056,900 77,019,773
Program revenuesCharges for services - 8,616 10,100 320 14,029 160,857 27,884 837,721 41,942 - 1,101,469 Operating grants and contributions 1,659,855 65,590 1,212,796 1,007,289 597,217 2,137,971 1,980,947 1,350,884 1,722,319 862,640 12,597,508 Capital grants and contributions 279,567 563,950 - 150,149 39,031 258,993 1,732,269 444,434 342,198 93,794 3,904,385
Total program revenues 1,939,422 638,156 1,222,896 1,157,758 650,277 2,557,821 3,741,100 2,633,039 2,106,459 956,434 17,603,362
Net expenses (11,454,799) (4,419,976) (4,433,861) (2,728,404) (2,820,934) (7,391,509) (7,712,220) (5,758,573) (8,595,669) (4,100,466) (59,416,411)
General revenues:School finance act, unrestricted 7,937,178 4,432,450 2,869,067 3,064,831 1,109,522 7,151,262 8,160,519 4,552,711 9,589,414 2,755,616 51,622,570 Grants and contributions not restricted
to programs - - 160,722 - 930,063 - - - 130,983 86,838 1,308,606 Earnings on investments 388 37,952 7,285 198 11 5,525 5,119 5,326 9,231 619 71,654 Other 3,560,140 2,298,641 1,396,100 1,028,007 368,853 3,270,280 2,944,726 2,318,261 3,162,468 1,193,413 21,540,889 Total general revenues 11,497,706 6,769,043 4,433,174 4,093,036 2,408,449 10,427,067 11,110,364 6,876,298 12,892,096 4,036,486 74,543,719 Change in net position 42,907 2,349,067 (687) 1,364,632 (412,485) 3,035,558 3,398,144 1,117,725 4,296,427 (63,980) 15,127,308
(6,745,897) (5,980,389) 108,396 (6,791,779) (305,320) (16,427,162) (12,299,079) (2,299,723) (17,570,598) (1,666,562) (69,978,113) (632,577) - - - - (417,225) - - - - (1,049,802)
(7,378,474) (5,980,389) 108,396 (6,791,779) (305,320) (16,844,387) (12,299,079) (2,299,723) (17,570,598) (1,666,562) (71,027,915)
Net position (deficit) - June 30, 2021 (7,335,567)$ (3,631,322)$ 107,709$ (5,427,147)$ (717,805)$ (13,808,829)$ (8,900,935)$ (1,181,998)$ (13,274,171)$ (1,730,542)$ (55,900,607)$
Net position (deficit) as previously reported - July 1, 2020
Net position (deficit) as restated - July 1, 2020
Restatement for correction of an error
Independent Auditor’s Report on Supplementary Information
Board of Education Joint School District No. 28-J of the Counties of Adams and Arapahoe, Colorado Aurora, Colorado Our audit was conducted for the purpose of forming an opinion on the financial statements that collectively comprise the District’s basic financial statements. The Auditors Integrity Report is presented for purposes of additional analysis and is not a required part of the financial statements. The Auditors Integrity Report is the responsibility of management and was derived from and relates directly to the underlying accounting and other records used to prepare the financial statements. The Auditors Integrity Report has been subjected to the auditing procedures applied in the audit of the financial statements and certain additional procedures, including comparing and reconciling such information directly to the underlying accounting and other records used to prepare the financial statements or to the financial statements themselves, and other additional procedures in accordance with auditing standards generally accepted in the United States of America. In our opinion, based on our audit, the procedures performed described above, and the reports of other auditors, the Auditors Integrity Report is fairly stated, in all material respects, in relation to the basic financial statements as a whole.
Denver, Colorado November 3, 2021
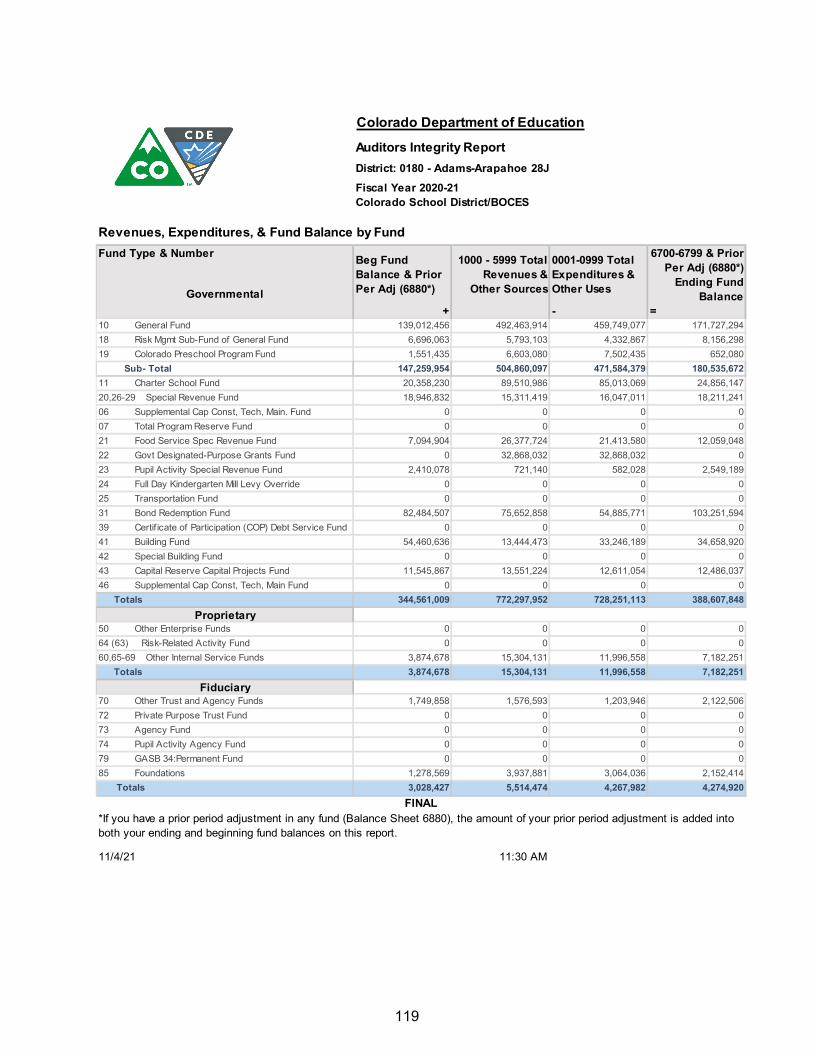
119
Colorado Department of Education – Auditor’s Integrity Report Colorado Department of Education – Auditor’s Integrity Report
Colorado Department of Education
Auditors Integrity ReportDistrict: 0180 - Adams-Arapahoe 28JFiscal Year 2020-21Colorado School District/BOCES
Fund Type & Number
Governmental+ - =
10 General Fund 139,012,456 492,463,914 459,749,077 171,727,29418 Risk Mgmt Sub-Fund of General Fund 6,696,063 5,793,103 4,332,867 8,156,29819 Colorado Preschool Program Fund 1,551,435 6,603,080 7,502,435 652,080 Sub- Total 147,259,954 504,860,097 471,584,379 180,535,67211 Charter School Fund 20,358,230 89,510,986 85,013,069 24,856,14720,26-29 Special Revenue Fund 18,946,832 15,311,419 16,047,011 18,211,24106 Supplemental Cap Const, Tech, Main. Fund 0 0 0 007 Total Program Reserve Fund 0 0 0 021 Food Service Spec Revenue Fund 7,094,904 26,377,724 21,413,580 12,059,04822 Govt Designated-Purpose Grants Fund 0 32,868,032 32,868,032 023 Pupil Activity Special Revenue Fund 2,410,078 721,140 582,028 2,549,18924 Full Day Kindergarten Mill Levy Override 0 0 0 025 Transportation Fund 0 0 0 031 Bond Redemption Fund 82,484,507 75,652,858 54,885,771 103,251,59439 Certif icate of Participation (COP) Debt Service Fund 0 0 0 041 Building Fund 54,460,636 13,444,473 33,246,189 34,658,92042 Special Building Fund 0 0 0 043 Capital Reserve Capital Projects Fund 11,545,867 13,551,224 12,611,054 12,486,03746 Supplemental Cap Const, Tech, Main Fund 0 0 0 0 Totals 344,561,009 772,297,952 728,251,113 388,607,848
Proprietary50 Other Enterprise Funds 0 0 0 064 (63) Risk-Related Activity Fund 0 0 0 060,65-69 Other Internal Service Funds 3,874,678 15,304,131 11,996,558 7,182,251 Totals 3,874,678 15,304,131 11,996,558 7,182,251
Fiduciary70 Other Trust and Agency Funds 1,749,858 1,576,593 1,203,946 2,122,50672 Private Purpose Trust Fund 0 0 0 073 Agency Fund 0 0 0 074 Pupil Activity Agency Fund 0 0 0 079 GASB 34:Permanent Fund 0 0 0 085 Foundations 1,278,569 3,937,881 3,064,036 2,152,414 Totals 3,028,427 5,514,474 4,267,982 4,274,920
11/4/21 11:30 AM
Revenues, Expenditures, & Fund Balance by Fund
*If you have a prior period adjustment in any fund (Balance Sheet 6880), the amount of your prior period adjustment is added into both your ending and beginning fund balances on this report.
Beg Fund Balance & Prior Per Adj (6880*)
1000 - 5999 Total Revenues &
Other Sources
0001-0999 Total Expenditures & Other Uses
6700-6799 & Prior Per Adj (6880*)
Ending Fund Balance
FINAL

120
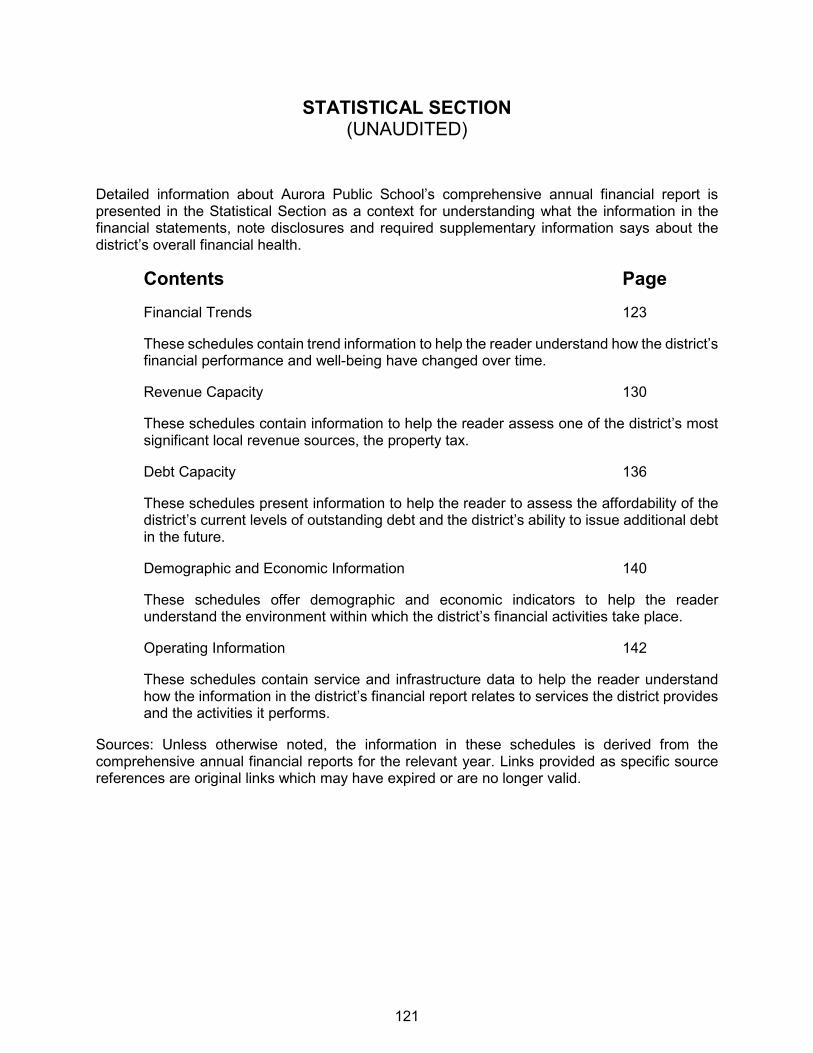
121
STATISTICAL SECTION (UNAUDITED)
Detailed information about Aurora Public School’s comprehensive annual financial report is presented in the Statistical Section as a context for understanding what the information in the financial statements, note disclosures and required supplementary information says about the district’s overall financial health.
Contents Page Financial Trends 123
These schedules contain trend information to help the reader understand how the district’s financial performance and well-being have changed over time.
Revenue Capacity 130
These schedules contain information to help the reader assess one of the district’s most significant local revenue sources, the property tax.
Debt Capacity 136
These schedules present information to help the reader to assess the affordability of the district’s current levels of outstanding debt and the district’s ability to issue additional debt in the future.
Demographic and Economic Information 140
These schedules offer demographic and economic indicators to help the reader understand the environment within which the district’s financial activities take place.
Operating Information 142
These schedules contain service and infrastructure data to help the reader understand how the information in the district’s financial report relates to services the district provides and the activities it performs.
Sources: Unless otherwise noted, the information in these schedules is derived from the comprehensive annual financial reports for the relevant year. Links provided as specific source references are original links which may have expired or are no longer valid.

122

Joint School District No. 28-J of the Counties of Adams and Arapahoe, Colorado Net Position by Component Last Ten Fiscal Years (Unaudited)
123
Net Position by Component
2011-12 2012-13 2013-14 2014-15 2015-16 2016-17 2017-18 2018-19 2019-20 2020-21 Governmental activities:
Net investment in capital assets 42,927,651$ 42,911,327$ 37,449,664$ 18,748,887$ 24,061,345$ 33,582,219$ 64,577,395$ 74,657,134$ 103,888,391$ 117,415,039$ Restricted 48,653,480 41,867,572 46,083,688 50,648,446 57,065,755 68,241,264 76,663,926 97,255,276 121,774,324 145,580,575 Unrestricted 6,764,197 17,179,763 22,608,607 (615,197,910) (668,057,787) (946,564,450) (1,261,588,811) (1,112,597,303) (952,998,885) (724,033,638)
Total governmental activities net position (deficit) 98,345,328 101,958,662 106,141,959 (545,800,577) (586,930,687) (844,740,967) (1,120,347,490) (940,684,893) (727,336,170) (461,038,024)
Business-type activityNet investment in capital assets 3,076,190 2,850,056 2,587,332 - - - - - - - Unrestricted 2,961,131 3,912,633 4,082,459 - - - - - - -
Total business-type activity net position 6,037,321 6,762,689 6,669,791 - - - - - - -
Primary governmentNet investment in capital assets 46,003,841 45,761,383 40,036,996 18,748,887 24,061,345 33,582,219 64,577,395 74,657,134 103,888,391 117,415,039 Restricted 48,653,480 41,867,572 46,083,688 50,648,446 57,065,755 68,241,264 76,663,926 97,255,276 121,774,324 145,580,575 Unrestricted 9,725,328 21,092,396 26,691,066 (615,197,910) (668,057,787) (946,564,450) (1,261,588,811) (1,112,597,303) (952,998,885) (724,033,638)
Total governmental activities net position (deficit) 104,382,649$ 108,721,351$ 112,811,750$ (545,800,577)$ (586,930,687)$ (844,740,967)$ (1,120,347,490)$ (940,684,893)$ (727,336,170)$ (461,038,024)$
Note 1: This schedule consolidates data from the government-wide financial statements that utilize the full accrual basis of accounting.Note 2: During 2013-14, the district adopted GASB 65 which resulted in a restatement for bond issue costs from prior accounting guidance. Prior year and earlier have not been restated for the adoption of GASB 65 because it is impractical to do so. Note 3: In previous years, the business-type activity of the district was comprised wholly of the Nutrition Services Fund. During fiscal year 2014-15, the Nutrition Services Fund type was changed to a Special Revenue Fund as required by the Colorado Department of Education, which is reported with the governmental activities of the district. As such, the district no longer reports any business-type activities.Note 4: During 2014-15, the district adopted GASB 68. Prior year and earlier have not been restated for the adoption of GASB 68 because it is impractical to do so.
Fiscal Year

Joint School District No. 28-J of the Counties of Adams and Arapahoe, Colorado Expenses, Program Revenues and Net (Expense)/Revenue Last Ten Fiscal Years (Unaudited)
124
Expenses, Program Revenues and Net (Expense)/Revenue
2011-12 2012-13 2013-14 2014-15 2015-16 2016-17 2017-18 2018-19 2019-2020 2020-2021EXPENSESGovernmental activities:
Instruction 192,168,046$ 200,510,721$ 214,719,376$ 244,552,029$ 267,967,412$ 387,982,826$ 380,254,999$ 170,369,692$ 174,053,652$ 167,588,694$ Supporting services 124,507,646 130,921,536 142,859,860 183,829,425 210,162,350 318,968,190 329,952,503 183,868,742 202,640,036 227,614,744 Interest 18,109,635 15,802,312 15,983,970 15,552,211 14,960,302 17,363,928 20,695,296 19,877,104 19,565,840 19,452,373
Total governmental activities expense 334,785,327 347,234,569 373,563,206 443,933,665 493,090,064 724,314,944 730,902,798 374,115,538 396,259,528 414,655,811 Business-type activity:
Nutrition services 13,853,942 14,263,076 15,662,854 - - - - - - -
Total primary government expenses 348,639,269$ 361,497,645$ 389,226,060$ 443,933,665$ 493,090,064$ 724,314,944$ 730,902,798$ 374,115,538$ 396,259,528$ 414,655,811$
PROGRAM REVENUESGovernmental activities:
Charges for services--instruction programs 4,410,749$ 6,090,007$ 5,943,567$ 5,929,784$ 6,215,052$ 6,542,641$ 7,993,537$ 8,173,184$ 10,035,034$ 5,844,519$ Charges for services--other programs 3,603,248 3,876,927 4,018,397 5,892,764 5,436,096 6,002,869 7,341,251 8,615,894 10,516,367 10,719,662 Operating grants and contributions 39,139,140 31,675,763 36,117,378 51,189,828 55,215,023 57,223,026 58,038,488 65,770,177 65,875,346 160,437,356 Capital grants and contributions 166,213 88,872 3,339,536 1,094,341 1,637,303 4,181,729 5,532,458 4,213,538 1,567,907 4,881,784
Total governmental activities 47,319,350 41,731,569 49,418,878 64,106,717 68,503,474 73,950,265 78,905,734 86,772,793 87,994,654 181,883,321 Business-type activity:
Charges for services 1,818,918 1,667,562 1,762,922 - - - - - - - Operating grants and contributions 12,080,741 12,871,935 13,446,481 - - - - - - - Capital grants and contributions 365,883 226,322.00 126,065 - - - - - - -
Total business-type activities program revenues 14,265,542 14,765,819 15,335,468 - - - - - - -
Total primary government program revenues 61,584,892$ 56,497,388$ 64,754,346$ 64,106,717$ 68,503,474$ 73,950,265$ 78,905,734$ 86,772,793$ 87,994,654$ 181,883,321$
Net (expense) / revenueGovernmental activities (287,465,977)$ (305,503,000)$ (324,144,328)$ (379,826,948)$ (424,586,590)$ (650,364,679)$ (651,997,064)$ (287,342,745)$ (308,264,874)$ (232,772,490)$ Business-type activity 411,600 502,743 (327,386) - - - - - - -
Total primary government net expense (287,054,377)$ (305,000,257)$ (324,471,714)$ (379,826,948)$ (424,586,590)$ (650,364,679)$ (651,997,064)$ (287,342,745)$ (308,264,874)$ (232,772,490)$
Note 1: This schedule consolidates data from the government-wide financial statements that utilize the full accrual basis of accounting.Note 2: In previous years, the business-type activity of the district was comprised wholly of the Nutrition Services Fund. During fiscal year 2014-15, the Nutrition Services Fund type was changed to a Special Revenue Fund as required by the Colorado Department of Education, which is reported with the governmental activities of the district. As such, the district no longer reports any business-type activities.
Fiscal Year
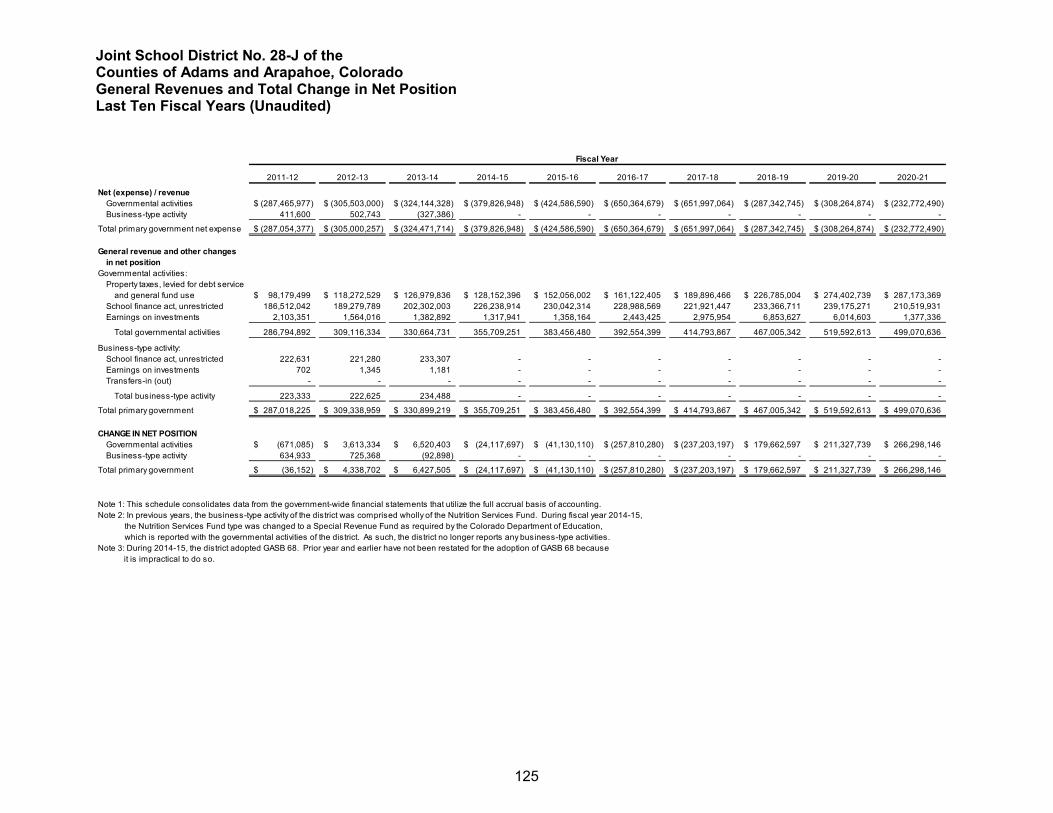
Joint School District No. 28-J of the Counties of Adams and Arapahoe, Colorado General Revenues and Total Change in Net Position Last Ten Fiscal Years (Unaudited)
125
General Revenues and Total Change in Net Position
2011-12 2012-13 2013-14 2014-15 2015-16 2016-17 2017-18 2018-19 2019-20 2020-21
Net (expense) / revenueGovernmental activities (287,465,977)$ (305,503,000)$ (324,144,328)$ (379,826,948)$ (424,586,590)$ (650,364,679)$ (651,997,064)$ (287,342,745)$ (308,264,874)$ (232,772,490)$ Business-type activity 411,600 502,743 (327,386) - - - - - - -
Total primary government net expense (287,054,377)$ (305,000,257)$ (324,471,714)$ (379,826,948)$ (424,586,590)$ (650,364,679)$ (651,997,064)$ (287,342,745)$ (308,264,874)$ (232,772,490)$
General revenue and other changesin net position
Governmental activities:Property taxes, levied for debt service
and general fund use 98,179,499$ 118,272,529$ 126,979,836$ 128,152,396$ 152,056,002$ 161,122,405$ 189,896,466$ 226,785,004$ 274,402,739$ 287,173,369$ School finance act, unrestricted 186,512,042 189,279,789 202,302,003 226,238,914 230,042,314 228,988,569 221,921,447 233,366,711 239,175,271 210,519,931 Earnings on investments 2,103,351 1,564,016 1,382,892 1,317,941 1,358,164 2,443,425 2,975,954 6,853,627 6,014,603 1,377,336
Total governmental activities 286,794,892 309,116,334 330,664,731 355,709,251 383,456,480 392,554,399 414,793,867 467,005,342 519,592,613 499,070,636
Business-type activity:School finance act, unrestricted 222,631 221,280 233,307 - - - - - - - Earnings on investments 702 1,345 1,181 - - - - - - - Transfers-in (out) - - - - - - - - - -
Total business-type activity 223,333 222,625 234,488 - - - - - - -
Total primary government 287,018,225$ 309,338,959$ 330,899,219$ 355,709,251$ 383,456,480$ 392,554,399$ 414,793,867$ 467,005,342$ 519,592,613$ 499,070,636$
CHANGE IN NET POSITIONGovernmental activities (671,085)$ 3,613,334$ 6,520,403$ (24,117,697)$ (41,130,110)$ (257,810,280)$ (237,203,197)$ 179,662,597$ 211,327,739$ 266,298,146$ Business-type activity 634,933 725,368 (92,898) - - - - - - -
Total primary government (36,152)$ 4,338,702$ 6,427,505$ (24,117,697)$ (41,130,110)$ (257,810,280)$ (237,203,197)$ 179,662,597$ 211,327,739$ 266,298,146$
Note 1: This schedule consolidates data from the government-wide financial statements that utilize the full accrual basis of accounting.Note 2: In previous years, the business-type activity of the district was comprised wholly of the Nutrition Services Fund. During fiscal year 2014-15, the Nutrition Services Fund type was changed to a Special Revenue Fund as required by the Colorado Department of Education, which is reported with the governmental activities of the district. As such, the district no longer reports any business-type activities.Note 3: During 2014-15, the district adopted GASB 68. Prior year and earlier have not been restated for the adoption of GASB 68 because
it is impractical to do so.
Fiscal Year
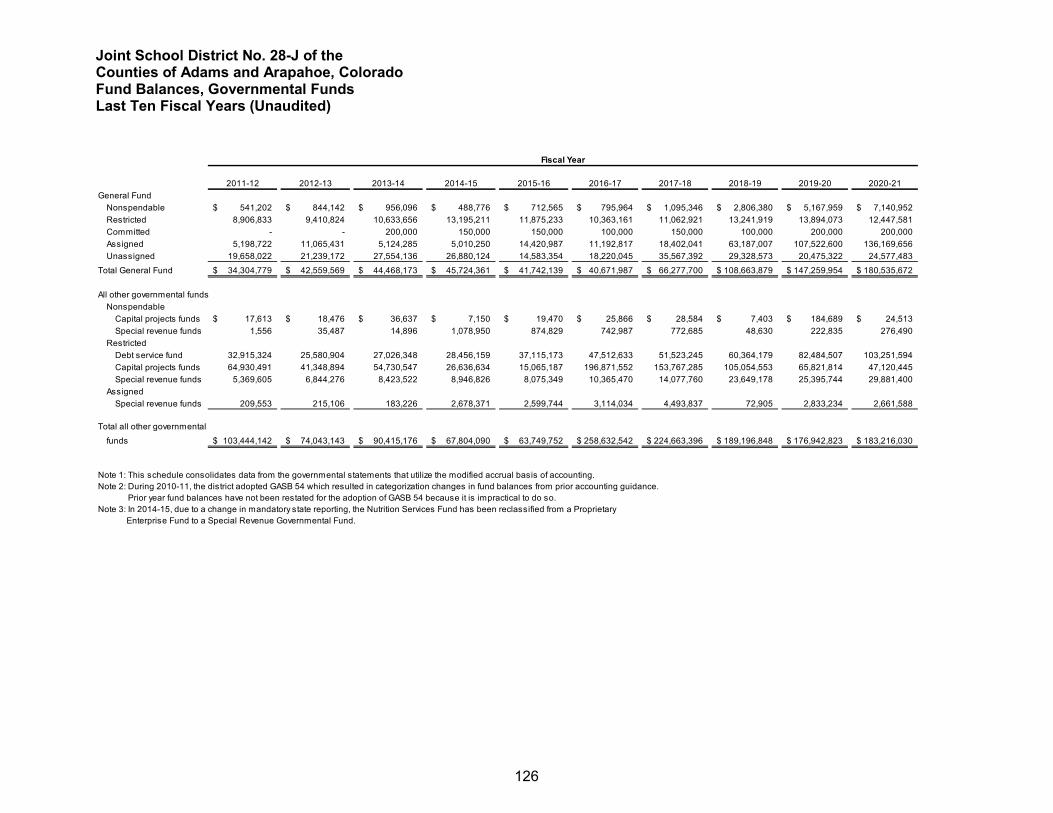
Joint School District No. 28-J of the Counties of Adams and Arapahoe, Colorado Fund Balances, Governmental Funds Last Ten Fiscal Years (Unaudited)
126
Fund Balances, Governmental Funds
2011-12 2012-13 2013-14 2014-15 2015-16 2016-17 2017-18 2018-19 2019-20 2020-21General Fund
Nonspendable 541,202$ 844,142$ 956,096$ 488,776$ 712,565$ 795,964$ 1,095,346$ 2,806,380$ 5,167,959$ 7,140,952$ Restricted 8,906,833 9,410,824 10,633,656 13,195,211 11,875,233 10,363,161 11,062,921 13,241,919 13,894,073 12,447,581 Committed - - 200,000 150,000 150,000 100,000 150,000 100,000 200,000 200,000 Assigned 5,198,722 11,065,431 5,124,285 5,010,250 14,420,987 11,192,817 18,402,041 63,187,007 107,522,600 136,169,656 Unassigned 19,658,022 21,239,172 27,554,136 26,880,124 14,583,354 18,220,045 35,567,392 29,328,573 20,475,322 24,577,483
Total General Fund 34,304,779$ 42,559,569$ 44,468,173$ 45,724,361$ 41,742,139$ 40,671,987$ 66,277,700$ 108,663,879$ 147,259,954$ 180,535,672$
All other governmental fundsNonspendable
Capital projects funds 17,613$ 18,476$ 36,637$ 7,150$ 19,470$ 25,866$ 28,584$ 7,403$ 184,689$ 24,513$ Special revenue funds 1,556 35,487 14,896 1,078,950 874,829 742,987 772,685 48,630 222,835 276,490
RestrictedDebt service fund 32,915,324 25,580,904 27,026,348 28,456,159 37,115,173 47,512,633 51,523,245 60,364,179 82,484,507 103,251,594 Capital projects funds 64,930,491 41,348,894 54,730,547 26,636,634 15,065,187 196,871,552 153,767,285 105,054,553 65,821,814 47,120,445 Special revenue funds 5,369,605 6,844,276 8,423,522 8,946,826 8,075,349 10,365,470 14,077,760 23,649,178 25,395,744 29,881,400
AssignedSpecial revenue funds 209,553 215,106 183,226 2,678,371 2,599,744 3,114,034 4,493,837 72,905 2,833,234 2,661,588
103,444,142$ 74,043,143$ 90,415,176$ 67,804,090$ 63,749,752$ 258,632,542$ 224,663,396$ 189,196,848$ 176,942,823$ 183,216,030$
Note 1: This schedule consolidates data from the governmental statements that utilize the modified accrual basis of accounting.Note 2: During 2010-11, the district adopted GASB 54 which resulted in categorization changes in fund balances from prior accounting guidance.
Prior year fund balances have not been restated for the adoption of GASB 54 because it is impractical to do so.Note 3: In 2014-15, due to a change in mandatory state reporting, the Nutrition Services Fund has been reclassified from a Proprietary
Enterprise Fund to a Special Revenue Governmental Fund.
fundsTotal all other governmental
Fiscal Year
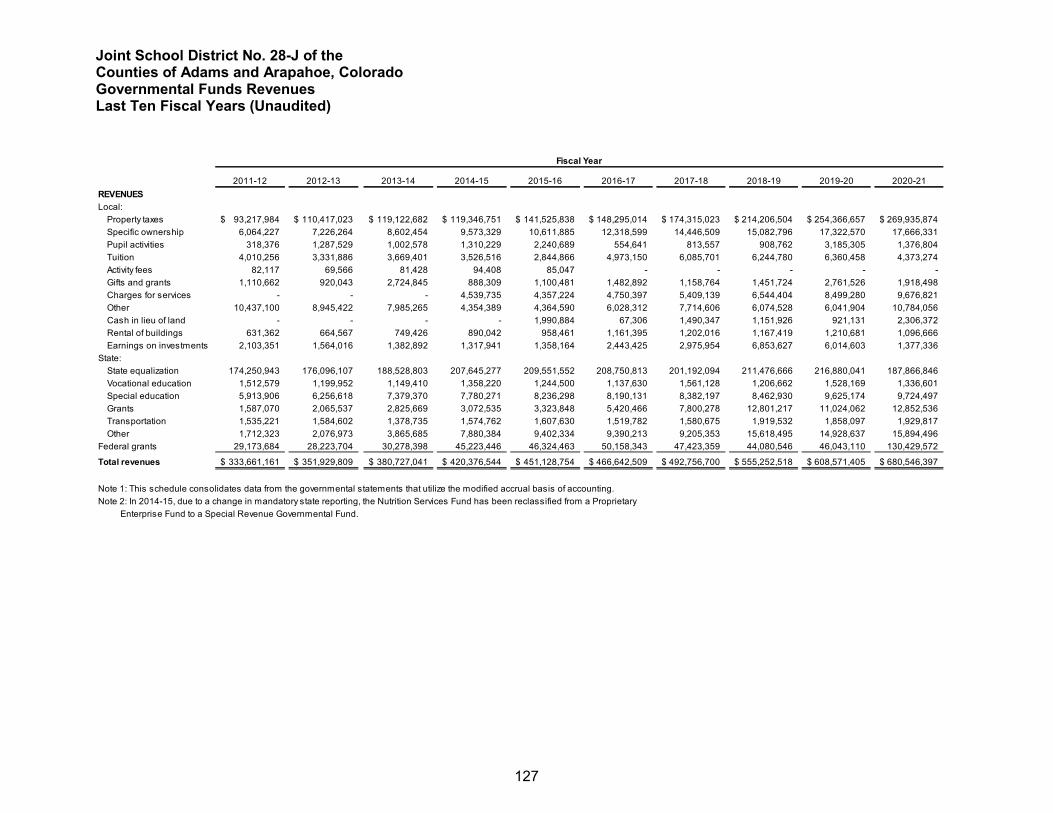
Joint School District No. 28-J of the Counties of Adams and Arapahoe, Colorado Governmental Funds Revenues Last Ten Fiscal Years (Unaudited)
127
Governmental Funds Revenues
2011-12 2012-13 2013-14 2014-15 2015-16 2016-17 2017-18 2018-19 2019-20 2020-21REVENUESLocal:
Property taxes 93,217,984$ 110,417,023$ 119,122,682$ 119,346,751$ 141,525,838$ 148,295,014$ 174,315,023$ 214,206,504$ 254,366,657$ 269,935,874$ Specific ownership 6,064,227 7,226,264 8,602,454 9,573,329 10,611,885 12,318,599 14,446,509 15,082,796 17,322,570 17,666,331 Pupil activities 318,376 1,287,529 1,002,578 1,310,229 2,240,689 554,641 813,557 908,762 3,185,305 1,376,804 Tuition 4,010,256 3,331,886 3,669,401 3,526,516 2,844,866 4,973,150 6,085,701 6,244,780 6,360,458 4,373,274 Activity fees 82,117 69,566 81,428 94,408 85,047 - - - - - Gifts and grants 1,110,662 920,043 2,724,845 888,309 1,100,481 1,482,892 1,158,764 1,451,724 2,761,526 1,918,498 Charges for services - - - 4,539,735 4,357,224 4,750,397 5,409,139 6,544,404 8,499,280 9,676,821 Other 10,437,100 8,945,422 7,985,265 4,354,389 4,364,590 6,028,312 7,714,606 6,074,528 6,041,904 10,784,056 Cash in lieu of land - - - - 1,990,884 67,306 1,490,347 1,151,926 921,131 2,306,372 Rental of buildings 631,362 664,567 749,426 890,042 958,461 1,161,395 1,202,016 1,167,419 1,210,681 1,096,666 Earnings on investments 2,103,351 1,564,016 1,382,892 1,317,941 1,358,164 2,443,425 2,975,954 6,853,627 6,014,603 1,377,336
State: State equalization 174,250,943 176,096,107 188,528,803 207,645,277 209,551,552 208,750,813 201,192,094 211,476,666 216,880,041 187,866,846 Vocational education 1,512,579 1,199,952 1,149,410 1,358,220 1,244,500 1,137,630 1,561,128 1,206,662 1,528,169 1,336,601 Special education 5,913,906 6,256,618 7,379,370 7,780,271 8,236,298 8,190,131 8,382,197 8,462,930 9,625,174 9,724,497 Grants 1,587,070 2,065,537 2,825,669 3,072,535 3,323,848 5,420,466 7,800,278 12,801,217 11,024,062 12,852,536 Transportation 1,535,221 1,584,602 1,378,735 1,574,762 1,607,630 1,519,782 1,580,675 1,919,532 1,858,097 1,929,817 Other 1,712,323 2,076,973 3,865,685 7,880,384 9,402,334 9,390,213 9,205,353 15,618,495 14,928,637 15,894,496
Federal grants 29,173,684 28,223,704 30,278,398 45,223,446 46,324,463 50,158,343 47,423,359 44,080,546 46,043,110 130,429,572
Total revenues 333,661,161$ 351,929,809$ 380,727,041$ 420,376,544$ 451,128,754$ 466,642,509$ 492,756,700$ 555,252,518$ 608,571,405$ 680,546,397$
Note 1: This schedule consolidates data from the governmental statements that utilize the modified accrual basis of accounting.Note 2: In 2014-15, due to a change in mandatory state reporting, the Nutrition Services Fund has been reclassified from a Proprietary Enterprise Fund to a Special Revenue Governmental Fund.
Fiscal Year
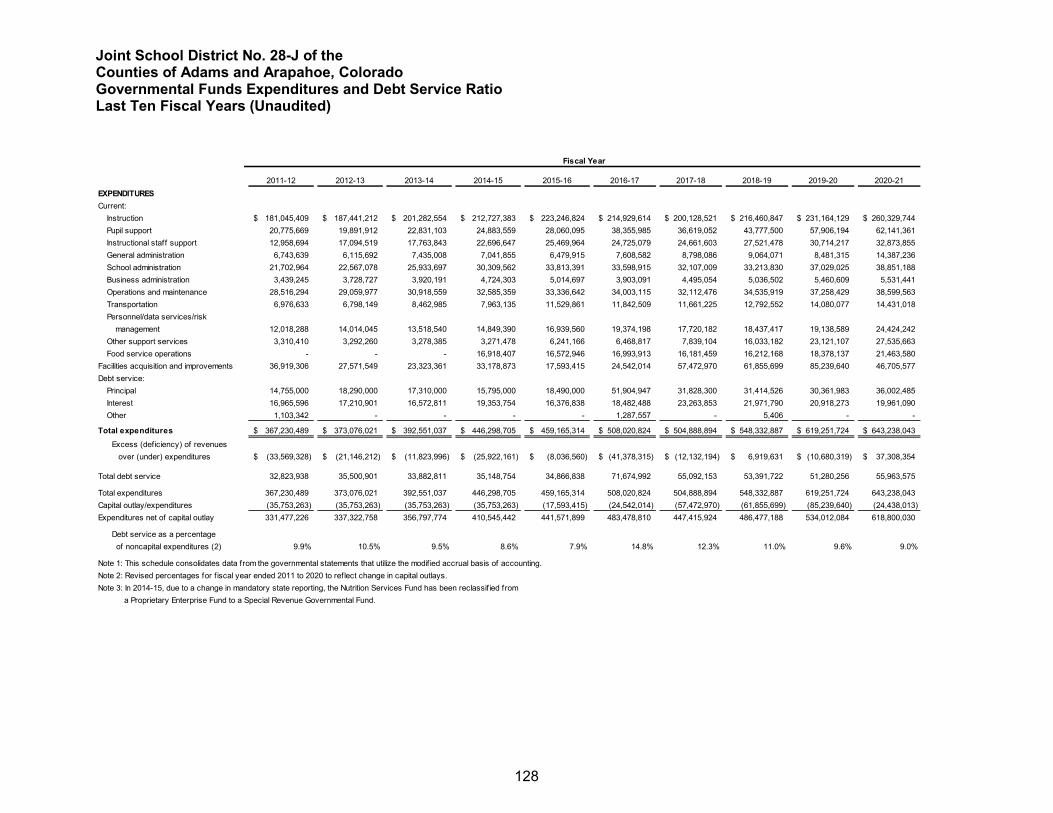
Joint School District No. 28-J of the Counties of Adams and Arapahoe, Colorado Governmental Funds Expenditures and Debt Service Ratio Last Ten Fiscal Years (Unaudited)
128
Governmental Funds Expenditures and Debt Service Ratio
2011-12 2012-13 2013-14 2014-15 2015-16 2016-17 2017-18 2018-19 2019-20 2020-21EXPENDITURESCurrent:
Instruction 181,045,409$ 187,441,212$ 201,282,554$ 212,727,383$ 223,246,824$ 214,929,614$ 200,128,521$ 216,460,847$ 231,164,129$ 260,329,744$ Pupil support 20,775,669 19,891,912 22,831,103 24,883,559 28,060,095 38,355,985 36,619,052 43,777,500 57,906,194 62,141,361 Instructional staff support 12,958,694 17,094,519 17,763,843 22,696,647 25,469,964 24,725,079 24,661,603 27,521,478 30,714,217 32,873,855 General administration 6,743,639 6,115,692 7,435,008 7,041,855 6,479,915 7,608,582 8,798,086 9,064,071 8,481,315 14,387,236 School administration 21,702,964 22,567,078 25,933,697 30,309,562 33,813,391 33,598,915 32,107,009 33,213,830 37,029,025 38,851,188 Business administration 3,439,245 3,728,727 3,920,191 4,724,303 5,014,697 3,903,091 4,495,054 5,036,502 5,460,609 5,531,441 Operations and maintenance 28,516,294 29,059,977 30,918,559 32,585,359 33,336,642 34,003,115 32,112,476 34,535,919 37,258,429 38,599,563 Transportation 6,976,633 6,798,149 8,462,985 7,963,135 11,529,861 11,842,509 11,661,225 12,792,552 14,080,077 14,431,018 Personnel/data services/risk
management 12,018,288 14,014,045 13,518,540 14,849,390 16,939,560 19,374,198 17,720,182 18,437,417 19,138,589 24,424,242 Other support services 3,310,410 3,292,260 3,278,385 3,271,478 6,241,166 6,468,817 7,839,104 16,033,182 23,121,107 27,535,663 Food service operations - - - 16,918,407 16,572,946 16,993,913 16,181,459 16,212,168 18,378,137 21,463,580
Facilities acquisition and improvements 36,919,306 27,571,549 23,323,361 33,178,873 17,593,415 24,542,014 57,472,970 61,855,699 85,239,640 46,705,577 Debt service:
Principal 14,755,000 18,290,000 17,310,000 15,795,000 18,490,000 51,904,947 31,828,300 31,414,526 30,361,983 36,002,485 Interest 16,965,596 17,210,901 16,572,811 19,353,754 16,376,838 18,482,488 23,263,853 21,971,790 20,918,273 19,961,090 Other 1,103,342 - - - - 1,287,557 - 5,406 - -
Total expenditures 367,230,489$ 373,076,021$ 392,551,037$ 446,298,705$ 459,165,314$ 508,020,824$ 504,888,894$ 548,332,887$ 619,251,724$ 643,238,043$
Excess (deficiency) of revenues over (under) expenditures (33,569,328)$ (21,146,212)$ (11,823,996)$ (25,922,161)$ (8,036,560)$ (41,378,315)$ (12,132,194)$ 6,919,631$ (10,680,319)$ 37,308,354$
Total debt service 32,823,938 35,500,901 33,882,811 35,148,754 34,866,838 71,674,992 55,092,153 53,391,722 51,280,256 55,963,575
Total expenditures 367,230,489 373,076,021 392,551,037 446,298,705 459,165,314 508,020,824 504,888,894 548,332,887 619,251,724 643,238,043Capital outlay/expenditures (35,753,263) (35,753,263) (35,753,263) (35,753,263) (17,593,415) (24,542,014) (57,472,970) (61,855,699) (85,239,640) (24,438,013) Expenditures net of capital outlay 331,477,226 337,322,758 356,797,774 410,545,442 441,571,899 483,478,810 447,415,924 486,477,188 534,012,084 618,800,030
Debt service as a percentage of noncapital expenditures (2) 9.9% 10.5% 9.5% 8.6% 7.9% 14.8% 12.3% 11.0% 9.6% 9.0%
Note 1: This schedule consolidates data from the governmental statements that utilize the modif ied accrual basis of accounting.Note 2: Revised percentages for f iscal year ended 2011 to 2020 to reflect change in capital outlays.Note 3: In 2014-15, due to a change in mandatory state reporting, the Nutrition Services Fund has been reclassif ied from a Proprietary Enterprise Fund to a Special Revenue Governmental Fund.
Fiscal Year
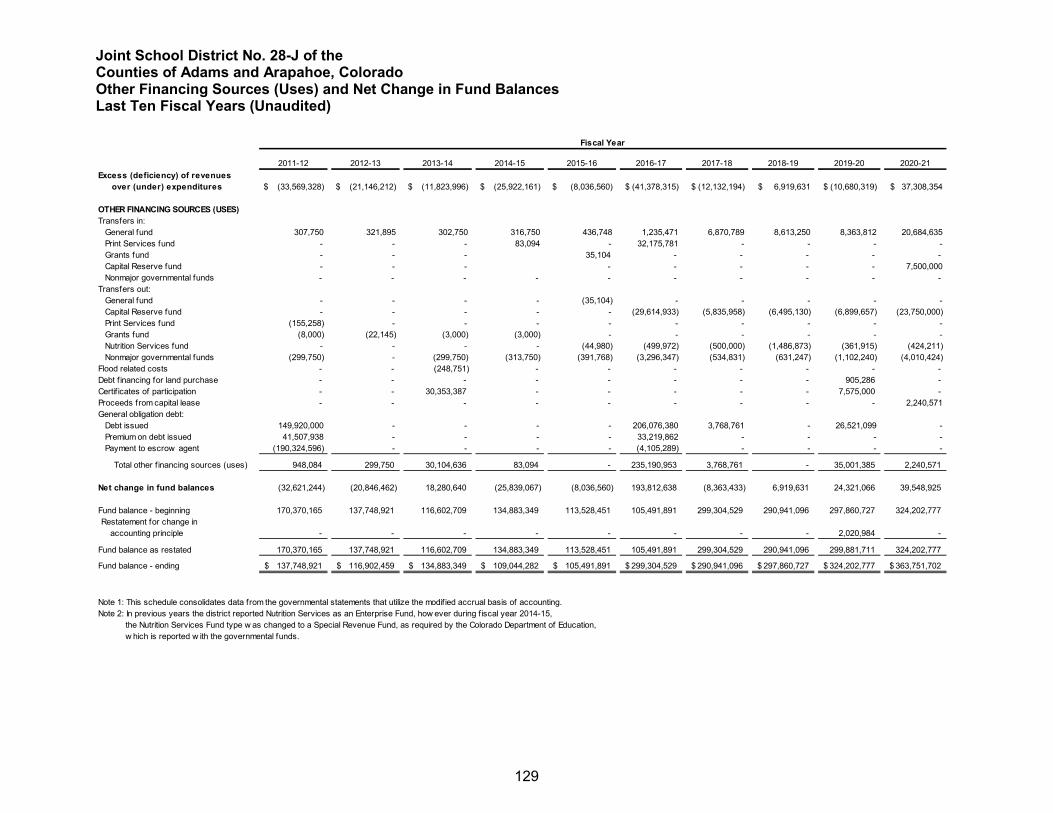
Joint School District No. 28-J of the Counties of Adams and Arapahoe, Colorado Other Financing Sources (Uses) and Net Change in Fund Balances Last Ten Fiscal Years (Unaudited)
129
Other Financing Sources (Uses) and Net Change in Fund Balances
2011-12 2012-13 2013-14 2014-15 2015-16 2016-17 2017-18 2018-19 2019-20 2020-21Excess (deficiency) of revenues
over (under) expenditures $ (33,569,328) $ (21,146,212) $ (11,823,996) $ (25,922,161) $ (8,036,560) $ (41,378,315) $ (12,132,194) $ 6,919,631 $ (10,680,319) $ 37,308,354
OTHER FINANCING SOURCES (USES)Transfers in:
General fund 307,750 321,895 302,750 316,750 436,748 1,235,471 6,870,789 8,613,250 8,363,812 20,684,635 Print Services fund - - - 83,094 - 32,175,781 - - - - Grants fund - - - 35,104 - - - - - Capital Reserve fund - - - - - - - - 7,500,000 Nonmajor governmental funds - - - - - - - - - -
Transfers out:General fund - - - - (35,104) - - - - - Capital Reserve fund - - - - - (29,614,933) (5,835,958) (6,495,130) (6,899,657) (23,750,000)Print Services fund (155,258) - - - - - - - - - Grants fund (8,000) (22,145) (3,000) (3,000) - - - - - - Nutrition Services fund - - - - (44,980) (499,972) (500,000) (1,486,873) (361,915) (424,211)Nonmajor governmental funds (299,750) - (299,750) (313,750) (391,768) (3,296,347) (534,831) (631,247) (1,102,240) (4,010,424)
Flood related costs - - (248,751) - - - - - - - Debt f inancing for land purchase - - - - - - - - 905,286 - Certif icates of participation - - 30,353,387 - - - - - 7,575,000 - Proceeds from capital lease - - - - - - - - - 2,240,571 General obligation debt:
Debt issued 149,920,000 - - - - 206,076,380 3,768,761 - 26,521,099 - Premium on debt issued 41,507,938 - - - - 33,219,862 - - - - Payment to escrow agent (190,324,596) - - - - (4,105,289) - - - -
Total other f inancing sources (uses) 948,084 299,750 30,104,636 83,094 - 235,190,953 3,768,761 - 35,001,385 2,240,571
Net change in fund balances (32,621,244) (20,846,462) 18,280,640 (25,839,067) (8,036,560) 193,812,638 (8,363,433) 6,919,631 24,321,066 39,548,925
Fund balance - beginning 170,370,165 137,748,921 116,602,709 134,883,349 113,528,451 105,491,891 299,304,529 290,941,096 297,860,727 324,202,777 Restatement for change in
accounting principle - - - - - - - - 2,020,984 -
Fund balance as restated 170,370,165 137,748,921 116,602,709 134,883,349 113,528,451 105,491,891 299,304,529 290,941,096 299,881,711 324,202,777
Fund balance - ending 137,748,921$ 116,902,459$ 134,883,349$ 109,044,282$ 105,491,891$ 299,304,529$ 290,941,096$ 297,860,727$ 324,202,777$ 363,751,702$
Note 1: This schedule consolidates data from the governmental statements that utilize the modif ied accrual basis of accounting.Note 2: In previous years the district reported Nutrition Services as an Enterprise Fund, how ever during f iscal year 2014-15, the Nutrition Services Fund type w as changed to a Special Revenue Fund, as required by the Colorado Department of Education, w hich is reported w ith the governmental funds.
Fiscal Year
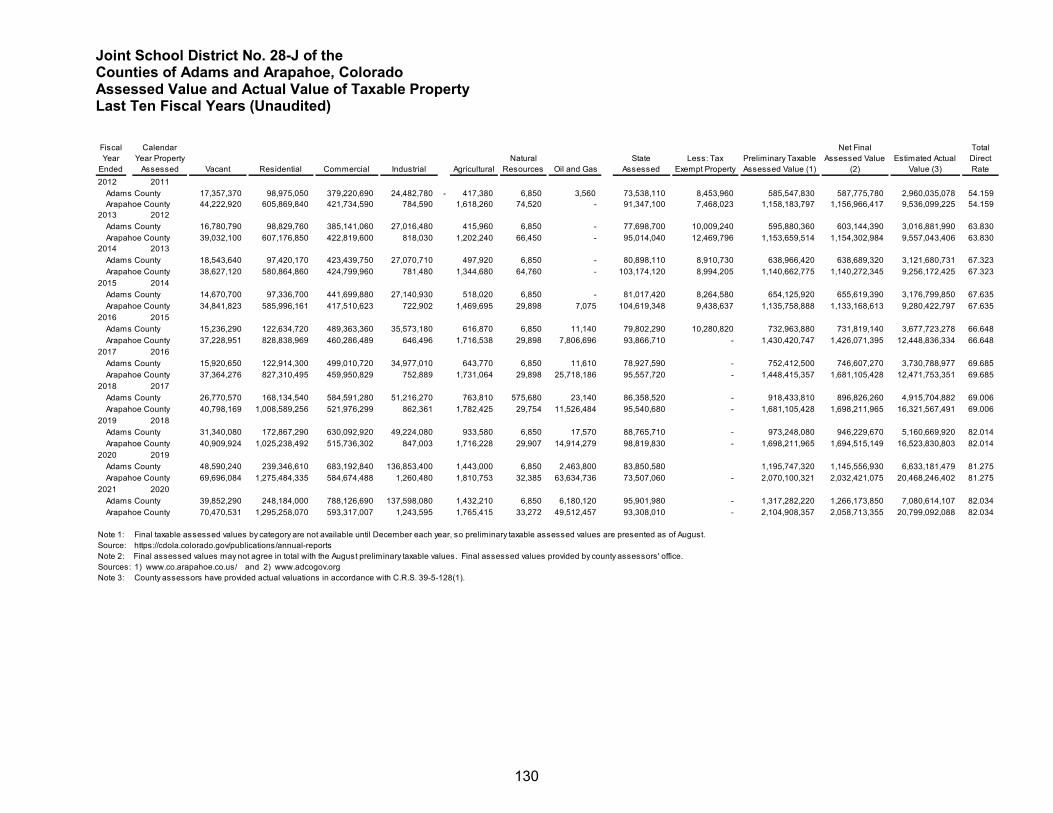
Joint School District No. 28-J of the Counties of Adams and Arapahoe, Colorado Assessed Value and Actual Value of Taxable Property Last Ten Fiscal Years (Unaudited)
130
Assessed Value and Actual Value of Taxable Property
Fiscal Year
Ended
Calendar Year Property
Assessed Vacant Residential Commercial Industrial AgriculturalNatural
Resources Oil and Gas State
AssessedLess: Tax
Exempt PropertyPreliminary Taxable Assessed Value (1)
Net Final Assessed Value
(2)Estimated Actual
Value (3)
Total Direct Rate
2012 2011Adams County 17,357,370 98,975,050 379,220,690 24,482,780 - 417,380 6,850 3,560 73,538,110 8,453,960 585,547,830 587,775,780 2,960,035,078 54.159 Arapahoe County 44,222,920 605,869,840 421,734,590 784,590 1,618,260 74,520 - 91,347,100 7,468,023 1,158,183,797 1,156,966,417 9,536,099,225 54.159
2013 2012Adams County 16,780,790 98,829,760 385,141,060 27,016,480 415,960 6,850 - 77,698,700 10,009,240 595,880,360 603,144,390 3,016,881,990 63.830 Arapahoe County 39,032,100 607,176,850 422,819,600 818,030 1,202,240 66,450 - 95,014,040 12,469,796 1,153,659,514 1,154,302,984 9,557,043,406 63.830
2014 2013Adams County 18,543,640 97,420,170 423,439,750 27,070,710 497,920 6,850 - 80,898,110 8,910,730 638,966,420 638,689,320 3,121,680,731 67.323 Arapahoe County 38,627,120 580,864,860 424,799,960 781,480 1,344,680 64,760 - 103,174,120 8,994,205 1,140,662,775 1,140,272,345 9,256,172,425 67.323
2015 2014Adams County 14,670,700 97,336,700 441,699,880 27,140,930 518,020 6,850 - 81,017,420 8,264,580 654,125,920 655,619,390 3,176,799,850 67.635 Arapahoe County 34,841,823 585,996,161 417,510,623 722,902 1,469,695 29,898 7,075 104,619,348 9,438,637 1,135,758,888 1,133,168,613 9,280,422,797 67.635
2016 2015Adams County 15,236,290 122,634,720 489,363,360 35,573,180 616,870 6,850 11,140 79,802,290 10,280,820 732,963,880 731,819,140 3,677,723,278 66.648 Arapahoe County 37,228,951 828,838,969 460,286,489 646,496 1,716,538 29,898 7,806,696 93,866,710 - 1,430,420,747 1,426,071,395 12,448,836,334 66.648
2017 2016Adams County 15,920,650 122,914,300 499,010,720 34,977,010 643,770 6,850 11,610 78,927,590 - 752,412,500 746,607,270 3,730,788,977 69.685 Arapahoe County 37,364,276 827,310,495 459,950,829 752,889 1,731,064 29,898 25,718,186 95,557,720 - 1,448,415,357 1,681,105,428 12,471,753,351 69.685
2018 2017Adams County 26,770,570 168,134,540 584,591,280 51,216,270 763,810 575,680 23,140 86,358,520 - 918,433,810 896,826,260 4,915,704,882 69.006 Arapahoe County 40,798,169 1,008,589,256 521,976,299 862,361 1,782,425 29,754 11,526,484 95,540,680 - 1,681,105,428 1,698,211,965 16,321,567,491 69.006
2019 2018Adams County 31,340,080 172,867,290 630,092,920 49,224,080 933,580 6,850 17,570 88,765,710 - 973,248,080 946,229,670 5,160,669,920 82.014 Arapahoe County 40,909,924 1,025,238,492 515,736,302 847,003 1,716,228 29,907 14,914,279 98,819,830 - 1,698,211,965 1,694,515,149 16,523,830,803 82.014
2020 2019Adams County 48,590,240 239,346,610 683,192,840 136,853,400 1,443,000 6,850 2,463,800 83,850,580 1,195,747,320 1,145,556,930 6,633,181,479 81.275 Arapahoe County 69,696,084 1,275,484,335 584,674,488 1,260,480 1,810,753 32,385 63,634,736 73,507,060 - 2,070,100,321 2,032,421,075 20,468,246,402 81.275
2021 2020Adams County 39,852,290 248,184,000 788,126,690 137,598,080 1,432,210 6,850 6,180,120 95,901,980 - 1,317,282,220 1,266,173,850 7,080,614,107 82.034 Arapahoe County 70,470,531 1,295,258,070 593,317,007 1,243,595 1,765,415 33,272 49,512,457 93,308,010 - 2,104,908,357 2,058,713,355 20,799,092,088 82.034
Note 1: Source: https://cdola.colorado.gov/publications/annual-reportsNote 2: Final assessed values may not agree in total with the August preliminary taxable values. Final assessed values provided by county assessors' office.Sources: 1) www.co.arapahoe.co.us/ and 2) www.adcogov.orgNote 3: County assessors have provided actual valuations in accordance with C.R.S. 39-5-128(1).
Final taxable assessed values by category are not available until December each year, so preliminary taxable assessed values are presented as of August.

131
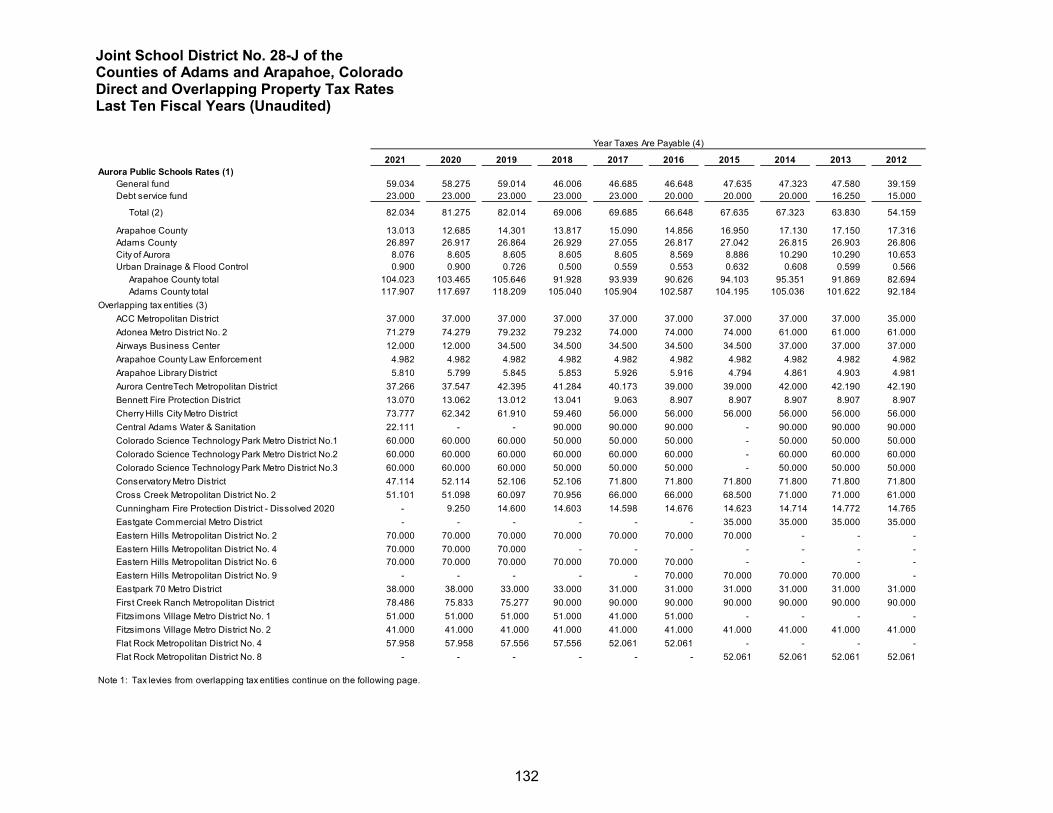
Joint School District No. 28-J of the Counties of Adams and Arapahoe, Colorado Direct and Overlapping Property Tax Rates Last Ten Fiscal Years (Unaudited)
132
Direct and Overlapping Property Tax Rates
2021 2020 2019 2018 2017 2016 2015 2014 2013 2012Aurora Public Schools Rates (1)
General fund 59.034 58.275 59.014 46.006 46.685 46.648 47.635 47.323 47.580 39.159 Debt service fund 23.000 23.000 23.000 23.000 23.000 20.000 20.000 20.000 16.250 15.000
Total (2) 82.034 81.275 82.014 69.006 69.685 66.648 67.635 67.323 63.830 54.159
Arapahoe County 13.013 12.685 14.301 13.817 15.090 14.856 16.950 17.130 17.150 17.316 Adams County 26.897 26.917 26.864 26.929 27.055 26.817 27.042 26.815 26.903 26.806 City of Aurora 8.076 8.605 8.605 8.605 8.605 8.569 8.886 10.290 10.290 10.653 Urban Drainage & Flood Control 0.900 0.900 0.726 0.500 0.559 0.553 0.632 0.608 0.599 0.566
Arapahoe County total 104.023 103.465 105.646 91.928 93.939 90.626 94.103 95.351 91.869 82.694 Adams County total 117.907 117.697 118.209 105.040 105.904 102.587 104.195 105.036 101.622 92.184
Overlapping tax entities (3)ACC Metropolitan District 37.000 37.000 37.000 37.000 37.000 37.000 37.000 37.000 37.000 35.000 Adonea Metro District No. 2 71.279 74.279 79.232 79.232 74.000 74.000 74.000 61.000 61.000 61.000 Airways Business Center 12.000 12.000 34.500 34.500 34.500 34.500 34.500 37.000 37.000 37.000 Arapahoe County Law Enforcement 4.982 4.982 4.982 4.982 4.982 4.982 4.982 4.982 4.982 4.982 Arapahoe Library District 5.810 5.799 5.845 5.853 5.926 5.916 4.794 4.861 4.903 4.981 Aurora CentreTech Metropolitan District 37.266 37.547 42.395 41.284 40.173 39.000 39.000 42.000 42.190 42.190 Bennett Fire Protection District 13.070 13.062 13.012 13.041 9.063 8.907 8.907 8.907 8.907 8.907 Cherry Hills City Metro District 73.777 62.342 61.910 59.460 56.000 56.000 56.000 56.000 56.000 56.000 Central Adams Water & Sanitation 22.111 - - 90.000 90.000 90.000 - 90.000 90.000 90.000 Colorado Science Technology Park Metro District No.1 60.000 60.000 60.000 50.000 50.000 50.000 - 50.000 50.000 50.000 Colorado Science Technology Park Metro District No.2 60.000 60.000 60.000 60.000 60.000 60.000 - 60.000 60.000 60.000 Colorado Science Technology Park Metro District No.3 60.000 60.000 60.000 50.000 50.000 50.000 - 50.000 50.000 50.000 Conservatory Metro District 47.114 52.114 52.106 52.106 71.800 71.800 71.800 71.800 71.800 71.800 Cross Creek Metropolitan District No. 2 51.101 51.098 60.097 70.956 66.000 66.000 68.500 71.000 71.000 61.000 Cunningham Fire Protection District - Dissolved 2020 - 9.250 14.600 14.603 14.598 14.676 14.623 14.714 14.772 14.765 Eastgate Commercial Metro District - - - - - - 35.000 35.000 35.000 35.000 Eastern Hills Metropolitan District No. 2 70.000 70.000 70.000 70.000 70.000 70.000 70.000 - - - Eastern Hills Metropolitan District No. 4 70.000 70.000 70.000 - - - - - - - Eastern Hills Metropolitan District No. 6 70.000 70.000 70.000 70.000 70.000 70.000 - - - - Eastern Hills Metropolitan District No. 9 - - - - - 70.000 70.000 70.000 70.000 - Eastpark 70 Metro District 38.000 38.000 33.000 33.000 31.000 31.000 31.000 31.000 31.000 31.000 First Creek Ranch Metropolitan District 78.486 75.833 75.277 90.000 90.000 90.000 90.000 90.000 90.000 90.000 Fitzsimons Village Metro District No. 1 51.000 51.000 51.000 51.000 41.000 51.000 - - - - Fitzsimons Village Metro District No. 2 41.000 41.000 41.000 41.000 41.000 41.000 41.000 41.000 41.000 41.000 Flat Rock Metropolitan District No. 4 57.958 57.958 57.556 57.556 52.061 52.061 - - - - Flat Rock Metropolitan District No. 8 - - - - - - 52.061 52.061 52.061 52.061
Note 1: Tax levies from overlapping tax entities continue on the following page.
Year Taxes Are Payable (4)
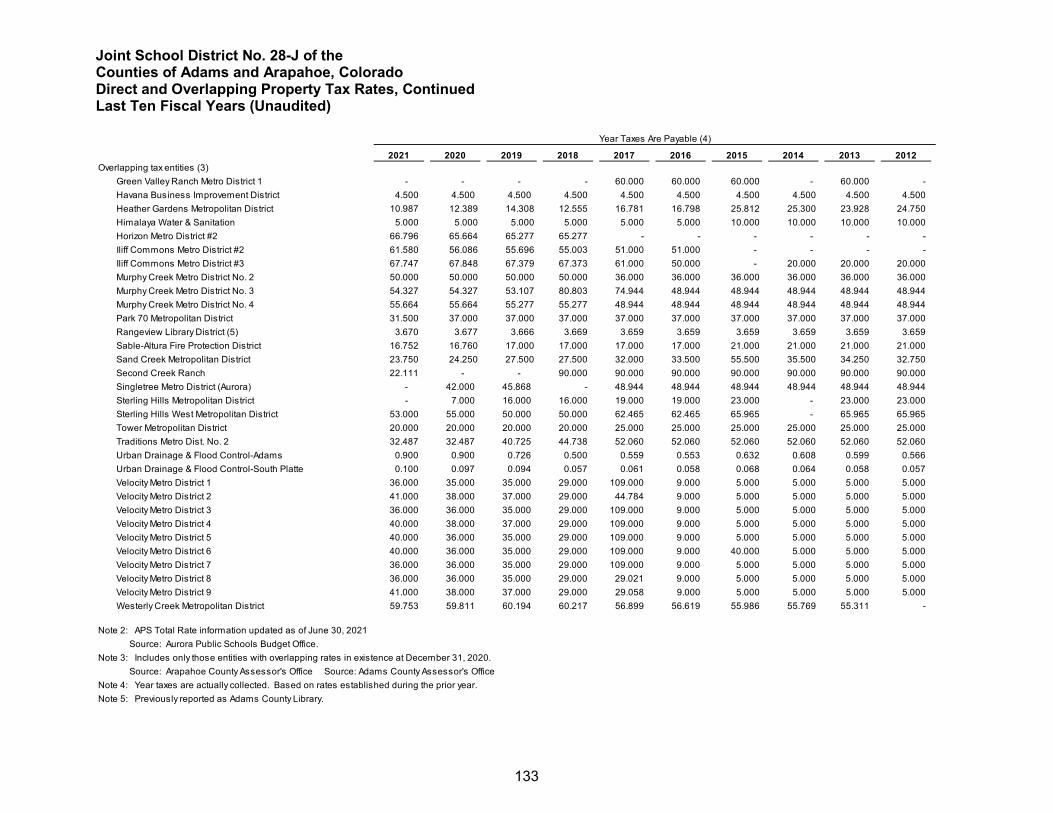
Joint School District No. 28-J of the Counties of Adams and Arapahoe, Colorado Direct and Overlapping Property Tax Rates, Continued Last Ten Fiscal Years (Unaudited)
133
2021 2020 2019 2018 2017 2016 2015 2014 2013 2012Overlapping tax entities (3)
Green Valley Ranch Metro District 1 - - - - 60.000 60.000 60.000 - 60.000 - Havana Business Improvement District 4.500 4.500 4.500 4.500 4.500 4.500 4.500 4.500 4.500 4.500 Heather Gardens Metropolitan District 10.987 12.389 14.308 12.555 16.781 16.798 25.812 25.300 23.928 24.750 Himalaya Water & Sanitation 5.000 5.000 5.000 5.000 5.000 5.000 10.000 10.000 10.000 10.000 Horizon Metro District #2 66.796 65.664 65.277 65.277 - - - - - - Iliff Commons Metro District #2 61.580 56.086 55.696 55.003 51.000 51.000 - - - - Iliff Commons Metro District #3 67.747 67.848 67.379 67.373 61.000 50.000 - 20.000 20.000 20.000 Murphy Creek Metro District No. 2 50.000 50.000 50.000 50.000 36.000 36.000 36.000 36.000 36.000 36.000 Murphy Creek Metro District No. 3 54.327 54.327 53.107 80.803 74.944 48.944 48.944 48.944 48.944 48.944 Murphy Creek Metro District No. 4 55.664 55.664 55.277 55.277 48.944 48.944 48.944 48.944 48.944 48.944 Park 70 Metropolitan District 31.500 37.000 37.000 37.000 37.000 37.000 37.000 37.000 37.000 37.000 Rangeview Library District (5) 3.670 3.677 3.666 3.669 3.659 3.659 3.659 3.659 3.659 3.659 Sable-Altura Fire Protection District 16.752 16.760 17.000 17.000 17.000 17.000 21.000 21.000 21.000 21.000 Sand Creek Metropolitan District 23.750 24.250 27.500 27.500 32.000 33.500 55.500 35.500 34.250 32.750 Second Creek Ranch 22.111 - - 90.000 90.000 90.000 90.000 90.000 90.000 90.000 Singletree Metro District (Aurora) - 42.000 45.868 - 48.944 48.944 48.944 48.944 48.944 48.944 Sterling Hills Metropolitan District - 7.000 16.000 16.000 19.000 19.000 23.000 - 23.000 23.000 Sterling Hills West Metropolitan District 53.000 55.000 50.000 50.000 62.465 62.465 65.965 - 65.965 65.965 Tower Metropolitan District 20.000 20.000 20.000 20.000 25.000 25.000 25.000 25.000 25.000 25.000 Traditions Metro Dist. No. 2 32.487 32.487 40.725 44.738 52.060 52.060 52.060 52.060 52.060 52.060 Urban Drainage & Flood Control-Adams 0.900 0.900 0.726 0.500 0.559 0.553 0.632 0.608 0.599 0.566 Urban Drainage & Flood Control-South Platte 0.100 0.097 0.094 0.057 0.061 0.058 0.068 0.064 0.058 0.057 Velocity Metro District 1 36.000 35.000 35.000 29.000 109.000 9.000 5.000 5.000 5.000 5.000 Velocity Metro District 2 41.000 38.000 37.000 29.000 44.784 9.000 5.000 5.000 5.000 5.000 Velocity Metro District 3 36.000 36.000 35.000 29.000 109.000 9.000 5.000 5.000 5.000 5.000 Velocity Metro District 4 40.000 38.000 37.000 29.000 109.000 9.000 5.000 5.000 5.000 5.000 Velocity Metro District 5 40.000 36.000 35.000 29.000 109.000 9.000 5.000 5.000 5.000 5.000 Velocity Metro District 6 40.000 36.000 35.000 29.000 109.000 9.000 40.000 5.000 5.000 5.000 Velocity Metro District 7 36.000 36.000 35.000 29.000 109.000 9.000 5.000 5.000 5.000 5.000 Velocity Metro District 8 36.000 36.000 35.000 29.000 29.021 9.000 5.000 5.000 5.000 5.000 Velocity Metro District 9 41.000 38.000 37.000 29.000 29.058 9.000 5.000 5.000 5.000 5.000 Westerly Creek Metropolitan District 59.753 59.811 60.194 60.217 56.899 56.619 55.986 55.769 55.311 -
Note 2: APS Total Rate information updated as of June 30, 2021Source: Aurora Public Schools Budget Office.
Note 3: Includes only those entities with overlapping rates in existence at December 31, 2020.Source: Arapahoe County Assessor's Office Source: Adams County Assessor's Office
Note 4: Year taxes are actually collected. Based on rates established during the prior year.Note 5: Previously reported as Adams County Library.
Year Taxes Are Payable (4)
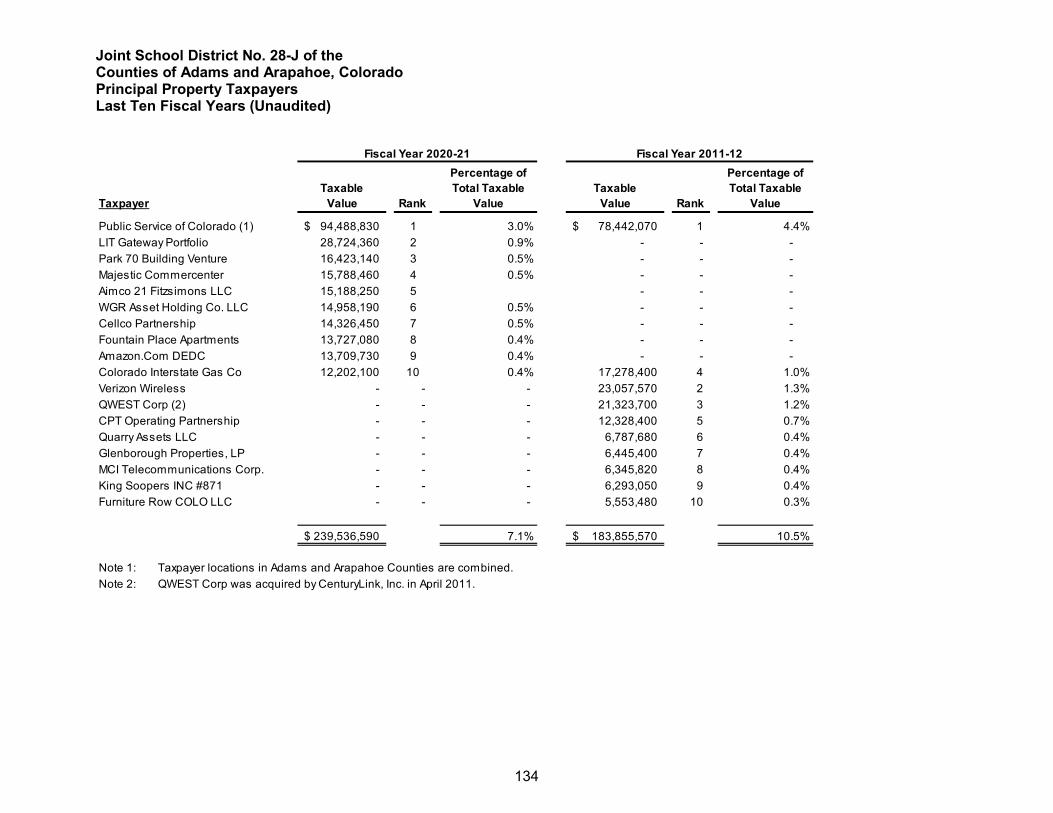
Joint School District No. 28-J of the Counties of Adams and Arapahoe, Colorado Principal Property Taxpayers Last Ten Fiscal Years (Unaudited)
134
Principal Property Taxpayers
TaxpayerTaxable
Value Rank
Percentage of Total Taxable
ValueTaxable
Value Rank
Percentage of Total Taxable
Value
Public Service of Colorado (1) 94,488,830$ 1 3.0% 78,442,070$ 1 4.4%LIT Gateway Portfolio 28,724,360 2 0.9% - - - Park 70 Building Venture 16,423,140 3 0.5% - - - Majestic Commercenter 15,788,460 4 0.5% - - - Aimco 21 Fitzsimons LLC 15,188,250 5 - - - WGR Asset Holding Co. LLC 14,958,190 6 0.5% - - - Cellco Partnership 14,326,450 7 0.5% - - - Fountain Place Apartments 13,727,080 8 0.4% - - - Amazon.Com DEDC 13,709,730 9 0.4% - - - Colorado Interstate Gas Co 12,202,100 10 0.4% 17,278,400 4 1.0%Verizon Wireless - - - 23,057,570 2 1.3%QWEST Corp (2) - - - 21,323,700 3 1.2%CPT Operating Partnership - - - 12,328,400 5 0.7%Quarry Assets LLC - - - 6,787,680 6 0.4%Glenborough Properties, LP - - - 6,445,400 7 0.4%MCI Telecommunications Corp. - - - 6,345,820 8 0.4%King Soopers INC #871 - - - 6,293,050 9 0.4%Furniture Row COLO LLC - - - 5,553,480 10 0.3%
239,536,590$ 7.1% 183,855,570$ 10.5%
Note 1: Taxpayer locations in Adams and Arapahoe Counties are combined.Note 2: QWEST Corp was acquired by CenturyLink, Inc. in April 2011.
Fiscal Year 2011-12Fiscal Year 2020-21
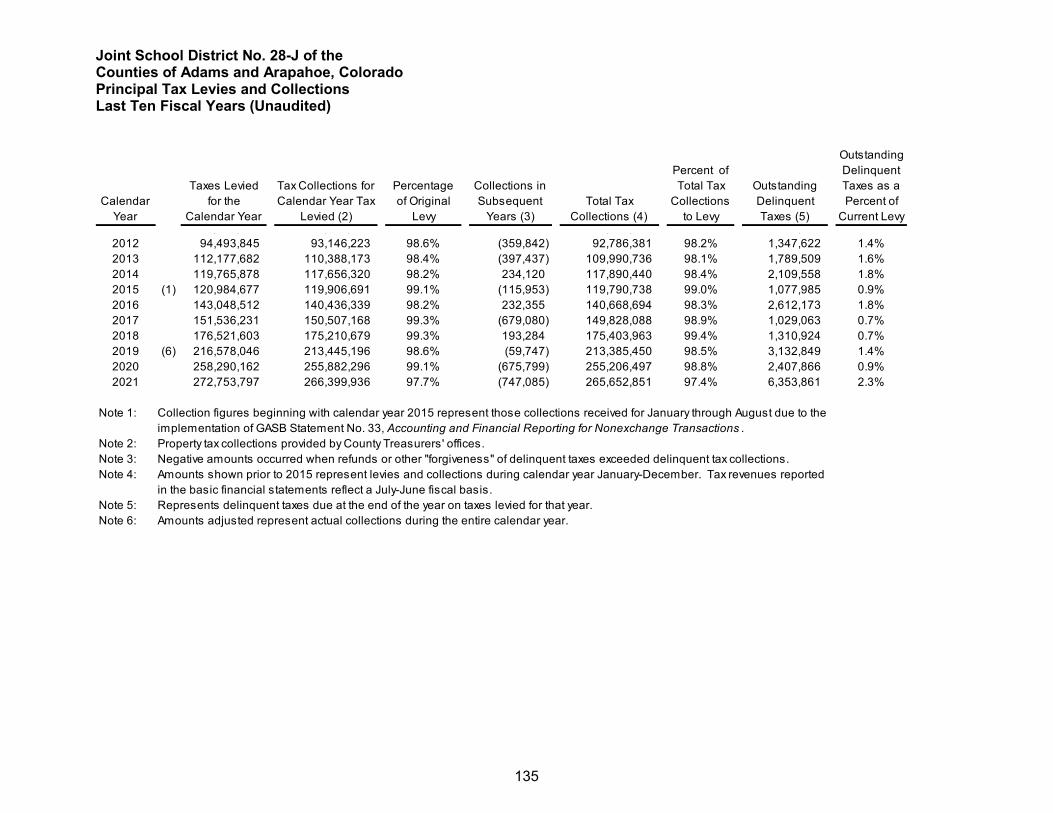
Joint School District No. 28-J of the Counties of Adams and Arapahoe, Colorado Principal Tax Levies and Collections Last Ten Fiscal Years (Unaudited)
135
Principal Tax Levies and Collections
Calendar Year
Taxes Levied for the
Calendar Year
Tax Collections for Calendar Year Tax
Levied (2)
Percentage of Original
Levy
Collections in Subsequent
Years (3)Total Tax
Collections (4)
Percent of Total Tax
Collections to Levy
Outstanding Delinquent Taxes (5)
Outstanding Delinquent Taxes as a Percent of
Current Levy, ,$ , ,$ , ,$ ,$
2012 94,493,845 93,146,223 98.6% (359,842) 92,786,381 98.2% 1,347,622 1.4%2013 112,177,682 110,388,173 98.4% (397,437) 109,990,736 98.1% 1,789,509 1.6%2014 119,765,878 117,656,320 98.2% 234,120 117,890,440 98.4% 2,109,558 1.8%2015 (1) 120,984,677 119,906,691 99.1% (115,953) 119,790,738 99.0% 1,077,985 0.9%2016 143,048,512 140,436,339 98.2% 232,355 140,668,694 98.3% 2,612,173 1.8%2017 151,536,231 150,507,168 99.3% (679,080) 149,828,088 98.9% 1,029,063 0.7%2018 176,521,603 175,210,679 99.3% 193,284 175,403,963 99.4% 1,310,924 0.7%2019 (6) 216,578,046 213,445,196 98.6% (59,747) 213,385,450 98.5% 3,132,849 1.4%2020 258,290,162 255,882,296 99.1% (675,799) 255,206,497 98.8% 2,407,866 0.9%2021 272,753,797 266,399,936 97.7% (747,085) 265,652,851 97.4% 6,353,861 2.3%
Note 1: Collection figures beginning with calendar year 2015 represent those collections received for January through August due to the implementation of GASB Statement No. 33, Accounting and Financial Reporting for Nonexchange Transactions .Note 2: Property tax collections provided by County Treasurers' offices.Note 3: Negative amounts occurred when refunds or other "forgiveness" of delinquent taxes exceeded delinquent tax collections.Note 4: Amounts shown prior to 2015 represent levies and collections during calendar year January-December. Tax revenues reported
in the basic financial statements reflect a July-June fiscal basis.Note 5: Represents delinquent taxes due at the end of the year on taxes levied for that year.Note 6: Amounts adjusted represent actual collections during the entire calendar year.
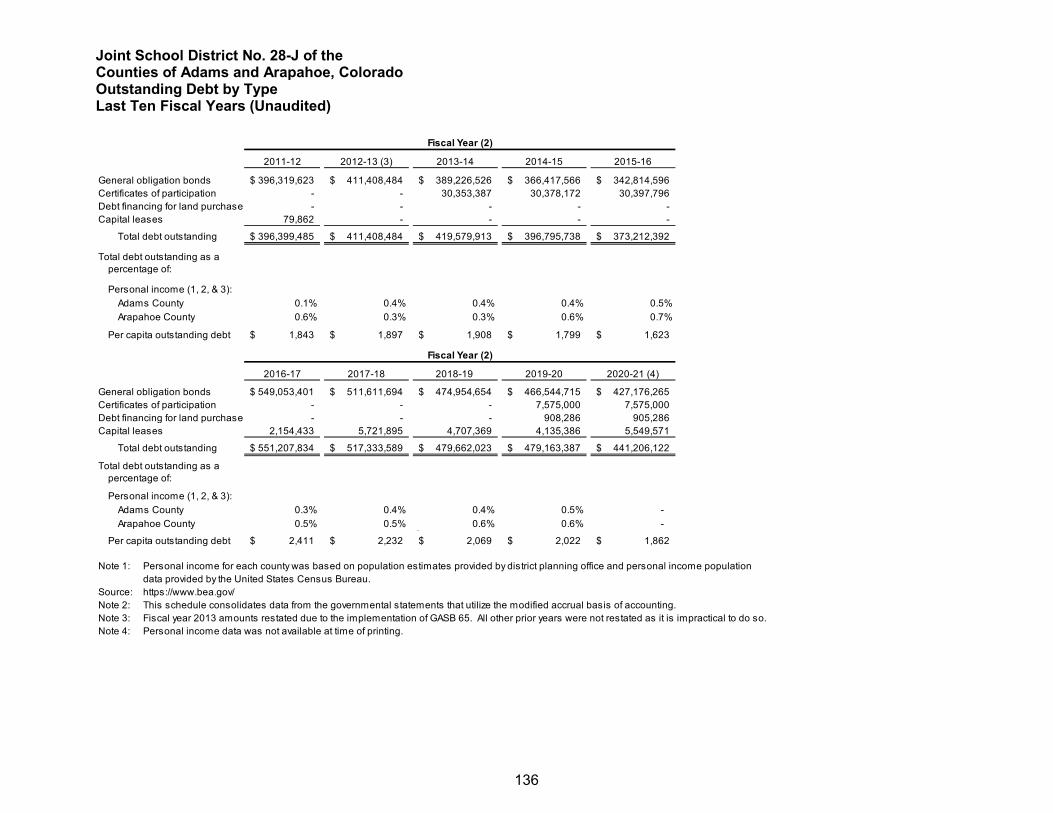
Joint School District No. 28-J of the Counties of Adams and Arapahoe, Colorado Outstanding Debt by Type Last Ten Fiscal Years (Unaudited)
136
Outstanding Debt by Type
2011-12 2012-13 (3) 2013-14 2014-15 2015-16
General obligation bonds 396,319,623$ 411,408,484$ 389,226,526$ 366,417,566$ 342,814,596$ Certificates of participation - - 30,353,387 30,378,172 30,397,796 Debt financing for land purchase - - - - - Capital leases 79,862 - - - -
Total debt outstanding 396,399,485$ 411,408,484$ 419,579,913$ 396,795,738$ 373,212,392$
Total debt outstanding as a percentage of:
Personal income (1, 2, & 3):Adams County 0.1% 0.4% 0.4% 0.4% 0.5%Arapahoe County 0.6% 0.3% 0.3% 0.6% 0.7%
Per capita outstanding debt 1,843$ 1,897$ 1,908$ 1,799$ 1,623$
2016-17 2017-18 2018-19 2019-20 2020-21 (4)
General obligation bonds 549,053,401$ 511,611,694$ 474,954,654$ 466,544,715$ 427,176,265$ Certificates of participation - - - 7,575,000 7,575,000 Debt financing for land purchase - - - 908,286 905,286 Capital leases 2,154,433 5,721,895 4,707,369 4,135,386 5,549,571
Total debt outstanding 551,207,834$ 517,333,589$ 479,662,023$ 479,163,387$ 441,206,122$
Total debt outstanding as a percentage of:
Personal income (1, 2, & 3):Adams County 0.3% 0.4% 0.4% 0.5% - Arapahoe County 0.5% 0.5% 0.6% 0.6% - 0
Per capita outstanding debt 2,411$ 2,232$ 2,069$ 2,022$ 1,862$
Note 1: Personal income for each county was based on population estimates provided by district planning office and personal income populationdata provided by the United States Census Bureau.
Source: https://www.bea.gov/Note 2: This schedule consolidates data from the governmental statements that utilize the modified accrual basis of accounting.Note 3: Fiscal year 2013 amounts restated due to the implementation of GASB 65. All other prior years were not restated as it is impractical to do so. Note 4: Personal income data was not available at time of printing.
Fiscal Year (2)
Fiscal Year (2)
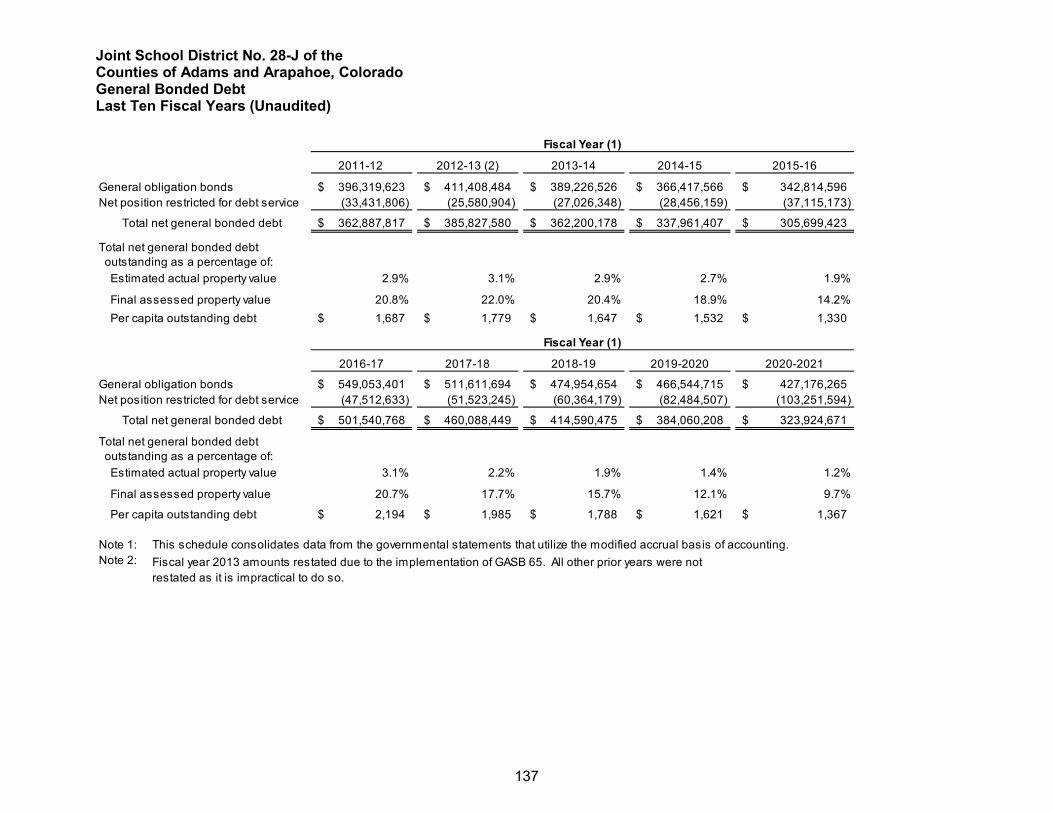
Joint School District No. 28-J of the Counties of Adams and Arapahoe, Colorado General Bonded Debt Last Ten Fiscal Years (Unaudited)
137
General Bonded Debt
2011-12 2012-13 (2) 2013-14 2014-15 2015-16
General obligation bonds 396,319,623$ 411,408,484$ 389,226,526$ 366,417,566$ 342,814,596$ Net position restricted for debt service (33,431,806) (25,580,904) (27,026,348) (28,456,159) (37,115,173)
Total net general bonded debt 362,887,817$ 385,827,580$ 362,200,178$ 337,961,407$ 305,699,423$
Total net general bonded debt outstanding as a percentage of:
Estimated actual property value 2.9% 3.1% 2.9% 2.7% 1.9%
Final assessed property value 20.8% 22.0% 20.4% 18.9% 14.2%Per capita outstanding debt 1,687$ 1,779$ 1,647$ 1,532$ 1,330$
2016-17 2017-18 2018-19 2019-2020 2020-2021
General obligation bonds 549,053,401$ 511,611,694$ 474,954,654$ 466,544,715$ 427,176,265$ Net position restricted for debt service (47,512,633) (51,523,245) (60,364,179) (82,484,507) (103,251,594)
Total net general bonded debt 501,540,768$ 460,088,449$ 414,590,475$ 384,060,208$ 323,924,671$
Total net general bonded debt outstanding as a percentage of:
Estimated actual property value 3.1% 2.2% 1.9% 1.4% 1.2%
Final assessed property value 20.7% 17.7% 15.7% 12.1% 9.7%
Per capita outstanding debt 2,194$ 1,985$ 1,788$ 1,621$ 1,367$
Note 1: This schedule consolidates data from the governmental statements that utilize the modified accrual basis of accounting.Note 2:
Fiscal year 2013 amounts restated due to the implementation of GASB 65. All other prior years were not restated as it is impractical to do so.
Fiscal Year (1)
Fiscal Year (1)
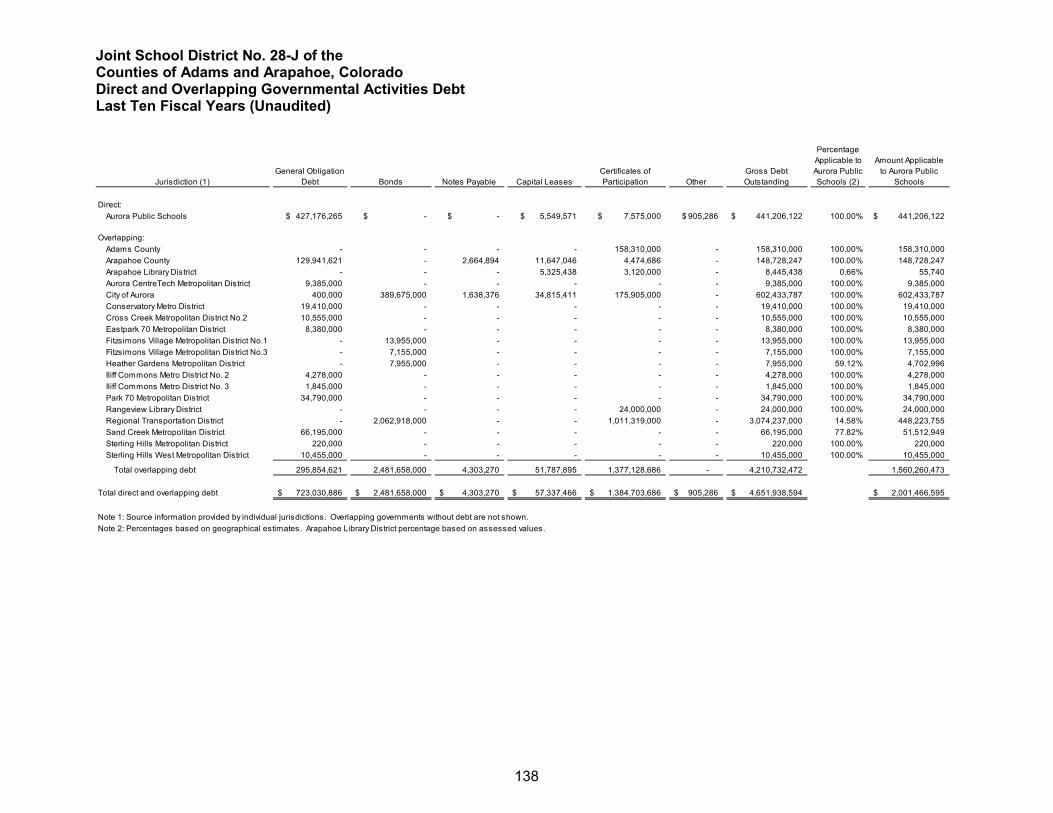
Joint School District No. 28-J of the Counties of Adams and Arapahoe, Colorado Direct and Overlapping Governmental Activities Debt Last Ten Fiscal Years (Unaudited)
138
Direct and Overlapping Governmental Activities Debt
Jurisdiction (1)General Obligation
Debt Bonds Notes Payable Capital LeasesCertificates of Participation Other
Gross Debt Outstanding
Percentage Applicable to Aurora Public Schools (2)
Amount Applicable to Aurora Public
Schools
Direct: Aurora Public Schools 427,176,265$ -$ -$ 5,549,571$ 7,575,000$ 905,286$ 441,206,122$ 100.00% 441,206,122$
Overlapping:Adams County - - - - 158,310,000 - 158,310,000 100.00% 158,310,000 Arapahoe County 129,941,621 - 2,664,894 11,647,046 4,474,686 - 148,728,247 100.00% 148,728,247 Arapahoe Library District - - - 5,325,438 3,120,000 - 8,445,438 0.66% 55,740 Aurora CentreTech Metropolitan District 9,385,000 - - - - - 9,385,000 100.00% 9,385,000 City of Aurora 400,000 389,675,000 1,638,376 34,815,411 175,905,000 - 602,433,787 100.00% 602,433,787 Conservatory Metro District 19,410,000 - - - - - 19,410,000 100.00% 19,410,000 Cross Creek Metropolitan District No.2 10,555,000 - - - - - 10,555,000 100.00% 10,555,000 Eastpark 70 Metropolitan District 8,380,000 - - - - - 8,380,000 100.00% 8,380,000 Fitzsimons Village Metropolitan District No.1 - 13,955,000 - - - - 13,955,000 100.00% 13,955,000 Fitzsimons Village Metropolitan District No.3 - 7,155,000 - - - - 7,155,000 100.00% 7,155,000 Heather Gardens Metropolitan District - 7,955,000 - - - - 7,955,000 59.12% 4,702,996 Iliff Commons Metro District No. 2 4,278,000 - - - - - 4,278,000 100.00% 4,278,000 Iliff Commons Metro District No. 3 1,845,000 - - - - - 1,845,000 100.00% 1,845,000 Park 70 Metropolitan District 34,790,000 - - - - - 34,790,000 100.00% 34,790,000 Rangeview Library District - - - - 24,000,000 - 24,000,000 100.00% 24,000,000 Regional Transportation District - 2,062,918,000 - - 1,011,319,000 - 3,074,237,000 14.58% 448,223,755 Sand Creek Metropolitan District 66,195,000 - - - - - 66,195,000 77.82% 51,512,949 Sterling Hills Metropolitan District 220,000 - - - - - 220,000 100.00% 220,000 Sterling Hills West Metropolitan District 10,455,000 - - - - - 10,455,000 100.00% 10,455,000
Total overlapping debt 295,854,621 2,481,658,000 4,303,270 51,787,895 1,377,128,686 - 4,210,732,472 1,560,260,473
Total direct and overlapping debt 723,030,886$ 2,481,658,000$ 4,303,270$ 57,337,466$ 1,384,703,686$ 905,286$ 4,651,938,594$ 2,001,466,595$
Note 1: Source information provided by individual jurisdictions. Overlapping governments without debt are not shown. Note 2: Percentages based on geographical estimates. Arapahoe Library District percentage based on assessed values.
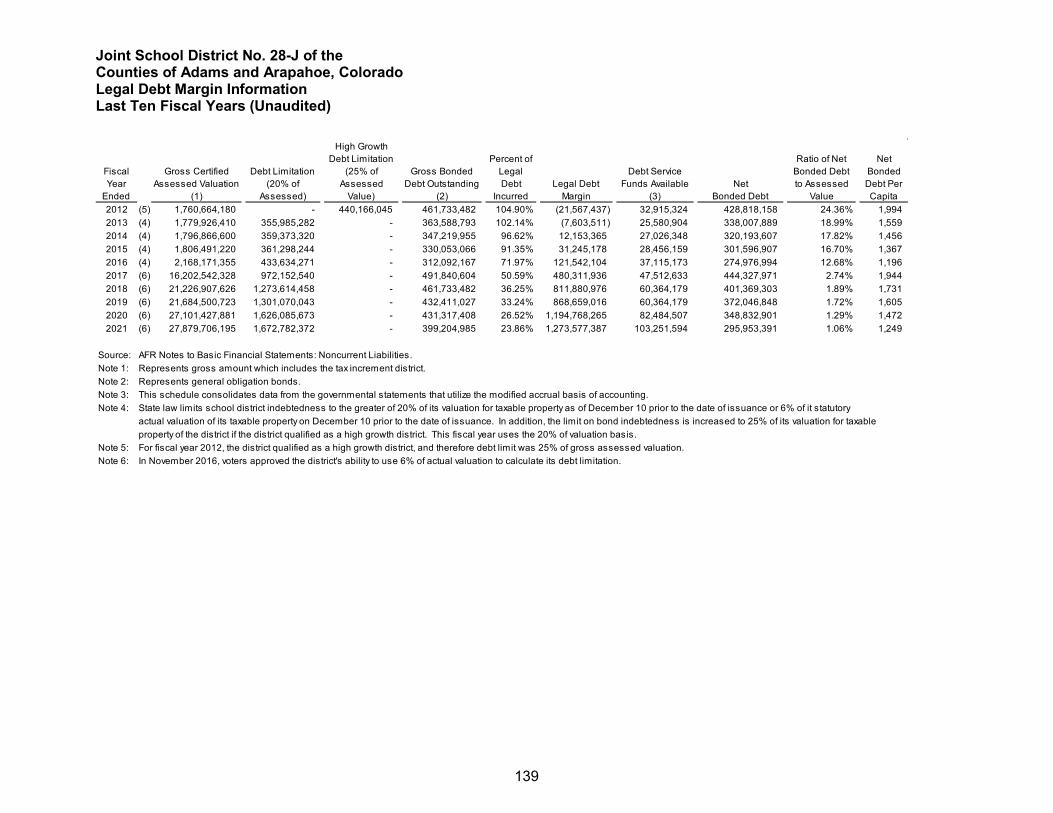
Joint School District No. 28-J of the Counties of Adams and Arapahoe, Colorado Legal Debt Margin Information Last Ten Fiscal Years (Unaudited)
139
Legal Debt Margin Information
Fiscal Year
Ended
Gross Certified Assessed Valuation
(1)
Debt Limitation (20% of
Assessed)
High Growth Debt Limitation
(25% of Assessed
Value)
Gross Bonded Debt Outstanding
(2)
Percent of Legal Debt
IncurredLegal Debt
Margin
Debt Service Funds Available
(3)Net
Bonded Debt
Ratio of Net Bonded Debt to Assessed
Value
Net Bonded Debt Per Capita
2012 (5) 1,760,664,180 - 440,166,045 461,733,482 104.90% (21,567,437) 32,915,324 428,818,158 24.36% 1,994 2013 (4) 1,779,926,410 355,985,282 - 363,588,793 102.14% (7,603,511) 25,580,904 338,007,889 18.99% 1,559 2014 (4) 1,796,866,600 359,373,320 - 347,219,955 96.62% 12,153,365 27,026,348 320,193,607 17.82% 1,456 2015 (4) 1,806,491,220 361,298,244 - 330,053,066 91.35% 31,245,178 28,456,159 301,596,907 16.70% 1,367 2016 (4) 2,168,171,355 433,634,271 - 312,092,167 71.97% 121,542,104 37,115,173 274,976,994 12.68% 1,196 2017 (6) 16,202,542,328 972,152,540 - 491,840,604 50.59% 480,311,936 47,512,633 444,327,971 2.74% 1,944 2018 (6) 21,226,907,626 1,273,614,458 - 461,733,482 36.25% 811,880,976 60,364,179 401,369,303 1.89% 1,731 2019 (6) 21,684,500,723 1,301,070,043 - 432,411,027 33.24% 868,659,016 60,364,179 372,046,848 1.72% 1,605 2020 (6) 27,101,427,881 1,626,085,673 - 431,317,408 26.52% 1,194,768,265 82,484,507 348,832,901 1.29% 1,472 2021 (6) 27,879,706,195 1,672,782,372 - 399,204,985 23.86% 1,273,577,387 103,251,594 295,953,391 1.06% 1,249
Source: AFR Notes to Basic Financial Statements: Noncurrent Liabilities.Note 1: Represents gross amount which includes the tax increment district.Note 2: Represents general obligation bonds.Note 3: This schedule consolidates data from the governmental statements that utilize the modified accrual basis of accounting.Note 4: State law limits school district indebtedness to the greater of 20% of its valuation for taxable property as of December 10 prior to the date of issuance or 6% of it statutory
actual valuation of its taxable property on December 10 prior to the date of issuance. In addition, the limit on bond indebtedness is increased to 25% of its valuation for taxableproperty of the district if the district qualified as a high growth district. This fiscal year uses the 20% of valuation basis.
Note 5: For fiscal year 2012, the district qualified as a high growth district, and therefore debt limit was 25% of gross assessed valuation.Note 6: In November 2016, voters approved the district's ability to use 6% of actual valuation to calculate its debt limitation.
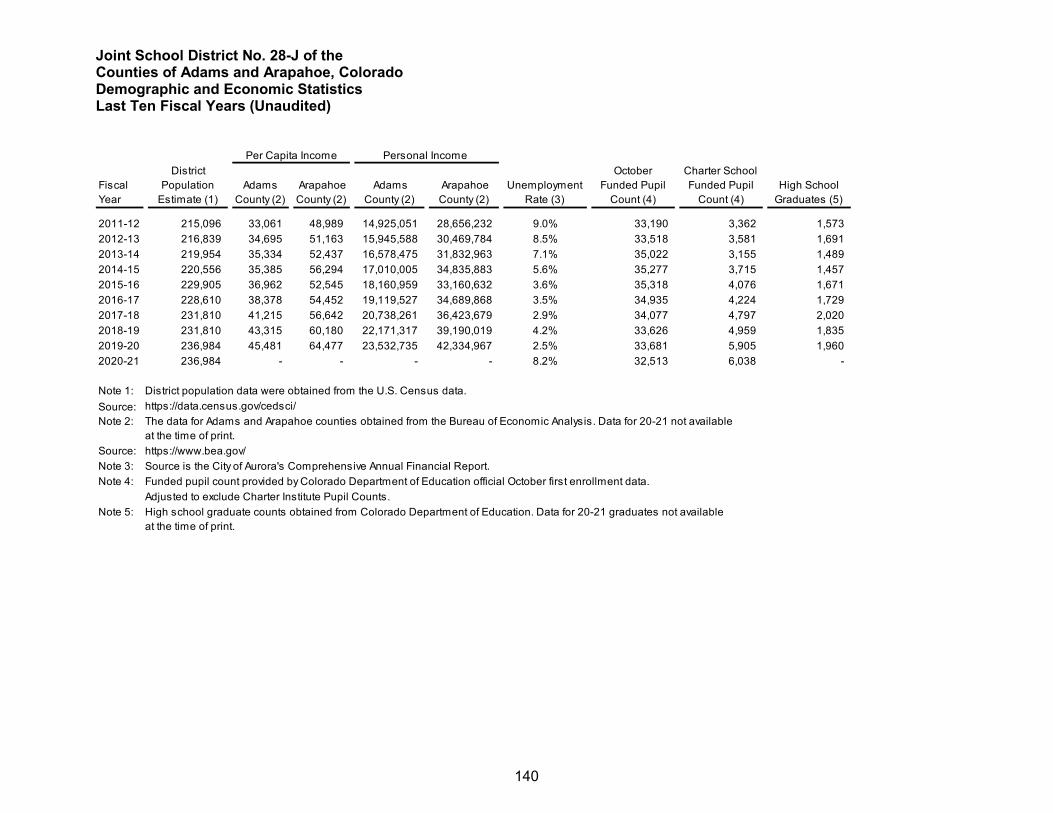
Joint School District No. 28-J of the Counties of Adams and Arapahoe, Colorado Demographic and Economic Statistics Last Ten Fiscal Years (Unaudited)
140
Demographic and Economic Statistics
Fiscal Year
District Population
Estimate (1)Adams
County (2) Arapahoe County (2)
Adams County (2)
Arapahoe County (2)
Unemployment Rate (3)
October Funded Pupil
Count (4)
Charter School Funded Pupil
Count (4)High School
Graduates (5)
2011-12 215,096 33,061 48,989 14,925,051 28,656,232 9.0% 33,190 3,362 1,573 2012-13 216,839 34,695 51,163 15,945,588 30,469,784 8.5% 33,518 3,581 1,691 2013-14 219,954 35,334 52,437 16,578,475 31,832,963 7.1% 35,022 3,155 1,489 2014-15 220,556 35,385 56,294 17,010,005 34,835,883 5.6% 35,277 3,715 1,457 2015-16 229,905 36,962 52,545 18,160,959 33,160,632 3.6% 35,318 4,076 1,671 2016-17 228,610 38,378 54,452 19,119,527 34,689,868 3.5% 34,935 4,224 1,729 2017-18 231,810 41,215 56,642 20,738,261 36,423,679 2.9% 34,077 4,797 2,020 2018-19 231,810 43,315 60,180 22,171,317 39,190,019 4.2% 33,626 4,959 1,835 2019-20 236,984 45,481 64,477 23,532,735 42,334,967 2.5% 33,681 5,905 1,960 2020-21 236,984 - - - - 8.2% 32,513 6,038 -
Note 1: District population data were obtained from the U.S. Census data. Source: https://data.census.gov/cedsci/Note 2: The data for Adams and Arapahoe counties obtained from the Bureau of Economic Analysis. Data for 20-21 not available
at the time of print.Source: https://www.bea.gov/Note 3: Source is the City of Aurora's Comprehensive Annual Financial Report.Note 4: Funded pupil count provided by Colorado Department of Education official October first enrollment data.
Adjusted to exclude Charter Institute Pupil Counts.Note 5: High school graduate counts obtained from Colorado Department of Education. Data for 20-21 graduates not available
at the time of print.
Per Capita Income Personal Income
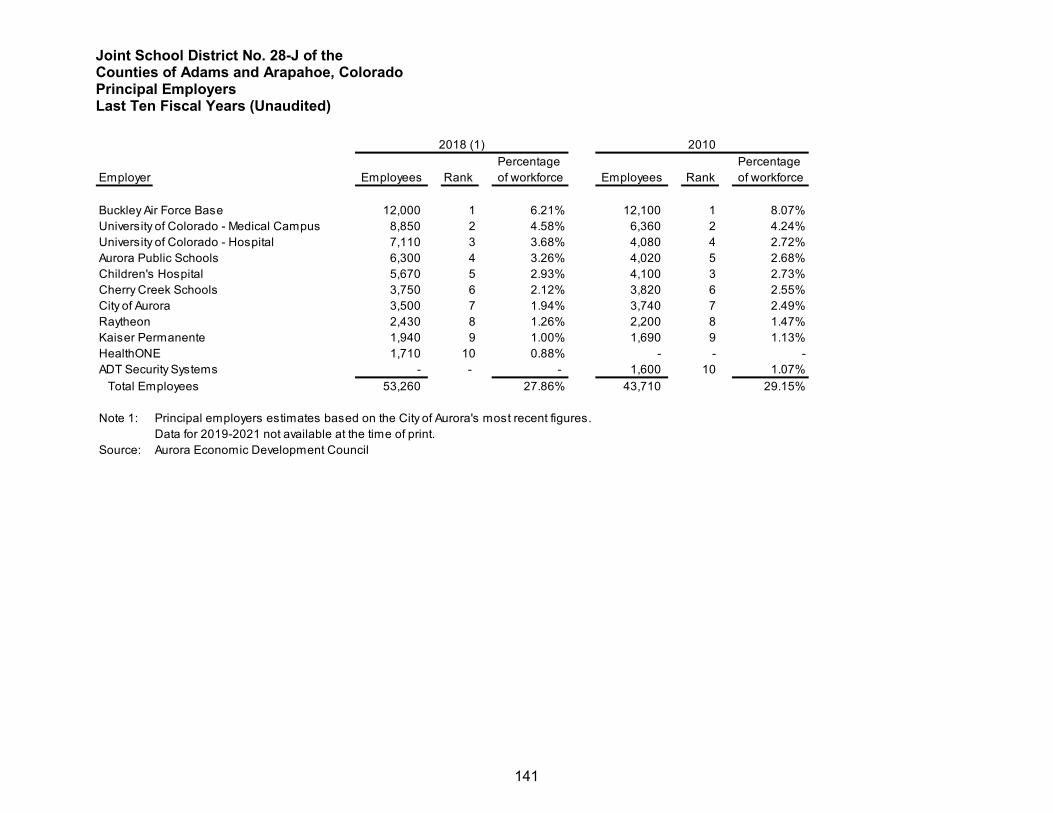
Joint School District No. 28-J of the Counties of Adams and Arapahoe, Colorado Principal Employers Last Ten Fiscal Years (Unaudited)
141
Principal Employers
Percentage Percentage Employer Employees Rank of workforce Employees Rank of workforce
Buckley Air Force Base 12,000 1 6.21% 12,100 1 8.07%University of Colorado - Medical Campus 8,850 2 4.58% 6,360 2 4.24%University of Colorado - Hospital 7,110 3 3.68% 4,080 4 2.72%Aurora Public Schools 6,300 4 3.26% 4,020 5 2.68%Children's Hospital 5,670 5 2.93% 4,100 3 2.73%Cherry Creek Schools 3,750 6 2.12% 3,820 6 2.55%City of Aurora 3,500 7 1.94% 3,740 7 2.49%Raytheon 2,430 8 1.26% 2,200 8 1.47%Kaiser Permanente 1,940 9 1.00% 1,690 9 1.13%HealthONE 1,710 10 0.88% - - -ADT Security Systems - - - 1,600 10 1.07% Total Employees 53,260 27.86% 43,710 29.15%
Note 1: Principal employers estimates based on the City of Aurora's most recent figures. Data for 2019-2021 not available at the time of print.
Source: Aurora Economic Development Council
20102018 (1)
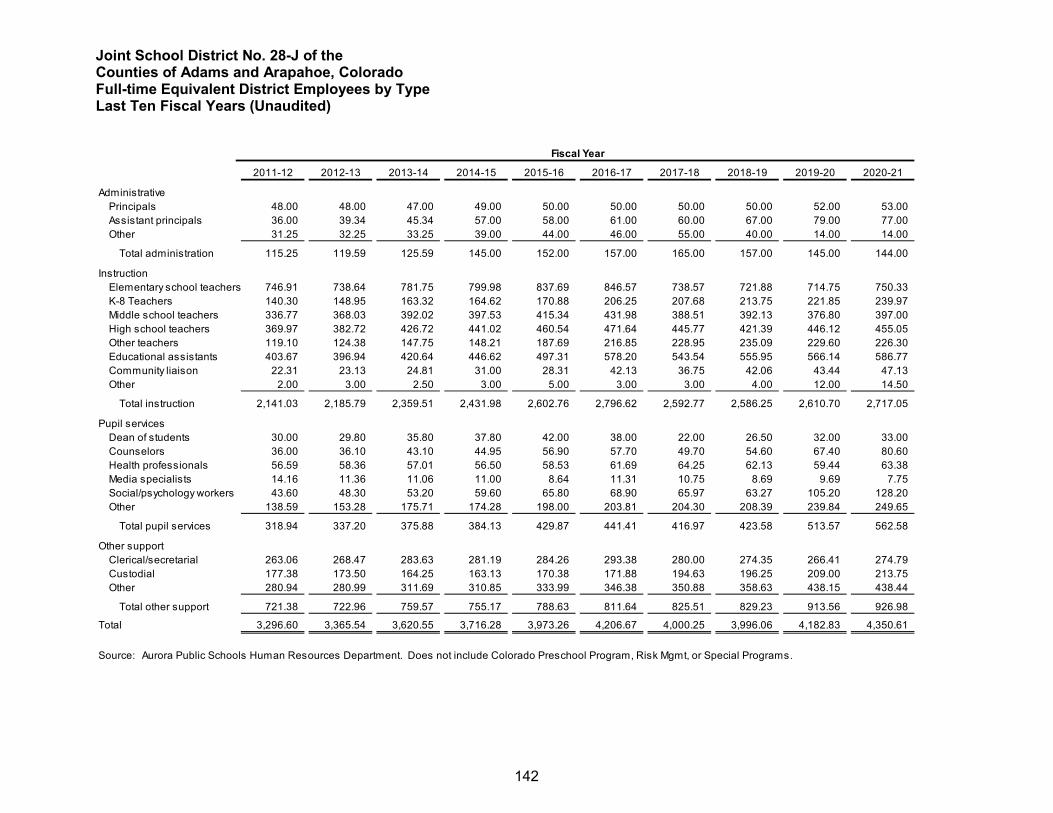
Joint School District No. 28-J of the Counties of Adams and Arapahoe, Colorado Full-time Equivalent District Employees by Type Last Ten Fiscal Years (Unaudited)
142
Full-time Equivalent District Employees by Type
2011-12 2012-13 2013-14 2014-15 2015-16 2016-17 2017-18 2018-19 2019-20 2020-21
AdministrativePrincipals 48.00 48.00 47.00 49.00 50.00 50.00 50.00 50.00 52.00 53.00 Assistant principals 36.00 39.34 45.34 57.00 58.00 61.00 60.00 67.00 79.00 77.00 Other 31.25 32.25 33.25 39.00 44.00 46.00 55.00 40.00 14.00 14.00
Total administration 115.25 119.59 125.59 145.00 152.00 157.00 165.00 157.00 145.00 144.00
InstructionElementary school teachers 746.91 738.64 781.75 799.98 837.69 846.57 738.57 721.88 714.75 750.33 K-8 Teachers 140.30 148.95 163.32 164.62 170.88 206.25 207.68 213.75 221.85 239.97 Middle school teachers 336.77 368.03 392.02 397.53 415.34 431.98 388.51 392.13 376.80 397.00 High school teachers 369.97 382.72 426.72 441.02 460.54 471.64 445.77 421.39 446.12 455.05 Other teachers 119.10 124.38 147.75 148.21 187.69 216.85 228.95 235.09 229.60 226.30 Educational assistants 403.67 396.94 420.64 446.62 497.31 578.20 543.54 555.95 566.14 586.77 Community liaison 22.31 23.13 24.81 31.00 28.31 42.13 36.75 42.06 43.44 47.13 Other 2.00 3.00 2.50 3.00 5.00 3.00 3.00 4.00 12.00 14.50
Total instruction 2,141.03 2,185.79 2,359.51 2,431.98 2,602.76 2,796.62 2,592.77 2,586.25 2,610.70 2,717.05
Pupil servicesDean of students 30.00 29.80 35.80 37.80 42.00 38.00 22.00 26.50 32.00 33.00 Counselors 36.00 36.10 43.10 44.95 56.90 57.70 49.70 54.60 67.40 80.60 Health professionals 56.59 58.36 57.01 56.50 58.53 61.69 64.25 62.13 59.44 63.38 Media specialists 14.16 11.36 11.06 11.00 8.64 11.31 10.75 8.69 9.69 7.75 Social/psychology workers 43.60 48.30 53.20 59.60 65.80 68.90 65.97 63.27 105.20 128.20 Other 138.59 153.28 175.71 174.28 198.00 203.81 204.30 208.39 239.84 249.65
Total pupil services 318.94 337.20 375.88 384.13 429.87 441.41 416.97 423.58 513.57 562.58 Other support
Clerical/secretarial 263.06 268.47 283.63 281.19 284.26 293.38 280.00 274.35 266.41 274.79 Custodial 177.38 173.50 164.25 163.13 170.38 171.88 194.63 196.25 209.00 213.75 Other 280.94 280.99 311.69 310.85 333.99 346.38 350.88 358.63 438.15 438.44
Total other support 721.38 722.96 759.57 755.17 788.63 811.64 825.51 829.23 913.56 926.98
Total 3,296.60 3,365.54 3,620.55 3,716.28 3,973.26 4,206.67 4,000.25 3,996.06 4,182.83 4,350.61
Source: Aurora Public Schools Human Resources Department. Does not include Colorado Preschool Program, Risk Mgmt, or Special Programs.
Fiscal Year
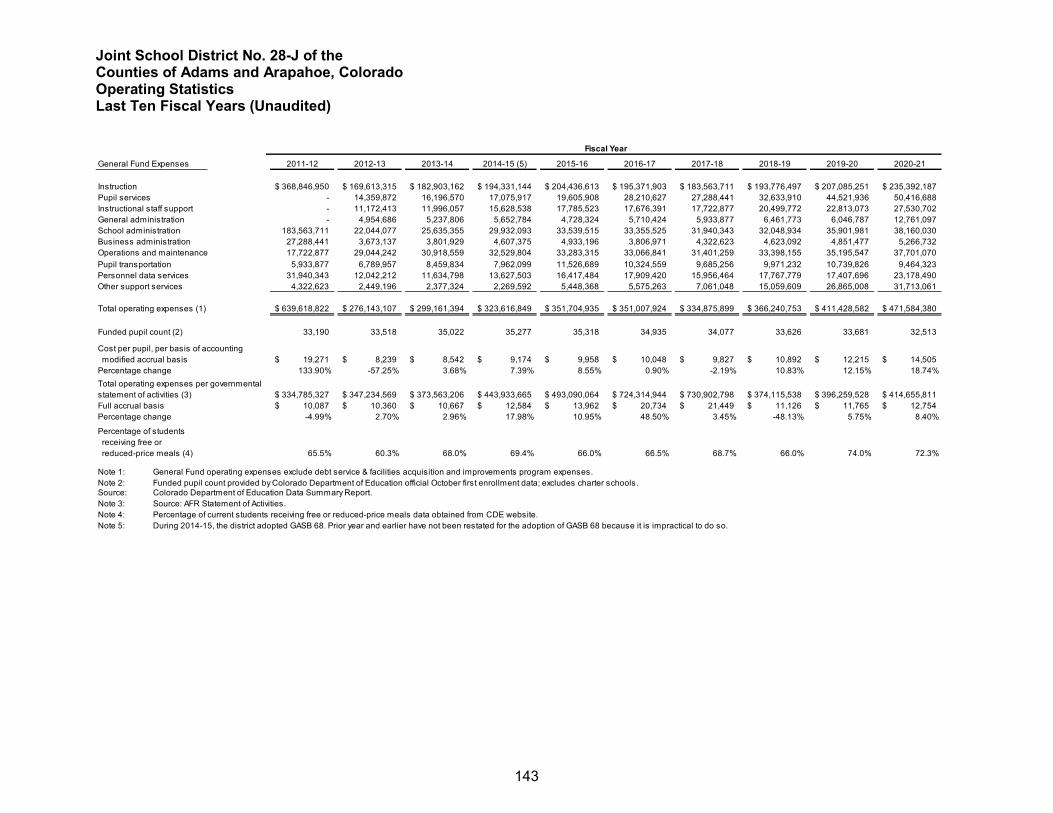
Joint School District No. 28-J of the Counties of Adams and Arapahoe, Colorado Operating Statistics Last Ten Fiscal Years (Unaudited)
143
Operating Statistics
2011-12 2012-13 2013-14 2014-15 (5) 2015-16 2016-17 2017-18 2018-19 2019-20 2020-21
Instruction 368,846,950$ 169,613,315$ 182,903,162$ 194,331,144$ 204,436,613$ 195,371,903$ 183,563,711$ 193,776,497$ 207,085,251$ 235,392,187$ Pupil services - 14,359,872 16,196,570 17,075,917 19,605,908 28,210,627 27,288,441 32,633,910 44,521,936 50,416,688 Instructional staff support - 11,172,413 11,996,057 15,628,538 17,785,523 17,676,391 17,722,877 20,499,772 22,813,073 27,530,702 General administration - 4,954,686 5,237,806 5,652,784 4,728,324 5,710,424 5,933,877 6,461,773 6,046,787 12,761,097 School administration 183,563,711 22,044,077 25,635,355 29,932,093 33,539,515 33,355,525 31,940,343 32,048,934 35,901,981 38,160,030 Business administration 27,288,441 3,673,137 3,801,929 4,607,375 4,933,196 3,806,971 4,322,623 4,623,092 4,851,477 5,266,732 Operations and maintenance 17,722,877 29,044,242 30,918,559 32,529,804 33,283,315 33,066,841 31,401,259 33,398,155 35,195,547 37,701,070 Pupil transportation 5,933,877 6,789,957 8,459,834 7,962,099 11,526,689 10,324,559 9,685,256 9,971,232 10,739,826 9,464,323 Personnel data services 31,940,343 12,042,212 11,634,798 13,627,503 16,417,484 17,909,420 15,956,464 17,767,779 17,407,696 23,178,490 Other support services 4,322,623 2,449,196 2,377,324 2,269,592 5,448,368 5,575,263 7,061,048 15,059,609 26,865,008 31,713,061
Total operating expenses (1) 639,618,822$ 276,143,107$ 299,161,394$ 323,616,849$ 351,704,935$ 351,007,924$ 334,875,899$ 366,240,753$ 411,428,582$ 471,584,380$
Funded pupil count (2) 33,190 33,518 35,022 35,277 35,318 34,935 34,077 33,626 33,681 32,513
Cost per pupil, per basis of accounting modified accrual basis 19,271$ 8,239$ 8,542$ 9,174$ 9,958$ 10,048$ 9,827$ 10,892$ 12,215$ 14,505$ Percentage change 133.90% -57.25% 3.68% 7.39% 8.55% 0.90% -2.19% 10.83% 12.15% 18.74%
334,785,327$ 347,234,569$ 373,563,206$ 443,933,665$ 493,090,064$ 724,314,944$ 730,902,798$ 374,115,538$ 396,259,528$ 414,655,811$ Full accrual basis 10,087$ 10,360$ 10,667$ 12,584$ 13,962$ 20,734$ 21,449$ 11,126$ 11,765$ 12,754$ Percentage change -4.99% 2.70% 2.96% 17.98% 10.95% 48.50% 3.45% -48.13% 5.75% 8.40%
Percentage of students receiving free or reduced-price meals (4) 65.5% 60.3% 68.0% 69.4% 66.0% 66.5% 68.7% 66.0% 74.0% 72.3%
Note 1: General Fund operating expenses exclude debt service & facilities acquisition and improvements program expenses.Note 2: Funded pupil count provided by Colorado Department of Education official October first enrollment data; excludes charter schools.Source: Colorado Department of Education Data Summary Report.Note 3: Source: AFR Statement of Activities.Note 4: Percentage of current students receiving free or reduced-price meals data obtained from CDE website.Note 5: During 2014-15, the district adopted GASB 68. Prior year and earlier have not been restated for the adoption of GASB 68 because it is impractical to do so.
Total operating expenses per governmental statement of activities (3)
General Fund Expenses
Fiscal Year
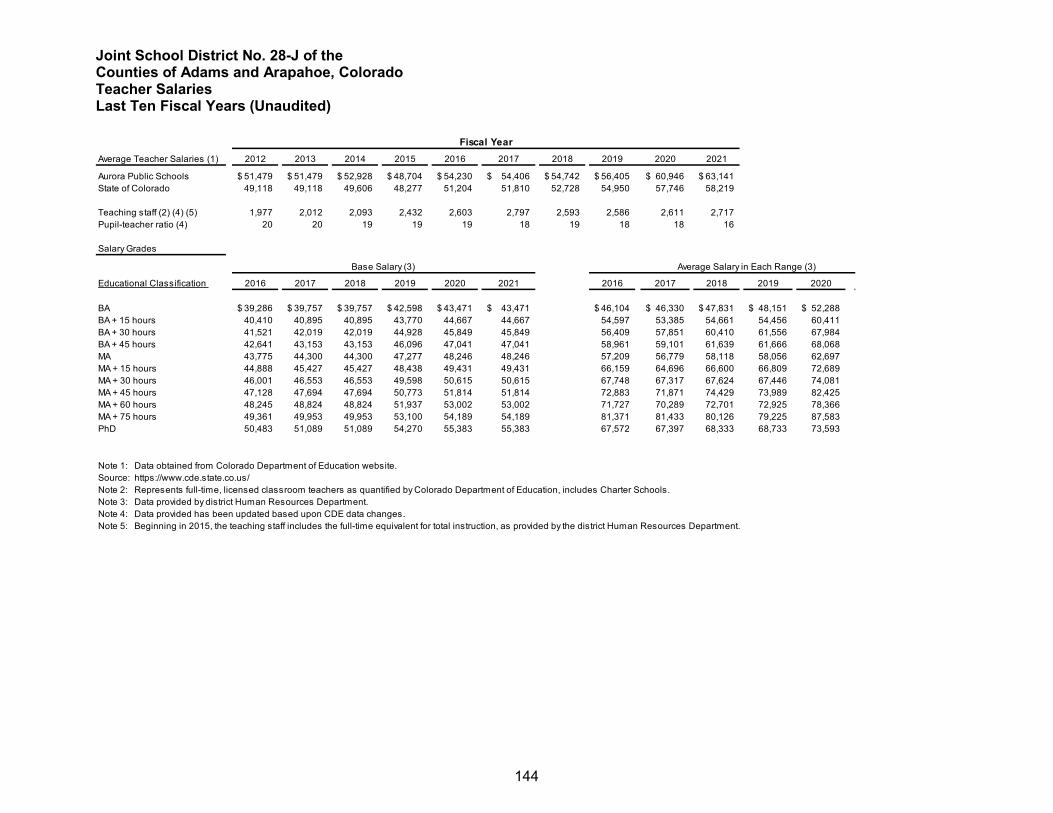
Joint School District No. 28-J of the Counties of Adams and Arapahoe, Colorado Teacher Salaries Last Ten Fiscal Years (Unaudited)
144
Teacher Salaries
Average Teacher Salaries (1) 2012 2013 2014 2015 2016 2017 2018 2019 2020 2021
Aurora Public Schools 51,479$ 51,479$ 52,928$ 48,704$ 54,230$ 54,406$ 54,742$ 56,405$ 60,946$ 63,141$ State of Colorado 49,118 49,118 49,606 48,277 51,204 51,810 52,728 54,950 57,746 58,219
Teaching staff (2) (4) (5) 1,977 2,012 2,093 2,432 2,603 2,797 2,593 2,586 2,611 2,717 Pupil-teacher ratio (4) 20 20 19 19 19 18 19 18 18 16
Salary Grades
Educational Classification 2016 2017 2018 2019 2020 2021 2016 2017 2018 2019 2020
BA 39,286$ 39,757$ 39,757$ 42,598$ 43,471$ 43,471$ 46,104$ 46,330$ 47,831$ 48,151$ 52,288$ BA + 15 hours 40,410 40,895 40,895 43,770 44,667 44,667 54,597 53,385 54,661 54,456 60,411 BA + 30 hours 41,521 42,019 42,019 44,928 45,849 45,849 56,409 57,851 60,410 61,556 67,984 BA + 45 hours 42,641 43,153 43,153 46,096 47,041 47,041 58,961 59,101 61,639 61,666 68,068 MA 43,775 44,300 44,300 47,277 48,246 48,246 57,209 56,779 58,118 58,056 62,697 MA + 15 hours 44,888 45,427 45,427 48,438 49,431 49,431 66,159 64,696 66,600 66,809 72,689 MA + 30 hours 46,001 46,553 46,553 49,598 50,615 50,615 67,748 67,317 67,624 67,446 74,081 MA + 45 hours 47,128 47,694 47,694 50,773 51,814 51,814 72,883 71,871 74,429 73,989 82,425 MA + 60 hours 48,245 48,824 48,824 51,937 53,002 53,002 71,727 70,289 72,701 72,925 78,366 MA + 75 hours 49,361 49,953 49,953 53,100 54,189 54,189 81,371 81,433 80,126 79,225 87,583 PhD 50,483 51,089 51,089 54,270 55,383 55,383 67,572 67,397 68,333 68,733 73,593
Note 1: Data obtained from Colorado Department of Education website. Source: https://www.cde.state.co.us/Note 2: Represents full-time, licensed classroom teachers as quantified by Colorado Department of Education, includes Charter Schools.Note 3: Data provided by district Human Resources Department. Note 4: Data provided has been updated based upon CDE data changes.Note 5: Beginning in 2015, the teaching staff includes the full-time equivalent for total instruction, as provided by the district Human Resources Department.
Base Salary (3)
Fiscal Year
Average Salary in Each Range (3)
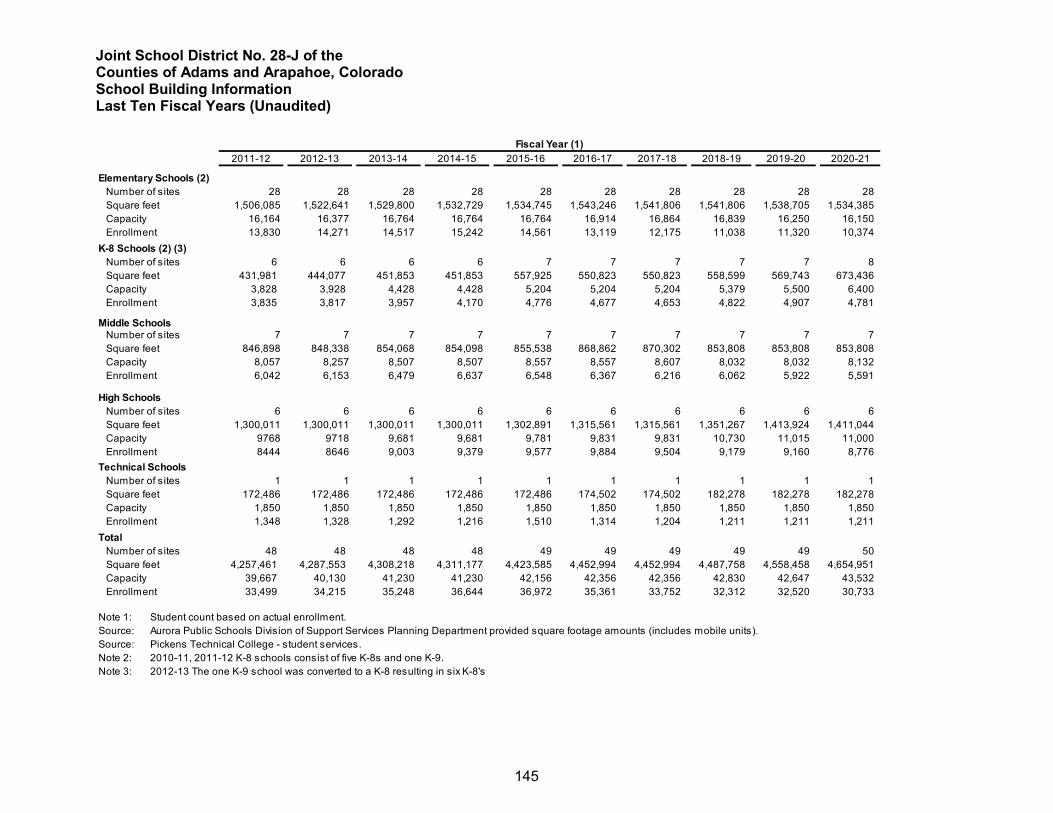
Joint School District No. 28-J of the Counties of Adams and Arapahoe, Colorado School Building Information Last Ten Fiscal Years (Unaudited)
145
School Building Information
2011-12 2012-13 2013-14 2014-15 2015-16 2016-17 2017-18 2018-19 2019-20 2020-21
Elementary Schools (2) Number of sites 28 28 28 28 28 28 28 28 28 28 Square feet 1,506,085 1,522,641 1,529,800 1,532,729 1,534,745 1,543,246 1,541,806 1,541,806 1,538,705 1,534,385 Capacity 16,164 16,377 16,764 16,764 16,764 16,914 16,864 16,839 16,250 16,150 Enrollment 13,830 14,271 14,517 15,242 14,561 13,119 12,175 11,038 11,320 10,374 K-8 Schools (2) (3) Number of sites 6 6 6 6 7 7 7 7 7 8 Square feet 431,981 444,077 451,853 451,853 557,925 550,823 550,823 558,599 569,743 673,436 Capacity 3,828 3,928 4,428 4,428 5,204 5,204 5,204 5,379 5,500 6,400 Enrollment 3,835 3,817 3,957 4,170 4,776 4,677 4,653 4,822 4,907 4,781 Middle Schools Number of sites 7 7 7 7 7 7 7 7 7 7 Square feet 846,898 848,338 854,068 854,098 855,538 868,862 870,302 853,808 853,808 853,808 Capacity 8,057 8,257 8,507 8,507 8,557 8,557 8,607 8,032 8,032 8,132 Enrollment 6,042 6,153 6,479 6,637 6,548 6,367 6,216 6,062 5,922 5,591
High Schools Number of sites 6 6 6 6 6 6 6 6 6 6 Square feet 1,300,011 1,300,011 1,300,011 1,300,011 1,302,891 1,315,561 1,315,561 1,351,267 1,413,924 1,411,044 Capacity 9768 9718 9,681 9,681 9,781 9,831 9,831 10,730 11,015 11,000 Enrollment 8444 8646 9,003 9,379 9,577 9,884 9,504 9,179 9,160 8,776 Technical Schools Number of sites 1 1 1 1 1 1 1 1 1 1 Square feet 172,486 172,486 172,486 172,486 172,486 174,502 174,502 182,278 182,278 182,278 Capacity 1,850 1,850 1,850 1,850 1,850 1,850 1,850 1,850 1,850 1,850 Enrollment 1,348 1,328 1,292 1,216 1,510 1,314 1,204 1,211 1,211 1,211 Total Number of sites 48 48 48 48 49 49 49 49 49 50 Square feet 4,257,461 4,287,553 4,308,218 4,311,177 4,423,585 4,452,994 4,452,994 4,487,758 4,558,458 4,654,951 Capacity 39,667 40,130 41,230 41,230 42,156 42,356 42,356 42,830 42,647 43,532 Enrollment 33,499 34,215 35,248 36,644 36,972 35,361 33,752 32,312 32,520 30,733
Note 1: Student count based on actual enrollment.Source: Aurora Public Schools Division of Support Services Planning Department provided square footage amounts (includes mobile units).Source: Pickens Technical College - student services.Note 2: 2010-11, 2011-12 K-8 schools consist of five K-8s and one K-9.Note 3: 2012-13 The one K-9 school was converted to a K-8 resulting in six K-8's
Fiscal Year (1)

146
147
REPORTS REQUIRED BY UNIFORM GUIDANCE
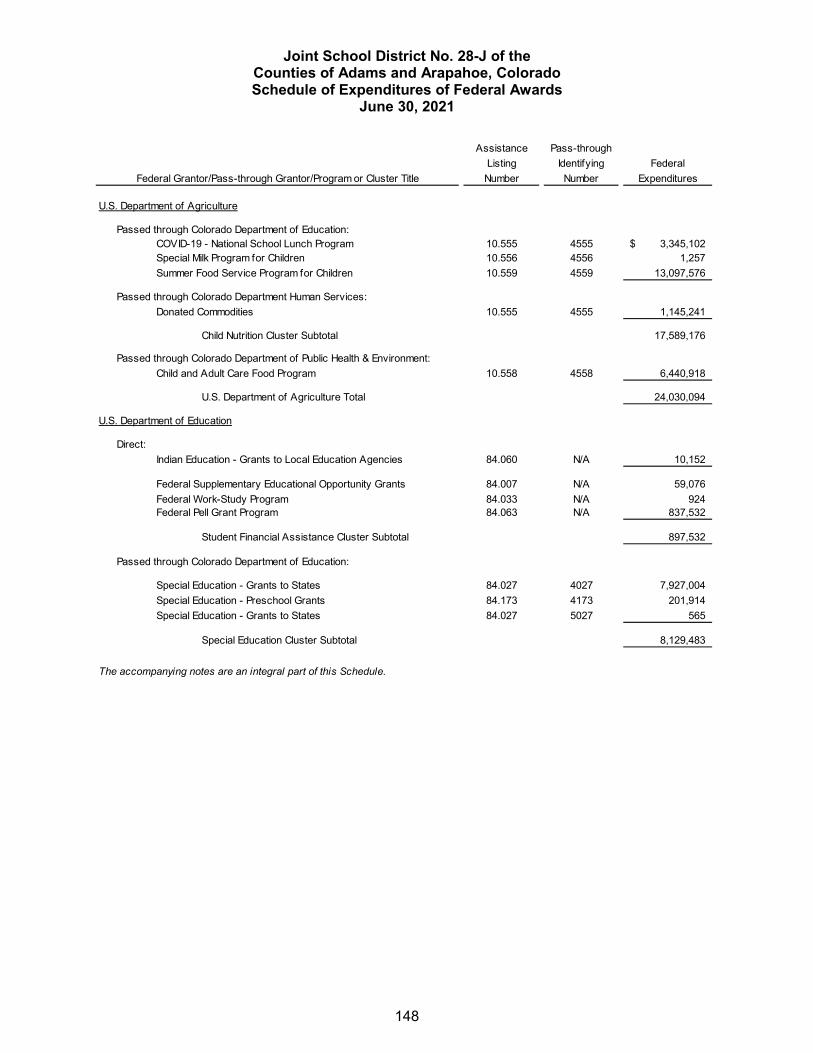
Joint School District No. 28-J of the Counties of Adams and Arapahoe, Colorado Schedule of Expenditures of Federal Awards
June 30, 2021
148
Schedule of Expenditures of Federal Awards
Assistance Pass-throughListing Identifying FederalNumber Number Expenditures
U.S. Department of Agriculture
Passed through Colorado Department of Education:COVID-19 - National School Lunch Program 10.555 4555 3,345,102$ Special Milk Program for Children 10.556 4556 1,257 Summer Food Service Program for Children 10.559 4559 13,097,576
Passed through Colorado Department Human Services:Donated Commodities 10.555 4555 1,145,241
Child Nutrition Cluster Subtotal 17,589,176
Passed through Colorado Department of Public Health & Environment:Child and Adult Care Food Program 10.558 4558 6,440,918
U.S. Department of Agriculture Total 24,030,094
U.S. Department of Education
Direct:Indian Education - Grants to Local Education Agencies 84.060 N/A 10,152
Federal Supplementary Educational Opportunity Grants 84.007 N/A 59,076 Federal Work-Study Program 84.033 N/A 924 Federal Pell Grant Program 84.063 N/A 837,532
Student Financial Assistance Cluster Subtotal 897,532
Passed through Colorado Department of Education:
Special Education - Grants to States 84.027 4027 7,927,004 Special Education - Preschool Grants 84.173 4173 201,914 Special Education - Grants to States 84.027 5027 565
Special Education Cluster Subtotal 8,129,483
The accompanying notes are an integral part of this Schedule.
Federal Grantor/Pass-through Grantor/Program or Cluster Title

Joint School District No. 28-J of the Counties of Adams and Arapahoe, Colorado Schedule of Expenditures of Federal Awards
June 30, 2021
149
Assistance Pass-throughListing Identifying FederalNumber Number Expenditures
Passed through Colorado Department of Education (continued):
Title I Grants to Local Educational Agencies 84.0104010, 5010 &
7010 10,611,906 Title I Part C Education of Migrant Children 84.011 4011 1,405,268 Title I, Vocational Education - Basic Grants to States 84.048 5048 & 6048 607,834 Title V, Part B. Public Charter School Grant 84.282 5282 203,243 Tw enty-First Century Community Learning Centers 84.287 5287 & 6287 547,755 Special Education - State Personnel Development 84.323 5323 33,229
English Language Acquisition Grants 84.3654365 & 5365 & 6365 & 7365 1,452,051
Title II Part A Supporting Effective Instruction State Grants 84.367 4367 1,337,696 School Improvement Grants 84.377 7377 9,874 Student Support and Academic Enrichment Program 84.424 4424 706,304 Colorado Multi-Tiered Behavioral Framew ork –
Colorado School Climate Transformation Grant 84.184F 8174 16,385 Charter School Program - Remote Learning 84.282A 8282 101,310 COVID-19 - Elementary and Secondary School Emergency
Relief Fund, RISE-Response, Innovation, & Student Equity 84.425C 6425 68,511 COVID-19 - Education Stabilization Fund Program Elementary and Secondary School Emergency Relief Fund (ESSER II Fund) 84.425D 4420 30,281,261 COVID-19 - Education Stabilization Fund Program Elementary and Secondary School Emergency Relief Fund (ESSER I Fund) 84.425D 4425 7,945,376
Passed through Colorado Department of Higher Education:
COVID-19 - Higher Education Emergency Relief Fund 84.425E 9425 2,128,288
U.S. Department of Education Total 66,493,458
U.S. Department of Treasury
Passed through Colorado Department of Education:
COVID-19 - Coronavirus Relief Fund K-12 - E7SD 21.019 4012 34,481,389 COVID-19 - Coronavirus Relief Fund K-12 At-Risk Pupils 21.019 5012 4,416,341 COVID-19 - Coronavirus Relief Fund - School Preparation/ Mitigation Funds/Safe Schools Reopening 21.019 6012 124,602
Passed through Colorado Department of Higher Education:COVID-19 - Coronavirus Relief Fund - Higher Education 21.019 9012 781,962
U.S. Department of Treasury Total 39,804,294
Other Federal Assistance
Air Force Jr. ROTC 12.000 N/A 157,954
Total Expenditures of Federal Aw ards 130,485,800$
The accompanying notes are an integral part of this Schedule.
Federal Grantor/Pass-through Grantor/Program or Cluster Title
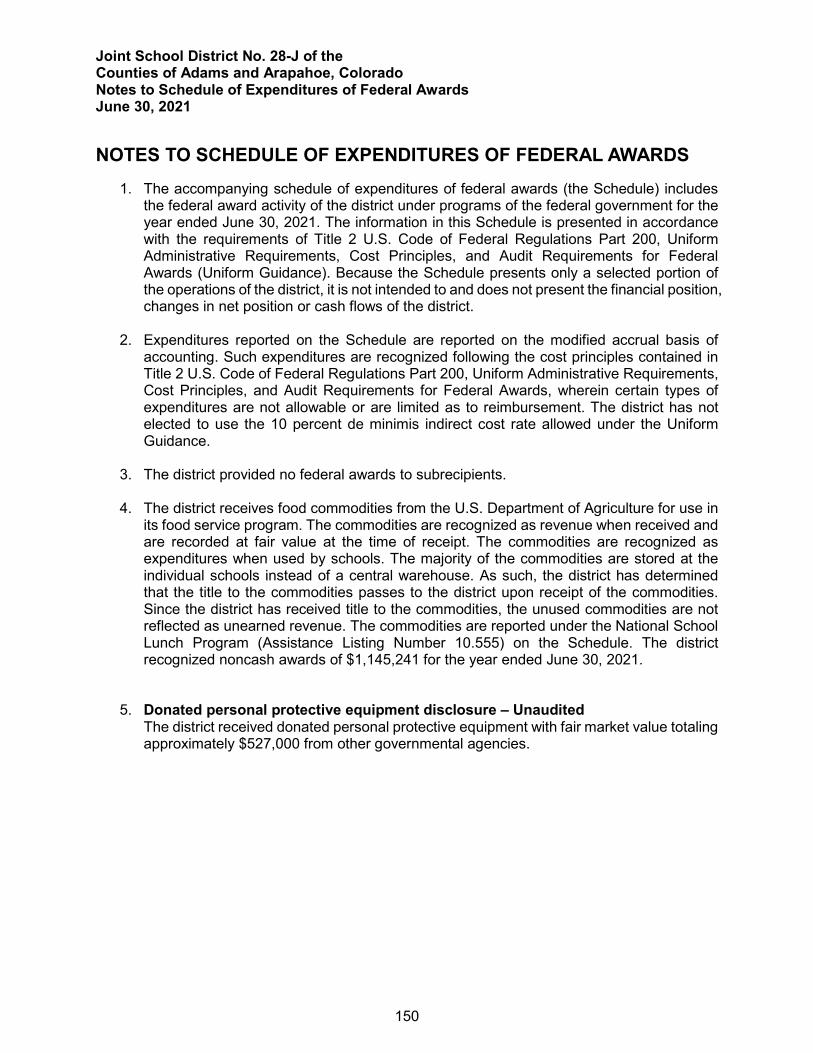
Joint School District No. 28-J of the Counties of Adams and Arapahoe, Colorado Notes to Schedule of Expenditures of Federal Awards June 30, 2021
150
Notes to Schedule of Expenditures of Federal Awards Notes to Schedule of Expenditures of Federal Awards
NOTES TO SCHEDULE OF EXPENDITURES OF FEDERAL AWARDS 1. The accompanying schedule of expenditures of federal awards (the Schedule) includes
the federal award activity of the district under programs of the federal government for the year ended June 30, 2021. The information in this Schedule is presented in accordance with the requirements of Title 2 U.S. Code of Federal Regulations Part 200, Uniform Administrative Requirements, Cost Principles, and Audit Requirements for Federal Awards (Uniform Guidance). Because the Schedule presents only a selected portion of the operations of the district, it is not intended to and does not present the financial position, changes in net position or cash flows of the district.
2. Expenditures reported on the Schedule are reported on the modified accrual basis of accounting. Such expenditures are recognized following the cost principles contained in Title 2 U.S. Code of Federal Regulations Part 200, Uniform Administrative Requirements, Cost Principles, and Audit Requirements for Federal Awards, wherein certain types of expenditures are not allowable or are limited as to reimbursement. The district has not elected to use the 10 percent de minimis indirect cost rate allowed under the Uniform Guidance.
3. The district provided no federal awards to subrecipients.
4. The district receives food commodities from the U.S. Department of Agriculture for use in its food service program. The commodities are recognized as revenue when received and are recorded at fair value at the time of receipt. The commodities are recognized as expenditures when used by schools. The majority of the commodities are stored at the individual schools instead of a central warehouse. As such, the district has determined that the title to the commodities passes to the district upon receipt of the commodities. Since the district has received title to the commodities, the unused commodities are not reflected as unearned revenue. The commodities are reported under the National School Lunch Program (Assistance Listing Number 10.555) on the Schedule. The district recognized noncash awards of $1,145,241 for the year ended June 30, 2021.
5. Donated personal protective equipment disclosure – Unaudited The district received donated personal protective equipment with fair market value totaling approximately $527,000 from other governmental agencies.
Report on Internal Control Over Financial Reporting and on Compliance and Other Matters Based on an Audit
of Financial Statements Performed in Accordance with Government Auditing Standards
Independent Auditor’s Report
Board of Education Joint School District No. 28-J of the Counties of Adams and Arapahoe, Colorado Aurora, Colorado
We have audited, in accordance with auditing standards generally accepted in the United States of America and the standards applicable to financial audits contained in Government Auditing Standards, issued by the Comptroller General of the United States, the financial statements of the governmental activities, the aggregate discretely presented component unites, each major fund, and the aggregate remaining fund information of the Joint School District No. 28-J of the Counties of Adams and Arapahoe, Colorado (the District) as of and for the year ended June 30, 2021, and the related notes to the financial statements, which collectively comprise the District’s basic financial statements, and have issued our report thereon dated November 3, 2021. Our report includes a reference to other auditors who audited the financial statements of Aurora Academy, Global Village Academy, Academy of Advanced Learning, Lotus School for Excellence, Vanguard Classical School, AXL Academy, Rocky Mountain Preparatory School, Vega Collegiate Academy, and Empower Community High School, as described in our report on the District’s financial statements. This report does not include the results of other auditor’s testing of internal controls over financial reporting or compliance and other matters that are reported on separately by those auditors. The financial statements of Aurora Public Schools Foundation, AXL Academy, Vanguard Classical School, Vega Collegiate Academy, and Empower Community High School, component units included in the financial statements of the aggregate discretely presented component units, were not audited in accordance with Government Auditing Standards.
Internal Control Over Financial Reporting
In planning and performing our audit of the financial statements, we considered the District’s internal control over financial reporting (internal control) as a basis for determining audit procedures that are appropriate in the circumstances for the purpose of expressing our opinions on the financial statements, but not for the purpose of expressing an opinion on the effectiveness of the District’s internal control. Accordingly, we do not express an opinion on the effectiveness of the District’s internal control.
Board of Education Joint School District No. 28-J of the Counties of Adams and Arapahoe, Colorado
A deficiency in internal control exists when the design or operation of a control does not allow management or employees, in the normal course of performing their assigned functions, to prevent, or detect and correct, misstatements on a timely basis. A material weakness is a deficiency, or a combination of deficiencies, in internal control, such that there is a reasonable possibility that a material misstatement of the District’s financial statements will not be prevented, or detected and corrected, on a timely basis. A significant deficiency is a deficiency, or a combination of deficiencies, in internal control that is less severe than a material weakness, yet important enough to merit attention by those charged with governance.
Our consideration of internal control was for the limited purpose described in the first paragraph of this section and was not designed to identify all deficiencies in internal control that might be material weaknesses or significant deficiencies. Given these limitations, during our audit we did not identify any deficiencies in internal control that we consider to be material weaknesses. However, material weaknesses may exist that have not been identified.
Compliance and Other Matters
As part of obtaining reasonable assurance about whether the District’s financial statements are free from material misstatement, we performed tests of its compliance with certain provisions of laws, regulations, contracts and grant agreements, noncompliance with which could have a direct and material effect on the determination of financial statement amounts. However, providing an opinion on compliance with those provisions was not an objective of our audit, and accordingly, we do not express such an opinion. The results of our tests disclosed no instances of noncompliance or other matters that are required to be reported under Government Auditing Standards.
Purpose of this Report
The purpose of this report is solely to describe the scope of our testing of internal control and compliance and the results of that testing, and not to provide an opinion on the effectiveness of the District’s internal control or on compliance. This report is an integral part of an audit performed in accordance with Government Auditing Standards in considering the entity’s internal control and compliance. Accordingly, this communication is not suitable for any other purpose.
Denver, Colorado November 3, 2021
Report on Compliance for Each Major Federal Program and Report on Internal Control Over Compliance
Independent Auditor’s Report
Board of Education Joint School District No. 28-J of the Counties of Adams and Arapahoe, Colorado Aurora, Colorado
Report on Compliance for Each Major Federal Program
We have audited the Joint School District No. 28-J of the Counties of Adams and Arapahoe, Colorado’s (the District) compliance with the types of compliance requirements described in the OMB Compliance Supplement that could have a direct and material effect on each of the District’s major federal programs for the year ended June 30, 2021. The District’s major federal programs are identified in the summary of auditor’s results section of the accompanying schedule of findings and questioned costs.
Management’s Responsibility
Management is responsible for compliance with federal statutes, regulations, contracts and the terms and conditions of its federal awards applicable to its federal programs.
Auditor’s Responsibility
Our responsibility is to express an opinion on compliance for each the District’s major federal programs based on our audit of the types of compliance requirements referred to above. We conducted our audit of compliance in accordance with auditing standards generally accepted in the United States of America; the standards applicable to financial audits contained in Government Auditing Standards, issued by the Comptroller General of the United States; and the audit requirements of Title 2 U.S. Code of Federal Regulations Part 200, Uniform Administrative Requirements, Cost Principles, and Audit Requirements for Federal Awards (Uniform Guidance). Those standards and the Uniform Guidance require that we plan and perform the audit to obtain reasonable assurance about whether noncompliance with the types of compliance requirements referred to above that could have a direct and material effect on a major federal program occurred. An audit includes examining, on a test basis, evidence about the District’s compliance with those requirements and performing such other procedures as we considered necessary in the circumstances.
We believe that our audit provides a reasonable basis for our opinion on compliance for each major federal program. However, our audit does not provide a legal determination of the District’s compliance.
Board of Education Joint School District No. 28-J of the Counties of Adams and Arapahoe, Colorado
Opinion on Each Major Federal Program
In our opinion, the District complied, in all material respects, with the types of compliance requirements referred to above that could have a direct and material effect on each of its major federal program for the year ended June 30, 2021.
Report on Internal Control Over Compliance
Management of the District is responsible for establishing and maintaining effective internal control over compliance with the types of compliance requirements referred to above. In planning and performing our audit of compliance, we considered the District’s internal control over compliance with the types of requirements that could have a direct and material effect on each major federal program to determine the auditing procedures that are appropriate in the circumstances for the purpose of expressing our opinion on compliance for each major federal program and to test and report on internal control over compliance in accordance with the Uniform Guidance, but not for the purpose of expressing an opinion on the effectiveness of internal control over compliance. Accordingly, we do not express an opinion on the effectiveness of the District’s internal control over compliance.
A deficiency in internal control over compliance exists when the design or operation of a control over compliance does not allow management or employees, in the normal course of performing their assigned functions, to prevent, or detect and correct, noncompliance with a type of compliance requirement of a federal program on a timely basis. A material weakness in internal control over compliance is a deficiency, or a combination of deficiencies, in internal control over compliance, such that there is a reasonable possibility that material noncompliance with a type of compliance requirement of a federal program will not be prevented, or detected and corrected, on a timely basis. A significant deficiency in internal control over compliance is a deficiency, or a combination of deficiencies, in internal control over compliance with a type of compliance requirement of a federal program that is less severe than a material weakness in internal control over compliance, yet important enough to merit attention by those charged with governance.
Our consideration of internal control over compliance was for the limited purposed described in the first paragraph of this section and was not designed to identify all deficiencies in internal control over compliance that might be material weaknesses or significant deficiencies. We did not identify any deficiencies in internal control over compliance that we consider to be material weaknesses. However, material weaknesses may exist that have not been identified.
The purpose of this report on internal control over compliance is solely to describe the scope of our testing of internal control over compliance and the results of that testing based on the requirements of the Uniform Guidance. Accordingly, this report is not suitable for any other purpose.
Denver, Colorado November 3, 2021
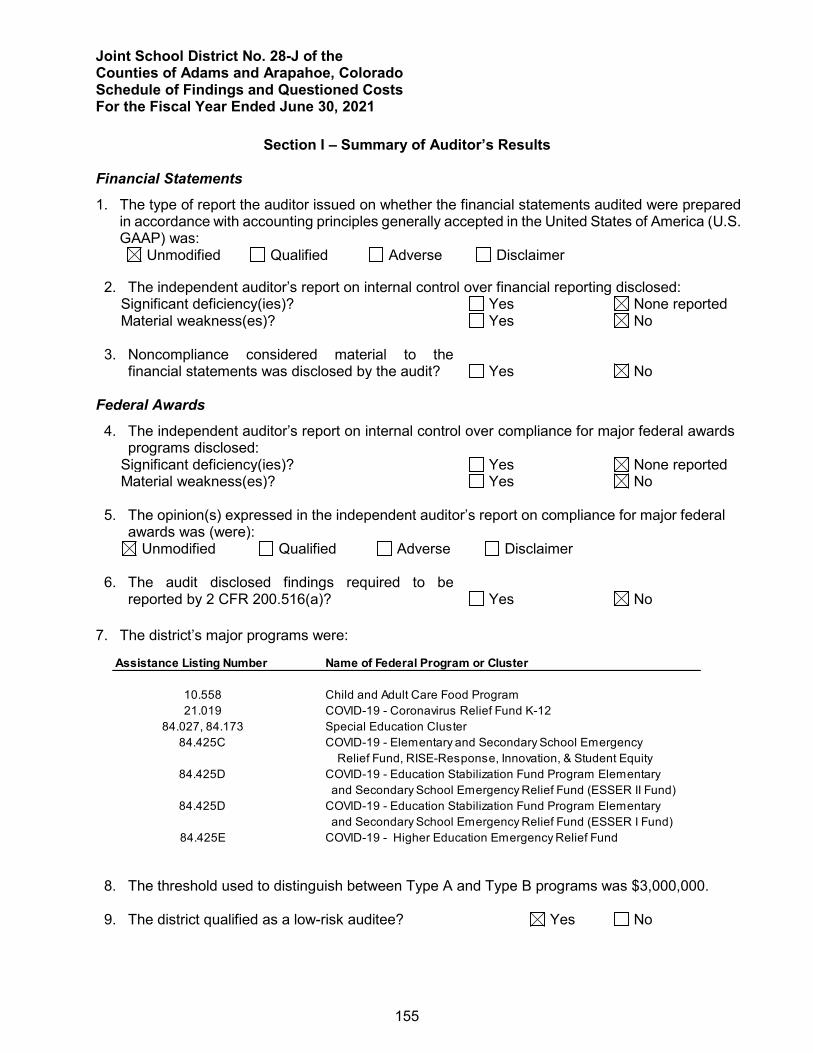
Joint School District No. 28-J of the Counties of Adams and Arapahoe, Colorado Schedule of Findings and Questioned Costs For the Fiscal Year Ended June 30, 2021
155
Schedule of Findings and Questioned Costs
Section I – Summary of Auditor’s Results Financial Statements
1. The type of report the auditor issued on whether the financial statements audited were prepared in accordance with accounting principles generally accepted in the United States of America (U.S. GAAP) was:
Unmodified Qualified Adverse Disclaimer
2. The independent auditor’s report on internal control over financial reporting disclosed: Significant deficiency(ies)? Yes None reported Material weakness(es)? Yes No
3. Noncompliance considered material to the financial statements was disclosed by the audit?
Yes
No
Federal Awards
4. The independent auditor’s report on internal control over compliance for major federal awards programs disclosed:
Significant deficiency(ies)? Yes None reported Material weakness(es)? Yes No
5. The opinion(s) expressed in the independent auditor’s report on compliance for major federal
awards was (were): Unmodified Qualified Adverse Disclaimer
6. The audit disclosed findings required to be
reported by 2 CFR 200.516(a)?
Yes
No 7. The district’s major programs were:
Assistance Listing Number Name of Federal Program or Cluster
10.558 Child and Adult Care Food Program 21.019 COVID-19 - Coronavirus Relief Fund K-12
84.027, 84.173 Special Education Cluster84.425C COVID-19 - Elementary and Secondary School Emergency
Relief Fund, RISE-Response, Innovation, & Student Equity84.425D COVID-19 - Education Stabilization Fund Program Elementary
and Secondary School Emergency Relief Fund (ESSER II Fund)84.425D COVID-19 - Education Stabilization Fund Program Elementary
and Secondary School Emergency Relief Fund (ESSER I Fund)84.425E COVID-19 - Higher Education Emergency Relief Fund
8. The threshold used to distinguish between Type A and Type B programs was $3,000,000.
9. The district qualified as a low-risk auditee? Yes No
Joint School District No. 28-J of the Counties of Adams and Arapahoe, Colorado Schedule of Findings and Questioned Costs Section II – Financial Statement Findings For the Fiscal Year Ended June 30, 2021
156
Section II – Financial Statement Findings
ReferenceNumber Finding
No matters are reportable.
Joint School District No. 28-J of the Counties of Adams and Arapahoe, Colorado Schedule of Findings and Questioned Costs Section III – Federal Award Findings and Questioned Costs For the Fiscal Year Ended June 30, 2021
157
Section III – Federal Award Findings and Questioned Costs
ReferenceNumber Finding
No matters are reportable.
Joint School District No. 28-J of the Counties of Adams and Arapahoe, Colorado Summary Schedule of Prior Audit Findings For the Fiscal Year Ended June 30, 20211
158
Summary Schedule of Prior Audit Findings
Summary Schedule of Prior Audit Findings ReferenceNumber Finding Status
No matters are reportable.