Embed Size (px)
Citation preview
1st & 2nd September 2010
CII 11th National Award for Excellence in Energy
Management 2010
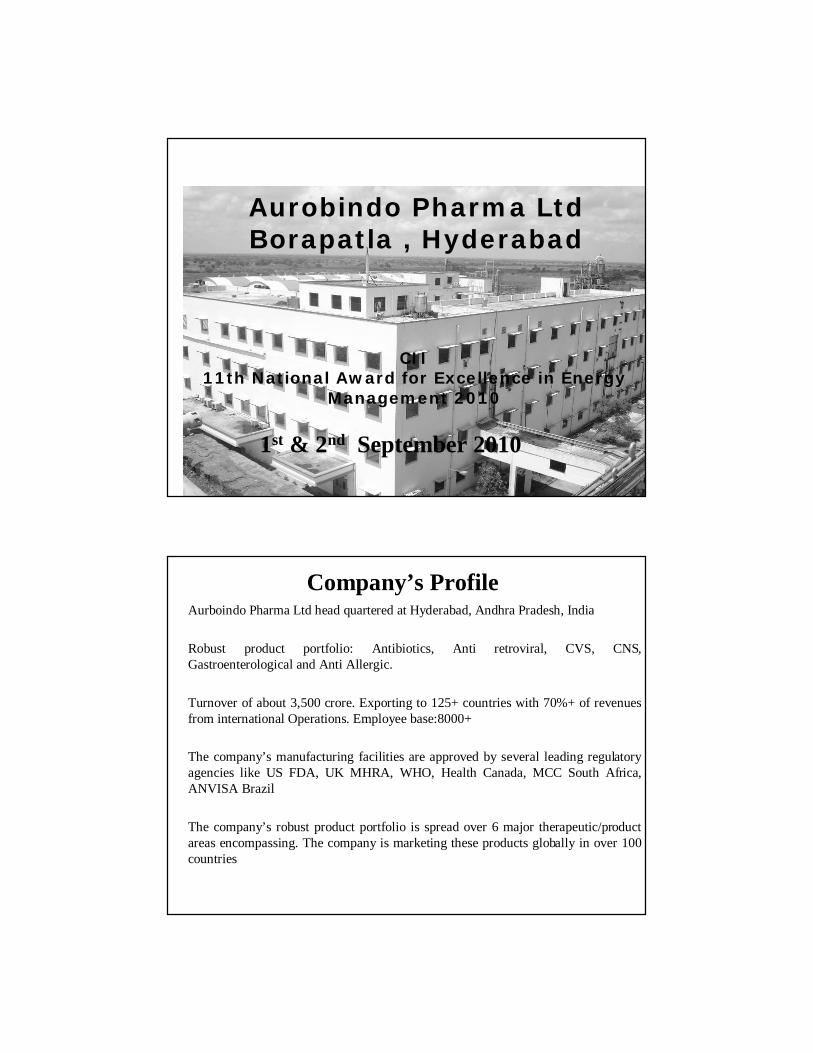
Aurobindo Pharma Ltd Borapatla , Hyderabad
Company’s Profile Aurboindo Pharma Ltd head quartered at Hyderabad, Andhra Pradesh, India
Robust product portfolio: Antibiotics, Anti retroviral, CVS, CNS, Gastroenterological and Anti Allergic.
Turnover of about 3,500 crore. Exporting to 125+ countries with 70%+ of revenues from international Operations. Employee base:8000+
The company’s manufacturing facilities are approved by several leading regulatory agencies like US FDA, UK MHRA, WHO, Health Canada, MCC South Africa, ANVISA Brazil
The company’s robust product portfolio is spread over 6 major therapeutic/product areas encompassing. The company is marketing these products globally in over 100 countries
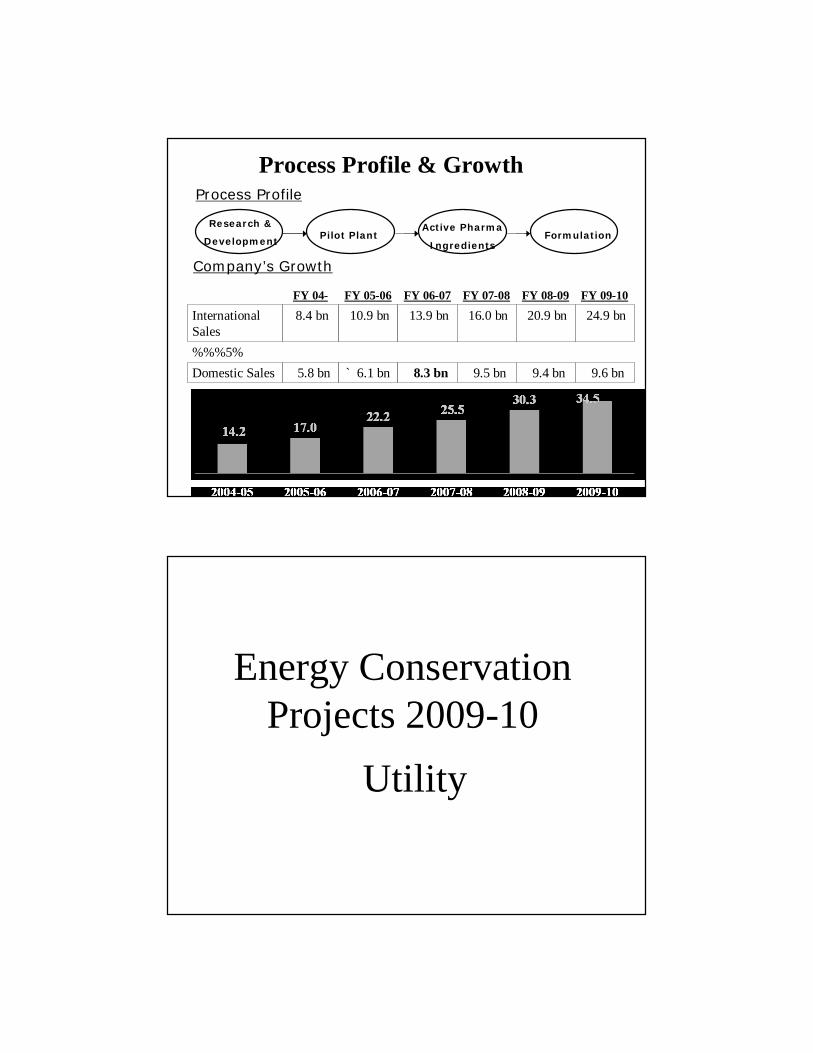
FY 04-05
FY 05-06 FY 06-07 FY 07-08 FY 08-09 FY 09-10
International Sales
8.4 bn 10.9 bn 13.9 bn 16.0 bn 20.9 bn 24.9 bn
%%%5%Domestic Sales 5.8 bn ` 6.1 bn 8.3 bn 9.5 bn 9.4 bn 9.6 bn
Process Profile & Growth
Pilot PlantResearch &
DevelopmentActive Pharma
IngredientsFormulation
Process Profile
Company’s Growth
Energy Conservation Projects 2009-10
Utility
v Process: Reaction+ Distillationv Original design: Thermic fluid was being
used as media of heating & cooling for both process.vModification: Distillation process does
require heating only, hence direct steam is used for the above process.
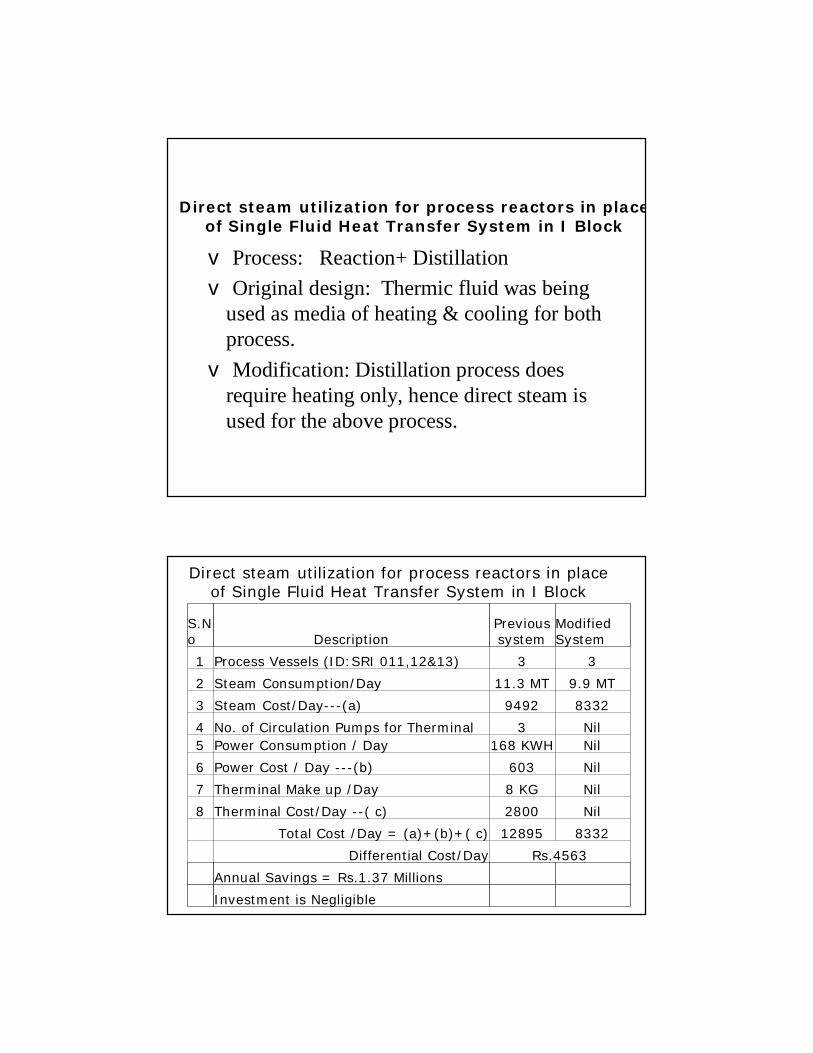
Direct steam utilization for process reactors in place of Single Fluid Heat Transfer System in I Block
Direct steam utilization for process reactors in place of Single Fluid Heat Transfer System in I Block
S.No Description
Previous system
Modified System
1 Process Vessels (ID:SRI 011,12&13) 3 3
2 Steam Consumption/Day 11.3 MT 9.9 MT
3 Steam Cost/Day---(a) 9492 8332
4 No. of Circulation Pumps for Therminal 3 Nil5 Power Consumption / Day 168 KWH Nil
6 Power Cost / Day ---(b) 603 Nil
7 Therminal Make up /Day 8 KG Nil
8 Therminal Cost/Day --( c) 2800 Nil
Total Cost /Day = (a)+(b)+( c) 12895 8332
Differential Cost/Day Rs.4563
Annual Savings = Rs.1.37 Millions
Investment is Negligible
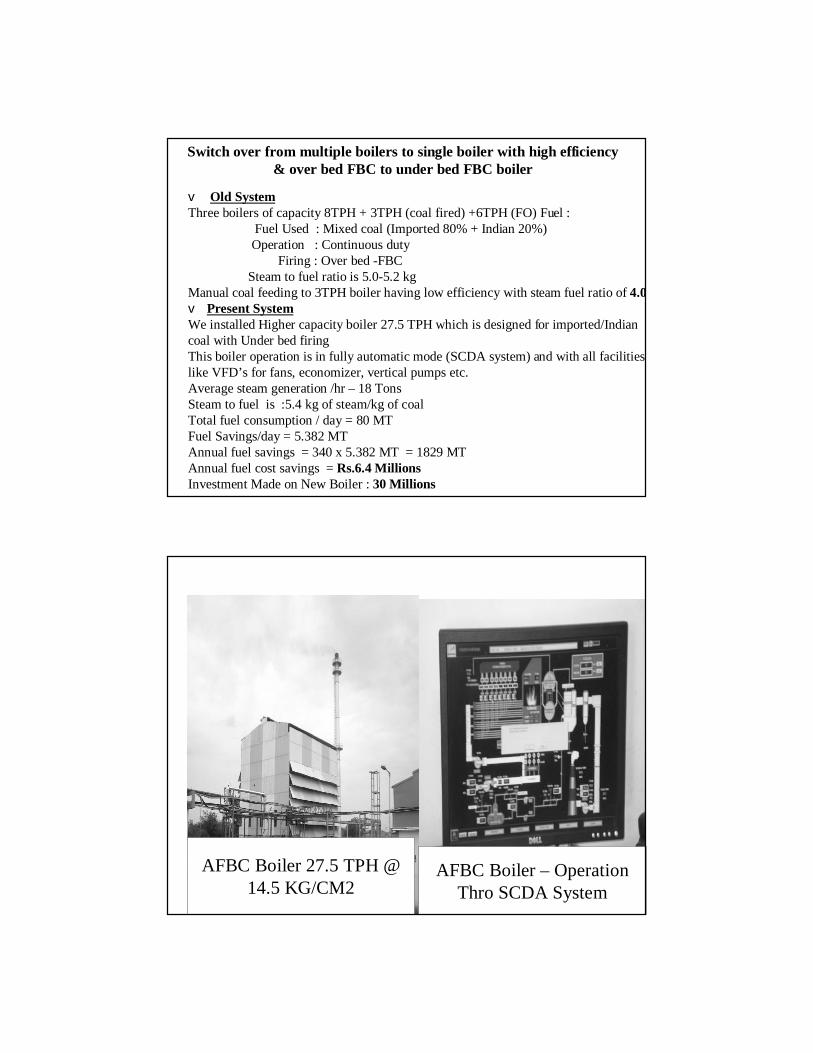
Switch over from multiple boilers to single boiler with high efficiency & over bed FBC to under bed FBC boiler
v Old SystemThree boilers of capacity 8TPH + 3TPH (coal fired) +6TPH (FO) Fuel :
Fuel Used : Mixed coal (Imported 80% + Indian 20%) Operation : Continuous duty
Firing : Over bed -FBCSteam to fuel ratio is 5.0-5.2 kg
Manual coal feeding to 3TPH boiler having low efficiency with steam fuel ratio of 4.0v Present SystemWe installed Higher capacity boiler 27.5 TPH which is designed for imported/Indian coal with Under bed firing This boiler operation is in fully automatic mode (SCDA system) and with all facilities like VFD’s for fans, economizer, vertical pumps etc.Average steam generation /hr – 18 TonsSteam to fuel is :5.4 kg of steam/kg of coalTotal fuel consumption / day = 80 MTFuel Savings/day = 5.382 MTAnnual fuel savings = 340 x 5.382 MT = 1829 MTAnnual fuel cost savings = Rs.6.4 MillionsInvestment Made on New Boiler : 30 Millions
AFBC Boiler 27.5 TPH @ 14.5 KG/CM2
AFBC Boiler – Operation Thro SCDA System
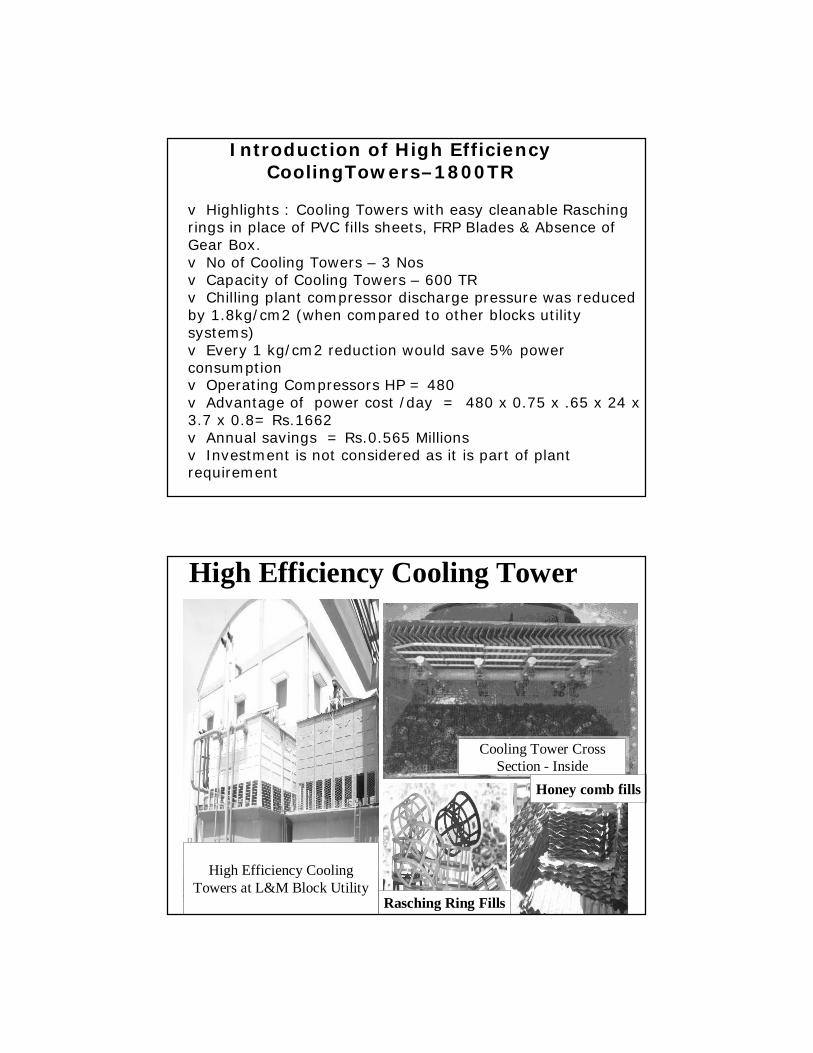
Introduction of High Efficiency CoolingTowers–1800TR
v Highlights : Cooling Towers with easy cleanable Raschingrings in place of PVC fills sheets, FRP Blades & Absence of Gear Box. v No of Cooling Towers – 3 Nosv Capacity of Cooling Towers – 600 TRv Chilling plant compressor discharge pressure was reduced by 1.8kg/cm2 (when compared to other blocks utility systems)v Every 1 kg/cm2 reduction would save 5% power consumptionv Operating Compressors HP = 480 v Advantage of power cost /day = 480 x 0.75 x .65 x 24 x 3.7 x 0.8= Rs.1662v Annual savings = Rs.0.565 Millionsv Investment is not considered as it is part of plant requirement
High Efficiency Cooling Tower
High Efficiency Cooling Towers at L&M Block Utility
Cooling Tower Cross Section - Inside
Honey comb fills
Rasching Ring Fills
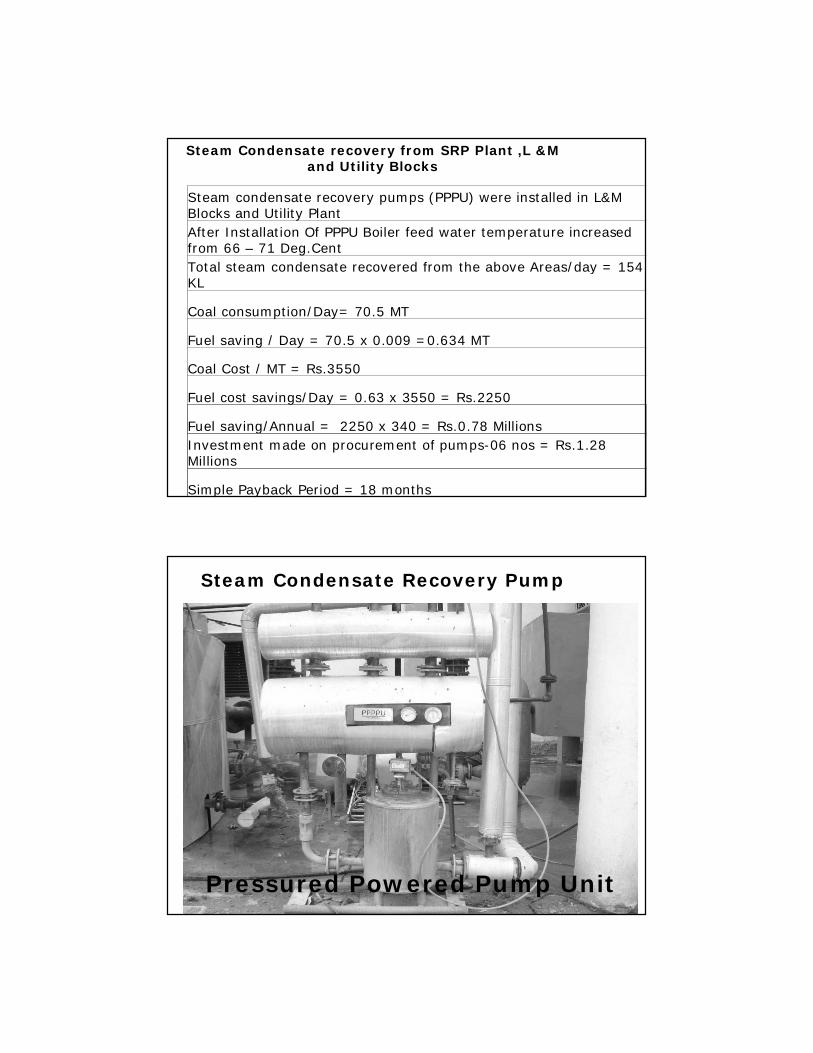
Steam Condensate recovery from SRP Plant ,L &M and Utility Blocks
Steam condensate recovery pumps (PPPU) were installed in L&M Blocks and Utility PlantAfter Installation Of PPPU Boiler feed water temperature increased from 66 – 71 Deg.CentTotal steam condensate recovered from the above Areas/day = 154 KL
Coal consumption/Day= 70.5 MT
Fuel saving / Day = 70.5 x 0.009 =0.634 MT
Coal Cost / MT = Rs.3550
Fuel cost savings/Day = 0.63 x 3550 = Rs.2250
Fuel saving/Annual = 2250 x 340 = Rs.0.78 MillionsInvestment made on procurement of pumps-06 nos = Rs.1.28 Millions
Simple Payback Period = 18 months
Steam Condensate Recovery Pump
Pressured Powered Pump Unit
Energy Conservation Projects-Electrical
v Energy saver in lighting circuit panel to maintain constant voltage between 200-210 to reduce the power consumption & lamps failure.
v Achieved savings is 15%
v Illumination levels . 200-220 lux
Energy Saver In Lighting Circuit
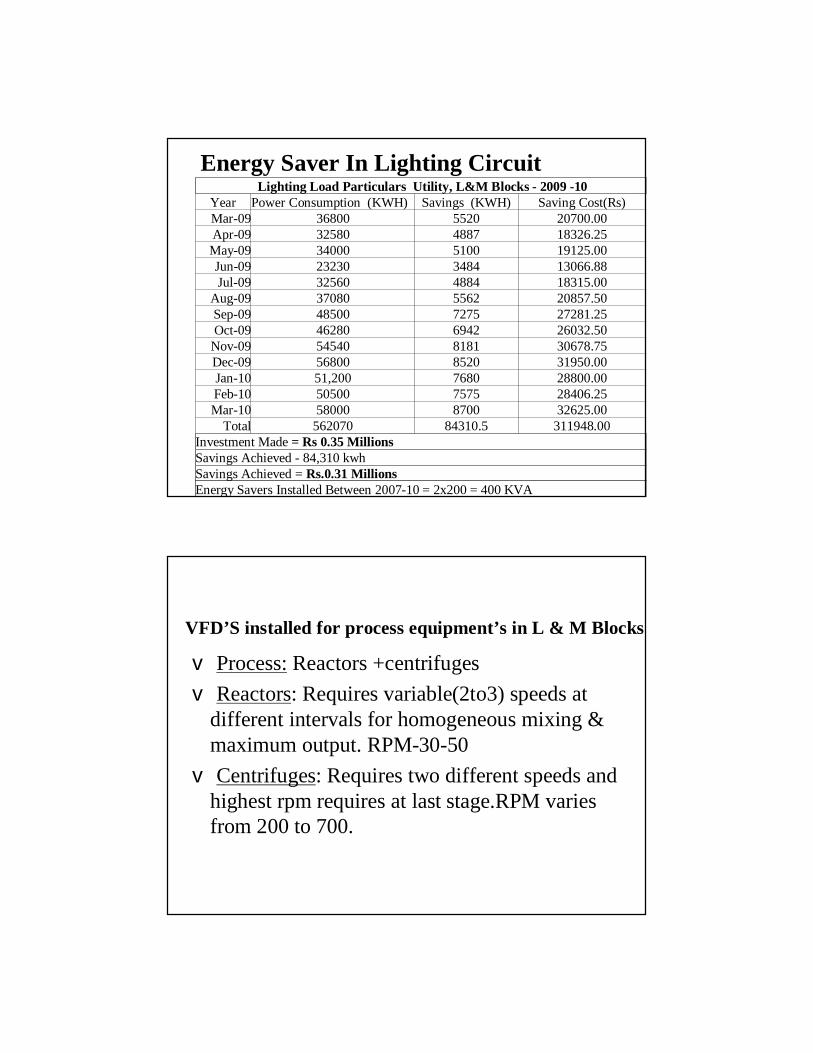
Energy Saver In Lighting CircuitLighting Load Particulars Utility, L&M Blocks - 2009 -10
Year Power Consumption (KWH) Savings (KWH) Saving Cost(Rs)Mar-09 36800 5520 20700.00Apr-09 32580 4887 18326.25May-09 34000 5100 19125.00Jun-09 23230 3484 13066.88Jul-09 32560 4884 18315.00
Aug-09 37080 5562 20857.50Sep-09 48500 7275 27281.25Oct-09 46280 6942 26032.50
Nov-09 54540 8181 30678.75Dec-09 56800 8520 31950.00Jan-10 51,200 7680 28800.00Feb-10 50500 7575 28406.25Mar-10 58000 8700 32625.00
Total 562070 84310.5 311948.00Investment Made = Rs 0.35 MillionsSavings Achieved - 84,310 kwhSavings Achieved = Rs.0.31 MillionsEnergy Savers Installed Between 2007-10 = 2x200 = 400 KVA
v Process: Reactors +centrifugesv Reactors: Requires variable(2to3) speeds at
different intervals for homogeneous mixing & maximum output. RPM-30-50v Centrifuges: Requires two different speeds and
highest rpm requires at last stage.RPM varies from 200 to 700.
VFD’S installed for process equipment’s in L & M Blocks
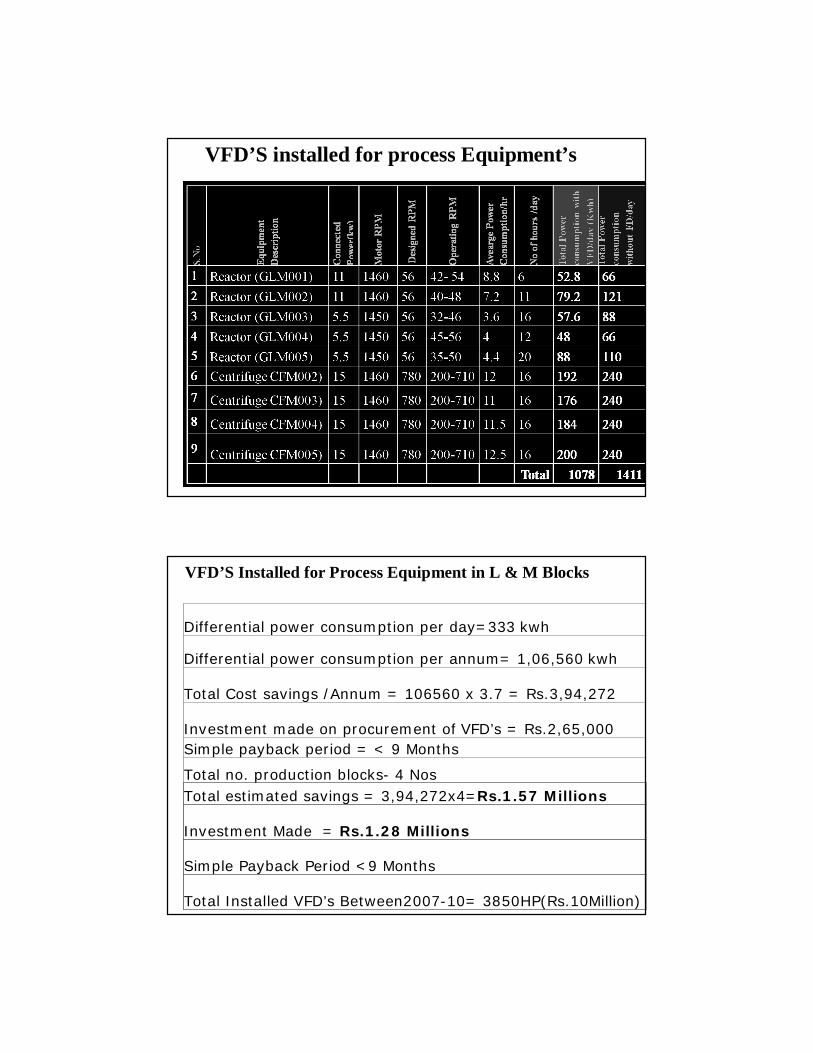
VFD’S installed for process Equipment’s
Differential power consumption per day=333 kwh
Differential power consumption per annum= 1,06,560 kwh
Total Cost savings /Annum = 106560 x 3.7 = Rs.3,94,272
Investment made on procurement of VFD’s = Rs.2,65,000Simple payback period = < 9 Months
Total no. production blocks- 4 NosTotal estimated savings = 3,94,272x4=Rs.1.57 Millions
Investment Made = Rs.1.28 Millions
Simple Payback Period <9 Months
Total Installed VFD’s Between2007-10= 3850HP(Rs.10Million)
VFD’S Installed for Process Equipment in L & M Blocks
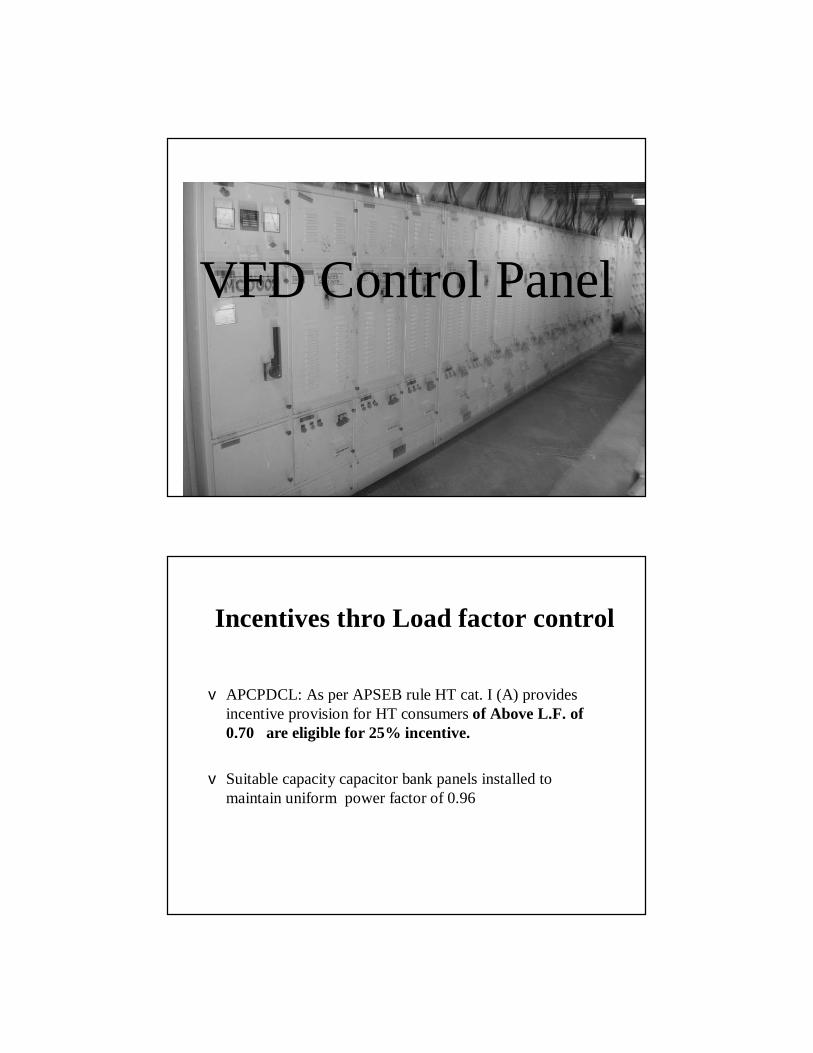
VFD Control Panel
Incentives thro Load factor control
v APCPDCL: As per APSEB rule HT cat. I (A) provides incentive provision for HT consumers of Above L.F. of 0.70 are eligible for 25% incentive.
v Suitable capacity capacitor bank panels installed to maintain uniform power factor of 0.96
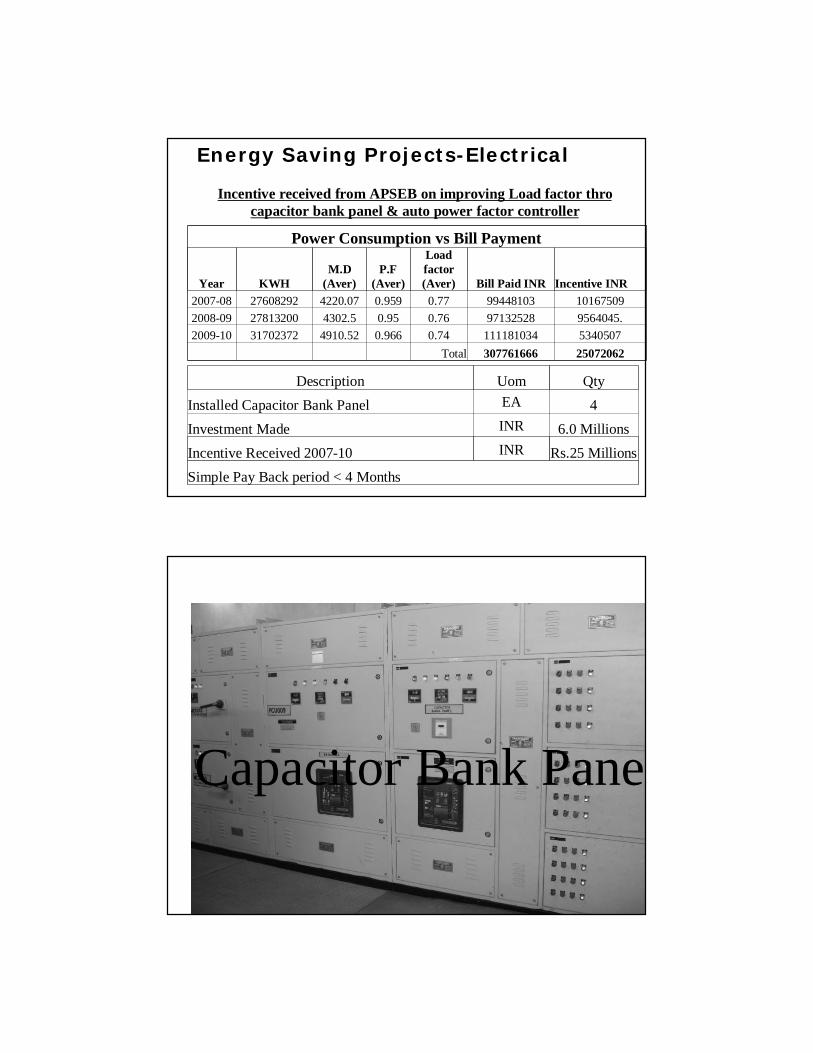
Energy Saving Projects-Electrical
Power Consumption vs Bill Payment
Year KWHM.D
(Aver)P.F
(Aver)
Load factor (Aver) Bill Paid INR Incentive INR
2007-08 27608292 4220.07 0.959 0.77 99448103 101675092008-09 27813200 4302.5 0.95 0.76 97132528 9564045.2009-10 31702372 4910.52 0.966 0.74 111181034 5340507
Total 307761666 25072062
Incentive received from APSEB on improving Load factor thro capacitor bank panel & auto power factor controller
Description Uom QtyInstalled Capacitor Bank Panel EA 4Investment Made INR 6.0 MillionsIncentive Received 2007-10 INR Rs.25 MillionsSimple Pay Back period < 4 Months
06 Aug 2010 Aurobindo Pharma Limited. 22
Capacitor Bank Panel
Energy Conservation Projects-Process
v One of production block reactors using conventional anchor agitators having low efficient mixing resulted quality as well quantity was affected.
v New high efficient agitator –Double flight helix with bottom anchor type provided high yield & quality though power consumption per batch is increased.
v The additional power cost is meager with respect high yield benefit.
High Efficiency Agitators for Reactors
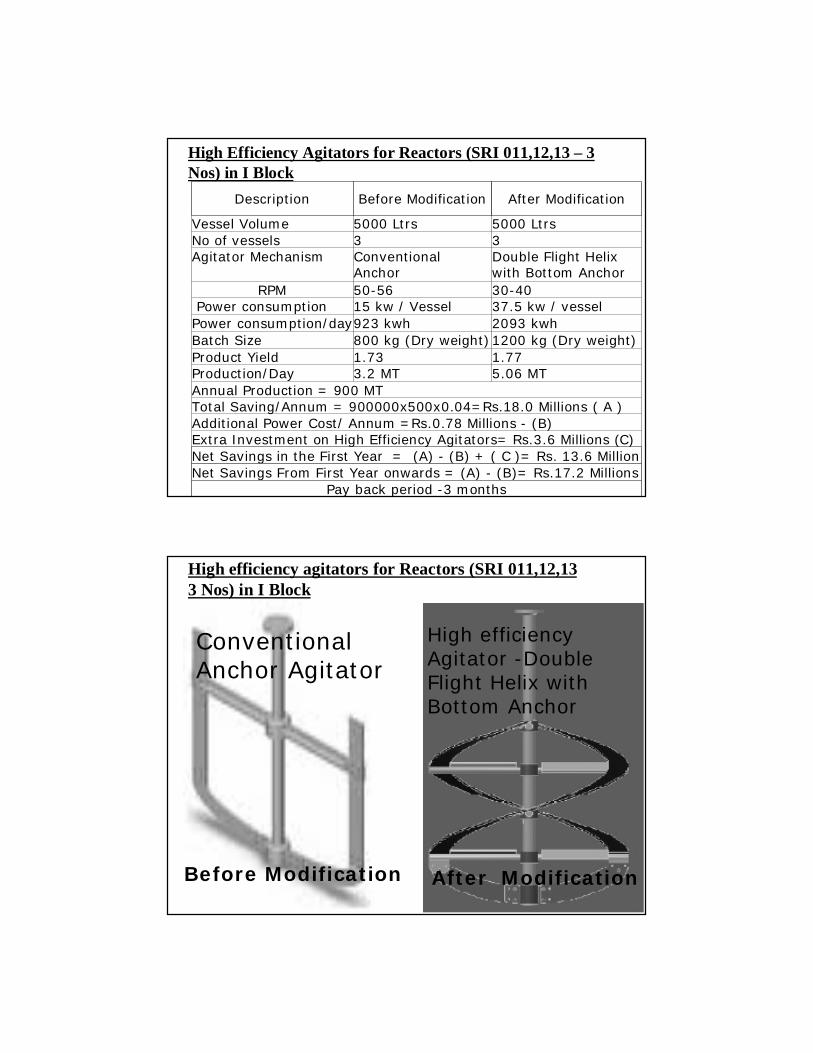
High Efficiency Agitators for Reactors (SRI 011,12,13 – 3 Nos) in I Block
Description Before Modification After Modification
Vessel Volume 5000 Ltrs 5000 LtrsNo of vessels 3 3Agitator Mechanism Conventional
Anchor Double Flight Helix with Bottom Anchor
RPM 50-56 30-40Power consumption 15 kw / Vessel 37.5 kw / vessel
Power consumption/day923 kwh 2093 kwhBatch Size 800 kg (Dry weight)1200 kg (Dry weight)Product Yield 1.73 1.77Production/Day 3.2 MT 5.06 MTAnnual Production = 900 MTTotal Saving/Annum = 900000x500x0.04=Rs.18.0 Millions ( A )Additional Power Cost/ Annum =Rs.0.78 Millions - (B)Extra Investment on High Efficiency Agitators= Rs.3.6 Millions (C) Net Savings in the First Year = (A) - (B) + ( C )= Rs. 13.6 MillionNet Savings From First Year onwards = (A) - (B)= Rs.17.2 Millions
Pay back period -3 months
High efficiency Agitator -Double Flight Helix with Bottom Anchor
High efficiency agitators for Reactors (SRI 011,12,13 3 Nos) in I Block
Conventional Anchor Agitator
Before Modification After Modification
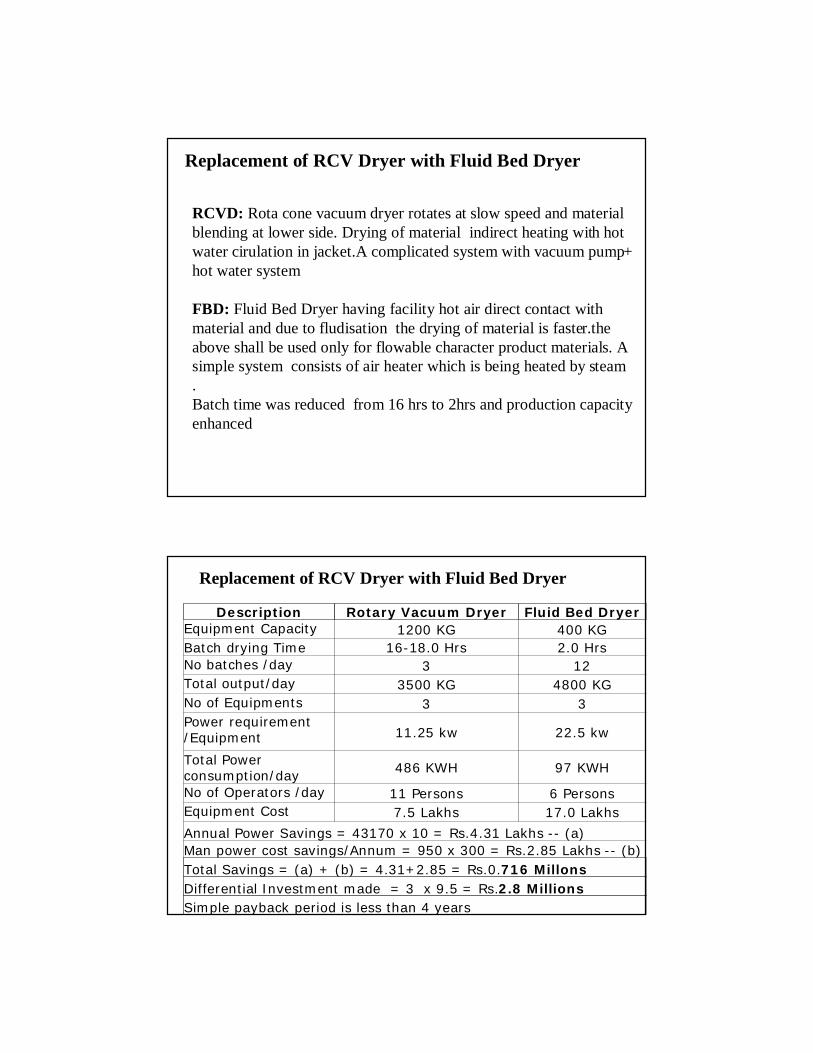
RCVD: Rota cone vacuum dryer rotates at slow speed and material blending at lower side. Drying of material indirect heating with hot water cirulation in jacket.A complicated system with vacuum pump+ hot water system
FBD: Fluid Bed Dryer having facility hot air direct contact with material and due to fludisation the drying of material is faster.the above shall be used only for flowable character product materials. A simple system consists of air heater which is being heated by steam . Batch time was reduced from 16 hrs to 2hrs and production capacity enhanced
Replacement of RCV Dryer with Fluid Bed Dryer
Replacement of RCV Dryer with Fluid Bed Dryer
Description Rotary Vacuum Dryer Fluid Bed DryerEquipment Capacity 1200 KG 400 KGBatch drying Time 16-18.0 Hrs 2.0 HrsNo batches /day 3 12Total output/day 3500 KG 4800 KGNo of Equipments 3 3Power requirement /Equipment 11.25 kw 22.5 kw
Total Power consumption/day 486 KWH 97 KWH
No of Operators /day 11 Persons 6 PersonsEquipment Cost 7.5 Lakhs 17.0 Lakhs
Annual Power Savings = 43170 x 10 = Rs.4.31 Lakhs -- (a)Man power cost savings/Annum = 950 x 300 = Rs.2.85 Lakhs -- (b)Total Savings = (a) + (b) = 4.31+2.85 = Rs.0.716 MillonsDifferential Investment made = 3 x 9.5 = Rs.2.8 MillionsSimple payback period is less than 4 years
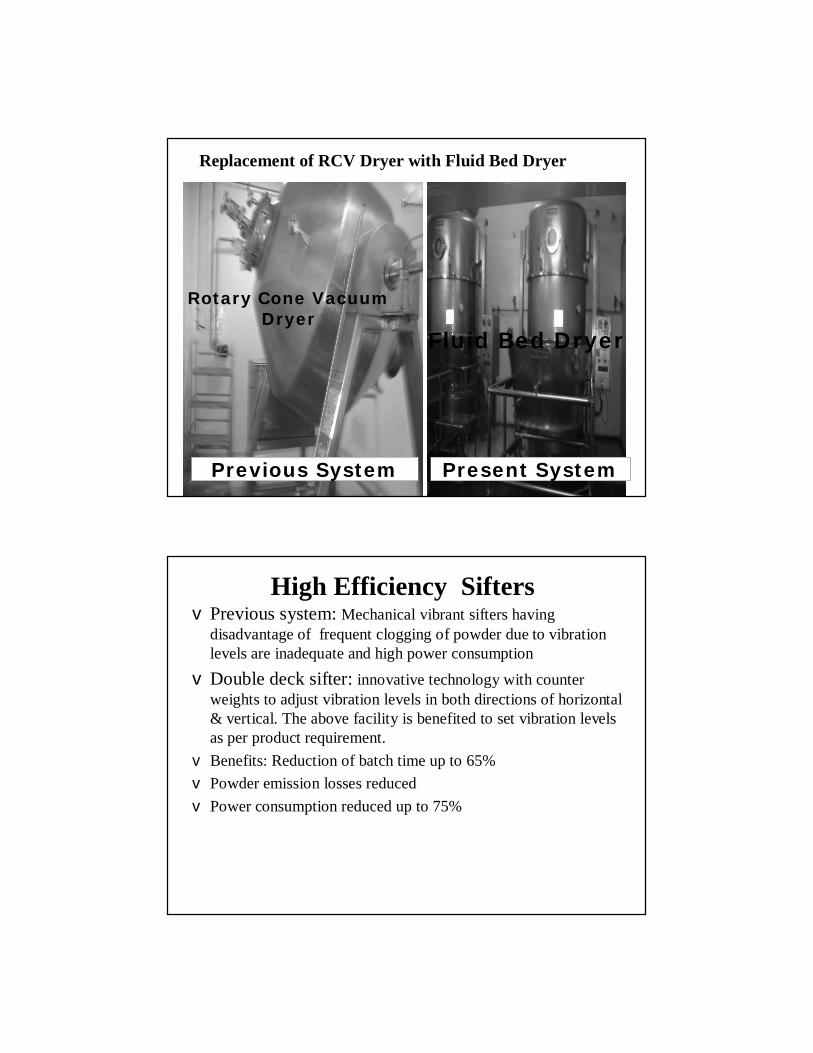
Replacement of RCV Dryer with Fluid Bed Dryer
Fluid Bed Dryer
Rotary Cone Vacuum Dryer
Previous System Present System
High Efficiency SiftersvPrevious system: Mechanical vibrant sifters having
disadvantage of frequent clogging of powder due to vibration levels are inadequate and high power consumptionvDouble deck sifter: innovative technology with counter
weights to adjust vibration levels in both directions of horizontal & vertical. The above facility is benefited to set vibration levels as per product requirement.
v Benefits: Reduction of batch time up to 65%v Powder emission losses reducedv Power consumption reduced up to 75%
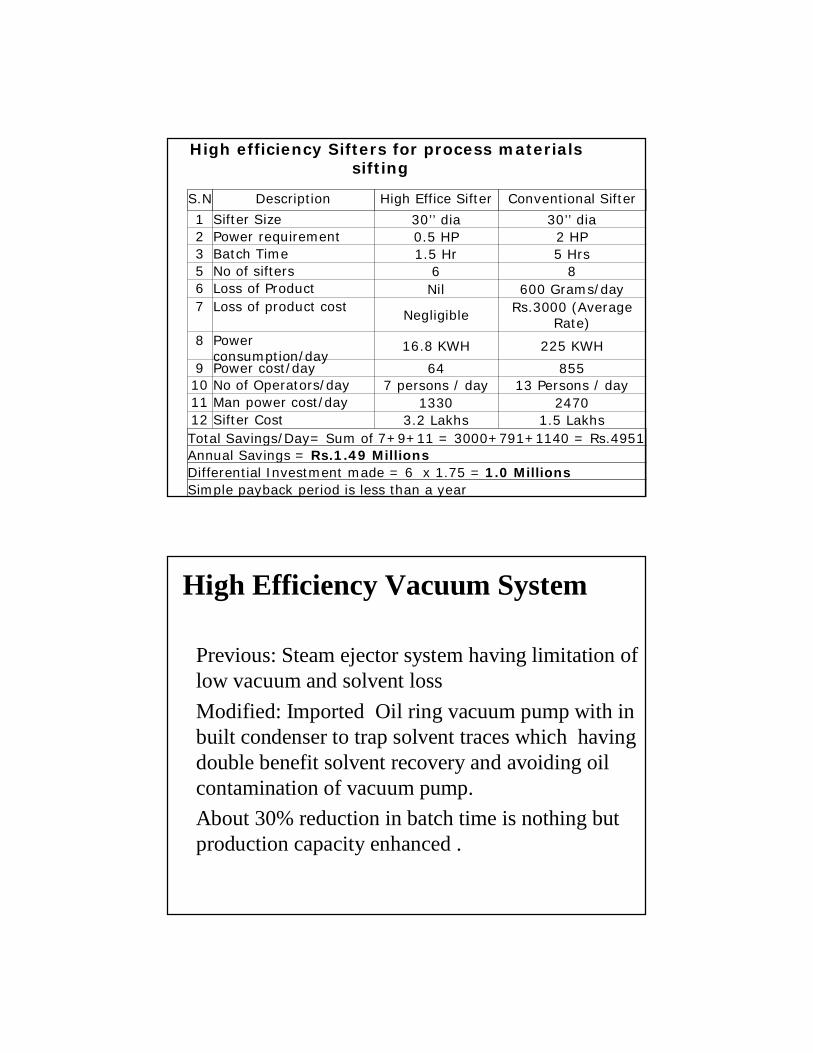
High efficiency Sifters for process materials sifting
S.N Description High Effice Sifter Conventional Sifter
1 Sifter Size 30’’ dia 30’’ dia2 Power requirement 0.5 HP 2 HP3 Batch Time 1.5 Hr 5 Hrs5 No of sifters 6 86 Loss of Product Nil 600 Grams/day7 Loss of product cost
Negligible Rs.3000 (Average Rate)
8 Power consumption/day
16.8 KWH 225 KWH
9 Power cost/day 64 85510 No of Operators/day 7 persons / day 13 Persons / day11 Man power cost/day 1330 247012 Sifter Cost 3.2 Lakhs 1.5 LakhsTotal Savings/Day= Sum of 7+9+11 = 3000+791+1140 = Rs.4951 Annual Savings = Rs.1.49 MillionsDifferential Investment made = 6 x 1.75 = 1.0 MillionsSimple payback period is less than a year
High Efficiency Vacuum System
Previous: Steam ejector system having limitation of low vacuum and solvent lossModified: Imported Oil ring vacuum pump with in built condenser to trap solvent traces which having double benefit solvent recovery and avoiding oil contamination of vacuum pump.About 30% reduction in batch time is nothing but production capacity enhanced .
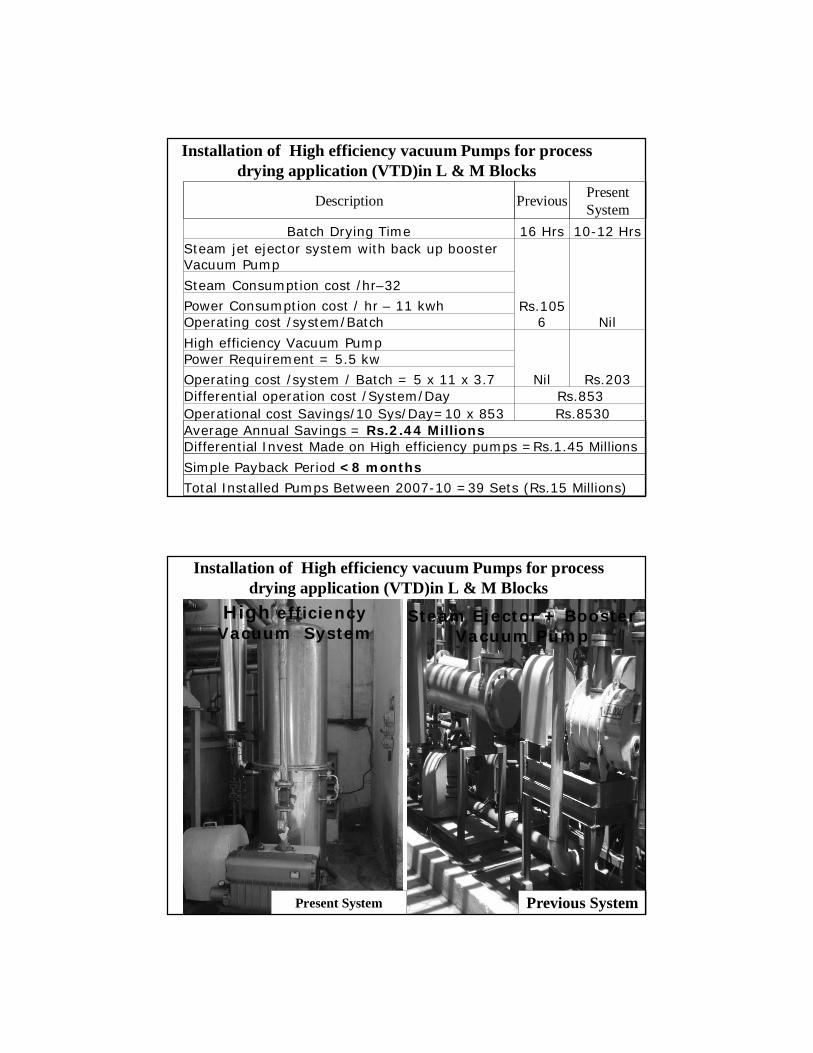
Installation of High efficiency vacuum Pumps for process drying application (VTD)in L & M Blocks
Description Previous Present System
Batch Drying Time 16 Hrs 10-12 HrsSteam jet ejector system with back up booster Vacuum Pump
Rs.1056 Nil
Steam Consumption cost /hr–32
Power Consumption cost / hr – 11 kwhOperating cost /system/Batch
High efficiency Vacuum Pump
Nil Rs.203
Power Requirement = 5.5 kw
Operating cost /system / Batch = 5 x 11 x 3.7 Differential operation cost /System/Day Rs.853Operational cost Savings/10 Sys/Day=10 x 853 Rs.8530Average Annual Savings = Rs.2.44 MillionsDifferential Invest Made on High efficiency pumps =Rs.1.45 Millions
Simple Payback Period <8 months
Total Installed Pumps Between 2007-10 =39 Sets (Rs.15 Millions)
Installation of High efficiency vacuum Pumps for process drying application (VTD)in L & M Blocks
High efficiency Vacuum System
Present System
Steam Ejector + Booster Vacuum Pump
Previous System
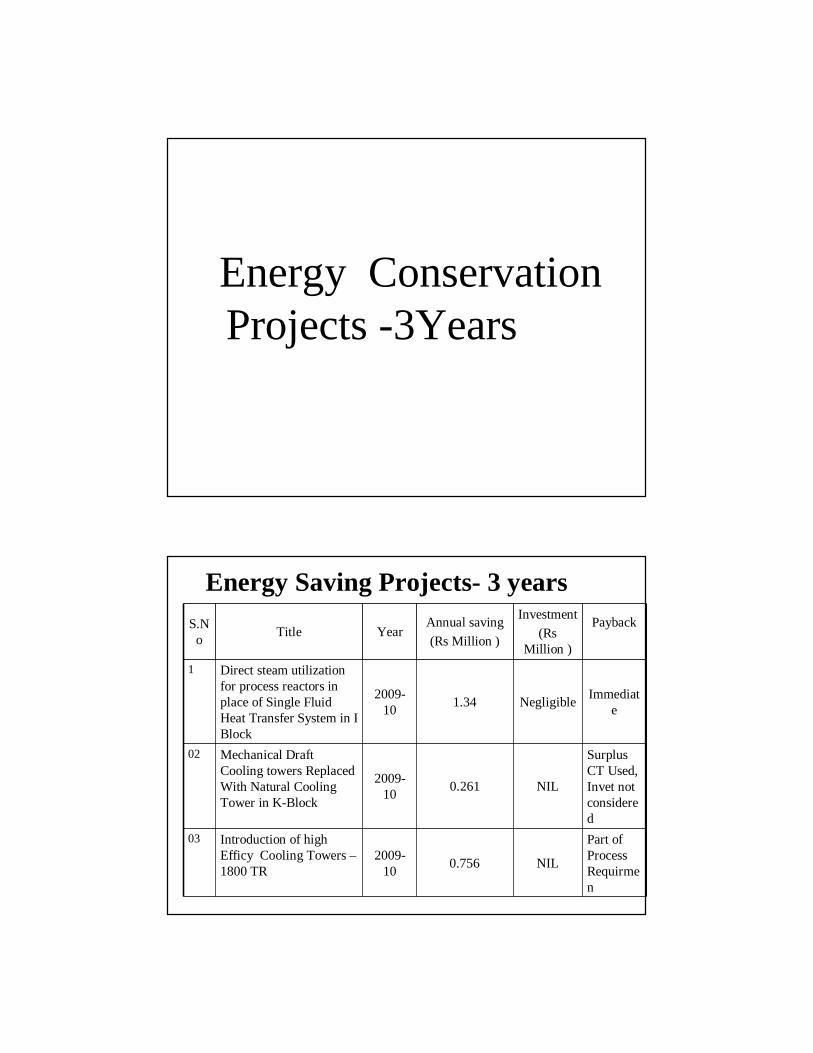
Energy Conservation Projects -3Years
Energy Saving Projects- 3 yearsS.N
o Title Year Annual saving (Rs Million )
Investment (Rs
Million )
Payback
1 Direct steam utilization for process reactors in place of Single Fluid Heat Transfer System in I Block
2009-10 1.34 Negligible Immediat
e
02 Mechanical Draft Cooling towers Replaced With Natural Cooling Tower in K-Block
2009-10 0.261 NIL
Surplus CT Used, Invet not considered
03 Introduction of high Efficy Cooling Towers –1800 TR
2009-10 0.756 NIL
Part of Process Requirmen
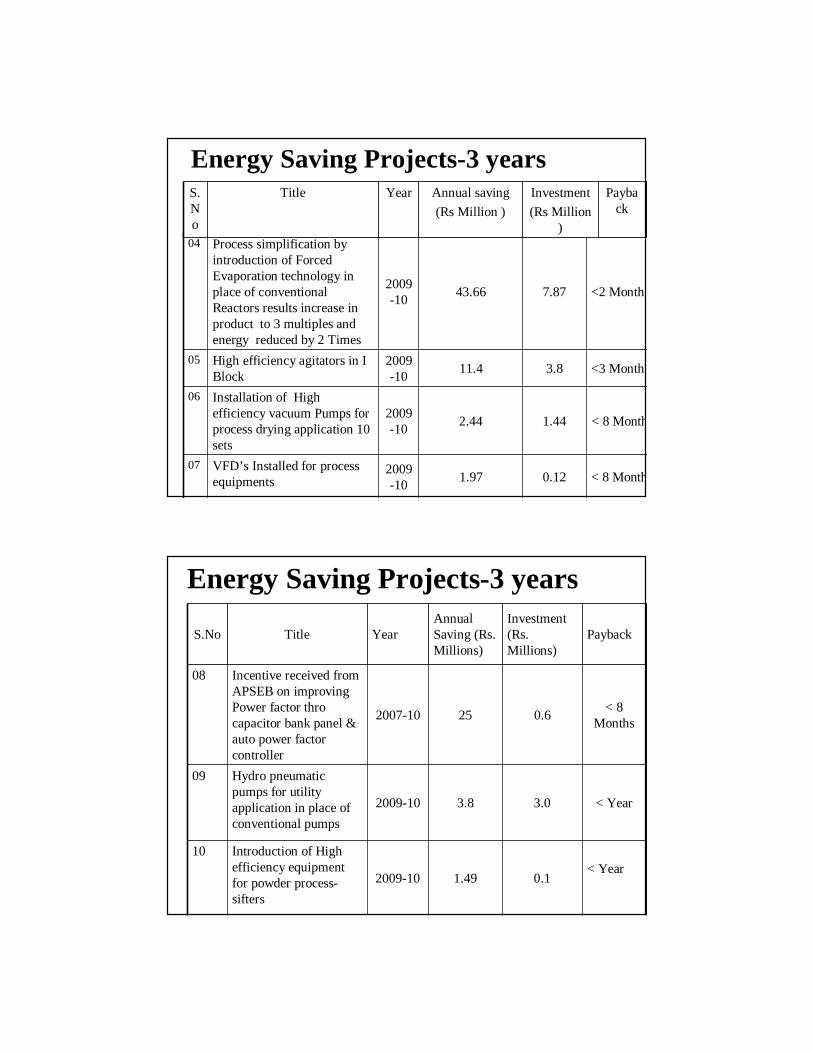
04 Process simplification by introduction of Forced Evaporation technology in place of conventional Reactors results increase in product to 3 multiples and energy reduced by 2 Times
2009-10 43.66 7.87 <2 Months
05 High efficiency agitators in I Block
2009-10 11.4 3.8 <3 Months
06 Installation of High efficiency vacuum Pumps for process drying application 10 sets
2009-10 2.44 1.44 < 8 Months
07 VFD’s Installed for process equipments
2009-10 1.97 0.12 < 8 Months
S.No
Title Year Annual saving (Rs Million )
Investment (Rs Million
)
Payback
Energy Saving Projects-3 years
Energy Saving Projects-3 years
S.No Title YearAnnual Saving (Rs. Millions)
Investment (Rs. Millions)
Payback
08 Incentive received from APSEB on improving Power factor thro capacitor bank panel & auto power factor controller
2007-10 25 0.6 < 8 Months
09 Hydro pneumatic pumps for utility application in place of conventional pumps
2009-10 3.8 3.0 < Year
10 Introduction of High efficiency equipment for powder process-sifters
2009-10 1.49 0.1< Year
Energy Saving Projects-3 years
S.No Title Year
Annual Saving
(Rs. Millions)
Investment (Rs.
Millions)Payback
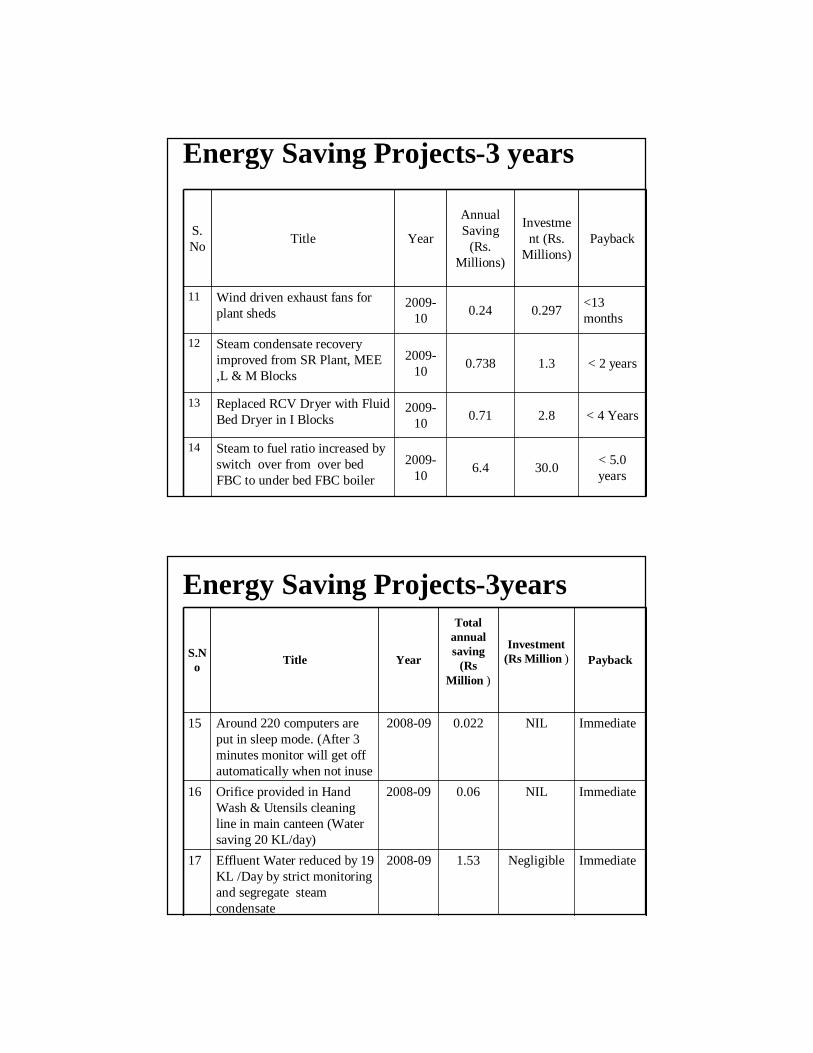
11 Wind driven exhaust fans for plant sheds
2009-10 0.24 0.297 <13
months
12 Steam condensate recovery improved from SR Plant, MEE ,L & M Blocks
2009-10 0.738 1.3 < 2 years
13 Replaced RCV Dryer with Fluid Bed Dryer in I Blocks
2009-10 0.71 2.8 < 4 Years
14 Steam to fuel ratio increased by switch over from over bed FBC to under bed FBC boiler
2009-10 6.4 30.0 < 5.0
years
Energy Saving Projects-3years
S.No Title Year
Total annual saving
(Rs Million )
Investment (Rs Million ) Payback
15 Around 220 computers are put in sleep mode. (After 3 minutes monitor will get off automatically when not inuse
2008-09 0.022 NIL Immediate
16 Orifice provided in Hand Wash & Utensils cleaning line in main canteen (Water saving 20 KL/day)
2008-09 0.06 NIL Immediate
17 Effluent Water reduced by 19 KL /Day by strict monitoring and segregate steam condensate
2008-09 1.53 Negligible Immediate
Energy Saving Projects-3years
S.No Title Year
Annual saving
(Rs Million )
Investment
(Rs Million )
Payback
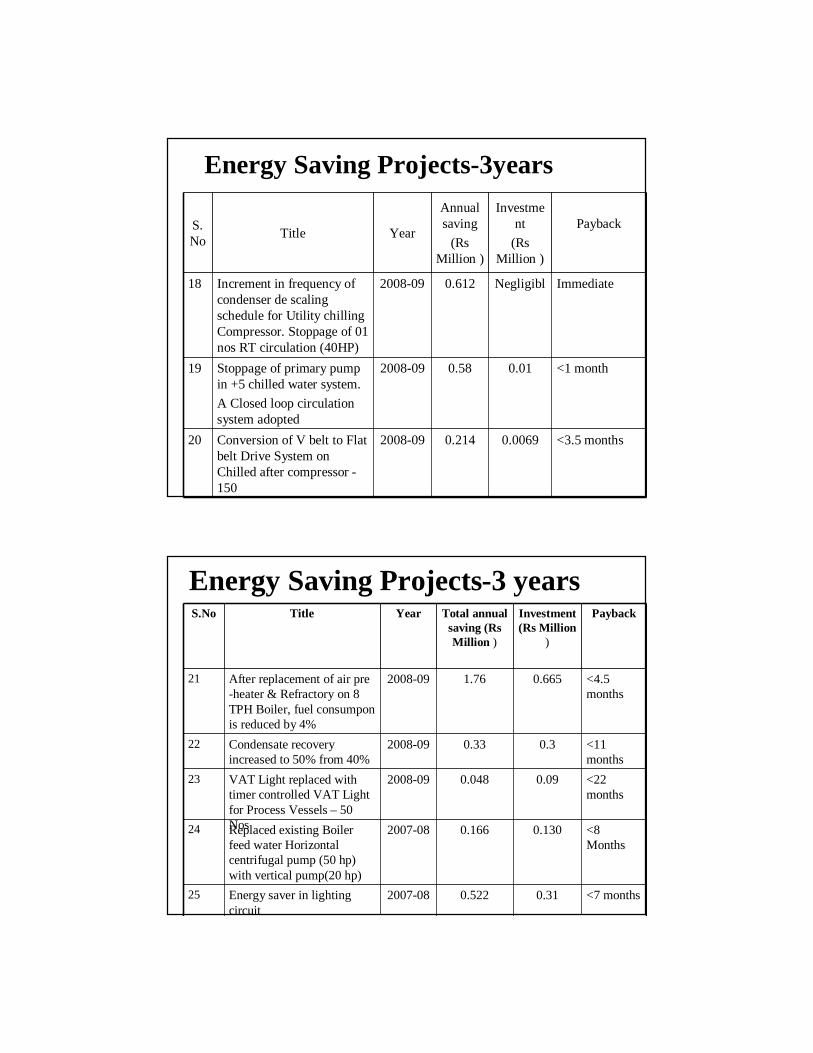
18 Increment in frequency of condenser de scaling schedule for Utility chilling Compressor. Stoppage of 01 nos RT circulation (40HP)
2008-09 0.612 Negligibl Immediate
19 Stoppage of primary pump in +5 chilled water system.A Closed loop circulation system adopted
2008-09 0.58 0.01 <1 month
20 Conversion of V belt to Flat belt Drive System on Chilled after compressor -150
2008-09 0.214 0.0069 <3.5 months
Energy Saving Projects-3 yearsS.No Title Year Total annual
saving (Rs Million )
Investment (Rs Million
)
Payback
21 After replacement of air pre -heater & Refractory on 8 TPH Boiler, fuel consumpon is reduced by 4%
2008-09 1.76 0.665 <4.5 months
22 Condensate recovery increased to 50% from 40%
2008-09 0.33 0.3 <11 months
23 VAT Light replaced with timer controlled VAT Light for Process Vessels – 50 Nos
2008-09 0.048 0.09 <22 months
24 Replaced existing Boiler feed water Horizontal centrifugal pump (50 hp) with vertical pump(20 hp)
2007-08 0.166 0.130 <8 Months
25 Energy saver in lighting circuit
2007-08 0.522 0.31 <7 months
Bench MarksS.no Description Standard Present Bench Mark
APL
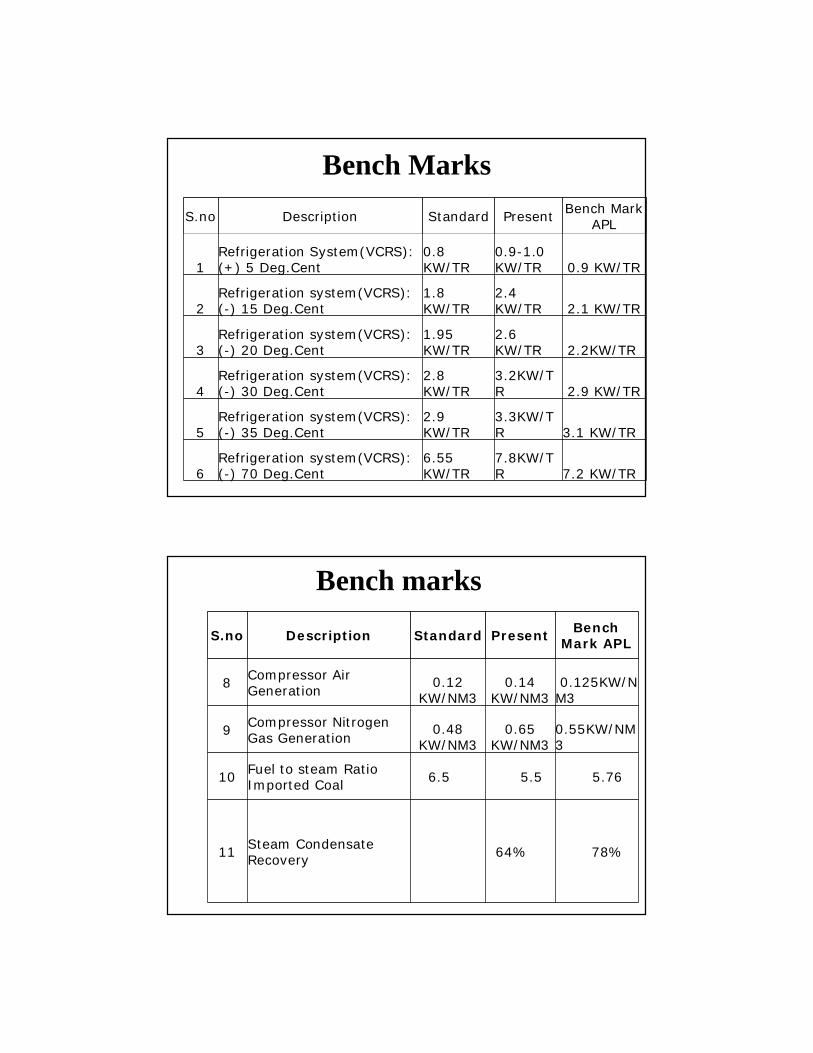
1Refrigeration System(VCRS):(+) 5 Deg.Cent
0.8 KW/TR
0.9-1.0 KW/TR 0.9 KW/TR
2Refrigeration system(VCRS):(-) 15 Deg.Cent
1.8 KW/TR
2.4 KW/TR 2.1 KW/TR
3Refrigeration system(VCRS):(-) 20 Deg.Cent
1.95 KW/TR
2.6 KW/TR 2.2KW/TR
4Refrigeration system(VCRS):(-) 30 Deg.Cent
2.8 KW/TR
3.2KW/TR 2.9 KW/TR
5Refrigeration system(VCRS):(-) 35 Deg.Cent
2.9 KW/TR
3.3KW/TR 3.1 KW/TR
6Refrigeration system(VCRS):(-) 70 Deg.Cent
6.55 KW/TR
7.8KW/TR 7.2 KW/TR
Bench marks
S.no Description Standard Present Bench Mark APL
8 Compressor Air Generation
0.12 KW/NM3
0.14 KW/NM3
0.125KW/NM3
9 Compressor Nitrogen Gas Generation
0.48 KW/NM3
0.65 KW/NM3
0.55KW/NM3
10 Fuel to steam Ratio Imported Coal 6.5 5.5 5.76
11 Steam Condensate Recovery 64% 78%
06 Aug 2010 Aurobindo Pharma Limited. 45
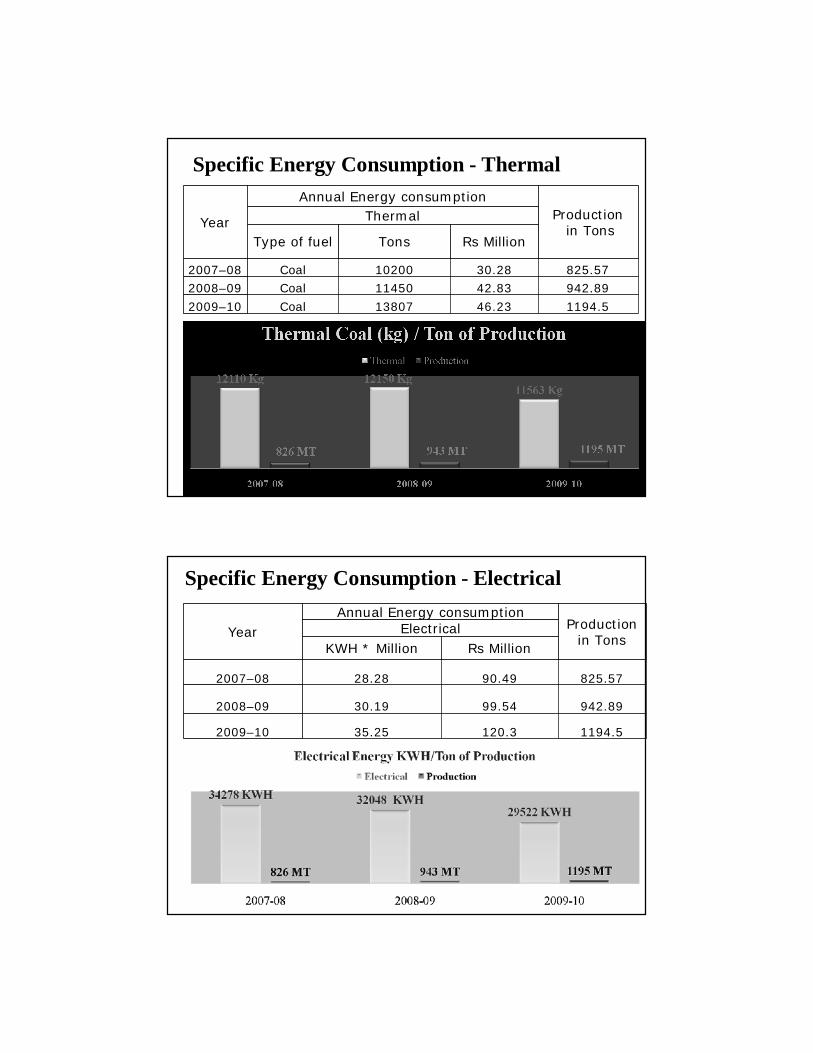
Year
Annual Energy consumptionProduction
in Tons Thermal
Type of fuel Tons Rs Million
2007–08 Coal 10200 30.28 825.572008–09 Coal 11450 42.83 942.89
2009–10 Coal 13807 46.23 1194.5
Specific Energy Consumption - Thermal
YearAnnual Energy consumption
Production in Tons
ElectricalKWH * Million Rs Million
2007–08 28.28 90.49 825.57
2008–09 30.19 99.54 942.89
2009–10 35.25 120.3 1194.5
Specific Energy Consumption - Electrical
Innovative Projects
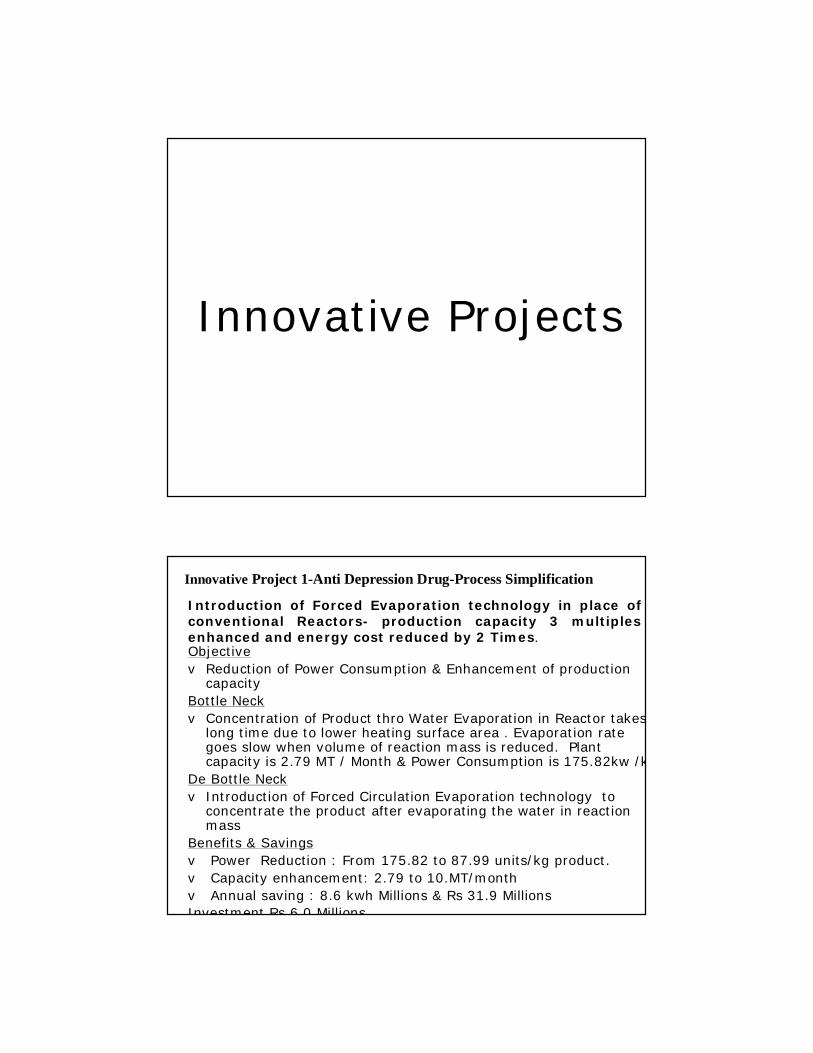
Introduction of Forced Evaporation technology in place of conventional Reactors- production capacity 3 multiples enhanced and energy cost reduced by 2 Times. Objective v Reduction of Power Consumption & Enhancement of production
capacityBottle Neck v Concentration of Product thro Water Evaporation in Reactor takes
long time due to lower heating surface area . Evaporation rate goes slow when volume of reaction mass is reduced. Plant capacity is 2.79 MT / Month & Power Consumption is 175.82kw /kg
De Bottle Neck v Introduction of Forced Circulation Evaporation technology to
concentrate the product after evaporating the water in reaction mass
Benefits & Savingsv Power Reduction : From 175.82 to 87.99 units/kg product.v Capacity enhancement: 2.79 to 10.MT/monthv Annual saving : 8.6 kwh Millions & Rs 31.9 Millions Investment Rs 6.0 Millions
Innovative Project 1-Anti Depression Drug-Process Simplification
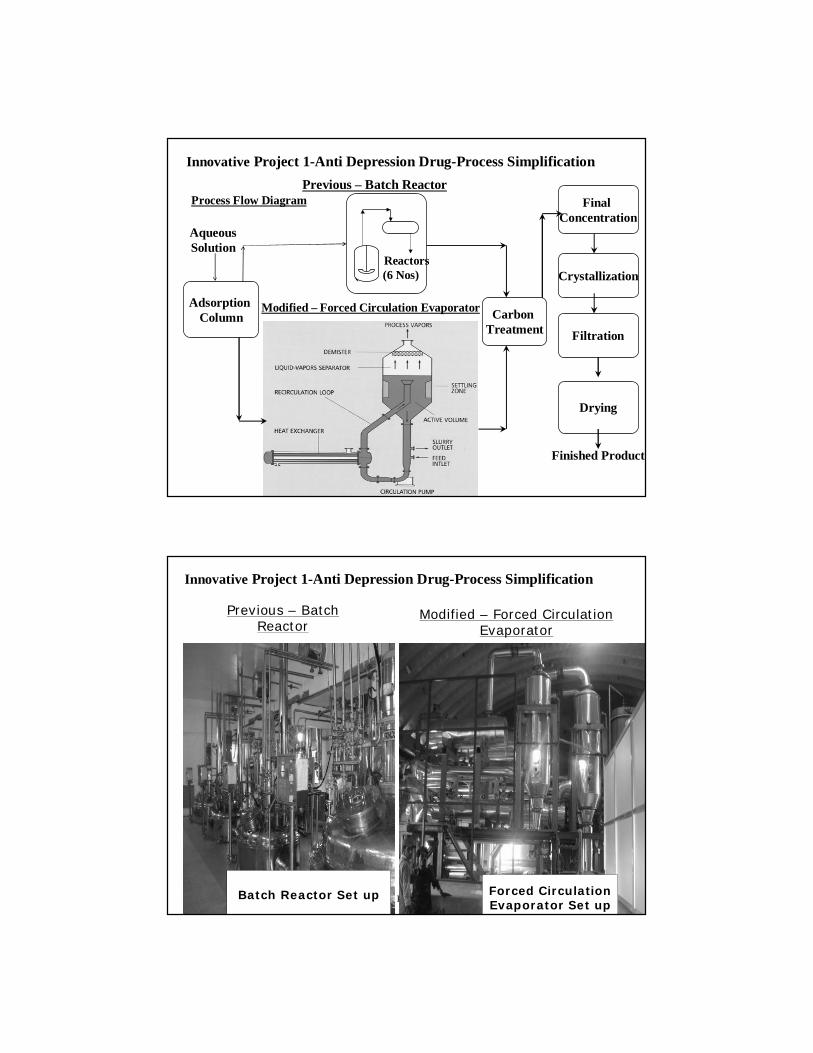
Reactors( (6 Nos)
Adsorption Column
Final Concentration
Crystallization
Filtration
Drying
Finished Product
Carbon Treatment
Previous – Batch Reactor
Aqueous Solution
Modified – Forced Circulation Evaporator
Process Flow Diagram
Innovative Project 1-Anti Depression Drug-Process Simplification
06 Aug 2010 Aurobindo Pharma Limited.50
INNOVATIVE
PROJECT - I
Modified – Forced Circulation Evaporator
Previous – Batch Reactor
Forced Circulation Evaporator Set up
Batch Reactor Set up
Innovative Project 1-Anti Depression Drug-Process Simplification
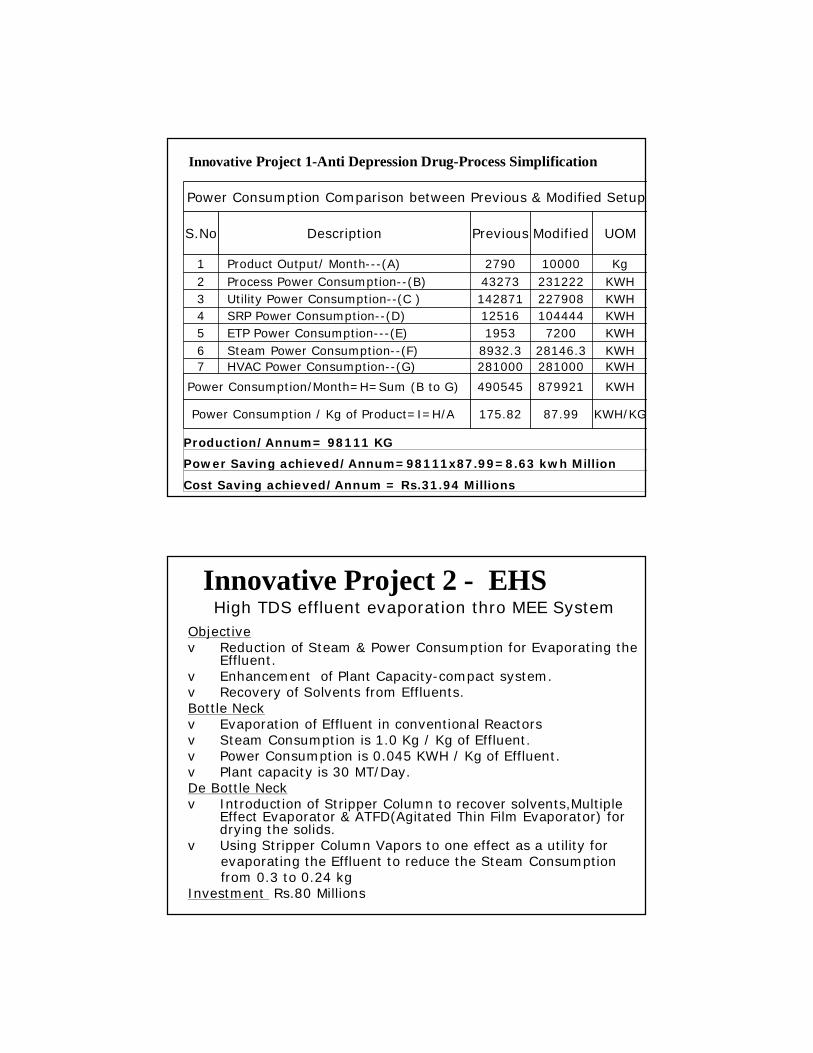
Power Consumption Comparison between Previous & Modified Setup
S.No Description Previous Modified UOM
1 Product Output/ Month---(A) 2790 10000 Kg2 Process Power Consumption--(B) 43273 231222 KWH3 Utility Power Consumption--(C ) 142871 227908 KWH4 SRP Power Consumption--(D) 12516 104444 KWH5 ETP Power Consumption---(E) 1953 7200 KWH6 Steam Power Consumption--(F) 8932.3 28146.3 KWH7 HVAC Power Consumption--(G) 281000 281000 KWH
Power Consumption/Month=H=Sum (B to G) 490545 879921 KWH
Power Consumption / Kg of Product=I=H/A 175.82 87.99 KWH/KG
Production/Annum= 98111 KG
Power Saving achieved/Annum=98111x87.99=8.63 kwh Million
Cost Saving achieved/Annum = Rs.31.94 Millions
Innovative Project 1-Anti Depression Drug-Process Simplification
Innovative Project 2 - EHS Objectivev Reduction of Steam & Power Consumption for Evaporating the
Effluent.v Enhancement of Plant Capacity-compact system.v Recovery of Solvents from Effluents. Bottle Neckv Evaporation of Effluent in conventional Reactors v Steam Consumption is 1.0 Kg / Kg of Effluent.v Power Consumption is 0.045 KWH / Kg of Effluent.v Plant capacity is 30 MT/Day.De Bottle Neckv Introduction of Stripper Column to recover solvents,Multiple
Effect Evaporator & ATFD(Agitated Thin Film Evaporator) for drying the solids.
v Using Stripper Column Vapors to one effect as a utility for evaporating the Effluent to reduce the Steam Consumption from 0.3 to 0.24 kg
Investment Rs.80 Millions
High TDS effluent evaporation thro MEE System
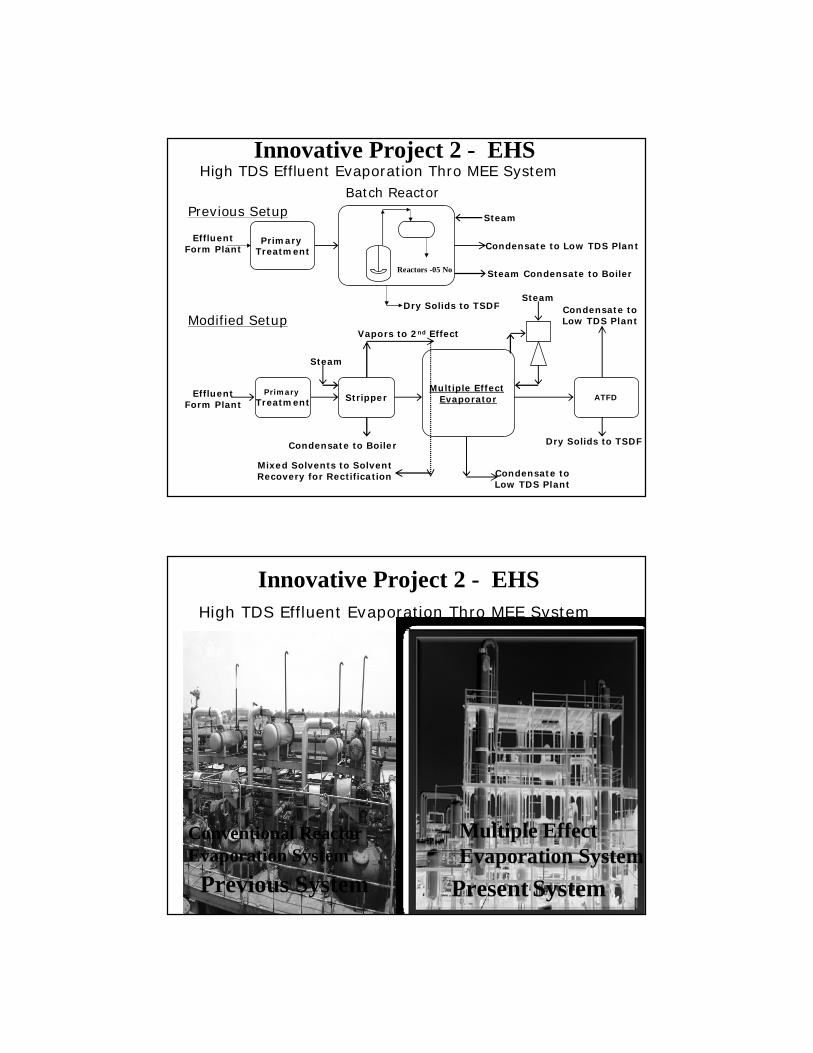
Reactors -05 No
Batch Reactor
Effluent Form Plant
Modified Setup
Primary Treatment
Effluent Form Plant
Primary Treatment
Multiple Effect EvaporatorStripper
Mixed Solvents to Solvent Recovery for Rectification
ATFD
Condensate to Low TDS Plant
Dry Solids to TSDFCondensate to Boiler
Steam
Steam
Previous Setup
Vapors to 2nd Effect
Condensate to Low TDS Plant
Dry Solids to TSDF
Condensate to Low TDS Plant
Steam
Steam Condensate to Boiler
High TDS Effluent Evaporation Thro MEE SystemInnovative Project 2 - EHS
Multiple Effect Evaporation System
High TDS Effluent Evaporation Thro MEE System
Conventional Reactor Evaporation System
Previous System Present System
Innovative Project 2 - EHS
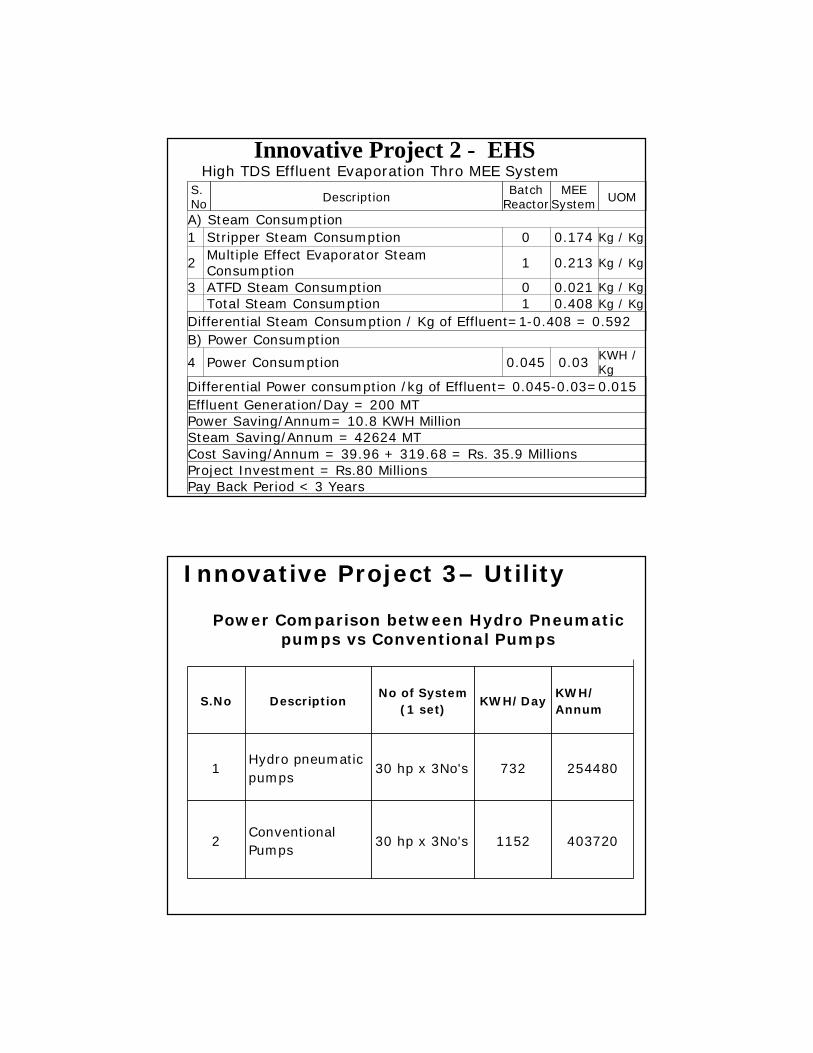
S.No Description
Batch Reactor
MEE System UOM
A) Steam Consumption 1 Stripper Steam Consumption 0 0.174 Kg / Kg
2 Multiple Effect Evaporator Steam Consumption 1 0.213 Kg / Kg
3 ATFD Steam Consumption 0 0.021 Kg / Kg Total Steam Consumption 1 0.408 Kg / Kg
Differential Steam Consumption / Kg of Effluent=1-0.408 = 0.592B) Power Consumption
4 Power Consumption 0.045 0.03 KWH / Kg
Differential Power consumption /kg of Effluent= 0.045-0.03=0.015Effluent Generation/Day = 200 MT Power Saving/Annum= 10.8 KWH Million Steam Saving/Annum = 42624 MTCost Saving/Annum = 39.96 + 319.68 = Rs. 35.9 MillionsProject Investment = Rs.80 Millions Pay Back Period < 3 Years
High TDS Effluent Evaporation Thro MEE SystemInnovative Project 2 - EHS
Innovative Project 3– Utility
S.No DescriptionNo of System
(1 set)KWH/Day
KWH/ Annum
1Hydro pneumatic pumps
30 hp x 3No's 732 254480
2Conventional Pumps
30 hp x 3No's 1152 403720
Power Comparison between Hydro Pneumatic pumps vs Conventional Pumps
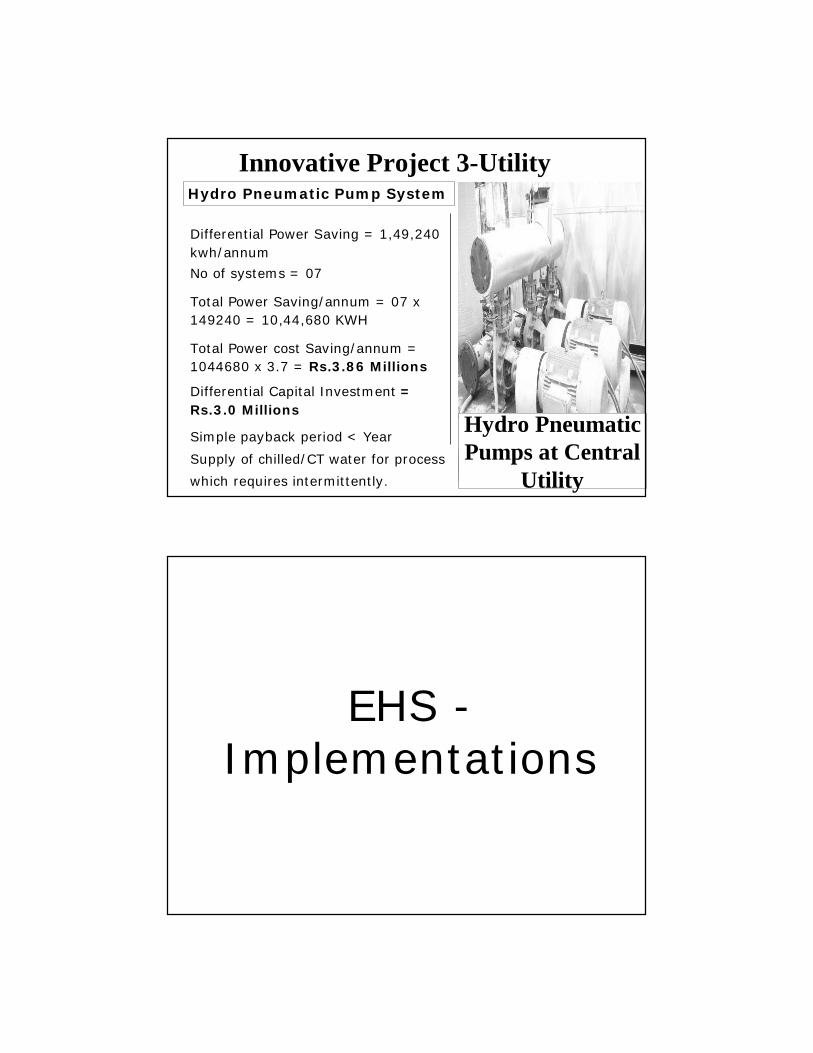
Innovative Project 3-Utility
Differential Power Saving = 1,49,240 kwh/annum
No of systems = 07
Total Power Saving/annum = 07 x 149240 = 10,44,680 KWH
Total Power cost Saving/annum = 1044680 x 3.7 = Rs.3.86 Millions
Differential Capital Investment = Rs.3.0 Millions
Simple payback period < Year
Supply of chilled/CT water for process
which requires intermittently.
Hydro Pneumatic Pump System
Hydro Pneumatic Pumps at Central
Utility
EHS -Implementations
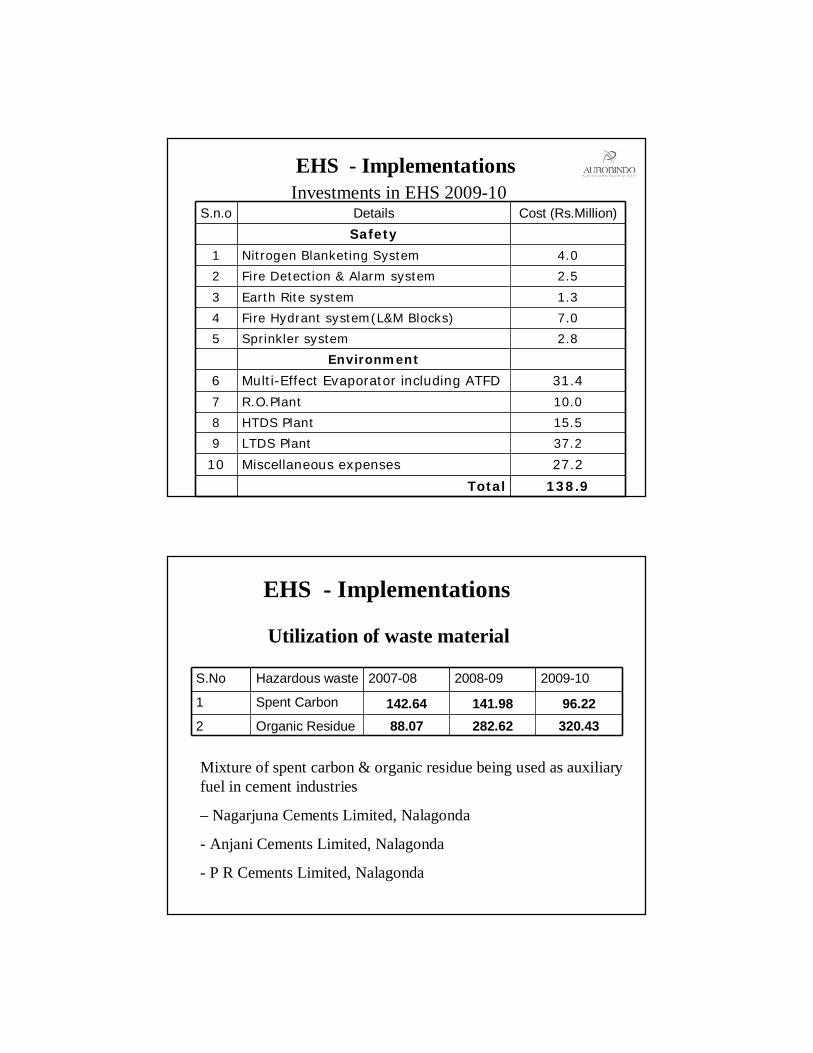
Investments in EHS 2009-10S.n.o Details Cost (Rs.Million)
Safety
1 Nitrogen Blanketing System 4.0
2 Fire Detection & Alarm system 2.5
3 Earth Rite system 1.3
4 Fire Hydrant system(L&M Blocks) 7.0
5 Sprinkler system 2.8
Environment
6 Multi-Effect Evaporator including ATFD 31.4
7 R.O.Plant 10.0
8 HTDS Plant 15.5
9 LTDS Plant 37.2
10 Miscellaneous expenses 27.2
Total 138.9
EHS - Implementations
Utilization of waste material
S.No Hazardous waste 2007-08 2008-09 2009-10
1 Spent Carbon 142.64 141.98 96.222 Organic Residue 88.07 282.62 320.43
Mixture of spent carbon & organic residue being used as auxiliary fuel in cement industries
– Nagarjuna Cements Limited, Nalagonda
- Anjani Cements Limited, Nalagonda
- P R Cements Limited, Nalagonda
EHS - Implementations
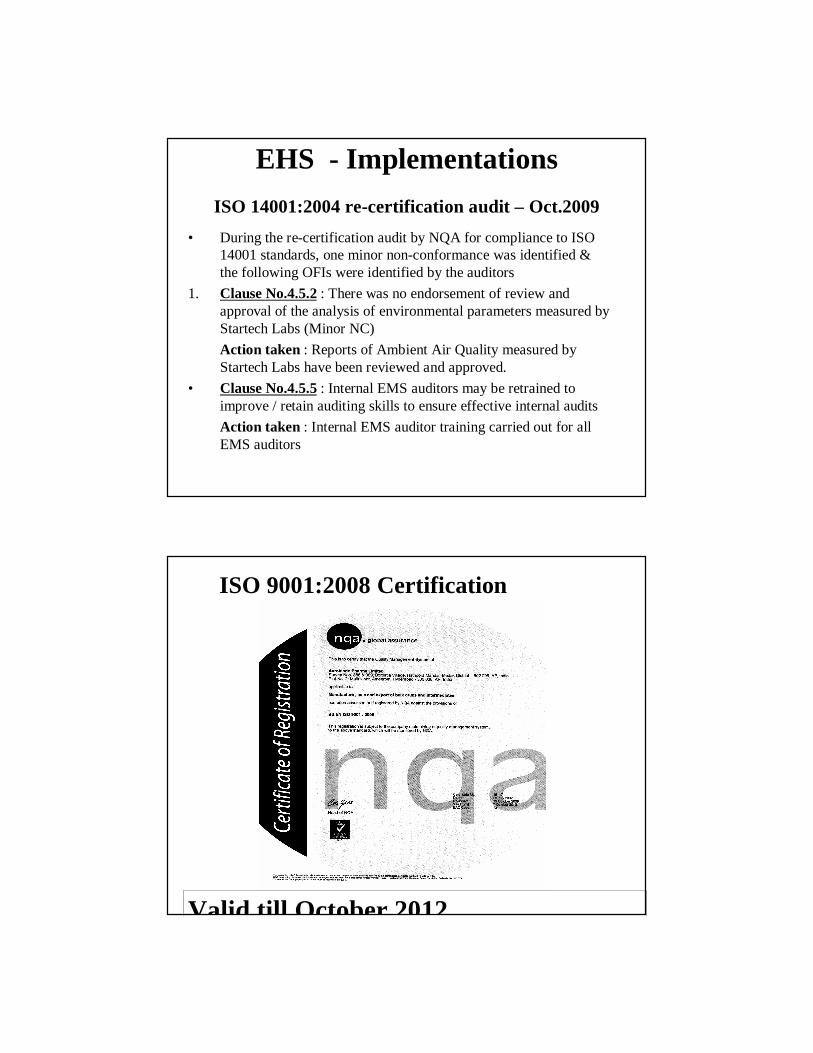
ISO 14001:2004 re-certification audit – Oct.2009• During the re-certification audit by NQA for compliance to ISO
14001 standards, one minor non-conformance was identified & the following OFIs were identified by the auditors
1. Clause No.4.5.2 : There was no endorsement of review and approval of the analysis of environmental parameters measured byStartech Labs (Minor NC)Action taken : Reports of Ambient Air Quality measured by Startech Labs have been reviewed and approved.
• Clause No.4.5.5 : Internal EMS auditors may be retrained to improve / retain auditing skills to ensure effective internal auditsAction taken : Internal EMS auditor training carried out for all EMS auditors
EHS - Implementations
ISO 9001:2008 Certification
Valid till October 2012
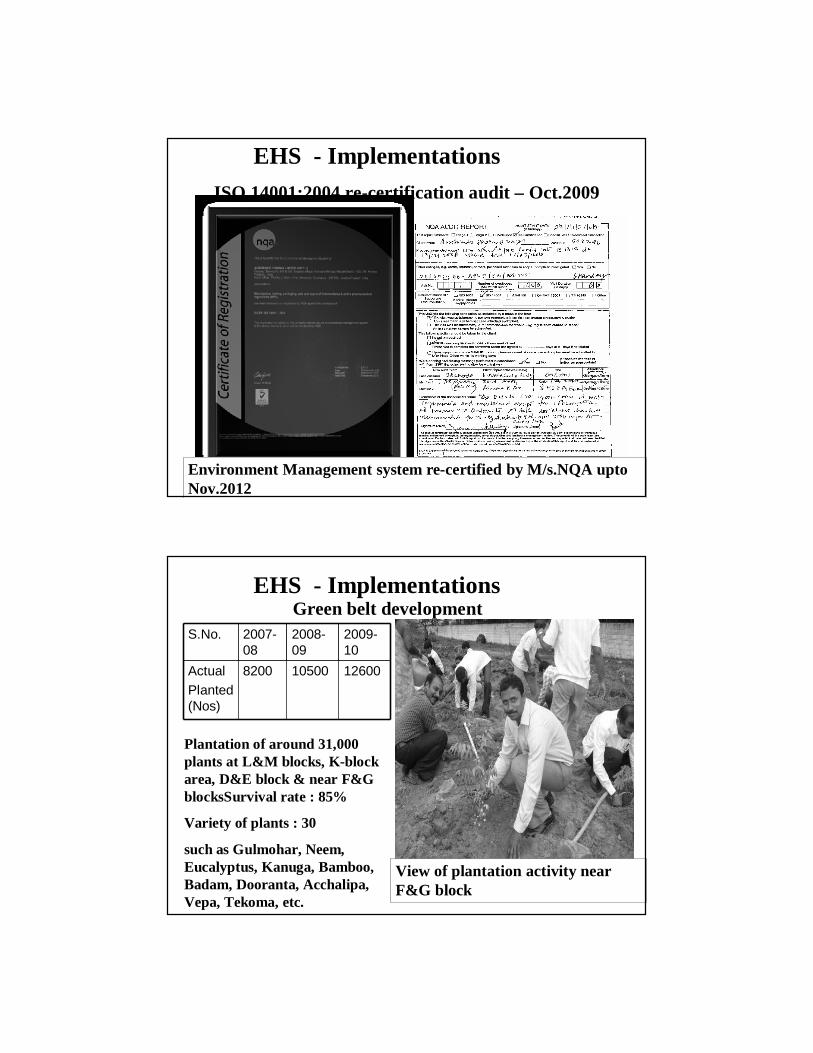
ISO 14001:2004 re-certification audit – Oct.2009
Environment Management system re-certified by M/s.NQA upto Nov.2012
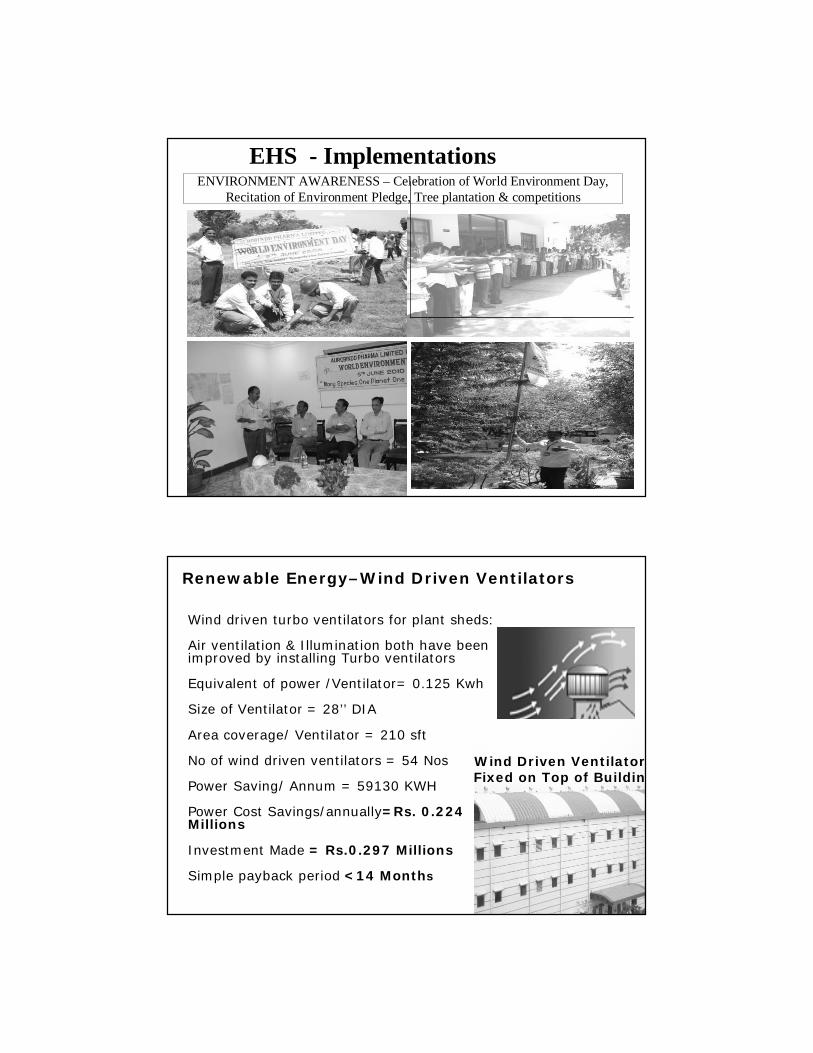
EHS - Implementations
Green belt developmentS.No. 2007-
082008-09
2009-10
Actual Planted (Nos)
8200 10500 12600
Plantation of around 31,000 plants at L&M blocks, K-block area, D&E block & near F&G blocksSurvival rate : 85%
Variety of plants : 30
such as Gulmohar, Neem, Eucalyptus, Kanuga, Bamboo, Badam, Dooranta, Acchalipa, Vepa, Tekoma, etc.
View of plantation activity near F&G block
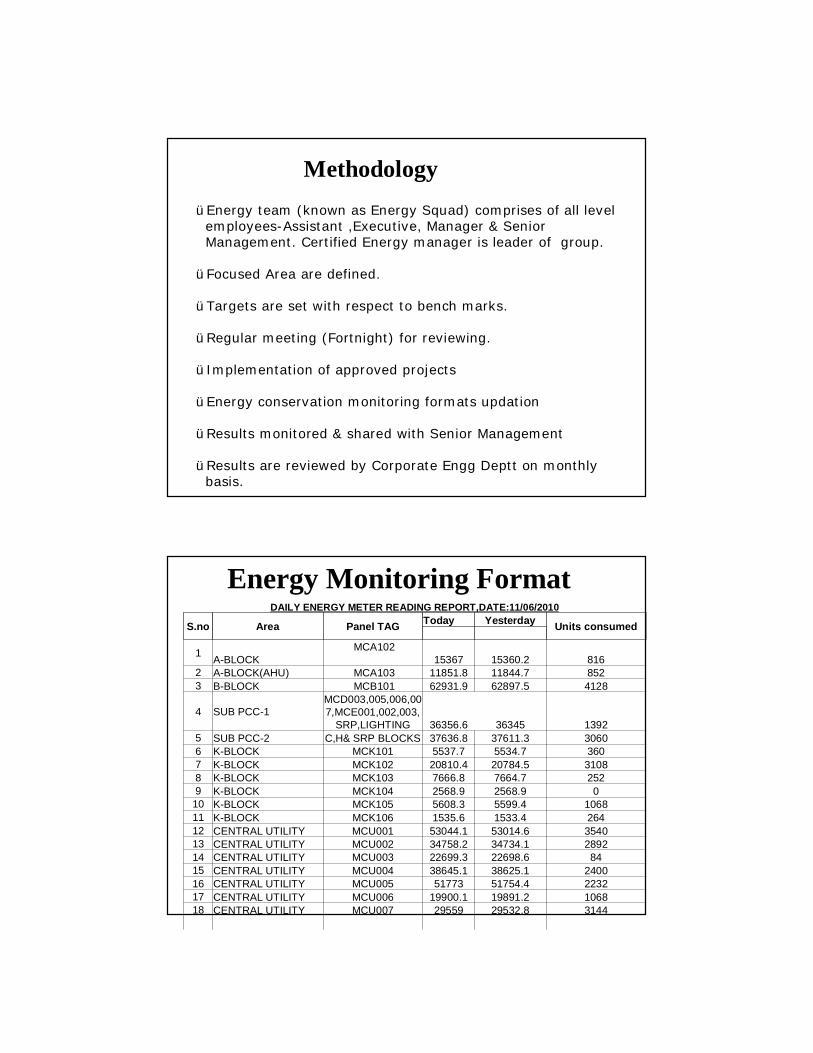
EHS - Implementations
ENVIRONMENT AWARENESS – Celebration of World Environment Day, Recitation of Environment Pledge, Tree plantation & competitions
EHS - Implementations
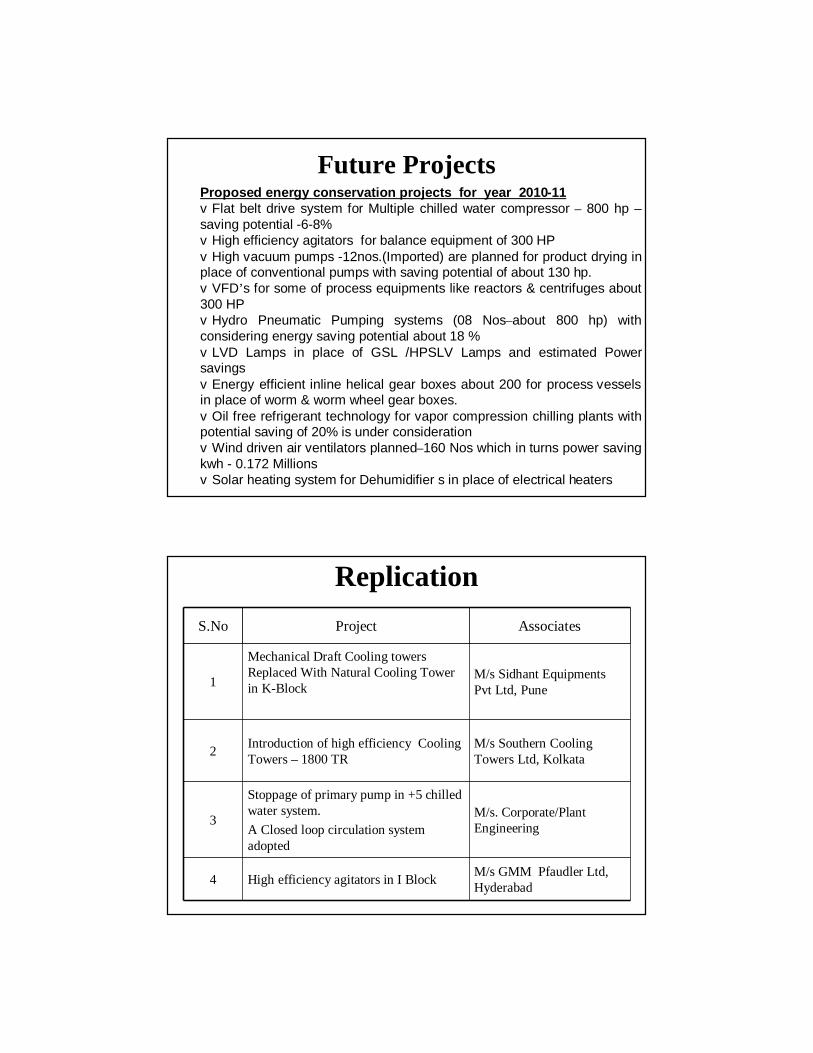
Renewable Energy–Wind Driven Ventilators
Wind driven turbo ventilators for plant sheds:
Air ventilation & Illumination both have been improved by installing Turbo ventilators
Equivalent of power /Ventilator= 0.125 Kwh
Size of Ventilator = 28’’ DIA
Area coverage/ Ventilator = 210 sft
No of wind driven ventilators = 54 Nos
Power Saving/ Annum = 59130 KWH
Power Cost Savings/annually=Rs. 0.224 Millions
Investment Made = Rs.0.297 Millions
Simple payback period <14 Months
Wind Driven Ventilators Fixed on Top of Building
MethodologyüEnergy team (known as Energy Squad) comprises of all level
employees-Assistant ,Executive, Manager & Senior Management. Certified Energy manager is leader of group.
üFocused Area are defined.
üTargets are set with respect to bench marks.
üRegular meeting (Fortnight) for reviewing.
üImplementation of approved projects
üEnergy conservation monitoring formats updation
üResults monitored & shared with Senior Management
üResults are reviewed by Corporate Engg Deptt on monthly basis.
Energy Monitoring FormatDAILY ENERGY METER READING REPORT,DATE:11/06/2010
S.no Area Panel TAG Today Yesterday Units consumed
1 A-BLOCKMCA102
15367 15360.2 8162 A-BLOCK(AHU) MCA103 11851.8 11844.7 8523 B-BLOCK MCB101 62931.9 62897.5 4128
4 SUB PCC-1MCD003,005,006,007,MCE001,002,003,
SRP,LIGHTING 36356.6 36345 13925 SUB PCC-2 C,H& SRP BLOCKS 37636.8 37611.3 30606 K-BLOCK MCK101 5537.7 5534.7 3607 K-BLOCK MCK102 20810.4 20784.5 31088 K-BLOCK MCK103 7666.8 7664.7 2529 K-BLOCK MCK104 2568.9 2568.9 010 K-BLOCK MCK105 5608.3 5599.4 106811 K-BLOCK MCK106 1535.6 1533.4 26412 CENTRAL UTILITY MCU001 53044.1 53014.6 354013 CENTRAL UTILITY MCU002 34758.2 34734.1 289214 CENTRAL UTILITY MCU003 22699.3 22698.6 8415 CENTRAL UTILITY MCU004 38645.1 38625.1 240016 CENTRAL UTILITY MCU005 51773 51754.4 223217 CENTRAL UTILITY MCU006 19900.1 19891.2 106818 CENTRAL UTILITY MCU007 29559 29532.8 3144
Future ProjectsProposed energy conservation projects for year 2010-11vFlat belt drive system for Multiple chilled water compressor – 800 hp –saving potential -6-8%vHigh efficiency agitators for balance equipment of 300 HPvHigh vacuum pumps -12nos.(Imported) are planned for product drying in place of conventional pumps with saving potential of about 130 hp.vVFD’s for some of process equipments like reactors & centrifuges about 300 HPvHydro Pneumatic Pumping systems (08 Nos–about 800 hp) with considering energy saving potential about 18 %vLVD Lamps in place of GSL /HPSLV Lamps and estimated Power savingsvEnergy efficient inline helical gear boxes about 200 for process vessels in place of worm & worm wheel gear boxes.vOil free refrigerant technology for vapor compression chilling plants with potential saving of 20% is under considerationvWind driven air ventilators planned–160 Nos which in turns power saving kwh - 0.172 Millions vSolar heating system for Dehumidifier s in place of electrical heaters
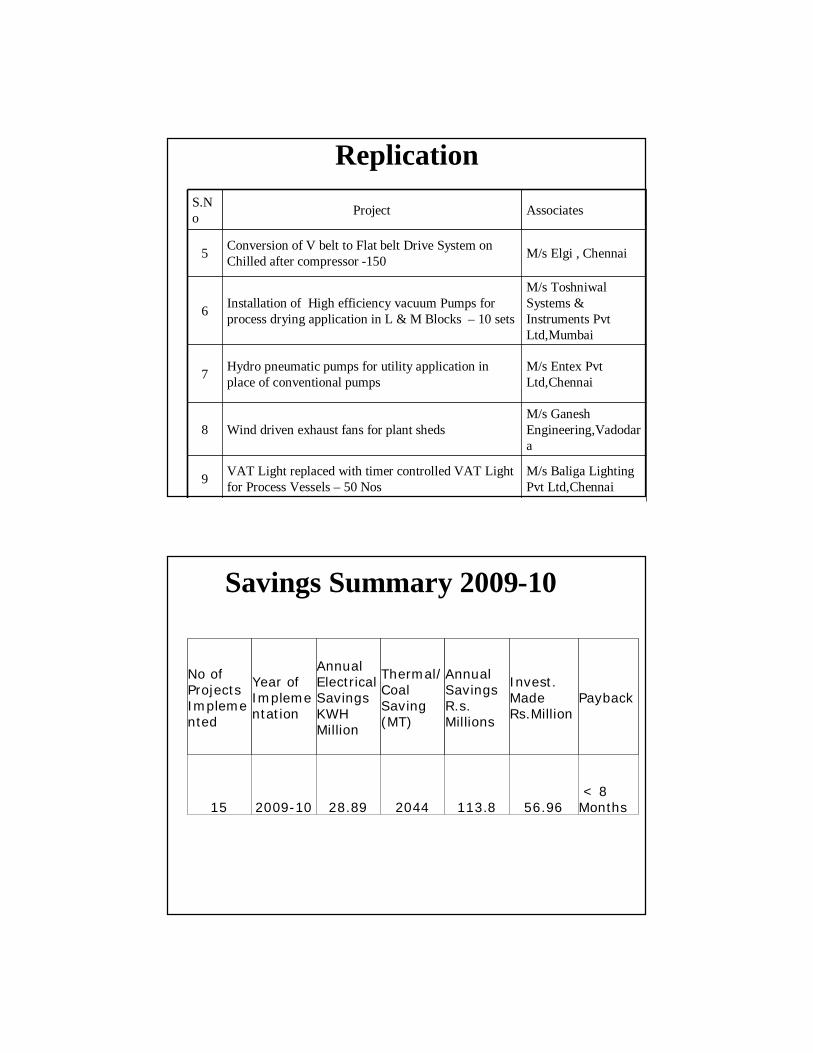
ReplicationS.No Project Associates
1
Mechanical Draft Cooling towers Replaced With Natural Cooling Tower in K-Block
M/s Sidhant Equipments Pvt Ltd, Pune
2 Introduction of high efficiency Cooling Towers – 1800 TR
M/s Southern Cooling Towers Ltd, Kolkata
3
Stoppage of primary pump in +5 chilled water system.A Closed loop circulation system adopted
M/s. Corporate/Plant Engineering
4 High efficiency agitators in I Block M/s GMM Pfaudler Ltd, Hyderabad
ReplicationS.No Project Associates
5 Conversion of V belt to Flat belt Drive System on Chilled after compressor -150 M/s Elgi , Chennai
6 Installation of High efficiency vacuum Pumps for process drying application in L & M Blocks – 10 sets
M/s Toshniwal Systems & Instruments Pvt Ltd,Mumbai
7 Hydro pneumatic pumps for utility application in place of conventional pumps
M/s Entex Pvt Ltd,Chennai
8 Wind driven exhaust fans for plant sheds M/s Ganesh Engineering,Vadodara
9 VAT Light replaced with timer controlled VAT Light for Process Vessels – 50 Nos
M/s Baliga Lighting Pvt Ltd,Chennai
Savings Summary 2009-10
No of Projects Implemented
Year of Implementation
Annual Electrical Savings KWH Million
Thermal/ Coal Saving (MT)
Annual Savings R.s. Millions
Invest. Made Rs.Million
Payback
15 2009-10 28.89 2044 113.8 56.96< 8
Months

Thank You