Embed Size (px)
Citation preview

August 10, 2017
ICICI Securities Ltd | Retail Equity Research
Result Update
Europe, US launches support numbers…
Revenues remained flat YoY at | 3679 crore (I-direct estimate: | 3671
crore) driven by 10% growth in the Europe to | 918 crore (I-direct
estimate: | 839 crore). US growth was flat at | 1695 crore (I-direct
estimate: | 1661 crore) despite strong headwinds. ARV business
declined 19% to | 245 crore (I-direct estimate: | 318 crore) whereas
APIs declined 15% to | 625 crore
EBITDA margins declined 72 bps YoY to 22.9% (I-direct estimate:
20.9%) due to higher employee and other expenditure
Adjusted net profit (ex forex gain/loss) declined 8% YoY to | 537
crore (I-direct estimates: | 466 crore)
US key growth driver despite imminent pricing pressure
After filing ANDA in the US in 2003, the company has come a long way as
current ANDA filings are at 429. The US revenue run rate has grown from
~US$100 million in 2009 to crossing $1 billion sales as on 2017. Note that
this was despite the USFDA embargo in FY12-13 on unit VI and unit III. In
rupee term, US sales have grown at 42% CAGR to | 6827 crore in FY12-
17. US formulations now constitute 46% of total turnover, up from 26% in
FY12. US traction has also boosted investor’s confidence, which was
impacted by warning letters, piling up debts besides non-business
political adversaries. We expect US sales to grow at 6% CAGR on a
higher base to | 7631 crore in FY17-19E.
Transformation, capacity optimisation to improve margins, cash flows
The API: formulations ratio has improved from 43:57 in FY12 to 21:79 in
FY17. Another USP of the company is its vertically integrated model with
huge capacity, unmatched by most peers. The company owns 22
manufacturing facilities, including eight key formulations facilities in India
and abroad. These can be optimised by 1) continuous US filings and
launches, 2) incremental launches and filings in the RoW markets and 3)
site transfers and supplies for products covered under the Actavis deal.
Higher capacity utilisation is likely to improve operating leverage thereby
maintaining the margin improvement trend.
Debt no more fear factor
The company’s debts kept on piling up over the last few years as the
capacity built up was in full flow and rupee depreciation. Working capital
loans are now 85% of overall debts from 65-70% earlier. However, with
consistent and incremental US cash flows the situation improved
markedly. While D/E ratio improved from 1.9x to 0.3x, the debt/EBITDA
improved from 4.5x to 0.9x in FY09-17. As the capex cycle moderates by
FY18, the company expects to utilise maximum FCF for debt repayment.
Launches continuum in US to mitigate pricing pressure
Unlike other peers, the Aurobindo management has asserted confidence
on the US near term prospect despite strong pricing headwinds. This is
on the back of lower product concentration as top 25 products are now
contributing 35% of the US portfolio against 45% in Q1FY17. Moreover,
we expect the percentage of injectables, which are relatively insulated
from pricing pressure, in the US portfolio, to grow from 14% in FY17 to
20-25% by FY19. We believe launches continuum, especially in the
injectable space, can effectively neutralise channel consolidation and
pricing pressure headwinds. Other important segment i.e. Europe is likely
to fetch better margins on the back of product transfers to India and a
focused approach. We have ascribed a target price of | 745, based on 18x
FY19E EPS of | 41.4.
Rating matrix
Rating : Hold
Target : | 745
Target Period : 15-18 months
Potential Upside : 9%
What’s Changed?
Target Changed from | 755 to | 745
EPS FY18E Changed from | 37 to | 46.5
EPS FY19E Changed from | 41.8 to | 41.4
Rating Changed from Buy to Hold
Quarterly Performance
Q1FY18 Q1FY17 YoY (%) Q4FY17 QoQ (%)
Revenue 3,678.8 3,766.6 -2.3 3,641.6 1.0
EBITDA 841.6 889.0 -5.3 721.2 16.7
EBITDA (%) 22.9 23.6 -72.4 19.8 307.2
Net Profit 518.5 585.0 -11.4 532.5 -2.6
Key Financials
(| Crore) FY16 FY17 FY18E FY19E
Revenues 13831.2 15089.9 16253.4 16990.2
EBITDA 3140.7 3434.3 4143.7 3737.9
Net Profit 1915.6 2301.6 2706.0 2411.3
Adjusted PAT 1981.6 2265.7 2724.8 2411.3
EPS (|) 32.8 39.4 46.5 41.4
Adjusted EPS (|) 33.9 38.8 46.8 41.4
Valuation summary
FY16 FY17 FY18E FY19E
PE (x) 20.9 17.4 14.7 16.5
Target PE (x) 22.7 18.9 16.0 18.0
EV to EBITDA (x) 14.0 12.4 10.1 11.1
Price to book (x) 5.5 4.3 3.4 2.8
RoNW (%) 27.2 24.2 22.9 17.1
RoCE (%) 23.1 24.4 25.5 19.6
Stock data
Particular
Market Capitalisation
Debt (FY16)
Cash (FY16)
EV
52 week H/L (|) 895/503
Equity capital
Face value | 1
| 58.6 crore
Amount
| 40148 crore
| 42998 crore
| 3364 crore
| 513 crore
Price performance (%)
1M 3M 6M 1Y
Aurobindo Pharma -3.9 10.5 0.6 -8.1
Sun Pharma -18.3 -28.3 -29.7 -43.6
Lupin -18.1 -25.3 -35.8 -39.1
Dr Reddy's -28.3 -24.9 -34.3 -34.8
Aurobindo Pharma (AURPHA) | 685
Research Analyst
Siddhant Khandekar
Mitesh Shah
Harshal Mehta
ICICI Securities Ltd | Retail Equity Research Page 2
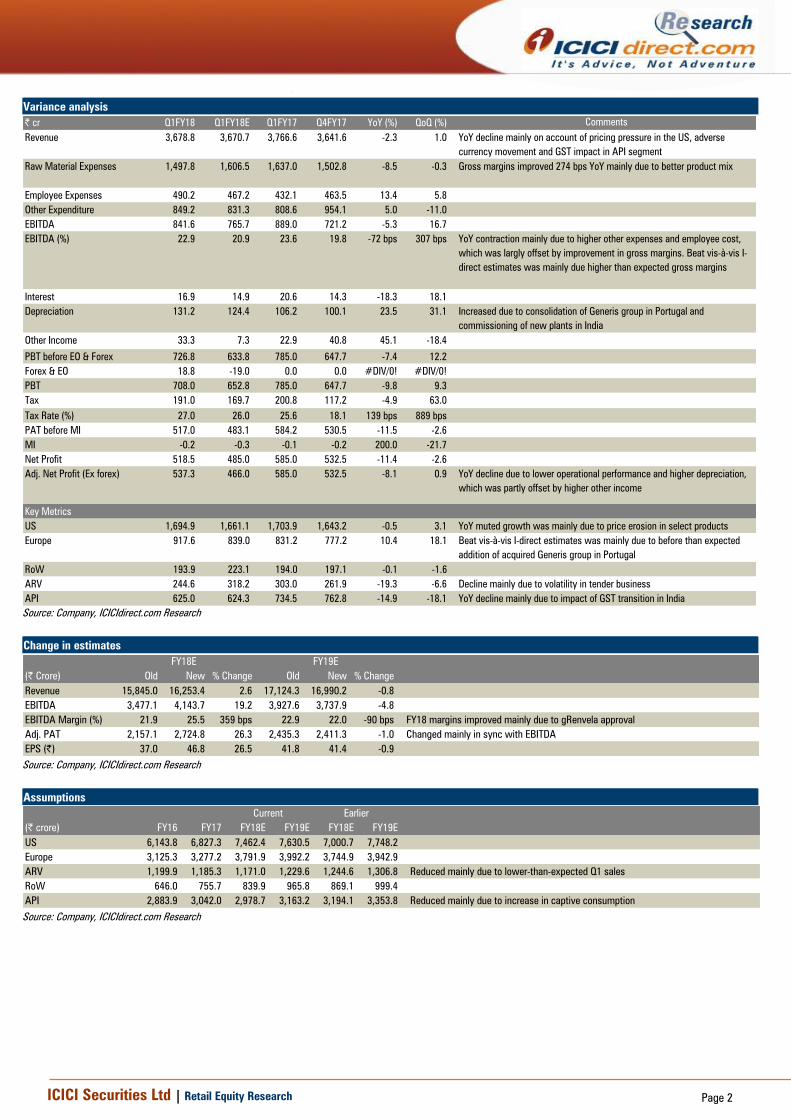
Variance analysis
| cr Q1FY18 Q1FY18E Q1FY17 Q4FY17 YoY (%) QoQ (%) Comments
Revenue 3,678.8 3,670.7 3,766.6 3,641.6 -2.3 1.0 YoY decline mainly on account of pricing pressure in the US, adverse
currency movement and GST impact in API segment
Raw Material Expenses 1,497.8 1,606.5 1,637.0 1,502.8 -8.5 -0.3 Gross margins improved 274 bps YoY mainly due to better product mix
Employee Expenses 490.2 467.2 432.1 463.5 13.4 5.8
Other Expenditure 849.2 831.3 808.6 954.1 5.0 -11.0
EBITDA 841.6 765.7 889.0 721.2 -5.3 16.7
EBITDA (%) 22.9 20.9 23.6 19.8 -72 bps 307 bps YoY contraction mainly due to higher other expenses and employee cost,
which was largly offset by improvement in gross margins. Beat vis-à-vis I-
direct estimates was mainly due higher than expected gross margins
Interest 16.9 14.9 20.6 14.3 -18.3 18.1
Depreciation 131.2 124.4 106.2 100.1 23.5 31.1 Increased due to consolidation of Generis group in Portugal and
commissioning of new plants in India
Other Income 33.3 7.3 22.9 40.8 45.1 -18.4
PBT before EO & Forex 726.8 633.8 785.0 647.7 -7.4 12.2
Forex & EO 18.8 -19.0 0.0 0.0 #DIV/0! #DIV/0!
PBT 708.0 652.8 785.0 647.7 -9.8 9.3
Tax 191.0 169.7 200.8 117.2 -4.9 63.0
Tax Rate (%) 27.0 26.0 25.6 18.1 139 bps 889 bps
PAT before MI 517.0 483.1 584.2 530.5 -11.5 -2.6
MI -0.2 -0.3 -0.1 -0.2 200.0 -21.7
Net Profit 518.5 485.0 585.0 532.5 -11.4 -2.6
Adj. Net Profit (Ex forex) 537.3 466.0 585.0 532.5 -8.1 0.9 YoY decline due to lower operational performance and higher depreciation,
which was partly offset by higher other income
Key Metrics
US 1,694.9 1,661.1 1,703.9 1,643.2 -0.5 3.1 YoY muted growth was mainly due to price erosion in select products
Europe 917.6 839.0 831.2 777.2 10.4 18.1 Beat vis-à-vis I-direct estimates was mainly due to before than expected
addition of acquired Generis group in Portugal
RoW 193.9 223.1 194.0 197.1 -0.1 -1.6
ARV 244.6 318.2 303.0 261.9 -19.3 -6.6 Decline mainly due to volatility in tender business
API 625.0 624.3 734.5 762.8 -14.9 -18.1 YoY decline mainly due to impact of GST transition in India
Source: Company, ICICIdirect.com Research
Change in estimates
(| Crore) Old New % Change Old New % Change
Revenue 15,845.0 16,253.4 2.6 17,124.3 16,990.2 -0.8
EBITDA 3,477.1 4,143.7 19.2 3,927.6 3,737.9 -4.8
EBITDA Margin (%) 21.9 25.5 359 bps 22.9 22.0 -90 bps FY18 margins improved mainly due to gRenvela approval
Adj. PAT 2,157.1 2,724.8 26.3 2,435.3 2,411.3 -1.0 Changed mainly in sync with EBITDA
EPS (|) 37.0 46.8 26.5 41.8 41.4 -0.9
FY18E FY19E
Source: Company, ICICIdirect.com Research
Assumptions
(| crore) FY16 FY17 FY18E FY19E FY18E FY19E
US 6,143.8 6,827.3 7,462.4 7,630.5 7,000.7 7,748.2
Europe 3,125.3 3,277.2 3,791.9 3,992.2 3,744.9 3,942.9
ARV 1,199.9 1,185.3 1,171.0 1,229.6 1,244.6 1,306.8 Reduced mainly due to lower-than-expected Q1 sales
RoW 646.0 755.7 839.9 965.8 869.1 999.4
API 2,883.9 3,042.0 2,978.7 3,163.2 3,194.1 3,353.8 Reduced mainly due to increase in captive consumption
Current Earlier
Source: Company, ICICIdirect.com Research

ICICI Securities Ltd | Retail Equity Research Page 3
Company Analysis
Aurobindo Pharma was set up by first generation entrepreneurs PV
Ramprasad Reddy and K Nithyananda Reddy in 1986. Based in
Hyderabad, the company is an integrated pharmaceutical company,
which started as an API manufacturer. In 2001, it moved up the value
chain by foraying into formulations while from 2007 onwards it started
scaling up the formulation business. APL's manufacturing facilities have
been approved by several leading regulatory agencies like USFDA,
UKMHRA, WHO, Health Canada, MCC South Africa and Anvisa Brazil. The
company owns 22 manufacturing facilities, including eight key
formulations facilities in India and abroad. The company owns three R&D
centres. The current employee strength is more than 8000, which
includes more than 750 scientists.
In FY17, the API: formulations ratio was at 21:79. US formulations
constitute 45% of revenues followed by APIs & RoW formulations (25%),
Europe (22%) and ARV formulations (8%).
The company faced a USFDA embargo in 2011 for two of its units for
non-compliance with cGMP. It also went through political turmoil due to
the Telangana issue and alleged favours received by promoters through
political connections. Aurobindo acquired commercial operations in
seven Western European countries from Actavis. The company has
acquired personnel, commercial infrastructure, products, marketing
authorisation and dossier license rights in these seven countries. The
acquisition brought in a pipeline of ~1200 products from different
segments and an additional pipeline of over 200 products under its aegis.
Net sales for acquired businesses were ~€320 million. GPMs were ~30%.
They were fetching losses of ~€23 million at the EBITDA level.
Aurobindo Pharma also acquired the Generis group in Portugal in Q4FY17
through its step down subsidiary Agile Pharma (Netherlands) for a
consideration of ~€135 million (~| 985 crore). Generis’ CY16 revenues
were €64.8 million and EBITDA was €12.7 million.
The company also acquired the assets of nutritional supplement maker
Natrol Inc for a consideration of ~US$132.5 million. With this acquisition,
the company has forayed into the nutritional OTC business in the US and
other international markets. Overall, we expect revenues to grow at 6%
CAGR in FY17-19E to | 16990 crore on the back of Actavis consolidation
and incremental US launches.
Exhibit 1: Revenues to grow at CAGR of 6% in FY17-19E
4627.4
5855.3
8099.9
12120.5
13831.2
15089.9
16253.416990.2
0
2000
4000
6000
8000
10000
12000
14000
16000
18000
FY12 FY13 FY14 FY15 FY16 FY17 FY18E FY19E
(| crore)
Total Operating Income
Source: Company, ICICIdirect.com Research
26.6% CAGR
6.1% CAGR

ICICI Securities Ltd | Retail Equity Research Page 4
After filing ANDA in the US in 2003, the company has come a long way as
current ANDA filings are at 442. The US revenue run rate has grown from
~US$100 million in 2009 to crossing $1 billion sales as on 2016. Note that
this was despite the USFDA embargo in FY12-13 on unit VI and unit III.
The much hyped Pfizer deal, which eventually fell apart, also had an
impact on US sales as the company had to invest in the front end
network. In rupee terms, US sales have grown at 42% CAGR to | 6827
crore in FY12-17. US formulations now constitute 46% of total turnover,
up from 26% in FY12. The US traction has also boosted investors’
confidence, which was affected by warning letters, piling debts besides
non-business political adversaries. We expect US sales to grow at a CAGR
of 6% on a higher base to | 7631 crore in FY17-19E.
Exhibit 2: US growth on the back of robust pipeline and Natrol acquisition
1183.6
1752.6
3446.8 3446.8
6143.8
6827.3
7462.47630.5
0
1000
2000
3000
4000
5000
6000
7000
8000
9000
FY12 FY13 FY14 FY15 FY16 FY17 FY18E FY19E
(| crore)
US
Source: Company, ICICIdirect.com Research
From a prominent API supplier and participant in the global ARV tenders
to a leading formulations vendor, the company has virtually changed its
identity. The API: formulations ratio has improved from 43:57 in FY12 to
21:79 in FY17. Another USP of the company is its vertically integrated
model with huge capacity, unmatched by most peers. The company owns
22 manufacturing facilities, including eight key formulations facilities in
India and abroad. These can be optimised by 1) continuous US filings and
launches 2) incremental launches and filings in the RoW markets and 3)
site transfers and supplies for products covered under the Actavis deal.
Higher capacity utilisation is likely to have a positive impact on margins,
which are likely to be under some pressure after the Actavis deal.
Exhibit 3: Acquisition of Actavis Europe business boosts sales in Europe
647.48467.9
672.1 672.1
3125.33277.2
3791.93992.2
0
1000
2000
3000
4000
5000
FY12 FY13 FY14 FY15 FY16 FY17 FY18E FY19E
(| crore)
Europe
Source: Company, ICICIdirect.com Research
42% CAGR
5.7% CAGR
38.3% CAGR
10.4% CAGR

ICICI Securities Ltd | Retail Equity Research Page 5
Exhibit 4: Aurobindo to concentrate on high margins tender business
766.7 750.3
840.2 840.2
1199.9 1185.3 1171.01229.6
0
200
400
600
800
1000
1200
1400
FY12 FY13 FY14 FY15 FY16 FY17 FY18E FY19E
(| crore)
ARV
Source: Company, ICICIdirect.com Research
Exhibit 5: API business to see muted growth due to higher captive consumption
2067.6
2536.2
2828.9 2828.9 2883.93042.0 2978.7
3163.2
0
1000
2000
3000
4000
FY12 FY13 FY14 FY15 FY16 FY17 FY18E FY19E
(| crore)
Total API
Source: Company, ICICIdirect.com Research
Exhibit 6: Impact on margins due to acquisitions to be neutralised by US growth
610.1
889.2
2132.9
2563.6
3140.7
3434.3
4143.7
3737.9
13.2
15.2
26.3
21.2
22.7 22.8
25.5 22.0
0
500
1000
1500
2000
2500
3000
3500
4000
4500
FY12 FY13 FY14 FY15 FY16 FY17 FY18E FY19E
(|
crore)
0
5
10
15
20
25
30(%
)
Operating Profit (EBITDA) EBITDA Margins (%)
Source: Company, ICICIdirect.com Research
9.1% CAGR
1.9% CAGR
8% CAGR
-3.5% CAGR

ICICI Securities Ltd | Retail Equity Research Page 6
Exhibit 7: Net profit to grow at CAGR of 3% in FY17-19E
1173.0
1915.6
2301.6
2706.0
2411.3
-123.5
293.9
1575.8
-500
0
500
1000
1500
2000
2500
3000
FY12 FY13 FY14 FY15 FY16 FY17 FY18E FY19E
(|
crore)
PAT
Source: Company, ICICIdirect.com Research
Exhibit 8: Trends in return ratios
16.3
7.9
10.9
23.8 24.123.1
24.4
21.5
18.0 17.6
36.7
27.2
25.5
30.4
24.2
22.9
0
5
10
15
20
25
30
35
40
FY12 FY13 FY14 FY15 FY16 FY17 FY18E FY19E
(%
)
RoCE (%) RoNW (%)
Source: Company, ICICIdirect.com Research
2.4% CAGR

ICICI Securities Ltd | Retail Equity Research Page 7
Exhibit 9: Trends in quarterly financials
(| Crore) Q1FY15 Q2FY15 Q3FY15 Q4FY15 Q1FY16 Q2FY16 Q3FY16 Q4FY16 Q1FY17 Q2FY17 Q3FY17 Q4FY17 Q1FY18 YoY (%) QoQ(%)
Total Operating Income 2911.1 2881.2 3166.2 3162.1 3298.9 3365.1 3505.6 3745.9 3766.6 3775.5 3906.2 3641.6 3678.8 -2.3 1.0
Raw Material Expenses 1380.6 1264.7 1538.5 1373.6 1512.4 1512.1 1550.8 1625.9 1637.0 1629.9 1709.7 1502.8 1497.8 -8.5 -0.3
% of revenue 47.4 43.9 48.6 43.4 45.8 44.9 44.2 43.4 43.5 43.2 43.8 41.3 40.7 -274 bps -55 bps
Gross Profit 1530.4 1616.5 1627.6 1788.5 1786.6 1853.0 1954.8 2120.0 2129.6 2145.6 2196.5 2138.8 2180.9 2.4 2.0
GPM (%) 52.6 56.1 51.4 56.6 54.2 55.1 55.8 56.6 56.5 56.8 56.2 58.7 59.3 274 bps 55 bps
Employee Expenses 308.4 337.0 368.0 373.3 361.2 373.0 401.6 406.8 432.1 426.6 445.6 463.5 490.2 13.4 5.8
% of revenue 10.6 11.7 11.6 11.8 10.9 11.1 11.5 10.9 11.5 11.3 11.4 12.7 13.3 185 bps 60 bps
Other Manufacturing Expenses563.9 642.4 647.4 759.1 700.3 700.9 735.5 852.1 808.6 789.8 856.0 954.1 849.2 5.0 -11.0
% revenues 19.4 22.3 20.4 24.0 21.2 20.8 21.0 22.7 21.5 20.9 21.9 26.2 23.1 162 bps -312 bps
Total Expenditure 2252.9 2244.0 2554.0 2506.0 2573.9 2586.1 2687.9 2884.8 2877.6 2846.2 3011.3 2920.4 2837.2 -1.4 -2.9
% of revenue 77.4 77.9 80.7 79.3 78.0 76.9 76.7 77.0 76.4 75.4 77.1 80.2 77.1 72 bps -307 bps
EBITDA 658.2 637.2 612.2 656.1 725.1 779.0 817.7 861.1 889.0 929.2 894.8 721.2 841.6 -5.3 16.7
EBITDA Margins (%) 22.6 22.1 19.3 20.7 22.0 23.1 23.3 23.0 23.6 24.6 22.9 19.8 22.9 -72 bps 307 bps
Depreciation 90.8 89.9 67.3 84.7 89.0 92.6 99.4 111.4 106.2 110.2 111.1 100.1 131.2 23.5 31.1
Interest 18.9 21.0 21.9 22.6 20.8 24.1 22.7 25.1 20.6 17.5 14.3 14.3 16.9 -18.3 18.1
Other Income 10.8 27.3 35.9 6.7 29.4 12.2 7.5 21.0 22.9 8.3 7.9 40.8 33.3 45.1 -18.4
Less: Forex & Exceptional Items-1.4 42.0 20.2 -1.2 10.6 43.9 -14.0 -15.3 0.0 -20.2 -15.8 0.0 18.8
PBT 560.7 511.7 538.7 556.8 634.0 630.6 717.2 761.0 785.0 829.9 793.2 647.7 708.0 -9.8 9.3
Total Tax 146.4 140.4 156.3 153.4 163.4 176.7 174.2 206.4 200.8 224.0 217.7 117.2 191.0 -4.9 63.0
Tax rate (%) 26.1 27.4 29.0 27.6 25.8 28.0 24.3 27.1 25.6 27.0 27.4 18.1 27.0 139 bps 889 bps
PAT 414.3 371.2 382.4 403.4 470.6 453.9 543.0 554.6 584.2 606.0 575.5 530.5 517.0 -11.5 -2.6
Minority Interest -1.2 -1.0 -2.0 -0.5 -1.9 -1.1 0.4 -0.3 -0.1 -0.1 -0.1 -0.2 -0.2 200.0 -21.7
Net Profit 415.4 372.2 384.4 403.8 472.5 455.0 542.6 554.9 584.2 606.0 575.6 530.8 517.2 -11.5 -2.6
EPS (|) 7.1 6.4 6.6 6.9 8.1 7.8 9.3 9.5 10.0 10.4 9.9 9.1 8.9
Source: Company, ICICIdirect.com Research
SWOT Analysis
Strengths - US product pipeline, huge capacity, vertically integrated
business model
Weakness - No presence in Indian domestic formulations, substantial debt
Opportunities - US generics space, foray into oncology
Industry specific threats- Increased USFDA scrutiny across the globe
regarding cGMP issues, pricing pressure due to client consolidation.
Conference call highlights
As per the management, the price erosion in the US business was
at low double digits (11-12% YoY) in Q1FY18. The scenario is
likely to continue in the remaining three quarters of FY18
(fluctuating between high single digits and low double digits).
However, sequentially the price erosion on the base business was
flat QoQ
Despite the price erosion, the management has guided for
positive growth in the US in FY18
Aurobindo’s cumulative filings were at 442 ANDAs including 292
final approvals, 37 tentative approvals and 113 pending approvals.
The company’s US base business grew 3% YoY in Q1FY18
During Q1FY18, the company filed 13 ANDAs with USFDA
including nine in oral and four in injectable category. It has
launched 15 products in the US including 16 in oral and one in
injectable category in Q1FY18
In Q1FY18, R&D spend was at | 162 crore, 4% of revenues. The
company expects percentage of R&D spending to remain in the
range of 5-6% for FY18 and FY19
Capex spend during the quarter was at US$40 million
For FY18, the effective tax rate will be ~27%

ICICI Securities Ltd | Retail Equity Research Page 8
The acquired Generis group (Portugal), EBITDA margins were in
double digits during the quarter
The company has to date transferred manufacturing of 71
products from Europe (Actavis) to India
On the M&A strategy, the company intends to focus on market
penetration and newer technologies
On the launches front, gMucinex has already been launched while
volumes are getting ramped up. gVancomycin is expected to be
launched in FY18 while gDarunavir is expected to be filed in the
next few quarters
Unit 10 facility (SEZ) is expected to be commercialised on April 1,
2018. Unit 16 facility (injectable) has already received EIR and has
started exporting
On the debt front, the company reported a net debt of $560
million in Q1FY18. The net debt is currently at $605 million, which
is expected to reduce to $475 million in FY18 end
Exhibit 11: Major facilities
Unit No. Segment Approvals Type Location
Aurolife Formulations USFDA Non antibiotic & Controlled substances USA
Unit-I API CVS, CNS, Anti-Allergics, Non-Sterile India
Unit-II API Intermediates for non antibiotics, Penems India
Unit-III Formulations USFDA Non antibiotics, ARVs / Orals India
Unit-IV Formulations USFDA Injectables (Non-antibiotics) & Ophthalmics India
Unit-V API Antibiotics (Sterile & Non-sterile) India
Unit-VI Formulations USFDA Cephalosporins Orals India
Unit-VII (SEZ) Formulations USFDA Oral dosage India
Unit-VIII API ARV, CVS, CNS (Non-sterile) India
Unit-IX API Intermediates India
Unit-X * Formulations Facilities under construction/development India
Unit-XI API India
Unit-XII Formulations USFDA Antibiotics, injectables, Orals India
Unit-XIV * Facilities under construction/development India
Unit-XV India
Unit-XVI * Facilities under construction/development India
Unit-XVII * Facilities under construction/development India
APLRC-I @ R&D Center Research and Development Centers India
APLRC-II @ R&D Center Research and Development Centers India
Bhiwadi Unit Formulations USFDA Penem Injecables India
Source: Company, ICICIdirect.com Research
Exhibit 10: US pipeline
Units Therapies Tentative Approvals Final Approvals Pending Total
Unit III Oral Formulations 14 102 10 126
Unit IV Injectables & Ophthalmics 2 42 39 83
Unit VIB Cephalosphorins Oral 11 11
Unit VII (SEZ) Oral Formulations 21 101 37 159
Unit X Oral Formulations 10 10
Unit XII Penicillin Oral & Injectables 19 1 20
Aurolife USA Oral Formulations 16 10 26
AuroNext Penem Injectables 1 3 4
Eugia Oral &Injectable Formulations 3 3
Total 37 292 113 442
Source: Company, ICICIdirect.com Research

ICICI Securities Ltd | Retail Equity Research Page 9
Valuation
Unlike other peers, the Aurobindo management has asserted its
confidence on the US near term prospect despite strong pricing
headwinds. This is on the back of lower product concentration as top 25
products are now contributing 35% of the US portfolio against 45% in
Q1FY17. Moreover, we expect the percentage of injectables, which are
relatively insulated from pricing pressure, in the US portfolio, to grow
from 14% in FY17 to 20-25% by FY19. We believe launches continuum,
especially in the injectable space, can effectively neutralise channel
consolidation and pricing pressure headwinds. Other important segment
i.e. Europe are likely to fetch better margins on the back of product
transfers to India and a focused approach. We have ascribed a target
price of | 745, based on 18x FY19E EPS of | 41.4.
Exhibit 12: One year forward PE
0.0
200.0
400.0
600.0
800.0
1000.08/10/2011
2/10/2012
8/10/2012
2/10/2013
8/10/2013
2/10/2014
8/10/2014
2/10/2015
8/10/2015
2/10/2016
8/10/2016
2/10/2017
8/10/2017
|
Aurobindo 18.1x 15.0x 8.9x 5.8x
[
Source: Company, ICICIdirect.com Research
Exhibit 13: One year forward PE of company vs. CNX Pharma
0.00
5.00
10.00
15.00
20.00
25.00
30.00
35.00
40.00
45.00
8/10/2011
2/10/2012
8/10/2012
2/10/2013
8/10/2013
2/10/2014
8/10/2014
2/10/2015
8/10/2015
2/10/2016
8/10/2016
2/10/2017
8/10/2017
x
Aurobindo CNX Pharma
14% Discount
Source: Company, ICICIdirect.com Research
Exhibit 14: Valuation
Revenues Growth Adj. EPS Growth P/E EV/EBITDA RoNW RoCE
(| crore) (%) (|) (%) (x) (X) (%) (%)
FY16 13831 14.1 32.8 21.2 20.9 14.0 27.2 23.1
FY17 15090 9.1 39.4 14.3 17.4 12.4 24.2 24.4
FY18E 16253 7.7 46.5 20.3 14.7 10.1 22.9 25.5
FY19E 16990 4.5 41.4 -11.5 16.5 11.1 17.1 19.6
Source: Company, ICICIdirect.com Research

ICICI Securities Ltd | Retail Equity Research Page 10
Recommendation history vs. Consensus
0.0
10.0
20.0
30.0
40.0
50.0
60.0
70.0
80.0
90.0
100.0
0
200
400
600
800
1,000
1,200
1,400
1,600
1,800
Aug-17May-17Mar-17Jan-17Oct-16Aug-16May-16Mar-16Dec-15Oct-15Aug-15
(%
)(|)
Price Idirect target Consensus Target Mean % Consensus with BUY
Source: Reuters, Company, ICICIdirect.com Research
Key events
Date Event
Mar-10 Starts contract manufacturing business Aurolife
Sep-10 Signs an agreement with AstraZeneca to supply generic drugs for emerging markets
Jan-11 Sells stake in API unit of China for US$23 million
Feb-11 USFDA issues import alert for Unit VI
May-11 Redeems FCCB bonds
May-11 Receives warning letter for Unit VI & concerns on packing division of Unit III
Apr-12 CBI raids company premises
May-12 Ramprasad Reddy & Nithyananda Reddy step down from CEO and MD posts. Govindarajan appointed Managing Director
Mar-13 USFDA withdraws import alert for Unit VI
Jan-14 Acquires Actavis's Western European operations in 7 countries for ~EUR 30 million
Nov-14 Highest bidder for US nutritional supplement market Natrol with a bid of US$ 132.5 million
Dec-14 Acquires manufacturing assets, personnel, commercial infrastructure including the well established nutraceuticals brands in USA of Natrol along with an agreement
to take on certain liabilities, with a bid of $ 132.5 million
Feb-15 Gets approval for setting up JV with Tergene Biotech Pvt Ltd for development of Pneumococcal Conjugate Vaccine with a global market of more than US$5 billion.
The company holds majority stake in the JV
Feb-16 The USFDA inspects Unit III and Unit VII facilities of the company. Unit III was cleared without observations while unit VII received four 483 observations.
Feb-17 Forays into biosimilars development through an acquisition of four products from TL Biopharmaceutical AG
Source: Company, ICICIdirect.com Research
Top 10 Shareholders Shareholding Pattern
Rank Investor Name Latest Filing Date % O/S Position (%) Position Change
1 RPR Sons Advisors Pvt. Ltd. 31-Mar-17 33.5 196.38m 0.00m
2 Reddy (Nityananda K) 31-Mar-17 4.3 25.36m 0.00m
3 HDFC Asset Management Co., Ltd. 31-Mar-17 4.3 24.94m 3.76m
4 Kambam (Kirthi Reddy) 31-Mar-17 3.5 20.70m 0.00m
5 Reddy (Ramaprasad P V) 31-Mar-17 3.1 18.00m 0.00m
6 Sivakumaran (M) 31-Mar-17 2.5 14.49m (0.20)m
7 Reliance Nippon Life Asset Management Limited 31-Mar-17 1.7 9.99m 2.90m
8 The Vanguard Group, Inc. 30-Jun-17 1.5 8.62m (0.00)m
9 Birla Sun Life Asset Management Company Ltd. 31-Mar-17 1.4 8.38m 0.87m
10 SBI Funds Management Pvt. Ltd. 30-Sep-16 1.4 8.03m 1.29m
(in %) Jun-16 Sep-16 Dec-16 Mar-16 Jun-16
Promoter 53.8 53.8 53.8 51.9 51.9
Others 46.2 46.2 46.2 48.1 48.1
Source: Reuters, ICICIdirect.com Research
Recent Activity
Investor name Value ($) Shares Investor name Value ($) Shares
Stichting Depositary APG Emerging Markets Equity Pool 67.1m 6.4m Trident Chemphar, Ltd. -126.5m -12.1m
HDFC Asset Management Co., Ltd. 39.2m 3.8m Invest AD -22.3m -2.1m
Reliance Nippon Life Asset Management Limited 30.2m 2.9m APG Asset Management -17.8m -1.7m
Birla Sun Life Asset Management Company Ltd. 9.1m 0.9m Artisan Partners Limited Partnership -14.9m -1.4m
Govindarajan (Hema) 7.6m 0.7m Lyxor Asset Management -8.3m -0.9m
Buys Sells
Source: Reuters, ICICIdirect.com Research

ICICI Securities Ltd | Retail Equity Research Page 11
.
Financial summary
Profit and loss statement | Crore
(Year-end March) FY16 FY17 FY18E FY19E
Revenues 13,831.2 15,089.9 16,253.4 16,990.2
Growth (%) 14.1 9.1 7.7 4.5
Raw Material Expenses 6,157.5 6,479.4 6,527.7 7,135.9
Employee Expenses 1,550.8 1,767.8 2,029.3 2,293.7
Other Manufacturing Expenses 2,982.1 3,408.5 3,552.7 3,822.8
Total Operating Expenditure 10,690.5 11,655.6 12,109.7 13,252.4
EBITDA 3,140.7 3,434.3 4,143.7 3,737.9
Growth (%) 22.5 9.3 20.7 -9.8
Interest 92.7 66.7 63.1 63.1
Depreciation 392.6 427.6 434.6 479.8
Other Income 68.2 79.9 81.3 85.0
PBT before Exceptional Items 2,723.6 3,019.8 3,727.3 3,280.0
Less: Forex & Exceptional Items 66.0 -36.0 18.8 0.0
PBT 2,657.6 3,055.8 3,708.5 3,280.0
Total Tax 744.4 759.7 1,004.4 869.2
PAT before MI 1,913.2 2,296.2 2,704.0 2,410.8
Minority Interest -2.4 -0.5 -0.6 -0.6
PAT 1,915.6 2,301.6 2,706.0 2,411.3
Adjusted PAT 1,981.6 2,265.7 2,724.8 2,411.3
Growth (%) 21.2 14.3 20.3 -11.5
EPS (Diluted) 32.8 39.4 46.5 41.4
Source: Company, ICICIdirect.com Research
Cash flow statement | Crore
(Year-end March) FY16 FY17 FY18E FY19E
Profit/(Loss) after taxation 1,986.7 2,301.6 2,706.0 2,411.3
Add: Depreciation & Amortization 392.6 427.6 434.6 479.8
Net Increase in Current Assets -1,583.4 801.4 -864.3 -536.8
Net Increase in Current Liabilities 545.1 -102.4 382.1 235.7
CF from operating activities 605.2 3,428.3 2,658.4 2,590.0
(Purchase)/Sale of Fixed Assets -1,411.3 -1,675.6 -1,701.5 -900.0
(Inc)/dec in Investments -39.0 -122.9 -100.0 -1,000.0
Others 683.1 -102.5 -86.3 -50.0
CF from investing activities -767.2 -1,901.1 -1,887.8 -1,950.0
Issue of Equity Shares 29.3 0.1 0.0 0.0
Inc / (Dec) in Debt 645.3 -1,676.9 -280.0 0.0
Dividend & Dividend Tax -161.6 -137.2 -197.2 -175.7
others 0.0 0.0 0.0 0.0
CF from financing activities 513.1 -1,814.0 -477.2 -175.7
Net Cash flow 351.2 -286.8 293.3 464.2
Opening Cash 449.1 800.3 513.5 806.8
Closing Cash 800.3 513.5 806.8 1,271.0
Free Cash Flow -806.1 1,752.7 956.9 1,690.0
Source: Company, ICICIdirect.com Research
Balance sheet | Crore
(Year-end March) FY16 FY17 FY18E FY19E
Equity Capital 58.5 58.6 58.6 58.6
Reserve and Surplus 7,228.8 9,313.3 11,822.2 14,057.8
Total Shareholders funds 7,287.3 9,371.9 11,880.7 14,116.4
Total Debt 5,041.1 3,364.1 3,084.1 3,084.1
Deferred Tax Liability 24.0 49.3 59.2 66.3
Minority Interest 2.6 2.1 2.5 2.8
Long term Provisions 23.4 22.4 26.9 30.1
Source of Funds 12,378.2 12,809.8 15,053.4 17,299.7
Gross Block - Fixed Assets 3,725.9 4,799.8 5,668.4 6,318.4
Accumulated Depreciation 345.5 716.8 1,082.7 1,490.7
Net Block 3,380.4 4,083.1 4,585.7 4,827.7
Capital WIP 835.9 1,237.4 1,437.4 1,637.4
Net Fixed Assets 4,216.3 5,320.4 6,023.0 6,465.1
Total Intangible Assets 405.2 565.2 1,129.5 1,107.7
Goodwill on Consolidation 406.3 406.3 406.3 406.3
Investments 123.0 245.9 345.9 1,345.9
Inventory 4,056.1 4,330.5 4,664.5 4,875.9
Cash 800.3 513.5 806.8 1,271.0
Debtors 4,606.7 2,765.3 2,978.6 3,113.6
Loans & Advances & Other CA 831.3 1,596.8 1,914.0 2,104.3
Total Current Assets 10,294.3 9,206.2 10,363.8 11,364.8
Creditors 2,457.0 2,488.3 2,680.1 2,801.6
Provisions & Other CL 1,084.9 951.3 1,141.6 1,255.7
Total Current Liabilities 3,542.0 3,439.6 3,821.7 4,057.4
Net Current Assets 6,752.4 5,766.6 6,542.1 7,307.5
LT L& A, Other Assets 268.8 337.8 405.3 445.9
Deferred Tax Assets 206.3 167.8 201.3 221.4
Application of Funds 12,378.2 12,809.8 15,053.4 17,299.7
Source: Company, ICICIdirect.com Research
Key ratios
(Year-end March) FY16 FY17 FY18E FY19E
Per share data (|)
Adjusted EPS (Diluted) 33.9 38.8 46.8 41.4
BV per share 124.8 160.5 204.1 242.4
Dividend per share 2.8 2.3 3.4 3.0
Cash Per Share 13.7 8.8 13.9 21.8
Operating Ratios (%)
Gross Profit Margins 55.5 57.1 59.8 58.0
EBITDA margins 22.7 22.8 25.5 22.0
Net Profit margins 14.3 15.0 16.8 14.2
Inventory days 107.0 104.7 104.7 104.7
Debtor days 121.6 66.9 66.9 66.9
Creditor days 64.8 60.2 60.2 60.2
Asset Turnover 1.1 1.2 1.1 1.0
EBITDA Conversion Rate 19.3 99.8 64.2 69.3
Return Ratios (%)
RoE 27.2 24.2 22.9 17.1
RoCE 23.1 24.4 25.5 19.6
RoIC 26.1 28.8 30.5 23.8
Valuation Ratios (x)
P/E 20.9 17.4 14.7 16.5
EV / EBITDA 14.0 12.4 10.1 11.1
EV / Net Sales 3.2 2.8 2.6 2.4
Market Cap / Sales 2.9 2.6 2.5 2.3
Price to Book Value 5.5 4.3 3.4 2.8
Solvency Ratios
Debt / Equity 0.7 0.4 0.3 0.2
Debt / EBITDA 1.6 1.0 0.7 0.8
Current Ratio 2.7 2.5 2.5 2.5
Source: Company, ICICIdirect.com Research

ICICI Securities Ltd | Retail Equity Research Page 12
ICICIdirect.com coverage universe (Healthcare)
Company I-Direct CMP TP Rating M Cap
Code (|) (|) (| Cr) FY16 FY17E FY18E FY19E FY16 FY17E FY18E FY19E FY16 FY17E FY18E FY19E FY16 FY17E FY18E FY19E
Ajanta Pharma AJAPHA 1211 1,420 Buy 10655.8 110.0 56.6 57.1 71.0 11.0 21.4 21.2 17.1 46.2 41.8 33.1 32.4 37.3 33.2 26.5 26.0
Alembic Pharma ALEMPHA 524 570 Hold 9881.1 38.2 21.2 19.1 28.6 13.7 24.7 27.4 18.3 52.2 25.3 18.7 23.9 45.1 21.0 16.5 20.8
Apollo Hospitals APOHOS 1210 1,400 Buy 16836.2 13.2 12.8 16.5 33.3 91.7 94.3 73.2 36.3 6.6 6.0 6.7 10.8 5.3 4.9 5.9 10.9
Aurobindo Pharma AURPHA 685 745 Hold 40147.6 33.9 38.8 46.8 41.4 20.2 17.7 14.6 16.5 23.1 24.4 25.5 19.6 27.2 24.2 22.9 17.1
Biocon BIOCON 331.1 380 Hold 19866.0 7.7 11.0 7.8 13.5 42.9 30.2 42.6 24.6 9.3 11.9 10.1 15.9 11.5 13.6 9.0 13.9
Cadila Healthcare CADHEA 466 420 Hold 47721.8 15.0 14.5 15.4 20.5 31.2 32.1 30.2 22.7 24.9 13.1 15.2 18.5 34.4 21.4 19.4 21.6
Cipla CIPLA 548.2 470 Hold 44112.2 18.5 12.9 17.8 25.3 29.6 42.6 30.7 21.7 12.0 8.0 11.0 14.5 12.5 8.1 10.4 13.1
Divi's Lab DIVLAB 626 665 Hold 16621.0 41.5 39.3 34.6 41.5 15.1 15.9 18.1 15.1 30.5 25.0 20.3 21.5 25.7 19.5 15.4 16.4
Dr Reddy's Labs DRREDD 1949 2,400 Hold 32305.0 141.4 70.6 72.4 126.2 13.8 27.6 26.9 15.4 15.3 6.1 6.8 11.9 19.2 9.5 9.0 13.9
Glenmark Pharma GLEPHA 613 730 Hold 17289.9 32.2 46.0 38.7 40.6 19.0 13.3 15.8 15.1 16.2 18.9 15.9 15.5 21.2 25.5 17.9 15.9
Indoco Remedies INDREM 192.8 180 Hold 1776.7 9.4 8.4 7.3 14.9 20.5 23.1 26.5 12.9 12.9 8.4 6.8 12.0 14.8 12.0 9.6 17.1
Ipca Laboratories IPCLAB 420 525 Hold 5297.3 7.4 15.4 17.6 27.9 56.9 27.2 23.8 15.0 4.5 8.7 9.3 13.2 4.1 7.9 8.4 12.0
Jubilant Life JUBLIF 642.7 845 Buy 10236.2 26.0 36.1 44.3 59.1 24.7 17.8 14.5 10.9 12.0 13.3 14.8 17.6 14.2 16.8 17.3 19.0
Lupin LUPIN 937 1,070 Hold 42315.2 50.4 56.6 41.4 53.4 18.6 16.5 22.6 17.5 17.8 16.6 12.4 15.5 20.3 18.9 12.4 14.2
Natco Pharma NATPHA 696.7 955 Hold 12143.2 9.0 27.0 25.5 16.0 77.0 25.8 27.3 43.5 16.0 33.0 27.6 16.2 12.2 28.8 22.6 12.8
Sun Pharma SUNPHA 461 550 Hold 110557.3 23.4 29.0 20.3 25.5 19.7 15.9 22.7 18.1 18.6 19.8 13.5 15.0 18.0 19.0 12.0 13.4
Syngene Int. SYNINT 439 490 Hold 8789.0 11.1 14.3 14.3 17.4 43.6 33.6 33.6 27.7 14.1 16.8 16.2 17.8 21.6 20.3 17.2 17.4
Torrent Pharma TORPHA 1229 1,250 Hold 20795.0 110.9 55.2 48.3 65.8 11.1 22.3 25.4 18.7 46.5 18.9 17.6 20.7 53.7 21.5 16.5 19.2
Unichem Lab UNILAB 245 235 Hold 2227.1 12.3 12.0 17.3 23.6 19.9 20.4 14.2 10.4 13.8 11.8 11.6 13.9 11.7 10.2 13.1 15.5
RoE (%)EPS (|) PE(x) RoCE (%)
Source: Company, ICICIdirect.com Research

ICICI Securities Ltd | Retail Equity Research Page 13
RATING RATIONALE
ICICIdirect.com endeavours to provide objective opinions and recommendations. ICICIdirect.com assigns
ratings to its stocks according to their notional target price vs. current market price and then categorises them
as Strong Buy, Buy, Hold and Sell. The performance horizon is two years unless specified and the notional
target price is defined as the analysts' valuation for a stock.
Strong Buy: >15%/20% for large caps/midcaps, respectively, with high conviction;
Buy: >10%/15% for large caps/midcaps, respectively;
Hold: Up to +/-10%;
Sell: -10% or more;
Pankaj Pandey Head – Research [email protected]
ICICIdirect.com Research Desk,
ICICI Securities Limited,
1st Floor, Akruti Trade Centre,
Road No 7, MIDC,
Andheri (East)
Mumbai – 400 093
ICICI Securities Ltd | Retail Equity Research Page 14
ANALYST CERTIFICATION
We /I, Siddhant Khandekar CA-INTER, Mitesh Shah MS (Finance) Harshal Mehta M. Tech (Biotechnology) Research Analysts, authors and the names subscribed to this report, hereby certify that all of the
views expressed in this research report accurately reflect our views about the subject issuer(s) or securities. We also certify that no part of our compensation was, is, or will be directly or indirectly related
to the specific recommendation(s) or view(s) in this report.
Terms & conditions and other disclosures:
ICICI Securities Limited (ICICI Securities) is a full-service, integrated investment banking and is, inter alia, engaged in the business of stock brokering and distribution of financial products. ICICI Securities
Limited is a Sebi registered Research Analyst with Sebi Registration Number – INH000000990. ICICI Securities is a wholly-owned subsidiary of ICICI Bank which is India’s largest private sector bank and has
its various subsidiaries engaged in businesses of housing finance, asset management, life insurance, general insurance, venture capital fund management, etc. (“associates”), the details in respect of which
are available on www.icicibank.com.
ICICI Securities is one of the leading merchant bankers/ underwriters of securities and participate in virtually all securities trading markets in India. We and our associates might have investment banking
and other business relationship with a significant percentage of companies covered by our Investment Research Department. ICICI Securities generally prohibits its analysts, persons reporting to analysts
and their relatives from maintaining a financial interest in the securities or derivatives of any companies that the analysts cover.
The information and opinions in this report have been prepared by ICICI Securities and are subject to change without any notice. The report and information contained herein is strictly confidential and
meant solely for the selected recipient and may not be altered in any way, transmitted to, copied or distributed, in part or in whole, to any other person or to the media or reproduced in any form, without
prior written consent of ICICI Securities. While we would endeavour to update the information herein on a reasonable basis, ICICI Securities is under no obligation to update or keep the information current.
Also, there may be regulatory, compliance or other reasons that may prevent ICICI Securities from doing so. Non-rated securities indicate that rating on a particular security has been suspended
temporarily and such suspension is in compliance with applicable regulations and/or ICICI Securities policies, in circumstances where ICICI Securities might be acting in an advisory capacity to this
company, or in certain other circumstances.
This report is based on information obtained from public sources and sources believed to be reliable, but no independent verification has been made nor is its accuracy or completeness guaranteed. This
report and information herein is solely for informational purpose and shall not be used or considered as an offer document or solicitation of offer to buy or sell or subscribe for securities or other financial
instruments. Though disseminated to all the customers simultaneously, not all customers may receive this report at the same time. ICICI Securities will not treat recipients as customers by virtue of their
receiving this report. Nothing in this report constitutes investment, legal, accounting and tax advice or a representation that any investment or strategy is suitable or appropriate to your specific
circumstances. The securities discussed and opinions expressed in this report may not be suitable for all investors, who must make their own investment decisions, based on their own investment
objectives, financial positions and needs of specific recipient. This may not be taken in substitution for the exercise of independent judgment by any recipient. The recipient should independently evaluate
the investment risks. The value and return on investment may vary because of changes in interest rates, foreign exchange rates or any other reason. ICICI Securities accepts no liabilities whatsoever for any
loss or damage of any kind arising out of the use of this report. Past performance is not necessarily a guide to future performance. Investors are advised to see Risk Disclosure Document to understand the
risks associated before investing in the securities markets. Actual results may differ materially from those set forth in projections. Forward-looking statements are not predictions and may be subject to
change without notice.
ICICI Securities or its associates might have managed or co-managed public offering of securities for the subject company or might have been mandated by the subject company for any other assignment
in the past twelve months.
ICICI Securities or its associates might have received any compensation from the companies mentioned in the report during the period preceding twelve months from the date of this report for services in
respect of managing or co-managing public offerings, corporate finance, investment banking or merchant banking, brokerage services or other advisory service in a merger or specific transaction.
ICICI Securities or its associates might have received any compensation for products or services other than investment banking or merchant banking or brokerage services from the companies mentioned
in the report in the past twelve months.
ICICI Securities encourages independence in research report preparation and strives to minimize conflict in preparation of research report. ICICI Securities or its associates or its analysts did not receive any
compensation or other benefits from the companies mentioned in the report or third party in connection with preparation of the research report. Accordingly, neither ICICI Securities nor Research Analysts
and their relatives have any material conflict of interest at the time of publication of this report.
It is confirmed that Siddhant Khandekar CA-INTER, Mitesh Shah MS (Finance) Harshal Mehta MTech (Biotechnology) Research Analysts of this report have not received any compensation from the
companies mentioned in the report in the preceding twelve months.
Compensation of our Research Analysts is not based on any specific merchant banking, investment banking or brokerage service transactions.
ICICI Securities or its subsidiaries collectively or Research Analysts or their relatives do not own 1% or more of the equity securities of the Company mentioned in the report as of the last day of the month
preceding the publication of the research report.
Since associates of ICICI Securities are engaged in various financial service businesses, they might have financial interests or beneficial ownership in various companies including the subject
company/companies mentioned in this report.
It is confirmed that Siddhant Khandekar CA-INTER, Mitesh Shah MS (Finance) Harshal Mehta MTech (Biotechnology) Research Analysts do not serve as an officer, director or employee of the companies
mentioned in the report.
ICICI Securities may have issued other reports that are inconsistent with and reach different conclusion from the information presented in this report.
Neither the Research Analysts nor ICICI Securities have been engaged in market making activity for the companies mentioned in the report.
We submit that no material disciplinary action has been taken on ICICI Securities by any Regulatory Authority impacting Equity Research Analysis activities.
This report is not directed or intended for distribution to, or use by, any person or entity who is a citizen or resident of or located in any locality, state, country or other jurisdiction, where such distribution,
publication, availability or use would be contrary to law, regulation or which would subject ICICI Securities and affiliates to any registration or licensing requirement within such jurisdiction. The securities
described herein may or may not be eligible for sale in all jurisdictions or to certain category of investors. Persons in whose possession this document may come are required to inform themselves of and
to observe such restriction.
report and information herein is solely for informational purpose and shall not be used or considered as an offer document or solicitation of offer to buy or sell or subscribe for securities or other financial
instruments. Though disseminated to all the customers simultaneously, not all customers may receive this report at the same time. ICICI Securities will not treat recipients as customers by virtue of their
receiving this report. Nothing in this report constitutes investment, legal, accounting and tax advice or a representation that any investment or strategy is suitable or appropriate to your specific
circumstances. The securities discussed and opinions expressed in this report may not be suitable for all investors, who must make their own investment decisions, based on their own investment
objectives, financial positions and needs of specific recipient. This may not be taken in substitution for the exercise of independent judgment by any recipient. The recipient should independently evaluate
the investment risks. The value and return on investment may vary because of changes in interest rates, foreign exchange rates or any other reason. ICICI Securities accepts no liabilities whatsoever for any
loss or damage of any kind arising out of the use of this report. Past performance is not necessarily a guide to future performance. Investors are advised to see Risk Disclosure Document to understand the
risks associated before investing in the securities markets. Actual results may differ materially from those set forth in projections. Forward-looking statements are not predictions and may be subject to
change without notice.
ICICI Securities or its associates might have managed or co-managed public offering of securities for the subject company or might have been mandated by the subject company for any other assignment
in the past twelve months.
ICICI Securities or its associates might have received any compensation from the companies mentioned in the report during the period preceding twelve months from the date of this report for services in
respect of managing or co-managing public offerings, corporate finance, investment banking or merchant banking, brokerage services or other advisory service in a merger or specific transaction.
ICICI Securities or its associates might have received any compensation for products or services other than investment banking or merchant banking or brokerage services from the companies mentioned
in the report in the past twelve months.
ICICI Securities encourages independence in research report preparation and strives to minimize conflict in preparation of research report. ICICI Securities or its analysts did not receive any compensation
or other benefits from the companies mentioned in the report or third party in connection with preparation of the research report. Accordingly, neither ICICI Securities nor Research Analysts have any
material conflict of interest at the time of publication of this report.
It is confirmed that Siddhant Khandekar CA-INTER Mitesh Shah MS (Finance), Harshal Mehta MTech (Biotechnology) Research Analysts of this report have not received any compensation from the
companies mentioned in the report in the preceding twelve months.
Compensation of our Research Analysts is not based on any specific merchant banking, investment banking or brokerage service transactions.


![Dombrowski-Argument From Marginal Cases (JHI 45.1 [1984])](https://img.pdfslide.us/doc/110x75/577cd2a31a28ab9e7895b0f5/dombrowski-argument-from-marginal-cases-jhi-451-1984.jpg)