Embed Size (px)
Citation preview

1
2Q 2016 Earnings Call
August 9, 2016
8:30am ET

2
Safe Harbor Statement
Certain statements made within this presentation contain forward-looking statements, within the
meaning of the Private Securities Litigation Reform Act of 1995. Forward-looking statements are
not guarantees of performance and by their nature are subject to inherent uncertainties. Actual
results may differ materially. Any forward-looking information relayed in this presentation speaks
only as of August 8, 2016, and the Company undertakes no obligation to update that information to
reflect changed circumstances.
Additional information concerning these statements is contained in the Company’s press release
regarding its Second Quarter 2016 results issued on August 8, 2016, and the Risk Factors and
Forward-Looking Statements sections of the Company’s Second Quarter 2016 Quarterly Report on
Form 10-Q filed on August 8, 2016. Copies of these filings are available from the SEC, the Hertz
website or the Company’s Investor Relations Department.
2Q

3
Non-GAAP Measures
THE FOLLOWING NON-GAAP* MEASURES WILL BE USED IN THE PRESENTATION:
Adjusted corporate EBITDA
Adjusted corporate EBITDA margin
Adjusted pre-tax income (loss)
Adjusted net income (loss)
Adjusted earnings (loss) per share
(Adjusted EPS)
Revenue per available car day (RACD)
Total RPD
Net depreciation per unit per month
Net non-vehicle debt
Net vehicle debt
Free cash flow
*Definitions and reconciliations of these non-GAAP measures are provided
in the Company’s second quarter 2016 press release.
2Q

4
Agenda
BUSINESSOVERVIEW
John Tague
President & Chief Executive Officer
Hertz Global Holdings, Inc.
FINANCIAL RESULTSOVERVIEW
Tom Kennedy
Chief Financial Officer
Hertz Global Holdings, Inc.
2Q

5
TOM KENNEDYCHIEF FINANCIAL OFFICER
Hertz Global Holdings, Inc.
Quarterly Overview

6
2Q:16 Consolidated Results
*Definitions and reconciliations of these non-GAAP measures are provided in the Company’s second quarter 2016 press release.
NM – Not Meaningful
2QGAAP 2Q:16 Results 2Q:15 Results YoY Change
Revenue $2,270M $2,317M (2)%
Income (loss) from continuing operations before income taxes $(35)M $38M NM
Net Income (loss) from continuing operations $(28)M $13M NM
Earnings (loss) per share from continuing operations $(0.33) $0.14 NM
Weighted Average Shares outstanding 85M 92M (8)%
Non-GAAP*
Adjusted corporate EBITDA $184M $246M (25)%
Adjusted corporate EBITDA margin 8% 11% (251 bps)
Adjusted pre-tax income (loss) $55M $118M (53)%
Adjusted net income (loss) $35M $74M (53)%
Adjusted EPS (loss per share) $0.41 $0.80 (49)%

7
Consolidated Cost Initiatives Tangible Progress
Consolidated Cost Savings
• FY:16 Target $350M realized savings
– 2Q:16 realized savings of ~$100M
– 1H:16 realized savings of ~$170M
• FY:15 realized $230M of savings
IT Platform /
Cost of
Delivery
Back Office
Optimization and
General Overhead
US RAC Direct
Operation
Expenses
Strong Cost Management
Consolidated Unit Cost Metrics Reflect Initiative Progress
• Excludes affects of revenue change
• Consolidated DOE & SG&A per transaction day:
- Q2 total company declined 7% YoY
- IT outsourcing
- Customer relationship
management system
- Global fleet
management system
- Accounts payable
operations
- Reduction to strategic
consulting spend
- Streamlined vehicle
administrative operations
- Vehicle damage
collections process
- Labor productivity
improvements
- Improved sourcing

8
2Q:16 U.S. RAC Performance
Revenue Days Rate
Vehicle Utilization (pts) Capacity RACD
-2%
-8%-5%
-2%
2%0%0%
6%
-10%
-5%-2%
-8%
500400300
700
-5%-5%-3% -2% -3%
0%1% 0%
U.S. RAC (YOY quarterly results)
Q3’15 Q4’15 Q1’16 Q2’16
Revenue is defined as total revenue excluding ancillary retail car sales. Capacity calculated based on average total days. Vehicle utilization calculated as transaction days divided by capacity. RACD calculated as Revenue divided by Available Car Days (Capacity).
• 180 bps negative impact from DTG
methodology change, fuel and
other ancillary revenue
• Meaningful sequential
improvements in total RPD
throughout 2Q
• Published positive YoY pricing
• Negative impact from longer rental
length of keep and uncompetitive
customer mix
Q3’15 Q4’15 Q1’16 Q2’16
Q3’15 Q4’15 Q1’16 Q2’16
Q3’15 Q4’15 Q1’16 Q2’16Q3’15 Q4’15 Q1’16 Q2’16
Q3’15 Q4’15 Q1’16 Q2’16
U.S. RAC Pricing
2Q

9
2Q:16 International Rental Car 2Q• 2Q:16 Revenue decreased 2% YoY, excluding FX
- Volume flat primarily due to decline in inbound business following terrorist attacks, offsetting growth in commercial and other
leisure
- Total RPD 2% lower, in constant currency, due to impact of reduced high yielding inbound business
• Revenue per available car day decreased 4% YoY in constant currency
• Vehicle utilization fell 200bps YoY at 77%
• Customer service scores continue to improve
• Net monthly depreciation per unit decreased 4% in constant currency due to improvements in fleet procurement, fleet
mix and increased use of alternative disposition channels
• Adjusted corporate EBITDA declined $12M YoY, including $20M unanticipated charge to insurance reserves

10
CASH FLOW / BALANCE SHEET
OVERVIEW
TOM KENNEDYCHIEF FINANCIAL OFFICER
Hertz Global Holdings, Inc.

11
Liquidity and Debt Overview
6/30/16
PF for 7.5%
Note Redemption
RCF Availability $1,094M $1,094M
Unrestricted Cash 1,285M 572M
Corporate Liquidity $2,379M $1,666M
• Improved Hertz Non-Vehicle Debt Structure
– Used $2 billion in proceeds to reduce debt
– Significantly extended maturity schedule
– Lowered ongoing interest expense
• Executed $4.4 billion Hertz financing transactions
– $1.7 billion 5 year RCF liquidity facility
– $700 million 7 year term loan to refi 7.5% notes due 2018
– $800 million RAC and $385 million Donlen term ABS notes
– Over $800 million of additional vehicle debt financings
• 4.5x net non-vehicle debt/LTM adj. corporate EBITDA;
Targeting 3.5x or below at YE’16
Corporate Liquidity at June 30, 2016

12
Improved Debt Maturity Profile
HGH 3/31/2016 Non-Vehicle Debt Maturity Stack 1
($ in millions)
$1,250
$700 $500 $500 $950
$2,056
$1,903
2017 2018 2019 2020 2021 2022 2023
Senior NotesTerm LoansUndrawn ABL
Pro Forma 6/30/2016 Hertz Global Non-Vehicle Debt Maturity Stack 2
($ in millions)
$1,250 $700 $500 $500 $700
$250
$1,700
2017 2018 2019 2020 2021 2022 2023
Senior NotesTerm LoansUndrawn RCF
1.Excludes $27 million of Promissory Notes due 2028 and $63 million of other debt 2.Pro forma for the retirement of $700 million of the existing 7.5% Senior Notes called on 7/8/16. Excludes $27 million of Promissory Notes due in 2028.

13
OUTLOOK

14
FY:2016 Financial Guidance
FY:2016 assumptions include:
• U.S. RAC residual decline of ~2.5%
• $350M incremental consolidated cost savings
• Consolidated 37% effective tax rate
• 85M weighted average shares outstanding
FY:2016 Guidance
Adjusted Corporate EBITDA $850M - $950M
Non-vehicle capital expenditures, net $125M – $150M
Non-Vehicle cash interest expense $280M – $290M
Cash income taxes $100M – $125M
Free cash flow $500M – $600M
U.S. RAC net depreciation per unit per month $290 - $300
U.S. RAC fleet capacity growth (2.0)% to (3.0)%
U.S. RAC revenue growth --% to (1.5)%
Adjusted earnings per share $2.75-$3.50

15
Reconciling Items
1st Half Items = ~$70 million
($20)M Unanticipated International insurance charge
(25)M Stranded costs that are no longer allocated
(10)M Strategic Investments
(10)M 2Q U.S. RAC vehicle recall (~1% to June capacity) and storm damage
(5)M FX
2nd Half Risks
- International RAC slower growth vs. original expectations due to recent terrorist attacks
- 3Q U.S. RAC vehicle recall (~1% to July capacity)
- US RAC pricing – continued improvement albeit at a slower rate than originally expected
FY:2016 Adjusted Corporate EBITDA Guidance Walk
16
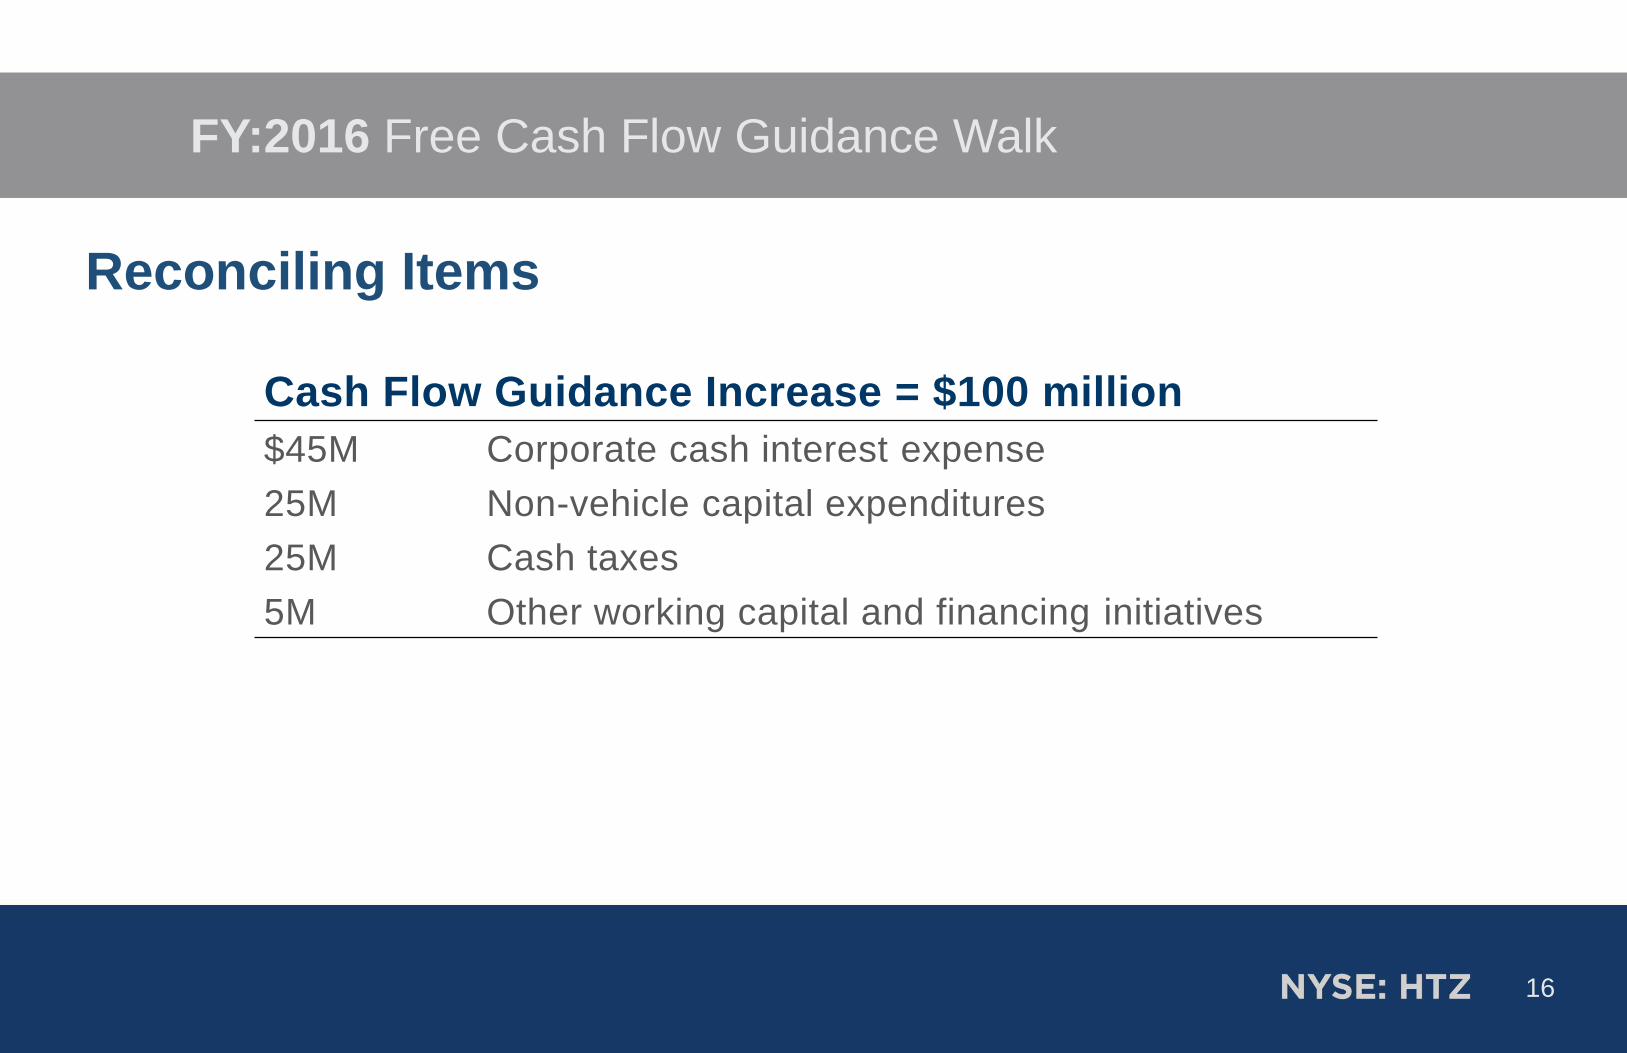
Reconciling Items
Cash Flow Guidance Increase = $100 million
$45M Corporate cash interest expense
25M Non-vehicle capital expenditures
25M Cash taxes
5M Other working capital and financing initiatives
FY:2016 Free Cash Flow Guidance Walk

17
Q&A