Embed Size (px)
Citation preview

1
15 - Radio vs TV FACT: A report from ad agency RPA says repeats only average 43% of the original episodes' C3 ratings (commercial ratings plus three days of DVR playback) among 18-49 viewers
August 26, 2012 10:33 pm
TV ad campaigns fail to reach audiences By Emily Steel in New York Nationwide US television advertising campaigns are failing to reach a large portion of their target audiences, according to new research based on TV viewing data. Using figures from Nielsen and Kantar Media, ad targeting company Simulmedia has found that in many cases as many as three-‐quarters of marketers’ TV ad impressions are viewed by just 20 per cent of their target audiences. According to its report, Unilever’s $6.3m TV ad campaign for its Axe body spray was not seen by 60 per cent of the 18 to 24-‐year-‐olds it was intended to reach in March this year.Similarly, Progressive Insurance spent $31.9m on television ads in June, but a fifth of all adults older than 20 did not watch any of its TV ads that month. Similar patterns were observed during ad campaigns run by several of the largest advertisers in the US. In spite of the fragmentation of audiences across new media, TV ad spending remains the bulk of many companies’ marketing budgets. US advertisers are expected to allocate 42.2 per cent of their total spending – $64bn – to TV ads this year, an increase on the 39 per cent share five years ago, according to WPP’s GroupM. But the new research provides further evidence of the long-‐ suspected shortcomings of TV as a medium for reaching broad audiences – which is likely to have ramifications for budget allocations across the media business.“When you are sitting fat and happy, there is not a lot of impetus to make a change,” said David Cohen, global chief media officer at Interpublic’s Universal McCann, whose clients include Coca-‐Cola, MasterCard, Sony and Microsoft. “But I am fairly certain that whether we like it or not, the horse is out of the stable.” Wenda Millard, president at consultancy MediaLink, which works with advertising companies and marketers, including Simulmedia,said: “TV advertising always has been

2
spray and pray. Because we couldn’t do anything about it, we used to laugh. “Now that joke is long over. It’s not funny to waste billions and billions of dollars.” Unilever did not respond to requests for comment, and Progressive declined to comment.
• And Now a Word From Our Sponsors: Please Don’t Pick Up Your iPhone!
• August 30, 2012 at 8:34 am PT
• Sure, your mobile phone is mobile. But you’re quite likely to be using it at home.
• We’ve been seeing evidence that a whole lot of smartphone and tablet usage doesn’t happen on the go, and here’s yet another data point, via ad network Tremor Video.
• This chart shows mobile “ad calls,” which we can use as a rough proxy for mobile Web usage, for three different Tuesdays across June and July. You can see that it peaks in late afternoon, presumably as we’re making post-work or post-school plans, and then again during TV’s primetime.
3
• Which again, syncs with what we’ve been hearing for a while. But if you take a closer look at the way people use their iPhones and Androids during primetime, the data gets even more interesting.
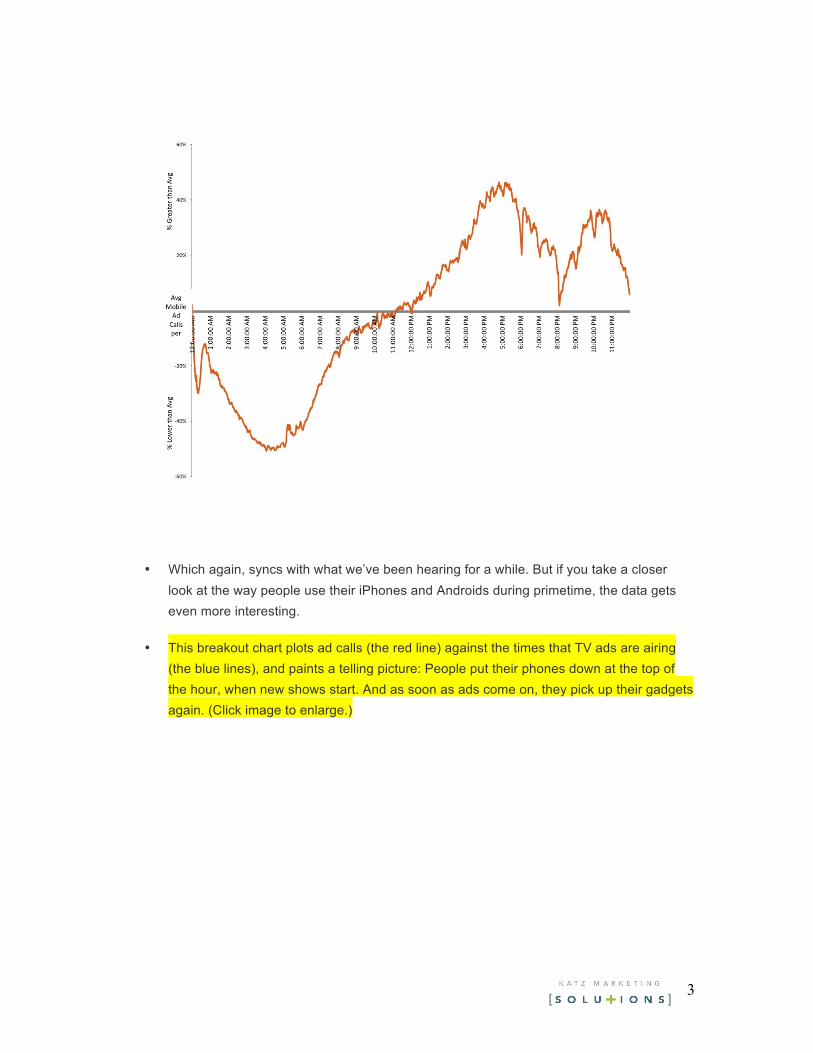
• This breakout chart plots ad calls (the red line) against the times that TV ads are airing (the blue lines), and paints a telling picture: People put their phones down at the top of the hour, when new shows start. And as soon as ads come on, they pick up their gadgets again. (Click image to enlarge.)
4
• And yes, Tremor’s takeaway here — people are tuning out TV ads in favor of the Web — is a self-serving one for a Web ad network to tout. But it certainly seems plausible.
• SEOUL, Korea, Aug 26 (Whowired) -- It is a well-known fact that the sense of
smell is most receptive of the human's five senses. The kinds of smell are reported to
be as many as 2,000 to 4,000.
•
• Another distinguishing feature of the olfactory sense is that it activates the state-
dependent memory. Whenever you smell something, you immediately recall a
situation in which you experienced the same smell.
•
• The area of business that takes advantage of this is called olfactory marketing or
perfume marketing. One familiar example of this kind is a department store
generously spraying perfume at the entrance so that visitors could feel good and thus
stay longer (and possibly spend more) in the establishment.
•

5
• Lately Samsung Electronics applied for a patent by coming up with a "perfume
smartphone." It can respond to the speaker's voice tone or the utterance of the lover's
name during phone conversation by discharging lovely perfume smell.
•
• Samsung said it is currently developing a TV that releases specific smells depending
on the situation on the screen. For example, it can give off a disinfectant smell when
showing a scene of swimming pool or a turf grass smell on a golf game telecasting.
•
• Sam Kim ([email protected])
By Carl Marcucci on Jul, 17 2012 with Comments 0

6
A report released 7/17 by the Pew Internet & American Life Project shows that more than half of all adult cellphone/smartphone owners interact with friends and surf the Internet on their cellphones while watching TV. Their connected viewing experiences link them to supplemental TV content and help them interact with others who share the same television interests.
Half of all adult cell owners (52%) have used their phones recently for engagement, diversion, or interaction with other people while watching TV. The Pew Research Center’s Internet & American Life Project measured the prevalence of these multi-screen viewing experiences by asking the 88% of American adults who are cell owners whether they had used their phone to engage in several different activities while watching television in the 30 days preceding an April 2012 survey.
They learned:
–38% of cell owners used their phone to keep themselves occupied during commercials or breaks in something they were watching.
–22% of cell owners used their phone to check whether something they heard on television was true or not.
–6% of cell owners used their phone to vote for a reality show contestant.
Three more questions were asked of the 57% of cell owners who download apps, use the internet, or use email on their phones:
–35% of cell owners who use the internet, email or apps on their phone used their phone to visit a website that was mentioned on television (that works out to 20% of all cell owners).
–20% of cell owners who use the internet, email or apps on their phone used their phone to see what other people were saying online about a program they were watching (that works out to 11% of all cell owners).
–19% of cell owners who use the internet, email or apps on their phone used their phone to post their own comments online about a

7
program they were watching (that works out to 11% of all cell owners).
In addition, 29% of cell owners who use text messaging have used their phone recently to exchange text messages with someone else who was watching the same program in a different location (since 79% of cell owners use text messaging, that means that 23% of all mobile users have done this).
Taken together, that works out to 52% of all adult cell owners who are “connected viewers”—meaning they took part in at least one of these activities in the 30 days preceding the survey. Young adults in particular stand out for their embrace of multi-screen viewing experiences, as some 81% of mobile owners ages 18-24 reported using their cell phones during televised programming in the preceding 30 days.
Other demographic differences in “connected viewing” include:
–Cell owners living in households earning $50,000 per year or more are more likely to participate in interactive television experiences than those in households with lower annual incomes, and those with at least some college experience are more likely to do so than those who have not graduated high school.
–African American cell phone owners participate in connected viewing experiences at a somewhat greater rate than their white counterparts (59% vs. 50%), and urban residents are more likely to do so than those living in rural areas.
Along with these demographic differences, smartphone owners use their devices to interact with televised content at far higher rates than owners of more basic cell phones. Fully 74% of smartphone owners reported using their devices in one way or another while watching television in the preceding 30 days, compared with 27% of non-smartphone owners.
The use of cell phones as a “distraction device” or multitasking tool during programming breaks is the most prevalent of the seven individual connected viewing behaviors that they measured in their survey. Some 38% of adult cell owners reported using their mobile

8
device to keep themselves occupied during commercials or other breaks in a program they were watching within the last 30 days.
Young adults are especially likely to use their mobile phones to keep themselves occupied while watching television, as nearly three quarters of all cell owners ages 18-24 (73%) used their cell phone in this manner recently. But while this behavior is especially common among the youngest cell owners, a majority of 25-34 year olds and just under half of those in their mid-30s to mid-40s have done this recently.
Outside of these age differences, most cell owners are equally likely to use their phones for “distracted viewing” regardless of demographic characteristics. Educational background is a modest exception to this rule, as mobile users with at least some college experience are somewhat more likely to use their phone as a distraction device compared with those who have not attended college (42% vs. 34%).
Cell phones allow viewers to engage more deeply with televised content by letting viewers seek out additional information or commentary about programming that interests them. This includes activities such as using one’s mobile device to visit a website mentioned on television (20% of cell owners have done this recently), checking whether televised statements are true or not (22%), or going online to read the opinions of others watching the same program (11%).
Overall, 32% of cell owners used their mobile devices in the 30 days preceding the survey for one or more of these reasons, and cell owners under the age of 25 have high levels of engagement in each of these activities. At the same time, using one’s cell phone to visit a website mentioned during televised programming is relatively common with older cell owners as well—engagement in this behavior does not drop significantly until approximately age 45.
Non-white cell phone owners also stand out when it comes to using their phones to engage more deeply with information they have seen on television. African-American cell owners are especially likely to say that they have used their phone recently to see what others are

9
saying online about a program they are watching (28% of African-American cell owners have done this recently, compared with 8% of whites and 12% of Latinos). And both black and Latino cell owners are more likely than whites to have recently used their phone to fact-check something they heard on-air. Some 33% of African American cell owners and 30% of Latinos have done this in the preceding 30 days, compared to 19% of whites.
Multi-screen experiences also allow audience members to connect directly with programming content—and to others who are interested in the same content. In the survey they examined three of these interactive behaviors: texting someone else watching the same program in a different location (23% of cell owners have done this in the last 30 days), posting one’s own comments online about a program (11% of cell owners have done this recently) and voting for a contestant on a reality show (6% of cell owners have done this).
As they saw with the other connected viewing experiences discussed above, younger cell owners are more likely than their elders to engage with others around televised content. This is especially true for posting one’s comments online and for sharing text messages with others watching the same program—for each of these activities, the youngest cell owners (those ages 18-24) stand out even compared with those just a few years older.
Similarly, African American cell owners are more likely than whites or Hispanics to exchange text messages with others about a program they are watching (35% of black cell owners have done this recently, compared with 24% of Latinos and 21% of whites) and are more than twice as likely as other groups to post their own comments online about a program they are watching (25% of black cell owners, 10% of Latinos and 8% of whites have done this).
While women and men are equally likely to be connected viewers overall, female cell owners are slightly more likely than men to engage in individual activities such as sharing text messages with others during televised programming (25% vs. 21%), posting their own comments online about a show they are watching (13% vs. 9%) and voting for a contestant on a reality show (8% vs. 4%).

10
So why is confidence in TV news at an all-time low? Here’s Gallup’s answer:
It is not clear precisely why Americans soured so much on television news this year compared with last. Americans’ negativity likely reflects the continuation of a broader trend that appeared to enjoy only a brief respite last year. Americans have grown more negative about the media in recent years, as they have about many other U.S. institutions and the direction of the country in general.
Americans’ confidence in television news is at a new low by one percentage point, with 21% of adults expressing a great deal or quite a lot of confidence in it. This marks a decline from 27% last year and from 46% when Gallup started tracking confidence in TV news in 1993.
Among 16 U.S. institutions tested, television news ranks 11th, following newspapers in 10th place. The 25% of adults who express a great deal or quite a lot of confidence in newspapers is down slightly from 28% last year. Confidence in newspapers is now half of what it was at its peak of 51% in 1979.

11
A lot of money for a Super Bowl Ad that few recall the advertiser
One week after the game On February 12th , Nielsen asked “Did you see the Super Bowl commercial....
• where Matthew Broderick was acting like Ferris Bueller?”
• where Elton John dressed like a king?”• that included Jerry Seinfeld, the Soup Nazi and Jay Leno?”
• that featured Clint Eastwood?”• that featured vampires having a party around a campfire?”

12
0%
10%
20%
30%
40%
50%
60%
70%
80%
90%
100%
80%
66%63%
60%
51%
32%
41%
20%25%
17%
Recall Seeing the Commercial
Recall the Brand Name
TV TV commercial where Matthew Broderick was acting like Ferris Bueller? (Honda)
TV commercial where Elton John dressed like a king?(Pepsi
TV commercial that featured Jerry Seinfeld, The Soup Nazi and Jay Leno?
(Acura)
TV commercial that featured
Clint Eastwood? (Chrysler)
TV commercial that featured
vampires having a party around a
campfire?(Audi)
Source Nielsen Entertainment Television, February 2012
Although The Spots Were Viewed and Recalled, The Brands Largely Weren’t
Among viewers 18-‐54 years old who said they watched Super Bowl XLVI
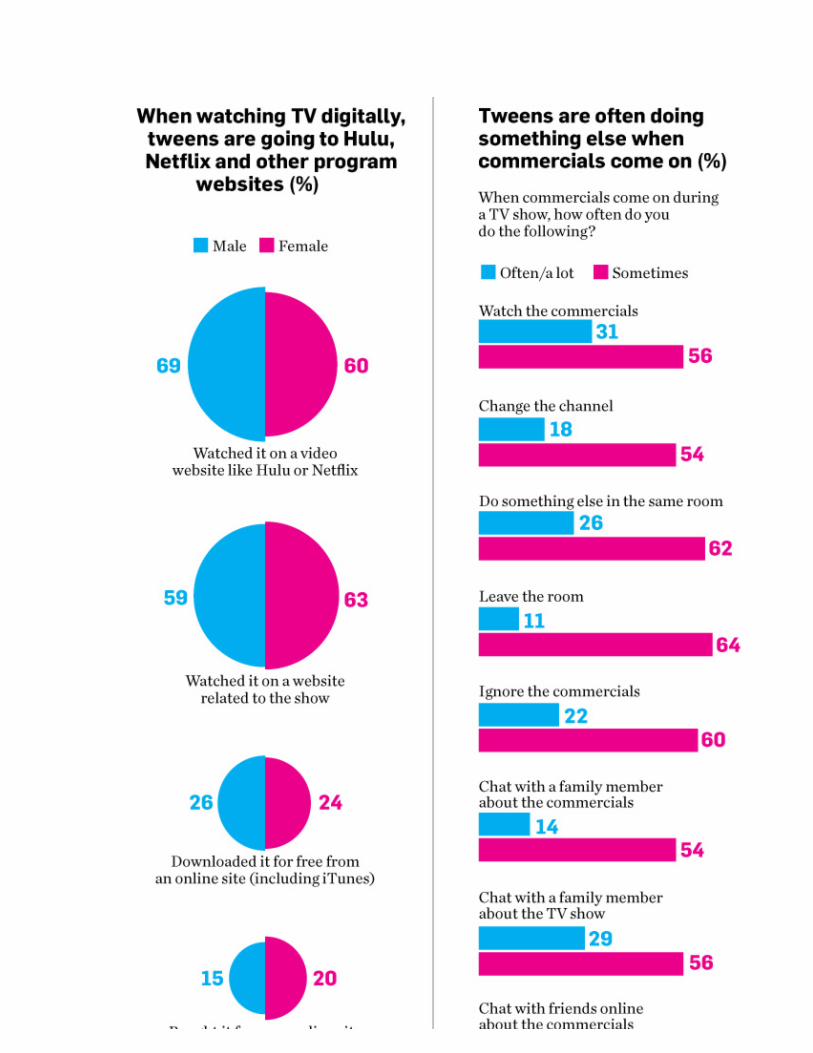
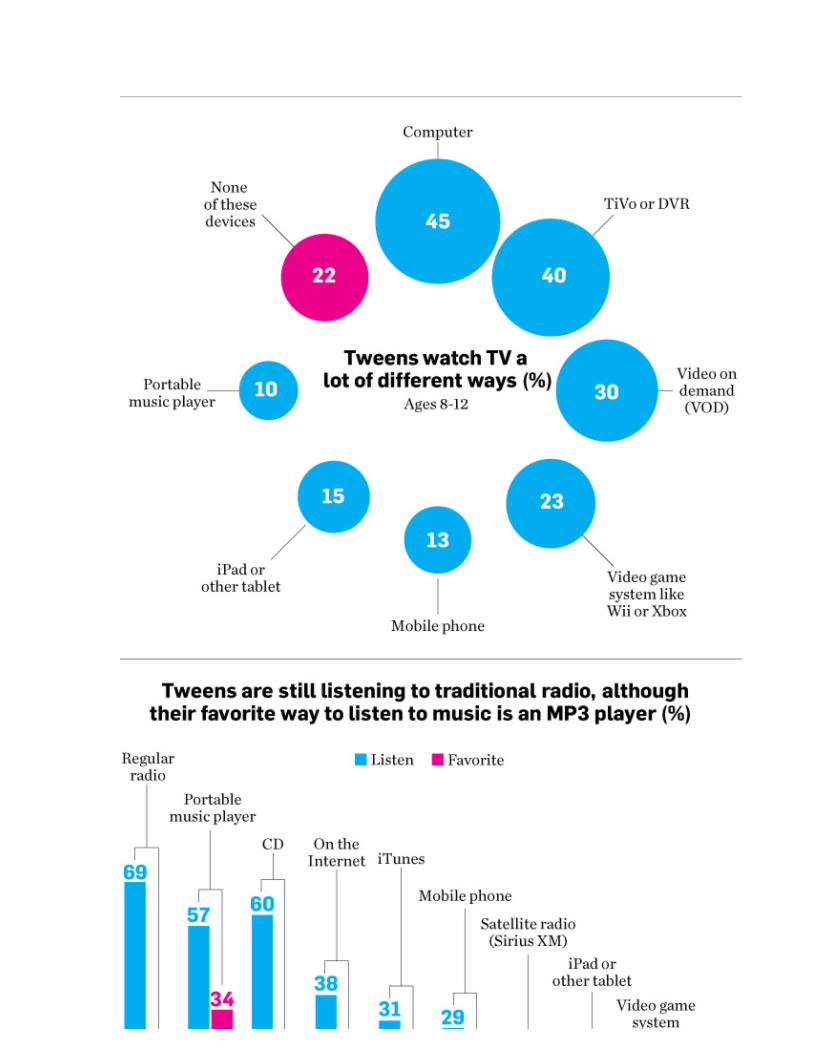
The information below is from Mindshare’s Tween study May/June 2012. It provides some insight as to how Tweens behave while watching TV.
13
14

15
Per Nielsen ratings data, cable deliveries are on a decade-long upward trajectory, and while growth has slowed in recent years, it has not seized up altogether. As it stands now, just a week before the second quarter of 2012 comes to a close, cable is on track to command 70 percent of TV’s total adults 18-49 GRPs in prime time.
That marks a tiny uptick from Q2 2011, when the cable networks accounted for 68 percent of all prime-time viewing, but it’s a significant leap from five years ago, when share hovered at around 61 percent.
In a show of obverse symmetry, broadcast continues its downward course. Ten years ago, the Big Four laid claim to 46 percent of all nightly GRPs; this year broadcast’s Q2 share is projected to fall to 30 percent.
A look under the hood at the individual broadcast networks presents a haves and have-nots landscape. In Q2 2002, NBC was TV’s top banana, averaging a 4.4 rating in the coveted 18-49 demo. Since then, NBC has plummeted 57 percent in the demo, closing out the quarter with an average nightly rating of 1.9.
CBS dropped from a 3.1 in Q2 2002 to a 2.1 (a difference of 32 percent), while Fox’s deterioration has been more gradual—3.0 to a 2.5, a drop of 17 percent. ABC over the course of the last 11 years has declined 19 percent, from a 2.7 to a 2.2 rating.
Full-season trends are largely analogous, as cable closed out the 2011-12 campaign with 65 percent of the prime-time GRPs, while broadcast commanded 35 percent. Cable first overtook the Big Four during the 2003-04 season, when it drew 51 percent of the demo to the networks’ combined 49 percent share.
6/12 Halfway To Oblivion - Or Salvation? by Bob Garfield

16
Halfway to oblivion, are we?
Or to salvation? You be the judge. Seven years ago, amid flying spittle and other signs of deep agitation, a notorious crank predicted the end of network television by 2020. Audience hyper-fragmentation, DVR ad avoidance, online competition and the immutable law of supply and demand were conspiring, this guy claimed, to undermine broadcast’s business model.
These were obviously the ravings of a lunatic -- one too irrational to comprehend that the society and the culture simply cannot live without CBS, NBC, Fox, ABC and CW. They are so much a part of our lives --- and our habits, and our memories, and our cultural iconography –- how could they possibly disappear? When the man in the tinfoil hat replied that desire for the status quo has nothing to do with economic viability, people just rolled their eyes. Or edged away in discomfort.
One of them was David Poltrack, head of research for CBS, who dismissed the notion on the grounds that -– duh -– network TV is too big to fail.
“If, in fact, that current system deteriorates to the point that advertisers and marketers abandon it,” he was quoted as saying in 2005, “I don't see anything that's going to replace it in the entire marketing infrastructure of the country, and the economy is going to be diminished, and that's a lot bigger problem than just a network television problem.”
Precisely -- which is why the crackpot vision was too apocalyptic to be taken seriously. I remember this all vividly, because the crackpot is me. Now seven years have elapsed since I first articulated The Chaos Scenario. Let’s just see how insanely wrong I was.
Back in 2005, the major networks’ audience had been shrinking for a decade to a mere 16.5% of TV households in prime time. That’s for all five of the nets put together. Seven years later the aggregate rating is down to an optimistic 13.5% -- optimistic because that number includes DVR time-shifters, who skip past commercials. For advertisers, those viewers may as well not exist. Removing them

17
from the ratings, only 11.5% of households are watching network shows live in prime time. The other 88.5% are doing something else.
Oh, and the number of TV households itself declined last year for the first time in two decades. In the most recent Nielsen numbers, HUT was down by a million despite overall population growth. Oh, and in the first quarter of 2012, NBC -- despite a Super Bowl bonanza -- showed an operating loss. Oh, and ubiquitous, low-budget singing and dancing competitions –- the programs that have kept the nets afloat because of relatively large audiences and relatively low production budgets -- are showing alarming signs of fatigue. Both Fox’s "American Idol" and ABC’s "Dancing with the Stars" scored their lowest-ever ratings in their season finales.
And after the public finally loses interest altogether, there is nothing cheaper to replace the talent shows with. The only remaining step down is security-cam feeds.
So, one might ask, with all of the key metrics trending catastrophically downward, how have the Big 5 managed to keep the lights on till now? Can it just be the cheapo programming?
No, it’s the cheapo programming combined with what I call the Chaos Alphabet: desperate CMOs buying GRPs at insanely inflated CPMs because if you’re an advertiser who craves reach you are otherwise SOL. In the economics of scarcity -- and what economics aren’t? -- the scarce commodity has become mass itself. The disappointing 17.8 million viewers "Dancing With the Stars" earned for its two-hour finale still won the broadcast ratings week. So CMOs are still lining up at the TV upfronts with wads of cash and saying, “Please gouge me” -- in the same way motorists are willing to pay $10/gallon at the last gas station before Death Valley. To some brands, even the incredibly expensive Incredible Shrinking Mass Audience is better than no mass audience at all. TV fragmentation has made them crazy.
The obvious beneficiary of all this disarray should be the Internet, and sure enough, its share of the advertising pie continues to grow. There was even an online Newfront market this spring, which could be a sign that online programming can now sit at the grown-up's table. The nets are, of course, trying to become a part of the online ecosystem,

18
like the buggy-whip manufacturer investing in the nascent driving-goggles industry.
But will the eventual integration of the Big 5’s infrastructures and the online platform create the hybrid that saves everybody?
Mind you, I’m a certified Cassandra, but I can’t see how. . CBS, ABC, NBC, CW and Fox will lose audience share to the Web at a much faster pace than they’ll gain revenue from it -- because as an advertising medium, not to put too fine a point on it, the Internet sucks. It disrupts the status quo without -- apart from search -- offering any reasonable platform for advertisers, or any promising model for profit.
So now what? Till now, the networks have dodged the bullets that have shredded newspapers, magazines, book publishing, the recording industry and Hollywood. Will they finally be mowed down in the fusillade? The Chaos Scenario imagines the end of broadcast as we know it by the year 2020. I’d be curious to hear alternate scenarios, but at least on my calendar, we are halfway there.
5/12 Zap! New DVR Wipes Out Ads
By Adding 'Auto Hop' Feature, Dish Network Spoils for Fight With Broadcasters
Commercial-free prime-time shows—the Holy Grail of TV watchers—has come to Dish Network Corp. DISH +1.72%
And it's likely to wreak holy havoc.
On Thursday, the satellite-TV operator began offering its customers a DVR feature that allows viewers to completely avoid commercials—rather than just fast-forward through ads, as the old model digital-video recorders do.
The new "Auto Hop" feature comes on a DVR dubbed the "Hopper," a device that has been available to subscribers since March. With Auto Hop, viewers see a black screen momentarily where the ads

19
were broadcast, or a glimpse of the first frame of the first commercial. Then the show resumes. Consumers merely have to click an on-screen Auto Hop button before a show to enable the feature.
"You can put down your remote control" and not see an ad again for the entire show, said Vivek Khemka, vice president of Dish product management.
The "Hopper" DVR costs Dish subscribers $10 a month in addition to a $99 upfront fee. Dish also offers a less-expensive traditional DVR with no upfront charge and a $6 monthly fee. The "Hopper" is made by Echostar Corp., SATS +0.21%which like Dish is controlled by satellite-TV pioneer Charlie Ergen.
The notion that viewers won't see even a whirr of fast-forwarded ads threatens billions of dollars in broadcast television advertising—and risks the ire of the networks.
"There has been a problem with ad skipping and this is just making it worse," said Tracey Scheppach, innovations director at Starcom MediaVest, a media-buying firm owned by Publicis Groupe SA.
Facial Coding Facial coding, the study of the physical expression of emotions, is considered such a reliable tool that the CIA and FBI regularly uses it.
The Facial Action Coding System (FACS), developed by sociologist Paul Ekman in the 1960s, breaks facial expressions down into 23 specific action units and is based on a widely accepted and simple premise -- emotions impact facial behavior.
The face's 43 facial muscles work in conjunction with each other to produce the seven core emotions universally recognized: happiness, surprise, sadness, fear, anger, disgust and contempt.
Over the past 10 years, Sensory Logic has analyzed more than 2,500 radio subjects and over 3,750 TV subjects. To qualify as "engaged," at least one of the 23 facial action units had to be observed concurrently by two subjects while viewing or listening to the

20
commercial. Nonintrusive webcams recorded the reactions. The results are below:
No. of
Commercials Tested
Average Sample
Size Engagement
Television 75+ 50 40% Radio 50+ 50 46%
Source: Sensory Logic, 2010.
Sensory Logic has also determined that the sound of a child’s voice increases positive emotions (+45%) and engagement (+14%).
These results above are consistent with the findings of a Gallup & Robinson study published in July 2007. Gallup's study focused on the biometric technique, facial electromyography, which was developed at the Johns Hopkins School of Medicine. Facial electromyography focuses on two facial muscles: the Zygomatic muscle, the smile muscle and the Corrugator muscle, the frowning muscle. Gallup evaluated 16 pairs of radio and TV commercials by embedding them in actual programming in a lab designed to simulate a living room. As with the Sensory Logic results mentioned above, the radio commercials generated emotional impact equal to their TV counterparts:

21
Source: Gallup & Robinson.

22
…Much More Cost Effectively
A18-49 CC Lineup Hit TV ShowCost $650,000 $657,000# of Spots 13 1Gross Impressions 51,143,600 8,684,000Cume Impressions 27,129,900 8,684,000Frequency 1.9 1CPM $12.70 $75.65
CCM+E Delivers Approximately 6x The Gross Impressions And Almost 3x The Reach For The
Same Expenditure
Source: Nielsen Television Index household and persons cost per point report February 2012. Fall 2011 NRD Arbitron.
1

23
The following info was taken from the 20011 MRI. Radio easily outperforms TV
CONFIDENTIAL – NOT TO BE DISTRIBUTED All content is intellectual property of Clear Channel Communications.
Radio Even Engages The Most Influential Consumers, Who Wield Great Buying Power in the U.S.
Category Influentials
Radio usage vs. average adult
TV usage vs. average adult
Automobiles + 24% -‐ 9%
Business + 20% -‐ 19%
Beer + 19% -‐ 18%
Beauty + 16% -‐ 24%
Business travel + 16% -‐ 16%
Politics + 12% -‐ 10%
Mobile phones + 10% -‐ 20%
Source: GfkMRI, Fall 2011 survey; based on 25,167 respondents.
May marks a time of year when advertisers, media agencies and networks crouch to their starting-block positions in anticipation of the start of TV’s upfront marketplace. Like so many years past, thoughts run the gamut from what will be the hottest new programs to which networks or agencies will set the pace for the pricing of national TV commercial inventory during the coming year. The upfront process can be thought of as the ultimate sausage-making machine with as much as 65%-80% of the ingredients (one year’s TV inventory) being squeezed through for sale over the course of a six-week period. As this annual event unfolds, it makes sense to reflect on its true purpose: to deliver entertainment to viewers while tendering marketing value for the event’s ultimate underwriter, the advertiser.
For an advertiser, committing millions of dollars to a TV campaign budget is really the final step within a much longer process that

24
involves establishing a budget, understanding the consumer target, producing the commercials, vetting the multitudes of TV network and program offerings, evaluating synergy with non-TV media, planning and scheduling the pacing and spacing of the TV spots, then, finally, executing the plan. So, it seems fitting to think about how well the final TV buy reflects the intentions of all the preparatory steps that came before. In order to get insight into the process, let’s first take a look at the dynamics of TV audience fragmentation and its potential for enabling the targeting of a diverse U.S. population. We will then follow this with a view on the quality and impact of steps taken in today’s advertising/media planning process that lead up to the actual placement of millions of commercial spots for advertisers.
The Big Bang of TV Fragmentation
Media audience fragmentation has been a fact of life for nearly three decades. Even before the internet spawned millions of sites, social networks, search engines and blogs, a big bang of media choice was in the making. This explosion in media options manifested itself in the proliferation of TV outlets, magazine titles, radio stations and newspapers, catering to the quilt work of changing consumer tastes within a quickly diversifying U.S. population.
Focusing on TV, the seminal move towards audience fragmentation occurred in the late 1970s when cable and satellite operators presented an alternative to over-the-air TV. The wide-bandwidth transmission technology of these then-emerging platforms made it possible to provide viewers with a multitude of channels, more than they could ever receive through rabbit-ears or rooftop antennae. Premium movie networks like HBO appeared on the scene as well as a dozen or so ad-supported networks like ESPN, USA, TBS, A&E and Lifetime. Today, this forty-year-old foothold of fragmentation has morphed into smithereens of options as there are literally hundreds of networks available for those who want to watch only sports, only news, only pop entertainment, only investment advice, etc. in one sitting.
TV Fragmentation: Friend or Foe? TV audience fragmentation can be viewed as both an opportunity and a challenge when evaluating on which networks and shows to place advertising. On the plus side,

25
advertisers have the potential to tailor communications to specific consumer segments that reflect the ever-expanding variety of lifestyles, product consumption patterns and cultural denominations that make up the population. For example, they can run commercials for golf clubs on the Golf Network, for marinades on the Food Network and vacation packages on the Travel Network. But what happens when they want to find viewers of this TV fare, or others like them, on other channels/programs? The reality is that they don’t watch just the Golf, Food or Travel networks. Or how about advertising a product like laundry detergent or toothpaste, where everyone could presumably be the target audience? In this case, how can audience fragments be amassed during the media placement process in such a way to make up the most meaningful prospective group of viewers for brands? And how can advertisers be assured that there is enough commercial weight against their target to have impact?
To gain full insight into the question of how well current industry TV placement practices address TV audience fragmentation, we need to examine the process of translating TV media plan goals into the actual purchase of specific networks and programs to support the campaign. In other words, how well do the TV programs on the ad schedule deliver the target audience in terms of descriptive match and communication weight?
Understanding who the target consumer is and what he/she watches on TV is a first critical step in this process. Today, many advertisers and their agencies conduct surveys and/or trawl customer data bases to produce rich psychographic and demographic descriptions of their consumer targets. Maintaining the integrity of these consumer target profiles from the first step in the planning stage all the way to the purchase of TV commercials, however, has been a long-standing industry challenge for a number of reasons. The obstacles lie in three key areas: TV audience data limitations, setting realistic effectiveness goals and program bundling in the TV buy.
1. TV Audience Data Limitations -Today’s TV audience data is weighed down by two critical shortcomings:

26
a. Weak link between consumer targets and viewing data – The often elaborate target audience descriptors and insights developed by advertisers are subject to a laundering process by the time they reach the TV buyer’s desk . Media planners attempt to replicate the advertiser target with MRI or Simmons to develop planning targets which are not directly linkable to the TV viewing data deployed to transact the TV buy. Instead, buying targets, simplified offshoots of the planning targets, serve as a proxy for target audience delivery. These age/sex demographic targets are still dominant means of transacting TV buys despite all the advances made in consumer research and data base mining.
b. Lack of reporting granularity – Sample sizes of today’s TV measurement panels often cannot support the capture and reporting of the bulk of fragmented TV viewing. So reporting for even basic demographic targets is limited to higher-rated programs and networks while audiences of other outlets either are obscured within the confines of weekly or monthly ratings averages or altogether absent. This granularity gap is critical, for example, to advertisers with day-of-week strategies like a retailer with a one-day Friday sale looking to run promotional ads during the Wednesday and Thursday before the

27
event. There are likely to be networks, programs and time periods where no reportable ratings are available during these specific days, particularly within daytime and late night when viewing activity is lower which means missed advertising opportunities. This is especially true for smaller targets like teens or women 18-24.
2. Setting Effectiveness Goals
Media planners own the important role of setting campaign ad effectiveness goals to ensure there is sufficient advertising weight to make a positive ripple in brand awareness, purchase intent, sales, maintenance of market share, etc. Very simply, effective frequency planning works on the principle that too much advertising is overkill and too little ineffective, an extreme on either end of this spectrum is wasteful. But a close examination of ad exposure frequency for typical TV campaigns demonstrates a very strong tendency to do just that – over saturate some viewers while only lightly touching others. Chart B demonstrates this lopsided audience delivery of Adult 18-49 viewers for a T-Mobile campaign: nearly 80% of ad impressions reached only 40% of the target. And it is also current practice to focus only on the ad frequency of those reached by the campaign, ignoring (albeit not deliberately) a healthy portion of consumer targets that are missed by TV schedules.

28
If we drill further down into this target audience saturation scenario, we find another layer of imbalance in TV delivery: lighter, more upscale viewers are in short supply. Chart C shows that viewers with household income less than $50K have the opportunity to see twice as many T-Mobile commercials compared to people in the $100K+ category. For example, the heaviest lower-income viewers were privy to 22 commercials compared to 13 for the heaviest upscale group. The same relationship is true for lighter viewers in both income segments, where the lower-income segment was exposed to three ads compared to 1 for the $100K+ group.
So far we’ve seen how a target audience transforms into a broader definition and the challenge of meeting effective communications goals when scheduling the TV buy. Now, let’s look at the final step in the process: executing the TV buy.
3. CPM and Inventory Bundling
When TV buyers go to market they are armed with a buying target and a CPM goal to secure a specified number of gross ratings points

29
(GRPs) to drive a client’s business. If the media agency has done its homework, there is also a list of preferred TV programs/genres identified during the planning process that the buyer is instructed to focus on if the program inventory price is right. On the network/station side, account execs are directed to sell all inventory, including commercials in programs for which there is lower demand; in general, they almost always bundle premium-priced inventory with lower-tier, less expensive supply. The hypothetical example in Chart D demonstrates the swing in CPM by program tiers to buy 1,000 GRPs. To meet the CPM goal of $18.00 and also secure premium shows for the campaign, the buyer must include middle- and lower-tiered programming. Both parties walk away with some value from the transaction: sellers unload less desirable inventory and buyers secure programs that meet buying target GRP requirements while achieving the $18.00 CPM goal.
The bundling trade-off focuses primarily on marketplace supply and demand using buying-target CPMs as the currency of exchange. So at the end of the TV advertising placement process, the reality of a CPM-driven world and the forces of the TV marketplace hold the potential for an advertiser to go further astray from reaching the target audience. At this point the TV buyer is concerned about meeting the CPM target, quite possibly at the expense of delivering the viewers who are in the planning target.

30
–Gerard Broussard is a media research/analytic industry veteran whose background includes CBS Television Network, Ogilvy, MediaEdge, GroupM and, most recently Canoe Ventures.
Multiscreen Viewing Up, Ad Reception Mixed by Wayne Friedman, Yesterday, 11:09 AM
While traditional ‘lean-back’ TV may be strong among U.S. viewers, a growing number of consumers have interest in -- or have already adopted -- multiscreen smaller device habits.
A new 2012 survey found that 57% of people are interested in multiscreen video services, up from 48% in 2011. The study comes from Toronto-based QuickPlay Media, a provider of video to IP-connected devices.
Another 35% have reported trying a mobile TV and/or video service, with 27% saying they currently use new video services. 43% of current users consume mobile TV and video at least once per week; and 23% have daily usage.
Much of this activity is relatively new: 72% have been mobile TV and video users for a year or less, and 81% say they watch more video on multiscreen devices than a year ago.
But not all advertising messaging is making an impact. Only 20% recall viewing ads on their device while using a mobile TV and/or video service, and 81% say there is a lack of advertising variety.

31
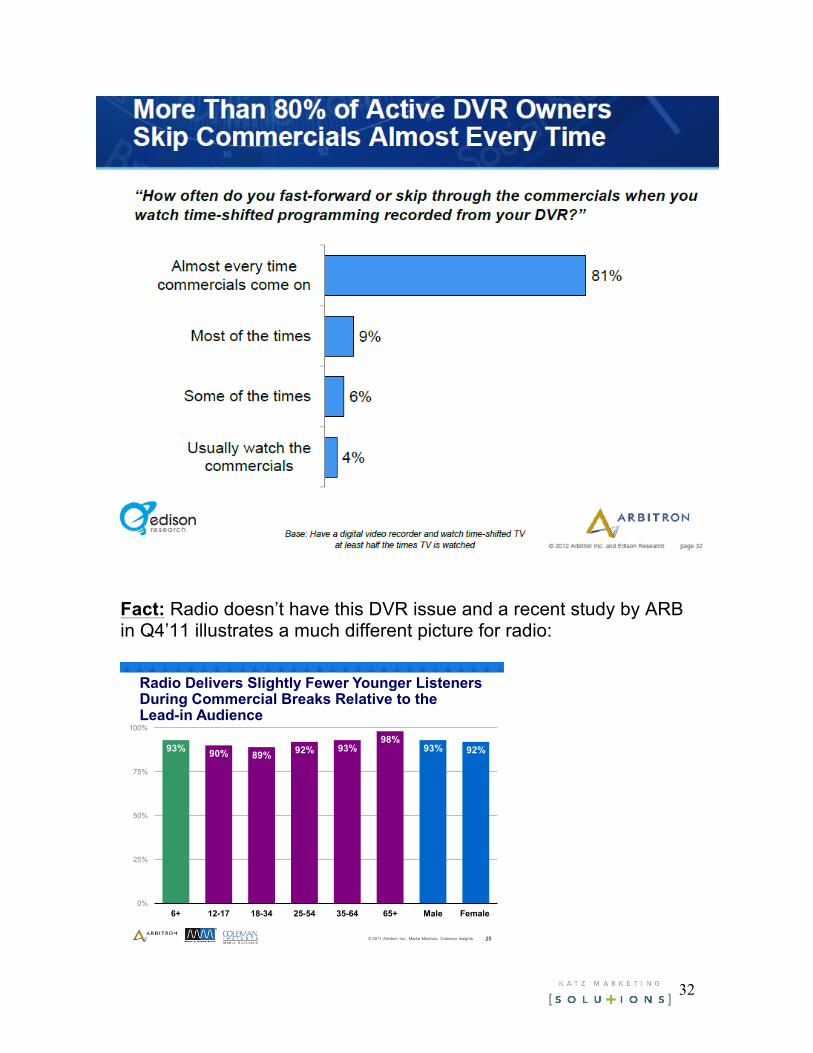
Fact: DVR is presenting TV with a “commercial” problem- increased penetration with vast majority skipping the commercials.
32
Fact: Radio doesn’t have this DVR issue and a recent study by ARB in Q4’11 illustrates a much different picture for radio:
25© 2011 Arbitron Inc., Media Monitors, Coleman Insights
93% 90% 89% 92% 93%98%
93% 92%
0%
25%
50%
75%
100%
6+ 12-17 18-34 25-54 35-64 65+ Male Female
Radio Delivers Slightly Fewer Younger Listeners During Commercial Breaks Relative to the Lead-in Audience
33
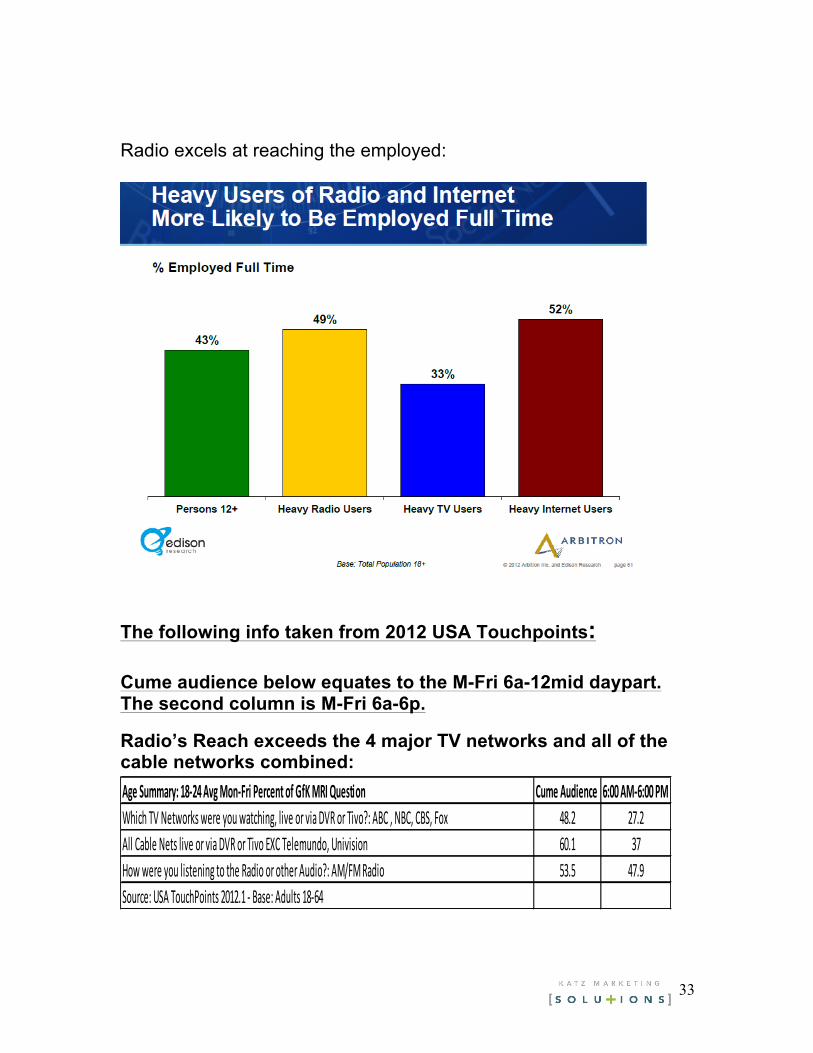
Radio excels at reaching the employed:
The following info taken from 2012 USA Touchpoints: Cume audience below equates to the M-Fri 6a-12mid daypart. The second column is M-Fri 6a-6p.
Radio’s Reach exceeds the 4 major TV networks and all of the cable networks combined: Age Summary: 18-‐24 Avg Mon-‐Fri Percent of GfK MRI Question Cume Audience 6:00 AM-‐ 6:00 PMWhich TV Networks were you watching, live or via DVR or Tivo?: ABC , NBC, CBS, Fox 48.2 27.2All Cable Nets live or via DVR or Tivo EXC Telemundo, Univision 60.1 37How were you listening to the Radio or other Audio?: AM/FM Radio 53.5 47.9Source: USA TouchPoints 2012.1 -‐ Base: Adults 18-‐64

34
Age Summary: 18-‐34 Avg Mon-‐Fri Percent of GfK MRI Question Cume Audience 6:00 AM-‐ 6:00 PMWhich TV Networks were you watching, live or via DVR or Tivo?: ABC , NBC, CBS, Fox 49.9 28.6All Cable Nets live or via DVR or Tivo EXC Telemundo, Univision 57.1 34.3How were you listening to the Radio or other Audio?: AM/FM Radio 55.8 50.7Source: USA TouchPoints 2012.1 -‐ Base: Adults 18-‐64 Age Summary: 25-‐34 Avg Mon-‐Fri Percent of GfK MRI Question Cume Audience 6:00 AM-‐ 6:00 PMWhich TV Networks were you watching, live or via DVR or Tivo?: ABC , NBC, CBS, Fox 51.2 29.5All Cable Nets live or via DVR or Tivo EXC Telemundo, Univision 55 32.3How were you listening to the Radio or other Audio?: AM/FM Radio 57.5 52.8Source: USA TouchPoints 2012.1 -‐ Base: Adults 18-‐64
Age Summary: 35-‐44 Avg Mon-‐Fri Percent of GfK MRI Question Cume Audience 6:00 AM-‐ 6:00 PMWhich TV Networks were you watching, live or via DVR or Tivo?: ABC , NBC, CBS, Fox 63.9 42.1All Cable Nets live or via DVR or Tivo EXC Telemundo, Univision 60.3 36.4How were you listening to the Radio or other Audio?: AM/FM Radio 66 61.3Source: USA TouchPoints 2012.1 -‐ Base: Adults 18-‐64 Age Summary: 45-‐54 Avg Mon-‐Fri Percent of GfK MRI Question Cume Audience 6:00 AM-‐ 6:00 PMWhich TV Networks were you watching, live or via DVR or Tivo?: ABC , NBC, CBS, Fox 69.1 47.1All Cable Nets live or via DVR or Tivo EXC Telemundo, Univision 62.9 38.5How were you listening to the Radio or other Audio?: AM/FM Radio 63.1 58.8Source: USA TouchPoints 2012.1 -‐ Base: Adults 18-‐64 Age Summary: 18-‐49 Avg Mon-‐Fri Percent of GfK MRI Question Cume Audience 6:00 AM-‐ 6:00 PMWhich TV Networks were you watching, live or via DVR or Tivo?: ABC , NBC, CBS, Fox 57.3 35.7All Cable Nets live or via DVR or Tivo EXC Telemundo, Univision 58.8 35.4How were you listening to the Radio or other Audio?: AM/FM Radio 60.4 55.6Source: USA TouchPoints 2012.1 -‐ Base: Adults 18-‐64

35
Age Summary: 25-‐54 Avg Mon-‐Fri Percent of GfK MRI Question Cume Audience 6:00 AM-‐ 6:00 PMWhich TV Networks were you watching, live or via DVR or Tivo?: ABC , NBC, CBS, Fox 61.7 39.9All Cable Nets live or via DVR or Tivo EXC Telemundo, Univision 59.5 35.8How were you listening to the Radio or other Audio?: AM/FM Radio 62.2 57.7Source: USA TouchPoints 2012.1 -‐ Base: Adults 18-‐64 2/12 Embracing comparisons, RAB takes a proactive stance to sell radio to marketers. The Super Bowl was the most-watched event in television history. But for advertisers the game may have been more of a fumble than a marketing touchdown. The Radio Advertising Bureau commissioned Nielsen in a post-Super Bowl study to see just how well those $3.5 million per half-minute television commercials actually worked. The results show that a lot more people remembered the ads than the product being advertised. Nielsen tested five of the most talked about spots — four car commercials and one soft drink spot. An average of 64% of respondents remembered watching the ads. But an average of just 27% remembered which products the spots were actually promoting. In the worst-performing ad, just 17% connected the spot to the brand. The online survey was conducted seven days after the Super Bowl among 500 respondents aged 18-54 who said they had watched the game. The results could be compared to a 2003 study by the Radio Ad Lab which found that a radio spot has 80% of the brand recall of a television commercial — at a fraction of the price. To protect the industry’s relationship with the advertisers, the RAB isn’t making the brands public — all of them currently use radio. because these three electronic reach media are continuing to do quite well even in uncertain times.” Fact: “In this digitally-intoxicated world, we've forgotten to acknowledge that we will always need intrusive media as part of what we do. Even television and web video folks recognize that audio is the most attenuating part of their medium”

36
- Senior Agency Executive, October 2011
1. Reach -‐ complimentary medium: extend reach
2 . Resonance -‐ Offers a less expensive way to extend frequency—Memory maintenance
3. Magnification -‐ offering additional reasons to believe. Have heard it somewhere before response. Communicate complimentary message
Radio provides a media multiplier effect for advertisers…when added to TV campaigns
Television User Groups
% of US adults
Television Avg hrs per
week
RadioAvg hrs per
weekQuintile I & II (Heavy TV users) 40% 52.7 13.1
Quintile III 20% 23.6 13.6Quintile IV &V (Light TV users) 40% 72 min/
day 14.3
Not Everyone is glued to the tube:
40% of Americans watch TV only about 1 hour/day
Source: Gfk MRI, Spring 2011 survey; based on 25,685 respondents.
The light consumers of Internet and television are big fans of broadcast radio. According to research firm GfK MRI's 2011 data, the three lowest-consuming quintiles of Internet usage spend on average

37
2 hours per week online (17 minutes/day), with the lowest two quintiles spending about 6 minutes a day- they listen to radio close to 2 hours/day. The internet is not a dominant part of many people’s lives. These three Internet quintiles tune in to broadcast radio close to 2 hours per day. The lowest quintile of television usage tunes in for only 3.2 hours a week, or about 26 minutes a day. The two lowest viewing quintiles tune in 8.4 hours per week, or a bit more than one hour a day. These same light television viewers listen to radio two hours a day. Not everyone is online and not everyone is glued to the tube.
The two lowest magazine quintiles read 1 issue per month while listening to radio 12.5 hours/week. The lowest two quintiles of newspaper readers read on average less than one issue per month while spending almost 14 hours/week with radio.

38
MEDIA QUINTILE ANALYSISMagazines Newspapers Radio Television Internet
% of U.S. Adults 18+
avg # of issues read in a month
avg # read in a 28-day period
avg # of hours listened to in a
week
avg # of hours viewed in a
week
avg # of hours spent with in a
week
U.S. Adults 18+ 100% Media usage 8.7 12.2 13.7 29.2 11.5
Magazines I (Heaviest users) 20% Media usage 25.9 18.1 16.0 30.9 13.9Indexed to U.S. adult avg 298 148 117 106 121
Magazines II 20% Media usage 10.2 14.0 14.5 28.3 12.6Indexed to U.S. adult avg 118 115 106 97 109
Magazines III 20% Media usage 5.2 11.8 12.9 27.8 12.2Indexed to U.S. adult avg 60 97 94 95 106
Magazines IV 20% Media usage 2.0 9.9 13.0 28.3 10.5Indexed to U.S. adult avg 23 81 95 97 91
Magazines V (Lightest users) 20% Media usage 0.1 7.2 11.9 30.6 8.3Indexed to U.S. adult avg 2 59 87 105 72
Newspaper I (Heaviest users) 20% Media usage 12.2 33.4 13.9 31.6 11.3Indexed to U.S. adult avg 141 275 102 108 99
Newspaper II 20% Media usage 11.0 19.9 14.1 30.9 11.1Indexed to U.S. adult avg 126 163 103 106 97
Newspaper III 20% Media usage 9.1 7.0 14.6 27.7 12.0Indexed to U.S. adult avg 104 58 107 95 105
Newspaper IV 20% Media usage 6.2 0.5 13.2 27.7 11.9Indexed to U.S. adult avg 71 4 97 95 104
Newspaper V (Lightest users) 20% Media usage 5.0 0.0 12.4 27.9 11.1Indexed to U.S. adult avg 58 0 91 96 96
Radio I (Heaviest users) 20% Media usage 10.5 13.0 43.5 28.1 11.9Indexed to U.S. adult avg 120 107 319 96 104
Radio II 20% Media usage 10.0 13.1 14.2 27.8 12.5Indexed to U.S. adult avg 115 108 104 95 109
Radio III 20% Media usage 8.8 12.5 7.1 27.3 12.1Indexed to U.S. adult avg 101 102 52 94 105
Radio IV 20% Media usage 7.8 11.5 3.3 28.8 11.2Indexed to U.S. adult avg 89 94 25 99 98
Radio V (Lightest users) 20% Media usage 6.4 10.9 0.1 33.9 9.7Indexed to U.S. adult avg 74 89 1 116 84
TV I (Heaviest users) 20% Media usage 8.9 13.0 12.0 69.2 10.0Indexed to U.S. adult avg 102 106 88 237 87
TV II 20% Media usage 9.4 13.6 14.2 36.2 11.1Indexed to U.S. adult avg 109 112 104 124 97
TV III 20% Media usage 8.8 12.9 13.6 23.6 11.5Indexed to U.S. adult avg 101 106 100 81 101
TV IV 20% Media usage 8.8 11.6 13.9 13.7 12.1Indexed to U.S. adult avg 101 95 102 47 105
TV V (Lightest users) 20% Media usage 7.5 9.8 14.6 3.2 12.6Indexed to U.S. adult avg 87 80 107 11 110
Internet I (Heaviest users) 20% Media usage 10.4 12.2 14.1 27.4 37.3Indexed to U.S. adult avg 120 100 103 94 325
Internet II 20% Media usage 10.0 13.0 14.0 26.7 14.1Indexed to U.S. adult avg 115 107 103 92 123
Internet III 20% Media usage 9.3 12.8 13.6 25.4 5.3Indexed to U.S. adult avg 107 105 99 87 46
Internet IV 20% Media usage 7.4 11.9 13.9 30.1 0.7Indexed to U.S. adult avg 85 98 102 103 6
Internet V (Lightest users) 20% Media usage 6.3 11.0 12.7 36.3 0.0Indexed to U.S. adult avg 73 90 93 124 0
Source: 2011 Spring GfK MRI

39
0%
10%
20%
30%
40%
50%
60%
70%
80%
90%
100%
5-‐6am
6-‐7am
7-‐8am
8-‐9am
9-‐10am
10-‐11am
11-‐12pm
12-‐1pm
1-‐2pm
2-‐3pm
3-‐4pm
4-‐5pm
5-‐6pm
6-‐7pm
7-‐8pm
8-‐9pm
9-‐10pm
10-‐11pm
Television
Radio
Source: Gfk MRI, Spring 2011 survey; based on 1,247 respondents who are 25-‐54 years old and employed full time
Radio vs. TV – % Share of Usage
Mon – Fri Average
Employed Americans spend more time with Radio than TV from dawn til dusk
Radio accounts for 2/3’s of the combined Radio/TV usage from 5A-‐5P. A radio campaign offers advertisers the opportunity to reach consumers when TV usage is relatively low.

40
Base : AllTarget : Adults 25-‐54 and Employment : working full time
Base Population : 228112 (000)Target Population: 87254(000)Target Sample Size : 1247
Cume Audience Dayparts:
76.36 227,940,650:40 3:26
5am-‐9am 56.96 59,424,970:50 1:12
9am-‐5pm 51.29 123,809,767:20 2:46
5pm-‐12am 32.58 38,192,219:50 1:21
12am-‐5am 3.71 6,513,692:40 2:01
TargetUsers (%)
RADIO
TELEVISION
Daily Media UsageAll Seasons – Average Day :
Mon-‐Fri
Total Hrs-‐MinsSpent
Avg Hrs-‐Mins/Target User
Cume Audience Dayparts:
82.38 291,281,842:10 4:04
5am-‐9am 33.20 29,998,917:30 1:039am-‐5pm 31.49 68,292,487:40 2:305pm-‐12am 76.38 181,518,145:40 2:4412am-‐5am 8.95 114,722,291:20 1:29
TargetUsers (%)
Total Hrs-‐MinsSpent
Avg Hrs-‐Mins/Target User
Source: MediaDay 2011 Single Year (fieldwork 10-‐11/Spring respondents) Weighted by Population (000)

41
Base : AllTarget : Educ: graduated college plus and Employment: working full time and Generations: Millenials (b.1977-‐1994)Base Population : 228112 (000)Target Population: 11601 (000)Target Sample Size : 134
Cume Audience Dayparts:
77.03 26,261,970:40 2:57
5am-‐9am 56.90 5,937,025:40 0:54
9am-‐5pm 53.28 14,024,372:10 2:17
5pm-‐12am 29.36 5,716,226:10 1:41
12am-‐5am 2.29 584,346:40 2:12
TargetUsers (%)
RADIO
TELEVISION
Daily Media UsageAll Seasons – Average Day :
Mon-‐Fri
Total Hrs-‐MinsSpent
Avg Hrs-‐Mins/Target User
TargetUsers (%)
Total Hrs-‐MinsSpent
Avg Hrs-‐Mins/Target User
Source: MediaDay 2011 Single Year (fieldwork 10-‐11/Spring respondents) Weighted by Population (000)
Cume Audience Dayparts:
78.51 33,770,832:10 3:43
5am-‐9am 36.38 4,106,901:40 0:599am-‐5pm 25.94 7,920,388:00 2:385pm-‐12am 74.15 20,592,784:40 2:2412am-‐5am 7.73 1,150,757:50 1:17

42
Base : AllTarget : Educ: graduated college plus and Employment: working full time and Generations: GenXers (b.1965-‐1976)Base Population : 228112 (000)Target Population: 15457(000)Target Sample Size : 240
Cume Audience Dayparts:
82.43 28,957,825:50 2:17
5am-‐9am 62.41 7,274,608:00 0:46
9am-‐5pm 53.44 15,858,335:30 1:56
5pm-‐12am 41.48 5,513,398:30 0:52
12am-‐5am 0.73 311,483:50 2:46
TargetUsers (%)
RADIO
TELEVISION
Daily Media UsageAll Seasons – Average Day :
Mon-‐Fri
Total Hrs-‐MinsSpent
Avg Hrs-‐Mins/Target User
Cume Audience Dayparts:
79.31 43,392,892:30 3:33
5am-‐9am 29.55 4,692,332:20 1:029am-‐5pm 19.58 7,422,837:50 2:285pm-‐12am 78.56 30,169,971:30 2:3012am-‐5am 6.33 1,107,750:50 1:08
TargetUsers (%)
Total Hrs-‐MinsSpent
Avg Hrs-‐Mins/Target User
Source: MediaDay 2011 Single Year (fieldwork 10-‐11/Spring respondents) Weighted by Population (000)

43
Base : AllTarget : Men 25-‐54 and Employment: working full time and HHI $100,000+
Base Population : 228112 (000)Target Population: 15899(000)Target Sample Size : 278
Cume Audience Dayparts:
79.80 47,292,323:50 3:44
5am-‐9am 64.43 12,501,531:00 1:14
9am-‐5pm 49.90 27,836,794:00 3:31
5pm-‐12am 33.62 6,801,585:30 1:17
12am-‐5am 1.90 152,413:20 0:31
TargetUsers (%)
RADIO
TELEVISION
Daily Media UsageAll Seasons – Average Day :
Mon-‐Fri
Total Hrs-‐MinsSpent
Avg Hrs-‐Mins/Target User
TargetUsers (%)
Total Hrs-‐MinsSpent
Avg Hrs-‐Mins/Target User
Source: MediaDay 2011 Single Year (fieldwork 10-‐11/Spring respondents) Weighted by Population (000)
Cume Audience Dayparts:
78.20 47,360,359:10 3:49
5am-‐9am 33.19 5,009,263:30 0:579am-‐5pm 20.27 6,979,731:20 2:105pm-‐12am 73.94 33,503,894:40 2:5212am-‐5am 7.05 1,867,469:40 1:40

44
How did 3,933 A25-‐54 College Educated U.S. Consumers in Pointlogic’s Spring 2011 Consumer Survey rate Radio’s ability to impact message and strategy tasks
compared to TV?
• Radio is a medium of sound and imagination
• TV combines sound and sight…..but at what price “sight”?
• How impactful do you believe a Radio commercial is versus a TV commercial?
– 10%, 20%, 30%, 40%, 50%, 60%, 70%?
– Take your pick and turn the page
….Very closely
Task/Tactic% Respondents Who said Radio
% Respondents who said Television
% Radio Effectiveness vs Television
Communicate Price 57 69 82.6Communicate Fun 46 60 76.7Communicate High Quality 35 52 67.3Communicate Detailed Information 45 59 76.3Communicate Customer Service 37 39 94.9Communicate Taste 28 39 71.8Brand Affinity 33 43 76.7Brand Recommendation 32 34 94.1Generate Awareness 61 87 70.1Generate Consideration 31 40 77.5Generate Trial 42 57 73.7Generate Re-‐purchase 26 38 68.4Generate Advocacy 31 49 63.3Generate Sharing of Information 29 33 87.9
Source: PointLogic’s Chorus Consumer Study, 2011.
To Be Read: 57% responded that Radio is effective at communicating pricing messaging. 69% said TV is effective at communicating pricing messaging

45
Radio’s ability to deliver messaging and strategy tasks parallels TV’s Becomes an even more attractive alternative when cost is considered.
TO BE READ: A25-‐54 WHO WORKED FULL TIME JUDGED RADIO’S ABILITY TO GENERATE CONSIDERATION WAS TO BE 86% OF TV’SRADIO’S ABILITY TO DELIVER PRICING MESSAGING AMONG THE SAME GROUP WAS JUDGED TO BE 90% OF TV’S
A25-‐54 Work Full Time
A25-‐54 HHI $100K+
A25-‐54 College+
A18-‐34 Ate Fast Food Restaurant
4+x/mo.
A18-‐34 Monthly Cell Phone Bill $75+/mo.
A25-‐54 2+ Cars Insured
A25-‐54 Auto Decision Maker
A25-‐64 HHI $150K+
A18-‐49 Attend 2-‐3 Movies/Mo
Tasks Index Index Index Index Index Index Index Index IndexOverall 80 84 81 79 90 87 74 77 104Price 90 102 92 86 94 95 75 98 104Fun 83 76 81 80 87 84 88 70 110High Quality 72 71 69 67 74 71 68 61 91Eco-‐Friendly 77 78 75 68 83 80 63 61 96Detailed Information 81 91 90 82 93 92 63 89 98Customer Service 100 116 104 97 113 108 93 117 133Taste 75 78 69 68 77 69 61 73 93Brand Affinity 83 82 81 73 82 83 69 76 96Brand Recommendation 100 105 100 97 115 109 89 71 123Awareness 75 78 77 72 80 80 71 81 84Consideration 86 96 86 85 90 85 60 92 104Trial 78 78 77 73 82 79 78 73 92Re-‐Purchase 74 76 69 70 77 69 70 54 88Advocacy 68 72 72 68 74 76 65 63 71Share Information 96 95 96 93 100 95 68 91 138Participate 68 68 70 68 75 71 48 65 110
Radio’s reach is a close #2 to Television’s
across numerous marketing targets
Reach TV RadioA25-‐54 Work Fulltime 97 91A25-‐54 HHI $100K+ 97 91A25-‐54 College + 97 88A18-‐34 Ate Fast Food 4+x/month 97 88A18-‐34 Monthly Cell Phone Bill $75+ 96 89A25-‐54 2+ Auto Insurance policies 97 89A25-‐54 Auto Decision Maker 97 94A25-‐64 HHI $150K+ 97 92A18-‐49 2-‐3 Movies/Month 96 89
Source: PointLogic’s Chorus Consumer Study, 2011.

46
Let’s evaluate how radio can enhance a TV-‐only Plan Targeting A25-‐54 who are employed fulltime
• $7,000,000 budget
$7,000,000 Budget: 100% TV
TV only campaign reaches 74% of consumers
Pointlogic Chorus 2011
47
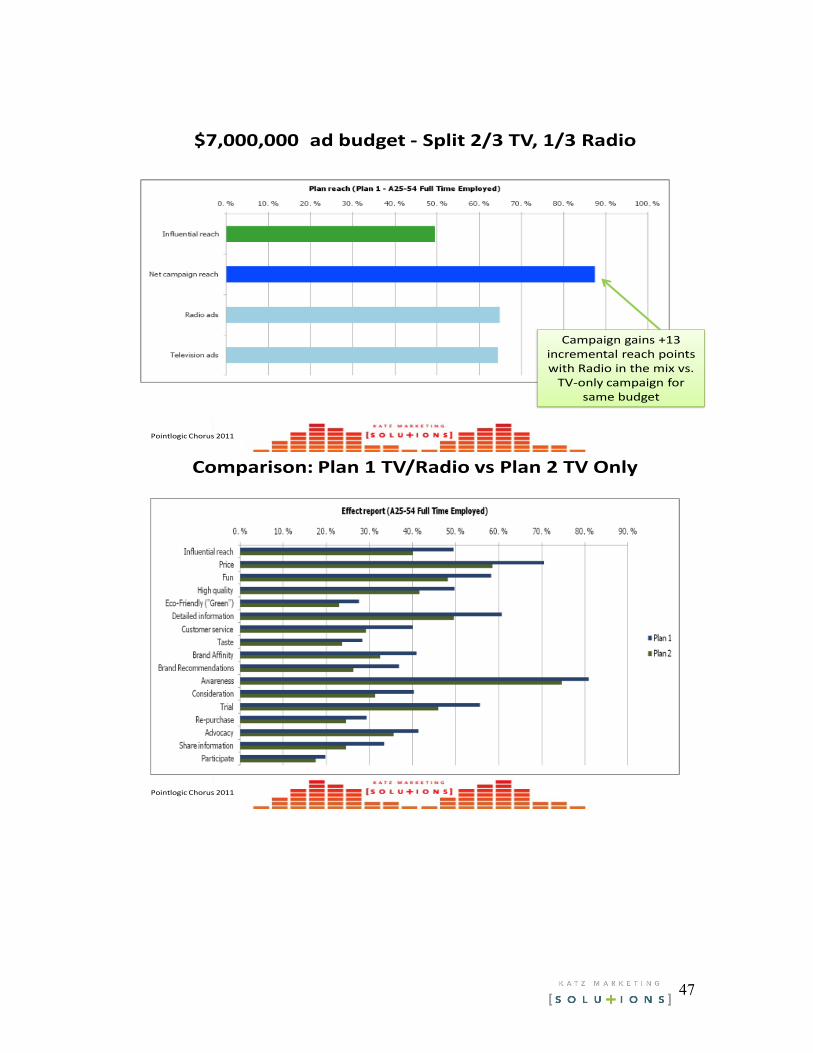
$7,000,000 ad budget -‐ Split 2/3 TV, 1/3 Radio
Campaign gains +13 incremental reach points with Radio in the mix vs. TV-‐only campaign for
same budget
Pointlogic Chorus 2011
Comparison: Plan 1 TV/Radio vs Plan 2 TV Only
Pointlogic Chorus 2011

48
To be Read: If an advertiser wanted to generate “trial and “awareness” of a luxury product Plan 1 (with Radio) was 19.5% more effective in communicating “high quality” and 20.9%
more effective in generating “trial” of the product
Plan 1 W/Radio Plan 2 Without Radio
Per Cent Advantage Plan 1
Influential Reach 49.5 40.1 23.4Price 70.5 58.6 20.3Fun 58.3 48.2 21.0High Quality 49.7 41.6 19.5Detailed Information 60.7 49.6 22.4Customer Service 40 29.2 37.0Taste 28.3 23.6 19.9Brand Affinity 40.9 32.5 25.8Brand Recommendations 36.9 26.3 40.3Awareness 80.9 74.7 8.3Consideration 40.3 31.3 28.8Trial 55.6 46 20.9Re-‐Purchase 29.3 24.6 19.1Advocacy 41.3 35.6 16.0
Pointlogic Chorus 2011
Base : Adults 25-‐54Target : ALL
Base Population : 126854(000)Target Population: 126854(000)Target Sample Size : 29338
Somewhat/Very Focused (%)
% of Gross ImpressionsDayparts:
72.33
6am-‐7pm 71.36
6am-‐10am 74.94
3pm-‐7pm 72.83
RADIO
TELEVISION
Degree of Focus on Media (Percentages)All Seasons – Average Day :
Mon-‐Fri
Source: MediaDay 2011 (fieldwork 10-‐11/Doublebaserespondents) Weighted by Population (000)
Somewhat/Very Focused (%)
% of Gross ImpressionsDayparts:
81.84
6am-‐7pm 81.69
6am-‐10am 79.00
3pm-‐7pm 83.91

49
Base : Adults 25-‐54Target : GEICO
Base Population : 126854(000)Target Population: 10276(000)Target Sample Size : 2397
Somewhat/Very Focused (%)
% of Gross ImpressionsDayparts:
76.60
6am-‐10am 78.23
10am-‐3pm 74.40
3pm-‐7pm 77.21
4pm-‐6pm 75.17
6am-‐8am 81.51
RADIO
TELEVISION
Degree of Focus on Media (Percentages)All Seasons – Average Day : Mon-‐Sun
Source: MediaDay 2011 (fieldwork 10-‐11/Doublebase respondents) Weighted by Population (000)
Somewhat/Very Focused (%)
% of Gross ImpressionsDayparts:
81.20
6am-‐10am 79.64
10am-‐3pm 85.13
3pm-‐7pm 82.01
4pm-‐6pm 80.62
6am-‐8am 70.17
Base : A25-‐54Target : Political Outlook –Usually Think of YourselfAs: Very Liberal
Base Population : 228112(000)Target Population: 11690(000)Target Sample Size : 222
Somewhat/Very Focused (%)
% of Gross ImpressionsDayparts:
77.15
6am-‐9am 76.16
4pm-‐7pm 90.17
11am-‐2pm 69.11
6am-‐10am 74.86
10am-‐3pm 68.55
3pm-‐7pm 83.67
7pm-‐12am 82.62
RADIO
TELEVISION
Degree of Focus on Media (Percentages)All Seasons – Average Day : Mon-‐Sun
Source: MediaDay 2011 (fieldwork 10-‐11/Doublebase respondents) Weighted by Population (000)
Somewhat/Very Focused (%)
% of Gross ImpressionsDayparts:
85.56
6am-‐9am 76.07
4pm-‐7pm 82.94
11am-‐2pm 87.53
6am-‐10am 78.32
10am-‐3pm 80.74
3pm-‐7pm 81.25
7pm-‐12am 92.90
Radio’s 4P-‐7P daypartbeats every TV daypart but 7P-‐12mid

50
In 2010, Entravision and Arbitron partnered to conduct a single-source television and radio measurement pilot utilizing Arbitron’s Portable People Meter in Denver. It was the first time that both Television and Radio audiences have been captured by a single electronic panel. It was also clear that among these properties at least, the usage of TV and Radio complement each other. Key Conclusions: -70 to 80% of the combined radio/TV audience can be found on Radio from 6a-4p -80% of the audience is found on TV from Prime Time to Midnight. -A Radio/TV campaign offers the opportunity to reach an audience when the other medium’s usage is lower. -Entravision TV+ Radio Reaches 56% of the Entire Market which is 5 to 11 Points More Than TV/Radio Alone. Both TV and Radio are additive to one another. Together EVC properties reach over 55% of all Hispanic A18-49

51
- Both radio stations vastly outperform TV 6a-6p. Advertisers buying both media are receiving near-Prime Time reach all day long
#ARFAM6
McDonald’s Schedule ResultsTV, Radio and TV + Radio Schedule Delivery
McDonald’s® Schedule Increases Reach, Frequency and GRPs
Radio TV Radio + TV
# Spots 151 152 303
Cost $17,940 $36,451 $54,391
Reach (%) 38.4 46.0 49.9
AQH Rtg 2.0 3.2 2.6
Avg. Freq. 8.02 10.67 16.03
GRPs 308.1 491.6 799.7
CPM $19.1 $24.3 $22.3
Hispanic A18-49
Source: Arbitron PPM Cross Platform custom report. August 19, 2010 - September 15, 2010, Hispanic Persons, Mon-Sun 6AM-Mid
Radio is delivering an impressive reach at half of the TV investment, yet even with these heavy base schedules, by adding the other media McDonald’s receives: -60% to 100% greater frequency. -10% to 23% greater reach. -At least 60% more GRPs. Add to all of this the fact that by using both Radio and TV, the advertiser is getting more consistent Near-Prime-Time reach throughout the day and reaching the allusive light consumer of the other media. Radio and TV together
– Can bring advertisers prime-time audience levels throughout the entire day
– Increases both reach and frequency – Are more powerful in combination than either media is
alone- Multiplicative

52
ESPN
• An ESPN and Arbitron November 2010 study measured consumption on ESPN national cable television and radio:
– Football games and studio programs on TV • ESPN • ESPN2 • ESPNews
– ESPN local radio stations (Total Day) • Arbitron reported:
– In-home estimates – Out-of-home estimates – Platform duplication
Shared-‐Exclusive Reach
73.761.8
29.4
21.519.0
12.3
4.2
3.5
1.8
99.4
84.3
43.4
P6+ P18+ M18+
Reach (Millions)
Radio Only
Both
TV Only
• 4.2 Million Persons
• 3.5 Million Adults
• 1.8 Million Men
17
RadioRadio
ExclusiveRadio Shared
Persons 6+ 26% 4% 22%
Persons 18+ 27% 4% 23%
Males 18+ 32% 4% 28%
Percent of Total Users
Radio Exclusive Reach

53
OOH TV/Radio Add Reach
68,800
44,998
22,468
In-‐Home TV OOH TV Radio
ESPN Content Reach (P18+ 000)
21
28,453
40,347
10,5053,4981,470
P18+ (000)
OOH TV+Radio Only
Radio Only
OOH TV Only
IH TV+Other
IH TV Only
Exclusive Reach 15.5 million (+23%)
Able to measure exclusive Reach and usage from Radio and out-of-home
– Radio Only = 4.2 million persons – Out-of-Home Only = 14.5 million persons – Radio or OOH TV vs In-Home TV:
• Reach = 15.5 million persons (+23%) Minutes = 9.1 billion minutes (+40%)
All told, CBS is the grayest net, with a median age of 56.8 years. ABC is also creaky (54.9), and NBC (48.9) and Fox (44.2) are wearing Mom Jeans. Only The CW draws a sub-40s crowd, posting a median age of 38.6.

54
TV Has A Growing Reach Problem TV Used to Put the 'Mass' In Mass Media. Not Anymore.
By: Dave Morgan Published: February 28, 2012 In 1997, noted media researcher Erwin Ephron presented a paper titled "Learning to live in Lilliput, the media land where small is beautiful. Optimizing reach with low ratings and other thoughts on TV fragmentation." In it, Ephron wrote about the TV's growing audience-fragmentation problem and presciently saw what would happen if the media-buying community continued to focus the bulk of TV budgets on a declining pool of larger-rated shows without strategically dispersing a large volume of spots across lots of shows with small audiences. Folks didn't listen then and -- in spite of fragmentation along the lines of Ephron's forecast -- apparently won't listen now. TV ad campaigns in the U.S. today deliver considerably less reach than they did in

55
1997, even though TV viewing is at an all-time high. *Fifteen years ago, a heavy national schedule with average frequency would reach 80-90% of its target audience in three weeks. Today, most heavy multi-week national ad campaigns are lucky to reach 60% of TV viewers in their target audience. The story is even worse when it comes to frequency distribution. Fifteen years ago, TV advertisers could expect 40% of their campaigns' impressions to be concentrated on the 20% of their target audience who were the heaviest TV viewers. Today, the frequency imbalance is almost twice as bad. *According to both Nielsen data as well as Simulmedia's database of anonymous second-by-second set-top box viewing data of 30 million Americans, those 20% of target viewers who are heavy TV viewers now receive 60 to 80% of most national TV campaign impressions. This squanders advertiser money, needlessly accelerates the "wear out" of creatives and alienates target customers who feel bombarded by redundant messaging. Don't believe me? Go ahead and run the data yourself with any of the national audience data systems: Nielsen AudienceWatch or Nielsen AMRLD or Kantar or TRA or Rentrak. You will see similar results. How did this happen? It happened because TV audiences have fragmented dramatically over the past 15 years and the TV media industry has not adjusted its planning, buying and measurement tools and strategies to keep pace. *Twenty years ago, the average American household had access to 28 TV channels, and brands like Fox, Nickelodeon and TNT were babies. Today, Americans have 165 channels and watch networks like Military Channel, Investigation Discovery and BBC America. Twenty years ago, in an average week, there were hundreds of shows with a rating of 10 or better. Today, there are scarcely more than a dozen. *Today, it takes four to five spots to deliver the equivalent media weight of one spot 15 or 20 years ago, and eight to deliver as much reach. That's an enormous change.

56
As Ephron's paper noted, "Fragmentation challenges the analytical capabilities of our research systems. … Our current approach -- using the program and day part as ways of organizing media value -- becomes less useful as audiences get smaller." TV's ability to reach a lot of people in a short period of time, and to do it efficiently, is what has historically set it apart from all other advertising media. It is why national brand advertisers have to plan and buy it first and why TV has historically received the dominant share of brand expenditures. Neither radio nor print nor out-of-home -- nor even the internet -- has the capacity to efficiently deliver multiple effective advertising messages to tens of millions of target consumers in the space of a few days or weeks. However, competition for media dollars is intensifying. Clients want to move more money to digital. They want to "jump into" social media. They are demanding more and better measurement and ROI. This is not a good time for folks in the TV media industry to undermine their core competitive advantage and sell and buy campaigns with such bad reach and frequency balance. And it certainly won't help the medium's ability to stave off calls to shift more money into digital channels. Unfortunately, so much of the energy in TV buying today is spent chasing those declining dozen or so top-rated shows rather than developing the analytical chops to efficiently accumulate target audience across the exploding landscape of smaller-rated shows that attract relevant, passionate audiences. The problem, as all media researchers know, is that heavy TV viewers tend to watch all of the highly-rated shows, so buying more of those shows doesn't get you much more reach. Not so when you get into lots and lots of lower-rated shows. Contrary to the opinion of many, strategically dispersing ads across many smaller audience shows is not mutually exclusive with buying those several high-rated shows which clients seem to prefer. They

57
complement each other, and you get much more reach and much better balanced frequency. As we prepare for this year's upfronts, I do think it would be instructive to go back and read the concluding sentences to Ephron's paper: Buyers will have to push for change. The TV networks are trapped by their own success with day parts. In prime time, more dollars chasing less inventory has increased prices substantially each year. But there is an issue larger than pricing. Daypart thinking increases costs and limits reach which, in turn limits television's effectiveness. Smaller ratings need not cripple TV if we learn to use the entire medium. Fragmentation is not the nemesis of mass TV advertising. There is a cosmic fairness to it all. Greater choice for viewers creates the fragmentation which in turn creates greater choice for buyers. If we are going to live in Lilliput, we should wake up and smell the little flowers. What do you think? Is the industry ready to hear Ephron's nearly 15 year-old warning?