Embed Size (px)
Citation preview

C O N T E N T S
Child care and early childhood 4 learning: future options
Reforming public infrastructure 8
Access to justice arrangements 12
Should the National Access regime 15 be retained?
Improving resource exploration 19 in Australia
Costs of doing business – retail trade 23 and dairy product manufacturing
Tasmanian shipping and freight – how 26 effective are current arrangements?
Literacy and numeracy skills and 28 labour market outcomes
PC NEWSPRODUCTIV ITY COMMISS ION NEWSLETTER | No. 56 AUGUST 2014 | www.pc . gov. au | I S SN 1443 -6671

2
The Productivity Commission is the Australian Government’s independent research and advisory body on a range of economic, social and environmental issues affecting the welfare of Australians.
Chairman Peter Harris
Deputy Chairman Mike Woods
Commissioners Karen Chester Jonathan Coppel Wendy Craik Robert Fitzgerald (on leave) Paul Lindwall (A/g) Angela MacRae Alison McClelland Warren Mundy Patricia Scott Philip Weickhardt
Head of Office Daryl Quinlivan
First Assistant Commissioner Lisa Gropp (Melbourne)
Principal Adviser Research Jenny Gordon
Media and Publications Leonora Nicol (Media Director) Ph: 02 6240 3239 [email protected]
Melbourne Office Locked Bag 2 Collins Street East Melbourne VIC 8003 Level 12, 530 Collins Street Melbourne VIC 3000 Ph: 03 9653 2100 Fax: 03 9653 2199
Canberra Office PO Box 1428 Canberra City ACT 2601 Level 2, 15 Moore Street Canberra City ACT 2600 Ph: 02 6240 3200 Fax: 02 6240 3399
Website www.pc.gov.auEmail [email protected] @ozprodcom
Requests to be placed on the mailing list for PC News are welcome. Contact the Media and Publications Unit (03 9653 2244 or email [email protected]). Copies are also available on the Commission’s website.
Latest releases
Childcare and Early Childhood Learning Draft Report
Public Infrastructure Inquiry Report
Competition Policy Review Productivity Commission submission to the Competition Policy Review
Trade and Assistance Review 2012-13 Annual Report Series
Tasmanian Shipping and Freight Inquiry Report
Relative Costs of Doing Business in Australia: Retail Trade Interim Report
Relative Costs of Doing Business in Australia: Dairy Product Manufacturing Interim Report
Address to the 2014 Annual Stockbrokers Conference Chairman’s speech
Literacy and Numeracy Skills and Labour Market Outcomes in Australia Staff Working Paper
Infrastructure for an Ageing Australia Chairman’s speech
Natural Disaster Funding Issues Paper
Geographic Labour Mobility Research Report
PC Productivity Update 2014
Agricultural Competitiveness Taskforce Productivity Commission Submission to the Agricultural Competitiveness Taskforce
Report on Government Services 2014: Indigenous Compendium Steering Committee for the Review of Government Service Provision
Access to Justice Arrangements Draft Report
All publications can be downloaded from the Commission’s website: pc.gov.au

PC NEWS August 2014 www.pc.gov.au 3
Natural disaster funding
The Australian Government has asked the Commission to undertake a public inquiry into the efficacy of cur-rent national natural disaster funding arrangements, taking into account the priority of effective natural disaster mitigation and the reduction in the impact of disasters on communities. An issues paper was released in May 2014, and a draft report will be released in September. The final report will be sent to Government in December 2014.
Costs of doing business: case studies
As part of the broader study on the Relative Costs of Doing Business in Australia, the Australian Government requested that the Productivity Commission undertake case studies of the costs facing businesses in two Australian industries: retail trade and dairy product manufacturing. The Commission published interim reports in June 2014 (see pages 23-25) and the final reports, including findings, will be provided to the Australian Government in early October 2014.
N E W C O M M I S S I O N E D P R O J E C T S
Richard Snape Lecture
The Productivity Commission’s 2014 Richard Snape Lecture was presented in Melbourne on 23 June by Nobel-prize winning economist Joseph Stiglitz. Professor Stiglitz is University Professor at Columbia University in New York and Chair of Columbia University’s Committee on Global Thought. Stiglitz is best known for helping to create a new branch of economics, ‘The Economics of Information,’ exploring the consequences of information asymmetries and for developing concepts such as adverse selection and moral hazard.
In his presentation, titled ‘Creating a Learning Society: A New Approach to Growth, Development and Social Progress’, Professor Stiglitz focused on the importance of education and innova-tion in generating sustainable economic growth, and the role of government in promoting a successful ‘learning society’.
Professor Stiglitz’s presentation can be downloaded from the Commission’s website: www.pc.gov.au
Productivity Commission News
> Details of all current commissioned projects appear on page 32 and are available at www.pc.gov.au
Pictured after the Lecture are Professor Joseph Stiglitz (far right) with (from left) Productivity Commission Deputy Chairman Mike Woods, Professor Max Corden and Richard Snape (Jnr). Professor Corden delivered the inaugural Richard Snape Lecture in 2003.

4
In July 2014, the Productivity Commission released the draft report for its inquiry into Childcare and Early Childhood Learning. The Commission has assessed the accessibility, flexibility and affordability of Australia’s childcare and recommended ways that it can be improved to better support both children’s development needs and participation in the workforce, particularly that of mothers.
The Commission received more than 1000 submis-sions and comments before publishing its draft report, and found a lot that is good about the current early childhood education and care (ECEC) system.
However, the ECEC system was largely designed to meet the needs of a different era and there is much scope for improvement. More families now use formal ECEC both as a means to return to the workforce (rather than having one parent care for children at home) and in recognition of its contribution to early child development.
Almost all of Australia’s 3.8 million children aged 12 years or under have attended some form of ECEC,
and around half of these children regularly use formal ECEC or informal non-parental care.
ECEC is important for child development
ECEC services play a vital role in the development of Australian children and their preparation for school. Preschool has been found to be particularly important. However, children are learning and developing from birth, and except where the home environment offers very poor development opportunities or places the child at risk, some learning and developemnt will con-tinue even without participation in formal ECEC at a very young age.
Unfortunately, many children who would benefit most from some participation in ECEC – those who are at risk of abuse or neglect, have a diagnosed disability, or are developmentally vulnerable because of some cul-tural or family characteristic (such as children who are not exposed to English in their homes) – are missing out.
Childcare and early childhood learning: future options
A recent Commission draft report recommends an overhaul of existing funding arrangements for childcare and early childhood learning, including replacing the existing array of childcare subsidies with a single means- and activity-tested payment, which would also apply to appropriately qualified nannies.

PC NEWS August 2014 www.pc.gov.au 5
$ million
Annual family disposable income ($)
per cent of fees
% paid by families (RHS)
0
100
200
300
400
500
600
700
JETCCFA
CCR
CCB
3000
00+
280-
3000
00
260-
2800
00
240-
2600
00
220-
2400
00
200-
2200
00
180-
2000
00
160-
1800
00
140-
1600
00
120-
1400
00
100-
1200
00
90-1
0000
0
80-9
0000
70-8
0000
60-7
0000
50-6
0000
40-5
0000
30-4
0000
20-3
0000
10
20
30
40
50
60
Figure 1 Subsidy amounts to families by income
ECEC can improve workforce participation
There is scope to increase the workforce participation of parents, particularly mothers.
Current Australian Government assistance to fami-lies creates a strong disincentive for some parents to enter the workforce or to increase their hours of work. For some second income earners (usually mothers) who return to work and use ECEC, the combination of reduced ECEC assistance and other Government assis-tance, and increasing income tax rates as family income rises can result in an effective marginal tax rate of close to 100 per cent, particularly once work exceeds 3 days per week.
The Commission has estimated that there may be up to roughly 165 000 parents (on a full time equivalent basis) who would like to work, or work more hours, but are not able to do so because they are experiencing difficulties with the cost of, or access to, suitable childcare.
Government spending on ECEC continues to grow with little prioritisation
Governments in Australia provide assistance to ECEC through a mix of payments to families (figure 1), sup-port for providers and the direct provision of services.
ECEC assistance arrangements are complex,
costly for governments to administer, and
difficult for parents and providers to navigate
or to readily calculate the out of pocket
costs of care. There are at least 20 Australian
Government ECEC assistance programs, many
overlapping in their objectives or very poorly
targeted.
Note: CCB: Child Care Benefit; CCR: Child Care Rebate; JETCCFA: Jobs, Education and Training Child Care Fee Assistance.

6
CCB introduced CCTR introduced
$ million (real)
0
1000
2000
3000
4000
5000
6000
7000
2012-132010-112008-092006-072004-052002-032000-011998-991996-97
CCTR (now CCR) increased to 50% up to
$7500/child/year
The cost to taxpayers of ECEC assistance
has ballooned with little prioritisation over a
number of years, from 0.8 per cent of total
Australian Government expenditure 10 years
ago to around 1.7 per cent in 2014-15. Funding
is projected by the Government to rise from
around $7 billion per year currently (figure 2)
to $8.5 billion by 2017-18.
Overall, the Government pays around two-thirds of the cost of approved childcare and families pay the residual. However, the design of ECEC assistance arrangements is resulting in a declining proportion of assistance to low-income families. The non-means tested capped Child Care Rebate payment is this year expected to overtake the means-tested Child Care Benefit payment as the primary form of ECEC assistance.
The Commission recommends an overhaul of the subsidy system
The Commission’s recommended approach to ECEC seeks to direct regulatory reforms and available Australian Government budgeted ECEC assistance to where there is the greatest potential to enhance the
accessibility and/or affordability of ECEC, with the aim of moving towards an ideal ECEC system.
The Commission proposes that funding for the exist-ing medley of Australian Government ECEC assistance programs be combined and directed to three priority areas – (i) mainstream ECEC services, (ii) services for children with additional needs and (iii) preschool services.•Mainstream support should be a single child-based
subsidy that is: means- and activity-tested, paid directly to the family’s choice of approved services, for up to 100 hours per fortnight, and based on a rea-sonable cost of delivering ECEC for each age of child in different ECEC types (the Early Care and Learning Subsidy, figure 3).
•Children with additional needs should have access to a ‘top-up’ subsidy to meet the additional reasonable costs of service. Services should have access to assis-tance to build capacity to provide ECEC services for additional needs children (the Special Early Care and Learning Subsidy, figure 3).
•The Australian Government should continue to support the states and territories for all children to attend an approved preschool program in the year prior to school.
The Commission has proposed that mainstream sup-port should be extended to qualified nanny services where these meet appropriate quality standards.
C H I L D C A R E A N D E A R LY C H I L D H O O D L E A R N I N G : F U T U R E O P T I O N S … C O N T
Figure 2 Australian Government funding on ECEC has continued to rise
Note: CCB: Child Care Benefit; CCTR: Child Care Tax Rebate; CCR: Child Care Rebate.

PC NEWS August 2014 www.pc.gov.au 7
Childcare and Early Childhood Learning
> Draft Report > Released July 2014> Submissions on the draft report are due by 5 September 2014. The final report will be sent to Government on
31 October 2014.
Figure 3 Child-based assistance – proposed approach for the Australian Government
CH
ILD
’S N
EED
SM
EAN
S T
EST
AC
TIVI
TY T
EST
SU
BS
IDY
AVA
ILA
BIL
ITY
Child has additional needNo subsidy available
At least one parent does not work/study/train for
24 hours/fortnight
Child has a diagnosed disability
Child is Indigenous
Child has additional need
Child at risk of abuse or neglect
Special Early Care and Learning Subsidy (SECLS)supplement (or full deemed cost for children at risk)
$/hour/child (depending on need category) up to 100 hours/fortnight
Both parents work/study/train at least 24 hours/fortnight
Grandparent or other non-parent is primary
carer of child
Child has no additional need
Parent on disability support pension or
carer payment
Early Care and Learning Subsidy (ECLS)$/h/child up to 100 hours/fortnight
(depending on type of ECEC, child age group and subsidy rate)
Max subsidy if family income <$60 000 tapering down to min subsidy after family income
reaches $300 000

8
Imaginative reform needed for public infrastructure
The Commission has identified an urgent need to improve how public infrastructure projects are selected, funded, financed and delivered.
Public infrastructure is central to the provision of a range of important services and involves a significant investment of resources. For example, engineering work done for the public sector has been equivalent to more than 2 per cent of GDP in recent years (figure 1). In addition, there has been significant investment in public sector buildings, such as schools and hospitals.
While governments have traditionally taken overall responsibility for public infrastructure provision, there has been an increasing recognition that greater pri-vate sector involvement has the potential to deliver more efficient infrastructure services. However, there is often a misguided perception that private financ-ing of public infrastructure projects will automatically reduce the cost to governments over the long term. A further issue is that governments have been concerned that Australia has excessive infrastructure construction costs, limiting the investment that can take place for any budget.
Reflecting the interest in greater private sector involvement and concerns about costs, the Australian
Government asked the Productivity Commission to prepare an inquiry report on public infrastructure pro-vision, funding, financing and costs. The report was released in July 2014.
The Commission found that there needs to be a com-prehensive overhaul of governance and institutional arrangements for public infrastructure projects to pro-mote better decision making.
The report observes that there are numerous exam-ples of poor value for money arising from inadequate project selection, potentially costing Australia billions of dollars. Without the reforms proposed in the report, additional spending under current arrangements will simply increase costs for users, taxpayers, the commu-nity generally, and lead to more wasteful infrastructure.
The Commission’s proposed reforms include the adoption by all governments of a package of best-practice institutional and governance arrangements, which among other things would require a greater role for rigorous cost–benefit analysis in project selection, including persistent and consistent public reporting.

PC NEWS August 2014 www.pc.gov.au 9
Per cent of GDP
0.0
0.5
1.0
1.5
2.0
2.5
OtherDrainsWaterElectricityRailwaysRoads, subdiv's, bridges
2013
2012
2011
2010
2009
2008
2007
2006
2005
2004
2003
2002
2001
2000
1999
1998
1997
1996
1995
1994
1993
1992
1991
1990
1989
1988
1987
Figure 1 Expenditure on engineering construction work for the public sector, as a percentage of GDP
The procurement practices used by State and Territory Governments would also need to be overhauled to improve the initial design phase of a project.
The report advises that direct user charges provide an incentive for efficient provision and use of infrastruc-ture, and so they should be used to address both alloca-tion and development of project funding. A particular focus of the report was on the scope to shift to more direct charges on motorists to improve the provision and funding of roads, underpinned by developments in vehicle and associated technologies.
However, the report cautions that governments will regardless need to at least partly fund selected infrastructure because it is sometimes impractical to exclude users who do not pay a direct charge, the wider beneficiaries are difficult to identify, or infrastructure is provided to meet equity goals.
The Commission stressed that private financing of infrastructure is not a ‘magic pudding’ – ultimately users and/or taxpayers must foot the bill. Thus, while private financing may offer scope to alter the timing of
government payments to fund infrastructure services, it does not necessarily change the long-run impacts on government budgets. Moreover, governments should be mindful that debt guarantees and tax concessions offered to the private sector are not costless and often involve poorly understood risks.
Though sometimes the origins of cost pressures are misconstrued, there is evidence of recent significant increases in the costs of constructing major public infrastructure in Australia (there can also be marked variation in costs between projects, as illustrated in figure 2). Elevated labour costs due to the mining construction boom has been one factor, but no single cause has played a decisive role in cost increases. For instance, raw material and land prices have also increased significantly. Overall, Australia’s costs are not extreme by global standards, and for some projects are comparable to other developed countries.
Until recently, labour productivity growth in the con-struction sector has generally been sluggish – a prob-lem in some other countries too. Assessing Australia’s

10
Cost per kilometre ($m) of rail projects in built-up areas
0 20 40 60 80 100 120
Noarlunga Seaford line extension SA
Joondalup line extension WA
Metrorail Perth WA
Helensvale to Robina Qld
Salisbury to Kuraby Qld
Caboolture to Beerbumum Qld
Robina to Varsity Lakes Qld
Corinda to Darra Qld
Moreton Bay Rail Link Qld
Regional Rail Link VIC
South Morang Rail Extension VIC
South West Rail Link NSW
Southern Sydney Freight Line NSW
Kingsgrove Revesby Quad NSW
Richmond Line Duplication NSW
Cronulla Duplication NSW
construction productivity and costs at a more granular level to pinpoint where the problems most lie is bedev-illed by data inadequacies. Publication by Infrastructure Australia of a coordinated and coherent dataset on infrastructure costs will address this, improve future project selection decisions and motivate improvement in the areas where Australia is a poor performer.
Despite concerns that significant concentration in the market for large public infrastructure projects inflates prices, the market appears to be workably com-petitive today. However, a few simple measures would make it more so, and would reduce the cost pressures facing procurers.
The industrial relations environment in the construc-tion industry remains problematic, primarily in general rather than civil construction, with the problems much greater for some sites, unions and states. Governments can use their procurement policies to drive reform among prime contractors and the main unions. The mantra should be ‘Government won’t buy, if the work-place IR environment is poor’. Penalties for unlawful conduct should rise to deter poor behaviour by unions, employees and employers.
There is scope for individual governments to
act immediately on many of the Commission’s
recommended reforms. This would deliver large
benefits for the community. Based on recent
levels of investment, a 10 per cent reduction
in the cost of delivering infrastructure – a
conservative estimate of the potential savings
from implementing sensible reforms – would
amount to an annual saving of around
$3.5 billion (and that would grow over time).
A goal to achieve just a portion of this, say
$1 billion per annum, would be quite feasible.
I M A G I N AT I V E R E F O R M N E E D E D F O R P U B L I C I N F R A S T R U C T U R E … C O N T
Figure 2 Rail construction costs vary enormously

PC NEWS August 2014 www.pc.gov.au 11
Public Infrastructure
> Inquiry Report> Released July 2014
Better institutional and governance arrangements are crucial
Governments should adopt best-practice institutional and governance arrangements for public infrastructure provision. Governments should commit to publishing a rigorous cost–benefit analysis before calling for tenders for any infrastructure proposal expected to cost above $50 million.
Various public and private financing models may have a role to play
State and Territory Governments should privatise their major ports and electricity generation, network and retail businesses. The Australian Government should consider privatising its business enterprises.Not requiring bids to be fully financed at the time of tender should be trialled.Barriers to the development of Australia’s corporate bond market should be investigated by the Financial System Inquiry.
Road-specific institutional and funding reforms are required
State and Territory Governments should actively encourage local governments to form regional Road Funds. This should be guided by a future Productivity Commission inquiry on how best to implement road funds.Governments should sponsor pilot studies on how vehicle telematics could be used for distance and location-based road user charges.
Planning and tendering arrangements can be significantly improved
Governments should reform tendering and planning arrangements, such as by investing more time in initial concept design specifications.
Achieving better labour markets
Apprenticeship arrangements should be reviewed.There should be more systematic collection and analysis of employment data to better inform expectations of future labour demand.All governments should oblige their infrastructure suppliers to adhere to requirements similar to the Victorian Code of Practice for the Building and Construction Industry.
Better data collection and analysis
The Australian Government should fund the benchmarking of major public infrastructure projects. It should also fund improvements to productivity and other data for the construction sector.
Implementation of reform
Governments should immediately commence the Commission’s recommended reforms. Where cooperation across jurisdictions would be beneficial, this could be facilitated by inter-governmental agreements.
* A complete list of recommendations is available in the report overview.
Public infrastructure: Summary of the Commission’s recommendations*

12
A well-functioning civil justice system underpins social cohesion and economic activity. Addressing concerns that accessing justice is too slow, too expensive and too adversarial can better facilitate the efficient and fair resolution of civil disputes, thereby enhancing commu-nity wellbeing.
The Australian Government has asked the Productivity Commission to undertake a broad ranging inquiry into Australia’s system of civil dispute resolu-tion with a focus on constraining costs, and promot-ing access to justice and equality before the law. Key themes of the Commission’s draft report, released in April 2014, are outlined below. A final report will be sent to Government in September 2014.
Civil disputes are relatively common
According to the most recent comprehensive survey of legal need, close to half of respondents experienced one or more civil legal problems in a 12 month period. The most prevalent civil problems related to consumer mat-ters, housing disputes and dealing with different levels of government (figure 1).
Many disputes experienced by individuals were sub-stantial in nature. More than half of respondents who
experienced at least one civil legal problem, considered the problem had a ‘severe’ or ‘moderate’ impact on their everyday life. Family disputes, including disputes relat-ing to child custody and maintenance, were more likely to be considered substantial.
Parties to disputes encounter similar problems
Many people have difficulty identifying whether their problem has a legal dimension and what action to take. Information services are a simple and effective way to assist people to resolve disputes informally, and seek more formal advice if required. Such services should enable people to resolve their legal problems, if they have the capacity and are provided with appropriate information and some direction.
Big potential gains from early and informal solutions
Parties have at their disposal an increasing number of low cost and timely informal mechanisms to help resolve disputes. Better directing people to ombuds-men and other informal dispute resolution bodies could significantly reduce the level of unmet legal need, but these bodies need to be more visible to those who might require their services.
Some alternative dispute resolution techniques have proven an efficient and effective way to resolve disputes. There appears to be greater scope for the use of alternative dispute resolution in court and tribunal processes, government disputes and private disputes. Litigation should remain an option if settlement cannot be reached.
When disputes cannot be resolved independently and consumers opt to seek formal legal advice, they find it hard to compare practitioners, different billing arrangements and service offerings. In addition, the complicated nature of many legal services means that consumers find it difficult to judge the quality of the ser-vices both before and after they receive them. Avenues to allow consumers to make more informed choices and enhanced regulatory oversight of the legal profession have the potential to improve outcomes.
Access to justice arrangements
A number of barriers prevent Australians from resolving civil disputes in a timely and affordable way. Wide ranging reforms recommended in a recent Commission draft report have the potential to improve both the visibility and accessibility of the various avenues available to people to resolve their disputes.

PC NEWS August 2014 www.pc.gov.au 13
Share of total problems (per cent)
0
5
10
15
20
25
HealthAccidentsPersonalinjury
MoneyEmploymentCredit/debt
FamilyRightsGovernmentHousingCrimeConsumer
Figure 1 Composition of legal problems faced by Australians
Source: Coumarelos, C., Macourt, D., People, J., McDonald, H.M., Wei, Z., Iriana, R. and Ramsey, S. 2012, Legal Australia-Wide Survey: Legal Need in Australia, August, Law and Justice Foundation of NSW, Sydney.
Court and tribunal processes can be improved
Governments, in granting courts and tribunals exclu-sive jurisdiction over some activities, have a responsi-bility to ensure these institutions operate as efficiently and effectively as possible.
The adversarial behaviour of parties can run counter to these objectives – hindering the resolution of dis-putes or even exacerbating them. Such behaviour can be addressed by subjecting parties and their lawyers to requirements that facilitate the swift, proportionate and just resolution of disputes. Greater use of targeted pre-action protocols – the rules that govern legal manoeu-vrings that occur before a trial – accompanied by strong judicial oversight, can help resolve disputes early or narrow the range of issues in dispute. Reforming cost awards can also provide another mechanism for deter-ring parties from incurring unnecessary or dispropor-tionate legal costs.
Well-targeted and appropriately employed case management can yield significant benefits in terms of improved efficiency and reduced cost and delay. Courts in all Australian jurisdictions have either initiated, or been the subject of, substantial reforms that have moved towards more active judicial management of cases. Progress has been uneven across jurisdictions and arguably court processes do not yet sufficiently ensure that unnecessary costs and delays are avoided.
Reforms to other court processes, including rules around discovery and expert witnesses, also have the potential to improve the efficiency of court based dis-pute resolution. Courts and tribunals would also benefit from greater investment in technology.
Legal assistance for disadvantaged people
Disadvantaged people face a number of barriers, which mean they are both more susceptible to and less equipped to deal with legal disputes. If left unresolved, civil problems can have a substantial impact on the lives of the most vulnerable. Governments have a role in providing legal assistance services to these individu-als to help them to uphold their legal rights and resolve their civil disputes.
The capacity of legal assistance providers to assist disadvantaged Australians is constrained by a range of factors, many of which stem from the way in which these services are funded. A number of approaches for improving funding arrangements – including address-ing the funding tensions between the civil and criminal systems and better distributing funds in line with civil legal need – are explored.
Eligibility tests for casework services currently vary between legal assistance providers. Financial eligibility criteria for these services should be consistent across providers and linked to an established measure of dis-advantage. This would make tests more equitable and transparent.
Reallocating funding towards higher priority areas alone will be insufficient to meet the civil legal needs of disadvantaged Australians – absent additional resources service gaps will remain.
Aboriginal and Torres Strait Islander people often have complex legal needs and face sizable barriers in accessing legal services. As a result, many civil disputes go unresolved, which can lead to larger and more com-plex legal problems. While there are good grounds for tailored legal assistance services, reforms are warranted to who funds services, how funds are distributed, and ‘back of house’ operations to improve efficiency and effectiveness. >
14
Improving the experience of consumersJurisdictions should have a centralised source for consumers to access information, basic advice and referrals so they better understand whether they have a legal problem and what their options are.
A central online portal should be made available within each jurisdiction, which provides consumers with information on typical prices for a range of legal services.
Legal service providers should ensure that consumers understand billing information and are informed when additional services are required.
Governments and industry should raise the awareness of ombudsmen services to promote these relatively low-cost dispute resolution options.
Governments should develop a single set of rules to offer consumers the option of purchasing unbundled legal assistance.
Reforming court and tribunal operationsTribunals should enforce processes to facilitate the fair, economical, informal and quick resolution of disputes. Restrictions on legal representation should be more rigorously applied.
Courts should examine their processes to ensure that they are consistent with leading practice in relation to case management, case allocation, discovery and use of expert witnesses.
Cost awards should be reformed – lower-tier courts should introduce fixed, activity-based scales while higher-tier courts should introduce processes for cost management and capping.
Court and tribunal fees should be set to recover a higher proportion of costs and take into account the characteristics of the parties and the dispute. Fee waivers should be provided to disadvantaged litigants.
Addressing power imbalancesMore effort is needed to ensure that model litigant guidelines are adhered to by governments and their agencies.
While remaining impartial, judges and court staff should better assist self-represented litigants, including through the development of plain language forms and guides which clearly outline time-critical events.
Private sources of funding are important Governments should remove the restriction for most civil matters on calculating lawyers’ fees as an agreed share of the amount recovered through legal action.
Litigation funders should be regulated as licensed financial service providers and subject to ethical standards and appropriate monitoring.
Improving legal assistance servicesGovernments should ‘earmark’ a specified amount of legal assistance funding for civil matters.
Eligibility for grants of legal aid should take into account the client’s circumstances and the impact of the legal problem on the client and the community more broadly.
The Community Legal Services Program funding model should be more responsive to legal need and resources should be reallocated accordingly.
Funding for Family Violence Prevention Legal Services for Aboriginal and Torres Strait Islander people should be allocated to areas of ‘highest need’ and the funding allocation model revised to reflect differences in need and service cost across geographic areas.
Access to Justice Arrangements
> Draft Report > Released April 2014
A C C E S S TO J U S T I C E A R R A N G E M E N T S … C O N T
Access to justice: Summary of the Commission’s main draft recommendations

PC NEWS August 2014 www.pc.gov.au 15
Should the National Access Regime be retained?
In its recent report on the National Access Regime, the Commission recommended that the Regime should be retained, and made a number of recommendations to improve its operation.
The Australian Government asked the Productivity Commission to undertake an inquiry into the role and efficacy of the National Access Regime. The Commission was asked to propose ways of improving the operation of the Regime to ensure the efficient operation of and investment in essential infrastructure to promote competition and investment in dependent markets. The Commission’s final report was released in February 2014.
Why is access to infrastructure services important?
Infrastructure services are delivered through electricity, gas and water systems; telecommunications, rail and road networks; and port and airport terminals. The cost and quality of infrastructure services is an important driver of a business’s competitiveness and productivity. For example, improvements in transport infrastructure can lower distribution costs, increase access to over-seas markets, and improve access to inputs. And poor delivery of infrastructure services can stifle business productivity.
What is the National Access Regime?
The National Access Regime is a regulatory framework through which third parties may seek access to infra-structure services owned and operated by others, when commercial negotiations on access are unsuccessful.
The Regime aims to promote the economically efficient operation of, use of, and investment in essential infra-structure services, thereby promoting effective competi-tion in upstream and downstream markets. The Regime was introduced in 1995 as a key part of the National Competition Policy. The regulatory provisions of the Regime are contained in Part IIIA of the Competition and Consumer ACT 2010 (CCA) and clause 6 of the Competition Principles Agreement signed by the Commonwealth and States and Territories in 1995.
How does the Regime work?
Parties can use the Regime to seek access to a service provided by an infrastructure facility through one of four pathways:•Declaration – a party can request that the National
Competition Council (NCC) recommend that the designated Minister declare a particular infrastructure service. If the service is declared by the Minister, par-ties can then negotiate the terms of access to the ser-vice. If they are unable to agree on access terms, the Australian Competition and Consumer Commission (ACCC) can act as an arbitrator and may determine the terms and conditions of access to the declared service.
•Certified access regime – a party can seek access to a service through a state or territory access regime that is certified as effective by the Commonwealth Minister. >

16
•Undertaking – a party can seek access to a service under terms and conditions set out in an undertaking that has been accepted by the ACCC.
•Competitive tender – a party can access a service pro-vided by a government-owned facility under terms that have been established through a competitive tender process approved by the ACCC.
When should access to infrastructure services be regulated?
In the Commission’s view, access regulation should only be used to address an enduring lack of effective competition, due to natural monopoly, in markets for infrastructure services where access is required for third parties to compete effectively in upstream or down-stream markets.
The existence of a natural monopoly per se does not warrant access regulation, as the ability of an infrastruc-ture service provider to exercise market power may be constrained by a range of factors including the exis-tence of substitutes, countervailing market power, or the threat of market entry by a competitor.
However, where a service provider is not constrained from using its market power, denial of access or monop-oly pricing can lead to allocative inefficiencies that impose costs on the community. Access regulation can address these allocative inefficiencies, and facilitate lower prices for consumers. Applied appropriately,
access regulation can also increase incentives for inno-vation – a fundamental driver of productivity improve-ments and economic growth – through the promotion of competition in markets reliant on infrastructure services.
Access regulation is not the most effective means to address market power arising from government legisla-tion, patents and copyrights, or strategic behaviour – there are more direct means for addressing these prob-lems. Nor should access regulation be used to avoid the duplication of infrastructure per se, or to address wider social and economic issues such as income distribution or environmental concerns.
Government intervention can be costly – in par-ticular where it adversely affects investment incentives. If prices are set too low, investment could be delayed or not occur at all. And mandating third party access imposes costs on infrastructure service providers, including from coordinating multiple users of their facilities. The Commission report argues that access regulation is only warranted when it generates net ben-efits to the community.
The benefits of access regulation are more likely to outweigh the costs where there is a monopoly provider of infrastructure services. Competition between service providers will generally be preferable to access regula-tion in markets where two or more infrastructure ser-vice providers are able to provide the same service (or an effective substitute service).
Natural gas transmission pipelines may exhibit sig-nificant economies of scale in their construction and operation and, in some circumstances, adding com-pressors can be a lower cost way to increase their capacity than duplicating the pipeline. As such, it can be efficient for a single pipeline to transport gas from a production facility to an industrial or urban centre.
Access regulation may be warranted where the pro-vider of pipeline services has an ability and incentive to charge monopoly prices or deny access to a pipeline in order to generate monopoly rents. This may occur where the provider of pipeline services is not con-strained from exercising its market power by:
• the availability of substitute facilities – for example, where there are no other pipelines taking gas from
the production facility or delivering gas to the final market
• the availability of substitute goods – for example, where there are no other fuel and energy sources that are suitable substitutes for natural gas
• users with countervailing market power – for exam-ple, if users are small and do not have the capacity to build their own pipeline
• the threat of entry – for example, where sunk costs and economies of scale act as an impediment to a competitor building another pipeline.
Conversely, access regulation is unlikely to be war-ranted where the market power of a provider of a pipeline service is constrained by these factors.
Access regulation and the potential use of market power: an example
S H O U L D T H E N AT I O N A L A C C E S S R E G I M E B E R E TA I N E D ? … C O N T

PC NEWS August 2014 www.pc.gov.au 17
Pathways to access under the National Access Regime
The Commission’s recommendations
The Commission supported the continuation of the National Access Regime, but recommended that its scope be confined to ensure its use is limited to cases where the benefits arising from increased competition in dependent markets are likely to outweigh the costs of regulated third party access to infrastructure services.
The Commission’s proposed reforms focus on the criteria for declaration, as these determine when access regulation will and will not apply. The Commission’s reforms, if implemented, would reduce avoidable administrative costs of access cases by improving
certainty for access seekers and infrastructure service providers, and reduce the likelihood of unsubstantiated and speculative declaration applications, reviews and appeals.
When considering whether to regulate access to infrastructure services in the future, governments should seek to demonstrate that there is a lack of effec-tive competition in the market for the service that is best addressed by access regulation. An assessment of the net benefits should determine whether access regu-lation is most appropriately applied at the facility or industry level. >
Any person seeks access to an infrastructure service
Have the service provider and access seeker agreed to terms of access after private negotiation?
Negotiated outcome determines terms of access
Is there a certified access regime or an Australian Government access regime in place?
Relevant regime determines terms of access
Has a Part IIIA undertaking or a competitive tender process that applies to the service been accepted or
approved by the ACCC?
Undertaking or tender process determines terms of access
ACCC can arbitrate to determine terms of access
Have the service provider
and access seeker
agreed to terms of access
after private negotiation?
No right to negotiation or access under the Regime
NO
NO
NO
NO NO
Any person applies to the NCC for a recommendation to declare
NCC makes recommendation to the designated Minister
Is the service declared by the designated Minister?
YES
YES
YES
YES YES

18
National Access Regime: Summary of the Commission’s key recommendations
National Access Regime
> Inquiry Report> Released February 2014
Declaration criteria
Amend the competition test (criterion (a) in Part IIIA of the CCA so that the test is a comparison of competition with and without access on reasonable terms and conditions through declaration.
Amend the uneconomical to develop another facility test (criterion (b) in Part IIIA) so that the test is satisfied where total market demand could be met at least cost by the facility.
• Total market demand should include the demand for the service under application as well as the demand for any substitute services provided by facilities serving that market.
• The assessment of costs under criterion (b) should include an estimate of any production costs incurred by the infrastructure service provider from coordinating multiple users of its facility.
If criterion (b) continues to be applied as a private profitability test, it should be amended such that the definition of ‘anyone’ excludes the incumbent service provider.
Amend the public interest test (criterion (f) in Part IIIA) so that declaration promotes the public interest. In assessing the public interest, decision makers should have regard to effects on investment and administrative and compliance costs.
Certification and undertakings
Remove declaration criterion (e) from Part IIIA and introduce:
• a threshold clause stating that a service cannot be declared if it is subject to a certified access regime
• a revocation mechanism that allows certification of a regime to be revoked if substantial modifications have been made to the regime or the principles in clause 6 of the Competition Principles Agreement (CPA).
COAG should consider aligning the principles in clause 6 of the CPA with Part IIIA, and streamline the principles where appropriate.
Release state and territory governments from the requirements to submit their energy regimes for certification.
If mandatory undertakings are used, the NCC should assess the relevant service against the declaration criteria before, and at appropriate intervals after, the mandatory undertaking is in place.
Extensions
The ACCC should publish guidelines on how its power to direct extensions would be exercised in practice.
Amend Part IIIA to confirm that the ACCC’s power to direct extensions also encompasses capacity expansions.
Deemed ministerial decisions
Deemed ministerial decisions on applications for declaration should follow the NCC’s recommendation
Broader policy context
Australian governments should review their competitive neutrality policies to ensure they are relevant and reflect contemporary practice.
Undertake a further independent review of the Regime no more than ten years after the Government’s response to the Commission’s inquiry.
S H O U L D T H E N AT I O N A L A C C E S S R E G I M E B E R E TA I N E D ? … C O N T

PC NEWS August 2014 www.pc.gov.au 19
Improving resource exploration in Australia
According to several measures, the competitiveness of resource exploration in Australia has been declining since the 1990s, and Australia’s share of global exploration expenditure has also declined. In a recent inquiry report, the Productivity Commission made a number of recommendations aimed at improving the regulatory environment for exploration activities.
The Productivity Commission was asked to undertake a public inquiry into non-financial barriers to min-eral and energy resource exploration in Australia. The inquiry examined the exploration approval systems and processes within and across jurisdictions, their effec-tiveness and efficiency, and the costs associated with the regulation of exploration activities. It also assessed the impact of non-financial barriers on the interna-tional competitiveness and economic performance of the sector. The Commission’s final report, released in March 2014, recommended a range of reforms to improve the regulatory environment for exploration activities.
Mineral and energy resource exploration represents a small share of the economy, but it is an essential prerequisite for mining and energy resource extrac-tion. Exploration expenditure was just under $8 bil-lion in 2012-13, equivalent to about 0.5 per cent of GDP, whereas resource extraction accounted for 9 per cent of GDP. Resource exploration is not a large employer, accounting for only 0.2 per cent of Australian employment, but it can have a substantial impact on employment at a local level, and is an important source of economic activity for some regional and remote economies.
Why should governments regulate exploration?
The Commission identified three key reasons why governments regulate the mineral and energy resource exploration industry in Australia:•the mineral and energy resources are owned by the
Crown•exploration could directly impact on existing and
future agricultural and other land uses or damage sites of environmental and heritage significance
•exploration may have effects beyond the area being explored.
The policy context
Governments have a number of mechanisms by which they seek to influence the level and nature of explora-tion. The levers include:•Availability of, and access to, land. Governments, in
controlling large tracts of Crown land and in regulat-ing the use of private land, can influence what land is available for exploration activity and what access conditions apply where exploration is allowed. There are also legislative requirements set by governments relating to access to land where native title exists.
•Regulation of exploration. This involves providing licences to undertake exploration and establishing the terms and conditions of these licences as well as regulation of environmental impacts and heritage protection.
•Geoscience. Government provision of pre-competitive geological information such as geoscience maps, data-bases and information systems can facilitate explora-tion by identifying potentially prospective locations.
•Skilled labour. Governments can influence the avail-ability of skilled labour through the tertiary education system and migration programs. >

20
The performance of the exploration industry is declining
The number, size and quality of resource discoveries in Australia is declining over the longer term, and the exploration sector is experiencing rising costs and lower productivity
The number of giant and major discoveries is falling as exploration expenditure has risena
Share of world exploration budgets (%)
2011201020092008200720062005200420032002200120001999199819971996199519941993199219910
2
4
6
8
10
12
14
16
18
20
0
2
4
6
8
10
12
14
16
18
20
Share (RHS)
Exploration budgets (US$ billion)
Australia
World
Minerals and coal (rhs)
0
3000
6000
9000
12000
$ per metre $ per metre
2012201120102009200820072006200520042003200220012000199919981997199619951994199319921991199019890
100
200
300
400
Offshore petroleum (lhs)
Onshore petroleum (lhs)
$ billion (2011-12 prices)
Expenditure (RHS)
Number of discoveries
Giant
0
10
20
30
40
50
08-1203-0798-0293-9788-92
0
2
4
6
8
10
Major Moderate
Australia’s share of global non-bulk mineral exploration is falling (Excludes iron ore and uranium)
Drilling costs are rising Cost per metre drilled, 2012 prices
Source: Productivity Commission 2013, Mineral and Energy Resource Exploration, Inquiry Report
a Mineral discoveries and exploration expenditures (excluding iron ore, coal and petroleum).

PC NEWS August 2014 www.pc.gov.au 21
•The taxation treatment of exploration activities. Taxation concessions and other incentives relating to explora-tion activities can reduce the cost and raise expected returns. Taxation of extraction may also impact on the level of exploration.
•Subsidies to exploration activities. Governments can provide direct subsidies to exploration activities, for example, through government funded drilling pro-grams and co-drilling programs in partnership with exploration companies.
•Support for innovation. Governments can provide sup-port for innovation in exploration activities, such as through the funding of Cooperative Research Centres associated with developing exploration technologies.
Industry concerns with the regulatory landscape
In undertaking the inquiry, the Commission found that many stakeholders were dissatisfied with the current regulatory arrangements. Some explorers claim that governments are discouraging exploration by increasing compliance costs, take too long to grant approvals and increasing regulatory uncertainty. Some community groups claim that regulations are insufficient to protect heritage, environmental and community values and
agricultural uses of the land, and that regulators are not being sufficiently diligent in protecting those values and land uses.
Improving the regulatory framework
The Commission report argues that regulatory processes that impose unnecessary burdens on resource explorers or inhibit exploration can be reformed by: •ensuring stronger and simpler coordination, and more
timely, transparent and accountable approvals pro-cesses for exploration licences
•making land access decisions that take into account the benefits of exploration to the wider community, and that are appropriate to the level of risk posed by exploration as informed by sound evidence
•improving access for approved parties to the existing knowledge of Indigenous heritage and accrediting state and territory government processes which meet Australian Government standards of Indigenous heri-tage protection
•addressing state, territory and Commonwealth envi-ronmental approvals processes that are duplicative and are not commensurate with the risk and signifi-cance of the environmental impacts of exploration.
Summary of the Commission’s key recommendations
Exploration licensing and approvals
Governments should ensure that their authorities responsible for exploration licensing:
• prepare and publish information on the government’s exploration licensing objectives and the criteria by which applications for exploration licences will be assessed
• publish the outcome of exploration licence allocation assessments, including the name of the successful bidder and the reasons why their bid was successful.
Government agencies should publish information on the criteria to be used for assessing applications for exploration licences. They should also publish who the successful bidder is and why they were successful.
Regulatory practices
Regulators of exploration activity should create public databases that would allow any interested user to know where exploration licences exist or have been applied for. The public database should be map-based and facilitate address-based searches. The system should allow interested parties the option of being automatically notified if exploration licences are allocated or applied for in a particular area.
Governments should have lead agencies responsible for exploration. They should set target timeframes for approving applications and publish reports on how the government as a whole is performing against these targets. Lead agencies should also guide applications to explore through the approvals and assessment process – rather than requiring explorers to deal with each government agency separately.

22
I M P R O V I N G R E S O U R C E E X P L O R AT I O N I N A U S T R A L I A … C O N T
Land access issues
When governments are considering declaring a new national park or conservation reserve in recognition of its environmental and heritage value, they should also consider the economic, social and environmental costs and benefits of alternative or shared land use.
Where consideration of exploration activity is allowed in national park or conservation reserves, governments should assess applications according to the risk and the potential impact that the proposed exploration could have on the environmental and heritage values and on other uses and users of that national park or conservation reserve.
State and territory governments should ensure that:• reasonable legal and other costs incurred by land holders in negotiating a land access agreement are compensable
by explorers, including where the explorer withdraws from the negotiations prior to finalising the agreement• land holders are made aware that such compensation is available.
Governments should ensure that the development of coal seam gas exploration regulation is evidence-based and is appropriate to the level of risk. They should weigh the economic, social and environmental costs and benefits for those directly affected as well as for the whole community, and regulation should evolve in step with the evidence.
Heritage protection
The Australian Government should establish a system to accredit appropriate state and territory Indigenous heritage protection regimes, thus reducing the potential for regulatory duplication. Accreditation could only occur once Commonwealth requirements and standards are met.
Governments should ensure that their heritage authorities:• require that resource explorers or other parties lodge all heritage surveys with that authority• maintain registers which map and list all known Indigenous heritage sites• adopt measures to ensure that sensitive information collected by a survey is only provided to approved parties
(and only as necessary for the purposes of their activities), on the basis of agreed protocols.
State and territory governments should manage Indigenous heritage on a risk assessment basis.• Streamlined ‘duty of care’ or ‘due diligence’ processes should be used where there is a low likelihood of heritage
existing.• Where there is a high likelihood of heritage significance and the exploration activity is higher risk, agreement making
should be adopted.• When negotiated agreements cannot be reached, all parties should have access to a facilitation process. Only if
facilitation is unsuccessful should governments make decisions — which should be based on clear criteria and consultation with all the relevant parties.
Environmental management
Bilateral arrangements should be strengthened to allow accreditation of state and territory assessment processes under the Environment Protection and Biodiversity Conservation Act if they meet appropriate standards.
Greater use of strategic assessments should be made under the Environment Protection and Biodiversity Conservation Act. This would reduce reliance on project-based assessments.
Pre-competitive geoscience information
Private and foreign exploration companies should have the same requirements to publicly disclose information about resource discoveries in Australia as companies listed on the Australian Stock Exchange
Mineral and Energy Resource Exploration
> Inquiry Report > Released March 2014
PC NEWS August 2014 www.pc.gov.au 23
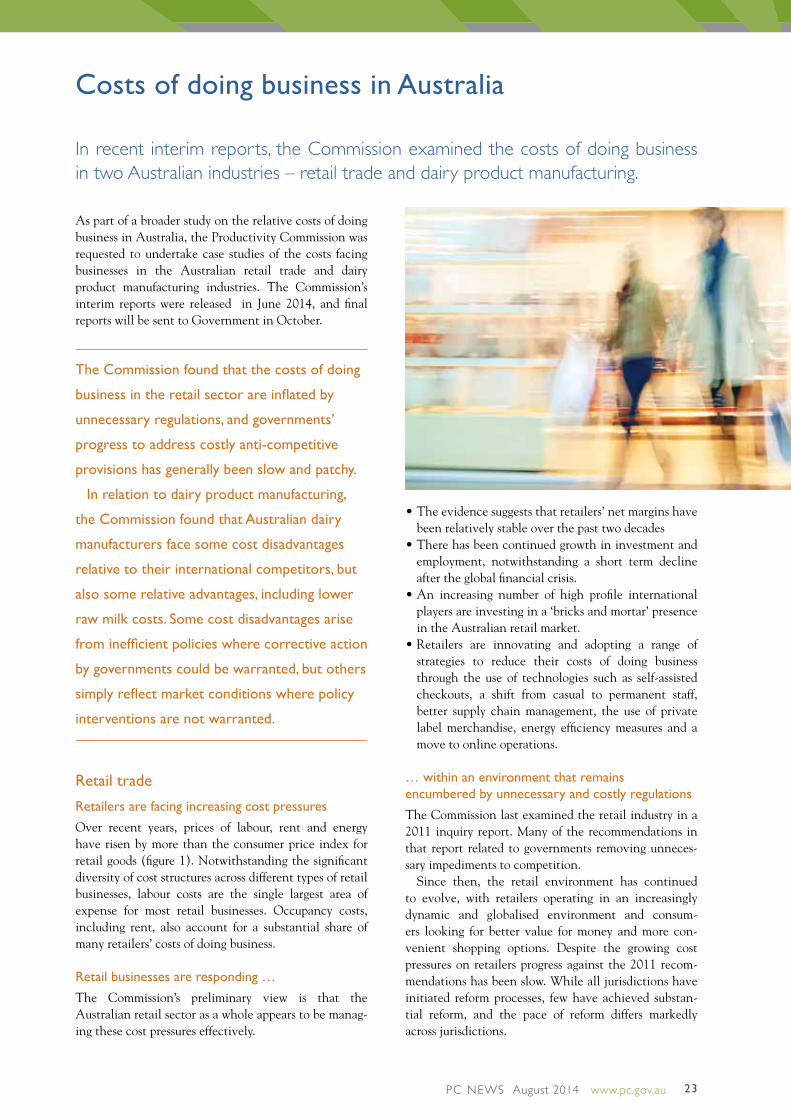
As part of a broader study on the relative costs of doing business in Australia, the Productivity Commission was requested to undertake case studies of the costs facing businesses in the Australian retail trade and dairy product manufacturing industries. The Commission’s interim reports were released in June 2014, and final reports will be sent to Government in October.
The Commission found that the costs of doing
business in the retail sector are inflated by
unnecessary regulations, and governments’
progress to address costly anti-competitive
provisions has generally been slow and patchy.
In relation to dairy product manufacturing,
the Commission found that Australian dairy
manufacturers face some cost disadvantages
relative to their international competitors, but
also some relative advantages, including lower
raw milk costs. Some cost disadvantages arise
from inefficient policies where corrective action
by governments could be warranted, but others
simply reflect market conditions where policy
interventions are not warranted.
Retail trade
Retailers are facing increasing cost pressures
Over recent years, prices of labour, rent and energy have risen by more than the consumer price index for retail goods (figure 1). Notwithstanding the significant diversity of cost structures across different types of retail businesses, labour costs are the single largest area of expense for most retail businesses. Occupancy costs, including rent, also account for a substantial share of many retailers’ costs of doing business.
Retail businesses are responding …
The Commission’s preliminary view is that the Australian retail sector as a whole appears to be manag-ing these cost pressures effectively.
•The evidence suggests that retailers’ net margins have been relatively stable over the past two decades
•There has been continued growth in investment and employment, notwithstanding a short term decline after the global financial crisis.
•An increasing number of high profile international players are investing in a ‘bricks and mortar’ presence in the Australian retail market.
•Retailers are innovating and adopting a range of strategies to reduce their costs of doing business through the use of technologies such as self-assisted checkouts, a shift from casual to permanent staff, better supply chain management, the use of private label merchandise, energy efficiency measures and a move to online operations.
… within an environment that remains encumbered by unnecessary and costly regulations
The Commission last examined the retail industry in a 2011 inquiry report. Many of the recommendations in that report related to governments removing unneces-sary impediments to competition.
Since then, the retail environment has continued to evolve, with retailers operating in an increasingly dynamic and globalised environment and consum-ers looking for better value for money and more con-venient shopping options. Despite the growing cost pressures on retailers progress against the 2011 recom-mendations has been slow. While all jurisdictions have initiated reform processes, few have achieved substan-tial reform, and the pace of reform differs markedly across jurisdictions.
I M P R O V I N G R E S O U R C E E X P L O R AT I O N I N A U S T R A L I A … C O N T Costs of doing business in Australia
In recent interim reports, the Commission examined the costs of doing business in two Australian industries – retail trade and dairy product manufacturing.

24
Figure 1 Retail labour and intermediate input prices have increased relative to capital prices and final retail prices
For data sources and notes see Productivity Commission 2014, Relative Costs of Doing Business in Australia: Retail Trade Industry, Interim Report
Labour and intermediate cost shares from multifactor productivity estimates
Retail input price indexes and the Consumer Price Index, 1997-98 = 100
Restrictions on trading hours
These impediments include, for example, restrictions on trading hours across and within jurisdictions, and restrictions on what can be sold at particular times. At a time when e-commerce and lifestyle considerations are changing shopping patterns considerably, these restrictions are increasingly out of step with community expectations.
Beyond the costs to consumers, regulations on trad-ing hours also have efficiency costs for retailers. A retailer forced to close earlier than desired suffers from excess capacity, since capital investment (for example, plant and equipment) is not fully utilised. Moreover, being forced to close on Sundays, for example, prevents retailers from managing their stocks better, especially those of highly perishable goods like fruit and veg-etables. More produce is wasted and last minute sales are more frequent. There are also additional compli-ance and operational costs to retailers who trade in all states. These costs become more acute around the time of gazetted public holidays, when retailers have to interrupt ‘normal’ trading arrangements and put in place different arrangements to comply with the diverse public holiday trading arrangements set down in differ-ent states, different regions and different local trading precincts across Australia.
While some gains have been made across Australia in the deregulation of retail trading hours, inconsistencies remain across and within jurisdictions. Trading hours are effectively deregulated in Victoria, Tasmania, the Northern Territory and the Australian Capital Territory and are largely unrestricted in New South Wales. However, they are most restricted in South Australia, Western Australia and Queensland, and are inconsis-tent within these jurisdictions.
Dairy product manufacturing
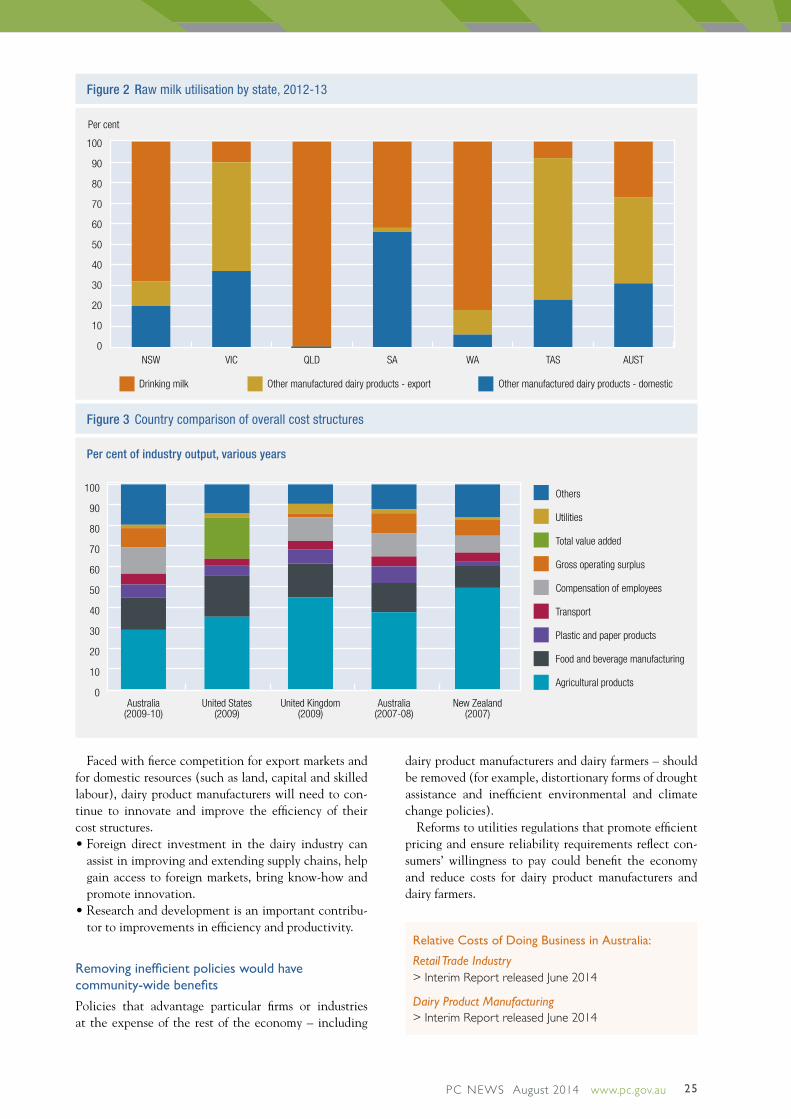
Australian dairy product manufacturing businesses are diverse
There is significant variation in the scale and product mix of dairy manufacturing businesses (figure 2). While the industry has a national footprint, most manufactur-ing activity occurs in south eastern Australia, where about 80 per cent of Australia’s raw milk is produced.
This diversity has direct implications for cost struc-tures and prices. For example, while raw milk costs averaged 29 per cent of industry output in 2009-10 (denoted by ‘agricultural products’, column 1, figure 3), this share varies across dairy products, and some partici-pants reported much higher cost shares for raw milk.
Scale is important but not the whole story
The decline in raw milk volumes, and seasonal vari-ability, may be limiting Australian dairy manufactur-ers’ ability to achieve scale efficiencies and better asset utilisation. However, the commerciality of increasing milk production is primarily a matter for manufacturers and dairy farmers.
A competitive global dairy market
Dairy product markets are global, highly competitive and reasonably mature. About 40 per cent of Australia’s dairy output (in milk equivalent terms) is exported, with China and Japan the largest markets. The inte-gration of Australian dairy manufacturers into world markets means that domestic dairy product prices (and farmgate milk prices) are strongly influenced by inter-national markets and prices.
0
0.2
0.4
0.6
0.8
1
2011-122004-051997-98
Labour costs
Intermediate input costs
Capital costs
80
100
120
140
160
180
2011-122004-051997-98
CPI retail
Wage price index
Intermediate input prices
Capital prices
PC NEWS August 2014 www.pc.gov.au 25
Faced with fierce competition for export markets and for domestic resources (such as land, capital and skilled labour), dairy product manufacturers will need to con-tinue to innovate and improve the efficiency of their cost structures. •Foreign direct investment in the dairy industry can
assist in improving and extending supply chains, help gain access to foreign markets, bring know-how and promote innovation.
•Research and development is an important contribu-tor to improvements in efficiency and productivity.
Removing inefficient policies would have community-wide benefits
Policies that advantage particular firms or industries at the expense of the rest of the economy – including
dairy product manufacturers and dairy farmers – should be removed (for example, distortionary forms of drought assistance and inefficient environmental and climate change policies).
Reforms to utilities regulations that promote efficient pricing and ensure reliability requirements reflect con-sumers’ willingness to pay could benefit the economy and reduce costs for dairy product manufacturers and dairy farmers.
Figure 3 Country comparison of overall cost structures
Figure 2 Raw milk utilisation by state, 2012-13
0
10
20
30
40
50
60
70
80
90
100 Others
Utilities
Total value added
Gross operating surplus
Compensation of employees
Transport
Plastic and paper products
Food and beverage manufacturing
Agricultural products
New Zealand(2007)
Australia(2007-08)
United Kingdom(2009)
United States(2009)
Australia(2009-10)
0
10
20
30
40
50
60
70
80
90
100
Per cent
Drinking milk Other manufactured dairy products - export Other manufactured dairy products - domestic
AUSTTASWASAQLDVICNSW
Per cent of industry output, various years
Relative Costs of Doing Business in Australia:
Retail Trade Industry > Interim Report released June 2014
Dairy Product Manufacturing > Interim Report released June 2014

26
Famous for its unique landscapes and wilderness, less well known is Tasmania’s status as the only jurisdiction to receive federally funded subsidies for freight and pas-senger services. These longstanding arrangements are designed to partially offset the relatively higher cost of moving freight and passengers across Bass Strait by sea. The Australian Government has outlaid more than $2 billion since the inception of the schemes, and without change a further $2 billion can be expected over the next 15 years. Around $110 million in funding assistance was provided under the Tasmanian Freight Equalisation Scheme (TFES) in 2012-13.
Why examine Tasmania’s shipping and freight arrangements?
Shipping accounts for over 99 per cent of all freight to and from Tasmania by volume. Tasmania is serviced by high quality but relatively high cost containerised domestic shipping services and the viability of direct international shipping services is adversely affected by the regulation and cost of coastal shipping.
The relatively small volume of cargo across Bass Strait limits the scope for economies of scale, and the number of competitors that the market can sustain. The efficiency of freight and shipping is further stifled by the Tasmanian Government’s pervasive role in shipping, port, road and rail assets and the lack of an integrated freight strategy.
Are subsidies the best form of assistance?
The Australian Government is currently commit-ted to retaining the TFES and the Bass Strait Pass-enger Vehicle Equalisation Scheme (BSPVES). The Commission found that these subsidies fall well short of what is needed to improve Tasmania’s competitiveness in the face of its broader economic and social challeng-es – comparatively lower income growth, higher rates of unemployment, lower labour productivity and social disadvantage.
The TFES is costly, complex and has unintended
consequences. It mostly benefits a handful of
large recipients. It also, perversely, increases
prices for Tasmanian consumers. The objective
of the BSPVES is poorly articulated. Irrespective
of its intended primary beneficiaries, the
scheme provides only diluted support to them.
Some of the BSPVES subsidy is inevitably
captured by TT-Line as the main (virtually sole)
carrier of passenger vehicles across Bass Strait.
While the introduction of the BSPVES saw a
sharp immediate reduction in real fares paid,
most of this reduction was eventually recouped
by TT-Line.
In the light of these findings, the Commission made a number of recommendations focused on address-ing some of the perverse incentives created by the TFES and reducing complexity to lower the compli-ance burden on business and administrative costs to government.
On the TFES the Commission found that there was potentially an economic case to extend eligibility to exports (transhipped through Port of Melbourne) whilst lowering the overall rate of assistance – ‘broaden the base and lower the rate’ – contingent on a direct inter-national containerised shipping service not being com-mercially available to Tasmanian shippers. As such, a decision on extending the eligibility of the TFES would be premature prior to the Tasmanian Government resolving the possible resumption of a direct interna-tional service, for which the economics is impacted by potential coastal shipping reform.
In relation to the BSPVES, the Commission recom-mended greater scrutiny of TT-Line’s competitive neu-trality obligations, and greater transparency and clarity around the scheme itself.
Tasmanian shipping and freight – how effective are current arrangements?
The Commission recommended a number of changes to existing subsidy schemes for Tasmanian shipping and freight in a recently released inquiry report.

PC NEWS August 2014 www.pc.gov.au 27
Coastal shipping reform
A key finding of the inquiry was that Tasmania was especially vulnerable to regulation that increases the cost of engaging in coastal trade. Most inquiry partici-pants raised concerns about the anticompetitive effects of Australian cabotage regulation and its impacts on the costs of shipping borne by Tasmanian businesses.
In view of this, the Commission recommended that the Australian Government proceed with the foreshadowed review of coastal shipping regulation (including cabo-tage) as a matter of priority.
Tasmanian Shipping and Freight
> Inquiry Report released June 2014
Tasmanian shipping and freight – subsidy schemes
2009-10 2012-132006-07
Expenditure ($m)
Amount paid ($m)
Amount paid ($m)
Order of claimants – largest to smallestTFES BSPVES
2003-04
2002-03 2012-131992-931982-83
40 60 80 100
$,’000
20
0
20
40
60
80
100
120
0
2
4
6
8
10
12
0
10
20
30
40
50
60
70
80
SouthboundNorthbound0
0.2
0.4
0.6
0.8
1.0
no rebate
rebate
BSPVES
TFES and BSPVES funding
TFES assistance paid by direction, 2011-12 BSPVES – real sea package prices
TFES assistance paid to the top 100 claimants, 2011-2012
28
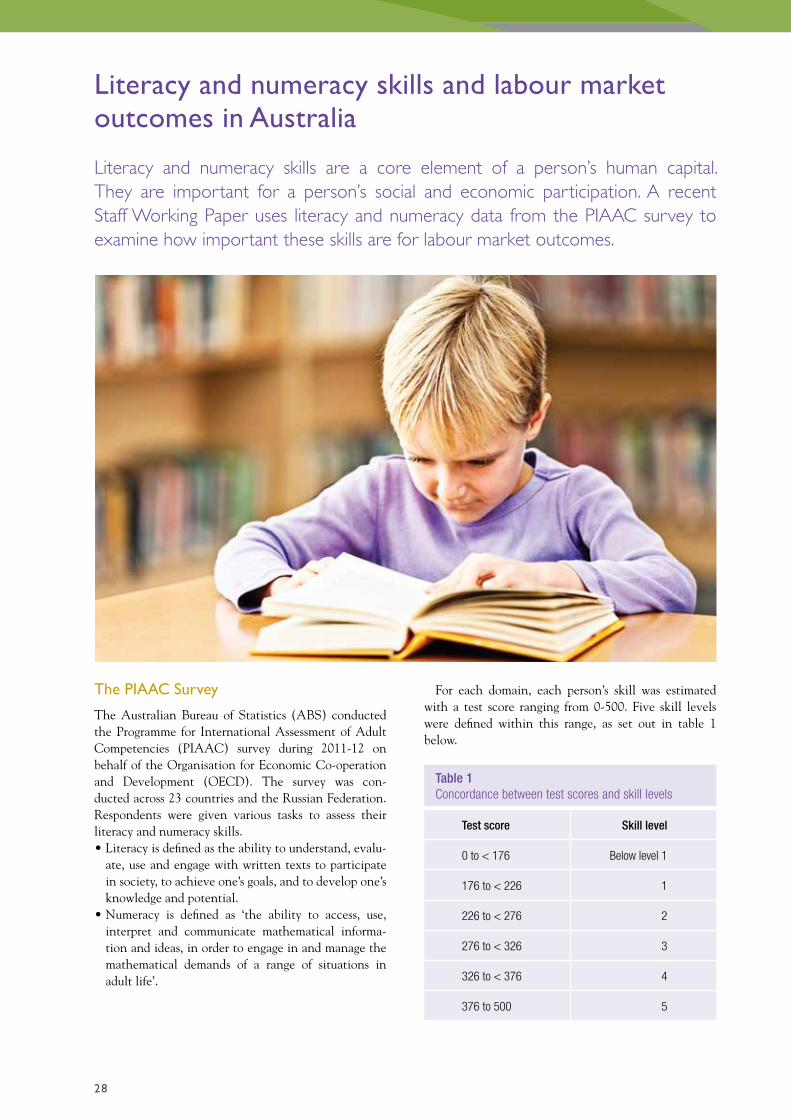
Literacy and numeracy skills and labour market outcomes in Australia
Literacy and numeracy skills are a core element of a person’s human capital. They are important for a person’s social and economic participation. A recent Staff Working Paper uses literacy and numeracy data from the PIAAC survey to examine how important these skills are for labour market outcomes.
The PIAAC Survey
The Australian Bureau of Statistics (ABS) conducted the Programme for International Assessment of Adult Competencies (PIAAC) survey during 2011-12 on behalf of the Organisation for Economic Co-operation and Development (OECD). The survey was con-ducted across 23 countries and the Russian Federation. Respondents were given various tasks to assess their literacy and numeracy skills.•Literacy is defined as the ability to understand, evalu-
ate, use and engage with written texts to participate in society, to achieve one’s goals, and to develop one’s knowledge and potential.
•Numeracy is defined as ‘the ability to access, use, interpret and communicate mathematical informa-tion and ideas, in order to engage in and manage the mathematical demands of a range of situations in adult life’.
For each domain, each person’s skill was estimated with a test score ranging from 0-500. Five skill levels were defined within this range, as set out in table 1 below.
Table 1 Concordance between test scores and skill levels
Test score Skill level
0 to < 176 Below level 1
176 to < 226 1
226 to < 276 2
276 to < 326 3
326 to < 376 4
376 to 500 5

PC NEWS August 2014 www.pc.gov.au 29
How does Australia perform?
The authors of a recent Staff Working Paper – Anthony Shomos and Matthew Forbes – found a strong cor-relation between literacy and numeracy skills among Australians (figure 1). That is, someone with low lit-eracy is also likely to have low numeracy.
Australian literacy levels are above average OECD levels, while numeracy skills are close to the OECD average (figure 2).
Despite this, there are many Australians with very poor literacy or numeracy skills. In 2011-12:•14 per cent of Australians could, at best, read short
texts from which they were able to locate a single piece of information
•22 per cent could only carry out one-step or simple processes such as counting where the mathematical content is explicit with little or no distractions.
People with lower skills tend to be those with lower levels of education, older persons, people not work-ing, and immigrants with a non-English speaking background.
How important are literacy and numeracy skills for labour market outcomes?
Literacy and numeracy skills are important for suc-cessful labour market outcomes. Modelling in the paper shows that an increase in a person’s literacy and numeracy score by about 50 points – one skill level for most people – is associated with an increased likelihood of employment of 2.4 percentage points for men, and 4.3 percentage points for women, that is, roughly the same increase in the probability of employment as increasing educational attainment from Year 11 to Year 12. The relationship between the probability of employment and literacy and numeracy is depicted in figure 3.
An increase of literacy and numeracy by 50 points was also found to be associated with wages that are about 10 per cent higher. This was the case for both men and women.
After accounting for differences in literacy and numeracy skills, the association between education and labour market outcomes, such as employment or wages,
Source: Authors’ estimates based on PIAAC data.
15–74 year olds
Figure 1 Correlation between literacy and numeracy test scores
0
25
50
75
100
125
150
175
200
225
250
275
300
325
350
375
400
425
450
0 25 50 75 100 125 150 175 200 225 250 275 300 325 350 375 400 425 450
Literacy
Numeracy
Level 1 or below
Level 2
Level 3
Level 4 Level 5

30
decreases substantially. This indicates that much of the association between education and labour market outcomes is attributable to literacy and numeracy. This also confirms that education provides other skills that are valued in the workplace, including higher order skills and non-cognitive skills, such as perseverance and leadership.
The association between labour market experi-ence and wages remained relatively unchanged after accounting for differences in literacy and numeracy skills. That is, there did not appear to be a relationship between experience and literacy and numeracy skills in determining wages, suggesting that these skills are not acquired on the job.
L I T E R A C Y A N D N U M E R A C Y S K I L L S A N D L A B O U R M A R K E T O U T C O M E S I N A U S T R A L I A … C O N T
230
240
250
260
270
280
290
300
Italy
Spai
n
Fran
ce
Irela
nd
Pola
nd
Cypr
us
Aust
ria
Unite
d St
ates
Germ
any
Denm
ark
Engl
and/
N. Ir
elan
d
Kore
a
Aver
age
Cana
da
Slov
ak R
epub
lic
Czec
h Re
publ
ic
Russ
ian
Fede
ratio
n
Flan
ders
(Bel
gium
)
Esto
nia
Norw
ay
Swed
en
Aust
ralia
Neth
erla
nds
Finl
and
Japa
n
230
240
250
260
270
280
290
300
Spai
n
Italy
Unite
d St
ates
Fran
ce
Irela
nd
Pola
nd
Engl
and/
N. Ir
elan
d
Kore
a
Cypr
us
Cana
da
Aust
ralia
Aver
age
Russ
ian
Fede
ratio
n
Germ
any
Esto
nia
Aust
ria
Czec
h Re
publ
ic
Slov
ak R
epub
lic
Denm
ark
Norw
ay
Swed
en
Neth
erla
nds
Flan
ders
(Bel
gium
)
Finl
and
Japa
n
a Data for the Russian Federation are preliminary and subject to change. b The average does not include results for the Russian Federation.Source: See Shomos, A. and Forbes, M. 2014 Literacy and Numeracy Skills and Labour Market Outcomes in Australia, Productivity Commission Staff Working Paper
Literacy
Numeracy
Figure 2 Literacy and numeracy test scores, by country, 2011–12a,b
16–64 year olds

PC NEWS August 2014 www.pc.gov.au 31
Literacy and Numeracy Skills and Labour Market Outcomes in Australia
> Shomos, A. and Forbes, M. > Productivity Commission Staff Working Paper> Released May 2014
0.4
0.5
0.6
0.7
0.8
0.9
1.0
Pr (Employed)
Literacy and numeracy score
0 100 200 300 400 500
0.4
0.5
0.6
0.7
0.8
0.9
1.0
Pr (Employed)
Literacy and numeracy score
0 100 200 300 400 500
The marginal effect of a change in the probability of employment associated with a change in literacy and numeracy is estimated for different literacy and numeracy scores between 50 and 450, and is depicted by the slope of the line. Shaded areas represent 95 per cent confidence intervals.Source: Authors’ estimates using PIAAC data.
Figure 3 Probability of employment, by literacy and numeracy score
Men
Women
L I T E R A C Y A N D N U M E R A C Y S K I L L S A N D L A B O U R M A R K E T O U T C O M E S I N A U S T R A L I A … C O N T

32
Current commissioned projects6 August 2014
Log on to the Commission’s website www.pc.gov.au for full details of all current projects.
Access to Justice Arrangements – Public Inquiry
Issues paper September 2013Draft report April 2014Final report to Government September 2014
Contact: Alan Raine 02 6240 3304Email: [email protected]/projects/inquiry/access-justice
Childcare and Early Childhood Learning – Public Inquiry
Issues paper December 2013Draft report July 2014Final report to Government October 2014
Contact: Ros Bell 02 6240 3308Email: [email protected] www.pc.gov.au/projects/inquiry/childcare
Costs of Doing Business: Dairy Product Manufacturing – Case Study
Issues paper April 2014Interim report June 2014Final report to Government October 2014
Contact: Clare Sibly 03 9653 2118Email: [email protected]/projects/study/business-costs/dairy-manufacturing
Costs of Doing Business: Retail Trade Industry – Case Study
Issues paper April 2014Interim report June 2014Final report to Government October 2014
Contact: Stewart Plain 02 6240 3219Email: [email protected]://www.pc.gov.au/projects/study/business-costs/retail-trade
Natural Disaster Funding – Public Inquiry
Issues paper May 2014Draft report September 2014Final report to Government December 2014
Contact: Stewart Turner 03 9653 2218Email: [email protected] www.pc.gov.au/projects/inquiry/disaster-funding